best web-based data visualization tools
TRANSCRIPT

The Best Web-Based Data Visualisation Tools
As of March 2016
John Griffin

Dimensions for comparison
1. Target Market
2. Pricing
3. Technical Architecture & Scalability
4. Customisability
5. Type of visualisations
6. Key Functionality

1/6: Target Market
✴ Non-expert Business Users
✴ Analysts / Statisticians
✴ Journalists
✴ Designers
✴ Developers
✴ Industry specific (e.g. finance / marketing)

2/6: Pricing
✴ One-off
✴ Per visualisation / dataset / dashboard
✴ Per seat / active user
✴ Per time used (typically month / year)
✴ Per volume of data
✴ Free

3/6: Technical Architecture
✴ Client / Server
✴ Desktop only
✴ Browser only

4/6: Customisability
✴ Black Box
✴ Open API
✴ Open Source
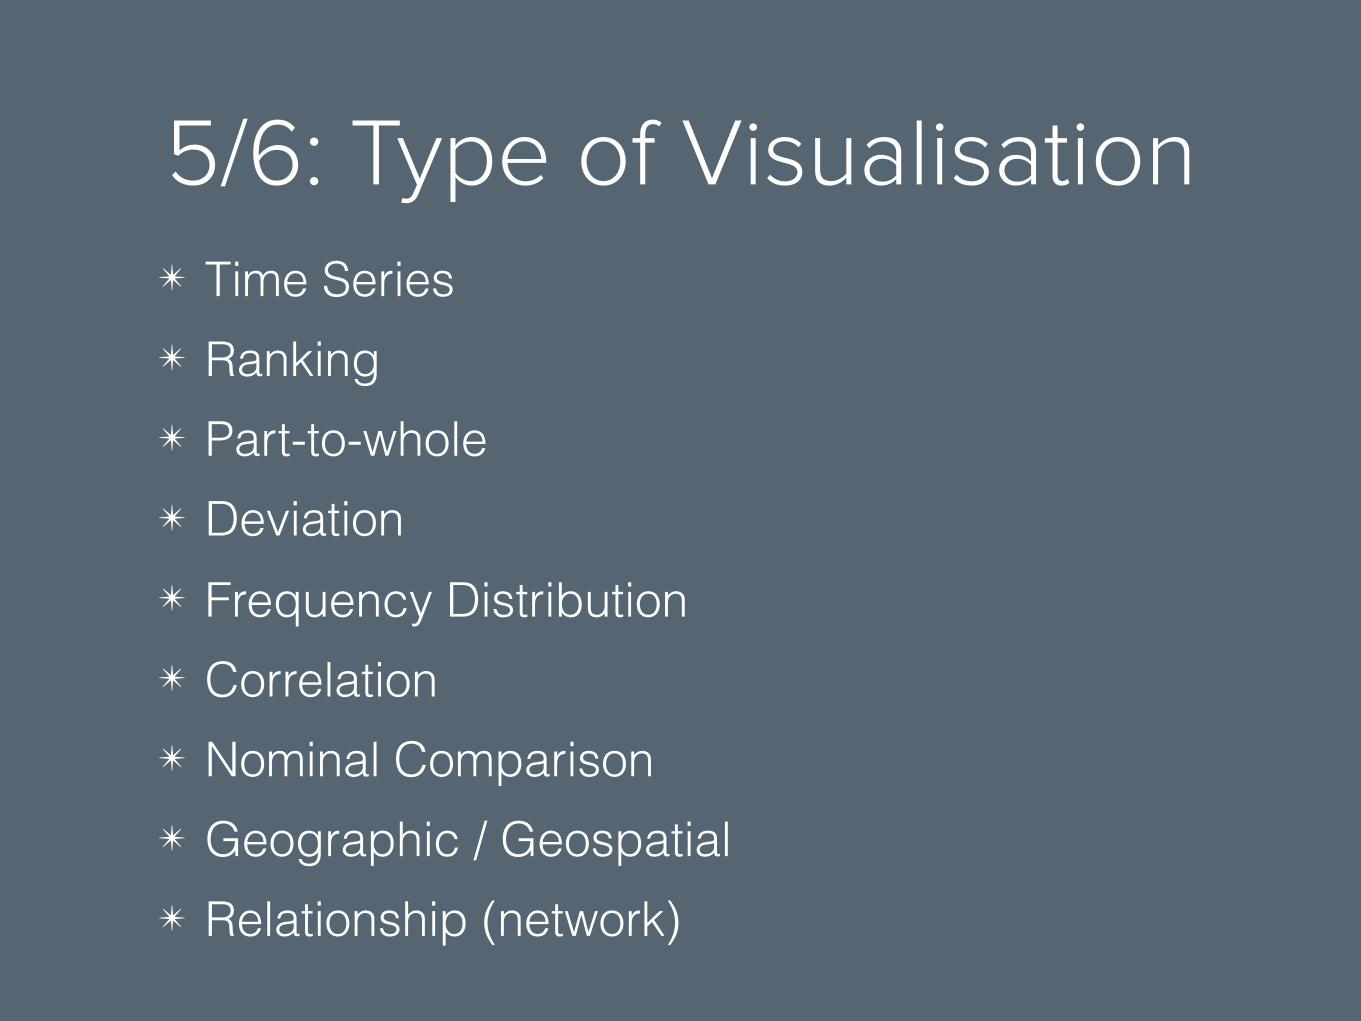
5/6: Type of Visualisation✴ Time Series ✴ Ranking ✴ Part-to-whole ✴ Deviation ✴ Frequency Distribution ✴ Correlation ✴ Nominal Comparison ✴ Geographic / Geospatial ✴ Relationship (network)

6/6: Key Functionality
✴ Static / interactive
✴ Single chart / dashboards
✴ Embedding
✴ Collaboration / sharing
✴ Exploration / presentation / storytelling
✴ Browser / device support

Tools✴ Datawrapper
✴ CartoDB
✴ Plotly
✴ Kibana
✴ Dc.js + crossfilter
✴ ParallelCoordinates.js
✴ Timeline.js

Datawrapper

Datawrapper

Datawrapper
Target Market : Journalists, bloggers…
Pricing: Free to start, €12/m to embed
Tech Architecture: All data and rendering in-browser
Customisability: Very good, open source.
Visualisation Functionality: Single charts only. All common charts and a few less common ones.

CartoDB


CartoDB
Target Market: Analysts, Data publishers, journalists
Pricing: Free for public, $149/m private, $825/m enterprise starting.
Tech Architecture: Client/Server, very scalable. Cloud or on-premises.
Customisability: Very good, open source & API.
Visualisation Functionality: All sorts of interactive maps — points, lines, polygons. Many base maps available and advanced features such as custom tiles.


Plotly

Plotly
Target Market: Analysts, Data scientists, Developers
Pricing: Free for public, $19/m for private, $9950/yr for 5 users on-site.
Tech Architecture: All data and rendering in-browser
Customisability: Very good, open source & API.
Visualisation Functionality : Single charts only. All common charts and a quite a few less common ones.
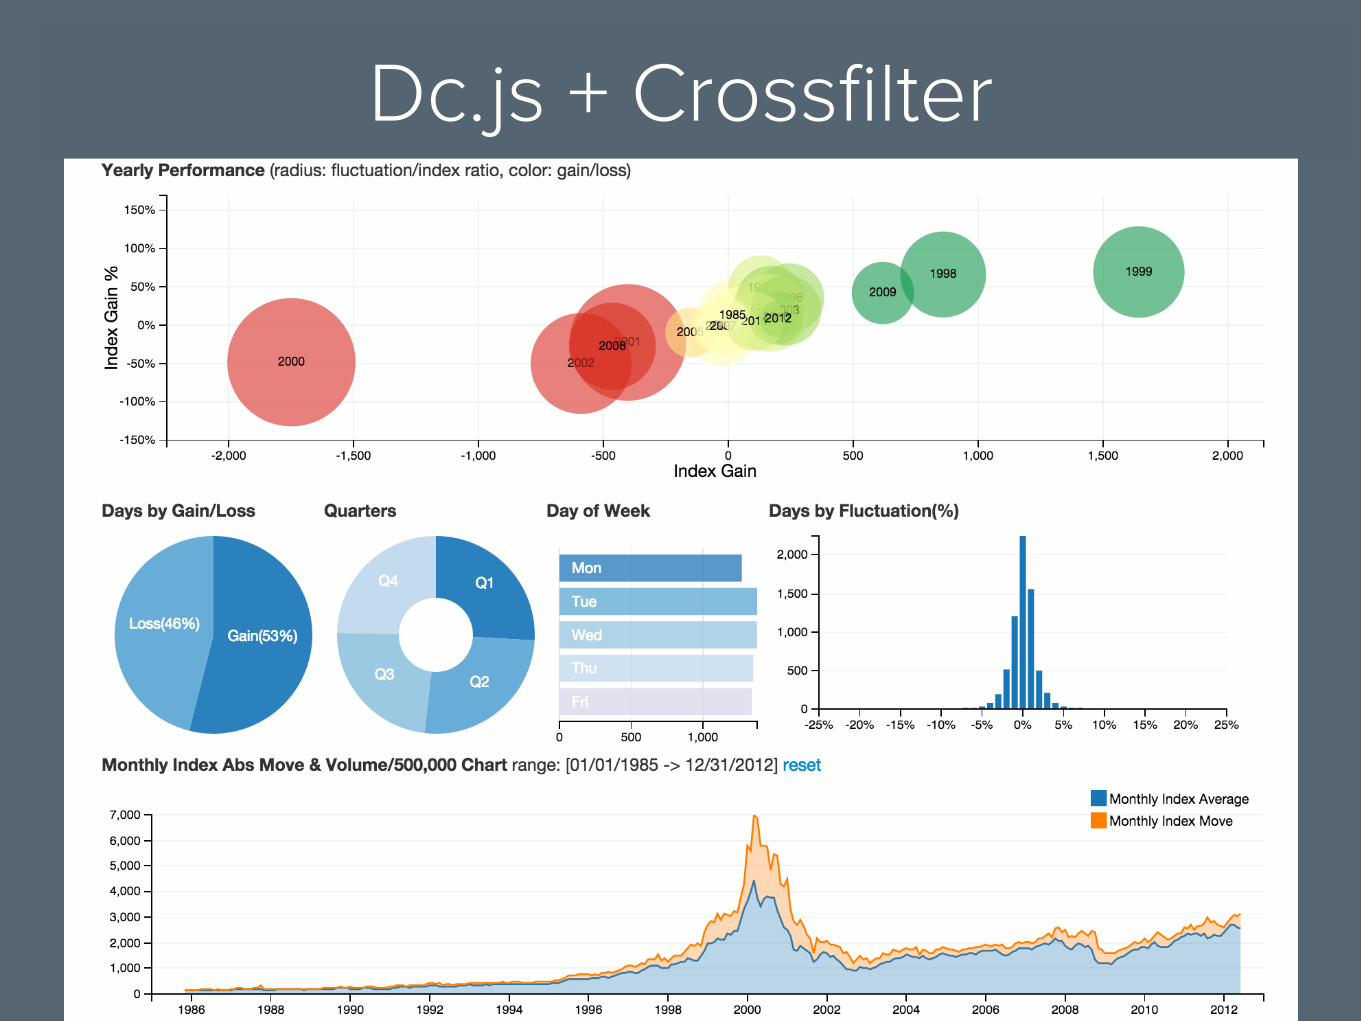
Dc.js + Crossfilter
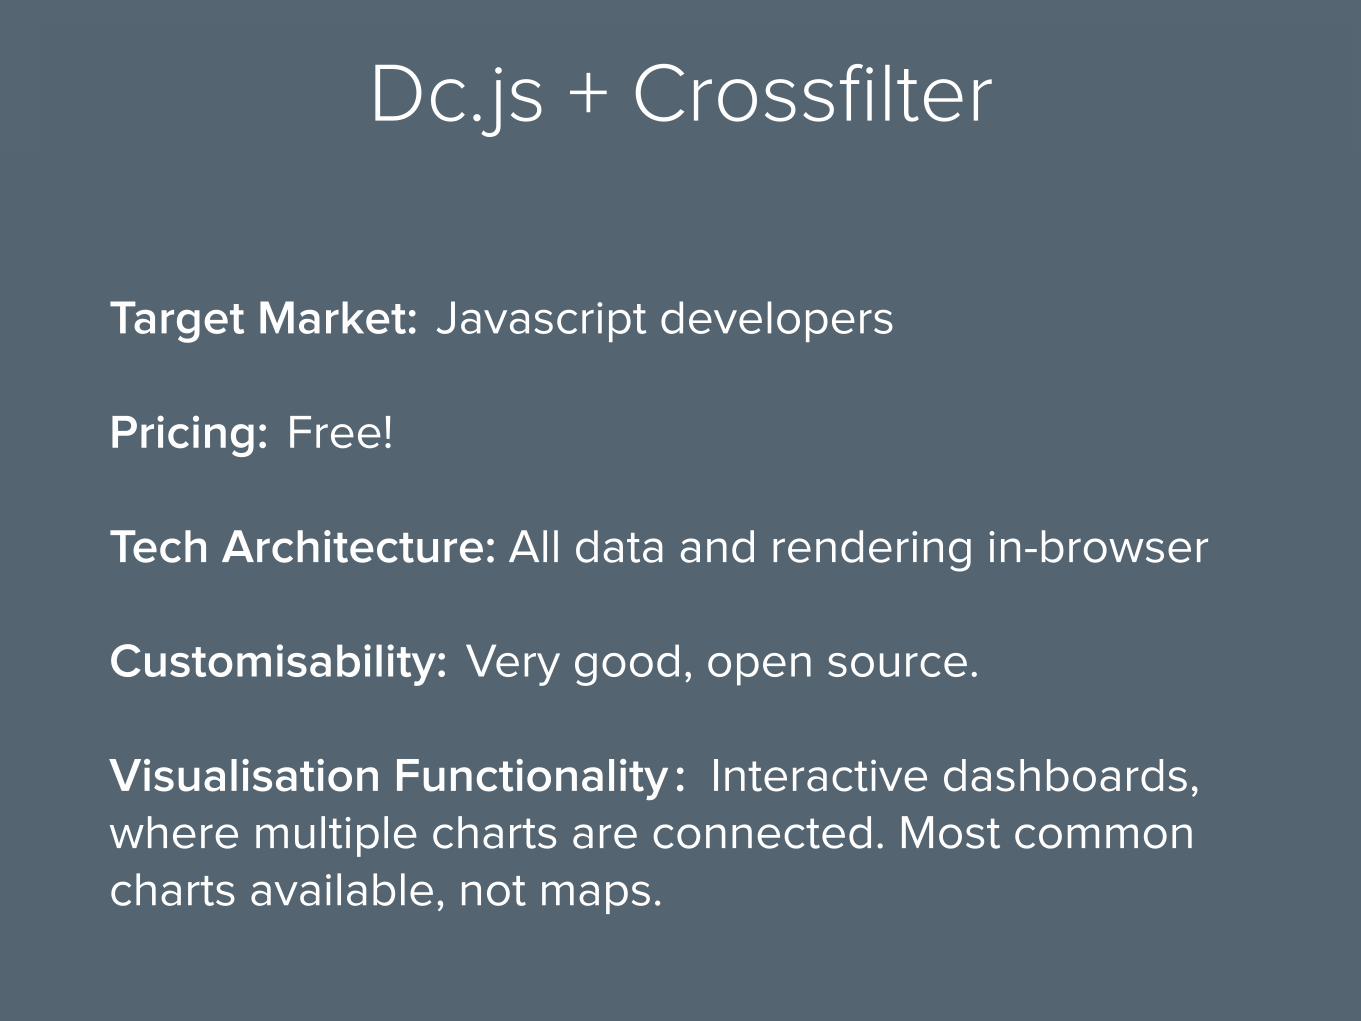
Target Market: Javascript developers
Pricing: Free!
Tech Architecture: All data and rendering in-browser
Customisability: Very good, open source.
Visualisation Functionality : Interactive dashboards, where multiple charts are connected. Most common charts available, not maps.
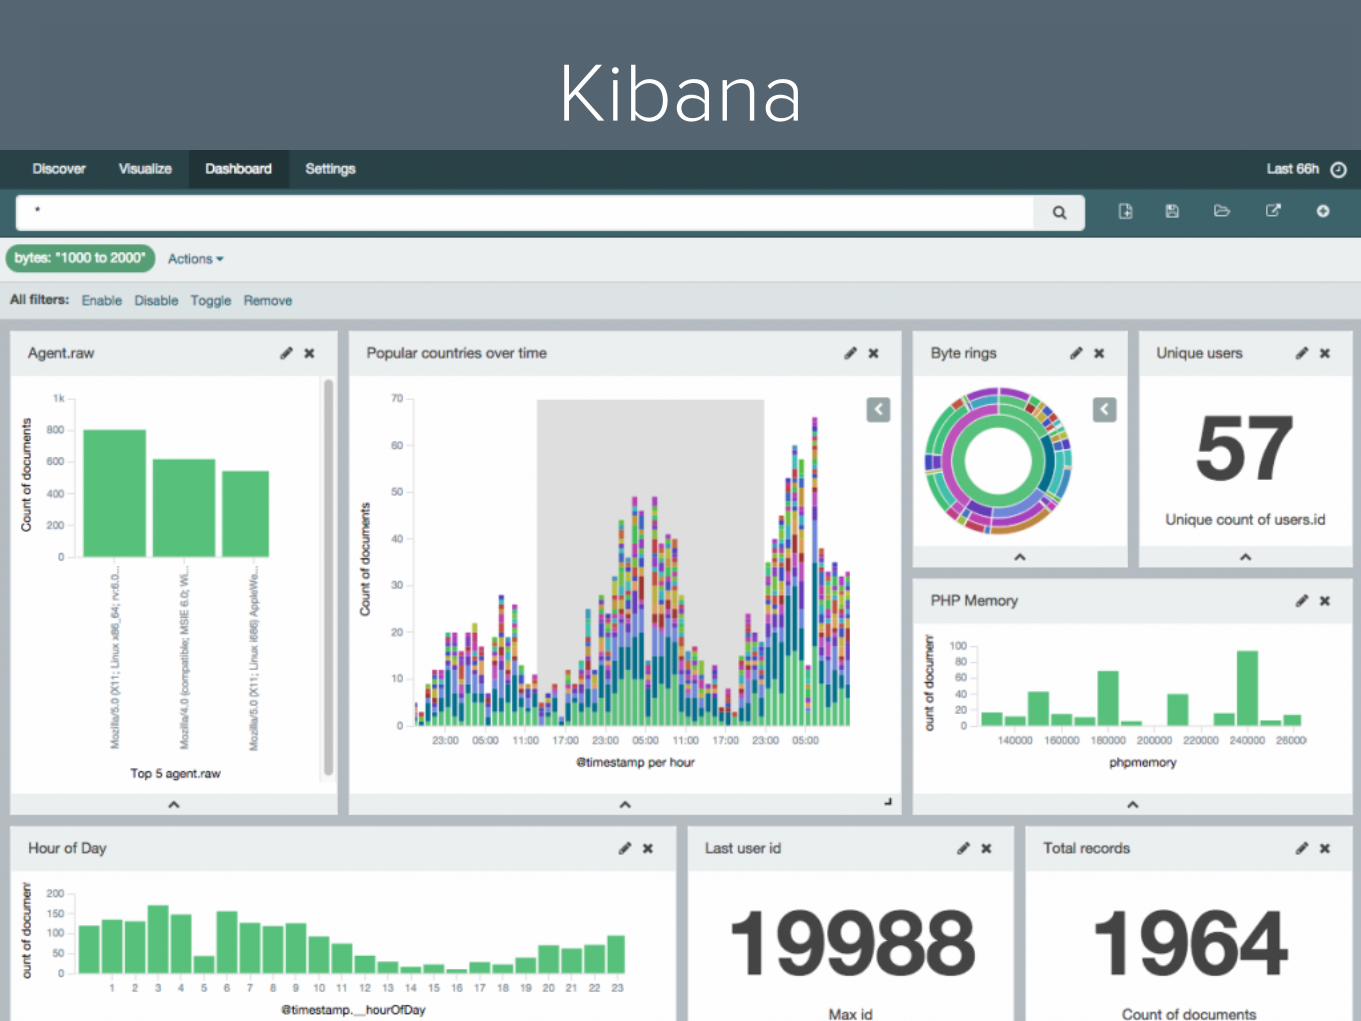
Kibana


John Griffin
Principal Consultant
twitter.com/johngriffin
github.com/johngriffin
atchai.com
getdataseed.com