best practices in pharmaceutical technology - · pdf filebest practices in pharmaceutical...
TRANSCRIPT

Best Practices in Pharmaceutical Technology
Filipe GasparOctober 2014
Confidential Hovione © 2014
Agenda
Technological Trends in Pharmaceutical Development and Manufacturing
Advanced Tools in Development and Manufacturing
Excellent Development and Manufacturing
Quality by Design at Hovione
Confidential Hovione © 2014
Agenda
Technological Trends in Pharmaceutical Development and Manufacturing
Advanced Tools in Development and Manufacturing
Excellent Development and Manufacturing
Quality by Design at Hovione
Confidential Hovione © 2014
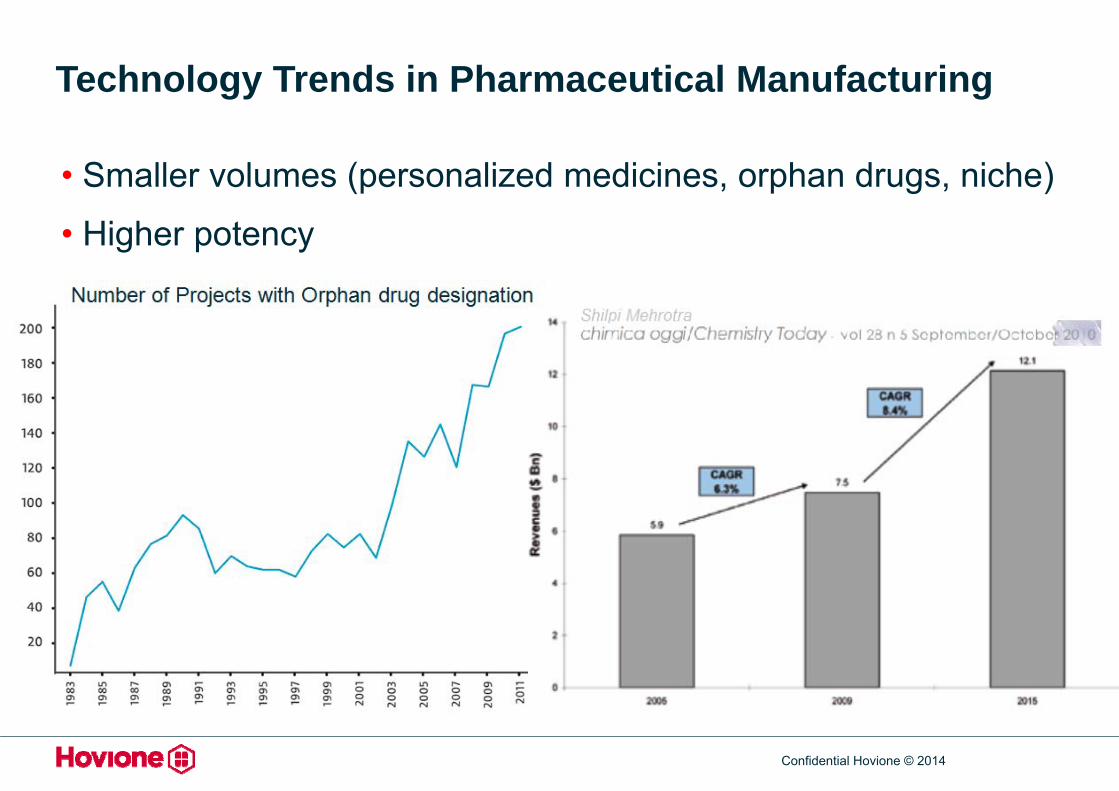
Technology Trends in Pharmaceutical Manufacturing
• Smaller volumes (personalized medicines, orphan drugs, niche)
• Higher potency
Confidential Hovione © 2014
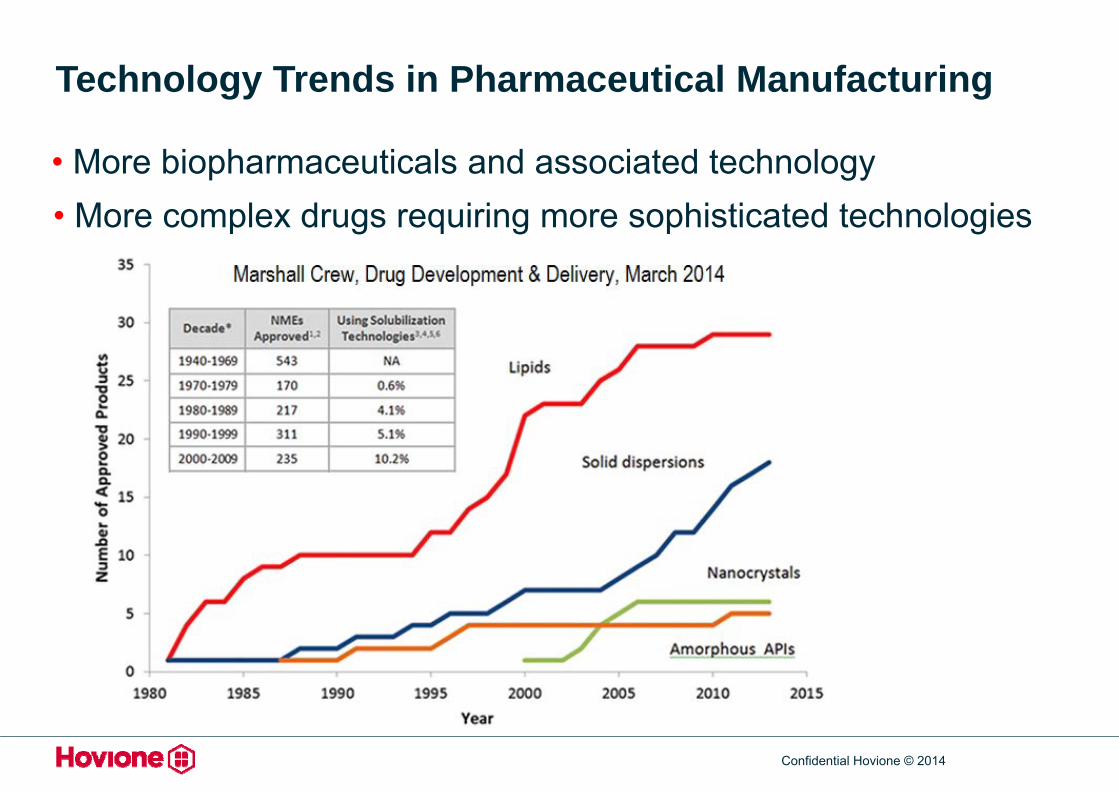
Technology Trends in Pharmaceutical Manufacturing
• More biopharmaceuticals and associated technology• More complex drugs requiring more sophisticated technologies
• Chromatography, chiral separation
• More difficult to deliver orally
Confidential Hovione © 2014
Technology Trends in Pharmaceutical Manufacturing
• Moving into continuous processes (???)
• CROs and CMOs becoming key solution & technology providers
• Eager to introduce new technologies
• Increasing volume of real time operational data
• generated by highly networked control and analytical technologies
… challenge being its consolidation in differentiating knowledge
Confidential Hovione © 2014
Some Key Tools in Pharmaceutical Development and Manufacturing
• Statistical design and analysis
• Process analytical technologies
• Advanced modeling tools
• Risk assessment and management
• Lean 6-Sigma
• Quality by Design
• Big Data / Big Data Analytics
Confidential Hovione © 2014
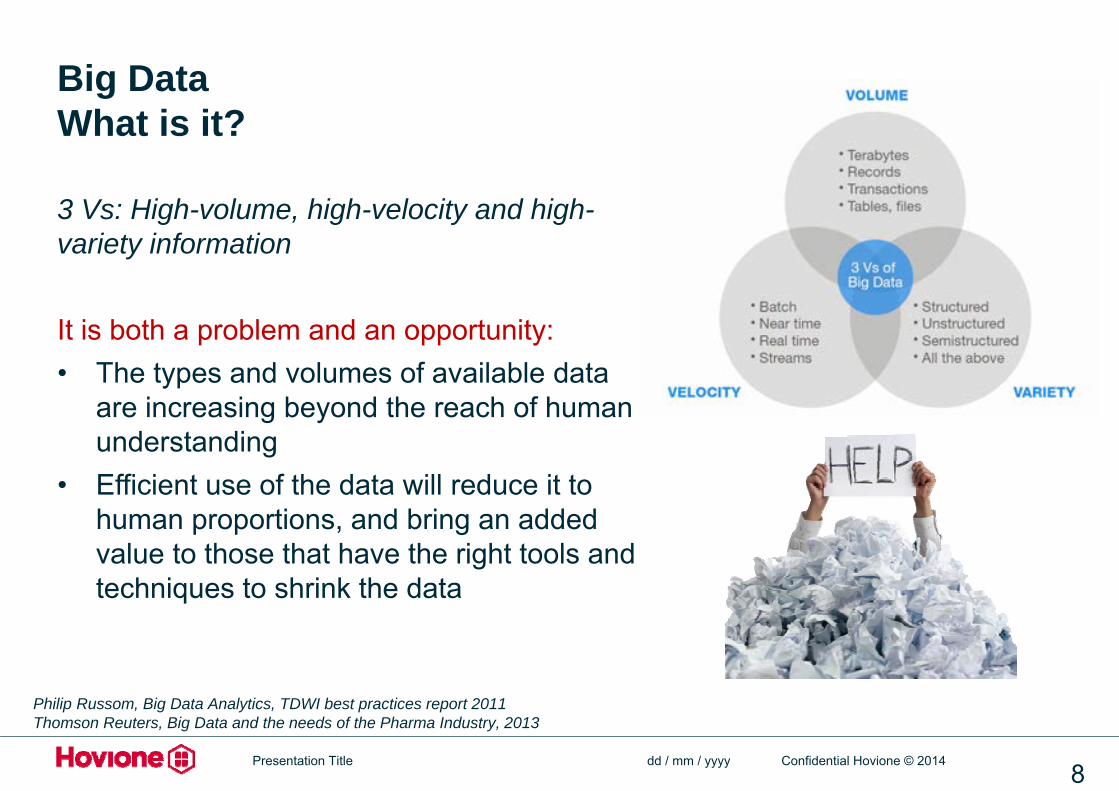
Big DataWhat is it?
3 Vs: High-volume, high-velocity and high-variety information
It is both a problem and an opportunity:• The types and volumes of available data
are increasing beyond the reach of human understanding
• Efficient use of the data will reduce it to human proportions, and bring an added value to those that have the right tools and techniques to shrink the data
dd / mm / yyyyPresentation Title8
Philip Russom, Big Data Analytics, TDWI best practices report 2011Thomson Reuters, Big Data and the needs of the Pharma Industry, 2013
Confidential Hovione © 2014
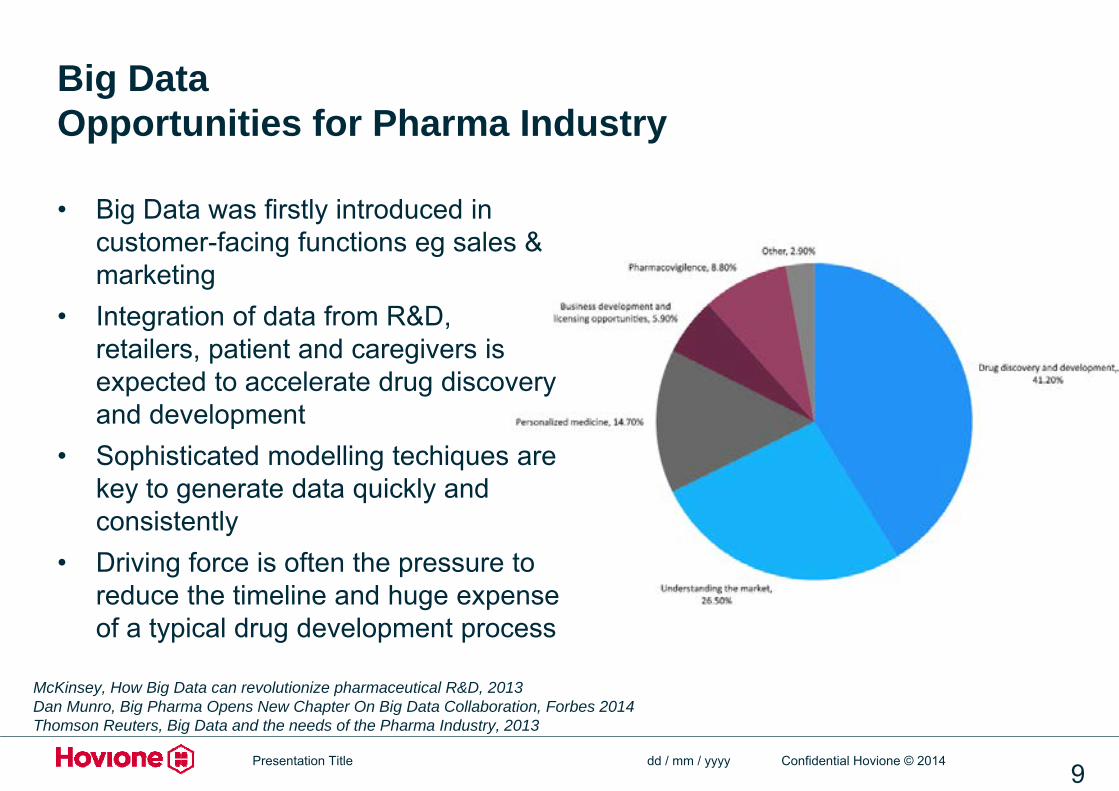
Big DataOpportunities for Pharma Industry
• Big Data was firstly introduced in customer-facing functions eg sales & marketing
• Integration of data from R&D, retailers, patient and caregivers is expected to accelerate drug discovery and development
• Sophisticated modelling techiques are key to generate data quickly and consistently
• Driving force is often the pressure to reduce the timeline and huge expense of a typical drug development process
dd / mm / yyyyPresentation Title9
McKinsey, How Big Data can revolutionize pharmaceutical R&D, 2013Dan Munro, Big Pharma Opens New Chapter On Big Data Collaboration, Forbes 2014Thomson Reuters, Big Data and the needs of the Pharma Industry, 2013
Confidential Hovione © 2014
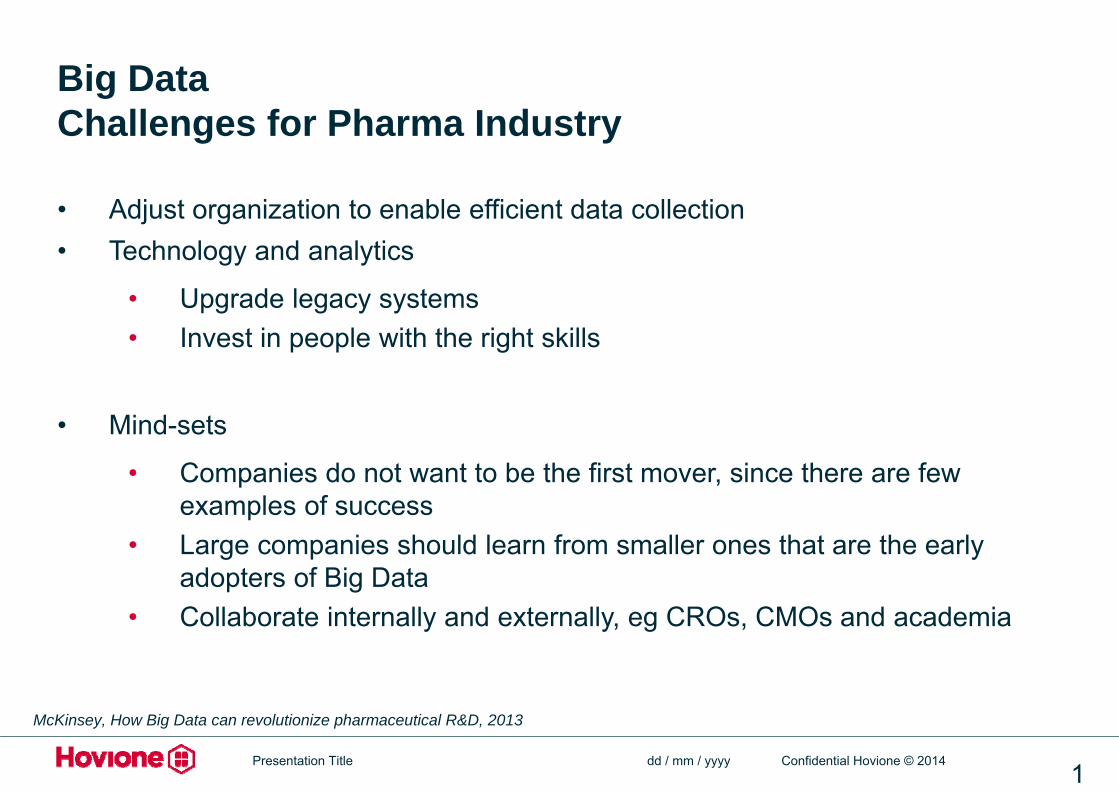
Big DataChallenges for Pharma Industry
• Adjust organization to enable efficient data collection• Technology and analytics
• Upgrade legacy systems• Invest in people with the right skills
• Mind-sets
• Companies do not want to be the first mover, since there are few examples of success
• Large companies should learn from smaller ones that are the early adopters of Big Data
• Collaborate internally and externally, eg CROs, CMOs and academia
dd / mm / yyyyPresentation Title1
McKinsey, How Big Data can revolutionize pharmaceutical R&D, 2013
Confidential Hovione © 2014
Agenda
Technological Trends in Pharmaceutical Development and Manufacturing
Advanced Tools in Development and Manufacturing
Excellent Development and Manufacturing
Quality by Design at Hovione
1
Confidential Hovione © 2014
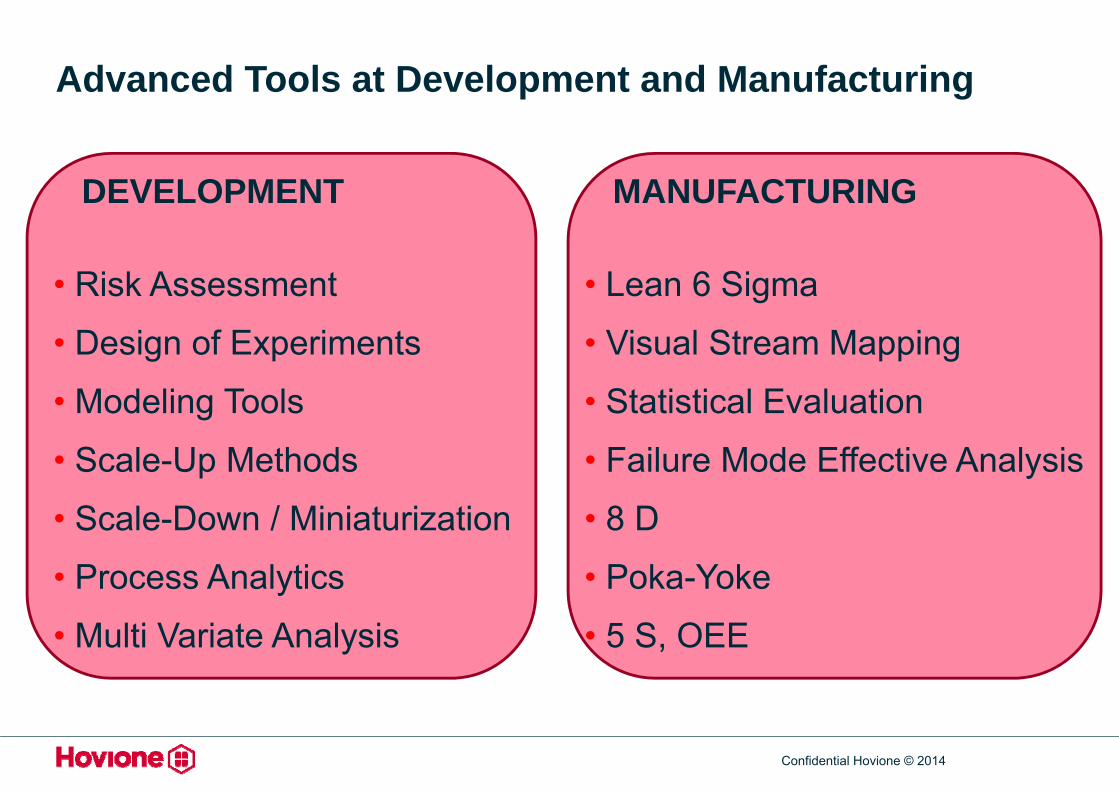
Advanced Tools at Development and Manufacturing
DEVELOPMENT
• Risk Assessment
• Design of Experiments
• Modeling Tools
• Scale-Up Methods
• Scale-Down / Miniaturization
• Process Analytics
• Multi Variate Analysis
MANUFACTURING
• Lean 6 Sigma
• Visual Stream Mapping
• Statistical Evaluation
• Failure Mode Effective Analysis
• 8 D
• Poka-Yoke
• 5 S, OEE
Confidential Hovione © 2014
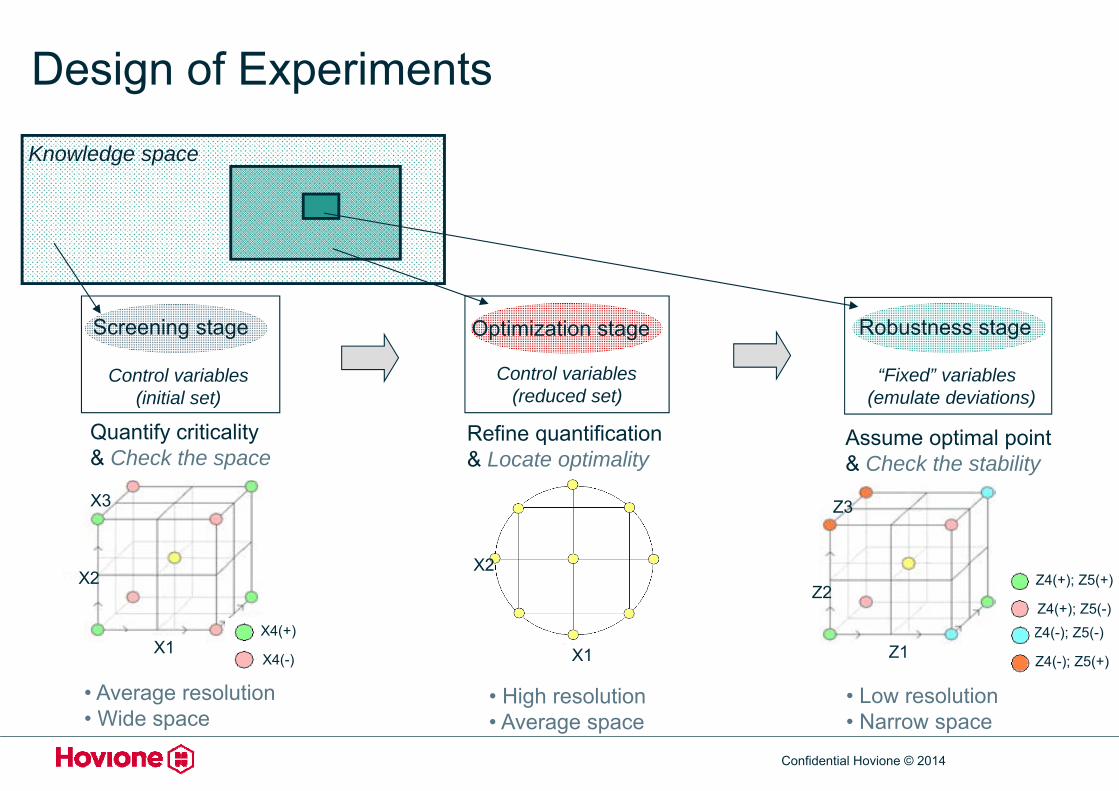
Knowledge space
• Average resolution • Wide space
• Low resolution • Narrow space
• High resolution • Average space
Z1
Z2
Z3
Z4(+); Z5(+)
Z4(+); Z5(-)Z4(-); Z5(-)
Z4(-); Z5(+)
X3
X1
X2X2
X1
Quantify criticality& Check the space
Refine quantification& Locate optimality
Assume optimal point& Check the stability
Screening stage Optimization stage Robustness stage
Control variables(initial set)
Control variables(reduced set)
“Fixed” variables(emulate deviations)
X4(+)
X4(-)
Design of Experiments
Confidential Hovione © 2014
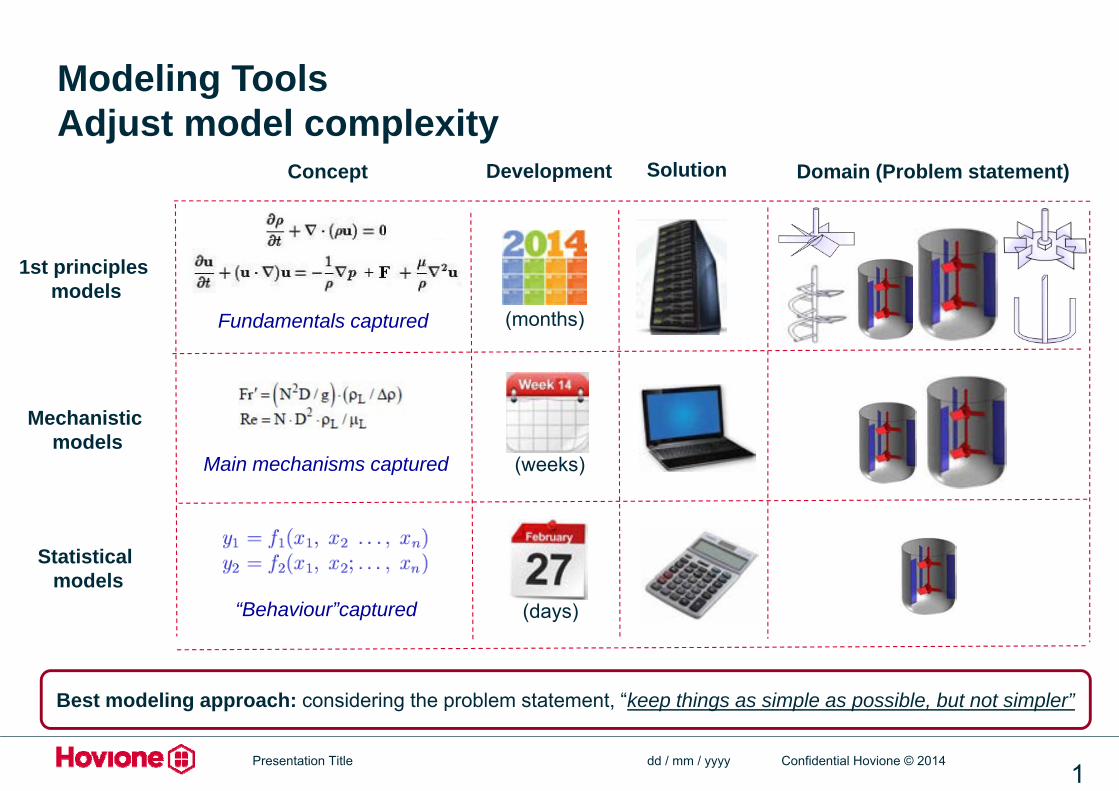
Modeling ToolsAdjust model complexity
dd / mm / yyyyPresentation Title1
Statistical models
Mechanistic models
1st principles models
Development Solution Domain (Problem statement)Concept
Best modeling approach: considering the problem statement, “keep things as simple as possible, but not simpler”
Main mechanisms captured
Fundamentals captured
“Behaviour”captured
(months)
(weeks)
(days)
Confidential Hovione © 2014
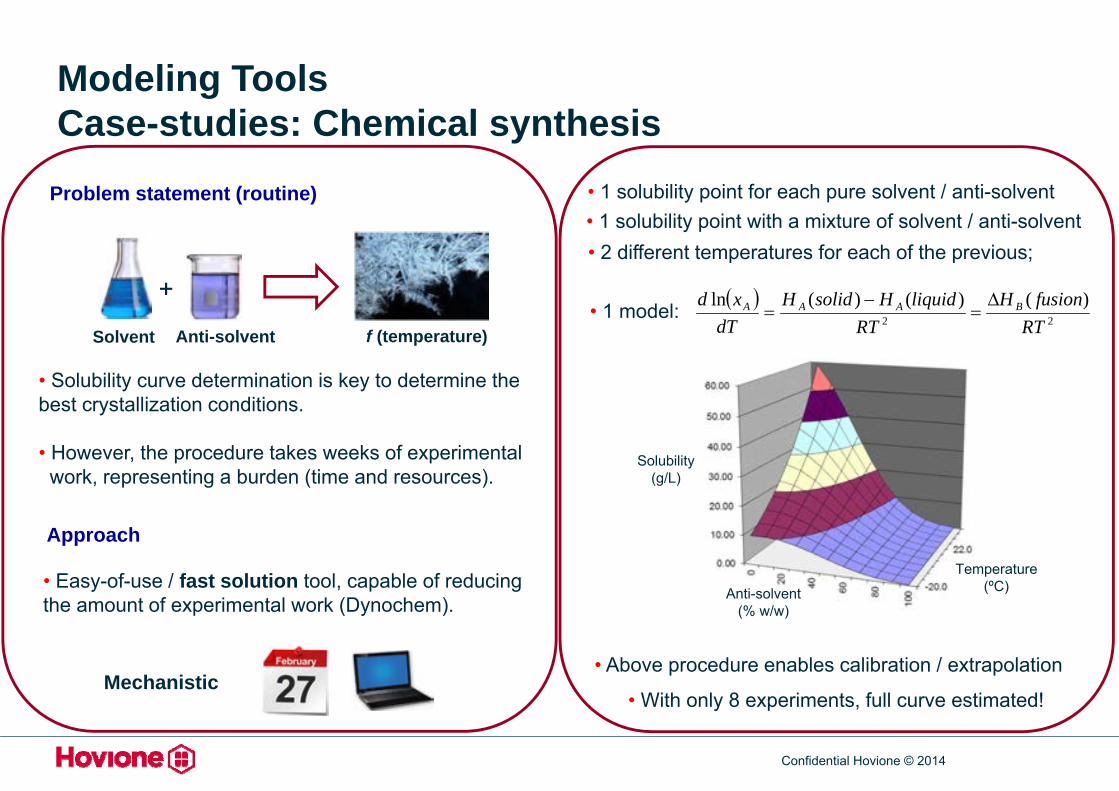
• Solubility curve determination is key to determine the best crystallization conditions.
• However, the procedure takes weeks of experimental work, representing a burden (time and resources).
Problem statement (routine)
Approach
• Easy-of-use / fast solution tool, capable of reducing the amount of experimental work (Dynochem).
+
Mechanistic
Solvent Anti-solvent f (temperature)
Modeling ToolsCase-studies: Chemical synthesis
• With only 8 experiments, full curve estimated!
• 1 solubility point for each pure solvent / anti-solvent• 1 solubility point with a mixture of solvent / anti-solvent• 2 different temperatures for each of the previous;
Solubility(g/L)
Anti-solvent(% w/w)
Temperature(ºC)
22
)()()(lnRT
fusionHRT
liquidHsolidHdT
xd BAAA
• Above procedure enables calibration / extrapolation
• 1 model:
Confidential Hovione © 2014
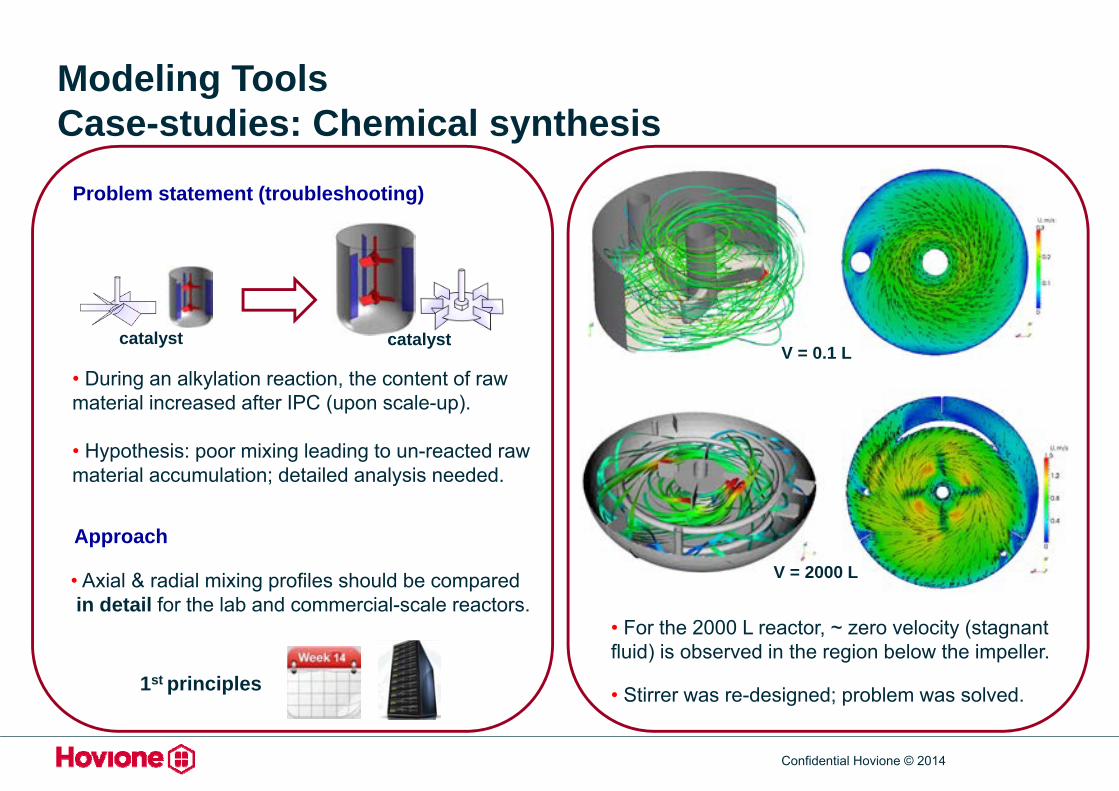
• During an alkylation reaction, the content of raw material increased after IPC (upon scale-up).
• Hypothesis: poor mixing leading to un-reacted raw material accumulation; detailed analysis needed.
Problem statement (troubleshooting)
Approach
• Axial & radial mixing profiles should be comparedin detail for the lab and commercial-scale reactors.
1st principles
catalyst catalyst
Modeling ToolsCase-studies: Chemical synthesis
• For the 2000 L reactor, ~ zero velocity (stagnant fluid) is observed in the region below the impeller.
V = 0.1 L
V = 2000 L
• Stirrer was re-designed; problem was solved.

Confidential Hovione © 2014
F_feed
F_atom
C_feed
P_feed
_feed
C_feed
2-fluid nozzle Pressure nozzle
How to predict particle size?
Modeling Tools Case-studies: Particle engineering

Confidential Hovione © 2014
• Performance very sensitive to particle size (±0.2 m);
Problem statement - Inhalation (routine)
Approach
• Different “classes” of nozzles across different scales;
Statistical
• Build an accurate local model for each product
• Lower number of product under development.
Modeling Tools Case-studies: Particle engineering #1
• Uncertainty evaluation is critical given the narrow ranges!
• Scale-dependent (local model) but very accurate.
DoE1) Experimentation / modeling

Confidential Hovione © 2014
Problem statement - Oral (routine)
Mechanistic
Approach
• Build a calibrated general model for PN systems
• Performance less sensitive to particle size;
• Same “class” of nozzles across different scales;
• High number of new products on a yearly basis.
Modeling Tools Case-studies: Particle engineering #2
• Prediction error of +/- 15% is perfectly acceptable!
• Scale-independent model for general use.
QkhUQhkFkUQkhk
Qkhkhk
r
tanh),,,,,(tanh4
tanhtanh2
2222421
21
LISA model
Calibration sucessfull(> 150 past runs used)
Confidential Hovione © 2014
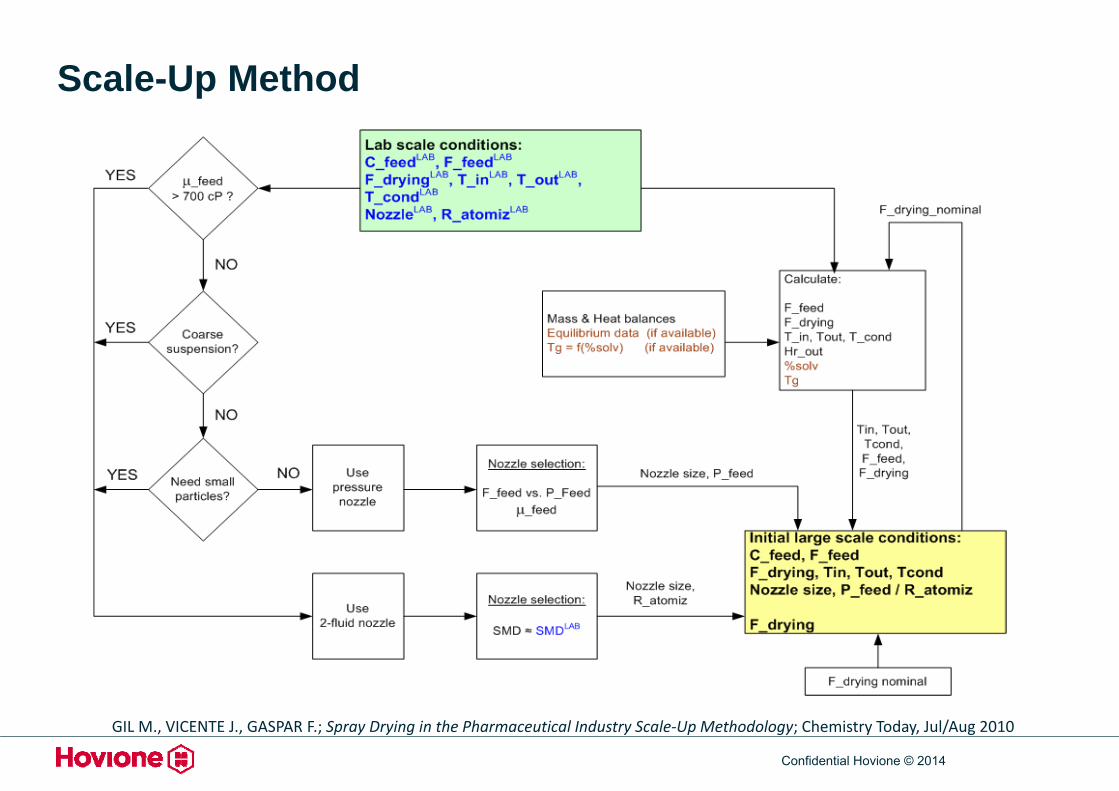
GIL M., VICENTE J., GASPAR F.; Spray Drying in the Pharmaceutical Industry Scale‐Up Methodology; Chemistry Today, Jul/Aug 2010
Scale-Up Method
Confidential Hovione © 2014
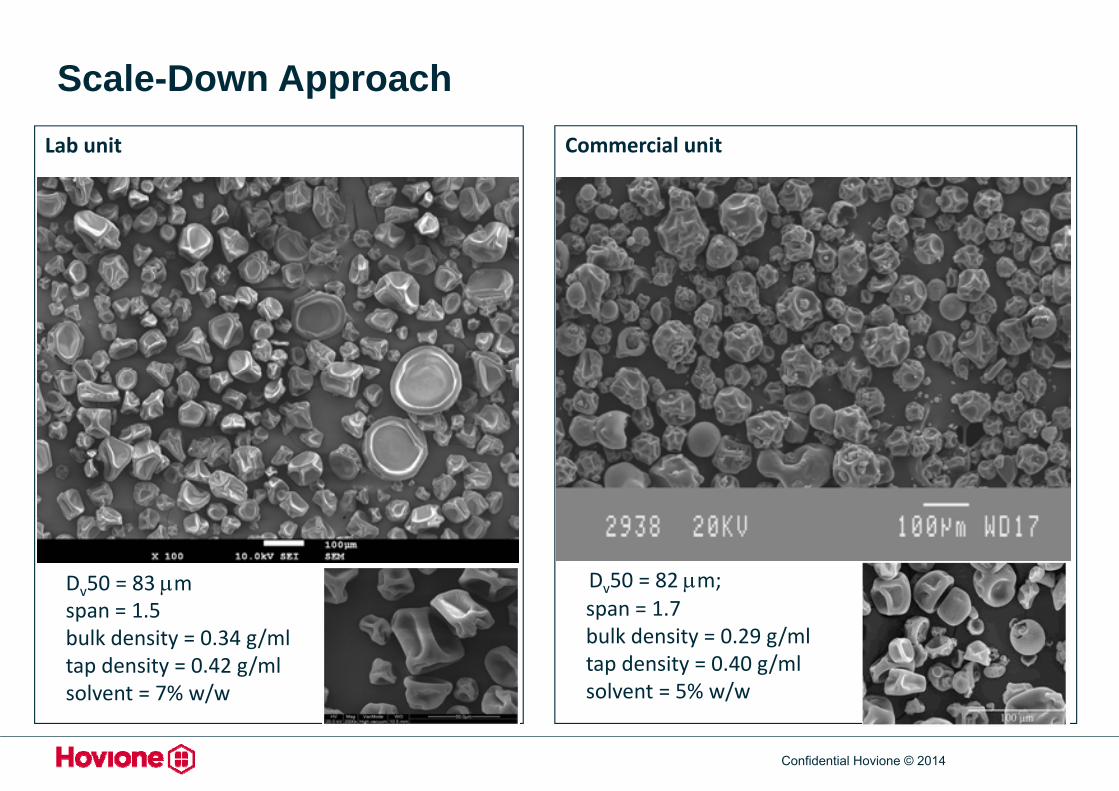
Lab unit
Dv50 = 83 mspan = 1.5bulk density = 0.34 g/ml tap density = 0.42 g/mlsolvent = 7% w/w
Commercial unit
Dv50 = 82 m; span = 1.7bulk density = 0.29 g/ml tap density = 0.40 g/mlsolvent = 5% w/w
Scale-Down Approach
Confidential Hovione © 2014
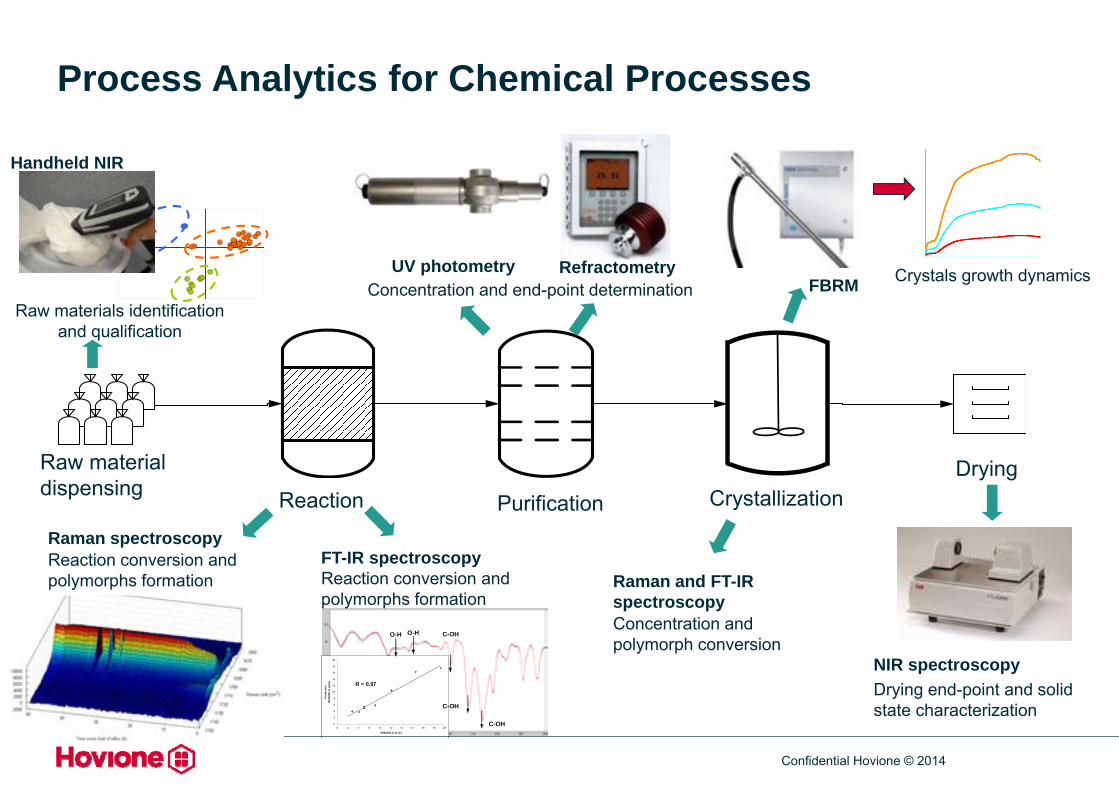
Process Analytics for Chemical Processes
Raw material dispensing
Handheld NIR
Reaction Purification CrystallizationDrying
-0 .4
-0 .3
-0 .2
-0 .1
0
0 .1
0 .2
0 .3
-0 .3 -0 .2 -0 .1 0 0 .1 0 .2
Raw materials identification and qualification
y = 0.9393x + 0.4461R2 = 0.9334
0
2
4
6
8
10
12
14
16
18
20
0 2 4 6 8 10 12 14 16 18 20
XR02036 % (w /w)
Pre
dict
ion
XR02
036
% (w
/w)
O-H C-OH
C-OH
R = 0.97
C-OH
O-H
y = 0.9393x + 0.4461R2 = 0.9334
0
2
4
6
8
10
12
14
16
18
20
0 2 4 6 8 10 12 14 16 18 20
XR02036 % (w /w)
Pre
dict
ion
XR02
036
% (w
/w)
O-H C-OH
C-OH
R = 0.97
C-OH
O-H
NIR spectroscopyDrying end-point and solid state characterization
FBRM Crystals growth dynamics
FT-IR spectroscopy Reaction conversion and polymorphs formation
Raman spectroscopyReaction conversion and polymorphs formation Raman and FT-IR
spectroscopyConcentration and polymorph conversion
UV photometry RefractometryConcentration and end-point determination
Confidential Hovione © 2014
0
5
10
15
20
25
30
35
0 10 20 30 40 50
Dv(
10) (
um)
Process time (h)
Dv(10) by NIR
Dv(10) by laser diffraction3.5
3.8
4.1
4.4
4.7
5
5.3
1.5 3.5 5.5 7.5 9.5 11.5Process time (h)
Wat
er (%
)
Water by NIR
Water by KF
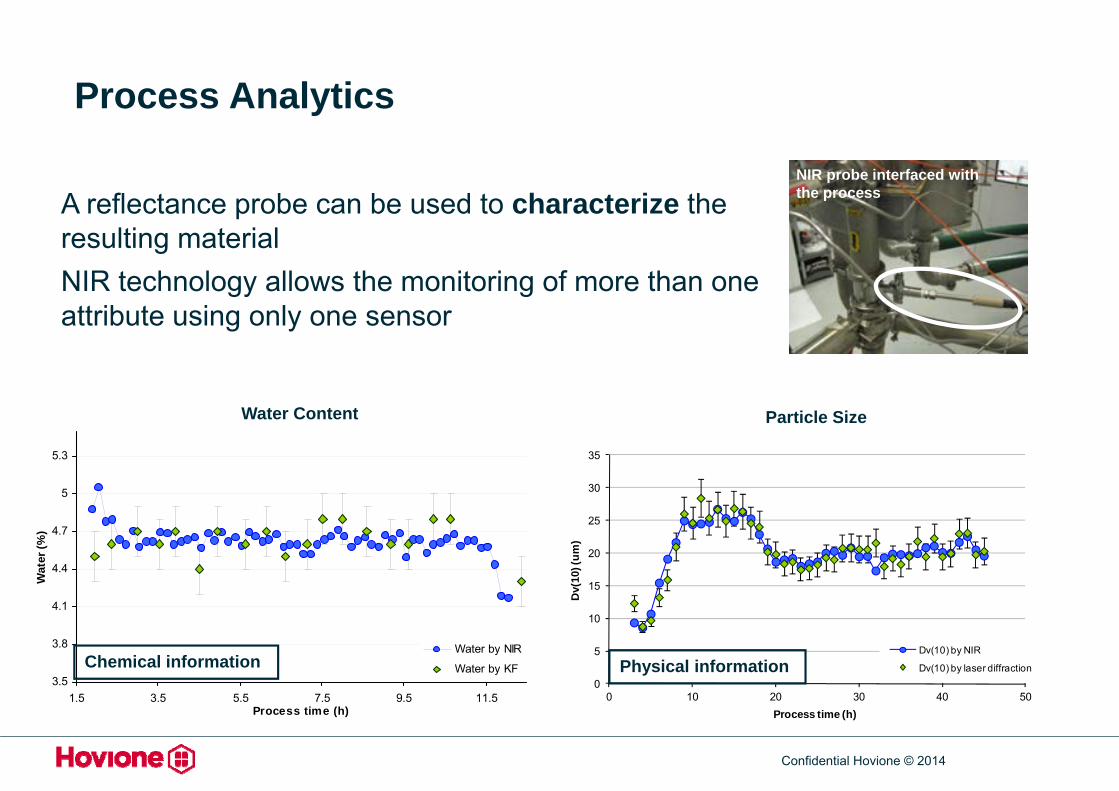
A reflectance probe can be used to characterize the resulting materialNIR technology allows the monitoring of more than one attribute using only one sensor
Water Content Particle Size
NIR probe interfaced with the process
Chemical information Physical information
Process Analytics
Confidential Hovione © 2014
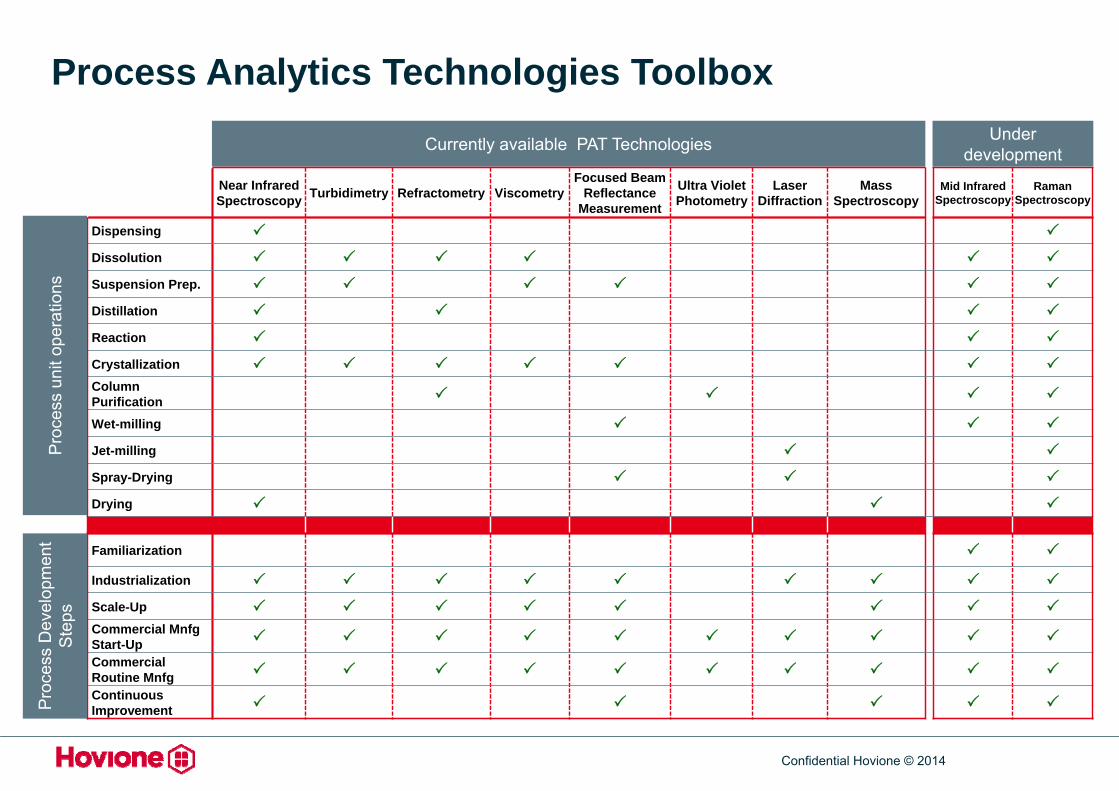
Currently available PAT Technologies
Near Infrared Spectroscopy Turbidimetry Refractometry Viscometry
Focused Beam Reflectance
Measurement
Ultra Violet Photometry
Laser Diffraction
Mass Spectroscopy
Mid Infrared Spectroscopy
Raman Spectroscopy
Dispensing
Dissolution
Suspension Prep.
Distillation
Reaction
Crystallization Column Purification
Wet-milling
Jet-milling
Spray-Drying
Drying
Familiarization
Industrialization
Scale-Up Commercial MnfgStart-Up
Commercial Routine Mnfg
Continuous Improvement
Under development
Pro
cess
uni
t ope
ratio
nsP
roce
ss D
evel
opm
ent
Ste
psProcess Analytics Technologies Toolbox
Confidential Hovione © 2014
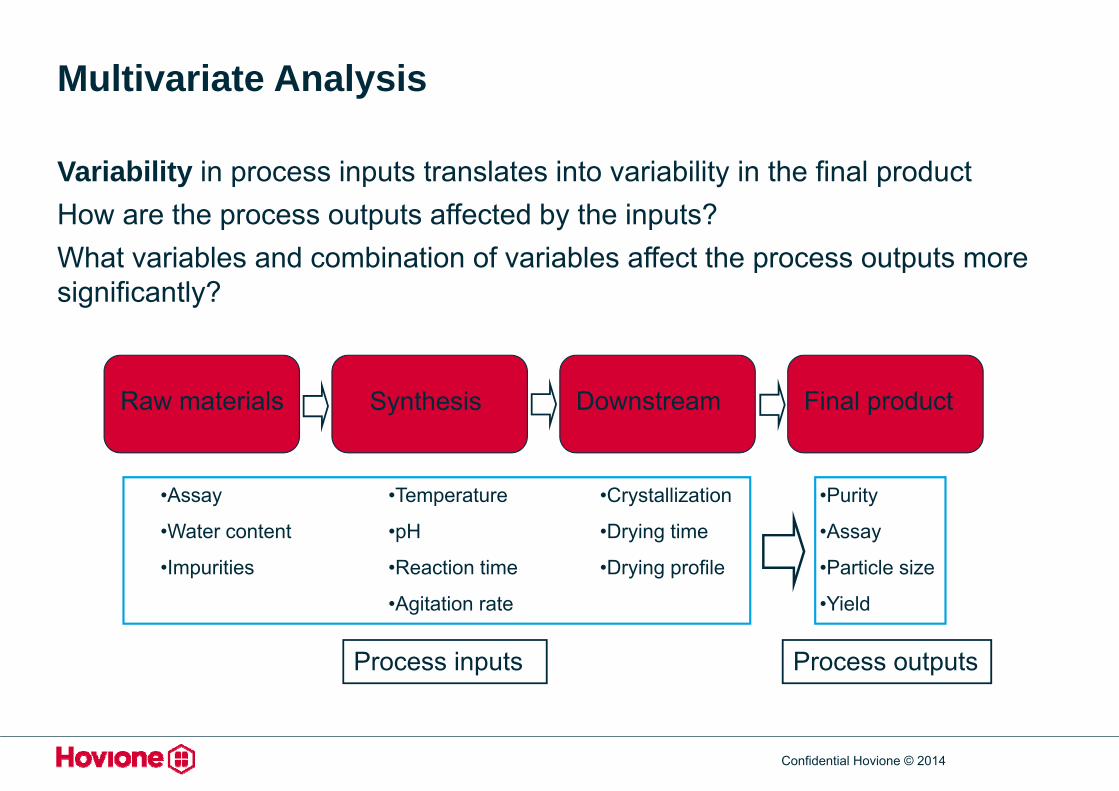
Multivariate Analysis
Variability in process inputs translates into variability in the final productHow are the process outputs affected by the inputs?What variables and combination of variables affect the process outputs more significantly?
•Assay
•Water content
•Impurities
•Temperature
•pH
•Reaction time
•Agitation rate
•Crystallization
•Drying time
•Drying profile
•Purity
•Assay
•Particle size
•Yield
Process inputs Process outputs
Raw materials Synthesis Downstream Final product
Confidential Hovione © 2014
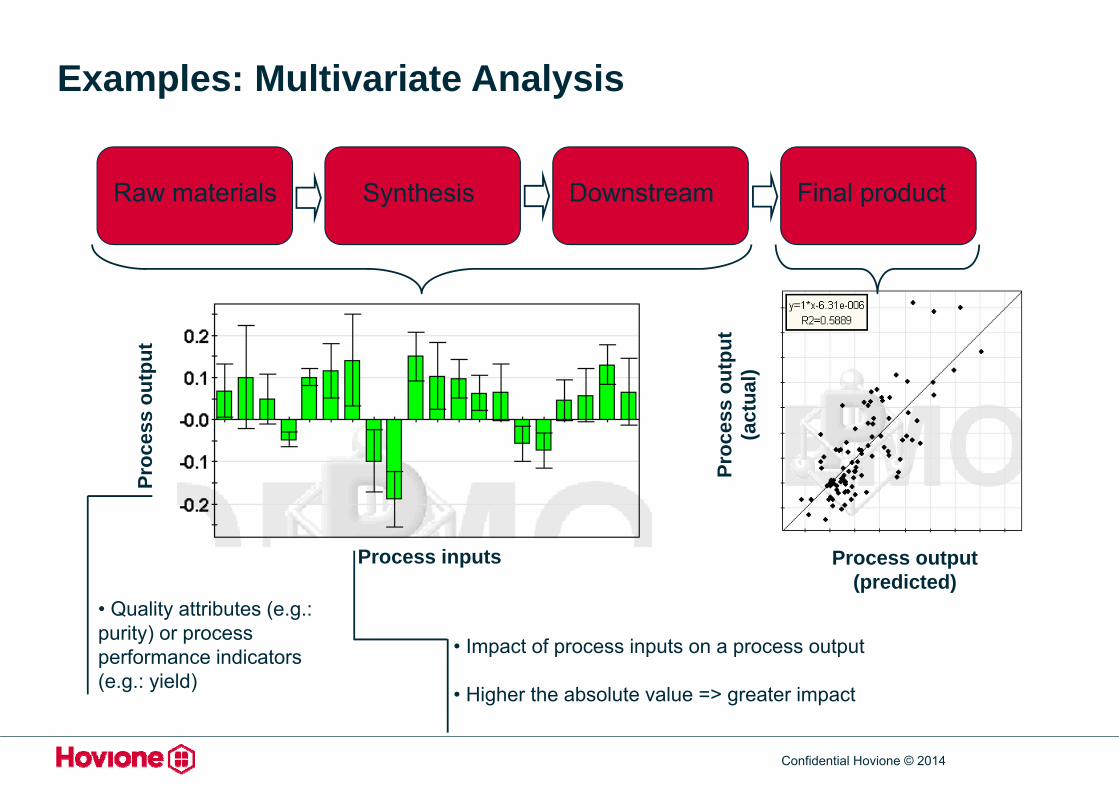
Examples: Multivariate Analysis
Raw materials Synthesis Downstream Final product
Process inputs
Proc
ess
outp
ut
Proc
ess
outp
ut(a
ctua
l)
Process output(predicted)
• Impact of process inputs on a process output
• Higher the absolute value => greater impact
• Quality attributes (e.g.: purity) or process performance indicators (e.g.: yield)
Confidential Hovione © 2014
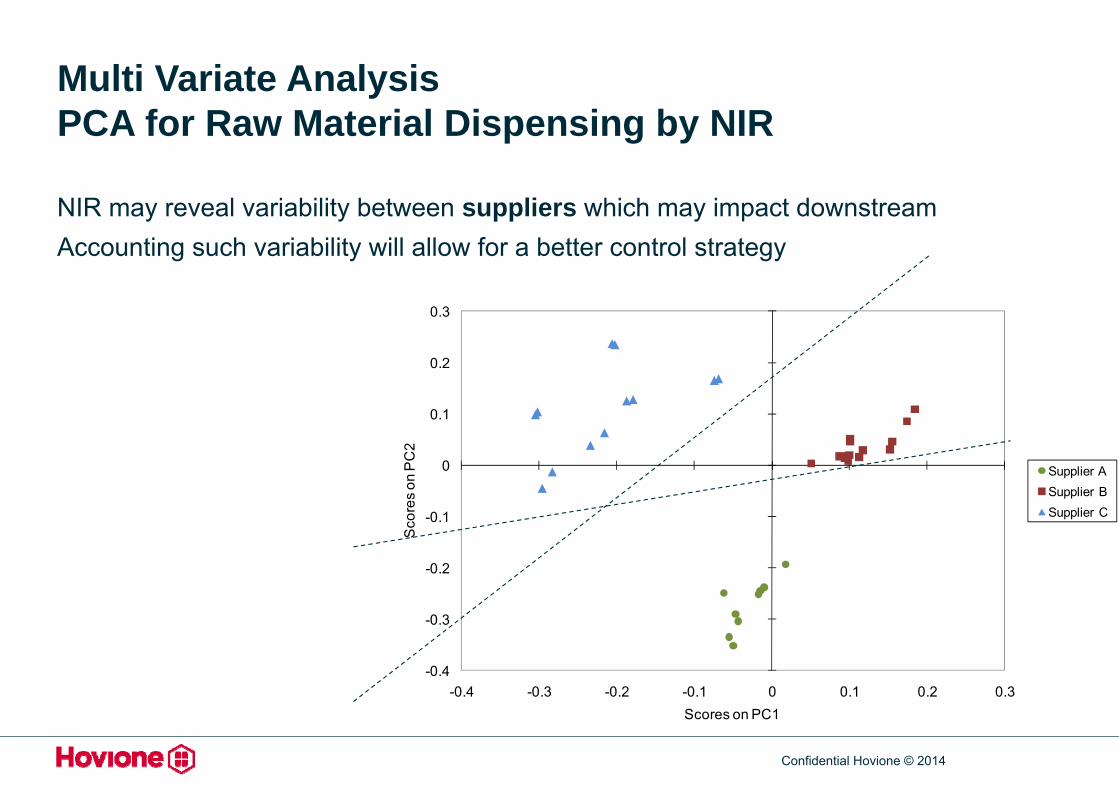
Multi Variate AnalysisPCA for Raw Material Dispensing by NIR
NIR may reveal variability between suppliers which may impact downstreamAccounting such variability will allow for a better control strategy
-0.4
-0.3
-0.2
-0.1
0
0.1
0.2
0.3
-0.4 -0.3 -0.2 -0.1 0 0.1 0.2 0.3
Sco
res
on P
C2
Scores on PC1
Supplier ASupplier BSupplier C
Confidential Hovione © 2014
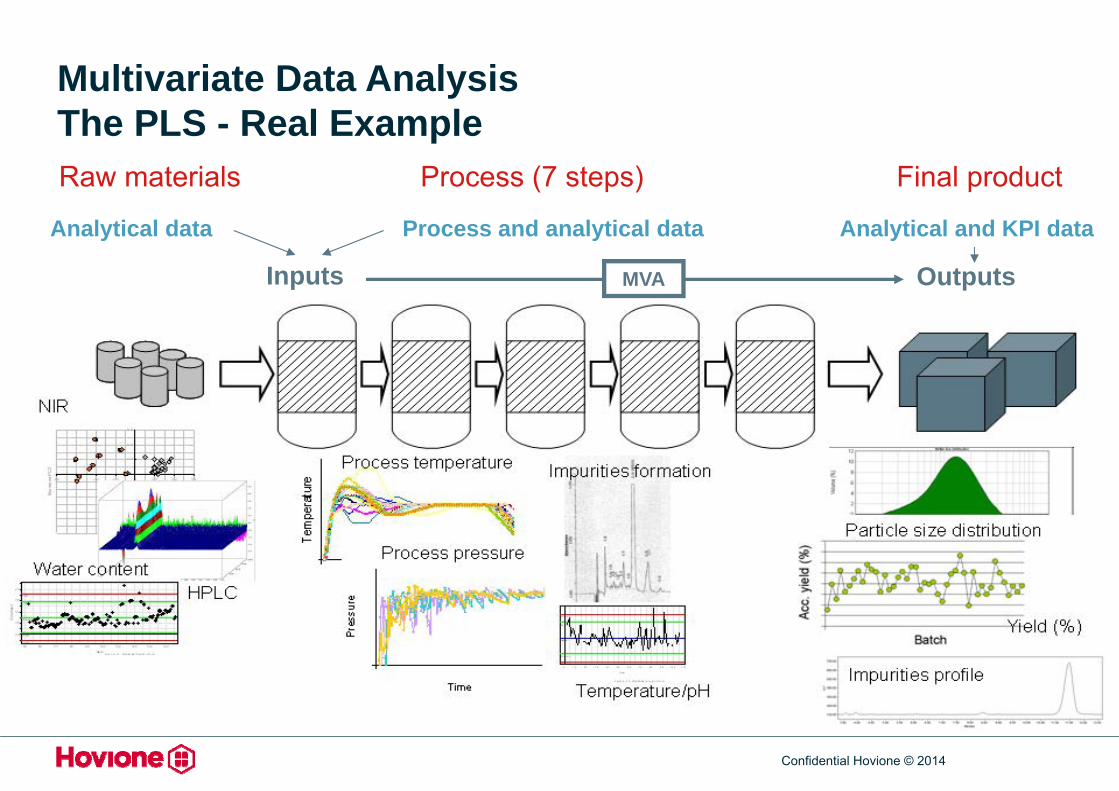
Multivariate Data AnalysisThe PLS - Real ExampleRaw materials Process (7 steps) Final product
Analytical data Process and analytical data Analytical and KPI data
Inputs OutputsMVA

Confidential Hovione © 2014
Multivariate Data AnalysisThe PLS - RegressionRaw materialsNIR spectra; HPLC; Water content
ReactionsTemp./pressure profiles
Intermediates HPLC
DownstreamTemperatures/pH
Intermediates HPLC
• Final product– Impurities– Particle size distribution– Accumulated yieldPartial Least Squares
Regression
Confidential Hovione © 2014
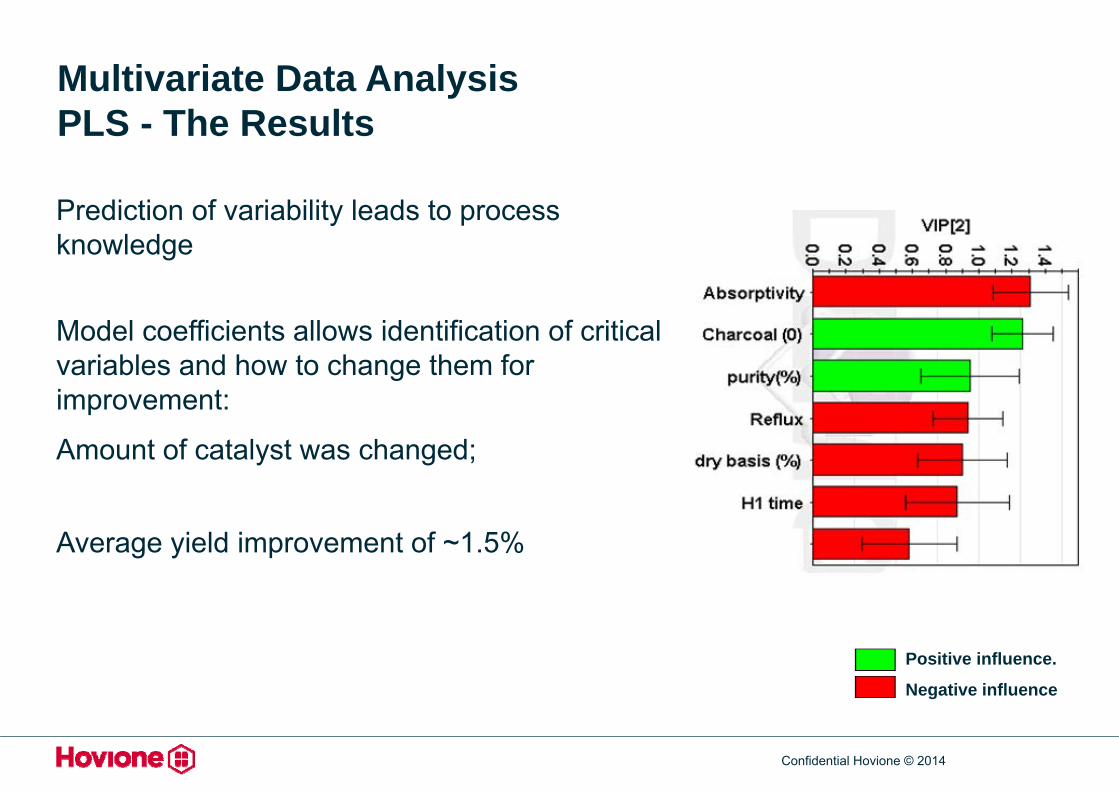
Multivariate Data AnalysisPLS - The Results
Prediction of variability leads to process knowledge
Model coefficients allows identification of critical variables and how to change them for improvement:
Amount of catalyst was changed;
Average yield improvement of ~1.5%
Positive influence.
Negative influence
Confidential Hovione © 2014
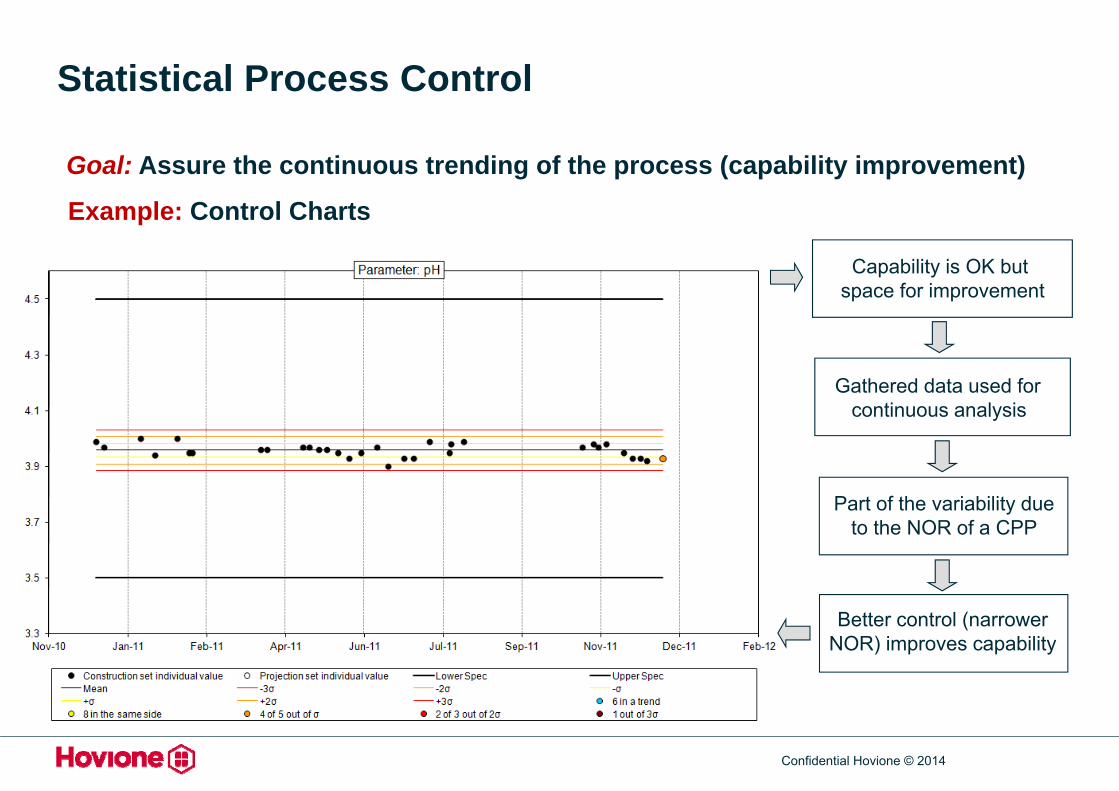
Part of the variability due to the NOR of a CPP
Gathered data used forcontinuous analysis
Statistical Process Control
Goal: Assure the continuous trending of the process (capability improvement)
Example: Control Charts
Capability is OK butspace for improvement
Better control (narrower NOR) improves capability
Confidential Hovione © 2014
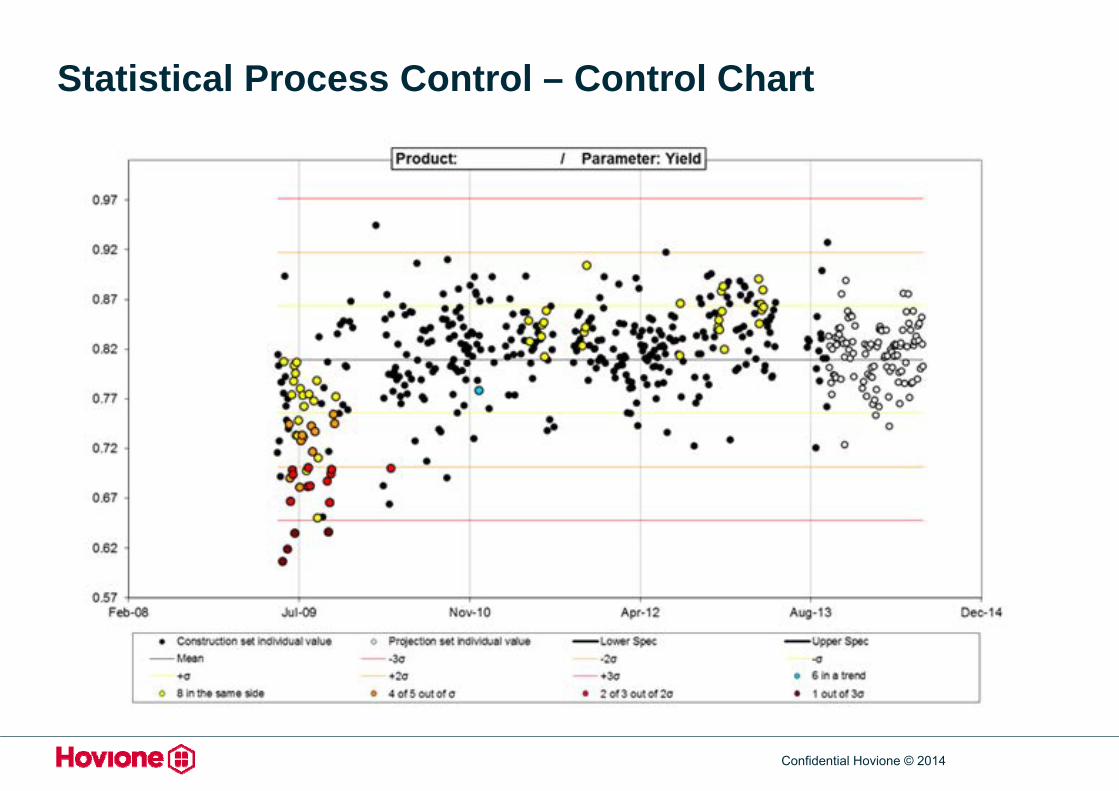
Statistical Process Control – Control Chart
Confidential Hovione © 2014
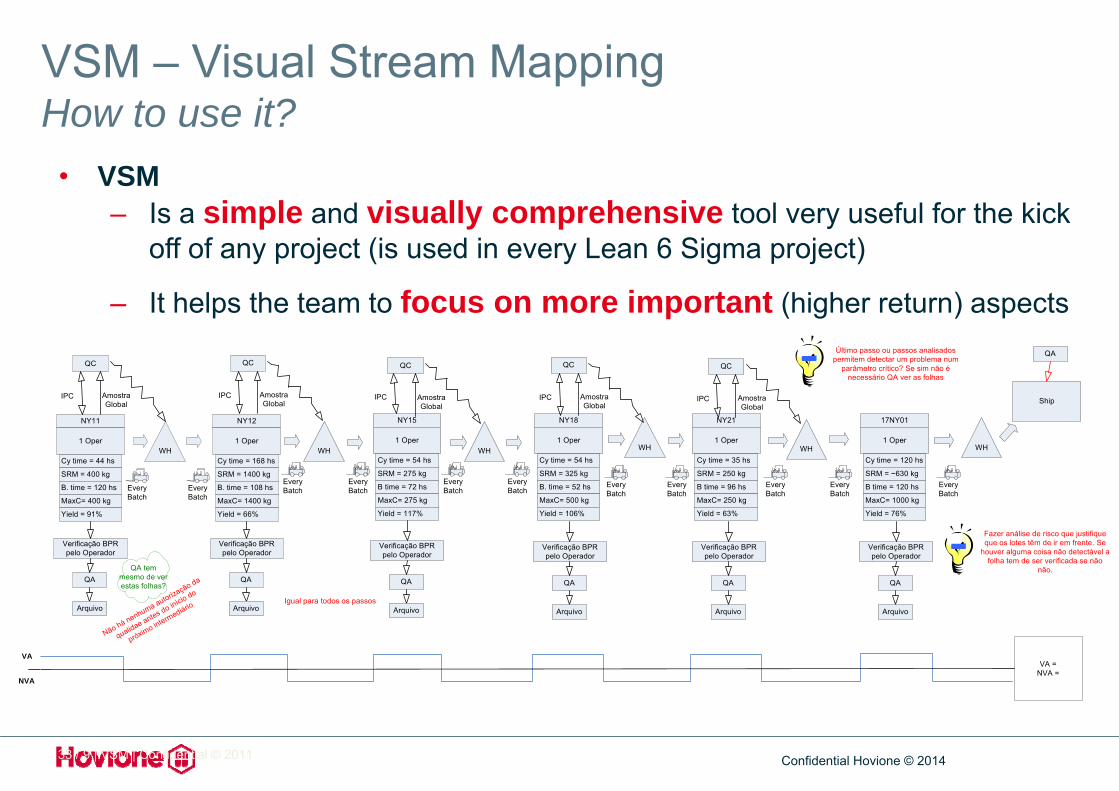
VSM – Visual Stream MappingHow to use it?
• VSM– Is a simple and visually comprehensive tool very useful for the kick
off of any project (is used in every Lean 6 Sigma project)
– It helps the team to focus on more important (higher return) aspects
VA = NVA =
NY11
1 Oper
Cy time = 44 hsWH
SRM = 400 kg
B. time = 120 hs
MaxC= 400 kg
Yield = 91%
NY12
1 Oper
Cy time = 168 hs
SRM = 1400 kg
B. time = 108 hs
MaxC= 1400 kg
Yield = 66%
WH
NY15
1 Oper
Cy time = 54 hs
SRM = 275 kg
B time = 72 hs
MaxC= 275 kg
Yield = 117%
WH
NY18
1 Oper
Cy time = 54 hs
SRM = 325 kg
B. time = 52 hs
MaxC= 500 kg
Yield = 106%
WH
NY21
1 Oper
Cy time = 35 hs
SRM = 250 kg
B time = 96 hs
MaxC= 250 kg
Yield = 63%
WH
17NY01
1 Oper
Cy time = 120 hs
SRM = ~630 kg
B time = 120 hs
MaxC= 1000 kg
Yield = 76%
WH
EveryBatch
EveryBatch
EveryBatch
EveryBatch
EveryBatch
EveryBatch
EveryBatch
EveryBatch
EveryBatch
EveryBatch
EveryBatch
QC
IPC AmostraGlobal Ship
QA
Verificação BPR pelo Operador
QC
IPC AmostraGlobal
QC
IPC AmostraGlobal
QC
IPC AmostraGlobal
QC
IPC AmostraGlobal
QA
Arquivo
Verificação BPR pelo Operador
QA
Arquivo
Verificação BPR pelo Operador
QA
Arquivo
Verificação BPR pelo Operador
QA
Arquivo
Verificação BPR pelo Operador
QA
Arquivo
Verificação BPR pelo Operador
QA
Arquivo
VA
NVA
QA tem mesmo de ver estas folhas?
Não há nenhuma autorização da
qualidae antes do início do
próximo intermediário
Último passo ou passos analisados permitem detectar um problema num
parâmetro crítico? Se sim não é necessário QA ver as folhas
Fazer análise de risco que justifique que os lotes têm de ir em frente. Se
houver alguma coisa não detectável a folha tem de ser verificada se não
não.
Igual para todos os passos
33 / 9 | VSM | Confidential © 2011
Confidential Hovione © 2014
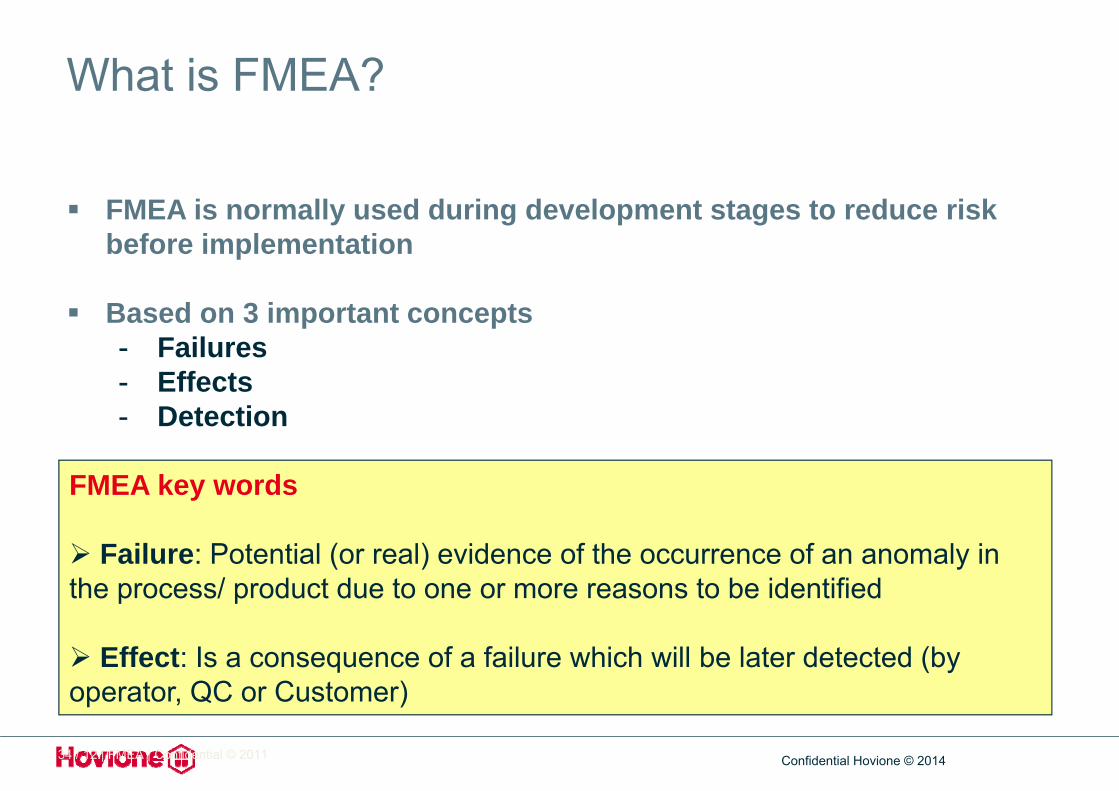
FMEA key words
Failure: Potential (or real) evidence of the occurrence of an anomaly in the process/ product due to one or more reasons to be identified
Effect: Is a consequence of a failure which will be later detected (by operator, QC or Customer)
FMEA is normally used during development stages to reduce risk before implementation
Based on 3 important concepts- Failures- Effects- Detection
What is FMEA?
34 / 12 | FMEA | Confidential © 2011
Confidential Hovione © 2014
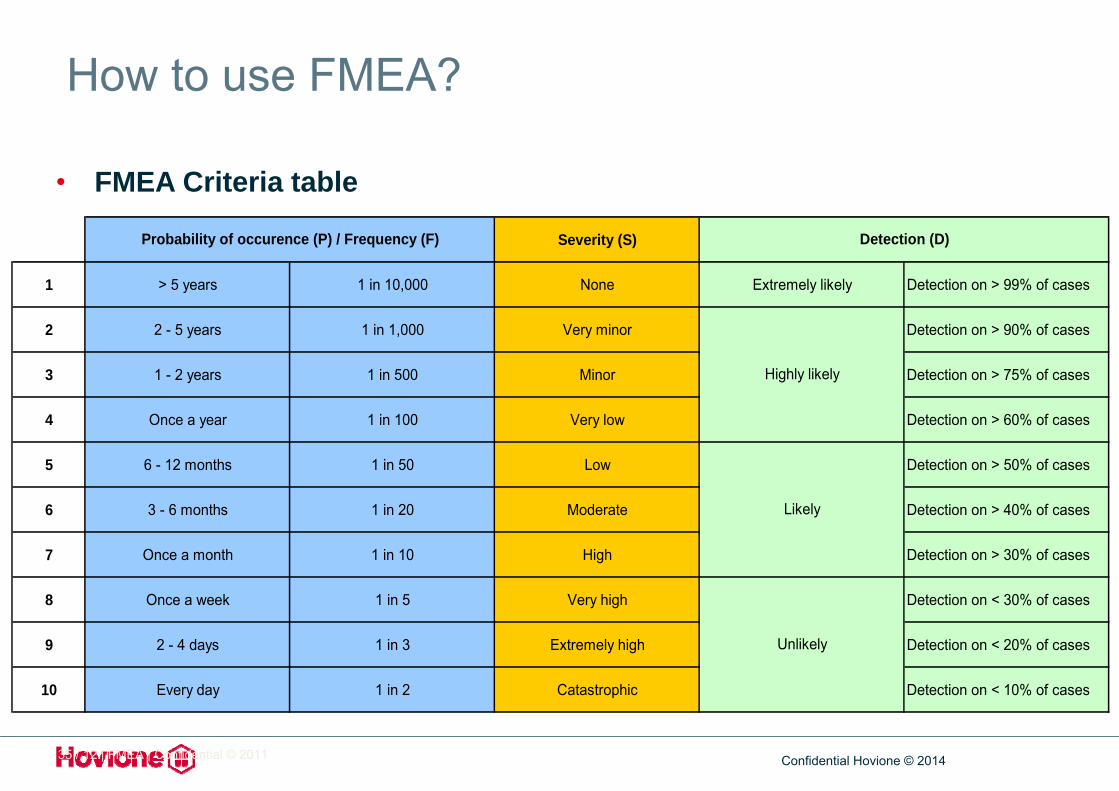
Severity (S)
1 > 5 years 1 in 10,000 None Extremely likely Detection on > 99% of cases
2 2 - 5 years 1 in 1,000 Very minor Detection on > 90% of cases
3 1 - 2 years 1 in 500 Minor Detection on > 75% of cases
4 Once a year 1 in 100 Very low Detection on > 60% of cases
5 6 - 12 months 1 in 50 Low Detection on > 50% of cases
6 3 - 6 months 1 in 20 Moderate Detection on > 40% of cases
7 Once a month 1 in 10 High Detection on > 30% of cases
8 Once a week 1 in 5 Very high Detection on < 30% of cases
9 2 - 4 days 1 in 3 Extremely high Detection on < 20% of cases
10 Every day 1 in 2 Catastrophic Detection on < 10% of cases
Unlikely
Probability of occurence (P) / Frequency (F) Detection (D)
Highly likely
Likely
How to use FMEA?
35 / 12 | FMEA | Confidential © 2011
• FMEA Criteria table
Confidential Hovione © 2014
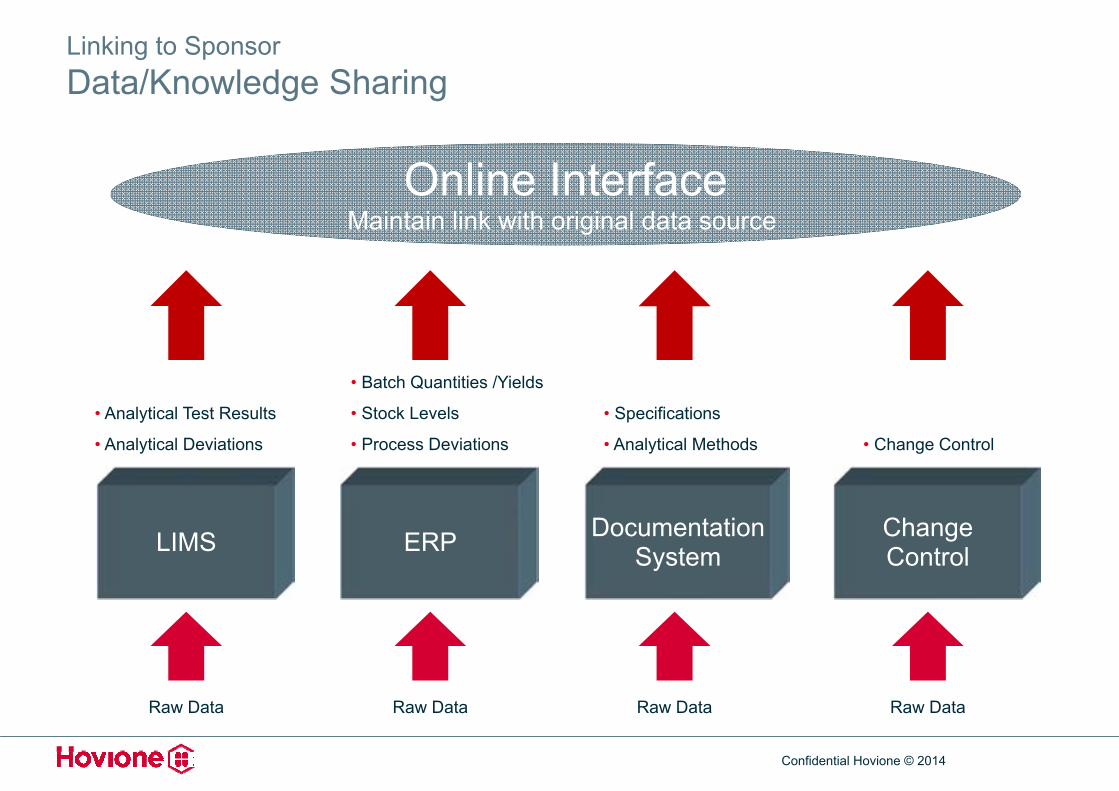
LIMS ERP ChangeControl
Online InterfaceMaintain link with original data source
DocumentationSystem
• Analytical Test Results
• Analytical Deviations
• Batch Quantities /Yields
• Stock Levels
• Process Deviations
• Specifications
• Analytical Methods • Change Control
Raw Data Raw Data Raw Data Raw Data
Linking to SponsorData/Knowledge Sharing
Confidential Hovione © 2014
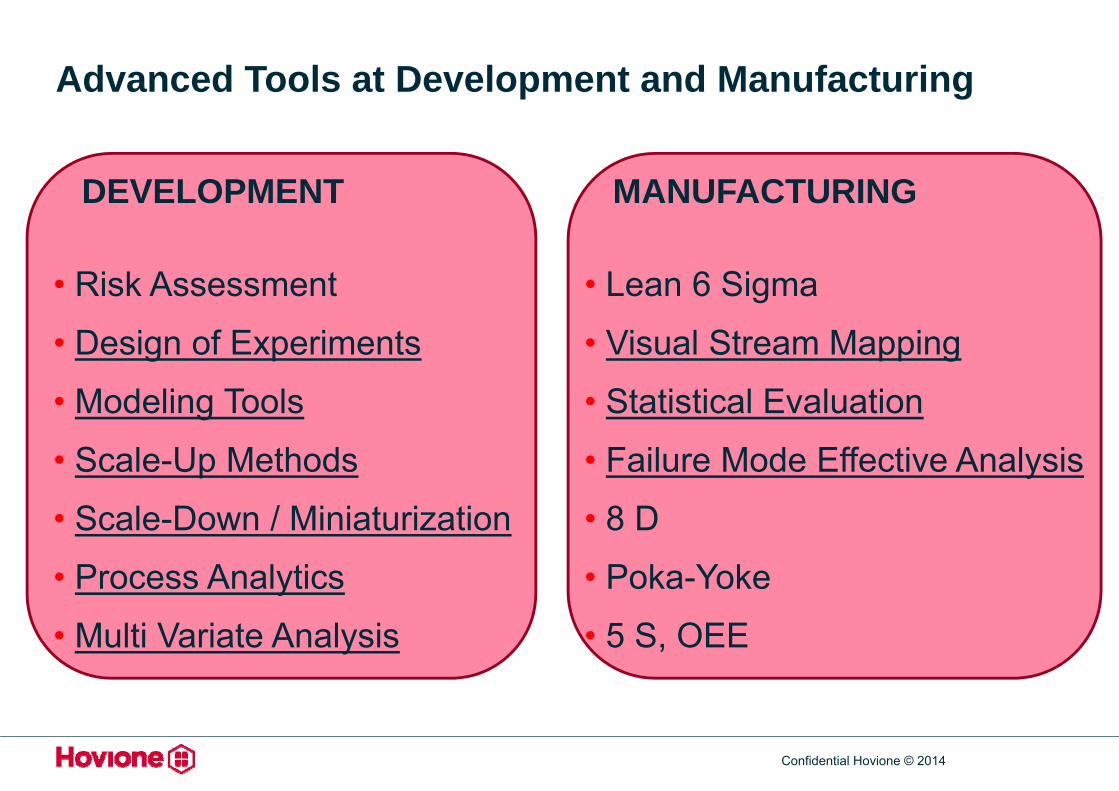
Advanced Tools at Development and Manufacturing
DEVELOPMENT
• Risk Assessment
• Design of Experiments
• Modeling Tools
• Scale-Up Methods
• Scale-Down / Miniaturization
• Process Analytics
• Multi Variate Analysis
MANUFACTURING
• Lean 6 Sigma
• Visual Stream Mapping
• Statistical Evaluation
• Failure Mode Effective Analysis
• 8 D
• Poka-Yoke
• 5 S, OEE
Confidential Hovione © 2014
Agenda
Technological Trends in Pharmaceutical Development and Manufacturing
Advanced Tools in Development and Manufacturing
Excellent Development and Manufacturing
Quality by Design at Hovione
3
Confidential Hovione © 2014
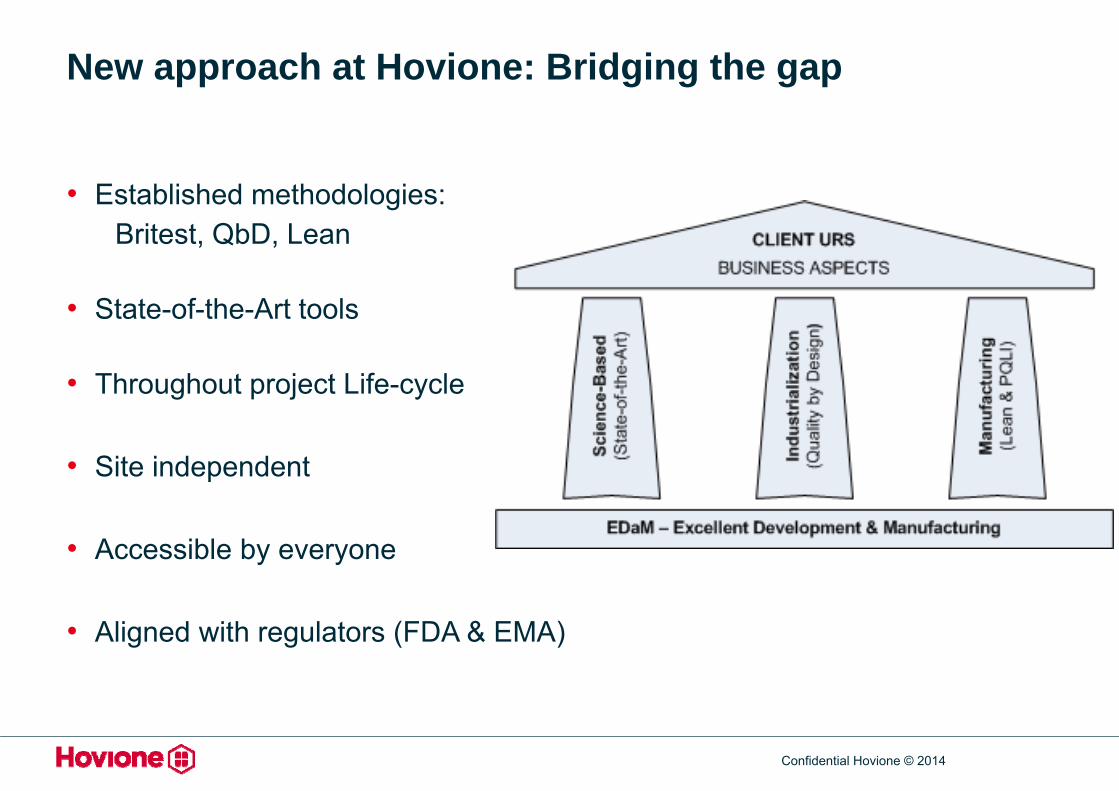
New approach at Hovione: Bridging the gap
• Established methodologies:Britest, QbD, Lean
• State-of-the-Art tools
• Throughout project Life-cycle
• Site independent
• Accessible by everyone
• Aligned with regulators (FDA & EMA)
Confidential Hovione © 2014
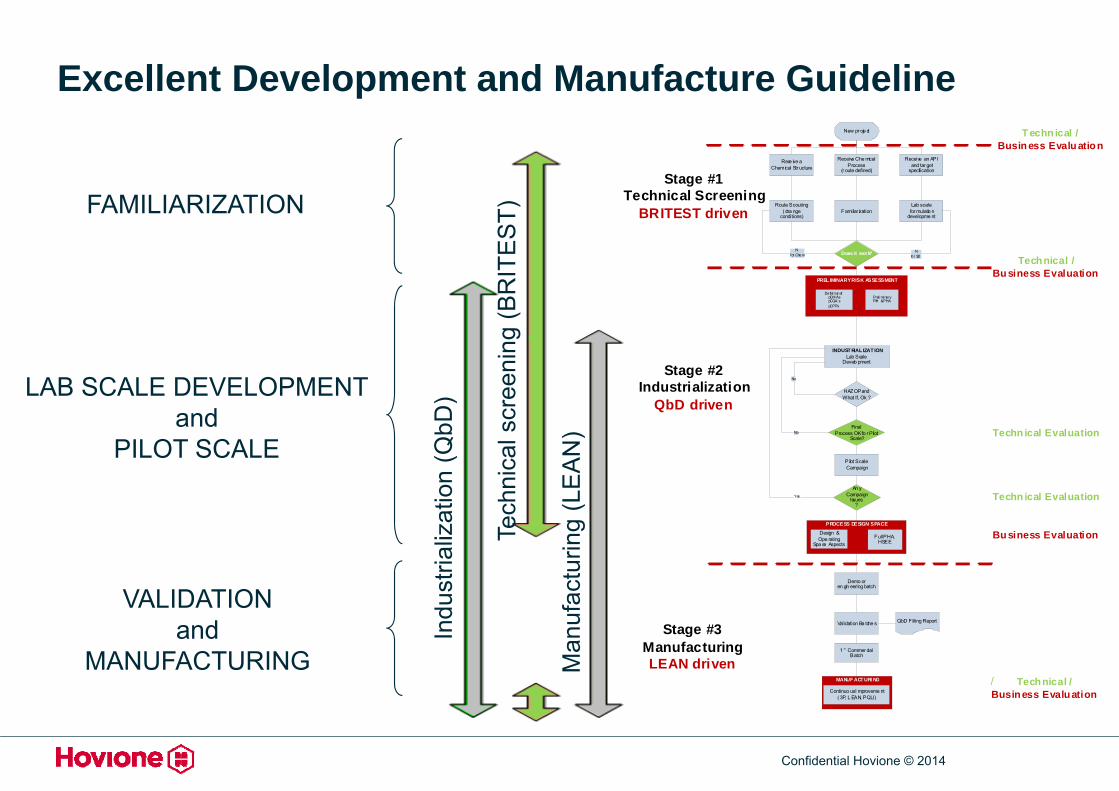
Excellent Development and Manufacture Guideline
FAMILIARIZATION
LAB SCALE DEVELOPMENTand
PILOT SCALE
VALIDATION and
MANUFACTURING/
Indu
stria
lizat
ion
(QbD
)
Tech
nica
l scr
eeni
ng (B
RIT
ES
T)
Man
ufac
turin
g (L
EA
N)
Yes
No
New pr oje ct
Rece ive a Chem ical Str ucture
Receive Che mical Process
(r oute defined)
Route Scouting ( cha nge
conditions)F amiliar ization
Pilot Scale Campaign
PROCESS DESIGN SPACE
Design &Ope rating
Spa ce AspectsF ull PHA,
HSEE
Demo or en gin eering batch
Validation Ba tche s
1 st Commer cial Batch
Receive an API and tar get
specification
Lab scale for mulatio n
developme nt
Nfor Chem
HAZ OP andWhat If, Ok ?
Does it work?
FinalProcess OKfo r Pilot
Scale?No
An yCampaign
Issues?
PREL IMINARY RISK ASSESSMENT
Defini tion ofpCM A’spCQA’spCPP’s
Prel iminaryPIH & PHA
Nfor SD
QbD F illing Report
INDUST RIAL IZAT IONLab Scale
Develo pment
Technical /Bu siness Evaluation
Techn ical Evaluation
Techn ical Evaluation
Bu siness Evaluation
Technical /Business Evaluation
MANUF ACTURI NG
Continuo us I mproveme nt( 3P, L EAN, PQLI)
Stage #1Technical Screening
BRITEST driven
T echn ical /Busin ess Evalu ation
Stage #2Industrialization
QbD driven
Stage #3ManufacturingLEAN driven
Confidential Hovione © 2014
Agenda
Technological Trends in Pharmaceutical Development and Manufacturing
Advanced Tools in Development and Manufacturing
Excellent Development and Manufacturing
Quality by Design at Hovione
4
Confidential Hovione © 2014
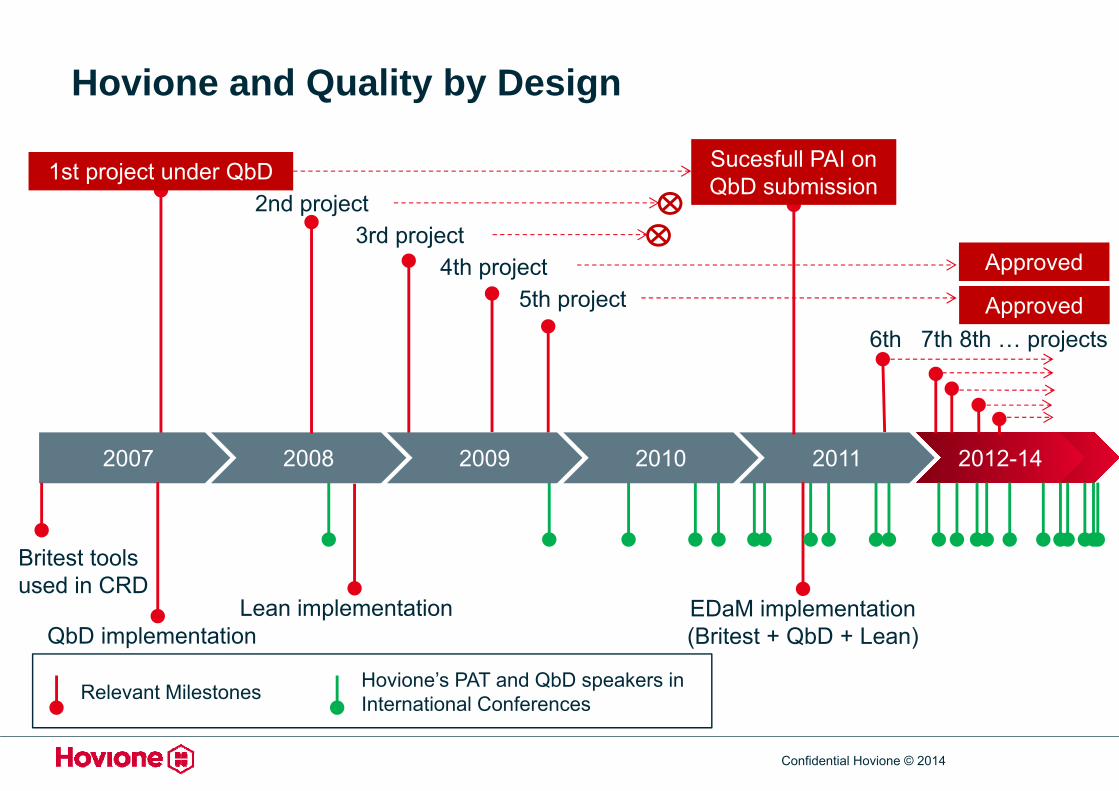
2012
Relevant Milestones Hovione’s PAT and QbD speakers in International Conferences
2007 2008 2009 2010 2011
QbD implementation
Sucesfull PAI on QbD submission
Lean implementation EDaM implementation(Britest + QbD + Lean)
Britest tools used in CRD
1st project under QbD2nd project
3rd project4th project
5th project
2012-14
Approved
Approved6th 7th 8th … projects
Hovione and Quality by Design
Confidential Hovione © 2014
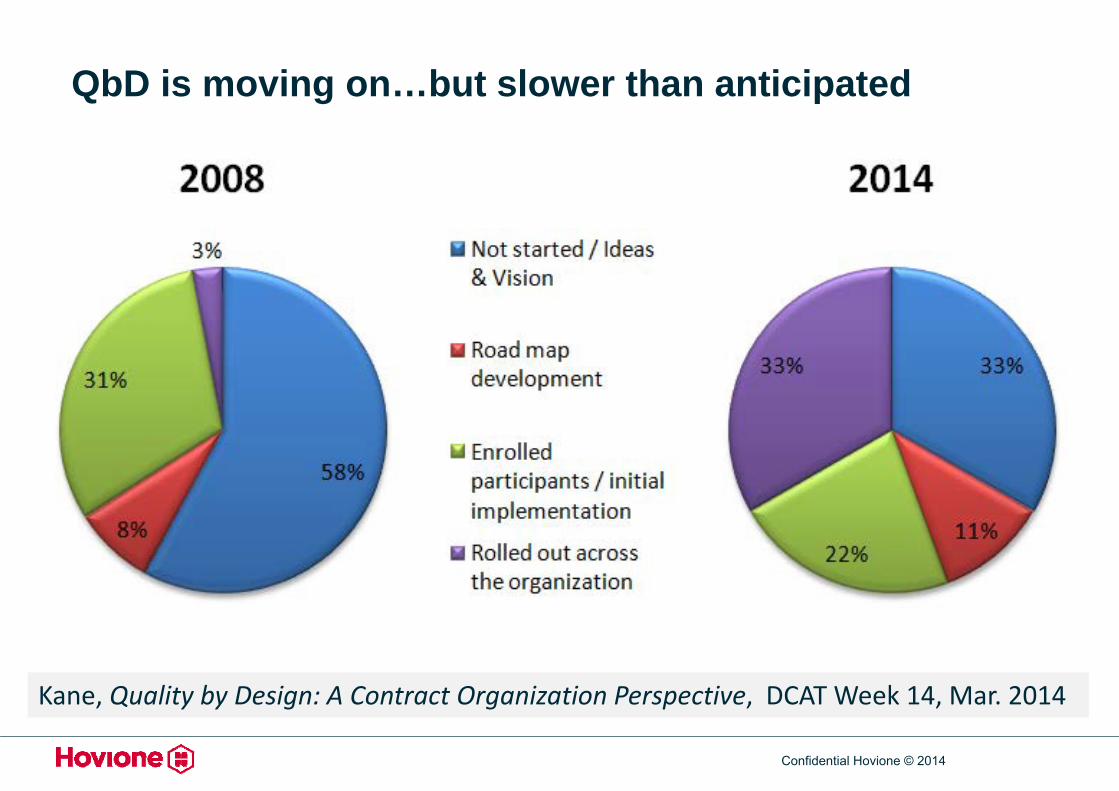
Kane, Quality by Design: A Contract Organization Perspective, DCAT Week 14, Mar. 2014
QbD is moving on…but slower than anticipated
Confidential Hovione © 2014
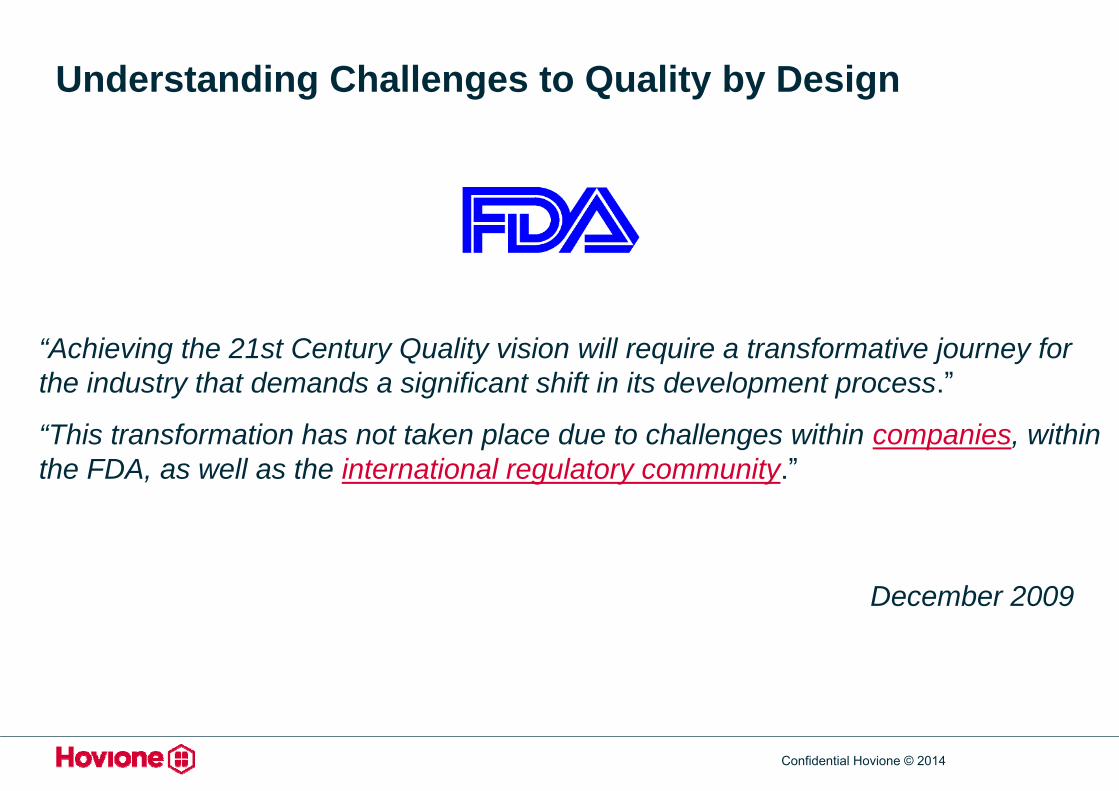
Understanding Challenges to Quality by Design
“Achieving the 21st Century Quality vision will require a transformative journey for the industry that demands a significant shift in its development process.”
“This transformation has not taken place due to challenges within companies, within the FDA, as well as the international regulatory community.”
December 2009
Confidential Hovione © 2014
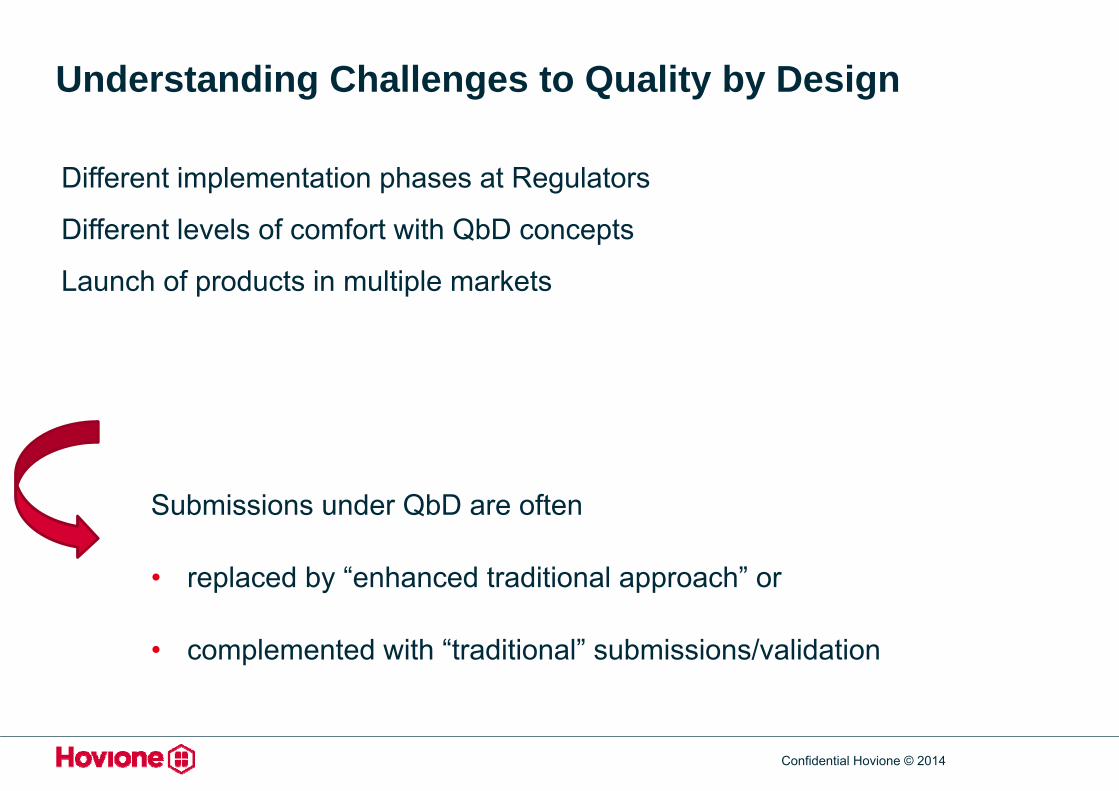
Understanding Challenges to Quality by Design
Different implementation phases at Regulators
Different levels of comfort with QbD concepts
Launch of products in multiple markets
Submissions under QbD are often
• replaced by “enhanced traditional approach” or
• complemented with “traditional” submissions/validation
Confidential Hovione © 2014
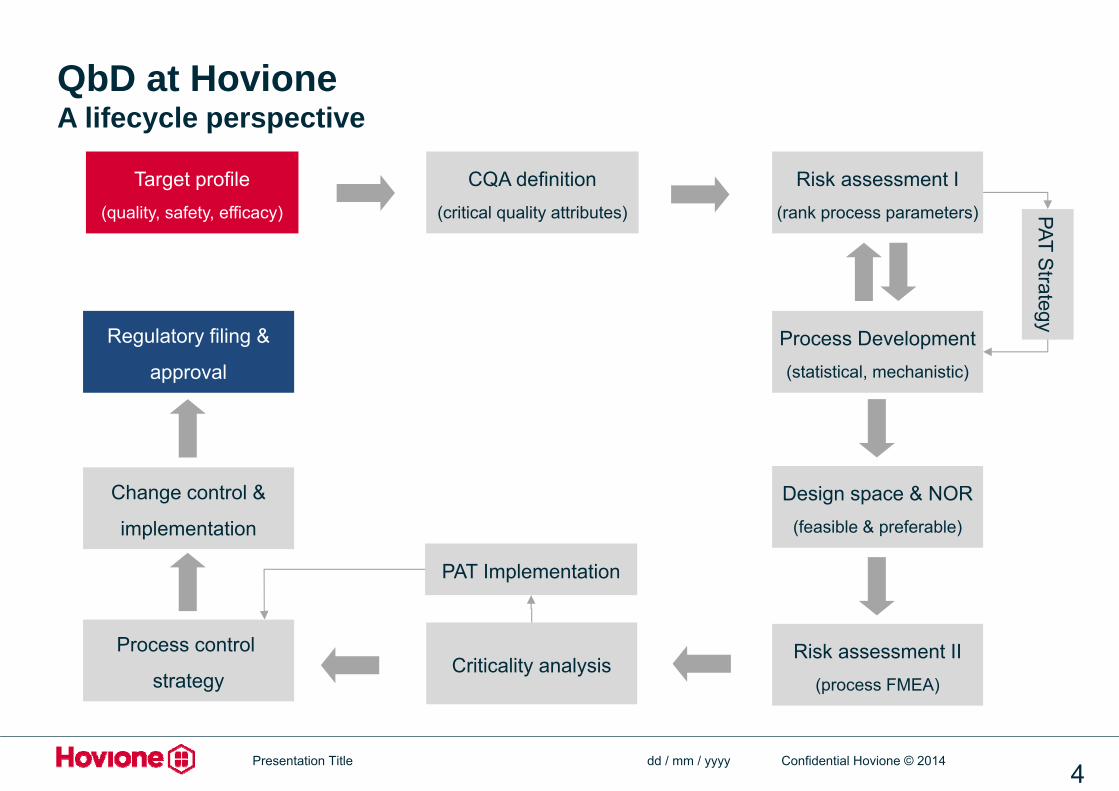
QbD at HovioneA lifecycle perspective
dd / mm / yyyyPresentation Title4
Target profile(quality, safety, efficacy)
CQA definition(critical quality attributes)
Risk assessment I(rank process parameters)
Process Development(statistical, mechanistic)
PAT Strategy
Design space & NOR(feasible & preferable)
Risk assessment II(process FMEA)
Criticality analysisProcess control
strategy
Change control &
implementation
Regulatory filing &
approval
PAT Implementation
Confidential Hovione © 2014
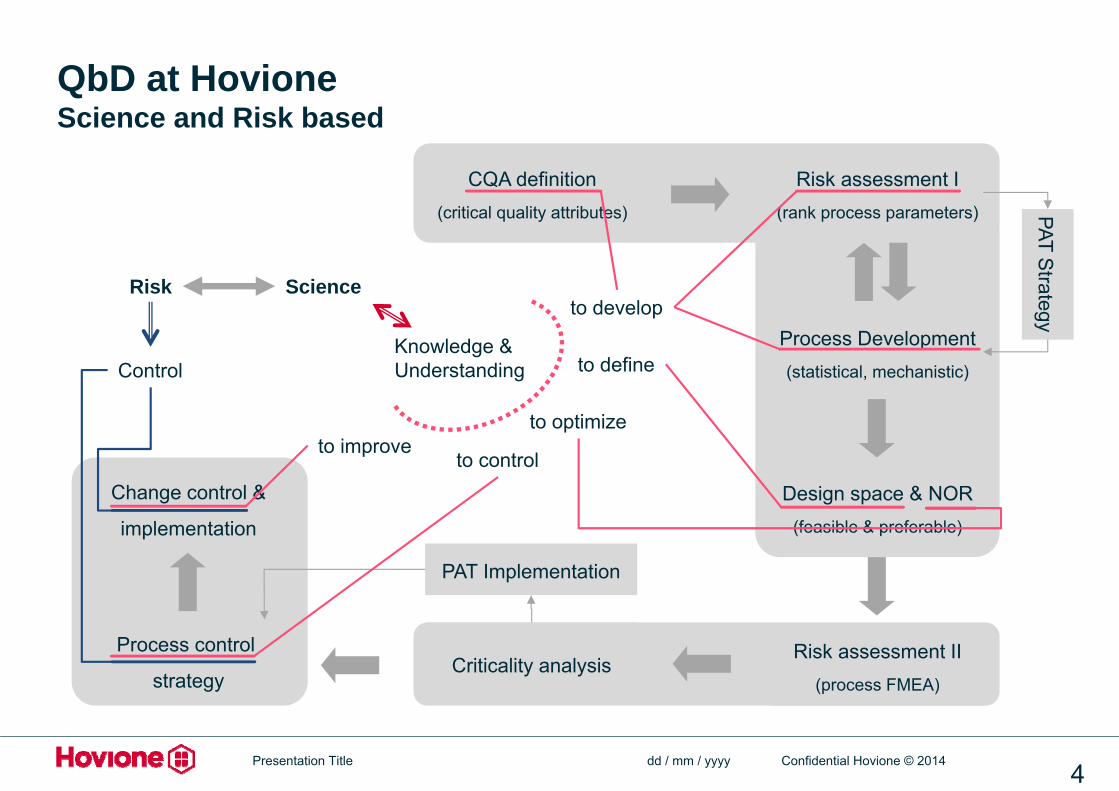
QbD at HovioneScience and Risk based
dd / mm / yyyyPresentation Title4
CQA definition(critical quality attributes)
Risk assessment I(rank process parameters)
Process Development(statistical, mechanistic)
PAT Strategy
Design space & NOR(feasible & preferable)
Risk assessment II(process FMEA)
Criticality analysisProcess control
strategy
Change control &
implementation
PAT Implementation
Science
Knowledge &Understanding
to develop
to define
to optimize
to controlto improve
Risk
Control

Confidential Hovione © 2014
Know
ledge
Time
QbD at HovioneKnowledge Management
dd / mm / yyyyPresentation Title4
Previous knowledgeFamiliarization studies
Staff experience
Continuous improvementDevelopment activities
Development Commercial Manufacturing
Knowledge Transfer
AcrossProcesses
(transversal)
Acrosslifecycle
Confidential Hovione © 2014
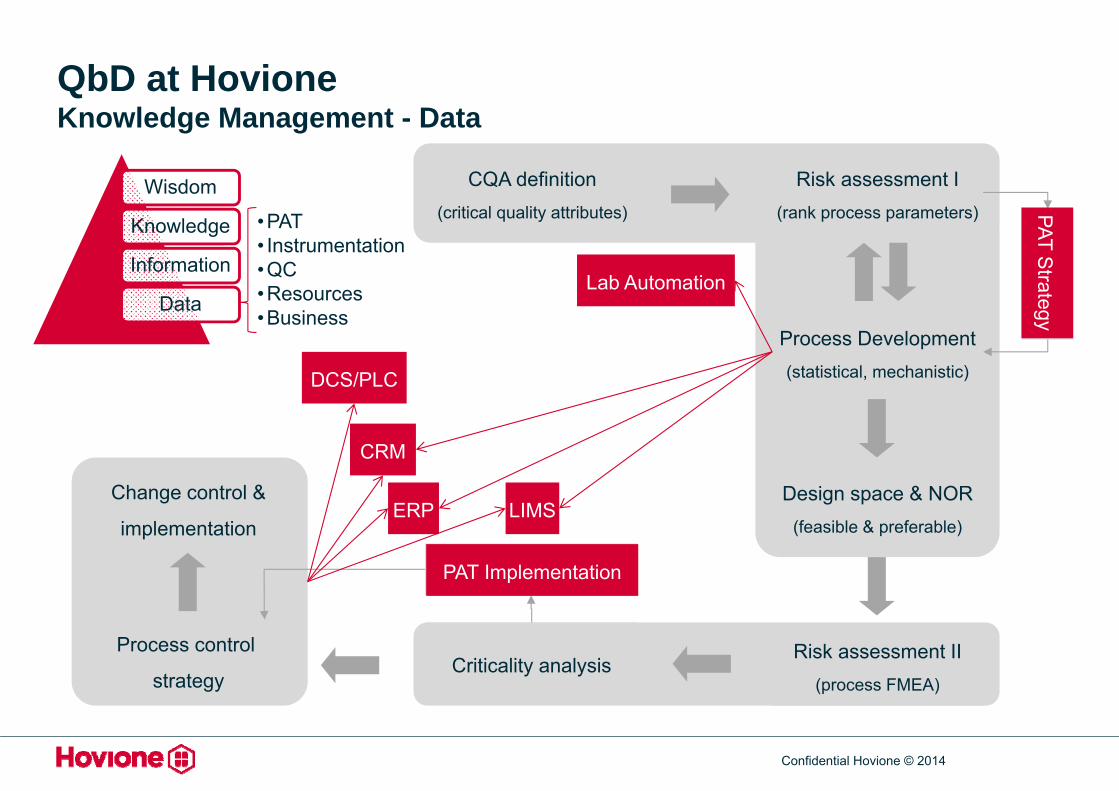
QbD at HovioneKnowledge Management - Data
CQA definition(critical quality attributes)
Risk assessment I(rank process parameters)
Process Development(statistical, mechanistic)
PAT Strategy
Design space & NOR(feasible & preferable)
Risk assessment II(process FMEA)
Criticality analysisProcess control
strategy
Change control &
implementation
PAT Implementation
Wisdom
Knowledge
Information
Data
•PAT• Instrumentation•QC•Resources•Business
PAT Strategy
PAT Implementation
LIMS
DCS/PLC
Lab Automation
ERP
CRM
Confidential Hovione © 2014
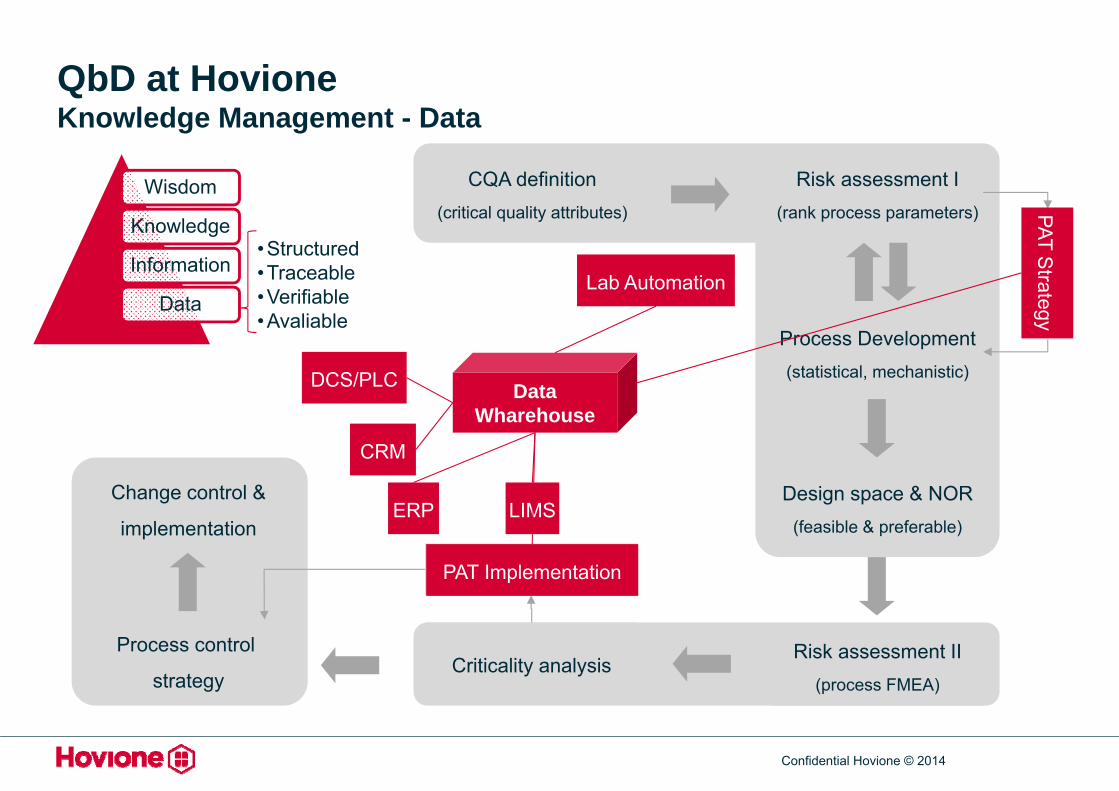
QbD at HovioneKnowledge Management - Data
CQA definition(critical quality attributes)
Risk assessment I(rank process parameters)
Process Development(statistical, mechanistic)
PAT Strategy
Design space & NOR(feasible & preferable)
Risk assessment II(process FMEA)
Criticality analysisProcess control
strategy
Change control &
implementation
PAT Implementation
PAT Strategy
PAT Implementation
LIMS
Lab Automation
ERP
Data Wharehouse
CRM
Wisdom
Knowledge
Information
Data
DCS/PLC
•Structured•Traceable•Verifiable•Avaliable
Confidential Hovione © 2014
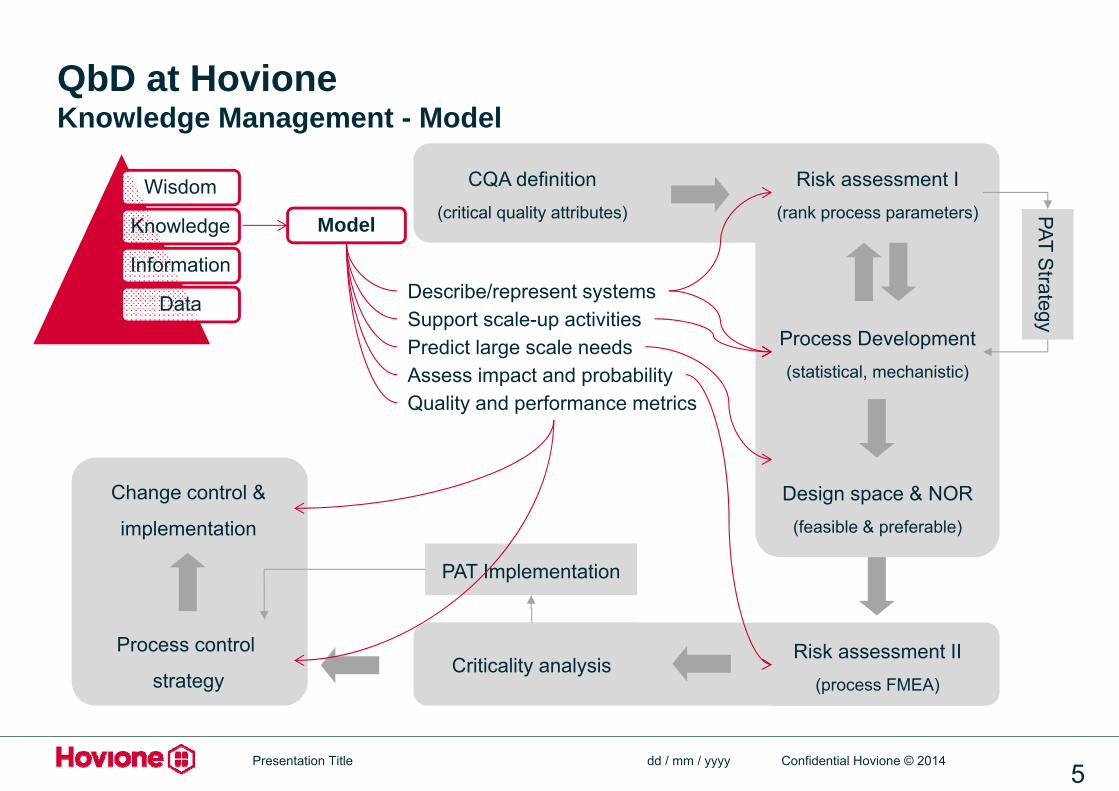
QbD at HovioneKnowledge Management - Model
dd / mm / yyyyPresentation Title5
CQA definition(critical quality attributes)
Risk assessment I(rank process parameters)
Process Development(statistical, mechanistic)
PAT Strategy
Design space & NOR(feasible & preferable)
Risk assessment II(process FMEA)
Criticality analysisProcess control
strategy
Change control &
implementation
PAT Implementation
Wisdom
Knowledge
Information
Data
Model
Describe/represent systemsSupport scale-up activitiesPredict large scale needsAssess impact and probabilityQuality and performance metrics
Confidential Hovione © 2014
• Stronger science & process understanding
What changes did QbD bring to Hovione?
• Structured approach to process development and continuous improvement
• New metrics to manufacturing: process robustness, RPN
• State-of-the-art risk evaluation and mitigation tools
• Leaner development through effective knowledge management
• Higher state of control => less failures
Confidential Hovione © 2014
Case-study: Traditional vs. Quality by DesignIntroduction
From our products portfolio, two processes were chosen for comparison
• Both spray drying processes at the same scale and equivalent equipment trains
• Both are commercial products with more than 70 batches produced
• One followed a traditional approach, the other a QbD based approach
Restrospective analysis to evaluate the following:
• Process performance
• Quality
• Continuous improvement
• Supply chain reliability
• Cost
Confidential Hovione © 2014
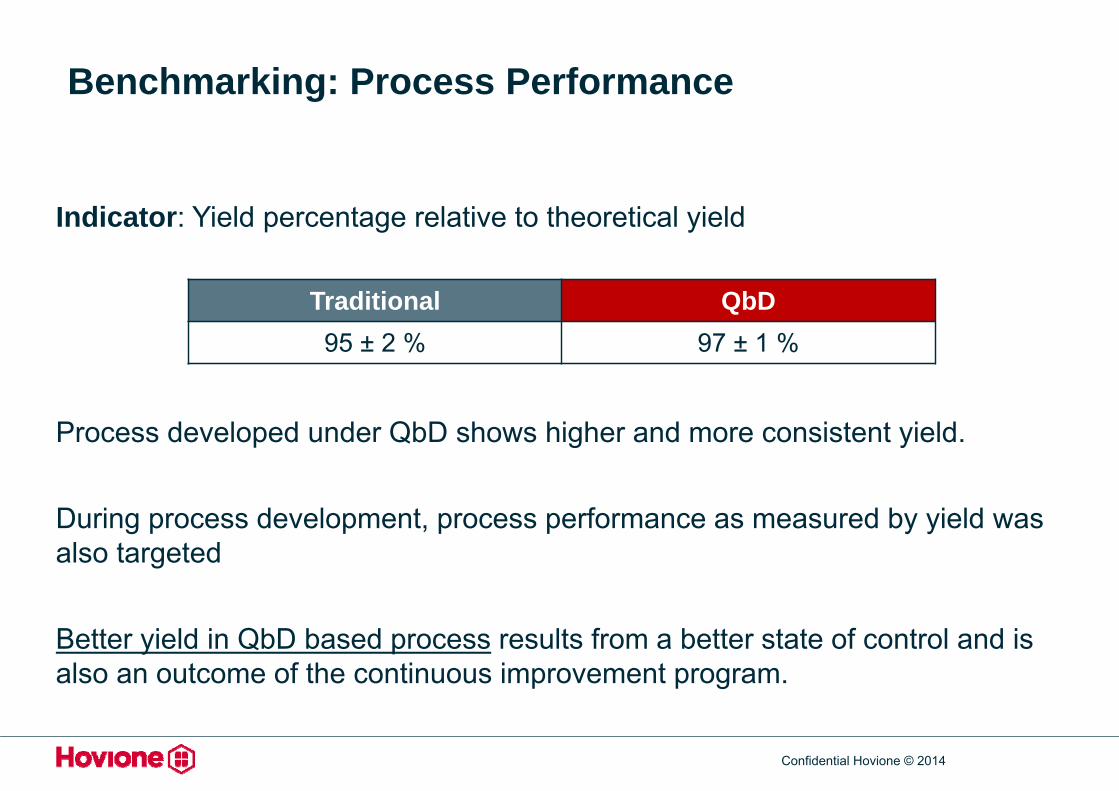
Benchmarking: Process Performance
Indicator: Yield percentage relative to theoretical yield
Process developed under QbD shows higher and more consistent yield.
During process development, process performance as measured by yield was also targeted
Better yield in QbD based process results from a better state of control and is also an outcome of the continuous improvement program.
Traditional QbD95 ± 2 % 97 ± 1 %
Confidential Hovione © 2014
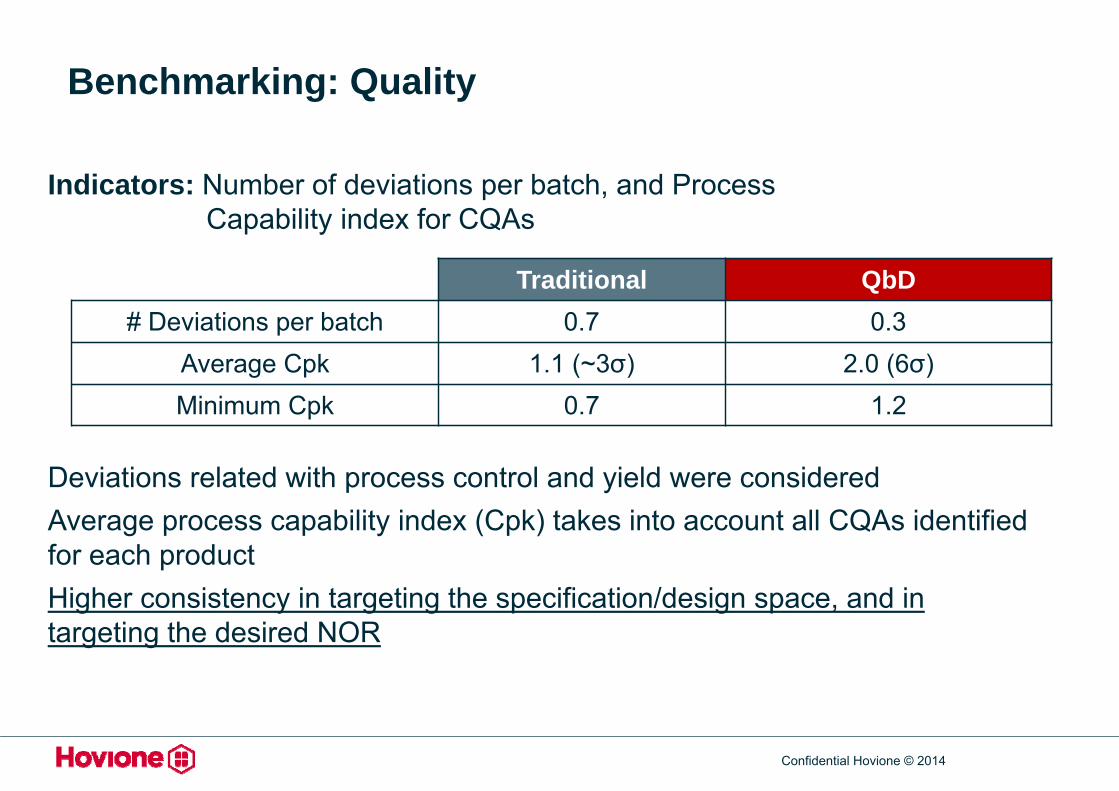
Benchmarking: Quality
Indicators: Number of deviations per batch, and Process Capability index for CQAs
Deviations related with process control and yield were consideredAverage process capability index (Cpk) takes into account all CQAs identified for each productHigher consistency in targeting the specification/design space, and in targeting the desired NOR
Traditional QbD# Deviations per batch 0.7 0.3
Average Cpk 1.1 (~3σ) 2.0 (6σ)Minimum Cpk 0.7 1.2
Confidential Hovione © 2014
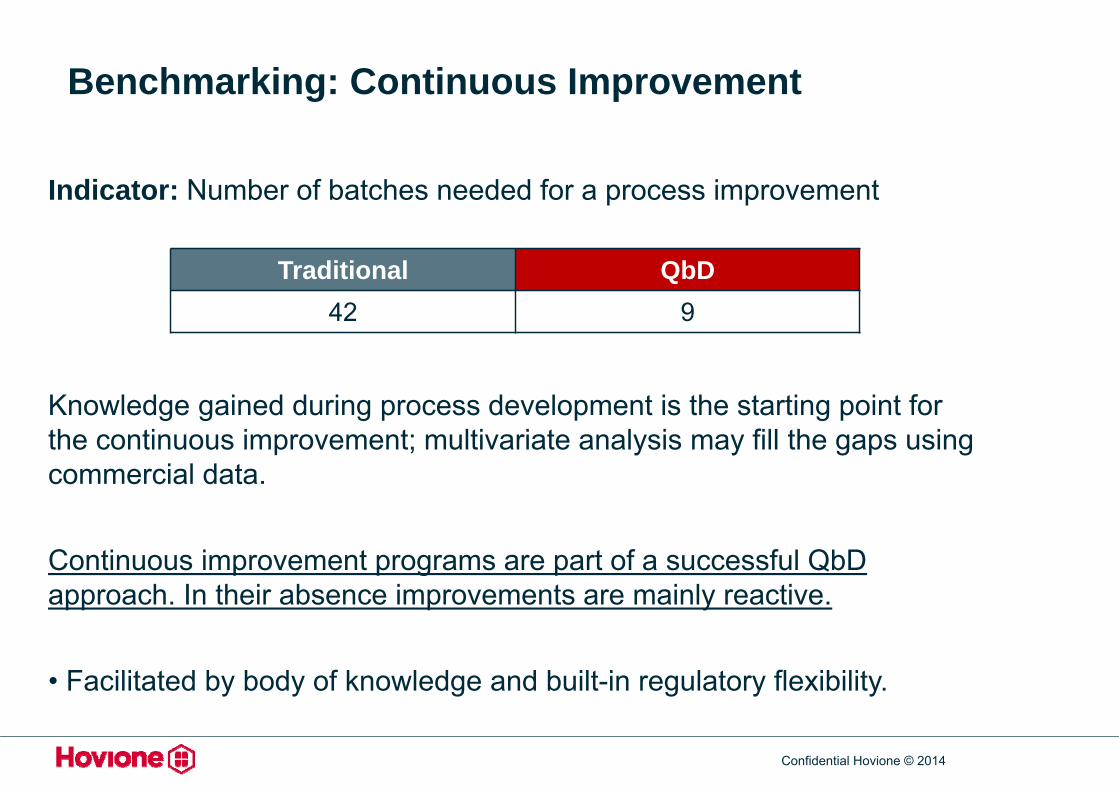
Benchmarking: Continuous Improvement
Indicator: Number of batches needed for a process improvement
Knowledge gained during process development is the starting point for the continuous improvement; multivariate analysis may fill the gaps using commercial data.
Continuous improvement programs are part of a successful QbDapproach. In their absence improvements are mainly reactive.
• Facilitated by body of knowledge and built-in regulatory flexibility.
Traditional QbD42 9
Confidential Hovione © 2014
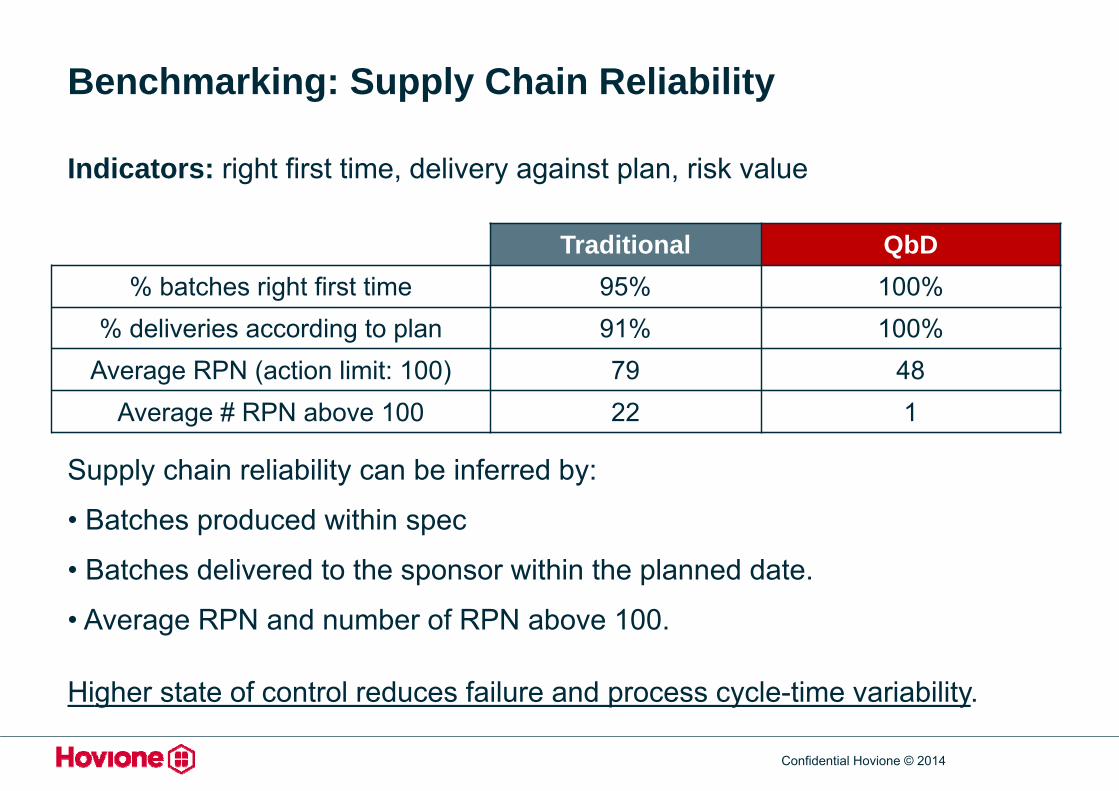
Benchmarking: Supply Chain Reliability
Indicators: right first time, delivery against plan, risk value
Supply chain reliability can be inferred by:
• Batches produced within spec
• Batches delivered to the sponsor within the planned date.
• Average RPN and number of RPN above 100.
Higher state of control reduces failure and process cycle-time variability.
Traditional QbD% batches right first time 95% 100%
% deliveries according to plan 91% 100%Average RPN (action limit: 100) 79 48
Average # RPN above 100 22 1
Confidential Hovione © 2014
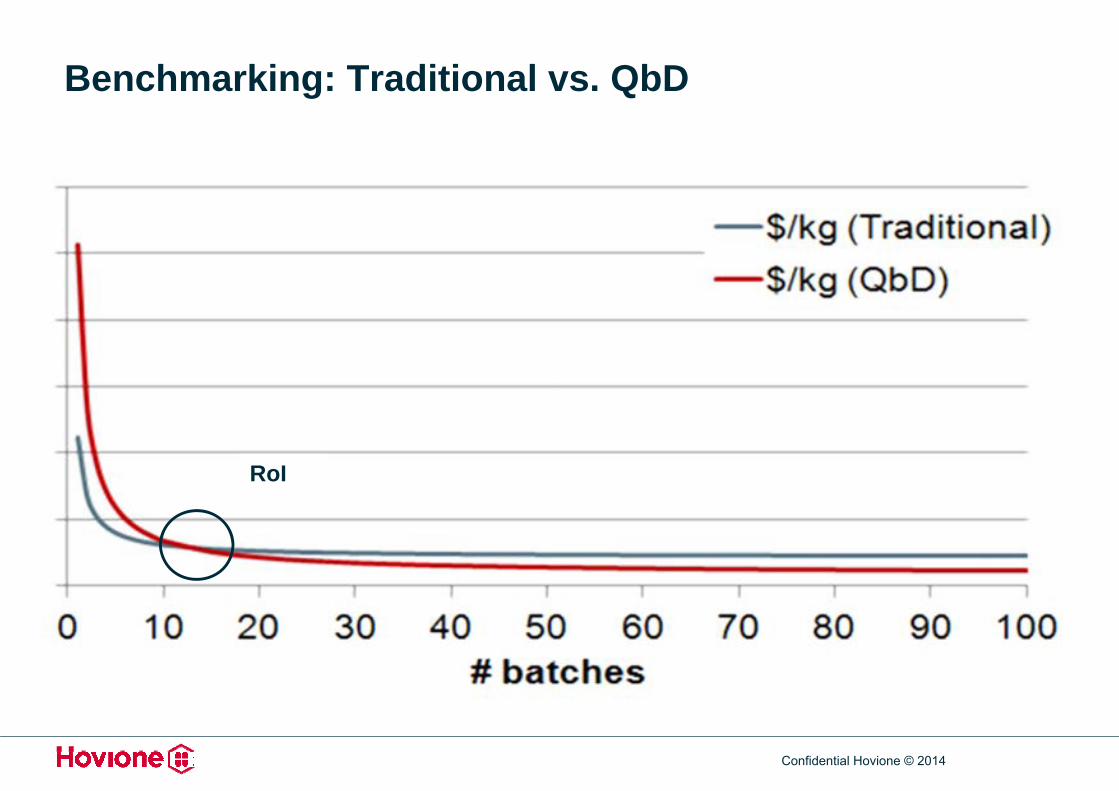
Two processes (> 70 commercial batches) were chosen for comparison:
Attribute Metric Traditional QbD
Performance Yield 95 ± 2 % 97 ± 1 %
Quality # deviation/batch 0.7 0.3
Min (average) Cpk 1.1 (~3σ) 2.0 (6σ)
Cont. improvement # batches/process change 42 9
Supply chain reliability # RPN above 100 22 1
Benchmarking: Traditional vs. QbD
RoI
Confidential Hovione © 2014
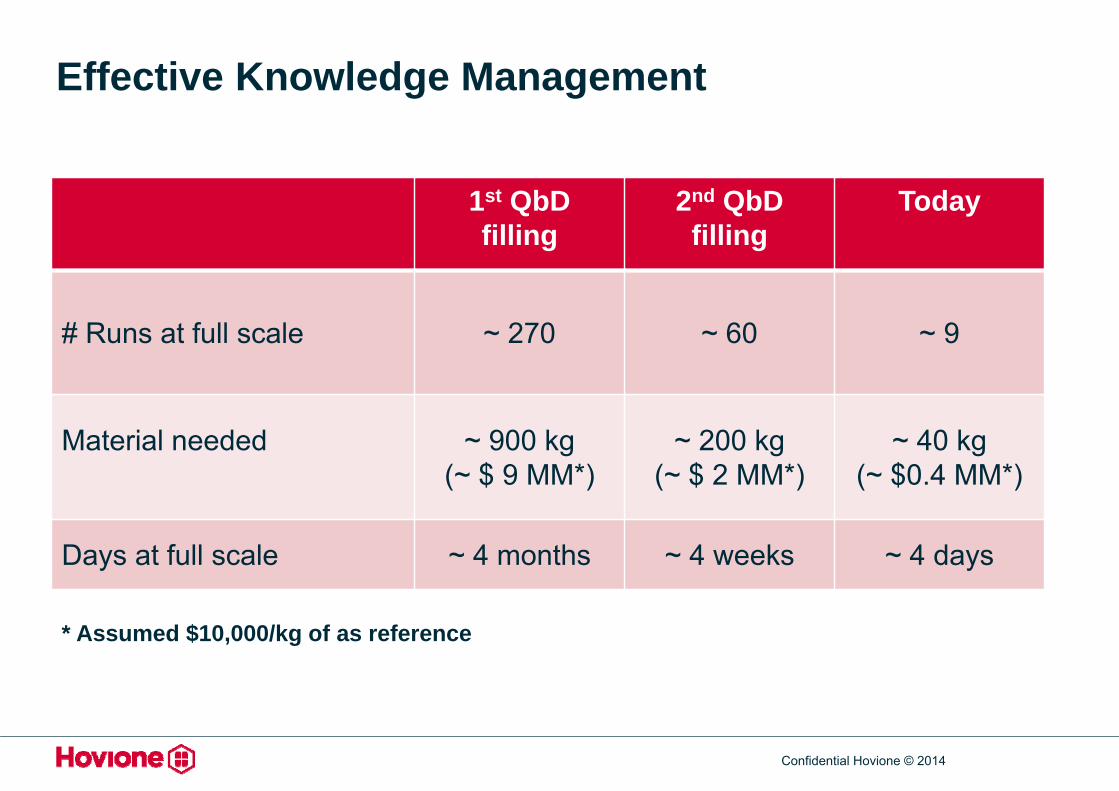
Effective Knowledge Management
1st QbDfilling
2nd QbDfilling
Today
# Runs at full scale ~ 270 ~ 60 ~ 9
Material needed ~ 900 kg(~ $ 9 MM*)
~ 200 kg(~ $ 2 MM*)
~ 40 kg(~ $0.4 MM*)
Days at full scale ~ 4 months ~ 4 weeks ~ 4 days
* Assumed $10,000/kg of as reference