best execution in fixed income - the ice · best execution in fixed income: ... markit, and...
TRANSCRIPT
Best Execution in Fixed Income: A Work in Progress
Comprehensive regulatory mandates in the US and Europe are driving a paradigm shift in the traditional
dynamic between pricing and best execution in over-the-counter fixed income markets. Increased pre-
and post-trade transparency requirements and a proliferation of execution protocols and venues are
beginning to outpace the ability of participants in the global bond market. More firms are eager to see
new third-party tools that can augment their ability to independently benchmark execution performance
as the fiduciary responsibilities of buy-side firms require a reevaluation of traditional market data
analysis and price discovery. As the complexity of the market grows, and compliance surveillance
burdens compound, fixed income transaction cost analysis tools will be essential for buy-side participants
to validate investment decisions throughout the lifecycle of a trade.
Data firms such as ICE Data Services (formerly Interactive Data Corporation), Markit, and Bloomberg
are building new TCA capabilities once thought unattainable for the opaque global OTC fixed income
market. There are, however, roadblocks to wholesale acceptance of these solutions. The extent to which
these third-party tools are able to integrate into existing buy-side workflows – and the methodology
upon which the TCA benchmarking tools are built – are the key hurdles to wider adoption.
Anthony Perrotta, Jr. &
Colby Jenkins
V14:045
July 2016 www.tabbgroup.com
Best Execution in Fixed Income: A Work in Progress | July 2016
2016 The TABB Group, LLC. All Rights Reserved. May not be reproduced by any means without express permission | 2
Introduction
“Mathematics is the music of reason.” – James Joseph Sylvester
The legislatively-driven shift in fixed income in the wake of the 2008 financial crisis requires
a reevaluation of long-standing execution standards. The proliferation of real-time trade data
and regulatory initiatives driving the fixed income marketplace to new levels of transparency
is the starting point in a race to a new definition of best execution. However, for credit market
participants, many roadblocks remain. Pricing is central to the problem.
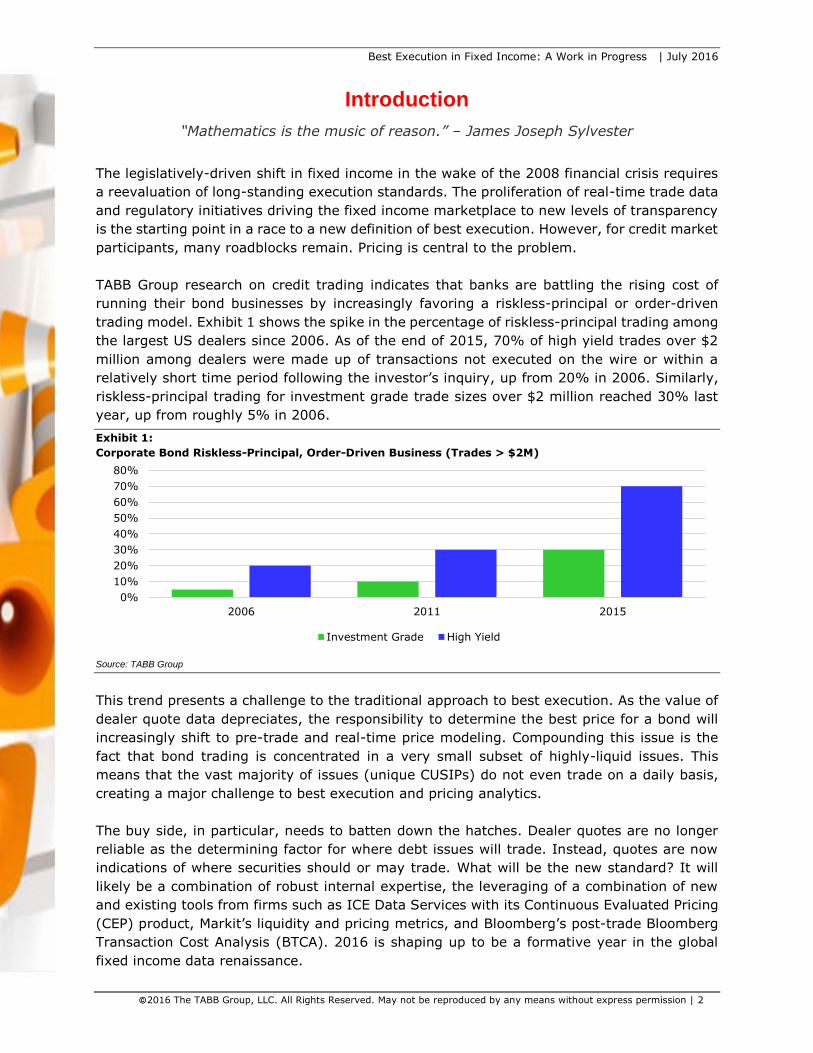
TABB Group research on credit trading indicates that banks are battling the rising cost of
running their bond businesses by increasingly favoring a riskless-principal or order-driven
trading model. Exhibit 1 shows the spike in the percentage of riskless-principal trading among
the largest US dealers since 2006. As of the end of 2015, 70% of high yield trades over $2
million among dealers were made up of transactions not executed on the wire or within a
relatively short time period following the investor’s inquiry, up from 20% in 2006. Similarly,
riskless-principal trading for investment grade trade sizes over $2 million reached 30% last
year, up from roughly 5% in 2006.
Exhibit 1:
Corporate Bond Riskless-Principal, Order-Driven Business (Trades > $2M)
Source: TABB Group
This trend presents a challenge to the traditional approach to best execution. As the value of
dealer quote data depreciates, the responsibility to determine the best price for a bond will
increasingly shift to pre-trade and real-time price modeling. Compounding this issue is the
fact that bond trading is concentrated in a very small subset of highly-liquid issues. This
means that the vast majority of issues (unique CUSIPs) do not even trade on a daily basis,
creating a major challenge to best execution and pricing analytics.
The buy side, in particular, needs to batten down the hatches. Dealer quotes are no longer
reliable as the determining factor for where debt issues will trade. Instead, quotes are now
indications of where securities should or may trade. What will be the new standard? It will
likely be a combination of robust internal expertise, the leveraging of a combination of new
and existing tools from firms such as ICE Data Services with its Continuous Evaluated Pricing
(CEP) product, Markit’s liquidity and pricing metrics, and Bloomberg’s post-trade Bloomberg
Transaction Cost Analysis (BTCA). 2016 is shaping up to be a formative year in the global
fixed income data renaissance.
0%
10%
20%
30%
40%
50%
60%
70%
80%
2006 2011 2015
Investment Grade High Yield

Best Execution in Fixed Income: A Work in Progress | July 2016
2016 The TABB Group, LLC. All Rights Reserved. May not be reproduced by any means without express permission | 3
The Driving Force
The global bond market is due for a revolution in the interaction between pricing and best
execution as regulatory mandates and the development of trading protocols evolve beyond
the ability of fixed income market participants to independently benchmark execution
performance. Other asset classes (either by association or legislation) are leading the way
and fiduciary responsibilities of the buy side require a more sophisticated approach to data
and pricing. The fact that regulators on both sides of the Atlantic have already given guidance
and updated rules means that this revolution is well under way.
In the US, investors have historically relied on dealer quotes (through request-for-quotes, or
“RFQ”s) to assess price discovery and satisfy internal compliance. A survey of 93 buy-side
traders by TABB Group in late 2015 found that the overwhelming majority still rely on the
Financial Industry Regulatory Authority’s Trade Reporting and Compliance Engine (TRACE) as
an additional post-fact data source for assessing and benchmarking execution. TRACE data
was second only to internal “investment team expertise” as a means of assessing liquidity
risk. This culture of complacence will have to change as regulators update and enhance the
required standard, and internal processes are changed in line with the mode of trading.
Exhibit 2:
TABB Group Buy-side Survey Results (2015)
How do you measure liquidity risk? How useful are the following liquidity metrics?
Source: TABB Group
Before the differences in various regulatory definitions – and whether they can be used as a
working baseline for firms today – can be explained, the issue needs to be defined. The latest
guidance from FINRA on bond market best execution (published in December 2015) is a case
in point. As we have long argued, fundamental changes in cash fixed income market dynamics
require consequent changes in compliance workflow – as what is needed clashes with what is
possible. Nowhere is this more apparent than in the corporate bond world where the
Best Execution in Fixed Income: A Work in Progress | July 2016
2016 The TABB Group, LLC. All Rights Reserved. May not be reproduced by any means without express permission | 4
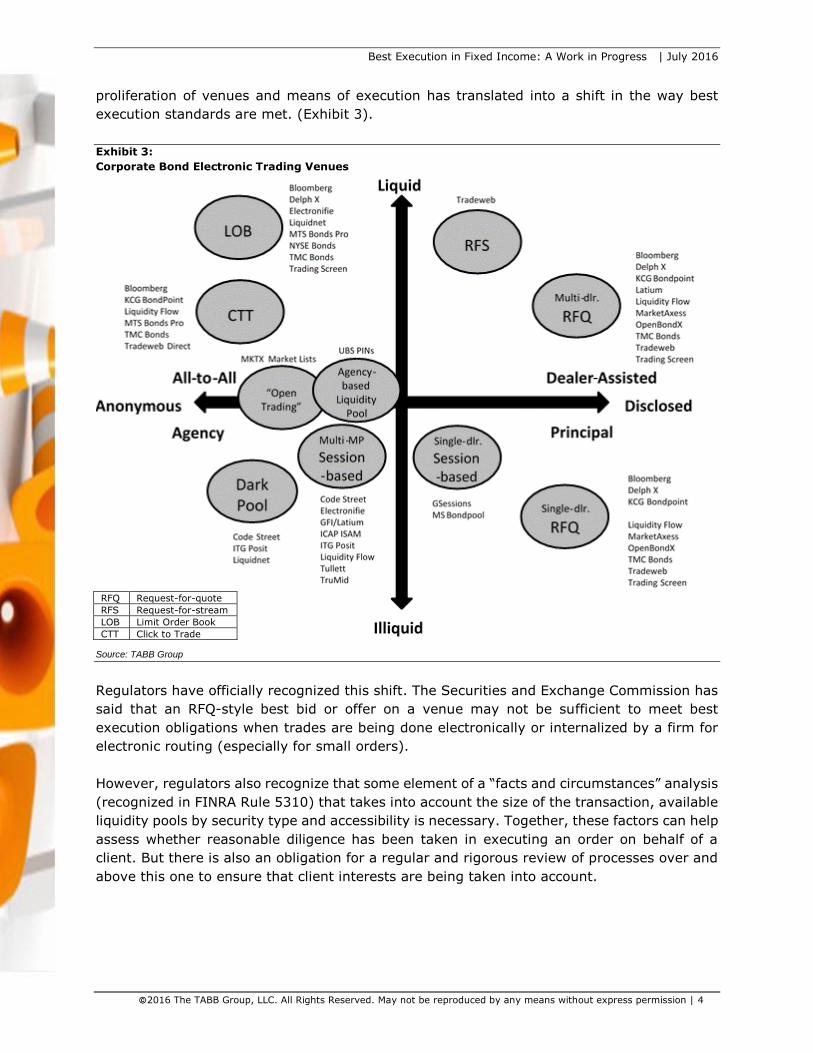
proliferation of venues and means of execution has translated into a shift in the way best
execution standards are met. (Exhibit 3).
Exhibit 3:
Corporate Bond Electronic Trading Venues
Source: TABB Group
Regulators have officially recognized this shift. The Securities and Exchange Commission has
said that an RFQ-style best bid or offer on a venue may not be sufficient to meet best
execution obligations when trades are being done electronically or internalized by a firm for
electronic routing (especially for small orders).
However, regulators also recognize that some element of a “facts and circumstances” analysis
(recognized in FINRA Rule 5310) that takes into account the size of the transaction, available
liquidity pools by security type and accessibility is necessary. Together, these factors can help
assess whether reasonable diligence has been taken in executing an order on behalf of a
client. But there is also an obligation for a regular and rigorous review of processes over and
above this one to ensure that client interests are being taken into account.
RFQ Request-for-quote
RFS Request-for-stream
LOB Limit Order Book
CTT Click to Trade

Best Execution in Fixed Income: A Work in Progress | July 2016
2016 The TABB Group, LLC. All Rights Reserved. May not be reproduced by any means without express permission | 5
Electric Shocks/Evolution of Pricing
Despite the gradual emergence of this more complicated and higher best execution standard,
asset managers that hold the majority of the inventory are increasingly interested in using
more varied trading protocols on electronic venues and dark pools. For example, Liquidnet’s
fixed income dark pool (which electronically matches bids and offers over $500 million in both
investment grade and high yield markets) achieved daily liquidity of over $7 billion in March.
This type of liquidity is still a small portion of the overall buy-side inquiry flow, but even at
this size, traders must independently verify and assess the performance of their execution
choices. In fact, it is incumbent on them to do so beyond the regulatory minimum – even as
trade sizes decrease and electronic trading (whether by traditional or new means) proliferate
(Exhibit 4).
Exhibit 4:
TRACE Trade Size Percent Change 2008 – 2015, High Yield & Investment Grade Corporate Bonds
Investment Grade High Yield
Source: TABB Group, TRACE
-15.0%
-10.0%
-5.0%
0.0%
5.0%
10.0%
15.0%
>=
25,000,000
>=
1,000,000
and <25,000,000
>=
100,000 and
< 1,000,000
< 100,000 -15.0%
-10.0%
-5.0%
0.0%
5.0%
10.0%
15.0%
>=
25,000,000
>=
1,000,000 and
< 25,000,000
>=
100,000 and <
1,000,000
< 100,000
Best Execution in Fixed Income: A Work in Progress | July 2016
2016 The TABB Group, LLC. All Rights Reserved. May not be reproduced by any means without express permission | 6
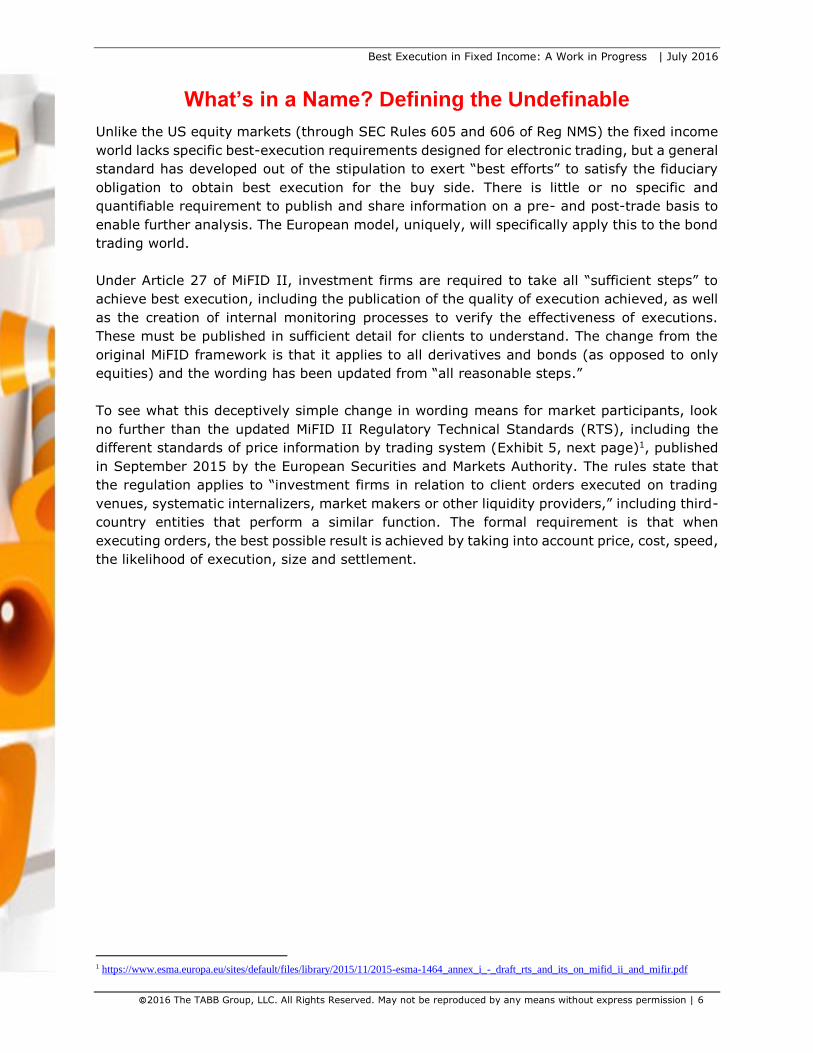
What’s in a Name? Defining the Undefinable
Unlike the US equity markets (through SEC Rules 605 and 606 of Reg NMS) the fixed income
world lacks specific best-execution requirements designed for electronic trading, but a general
standard has developed out of the stipulation to exert “best efforts” to satisfy the fiduciary
obligation to obtain best execution for the buy side. There is little or no specific and
quantifiable requirement to publish and share information on a pre- and post-trade basis to
enable further analysis. The European model, uniquely, will specifically apply this to the bond
trading world.
Under Article 27 of MiFID II, investment firms are required to take all “sufficient steps” to
achieve best execution, including the publication of the quality of execution achieved, as well
as the creation of internal monitoring processes to verify the effectiveness of executions.
These must be published in sufficient detail for clients to understand. The change from the
original MiFID framework is that it applies to all derivatives and bonds (as opposed to only
equities) and the wording has been updated from “all reasonable steps.”
To see what this deceptively simple change in wording means for market participants, look
no further than the updated MiFID II Regulatory Technical Standards (RTS), including the
different standards of price information by trading system (Exhibit 5, next page)1, published
in September 2015 by the European Securities and Markets Authority. The rules state that
the regulation applies to “investment firms in relation to client orders executed on trading
venues, systematic internalizers, market makers or other liquidity providers,” including third-
country entities that perform a similar function. The formal requirement is that when
executing orders, the best possible result is achieved by taking into account price, cost, speed,
the likelihood of execution, size and settlement.
1 https://www.esma.europa.eu/sites/default/files/library/2015/11/2015-esma-1464_annex_i_-_draft_rts_and_its_on_mifid_ii_and_mifir.pdf

Best Execution in Fixed Income: A Work in Progress | July 2016
2016 The TABB Group, LLC. All Rights Reserved. May not be reproduced by any means without express permission | 7
Exhibit 5:
Information to be made public in accordance with Article 2 ESMA
Type of
system Description of system Information to be made public
Continuous
auction
order book
trading
system
A system that by means of an order book and a
trading algorithm operated without human
intervention matches sell orders with buy orders on
the basis of the best available price on a continuous
basis.
For each financial instrument, the aggregate number of orders and the volume
they represent at each price level, for at least the five best bid and offer price
levels.
Quote-
driven
trading
system
A system in which transactions are concluded on the
basis of firm quotes that are continuously made
available to participants, which requires market
makers to maintain quotes in a size that balances
the needs of members and participants to deal in a
commercial size, and the risk to which the market
maker exposes itself.
For each financial instrument, the best bid and offer by price of each market
maker in that instrument, together with the volumes attached to those prices.
The quotes made public shall be those that represent binding commitments
to buy and sell the financial instruments and that indicate the price and
volume of financial instruments in which the registered market makers are
prepared to buy or sell. In exceptional market conditions, however, indicative
or one-way prices may be allowed for a limited time.
Periodic
auction
trading
system
A system that matches orders on the basis of a
periodic auction and a trading algorithm operated
without human intervention.
For each financial instrument, the price at which the auction trading system
would best satisfy its trading algorithm and the volume that would potentially
be executable at that price by participants in that system.
Request-
for-quote
trading
system
A trading system in which a quote or quotes are
provided in response to a request for a quote
submitted by one or more other members or
participants. The quote is executable exclusively by
the requesting member or market participant. The
requesting member or participant may conclude a
transaction by accepting the quote or quotes
provided to it on request.
The quotes and the attached volumes from any member or participant which,
if accepted, would lead to a transaction under the system’s rules. All
submitted quotes in response to a request for quote may be published at the
same time but not later than when they become executable.
Voice
trading
system
A trading system in which transactions between
members are arranged through voice negotiation.
The bids and offers and the attached volumes from any member or participant
which, if accepted, would lead to a transaction under the system’s rules.
Trading
system not
covered by
first 5
rows
A hybrid system falling into two or more of the first
five categories or a system in which the price
determination process is of a different nature than
that applicable to the types of system covered by
first five categories.
Adequate information as to the level of orders or quotes and of trading
interest; in particular, the five best bid and offer price levels and/or two-way
quotes of each market maker in the instrument, if the characteristics of the
price discovery mechanism so permit.
Source: TABB Group, ESMA
So, while the framework is very similar to the US, the reality of the European top-down
approach means that, in addition to annual best execution reports that rank brokers, the
requirement for price treatment in the bond world depends on dynamic liquidity thresholds
that leave a significant threat of “false positives” on specific instruments. The initial threshold
amounts are detailed in Exhibit 6, although they are currently up for debate. Still, even a
cursory analysis shows that large areas of the bond world could be categorized as liquid and
therefore within the scope of the rules set out in Exhibit 5.
On May 2, ESMA published two opinions about the draft regulatory standards. With respect
to draft RTS 2, the opinions call for a gradual phase-in approach to assessing bond liquidity
and thresholds detailed in Exhibit 6 over a four-year period. The opinions propose a declining
schedule of 15, 10, 7 and the (original) 2 daily trades over year one through four, respectively,
for the liquidity assessment of bond. The opinions also propose that the initial liquidity
determination for newly issued corporate bonds be amended. Under the newly- proposed
framework, the initial liquidity status determination of corporate bonds and covered bonds
Best Execution in Fixed Income: A Work in Progress | July 2016
2016 The TABB Group, LLC. All Rights Reserved. May not be reproduced by any means without express permission | 8
will be based on issuance size of EUR 1 billion until Dec. 31 2019 and after that, the applicable
issuance size will be cut in half to the originally proposed EUR 500 billion.
In the derivatives world, an additional burden of fairness in the pricing of instruments exists,
but again, there is a huge difference in the treatment of data by venue type. Multilateral
trading facilities (MTFs) were originally created for the equity markets as specialised venues
for matching client orders. For structured products and credit and interest rate swaps, it was
deemed necessary to create a new venue designation that allows discretionary – rather than
non-discretionary – trading protocols and behavior among participants. For example, in
contracts traded via voice or interdealer brokers, it can be necessary to retract, partially fill
or suggest alternative bids or offers to clients to help match them.
These activities are not allowed under MTF rules, which are based on traditional crossing
networks (platforms). While regulated markets can operate MTFs, licensed financial
institutions cannot operate an Organized Trading Facility (OTF) within the same legal entity
under which it operates proprietary activity. The latter (defined as executing trades on a
financial institution’s own balance sheet) requires registration as a systematic internalizer. In
all cases, different information standards require some form of data aggregation and analysis.
In the bond world, since most traders send out runs anyway, the amount of pre-trade data
available is substantial. Nonetheless, the required messaging fields, real-time price analysis,
or after-the-fact review of available necessary trading decisions are just not possible in the
traditional workflow. The information may not be uniform and the parameters may vary
hugely by firm. While this shortfall has led some third-party providers, such as the FIX Trading
Community, to seek to define a standardized and fungible architecture for trade reporting and
compliance certainty, the majority of issues come up at the pricing and execution level.

Best Execution in Fixed Income: A Work in Progress | July 2016
2016 The TABB Group, LLC. All Rights Reserved. May not be reproduced by any means without express permission | 9
Third-Party Best-Ex
Various companies have been building out best-execution solutions for market participants
over the past several years. Unlike equity markets, where participants can rely on order-
driven data, the majority of bonds trade far too infrequently to create an equity-like execution
benchmark. The murky waters of bond pricing are central to the credit market’s best-ex
conundrum. Exhibit 6 shows the infrequent nature of credit trading. In a sample of the 15,444
bonds that traded across both high yield and investment grade markets during January 2016,
only roughly 13% traded once and roughly 20% traded two to three times. Using the same
sample, just over 12% of bonds traded every day during the 19-day period.
Exhibit 6:
US IG & HY ‘Days Traded’ (January 2016)
Source: TABB Group, ICE Data Services
The challenge for solution providers is to make clients comfortable with the approach they
are taking in establishing a benchmark baseline for bond pricing. This challenge will be
compounded when solutions need to be applicable across the board for different securities,
depending on the client’s trading profile.
Companies such as ICE Data Services, Markit, and Bloomberg provide innovative approaches
to fixed income TCA analytics. ICE Data Services’ Continuous Evaluated Pricing (CEP) solution
has been a uniquely innovative tool in transforming murky and sporadic credit trade data into
a workable benchmarking dataset.
Exhibit 7 demonstrates the extent to which the ICE Data Services CEP tracks historical prices.
The theory is straightforward: A narrow ‘spread’ between the average theoretical (CEP) price
and historical trades indicates reliability. Using the US IG 5- and 10-year bond as examples,
Exhibit 8 tests that and breaks down the average price difference between the CEP model
price and actual TRACE trades. The shaded areas represent 50% of the distribution plotted in
different trade size buckets, with the thick black lines representing the median value of the
difference.
25.7%
49.8%
63.3%
13.2%
31.2%
58.8%
70.9%
88.2%
10.0%
20.0%
30.0%
40.0%
50.0%
60.0%
70.0%
80.0%
90.0%
100.0%
1 2 3 4 5 6 7 8 9 10 11 12 13 14 15 16 17 18 19
% o
f Tota
l CU
SIP
s
Days Traded US High Yield US Investment Grade

Best Execution in Fixed Income: A Work in Progress | July 2016
2016 The TABB Group, LLC. All Rights Reserved. May not be reproduced by any means without express permission | 10
Exhibit 7:
Dealer Trade Distributions ICE Data Services Calculation, US IG 5- and 10-year
5-year Buy 5-year Sell
10-year Buy 10-year Sell
*Black line indicates median price
Source: TABB Group, ICE Data Services
Across trade sizes, from blocks to micro-lot trades, the median price difference is more
pronounced for the smallest buckets. There is a duality to this trend. While the quality of CEP
benchmark data could theoretically be at the root of the trend, the culprit is the inherent price
uncertainty for thinly traded securities trading at the small end of the trade size spectrum.
Exhibit 8 (next page) dives deeper into this trend and plots the difference between dealer buy
and dealer sell median prices by trade size for securities with liquidity scores ranging from 10
(most liquid) to 6 (least liquid). Each line per color palette represents a month for each
liquidity score series (January, February and March of 2016). For the most liquid securities
(blue, green and yellow) there is a consistently small markup of about 3/16th of a point to a
quarter point that gradually rises in spread as trade size buckets decrease. This trend
demonstrates that there is a month-to-month behavioral consistency to the pricing model
benchmark and is a testament to the robustness of the model since the reliability holds when
looking down the liquidity spectrum of securities.
Best Execution in Fixed Income: A Work in Progress | July 2016
2016 The TABB Group, LLC. All Rights Reserved. May not be reproduced by any means without express permission | 11
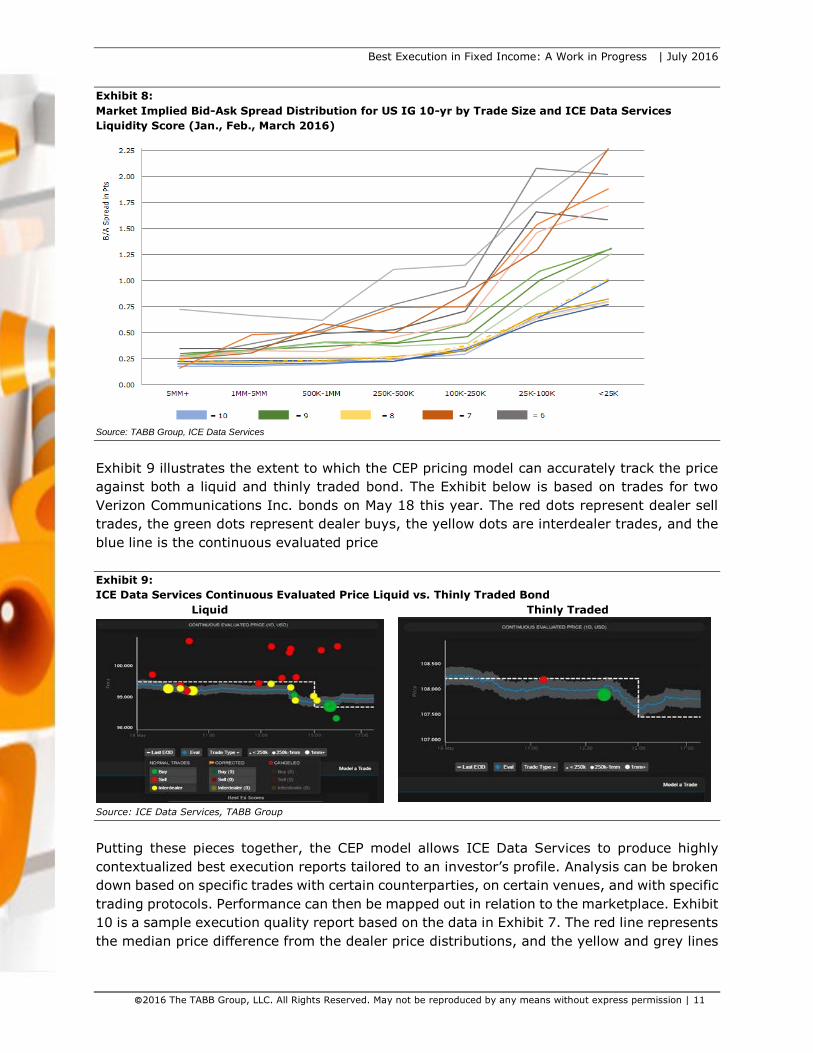
Exhibit 8:
Market Implied Bid-Ask Spread Distribution for US IG 10-yr by Trade Size and ICE Data Services
Liquidity Score (Jan., Feb., March 2016)
Source: TABB Group, ICE Data Services
Exhibit 9 illustrates the extent to which the CEP pricing model can accurately track the price
against both a liquid and thinly traded bond. The Exhibit below is based on trades for two
Verizon Communications Inc. bonds on May 18 this year. The red dots represent dealer sell
trades, the green dots represent dealer buys, the yellow dots are interdealer trades, and the
blue line is the continuous evaluated price
Exhibit 9:
ICE Data Services Continuous Evaluated Price Liquid vs. Thinly Traded Bond
Liquid Thinly Traded
Source: ICE Data Services, TABB Group
Putting these pieces together, the CEP model allows ICE Data Services to produce highly
contextualized best execution reports tailored to an investor’s profile. Analysis can be broken
down based on specific trades with certain counterparties, on certain venues, and with specific
trading protocols. Performance can then be mapped out in relation to the marketplace. Exhibit
10 is a sample execution quality report based on the data in Exhibit 7. The red line represents
the median price difference from the dealer price distributions, and the yellow and grey lines

Best Execution in Fixed Income: A Work in Progress | July 2016
2016 The TABB Group, LLC. All Rights Reserved. May not be reproduced by any means without express permission | 12
are tenth and fifth percentile thresholds, respectively. All of them can be built out of the CEP
modeling baseline.
This kind of analysis affords users the ability to put into place a variety of best execution
standards and safeguards such as being able to check whether any counterparties are
charging excessive markups or whether certain venues or protocols have had negative impact
on performance vs. the broader marketplace, set certain threshold execution standards, or
justify the price of a certain trade if a regulator or customer requests a deeper evaluation.
This type of analysis is beneficial for the buy side because it allows managers to evaluate
performance based on dealer counterparty.
Exhibit 10:
Execution Quality Sample Scanner, ICE Data Services
Source: TABB Group, ICE Data Services
Markit's fixed income TCA product has been running since early 2015, and similar to ICE Data
Services, leverages the firm's existing pricing service franchise as the core. The Markit fixed
income pricing service prices roughly 2.5 million US and European securities either hourly or
daily. The system utilizes quantitative algorithms developed by our team of analysts that are
designed with statistically valid inputs from a wide array of data sources for the security being
evaluated, its benchmark securities and other correlated instruments. Markit parses dealer
quote data from over 300 counterparties in real time throughout the trading day and also
consumes trade data from TRACE, the Municipal Securities Rulemaking Board (MSRB), iBoxx,
iTraxx, and Euroclear. New sources of data are constantly under evaluation. The resulting
evaluative pricing feed includes bid offer spreads, spreads to benchmark securities and over
250 other data fields.
Markit's current fixed income TCA offering is still an end-of-day system that provides
perspective on cost using near- and far-touch variance as well as time-weighted benchmarks.
Markit TCA's reports can also break down aggregate trades in terms of 'liquidity scores,' which,
like the ICE Data Services liquidity score and Bloomberg BVAL 'confidence index,' is a price
reliability indicator that follows a scale of 1 (most reliable/utilizes a range of data in the price)
to 5 (no underlying data).
Best Execution in Fixed Income: A Work in Progress | July 2016
2016 The TABB Group, LLC. All Rights Reserved. May not be reproduced by any means without express permission | 13
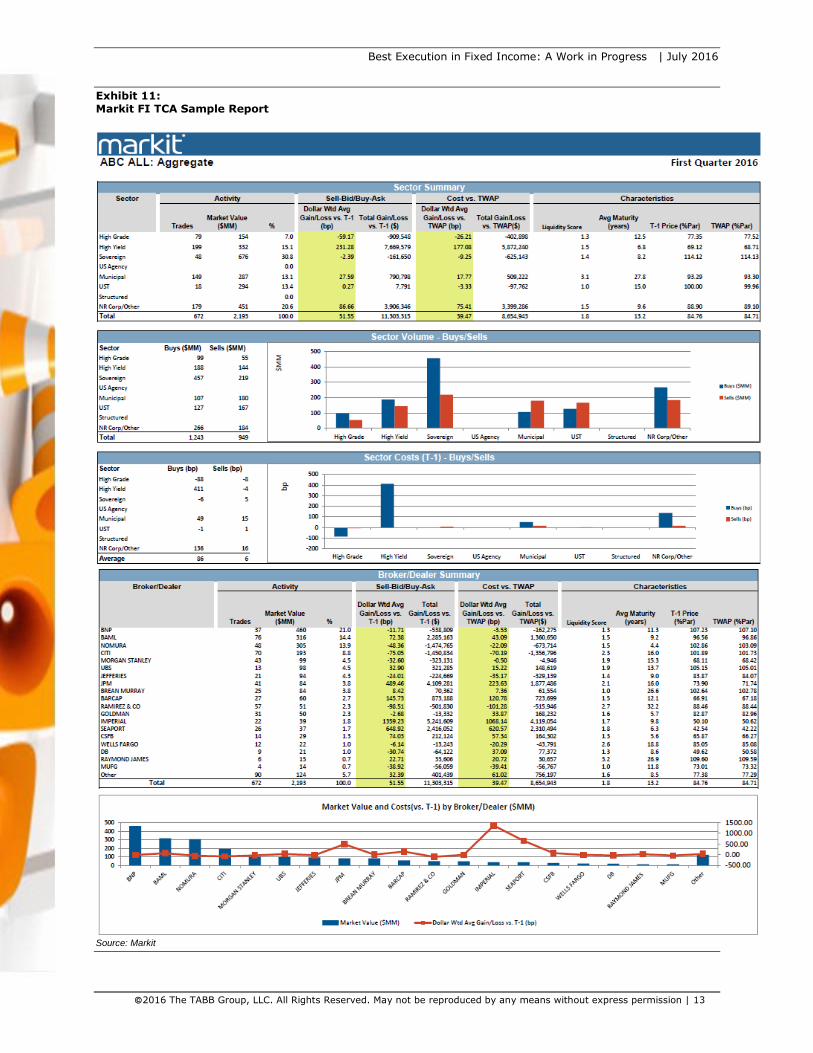
Exhibit 11: Markit FI TCA Sample Report
Source: Markit
Best Execution in Fixed Income: A Work in Progress | July 2016
2016 The TABB Group, LLC. All Rights Reserved. May not be reproduced by any means without express permission | 14
Exhibit 11 is a sample Markit quarterly TCA report that demonstrates the granularity of the
TCA analysis. Reports break down aggregate fixed income trades across asset classes in terms
of benchmark summaries, volume, costs and dealer cover.
The range of market-level statistics available within these reports is set to grow significantly
by the end of the year as the online GUI is set to launch during the third quarter of 2016. As
the online product ramps up, Markit's TCA product will evolve from principally an end-of-day
cost summary tool to one with intra-day statistics and contextual analysis to clients' flow.
Bloomberg’s BTCA is available to clients with a Bloomberg terminal. Transactional data can
be captured directly from Bloomberg platforms as well as external sources of trade data;
Bloomberg uses its internal central contributed data and evaluated pricings engine to calculate
performance benchmarks. Among the internal pricing sources offered are Bloomberg’s
Composite Bloomberg Bond Trader (CBBT), Bloomberg Benchmark (BMRK) and BVAL,
Bloomberg’s evaluated pricing source.
CBBT is a proxy for standardized tick stream data; it provides weighted bid-ask spread pricing
for bonds based on contributed indicative and firm pricing data from hundreds of dealers.
BMRK is a real-time price designed to provide pre-trade transparency to buy and sell-side
traders, including feeding into crossing networks, auto quoting engines, and algorithmic
strategies. Based on these data, BTCA is able to provide benchmarking information such as
arrival price methodology, near- and far-touch variance benchmark analysis, and a variety of
point-in-time benchmarks to decompose the entire order lifecycle. Results can be presented
trade-by-trade or in aggregate, for example by maturity band or order difficulty.
BTCA also relies on Bloomberg’s proprietary evaluated pricing engine. Bloomberg’s evaluated
pricing source, BVAL, provides bond pricing for liquid and thinly traded bonds alike, and also
assigns a score based on the dynamics of the data inputs, including the number of data points
and their proximity to the target security.
This index score is important for clients that have policies in place for checking any
independent pricing with respect to best execution obligations. These scores also allow users
of BTCA to take a more granular approach to best execution review and analysis than
aggregate flow analysis because it allows for its flow to be categorized and contextualized.
BTCA also focuses on the RFQ system and allows users to aggregate dealer interactions into
metrics that can provide greater contextual analysis. This type of analysis historically has
been a challenge within voice-based trading environments. Metrics such as cover will compile
quotes, prices received or lack of a response from dealers and can rank dealers in the user’s
network in terms of cover and price. These metrics can also be aggregated to produce
additional benchmarks around opportunity cost.
Best Execution in Fixed Income: A Work in Progress | July 2016
2016 The TABB Group, LLC. All Rights Reserved. May not be reproduced by any means without express permission | 15
Conclusion
The first phase of an unprecedented paradigm shift within the global fixed income marketplace
is well under way in both the US and Europe. The repercussions of sweeping regulatory
mandates will establish new standards in the way participants view the interaction between
pricing and best execution. Regulators in the US and Europe have already given considerable
guidance and established rules outlining comprehensive best- execution standards across
asset classes. Many standards of the past will have to be adapted to new regulatory realities
or thrown out entirely.
The time when market participants could independently benchmark their own execution
performance in such a way to adequately satisfy internal compliance or fiduciary obligations
is gone. These changes are particularly important to buy-side participants on both sides of
the pond. Traditional metrics such as dealer quotes and TRACE feeds are no longer sufficient
as stand-alone metrics for price discovery.
Investor demand for third-party TCA solutions within fixed income has grown tremendously
in recent years. The new standard for satisfying best execution standards for market
participants will have to be a combination of traditional internal expertise and integrated third-
party market analysis tools. Established companies such as ICE Data Services, Markit, and
Bloomberg are ahead of the curve in bringing, for the first time, robust TCA analysis to the
otherwise murky fixed income marketplace. A critical factor for the success of these third-
party models, however, will be the ease with which clients integrate them into their existing
workflows.
In the brave new world of fixed income trading, investors will need to utilize every tool – new
and old – available to them. Fixed income TCA, which was once thought to be a quixotic
undertaking, is evolving rapidly. Even so, the tools available today are still in their nascent
stages and TCA and compliance policies are very much a moving target firm to firm.
Nonetheless there is already an abundance of insight and value to be added to the decision-
making processes for any firm.
Best Execution in Fixed Income: A Work in Progress | July 2016
2016 The TABB Group, LLC. All Rights Reserved. May not be reproduced by any means without express permission | 16
About
TABB Group
TABB Group is a financial markets research and strategic advisory firm focused exclusively on
capital markets. Founded in 2003 and based on the methodology of first-person knowledge,
TABB Group analyzes and quantifies the investing value chain from the fiduciary, investment
manager, broker, exchange, and custodian. Our goal is to help senior business leaders gain
a truer understanding of financial markets issues and trends so they can grow their business.
TABB Group members are regularly cited in the press and speak at industry conferences. For
more information about TABB Group, go to www.tabbgroup.com.
The Authors
Anthony J. Perrotta, Jr.
A financial markets industry veteran, Anthony Perrotta is a partner at TABB Group, responsible
for directing the Global Research Alliance and Consulting practices, which serve institutional
investors in the capital markets. The practices focus on the areas of market structure,
regulatory affairs, compliance, trading, clearing, technology, and data issues affecting
equities, fixed income, listed, and OTC derivatives, and technology. Mr. Perrotta presents at
a wide range of industry conferences and his thought leadership regularly appears in financial
publications such as the Wall Street Journal, Financial Times, et al.
Mr. Perrotta joined TABB Group in 2014. He is considered a leading authority on fixed income
trading, distribution, market structure, and technology across rates, credit, and OTC
derivatives markets. His career includes roles as the Head of Credit and OTC Derivatives
Trading for both Tradeweb Markets LLC and MarketAxess Corp., in addition to trading and
sales management positions with Barclays, Lehman Brothers and Morgan Stanley in the US
and Asia. Since 2013, he has been an advisory board member for SenaHill Partners, a
merchant bank serving the financial services technology sector. He attended Georgetown
University.
Colby Jenkins
Colby Jenkins joined TABB Group in August 2012. Before joining TABB, he was
a Global Academic Fellow at New York University Abu Dhabi in the UAE, serving as a faculty
member in its physics and mathematics departments. He graduated from New York
University, earning a BS in physics with an additional focus on mathematics. As an analyst,
Colby works within the fixed income research group.

Best Execution in Fixed Income: A Work in Progress | July 2016
2016 The TABB Group, LLC. All Rights Reserved. May not be reproduced by any means without express permission | 17
www.tabbgroup.com
New York
+ 1.646.722.7800
Westborough, MA
+ 1.508.836.2031
London
+ 44 (0) 203 207 9477