berkshire wireless learning initiative - bc.edu · intasc report: berkshire wireless learning...
TRANSCRIPT

March 2009
www.intasc.org
Berkshire Wireless Learning InitiativeFinal Evaluation Report
REPORT
Funded by and prepared for:
Massachusetts Technology Collaborative 75 North Drive Westborough, MA 01581
Damian Bebell, Ph.D.
Rachel E. Kay
Technology and Assessment Study Collaborative Lynch School of Education Boston College Chestnut Hill, MA 02467

inTASC REPORT: Berkshire Wireless Learning Initiative, Final Evaluation Report, March 20092
Executive SummaryThis final report examines the impacts of the Berkshire Wireless Learning Initiative (BWLI)
a pilot program that provided 1:1 technology access to all students and teachers across five public and private middle schools in Western Massachusetts. Using a pre/post comparative study design, the current evaluation explores a wide range of program impacts over the three years of the project’s implementation. Specifically, the current document summarizes the background, project implementation, study design and methodology, and subsequent results detailing how teaching and learning practices changed when students and teachers were provided with laptops, wireless learn-ing environments, and additional technology resources through participation in the technology pilot program. Specifically, pre/post student surveys, pre/post teacher surveys, teacher interviews, principal interviews, pre/post student drawings, and an analysis of student achievement results were employed in determining the impacts of the BWLI program.
There are many potential ways to summarize the findings and outcomes of such a complicated and rich learning initiative. One of the most universal findings in the current study was that both the implementation and outcomes of the program were somewhat varied across the five 1:1 settings and over the three years of the student laptop implementation. However, a number of common trends across the various research results directly address the original four targeted BWLI outcomes.
Enhanced Student Achievement
There is emerging evidence that student achievement was positively enhanced through the types of educational access and opportunities afforded by 1:1 computing through the BWLI pro-gram. Specifically, the analyses of the pass rates on all of the available MCAS subject tests during the years when 7th and 8th grade students had full access to 1:1 computing saw growth compared to past averages as well as comparison school performance and state averages. After controlling for prior achievement levels, student level analysis of 8th grade test performance after two years of 1:1 computing in the BWLI setting revealed a statistically significant positive relationship between
Damian Bebell, Ph.D.Rachel E. KayTechnology and Assessment Study Collaborative Lynch School of Education Boston College
Berkshire Wireless Learning InitiativeFinal Evaluation Report
March 2009

inTASC REPORT: Berkshire Wireless Learning Initiative, Final Evaluation Report, March 20093
BWLI participation and 2008 English Language Arts MCAS performance, but not for Math. Fur-thermore, a randomized computer writing study in the final year of the BWLI implementation demonstrated that students produced both higher-scoring and lengthier essays when allowed to compose and edit text using their computer, rather than the traditional paper and pencil required in the official state assessment.
In addition to the state test score analyses, teachers and principals were overwhelmingly posi-tive in their assessment of the initiative on student outcomes. Seventy-one percent of all 1:1 teachers reported that their students’ quality of work had improved through participation in the program. The school principals were even more unanimous in their assessment of the impact of the BWLI and 1:1 computing on their students. For example, all of the interviewed school leadership reported unanimously that the “BWLI program has positively impacted my student’s academic achievement” and that computers helped their students “grasp difficult curricular concepts” and allowed them to “create better looking products”.
Improved Student Engagement
There is strong evidence that student engagement increased dramatically in response to the enhanced educational access and opportunities afforded by 1:1 computing through the BWLI pro-gram. In their final survey, teachers overwhelmingly reported improvements in student engagement and motivation: 83% of teachers felt that engagement had improved for their traditional students, as well as 84% for at-risk/low achieving students and 71% for high achieving students. Similarly, the principal interview results were equally as positive as the teachers in their assessment that student participation in the program has led to dramatically improved student engagement in the class-room. Nearly all of the interviewed building leaders reported throughout the three-year implemen-tation period that the majority of students responded very favorably to the laptop initiative and that students’ engagement, attentiveness, and motivation was improved when they were using laptops in class. The classroom observations also found that a large majority of students clearly appeared more attentive and engaged when they were using their laptops in class which was also expressed repeatedly in many teacher interviews over the duration of the three-year implementation. Both the classroom observation and teacher interviews additionally found that student engagement could also be enhanced even when only the teacher used technology in class, such as the delivery of cur-riculum using technology resources.
Fundamental Changes in Teaching Practices
The third targeted project outcome was the documentation of fundamental paradigm changes in teaching, particularly teaching strategies, curriculum delivery, and classroom management. With-out question, the BWLI program had major impacts across many aspects of teaching for the major-ity of teacher participants. In nearly all BWLI settings, teachers quickly adopted and incorporated technology across a wide variety of professional practices beyond use with students in the classroom (which had itself increased nearly four times within the first six months of the student deployment). Without question, the majority of teachers’ non-instructional professional practices were clearly

inTASC REPORT: Berkshire Wireless Learning Initiative, Final Evaluation Report, March 20094
impacted by the 1:1 initiative—representing a clear shift in many aspects of teaching strategies and methods. In the final survey administration, over 80% of BWLI teachers reported that the delivery of curriculum within their classes had changed since their schools began the BWLI program. In addition, just under 60% of responding teachers believed that their school climate had changed as a result of the program and over 50% of teachers further believed that their role as a teacher within their own classroom had changed. In assessing the impact of these changes in their own teaching, teachers were nearly unanimously positive (or neutral) with 62% of BWLI teachers reporting that their teaching had “improved as a result of the 1:1 program” while less than 10% disagreed with that statement. In conclusion, there is ample evidence across the various research inquires that 1:1 computing and the BWLI program substantially impacted nearly all aspects teachers’ professional lives in the majority of participating classrooms.
Enhanced Student Research Skills and Collaboration
There is supporting evidence that student research skills and collaboration were enhanced by the improved educational access and opportunities afforded by 1:1 computing through the BWLI program. Certainly, in every BWLI setting students access to digital resources and tools increased exponentially with 1:1 student computing. Based on the early survey results, BWLI students and teachers quickly adopted Internet resources as a research tool and resource in the classroom. Look-ing across the student surveys, teacher surveys, classroom observations, and teacher interviews, there were numerous accounts of how the adoption of 1:1 computing and wireless Internet access had changed the way students access information and conduct research.
In the teacher survey, BWLI teachers reported that with the adoption of 1:1 student computing they assigned their students much more frequently to create products using a wider variety of tools and mediums than had been available prior to the program. After the third year of the BWLI pro-gram over 60% of teacher respondents reported that their students had “greater freedom of choice with regard to their individual learning style” due to their participation in the BWLI program. From these results, it seems clear that both practices and sentiments of participating students and teachers show that student capabilities to conduct independent research increased through participation in the 1:1 program.
Supporting evidence shows that student collaboration and interaction with peers increased with 1:1 computing and the BWLI program. Teachers across the BWLI settings reported increases in stu-dent collaboration for a sizable portion of their students, although not the majority. Specifically, in the final survey teachers reported that their students interaction with other students had increased as a result of 1:1 computing for 44% of their traditional students, 42% of low-achieving students, and 39% of high-achieving students. Across all types of students, less than 7% of teachers reported decreases in student peer interaction as a result of the 1:1 initiative. In addition, 60% of BWLI prin-cipal/school leadership felt “students interact with each other more while working with computers.” Based on such evidence, we conclude that student collaboration and interaction increased for many BWLI students in many 1:1 classrooms, but the impact of the initiative on student collaboration was less universal and dramatic than many of the other findings.

inTASC REPORT: Berkshire Wireless Learning Initiative, Final Evaluation Report, March 20095
Table of ContentsExecutive Summary .................................................................................................................... 2
Enhanced Student Achievement .............................................................................................. 2Improved Student Engagement ................................................................................................ 3Fundamental Changes in Teaching Practices......................................................................... 3Enhanced Student Research Skills and Collaboration .......................................................... 4
Table of Contents ........................................................................................................................ 5List of Tables and Figures ........................................................................................................... 7
Introduction ............................................................................................................................. 11Background ............................................................................................................................... 11The Berkshire Wireless Learning Initiative .......................................................................... 14
Study Methodology and Data Sources ..................................................................................... 17Evaluation Opportunities and Program Objectives ............................................................ 17Student and Teacher Survey Response Rates ....................................................................... 19
Student Survey ............................................................................................................... 19Teacher Survey ............................................................................................................... 21
Student Drawings ..................................................................................................................... 24Classroom Observations and Teacher Interviews ............................................................... 25Principal/School Leadership Interviews ............................................................................... 27Exploring the Impact of 1:1 Computing on Student Achievement ................................... 28
School and Student Level MCAS Analyses ................................................................ 28Computer Writing Assessment ................................................................................... 31
Results ....................................................................................................................................... 37Teacher Survey Results: Adoption and Use of Technology ................................................ 37Teacher Survey Results: BWLI Teacher Reflections Towards 1:1 Computing ................. 45
Teacher Perceptions Across Grade Levels .................................................................. 52Teacher Perceptions Across Schools ........................................................................... 53
Principal/School Leadership Interview Results: Summary ................................................ 57Classroom Observation Results: Summary .......................................................................... 62
The Importance of the Teacher ................................................................................... 62The Role of MCAS and Standardized Testing ............................................................ 63Lack of Support/Peripheral Hardware ........................................................................ 63Transfer of Data and Information Within 1:1 Settings ............................................. 64Congested Wireless Networks ..................................................................................... 65Professional Development and Training for New and Incoming Teachers ........... 65Loaner Laptops and Student Equity Within 1:1 Setting ........................................... 66Student Engagement .................................................................................................... 67
inTASC REPORT: Berkshire Wireless Learning Initiative, Final Evaluation Report, March 20096
Student Drawing Results: Summary over Time ................................................................... 68Student Survey Results: Student Use of Technology in School .......................................... 71
Year 3 Student Survey Results ...................................................................................... 71Comparing Student Use Over Time ........................................................................... 90Students’ Home Access to Technology ..................................................................... 101Students’ Home Use of Technology .......................................................................... 104
Analyses of Student Achievement ......................................................................................... 107School-level Trend Analyses ................................................................................................. 107
Student Level Relationship Between Achievement and Technology Use ............ 116Determining the Relationship Between Student Level Technology Use and Student Achievement ......................................................................................... 124Computer Writing Study Results............................................................................... 129
Findings .................................................................................................................................. 132Enhanced Student Achievement .......................................................................................... 132Improved Student Engagement ............................................................................................ 133Fundamental Changes in Teaching Practices..................................................................... 134Enhanced Student Research Skills and Collaboration ...................................................... 135
Discussion............................................................................................................................... 137References ............................................................................................................................... 145Appendix A ............................................................................................................................. 149Endnotes ................................................................................................................................. 155

inTASC REPORT: Berkshire Wireless Learning Initiative, Final Evaluation Report, March 20097
List of Tables and FiguresTables
Table 1: Summary of schools participating in the BWLI research ............................ 14Table 2: Comparison of demographic and assessment characteristics for BWLI and comparison schools ....................................................................... 15Table 3: BWLI data collection procedures and targeted project outcomes .............. 18Table 4: Student survey response rates for Year 1 and Year 2 data collection .......... 20Table 5: Year 3 (2007–2008) student survey response rate ......................................... 20Table 6: Number of teacher survey respondents by school and survey administration for Year 1 and Year 2 .............................................................. 21Table 7: Year 2 (June 2007) teacher survey response rate .......................................... 22Table 8: Year 3 (2007–2008) teacher survey response rate ........................................ 23Table 9: Characteristics of Year 3 (June 2008) teacher survey sample by school .... 24Table 10: Summary of student level MCAS administration results across subjects and BWLI student laptop deployment schedule ............................ 30Table 11: Student assignment to testing conditions for the Spring 2008 BWLI computer writing study across BWLI schools ................................... 32Table 12: MCAS 7th grade open response scoring rubric for Topic/Idea Development and Standard English Conventions ........................................ 35Table T1: Frequency of teachers’ use of technology during the 2007–2008 school year (June 2008) .................................................................................... 38Table T2: Frequency of teachers’ use of technology during the 2007–2008 school year by school (June 2008) ................................................................... 39Table T3: BWLI Teachers’ use of technology over time ............................................... 41Table T4: Comparison of BWLI and comparison teacher frequency of assigning students to create products using technology during the 2007–2008 school year (June 2008) ......................................................... 42Table T5: Frequency of teachers’ assignments of technology based student products during the 2007–2008 school year by school (June 2008)........... 43Table T6: Frequency of teachers’ assignments of technology based student products over time ............................................................................................ 44Table T7: BWLI teachers’ response to the statement “My students have benefited greatly from their participation in the 1:1 laptop program” (June 2008) ....................................................................................... 46Table T8: BWLI teachers’ response to the statement “My teaching has improved as a result of the 1:1 laptop program” (June 2008) ........................................ 46Table T9: BWLI teachers’ response to the statement “The impacts of any 1:1 computing program may take many years to be fully understood” (June 2008) .................................................................................. 47Table T10: BWLI teacher attitudes towards increased curricular and technical support for improving the effectiveness of the BWLI program (June 2008) ...................................................................... 48

inTASC REPORT: Berkshire Wireless Learning Initiative, Final Evaluation Report, March 20098
Table T11: BWLI teachers’ response to the statement “I would encourage other Massachusetts middle schools to adopt 1:1 computing programs” (June 2008) ......................................................................................................... 49Table T12: BWLI teachers’ response to the statement: “The considerable costs and expenses associated with 1:1 laptop programs are not justified based on my experiences” (June 2008) ........................................................... 50Table T13: Mean BWLI teacher beliefs across grade levels (June 2008) ....................... 52Table T14: Mean BWLI teacher beliefs across participating schools (June 2008) ....... 53Table P1: Summary of general attitudes and benefits of computers in education across BWLI principal/school leaders (2008 Interview) ........... 57Table P2: Summary of specific attitudes and benefits of the BWLI program across BWLI principal/school leaders (2008 Interview) .............................. 58Table SD1: Summary of BWLI 7th grade student drawing characteristics across schools from December 2005 (pre-laptop) to June 2008 ............................. 69Table S1: Number of school days students reported using technology in the CLASSROOM (2007–2008 school year) ........................................................ 71Table S2: Number of school days students reported using technology in a COMPUTER LAB (2007–2008 school year) ................................................. 72Table S3: Number of school days students reported using technology in the LIBRARY (2007–2008 school year) ................................................................ 73Table S4: Number of school days STUDENTS reported using a computer in READING/ELA class (2007–2008 school year) ............................................ 75Table S5: Number of school days students reported their TEACHER using a computer in READING/ELA class (2007–2008 school year) .................. 76Table S6: Number of school days STUDENTS reported using a computer in MATH class (2007–2008 school year) ............................................................ 77Table S7: Number of school days students reported their TEACHER using a computer in MATH class (2007–2008 school year) .................................. 77Table S8: Number of school days STUDENTS reported using a computer in SOCIAL STUDIES class (2007–2008 school year) ...................................... 78Table S9: Number of school days students reported their TEACHER using a computer in SOCIAL STUDIES class (2007–2008 school year) ............. 79Table S10: Number of school days STUDENTS reported using a computer in SCIENCE class (2007–2008 school year) ...................................................... 80Table S11: Number of school days students reported their TEACHER using a computer in SCIENCE class (2006–2007 school year) ............................. 80Table S12: Number of times during the 2007–2008 school year that 6th grade students reported using a variety of specific technology applications in school ....................................................................................... 84Table S13: Number of times during the 2007–2008 school year that 7th grade students reported using a variety of specific technology applications in school ....................................................................................... 86

inTASC REPORT: Berkshire Wireless Learning Initiative, Final Evaluation Report, March 20099
Table S14: Number of times during the 2007–2008 school year that 8th grade students reported using a variety of specific technology applications in school ....................................................................................... 87Table S15: Number of times during the 2007–2008 school year that students across all grade levels reported using a variety of specific technology applications in school ....................................................................................... 89Table S16: Conversion table for transposing the January 2006 and May 2006 student survey data to 180-point scale ........................................................... 91Table S17: Average number of home computers across BWLI and comparison schools during the 2007–2008 school year .................................................. 101Table S18: Percent of students who reported taking a school laptop home with them during the 2007–2008 school year ............................................. 102Table S19: Students ease of access to a home computer during the 2007–2008 school year ....................................................................................................... 103Table S20: Percent of students’ access to the Internet from their home computer during the 2007–2008 school year ............................................................... 103Table S21: Average number of minutes students reported using their home computer on a typical day during the 2007–2008 school year .................. 104Table S22: Average number of minutes students reported using their home computer on a typical day for a variety of uses during the 2007–2008 school year ............................................................................. 105Table SA1: Percent change in MCAS performance levels from 2006 6th grade administration to 2008 8th grade .................................................................. 114Table SA2: Grade 7 achievement and demographic data summary ............................ 116Table SA3: Grade 8 achievement and demographic data from the state ..................... 117Table SA4: Interpretation of correlation coefficient ....................................................... 118Table SA5: Correlation table between 7th grade students commonly reported technology uses, demographic variables, and 2008 MCAS performance ........................................................................................ 119Table SA6: Correlation table between 8th grade students commonly reported technology uses, demographic variables, and 2008 MCAS performance .............................................................................. 122Table SA7: Mean 2008 ELA and Math raw scores for 8th grade BWLI and comparison students compared to their 2006 MCAS raw scores ............. 125Table SA8: Comparison of 7th grade results for students completing an MCAS essay using their BWLI laptop or traditional paper/pencil ....................... 130Table A1: Students use of technology to present information in class scale ............. 149Table A2: Scales for technology use at school ............................................................... 151Table A3: Scales for technology use at home ................................................................ 153Table A4: Scales for student beliefs and abilities around technology ........................ 154

inTASC REPORT: Berkshire Wireless Learning Initiative, Final Evaluation Report, March 200910
FiguresFigure T1: Frequencies of Year 3 BWLI teacher beliefs (surveyed June 2008) ............ 51Figure T2: Teachers’ beliefs on the impact of 1:1 computing across different students (June 2008) ......................................................................................... 55Figure S1: Average number of school days students reported using technology (2007–2008 school year) .................................................................................. 74Figure S2: Average number of school days students reported using technology by primary subject area (2007–2008 school year) ........................................ 81Figure S3: Average number of school days teachers used technology with their classes as reported by their students (2007–2008 school year) .......... 83Figure S4: Average number of days students reported using technology in their classrooms across past survey administrations ............................................ 92Figure S5: Number of days over the BWLI implementation years that BWLI and comparison 6th grade students reported using computers across their primary subject classes ................................................................ 93Figure S6: Number of days in the school year that BWLI and comparison students reported that their 6th grade teachers used computers in their primary subject classes ............................................................................ 94Figure S7: Number of days in the school year that BWLI and comparison 7th grade students reported using computers across their primary subject classes .................................................................................................... 95Figure S8: Number of days in the school year that BWLI and comparison students reported that their 7th grade teachers used computers in their primary subject classes ............................................................................ 96Figure S9: Number of days in the school year that BWLI and comparison 8th grade students reported using computers across their primary subject classes .................................................................................................... 97Figure S10: Number of days in the school year that BWLI and comparison students reported that their 8th grade teachers used computers in their primary subject classes ............................................................................ 99Figure S11: Frequency of BWLI and comparison students’ various computer uses during the 2007–2008 school year ........................................................ 100Figure SA1: Percent of students “passing” 7th grade ELA MCAS (2001–2008) ............ 108Figure SA2: Percent of students “passing” 7th grade Math MCAS (2006–2008) .......... 109Figure SA3: Percent of students “passing” 8th grade ELA MCAS (1998–2001; 2006-2008) ................................................................................. 111Figure SA4: Percent of students “passing” 8th grade Math MCAS (1998–2008) .......... 112Figure SA5: Percent of students “passing” 8th grade Science MCAS .............................. 113

inTASC REPORT: Berkshire Wireless Learning Initiative, Final Evaluation Report, March 200911
IntroductionThe current document is the final report in a series of twelve quarterly and annual reports
provided to the Massachusetts Technology Collaborative (MTC) by Boston College’s Technology and Assessment Study Collaborative (inTASC) evaluation team. MTC provides oversight, on behalf of the Commonwealth, for state funding allocated to the Berkshire Wireless Learning Initiative (BWLI). Quarterly and annual reports are provided to the BWLI Steering Committee by inTASC at MTC’s request in order to better assist the adoption of wireless learning technologies in partici-pating schools. Past reports, as well as additional information and links about the initiative and its’ evaluation can be found at: www.bc.edu/bwli.
Background
All of us, professionals as well as laymen, must consciously break the habits we bring to thinking about the computer. Computation is in its infancy. It is hard to think about computers of the future without projecting onto them the properties and the limitations of those we think we know today. And nowhere is this more true then in than in imagining how computers can enter the world of education.
—Seymour Papert, Mindstorms (2nd Ed.)
Few modern educational initiatives have been as widespread, dramatic, and costly as the integra-tion of computer technologies into American classrooms. Believing that increased use of computers will lead to improved teaching and learning, greater efficiency, and the development of important skills in students, educational leaders have made multi-billion dollar investments in educational technologies such that the national ratio of students to computers has dropped from 125:1 in 1983 to 4:1 in 2002 (where it has largely remained) (Russell, Bebell, & Higgins, 2004). While access to computers has increased, teachers and students in traditional school environments generally report using computers in schools for only a small amount of time each day, with the least amount of use typically occurring in science and mathematics classes (Bebell, Russell, & O’Dwyer, 2004; Russell, Bebell, O’Dwyer, & O’Connor, 2003; Ravitz, Wong, & Becker, 1999). Despite the many ways in which computers can be distributed within schools (e.g., in labs, libraries, or on shared carts), many observers theorize that the disjuncture between the dramatic increase in the presence of computers in schools and the relatively stagnant amount of use results in part because student-to-computer ratios have not yet reached a stage at which the technology is ubiquitous (Bull, Bull, Garofolo, & Harris, 2002; Papert, 1996; Rockman, 1998).
Both proponents and opponents of educational technology agree that the full effects of tech-nology in schools cannot be fully realized until the technology is no longer a shared resource (Op-penheimer, 2003; Papert, 1992, 1996). Currently, a new educational reality has been emerging as thousands of students and teachers have been provided with their own laptop computers. Currently, Henrico County School District in Virginia has implemented the fifth year of a district-wide 1:1 laptop program for grades 6 through 12 and the state of Maine has recently renewed a second three-

inTASC REPORT: Berkshire Wireless Learning Initiative, Final Evaluation Report, March 200912
year contract for a state-wide laptop program which provides a laptop to all students and teachers in the state’s grade 7 and 8 classroom. In 2003-2004, it was estimated that 4% of the nation’s school districts were implementing some form of 1:1 computing. In 2006, it was estimated that close to 25% of school districts are implementing some form of a 1:1 laptop program (eSchool News, 2006). Specifically, 1:1 programs now exist across the country in a wide variety of settings including large-scale 1:1 initiatives in South Dakota, Pennsylvania, New Hampshire, Texas, Georgia, Louisiana, California, Florida, Kansas, Massachusetts, and Michigan. In addition, international attention has been recently focused on the adoption of 1:1 computing through the “One Laptop Per Child” Initia-tive, which provides bulk quantities of inexpensive laptop computers for educational purposes in third world countries (www.laptop.org).
Early research and evaluation studies suggest several positive outcomes from 1:1 laptop initia-tives including: increased student engagement (Cromwell, 1999; Rockman, 1998; MEPRI, 2003), decreased disciplinary problems (Baldwin, 1999; MEPRI, 2003), increased use of computers for writing, analysis and research (Cromwell, 1999; Baldwin, 1999; Guignon, 1998; Russell, Bebell, & Higgins, 2004), and a movement towards student-centered classrooms (Rockman, 1998). Baldwin (1999) also documented effects on student behaviors at home such that students reported spending less time watching television and more time on homework. Similarly, Russell, Bebell and Higgins (2004) report that students’ academic use of computers at home occurred more frequently when students were provided with their own laptops. In addition, an evaluation of the Maine laptop pro-gram (Silvernail & Lane, 2004) and of a laptop program in Andover, Massachusetts (Russell, Bebell, & Higgins, 2004) provide evidence that substantially more use of laptops is occurring in science and mathematics classes in comparison to what has been found in studies that focus on non-1:1 laptop settings (Ravitz, Wong, & Becker, 1999; Russell, O’Brien, Bebell, & O’Dwyer, 2003).
In the past few years, a small number of studies have begun to more specifically focus on the relationship between achievement and participation or non-participation in laptop programs, but have not always included measures of specific technology uses. For example, Gulek and Demirtas (2005) examined test scores between students participating and not participating in a voluntary 1:1 laptop program at a middle school in Pleasanton, California. A significant difference in both math and ELA test scores was found for students participating in the program a year or more, even after statistically controlling for prior achievement levels. An urban middle school study (Dun-leavy & Heinecke, 2007) found a gender interaction between participation in a 1:1 laptop program and scores on the state’s standardized assessment in science. Students were randomly selected from the school population to participate in 1:1 laptop classrooms or non-1:1 laptop classrooms. They discovered a significant increase in science test scores as well as a significant gender interaction. Specifically, boys had a much greater increase in scores by participating in a 1:1 laptop school, whereas the increase for girls was negligible.
Evaluation results from the 1:1 middle school laptop initiative in Maine suggests impacts on student learning were greatest for English Language Arts, particularly for helping students improve writing skills. A subsequent research study which paired extensive Mathematics professional devel-opment and curricular resources across dozens of selected Maine 1:1 classrooms. The study found that in those 1:1 settings where additional curricular and professional development resources were

inTASC REPORT: Berkshire Wireless Learning Initiative, Final Evaluation Report, March 200913
provided, students tested up to four months ahead in mathematics skills compared to students with teachers who had no additional training (Silvernail, 2008). These results underscore the importance of adequate training and professional development as teachers transition to and maximize the op-portunities afforded by new 1:1 settings, but also demonstrate the potential for increasing student achievement across the curriculum. In addition, a large scale randomized experimental design study is currently exploring the impacts of 1:1 computing across 18 pilot 1:1 middle schools in Texas that is also beginning to document some positive results in students learning and achievement (Shapley, 2008). A more thorough summary of current laptop programs including considerations of imple-mentation and impacts on students has been published in the January 2, 2009 Science magazine (Zucker & Light, 2009).
With these limited measures of success, 1:1 computing has recently captured the imagination of many educational and political leaders looking to reform educational practices and improve un-derperforming schools. In addition, a number of political leaders have suggested that providing students access to powerful and widespread technology will result in long term economic prosper-ity. In the last few years, a number of legislators and politicians have promoted 1:1 computing in various public school settings including a recent proposal from the Lieutenant Governor of Illinois to provide 170,000 7th graders across the state with laptops. In two months alone (June–July 2006), major state-funded investments in 1:1 laptop environments have been reported in South Dakota ($4 million), Pennsylvania ($20 million) and a second program in Massachusetts ($1.25 million). Within school settings, the promise of 1:1 computing has also taken root; nearly 50% of school dis-trict chief technology officers reported in a recent national survey that they were likely to purchase a computing device for each student in their district by 2011 (Hayes, 2006).
However, despite growing interest in and excitement about 1:1 computing, there is a lack of sufficient, sustained, large-scale research and evaluation that focuses on teaching and learning in these intensive computing environments. Specifically, there is a lack of evidence that relates use of technology in these 1:1 settings with measures of student achievement. For example, despite the fact that the state of Maine has recently re-authorized the nation’s largest laptop initiative, little high-quality empirical evidence has been published about the impacts of the program on student achievement. This is a particularly salient issue in light of the high cost of implementing and main-taining 1:1 laptop initiatives and the current climate of educational policy whereby student achieve-ment is held as the benchmark of successful school reforms and initiatives under state and federal mandates such as No Child Left Behind (NCLB).
A number of methodological and psychometric challenges are partially responsible for this lack of research including (1) the way in which students’ and teachers’ technology use is measured, (2) a lack of prior student achievement measures or comparison groups, (3) a reliance exclusively on paper-based tests in high-tech classroom environments, and (4) poor alignment of measurement tools. The Massachusetts 1:1 pilot program, the Berkshire Wireless Learning Initiative provides a unique opportunity to document the effects of 1:1 computing on teaching and learning using a variety of techniques that overcome many common methodological challenges and shortcomings across a variety of middle school settings.

inTASC REPORT: Berkshire Wireless Learning Initiative, Final Evaluation Report, March 200914
The Berkshire Wireless Learning Initiative
The Berkshire Wireless Learning Initiative (BWLI) was a three-year pilot-program across five Massachusetts middle schools where every student and teacher was provided a laptop comput-er beginning in 2005. In addition, all classrooms were equipped with wireless Internet networks and selected classrooms with DLP/LCD projectors, as well as technical and curricular professional development and support to help teachers integrate the new technology into their curriculum. The $5.3 million dollar program was funded through a combination of district-level school funds, state funds, as well as local business contributions. Launched midway during the 2005–2006 school year, the initiative (as well as the accompanying research) continued through the 2007–2008 academic year. Each of the BWLI school districts were actively involved in the initial development of the tech-nology program, and participation by district personnel in Steering Committee meetings sought to encourage direct participation in subsequent phases of the program design and implementation.
The overall aim of the program was to determine the efficacy of a one-to-one laptop initia-tive in transforming teaching and learning in a traditional middle school setting. Specifically, the targeted outcomes of the BWLI included: enhancing student achievement, improving student engagement, improving classroom management, enhancing students’ capabilities to conduct independent research and collaborate with their peers, as well as creating fundamental paradigm changes in teaching strategies and curriculum delivery. The program evaluation employed a pre/post with comparison group design to examine the effects of 1:1 technology on students and teach-ers across five participating schools in Western Massachusetts. In other words, each cohort of stu-dents and teachers participating in the BWLI program was surveyed in their original pre-laptop setting and at various intervals throughout the implementation. In addition to following the cohorts of students over three years of the 1:1 technology implementation, the researchers also collected comparison data from two neighboring public middle schools. A summary of the participating schools in the BWLI research study are displayed in Table 1.
Table 1: Summary of schools participating in the BWLI research
School Name District Classification Grades School Type
Conte NAPS BWLI 6, 7, 8 Public
Herberg PPS BWLI 6, 7, 8 Public
Reid PPS BWLI 6, 7, 8 Public
St. Mark CSoP BWLI Pre-K to 7 Parochial
St. Joseph CSoP BWLI 8, 9, 10, 11, 12 Parochial
North WPS Comparison 6, 7, 8 Public
South WPS Comparison 6, 7, 8 Public

inTASC REPORT: Berkshire Wireless Learning Initiative, Final Evaluation Report, March 200915
As evidenced by our short review of past and current laptop initiatives, middle schools have served as one of the most concentrated settings for 1:1 laptop programs (Maine, Henrico, NH, TX). One of the more unique aspects of the BWLI 1:1 laptop initiative was the participation of schools from a variety of educational settings and school districts within the same pilot program. Specific-ally, three public and private school districts (North Adams Public Schools, Pittsfield Public Schools and Catholic Schools of Pittsfield) in two small cities in Western Massachusetts participated in the program. A summary of school characteristics for participating BWLI and comparison schools highlights the varied educational settings where the current research was undertaken. This is pre-sented below in Table 2.
Table 2: Comparison of demographic and assessment characteristics for BWLI and comparison schools
School Name
07/08 Enrollment
Student-to-teacher
ratio%
white
% eligible for free/ reduced
lunch
% English is not first language
% special education
Median income
(by town)
District spending
per student
Conte 323 9:1 84% 46% 5% 20% $27,601 $14,541
Herberg 721 14:1 82% 37% 4% 16% $42,930 $11,860
Reid 667 13:1 78% 51% 6% 19% $42,930 $11,860
St. Mark 271 14:1 96% — — — $42,930 —
St. Joseph 307 10:1 94% — — — $42,930 —
North 808 12:1 90% 25% 6% 19% $45,240 $12,093
South 670 10:1 83% 46% 15% 19% $45,240 $12,093
Enrollment from greatschools.net Student-to-teacher ratio from greatschools.net % white from greatschools.net, except St. Joseph from privateschoolsreport.com % eligible for free/reduced lunch from greatschools.net % English is not first language from Mass DOE % special education from Mass DOE Median household income from factfinder.census.gov District spending per student from greatschools.net
As Table 2 summarizes, each of the BWLI schools shared some characteristics, although there were also some interesting indications of how different the participating schools were. For example, although each of the public BWLI schools (Conte, Herberg, and Reid) has a similar percent of stu-dents whose first language is not English, the student to teacher ratio was substantially lower at the Conte school then at the substantially larger Pittsfield public schools. Conte also exhibited a lower median household income than the other schools. Conversely, the Conte school reported higher per pupil expenditures as well as the highest proportion of students receiving special educational services. Such variation across the participating schools provides a realistic setting for studying the impacts of the 1:1 program.

inTASC REPORT: Berkshire Wireless Learning Initiative, Final Evaluation Report, March 200916
In Table 2, it is also worth noting the general degree of similarity observed for the compari-son schools (North and South) when compared to the participating 1:1 schools. For example, the teacher-student ratios of the comparison schools fall within the range of the BWLI schools, as does the student ethnicity/race, percent of student receiving special educational services, and per pupil expenditure. One difference noted between the BWLI and comparison schools was that the average median income of the comparison schools was somewhat greater than the BWLI towns.

inTASC REPORT: Berkshire Wireless Learning Initiative, Final Evaluation Report, March 200917
Study Methodology and Data Sources
Evaluation Opportunities and Program Objectives
Given the varied educational settings across the BWLI schools and the participation of two matched comparison settings, the BWLI provides a unique and valuable opportunity to docu-ment the effects of 1:1 computing on teaching and learning using both qualitative and quantitative approaches. Specifically, the research design aimed to capitalize on the opportunities inherent in the three-year technology deployment of the BWLI schedule by examining different grade levels (6–8) through a series of naturally occurring pre/post comparisons in addition to comparisons at the two comparison middle schools.
The evaluation sought to provide meaningful data concerning the immediate impacts of the technology on classroom practices for practitioners and administrators throughout the deployment period. The evaluation design also aimed to address a number of the more far-reaching goals of the program by examining the impacts of the technology on student achievement and on more nuanced educational impacts using both qualitative and quantitative techniques. Specifically, a series of teacher surveys, selected teacher interviews, student surveys, student drawings, analysis of existing school records and test scores, as well as qualitative classroom observations were used to document and track the impacts of 1:1 computing on teaching and learning practices across the five experimental settings. Student achievement measures were examined through the secondary analysis of student level MCAS test data in the three participating public BWLI schools and two comparison sites through a non-equivalent comparison group study. An additional student writing assessment was undertaken in Spring 2008 whereby 7th grade students were randomly assigned to complete an extended writing exercise using their school laptop or using traditional paper and pen-cil. This writing assessment provides an opportunity to assess the impacts of the BWLI program on students writing that may be missed using only a paper-based writing assessment.
Specifically, the evaluation of the program sought to measure how successfully the BWLI program achieved the following targeted outcomes:
Enhanced student achievement as shown through 1. test scores, teacher survey data and assessments aggregated at the classroom and school levels;
Improved student engagement as shown through 2. teacher and student survey data, student drawings, teacher interviews, principal interviews, and classroom observations;
Fundamental paradigm changes in teaching strategies, curriculum delivery, and 3. classroom management as shown through teacher and student survey data, teacher interviews, principal interviews, student drawings, and classroom observation; and
Enhanced capabilities among students to conduct independent research, and 4. collaborate with peers as shown through teacher and student survey data, teacher interviews, principal interviews student drawings, and classroom observations.

inTASC REPORT: Berkshire Wireless Learning Initiative, Final Evaluation Report, March 200918
Table 3, below, describes each of the BWLI data collection procedures linked to the targeted project outcomes that they address.
Table 3: BWLI data collection procedures and targeted project outcomes
Procedure Description Outcome(s)
Student SurveyWeb-based student surveys were given to all participating BWLI and comparison group students both before and during the laptop implementation
1, 2, 3, 4
Teacher SurveyWeb-based teacher surveys were given to all participating BWLI and comparison group teachers before their students experience 1:1 computing (Pre) and again near the end of each 1:1 school year (Post).
1, 2, 3, 4
Student Drawing
A student drawing exercise asked BWLI students to reflect on “writing in school” through an open ended drawing exercise before they experience 1:1 computing (Pre) and again near the end of each 1:1 school year (Post).
2, 3, 4
Classroom Observation
Trained researchers and college students conducted pre-arranged visits to observe and record technology practices in 1:1 classrooms during the second year of program implementation.
2, 3, 4
MCAS Analysis
Research team analyzed 2006-2008 item-level MCAS results for each participating BWLI and comparison group student to determine the impacts of various technology practices (as measured via surveys) on standardized test performance.
1
Computer Writing Assessment
1:1 BWLI students were randomly selected in Spring 2008 (Year 3) to participate in an extended computer-based writing assessment to determine the impacts of technology practices on writing length and quality.
1
Teacher Interviews
At various intervals across the deployment of 1:1 student laptops, samples of BWLI teachers participated in short informal interviews regarding their progress, attitudes and results related to the program.
2, 3, 4
Principal Interviews
At various intervals across the deployment of 1:1 student laptops, BWLI principals participated in short informal and formal interviews regarding their progress, attitudes and outcomes related the program.
1, 2, 3, 4
Thus, over the course of the three year study, the research team employed a series of teacher surveys, selected teacher interviews, principal interviews, student surveys, student drawings, and qualitative classroom observations to document and track the impacts of 1:1 computing on teaching and classroom practices.
As the first part of the program implementation, all teachers were provided with laptops in late summer 2005 and have been regularly offered a variety of training and professional development opportunities. In early January 2006, each of the 7th grade students across the five participating schools (n=633) received Apple iBook G4 laptops for use during the remaining first year of the BWLI implementation. During this first year implementation, 7th grade students and teachers both reported substantial increases in the frequency and variety of technology use across the curriculum. At the first months of the second and third year of the laptop implementation all 6th, 7th, and 8th

inTASC REPORT: Berkshire Wireless Learning Initiative, Final Evaluation Report, March 200919
grade students across each participating school (n=1,700) were provided iBook G4 laptops for the majority of the 2006–2007 and 2007–2008 school year.
It should be noted that each of the participating BWLI schools varied the deployment and man-agement of the laptop program to best suit the needs of their own distinct educational community. For example, each school subscribed to their own nuanced resource allocation, training and profes-sional development opportunities, policies, and technical and curricular support. Even though the BWLI program raised the overall level of technology so that every student and teacher had a laptop computer in school, the differences in the deployment and management across the five settings re-mained substantial throughout the implementation period. For example, even though every school had policies and practices established so that students could bring their school laptops home for use, the actual policies and practices varied across each setting during the implementation period. Additional differences in the deployment and educational environment across the settings will be further explored in the results and discussion sections of this paper.
Given that the BWLI is modeled as a pilot program funded partially by legislatures interested in the utility and application of 1:1 computing, an integral component of BWLI is the current three-year research study funded by the state. The following sections of this report provide an additional overview of the specific research tools used in the current study, a summary of the project findings to date, and a discussion of these findings. After a summary of the studies methodological approach and instrumentation, the report focuses on BWLI and comparison group teacher results including teachers’ use of technology across the curriculum, and how they saw the 1:1 program impacts their own teaching and their students. The report next focuses on the examination of the BWLI and comparison group student results including a detailed summary of students’ use of technology across schools and over time. Finally, the current document presents analyses concerning the relationship between students’ use of technology and student achievement as measured by various components of the Massachusetts Comprehensive Assessment System (MCAS) as well as in a randomized com-puter writing exercise.
Student and Teacher Survey Response Rates
Student Survey
As more fully described in the BWLI evaluation plan (Bebell & Russell, 2005), all participating BWLI students completed a web based survey designed to focus on the frequency of many student technology uses both in and out of the classroom and across the curriculum. Students were addi-tionally asked to report on the frequency of their teachers’ use of technology across major curricular areas (Math, Reading/ELA, Social Studies, and Science) in addition to a handful of demographic items and a brief attitudes and beliefs inventory.
Given that the first year of the program focused on the 7th grade, grade seven students across the BWLI schools completed pre-1:1 laptop surveys in December 2005/January 2006. The overall response rate from the pre-laptop student survey was 574 surveys; or 90.4% of the 635 7th grade students. After approximately five months of 1:1 computing, these 7th grade students completed

inTASC REPORT: Berkshire Wireless Learning Initiative, Final Evaluation Report, March 200920
a post-laptop survey in early June 2006. Across the BWLI schools, the overall response rate from the student survey was 524 surveys, or 82.5%. Upon completion of the second year of the program (June 2007) when students across all grade levels had access to laptops, the Year 2 online survey was collected from 1,839 of the potential 1,898 students resulting in a 96.8% response rate. Table 4, below, shows the BWLI response rates across the BWLI schools for the first three administrations of the student survey (December 2005/January 2006, June 2006, and June 2007).
Table 4: Student survey response rates for Year 1 and Year 2 data collection
# of Participating BWLI Students
# of Survey Responses
BWLI Response Rate
Dec. 05/ Jan. 06 (7th grade only) 635 574 90.4%
June 2006 (7th grade only) 635 524 82.5%
June 2007 (Grade 6–8) 1898 1839 96.8%
Thanks to the diligence of school staff and survey technology resources, nearly every eligible student across the five BWLI schools completed third year and final student survey in June 2008. Like past survey administrations, students across the two comparison schools were also solicited to participate in the survey. The June 2008 student survey response rates are presented below for each of the BWLI and comparison schools in Table 5.
Table 5: Year 3 (2007–2008) student survey response rate
School Name Student Population
Survey Responses
Response Rate
South Middle School 697 556 79.7%
North Middle School 790 553 70.0%
Total Comparison Schools 1487 1109 74.6%
Conte Middle School 318 318 100%
Herberg Middle School 699 691 98.9%
Reid Middle School 644 643 99.8%
St. Mark 84 84 100%
St. Joseph 41 26 63.4%
Total BWLI Schools 1786 1762 98.7%

inTASC REPORT: Berkshire Wireless Learning Initiative, Final Evaluation Report, March 200921
A total of 1,109 students completed the Year 3 survey from the two comparison schools yield-ing a combined response rate of 74.6%. The response rate was higher across the BWLI schools with 1762 out of 1786 eligible students completing the survey resulting in a 98.7% response rate. Across the five BWLI schools, response rates ranged between 100% at St. Mark and Conte to 63.4% for the small (n=41) 8th grade class participating in the program at St. Joseph. Survey response rates in this range are unusually high and represent the efforts of teachers, principals and administrators at each school. In addition, daily email updates were sent to school leaders containing lists of un-surveyed students and a web site was established where response rates could be monitored across schools in real time. Such exemplary student response rates ensure that later statistical analyses will be highly representative of the population of all BWLI students (with the exception of the small population of St. Joseph participants).
Teacher Survey
As more fully described in the BWLI Evaluation Plan (Bebell & Russell, 2005), every teacher participating in the BWLI program was to be surveyed prior to and during the three years of the program. To this end, 7th grade teachers across the four BWLI schools (as well as the two compari-son group schools) were asked to complete pre-1:1 laptop surveys in January 2006 and again across all grades in June 2006, June 2007, and June 2008.
In the current report, results from the June 2008 teacher survey are compared to past survey administrations. Results from the first (January 2006) teacher survey again reflect a time when teachers had recently received their own laptops but no students had yet been issued computers. The May 2006 teacher survey administration asked teachers to focus on their first year experiences in the BWLI program with 7th grade students having had access to computers for the last five months of the year but still found all the 6th and 8th grade students without computers. It should be noted that the Year 1 teacher survey response rates were not optimal, but efforts focused on the 7th grade teachers who were most involved with the first year of the project implementation. An overview of the number of teacher survey responses across BWLI schools and survey administration is pre-sented below in Table 6 for Year 1 and Year 2 data collection.
Table 6: Number of teacher survey respondents by school and survey administration for Year 1 and Year 2
School Name Jan. 06 May 06 June 07 Total
Comparison 12 9 43 64
Conte Middle School 20 9 44 73
Herberg Middle School 10 20 56 86
Reid Middle School 21 35 56
St. Mark/ St. Joseph 3 3 8 14
Total BWLI Schools 33 53 143 229

inTASC REPORT: Berkshire Wireless Learning Initiative, Final Evaluation Report, March 200922
As Table 6 shows, fewer teachers responded to the teacher survey in its earlier administrations with only 33 7th grade BWLI responses from the January 2006 (Year 1—7th grade pre student laptop) survey. A total of 53 BWLI school teachers were surveyed again in June 2006 after their 7th grade students had 1:1 access to laptop computers (Year 1—7th grade post student laptop). In June 2007, the first year of student access across all grade levels, a school-wide survey of 143 BWLI teachers was completed. The response rates from the June 2007 teacher survey are presented below in Table 7.
Table 7: Year 2 (June 2007) teacher survey response rate
School Name Teacher Population
Survey Responses
Response Rate
South Middle School 68 42 61.8%
North Middle School 73 1 1.4%
Total Comparison Schools 141 43 30.5%
Conte Middle School 44 44 100%
Herberg Middle School 61 56 91.8%
Reid Middle School 55 52 94.5%
St. Mark 5 5 100%
St. Joseph 3 3 100%
Total BWLI Schools 168 160 95.2%
For the Year 2 school-wide teacher survey, a total of 43 teachers completed the survey from the two comparison schools yielding a combined response rate of 30.5%. Due to a scheduling conflict, North Middle School chose not to participate in the teacher survey, dramatically lowering the over-all response rate for the comparison schools’ teachers. Fortunately, the response rate was substan-tially higher across the BWLI schools with 160 out of 168 teachers completing the survey resulting in a 95.2% response rate.
Like the 2008 student survey, nearly every BWLI teacher completed the Year 3 teacher survey in June 2008. The online teacher survey focused on capturing the variety and extent of teachers’ tech-nology use, teachers’ attitude toward technology, teaching, and learning, as well as teachers’ beliefs on the effects of the BWLI program and is one of the main foci of the current report.
The June 2008 teacher survey response rates are presented on the next page in Table 8.

inTASC REPORT: Berkshire Wireless Learning Initiative, Final Evaluation Report, March 200923
Table 8: Year 3 (2007–2008) teacher survey response rate
School Name Teacher Population
Survey Responses
Response Rate
South Middle School 80 49 61.3%
North Middle School 73 39 53.4%
Total Comparison Schools 153 88 57.6%
Conte Middle School 42 42 100%
Herberg Middle School 59 59 100%
Reid Middle School 58 58 100%
St. Mark 5 4 80%
St. Joseph 3 0 0%
Total BWLI Schools 167 163 97.6%
A total of 88 teachers completed the survey from the two comparison schools yielding a com-bined response rate of 57.6%. Again, the response rate was substantially higher across the BWLI schools with 163 out of 167 teachers completing the survey resulting in a 97.6% response rate. It is unfortunate that the two Pittsfield parochial schools (St. Joseph and St. Mark) resulted in the less than 100% perfect response rate, with respective response rates of 0% and 80%.
Despite the lack of St. Joseph responses, response rates in this range are substantially above average and represent the combined efforts of teachers, principals, and administrators across each school and district. In addition, daily email updates were sent to school leaders which contained lists of un-surveyed teachers and a web site was established where response rates could be moni-tored in real time. Again, such exemplary teacher response rates ensure that later statistical analyses will be highly representative of the total population of BWLI teachers. Because the surveyed sam-ple of teachers so closely approximates the total population, a wide variety of teachers completed the final Year 3 (June 2008) survey. Amongst the 163 teacher survey respondents, a substantial portion taught or worked with students outside of the classroom or in subject areas beyond the original scope of the evaluation (foreign languages, physical education, etc.). Table 9, on the next page, shows the number of Year 3 teacher survey respondents comprising the current sample.

inTASC REPORT: Berkshire Wireless Learning Initiative, Final Evaluation Report, March 200924
Table 9: Characteristics of Year 3 (June 2008) teacher survey sample by school
All Subject Areas Primary Subject Areas
School Name # of Respondents
% of Sample
# of Respondents
% of Sample
Conte Middle School 42 26 29 27
Herberg Middle School 59 36 41 38
Reid Middle School 58 36 35 32
St. Mark 4 3 4 4
Total 163 100% 109 100%
Table 9 shows that of the 163 teachers across the four BWLI schools who completed the BWLI teacher survey, 109 were classified as teaching one of the focused primary subject areas (English/Language Arts, Math, Science, Social Studies). In addition to the 109 primary subject classroom teachers the survey was also completed by an addition 54 teachers and educators who taught subjects including: physical education, special education, reading intervention, foreign languages, and health.
To simplify the interpretation of the results, the current report presents survey results from the 109 primary subject teachers. In other words, the research team focuses the current report on data reflecting the impacts of the BWLI program on the core academic curriculum. Interestingly, the differences between the survey responses of the 109 primary subject classroom teachers and the other subject area specialists concerning the impacts of the BWLI program were largely negligible.
Student Drawings
As demonstrated in past research studies of technology programs, student drawings provide a unique and valuable reflective tool for both the participants and observers to perceive the impact of technology from the students own viewpoint (Russell, Bebell, Cowan, & Corbelli, 2003; Russell, Bebell, & Higgins, 2004). Although student drawings may be an unusual tool for collecting infor-mation about students and their classrooms, student drawings continue to provide a rich descrip-tive examination of students’ perspective that may be neglected by more traditional data sources. Participating students across all BWLI schools contributed student drawings both before and after implementation of the laptop program.
In each case, teachers distributed the blank drawing forms to their students which prompted them to:
Think about the work you do in your classroom. In the space below, draw a picture of yourself writing in school.

inTASC REPORT: Berkshire Wireless Learning Initiative, Final Evaluation Report, March 200925
For each student drawing, a trained member of the research team coded a number of dichoto-mous features that have been pre-selected using an emergent analytic coding process established through prior student drawing and 1:1 research studies (Bebell, 2001; Bassette, 2008). The specific features coded in the drawings fall into four broad categories:
Student Characteristics (what the students were doing),1.
Technology Present (type of technology depicted),2.
Student Demeanor (whether the student was depicted positively, negatively, 3. or neutral), and
Other Features (presence of teacher or other students, classroom decorations, 4. multi-frame drawing).
With minimal training these drawing categories and codes can be applied to student draw-ings with both a high degree of inter-rater and intra-rater reliability so that the codes assigned to the drawings are stable across different raters and over time. Before the team of researchers com-menced coding, 30 drawings from a prior 1:1 research study were randomly selected and coded by the research members to document inter-rater reliability. Across the raters, the inter-rater reliability estimate (i.e. percent agreement) was consistently greater than 95% which we consider more than sufficient for the current investigation and moved forward with coding the BWLI drawings.
Across the three years of the study, over 3,500 drawings were collected and analyzed from BWLI students. For the current analyses, baseline drawings were examined from the first cohort of 7th grade students in December 2005 before laptops were deployed. These students again were asked to submit drawings at the end of their first half-year of 1:1 computing in June 2006, and the exer-cise was replicated with the subsequent cohort of exiting 7th grade students in June 2008, who at that time had approximately two years of experience participating in the 1:1 laptop program. The response rates from this inquiry were generally quite good, with 91% of all eligible students completing drawings in December 2005, 84% in June 2006 and 85% in June 2008.
As more described in the results section of this paper, an internet database has been created to share common or interesting examples of drawings. In addition, codes and their definitions used in the current evaluation can be accessed on the BWLI web site at: www.bc.edu/bwli.
Classroom Observations and Teacher Interviews
Throughout the three-year implementation of the 1:1 program, members of the research and evaluation team made regular visits to each participating school to conduct classroom observations, informally interview teachers, and both formally and informally interview school principals as well as other building level and district level leadership. Although a formal classroom observation study was eliminated from the original evaluation due to post-proposal budget cuts, the research team leveraged their available resources to regularly observe 1:1 classrooms across the study settings. The information provided from the classroom observations served multiple purposes in the overall evaluation of the 1:1 initiative. First, the classroom observations served to document the variety and types of specific technology use occurring across a variety of subject areas and settings. These

inTASC REPORT: Berkshire Wireless Learning Initiative, Final Evaluation Report, March 200926
recorded observations were reflected upon with project leadership and the schools themselves during the course of the study to guide, monitor and facilitate implementation. Second, through these observations and school visits the evaluation team developed a better sense of how quickly technology practices occurred within the schools as well as levels of student engagement, pedagogi-cal practices, and school climate. For example, the classroom observations documented meaningful examples of the real world day-to-day challenges and complications inherent with the transforma-tion of established teacher and learning practices. Finally, at the end of the data collection period, the observation notes and experiences prompted exploratory data analyses of the teacher and stu-dent surveys for meaningful trends and relationships.
Thus, classroom observations were used as one of many tools to help facilitate a formative un-derstanding of the varied ways in which the laptops and technology were being used throughout the school day. To facilitate this aspect of the classroom observations, during the first year of the project, two education majors from the Massachusetts College of Liberal Arts (MCLA) were recruited and trained to carry out classroom observations focusing on the 7th grade classrooms where students had been recently provided laptops. In Fall 2005, the two MCLA students completed formal train-ing and National Institute of Health certification on conducting classroom research. In Spring 2006 (during the first months of student 1:1 computing), a total of 11 complete lessons or class periods were formally observed and documented by the MCLA student team. All of these pre-scheduled observations with voluntary teachers occurred at the Conte Middle School due in large part to its close geographic proximity to the MCLA campus. Since the classroom observations were chiefly concerned with documenting technology practices, this approach was feasible from both the per-spective of the somewhat apprehensive classroom teachers who had just begun their 1:1 experience and the research studies formative and summative objectives. Given this, the classroom observa-tions collected during Spring 2006 were not presented as a representative sample of 1:1 classrooms at that time, but rather volunteer teachers who offered to share a technology-rich lesson with an observer.
During each of the second and third years of the program, members of the Boston College research team made approximately 45 classroom observations. Although the resources allocated for these Year 2 and 3 school visits were minimal, the school visits continued to remain a rich source of information in addressing the potential impacts of the BWLI as they had during the first year. These research team visits were conducted across all BWLI schools and generally included class-room observations as well as interviews with teachers, principals, and other staff. It is challenging to summarize the conditions of the actual observations that were conducted given that the condi-tions of the observations fluctuated widely. In some cases, classes were observed when the teacher knew in advance of the visit. In other situations the researcher would “drop in” on classes about to begin or already underway without the teachers’ direct advance notice. Some observations lasted for full instructional periods and others were only for segments of a class. In many cases, informal interviews with the observed teachers were arranged to address or clarify any specific queries from the observation. In many cases, the informal teacher interview also allowed the teaching staff an op-portunity to express their thoughts and beliefs about the program, their students, or the technology programs in more candid way than the formal surveys. Although these sentiments and expressions

inTASC REPORT: Berkshire Wireless Learning Initiative, Final Evaluation Report, March 200927
were not formally or systematically analyzed, they provided the research team with valuable insights and perspectives to further explore using the other research tools/inquiry methods, particularly the data analyses of the survey. Specific examples and formative results detailing how the classroom observations were used during the evaluation period can be found in the April 2007 report, Berk-shire Wireless Learning Initiative Evaluation Implementation Notes and Concerns (Bebell, 2007).
Principal/School Leadership Interviews
In addition to the classroom observations and teacher interviews, interviews were also conducted with each BWLI principal as well as with various support staff since the time of the original deployment. Although much of the data was used for formative reflection during the deployment period, the school principal interviews also served as an important formative data point reflecting the experience of school-level leadership concerning many of the program outcomes. In other words, the principals were all asked to reflect on their experiences not only implementing the program, but were also asked to think critically about the impacts of the program.
Principal interviews were conducted in person with each building leader approximately three to four times during each of the three years of the program and again on two occasions following the final year of the original deployment timeline.
Most interviews lasted between 20 and 30 minutes and were often conducted following class-room observations. After each round of principal interviews, field notes were summarized across the schools and follow-up questions, clarifications, and queries were also handled via email and phone.
The content and nature of the principal interviews continuously changed and adapted to suit the needs of the evaluation. For example, in some cases, specific interview scripts were used to elicit specific responses and allow for cross-school comparison while in other cases the interviews were more loosely structured to allow principals more latitude in the interviews content and to specifi-cally express specific practices or outcomes within their setting.
In late 2008, after the completion of three years of 1:1 computing, a final principal/school leader interview was conducted in each of the participating schools. This final formal interview followed a scripted interview protocol to ensure that every respondent would address the same questions and issues. A portion of the final interview content consisted of a series of discrete short response ques-tions based on the teacher survey which concerned the impacts of the program at each school. The interview also included a number of opportunities for the school leader to reflect more widely on their experiences in a series of open response questions concerning the deployment, management, obstacles, and impacts of the BWLI program. Summarized results from the principal/school leader-ship survey are shared in the results and discussion sections of this paper.

inTASC REPORT: Berkshire Wireless Learning Initiative, Final Evaluation Report, March 200928
Exploring the Impact of 1:1 Computing on Student Achievement
School and Student Level MCAS Analyses
Given that the first targeted outcome of the BWLI program was to “enhance student achieve-ment” a central component of the evaluation is the investigation of 1:1 participation and technology use on student test scores. Despite the massive investments that federal, state, and local agencies devote to educational technology expenditures and initiatives, there remain only a few empirical studies that explore the relationship between students’ and teachers’ use of technology and their performance on measures of student achievement. This lack of rigorous research is particularly conspicuous at a time when nearly all educational ideas and programs are being evaluated by policy makers and educational leaders for their impact on standardized local and state level assessments.
One of the biggest reasons for this lack of research is the inherent complexity and difficulty in-volved in measuring emerging technology practices in 1:1 settings and associating them with valid measures of student achievement. Past research focusing only on participation in a 1:1 program may fail to account for important differences and distinctions between how individual teachers and students use technology. For example, one classroom teacher and their respective classes may effectively use in a way that may be positively impacting student achievement. However, this edu-cational practice is not shared with the other schools teachers whose students show no difference on measures of their achievement during this same period. When both classrooms are merged and considered equally across a 1:1 setting, the evidence of improved student achievement is marginal-ized. In other words, by only looking if average scores or grades improve in laptop settings, a lot of potentially valuable data may be overlooked. Given the exploratory and varied nature of 1:1 initia-tives, the current evaluation of student outcomes used three years of data collected from student surveys that was matched and merged with students’ individual state assessment results to explore how students varied technologies practices have impacted student achievement. Given that there was no commonly shared assessment across all five of the BWLI schools, the Massachusetts Com-prehensive Assessment System (MCAS) was deemed the best available measure outcome for student achievement.
One of the challenges in determining the impact of educational technology (or anything else for that matter) on student achievement is that student achievement means different things to different people. To many classroom teachers, student achievement can mean how well their students inter-act in class and on content specific teacher-created tests. To policy makers, student achievement is increasingly defined as a students’ performance on a state-sanctioned standardized assessment. In addition to the use of standardized tests in summarizing academic performance for policy discus-sions, standardized tests, such as the MCAS also offer a convenient and potentially meaningful measure of student achievement that is shared across all public schools within a state. Although the subject offerings and grade requirements have changed under different federal and state administra-tions and policies, the MCAS has been the de facto measure of student achievement in Massachu-setts since its debut in 1998. As the state’s most important and publicized metric of school quality, student MCAS scores are taken seriously by school and district leadership as well as teachers and students within each school. As we will later discuss in the later sections of this paper, the MCAS is

inTASC REPORT: Berkshire Wireless Learning Initiative, Final Evaluation Report, March 200929
by no means the perfect outcome measure for our current research, but given a lack of alternatives, we feel the MCAS is highly suited for this purpose since it is the most widely accepted measure of student achievement for both education and policy communities available.
The current investigation will employ MCAS results to show at least one aspect of the impacts of the BWLI program and 1:1 computing on students and schools. In our exploration of student achievement, we will consider results from a variety of perspectives and approaches including both school averages and individual student results for those 7th and 8th grade students who attended BWLI schools and experienced 2 years of 1:1 student computing. Specifically, the current investiga-tion will address:
trends in schools overall MCAS performance over time compared to the comparison •schools and state trends during this same period, and
which, if any, of students technology uses in school or at home have impacted •student-level performance on various MCAS measures (while statistically controlling for students pre-BWLI academic performance using prior MCAS performance)
School level MCAS results and performance indicators from 1998 to 2008 were accessed from the Massachusetts Department of Education while student level data was provided to the research team directly from the BWLI and comparison schools for all participating students for 2008, 2007, and 2006. To facilitate our analyses of how different types of use impacted student test performance, grade 7 and 8 student survey results across all BWLI and comparison students were merged with the item-level MCAS data. Grade 6 results were not analyzed as 6th grade students had the least exposure to the BWLI program and 1:1 computing. Again, because only public school students participated in the MCAS as a mandatory state assessment, only results from the three BWLI pub-lic schools (Conte, Herberg, and Reid) and the two comparison schools (North and South) were available for these analyses. Thus, for each grade level, a new data set was created by the research team that included both the student’s MCAS results and demographic information as well as their BWLI student survey on technology use and practices. So, for each 7th and 8th grade student who completed the MCAS and the BWLI survey, the relationship between various technology uses and various outcome/student achievement measures could be examined. Since nearly all students in the BWLI public schools completed both the MCAS and the BWLI student survey in Spring 2008, we are capable of performing our investigation with a highly representative sample of BWLI student participants. Table 10, on the next page, summarizes the MCAS subject tests schedule used by the state across various years of the BWLI program.

inTASC REPORT: Berkshire Wireless Learning Initiative, Final Evaluation Report, March 200930
Table 10: Summary of student level MCAS administration results across subjects and BWLI student laptop deployment schedule
Table 10 provides a simple list of what outcomes measures were available for each student cohort (grade 7 and grade 8) in our student level analyses of achievement. In the final year of the BWLI program, grade 8 students completed the Spring 2008 MCAS testing after nearly two full school years participating in the 1:1 student laptop program (throughout grade 7 and 8). The grade 8 MCAS tested students in English language arts (ELA), math, and science. In ELA, there were 36 multiple-choice items and 4 open-response items split between two strands, Reading and Literature, and Language. In math, there were 30 multiple-choice items, 4 short-answer items, and 5 open-response items. These were split between five content strands: Number Sense and Operations; Patterns, Relations, and Algebra; Geometry; Measurement; and Data Analysis, Statistics and Probability. In science, students had 34 multiple-choice items and 5 open-response items. They were divided into four strands: Earth and Space Science, Life Science, Physical Sciences, and Technology/Engi-neering.
Table 10 also shows that in the final year of the BWLI program, grade 7 students also completed the Spring 2008 MCAS after nearly two full years of 1:1 computing (throughout their 6th and 7th grade). Grade 7 students were tested in ELA and math. In ELA, there were 36 multiple-choice items and 4 open-response items. Additionally, the ELA grade 7 test includes an extended writing exercise which is scored by the state and yields two scores: a topic and idea development score and a standard English conventions score. In math at Grade 7, there were 29 multiple-choice items, 5 short-answer items, and 5 open-response items. For both the 7th grade ELA and math exams, the content strands were the same as those reported above for Grade 8.
In addition to looking at school level trends in student performance both before and during the laptop implementation period, the current investigation will use these student-level MCAS data at each grade level with student survey responses to determine the relationship between technol-ogy practices and student achievement. These student level analyses will employ linear regression techniques and use students most recent MCAS scores (Spring 2008) as the dependent or out-
Grade 6
Cohort 2
Cohort 3
Cohort 4
Cohort 1
Math, ELA, ELA Writing Prompt
ELA Reading Comprehension, Math
Math, ELA, Science
Grade 7 Grade 8
2005/2006school year
2006/2007school year
2007/2008school year
MCAS Subjects by Grade
MCAS
MCASMCAS
MCASMCAS

inTASC REPORT: Berkshire Wireless Learning Initiative, Final Evaluation Report, March 200931
come variable. Students individual MCAS scores from the pre-BWLI test administration (for ex-ample, when the 8th grade students were in Grade 6) will be employed as a independent variable to account (or control) for their prior level achievement. For both of the outcome measures and con-trol variables, MCAS raw scores will be used for each subject area of the assessment. Since the students in this analysis are clustered within schools, it would make sense to do multilevel regres-sion analysis as it can be assumed that students within the same school may have correlated errors (Luke, 2004). However, since there are a limited number of BWLI and comparison public schools (n=5), there would not be sufficient power to analyze the data reliably.
Computer Writing Assessment
Like the rest of the MCAS, the grade 7 ELA open-ended writing assessment is completed entire-ly on paper and pencil, which research now suggests may be unfairly underestimating the true writ-ing ability of students who have grown accustomed to composing and editing text on a computer (Russell & Plati, 2001; Russell, 1999; Russell & Haney, 1997). In other words, the mode of the state test administration (paper and pencil) may be having a negative impact on student performance for those very students who have adopted and are using the new learning techniques ushered by the 1:1 laptop program. In response to this growing body of literature suggesting that paper-based assess-ments, like the MCAS, may be poorly suited for accurately measuring the writing quality of students who may be more accustomed and experienced using Word processors and technology, a study of students computer writing ability was incorporated into Year 3 of the BWLI evaluation. Specifically, in Spring 2008, 7th grade students across all participating BWLI schools were randomly assigned at the classroom or student level (depending on school) to complete a mock-MCAS open response assessment using either their BWLI laptops or the traditional paper/pencil required by the state.
Given that each of the three public schools had a great deal of experience administering and interpreting the aforementioned 7th grade ELA MCAS open-response writing prompt, a publicly-released writing prompt from a previous (2006) MCAS ELA assessment was selected. Since the pub-lic schools were quite familiar with this assessment, adapting it to allowed computer access for some test takers was not a major challenge. However, given each schools’ past experience with official and practice MCAS sessions, interviews with ELA teachers and school leadership were conducted to ensure that each schools 7th grade student population had no prior familiarity or experience with the specific writing prompt to be used in our computer writing assessment. It was determined through this interview process that no 7th grade students in any of the BWLI settings in 2008 had any prior experience with the 7th grade ELA writing prompt originally included on the 2006 MCAS:
After-school activities give students an opportunity to do something they enjoy outside the classroom. Some students play sports, while others might enjoy acting or other activities.
Your school wants to add some new after-school activities and is taking suggestions from students. In a well-developed composition, suggest a new after school activity and explain why students might enjoy it.

inTASC REPORT: Berkshire Wireless Learning Initiative, Final Evaluation Report, March 200932
The open ended writing assessment provided students with a 45-minute session to draft a written composition; then, in a separate 45 minutes administration session, students completed a final composition based on their draft. Again, the chief difference between the actual MCAS admin-istration of the ELA writing assessment and the BWLI computer writing study conducted in Spring 2008 was that in our study students were randomly assigned to complete the assessment using either their BWLI laptop or using paper and pencil. Before the writing study, rosters containing the names of all of their 7th grade students which were collected and collated by student homeroom and ELA teacher in each BWLI school.
Although the original study design was to randomly assign testing conditions (computer vs, paper) at the student level, the task of simultaneously re-assigning hundreds of students to differ-ent testing classrooms resulted in the two Pittsfield public schools randomly sampling their in-tact homerooms. In other words, in these settings in-tact homerooms of 7th grade students were randomly assigned to one of the two potential testing conditions. Although of weaker methodologi-cal design, the random assignment of intact classroom was not seen as a major drawback to the overall study design since (1) student assignment to the homerooms in these schools was largely random or alphabetic and (2) the research team could additionally control statistically for differ-ences in students’ non-laptop writing performance using the state 2008 MCAS results. Indeed, since all participants in our computer writing study would be taking the actual paper-based MCAS writing assessment later in the school year, a higher proportion of students (approximately two-thirds) were randomly assigned to complete the BWLI computer writing study in the laptop setting. The breakdown of student assignment to the computer and paper testing conditions for the BWLI computer writing study is detailed across the four participating schools in Table 11, below.
Table 11: Student assignment to testing conditions for the Spring 2008 BWLI computer writing study across BWLI schools
School Name Condition # Students % of 7th grade population
Conte Middle SchoolComputer 50
69%Paper 26
Herberg Middle SchoolComputer 144
90%Paper 45
Reid Middle SchoolComputer 85
67%Paper 56
St. MarkComputer 30
83%Paper 14
TotalComputer 310
Paper 141

inTASC REPORT: Berkshire Wireless Learning Initiative, Final Evaluation Report, March 200933
As Table 11 shows, a total of 310 BWLI 7th graders were assigned to complete the computer writing study in laptop conditions (or 68.7% of all 451 participating students) while 141 students completed the assessment using traditional paper/pencil conditions (31.3%). It should be noted that despite the fact that St. Mark students and teachers had no prior experience with the state assessment, they were enthusiastic participants in the computer writing study. Thus, a total of 451 7th grade students completed the computer writing study in Spring 2008, after students had laptop access for most of their 7th and 6th grade school years. Given no make-up period was allowed, the percent of students participating in the BWLI assessment was diminished by student absences and testing exemptions. However, the large majority of the 7th grade population participated in the writing study.
Testing materials and directions were adapted from the state’s for both the paper and computer testing classrooms and distributed across each school prior to the assessment. Specifically, proctor-ing teachers and students within each setting were provided paper directions, scripted instructions and student rosters. Directions for the paper-learning conditions were nearly identical to those of the state, while the directions for the laptop conditions specified that all spell-checking, grammar-checking and other automated features of Microsoft Word (students most commonly used writing program) be temporarily turned off and/or removed for the duration of the assessment to ensure the only substantive difference between the computer and paper environments was the mode of test administration. All other testing circumstances (time, resources, directions, scoring criteria, etc.) were held exactly the same to ensure a realistic and meaningful testing experience as well as to ensure valid results. Copies of all directions and materials used in the BWLI computer writing study are available at www.bc.edu/bwli.
The completed copies of student paper-and-pencil essays were collected and sent in pre-paid mailers to the evaluation team while computer created student essays were uploaded to teacher computers (via teacher drop boxes, file transfers, or as email attachments) and then either burned to CDR and mailed to the evaluation team or sent via email. In addition, USB-Flash drives were provided to classroom proctors in the laptop settings for saving electronic versions of student essays directly from students’ computers.
To eliminate any later bias inherent in the paper or computer formatted essays when being scored, a team of six trained education undergraduate students at Boston College were recruited and trained to electronically input each of 141 paper essays (including all student mistakes, typos, etc.) into Microsoft Word. Once all the paper essays were successfully input into an electronic for-mat, a second recruited team of 8 Boston College undergraduate students completed formal train-ing and reliability testing for use of the states coding rubric to score the 7th grade essays.
Training for the eight essay scorers took place over two days and closely followed the same detailed instructions and procedures used by the state’s testing contractor outlined in “Ensur-ing Technical Quality: Policies and Procedures Guiding the Development of the MCAS Tests” (Massachusetts Department of Education, 2008) as well as the additional scoring information found at the online resource NCS Mentor for MCAS ELA Composition: http://www.ncsmentor.com/. In addition to the general descriptions, the training also provided anchor papers and benchmark

inTASC REPORT: Berkshire Wireless Learning Initiative, Final Evaluation Report, March 200934
papers for each category. These anchor and benchmark papers provide concrete examples of each performance level. The anchor and benchmark papers were first introduced to raters during the common scoring training session and were available to essay scorers throughout the scoring pro-cess. In addition, to ensure accurate and consistent scoring each trained essay scorer completed a qualifying set of ten example essays during the training session. Before an essay scorer could begin rating the BWLI essays, they first needed to meet or exceed the state’s minimum accuracy rate, as described below:
To be eligible to score operational MCAS responses, scorers were required to demonstrate scoring accuracy rates of minimum 70 percent exact agreement and at least 90 percent exact-or-adjacent agreement. In other words, exact scores were required on at least seven of the Qualifying Set responses and either exact or adjacent scores were required on a total of nine of the 10 responses; scorers were allowed one discrepant score, as long as they had at least seven exact scores. (Massachusetts Department of Education, 2008)
After completion of the training, each of the eight scores met or exceed the state requirements for scoring open-response essays, Thus, every essay scorer in the BWLI computer writing study received the same training offered by the state and the testing contactor and were qualified to use the same rating criteria.
After this training, each member of scoring team was provided a random sample of student essays to score. Each essay was scored on two dimensions: Topic Development and Standard English Conventions. The scale for Topic Development ranged from 1 to 6 and the scale for English Conven-tions ranged from 1 to 4, with one representing the lowest level of performance for both scales. The rubrics and range of scores for the Topic Development score and the Standard English Conventions scores and are summarized on the next page in Table 12.

inTASC REPORT: Berkshire Wireless Learning Initiative, Final Evaluation Report, March 200935
Table 12: MCAS 7th grade open response scoring rubric for Topic/Idea Development and Standard English Conventions
Score Topic Development English Standards
1
Little topic/idea development, •organization and/or detailsLittle or no awareness of audience •and/or task
Errors seriously interfere with communication; •andLittle control of sentence structure, grammar •and usage, and mechanics
2
Limited or weak topic/idea development, •organization, and/or detailsLimited awareness of audience and/or •task
Errors interfere somewhat with •communication; and/orToo many errors relative to the length of the •essay or complexity of sentence structure, grammar and usage, and mechanics
3
Rudimentary topic/idea development •and/or organizationBasic supporting details•Simplistic language•
Errors do not interfere with communication; •and/orFew errors relative to the length of the essay or •complexity of sentence structure, grammar and usage, and mechanics
4
Moderate topic/idea development and •organizationAdequate, relevant details•Some variety in language•
Control of sentence structure, grammar and •usage, and mechanics (length and complexity of the essay provide opportunity for students to show control of standard English conventions)
5
Full topic/idea development•Logical organization •Strong details•Appropriate use of language•
6Rich topic/idea development•Careful and/or subtle organization•Effective use of language•
Each essay was independently scored by two raters and assigned an official score in each area; the two scorers’ scores for each area are combined to report a total score range from 2 to 12 for Topic Development and a total score range from 2 to 8 for Standard English Conventions. Returned essays and their scores were provided back to each of the schools within six weeks of the exercise. Student scores were also input into our master data set where open-response scores from the computer writ-ing exercise could be examined with official MCAS results and survey results.
In theory, the random assignment of students to either testing condition should serve to elimi-nate potential pre-existing differences among the two groups of students and that any differences observed between the two groups in the computer writing study are a sole result of the testing for-mat. However, to even better control for pre-existing differences between the computer and paper students, 7th grade open response scores from the “official” paper-and-pencil ELA MCAS are used in the our statistical models as a covariate to represent students writing ability using traditional paper and pencil. In other words, with official writing data for each student from the 2008 paper-based state assessment contrasted with the results from the 2008 BWLI computer writing study, we

inTASC REPORT: Berkshire Wireless Learning Initiative, Final Evaluation Report, March 200936
can more fully explore the impacts of students use of computers in the MCAS writing assessment. Using a general linear model, we statistically “controlled” for paper-tested writing scores while evaluating the impact of a very similar writing assessment where student employed their laptop and word processor rather than paper/pencil.

inTASC REPORT: Berkshire Wireless Learning Initiative, Final Evaluation Report, March 200937
ResultsGiven the wide variety of data sources employed in the current study, results from each mode
of inquiry are presented individually. First, results from the teacher survey are summarized. Next, results from the principal/school leader interviews, classroom observations, and student drawings summarized. Finally, student survey results are detailed before an examination of the results from the analyses of student achievement. Following the individual results section, a collection of the principle BWLI program findings are summarized before the Discussion section.
Teacher Survey Results: Adoption and Use of Technology
In the next series of figures and tables, teachers’ use of technology is explored across BWLI schools and compared to a sample of comparison non-1:1 teachers. Additionally, survey data is pre-sented across four different teacher survey administrations, which have collected and summarized teacher practices and attitudes since the beginning of the first phase of 1:1 student computing in January 2006. Given teachers direct experience as both a ‘participant of ’ and potential recipient of any positive outcomes resulting from the initiative, we strongly feel that the data collected across the teacher survey is worthy of the considerable attention and space we devote to it here. In addi-tion, the exemplary response rates during the final rounds of teacher surveying insures that the data presented is a nearly direct representation of the entire populations of participating teachers. The summary of teachers’ reported technology use data begins with Table T1, on the next page, which illustrates the frequency of teachers’ use of technology during the 2008–2009 school year.

inTASC REPORT: Berkshire Wireless Learning Initiative, Final Evaluation Report, March 200938
Table T1: Frequency of teachers’ use of technology during the 2007–2008 school year (June 2008)
Comparison Schools
BWLI Schools
Mean Difference
Create and/or maintain web pages 6.2 57.0 50.8*
Use a computer to deliver instruction to your class 28.7 57.3 28.6*
Use a computer to help students better understand a concept 19.6 46.3 26.7*
Use a computer to present information to your class 22.6 47.4 24.8*
Perform research and lesson planning using the Internet 61.2 85.6 24.4*
Assess students using a computer (including a test, quiz, or practice test) 22.0 40.5 18.5
Use a computer to model relationships and/or functions 6.4 20.8 14.3
Create WebQuests or build the Internet into a lesson 6.2 19.9 13.7
Adapt an activity to students’ individual needs using computers 27.3 31.2 3.9
Use a computer to communicate with teachers, parents, or administrators 121.1 120.9 –0.2
Create a test, quiz, or assignment using a computer 64.4 60.3 –4.0
Prepare or maintain IEPs using a computer 21.2 15.8 –5.3
Make handouts for students using a computer 83.7 69.6 –14.2
Note: * denote statistically significant differences (Unequal variances; p.<.05)
Table T1 shows the comparison of BWLI teachers’ frequency of technology use to that of com-parison school teachers measured in the June 2008 survey administration. Overall, the average BWLI teacher used technology frequently for a wide variety of professional applications during the 2007–2008 school year, the third year of the BLWI implementation. Table T1 shows that for the 180 potential days in the academic year, BWLI teachers reported using a computer to communicate with teachers, parents, or administrators on 120 of those days. As widely reported in the literature, another frequent application of technology for teachers was “performing research and lesson plan-ning using the Internet” which occurred about every other day, or 85.6 times across the 2007–2008 school year. Other frequently occurring uses cited by BWLI teachers included the use technology to “create and/or maintain web pages”, “make handouts for students”, “deliver instruction”, and “create a test, quiz or assignment using a computer” all of which occurred on more than 50 school days in Year 3 of the program.
Comparing the averages of the BWLI teacher use with comparison teacher use found a number of statistically significant differences. In most categories of use the BWLI teachers reported more frequent technology use then the comparison teachers. The largest difference was found for “creat-ing and/or maintaining web pages” which had occurred almost third school day (57.0 times per

inTASC REPORT: Berkshire Wireless Learning Initiative, Final Evaluation Report, March 200939
year) across the BWLI teachers and only 6.2 times per year for the comparison school teachers. Other statistically significant differences where BWLI teachers had used technology more frequent-ly then the comparison school teachers during the 2007–2008 school year included: “delivering instruction”, “helping students better understand a concept”, “presenting information to your class”, and “performing research and lesson planning using the Internet”. Conversely, there were also a number of surveyed technology uses where the comparison group teachers reported more frequent technology use than the BWLI teachers in the June 2008 survey. “Using a computer to communi-cate with teachers, parents, or administrators”, “creating a test, quiz, or assignment”, “preparing or maintaining IEPs” and “making handouts for students using a computer” all occurred somewhat more frequently, on average, for the comparison group teachers than the BWLI teacher respon-dents. However, these differences were not found to be statistically significant. Table T2 continues the exploration of the teacher technology use during the 2007–2008 school year by displaying the average frequency of a number of technology applications for teachers across the BWLI and com-parison schools.
Table T2: Frequency of teachers’ use of technology during the 2007–2008 school year by school (June 2008)
North South Conte Herberg Reid St. Mark
Use a computer to deliver instruction to your class 23.2 33.0 65.4 56.3 50.5 83.3
Prepare or maintain IEPs using a computer 24.2 18.6 15.9 13.9 19.0 0.0
Adapt an activity to students’ individual needs using computers 34.7 21.5 33.6 34.2 27.6 14.3
Make handouts for students using a computer 85.0 82.8 83.0 62.1 64.0 114.3
Create a test, quiz, or assignment using a computer 65.0 63.9 68.4 53.0 63.0 44.8
Perform research and lesson planning using the Internet 63.3 59.5 85.4 81.3 88.8 103.8
Create WebQuests or build the Internet into a lesson 6.1 6.2 20.5 15.7 24.2 14.0
Use a computer to present information to your class 16.8 27.3 56.7 45.5 43.4 35.5
Use a computer to help students better understand a concept 16.2 22.3 55.0 56.2 30.5 36.0
Use a computer to model relationships and/or functions 4.0 8.3 28.6 22.7 13.0 21.5
Create and/or maintain web pages 12.7 0.7 79.8 54.4 40.1 97.5
Assess students using a computer (including a test, quiz, or practice test) 34.7 11.2 34.8 40.0 46.1 28.3
Use a computer to communicate with teachers, parents, or administrators 106.2 132.7 121.3 122.5 127.2 7.3

inTASC REPORT: Berkshire Wireless Learning Initiative, Final Evaluation Report, March 200940
Looking across the BWLI schools in Table T2, patterns emerge showing which schools’ teach-ers were using technology for what purposes during the third year of the BWLI implementation. For some technology applications, there was fairly little difference observed across the four BWLI schools. For example, the number of times teachers reported, on average, to “use a computer to pres-ent information to your class” occurred between 36 and 56 times for all BWLI schools compared to 16.8 and 27.3 times for the non-BWLI survey respondent. Similarly, the frequency with which teachers “use a computer to help students better understand a concept” occurred between 30.5 and 56.2 times per year across the BWLI schools while this activity occurred less frequently in the com-parison schools (16.2 and 22.3 times). When looking across the BWLI schools at the other teacher technology applications, patterns of more frequent or less frequent use are found for individual schools. For example, the widest variation in teachers’ frequency of technology use was observed for the “use of a computer to communicate with teachers, parents, or administrators” which was reported to occur 127 times per year by Reid teachers but less than 10 times per year by the St. Mark teachers. St. Mark teachers reported the most frequent “use of a computer to deliver instruction to your class” which happened 83.3 times during the 2007-2008 school year compared to about 50 times a year in the Pittsfield public schools and 65 times at Conte. Teachers’ frequency of “creating and/or maintaining web pages” was greatest for the Conte and St. Mark teachers who performed this activity 79.8 and 97.5 times respectively during the 2007–2008 school year compared to 54 times at the Herberg school and 40 times at the Reid school.
Table T1 (presented on page 37) shows that BWLI teachers typically used technology more frequently across a wide variety of reporting categories than teachers from the comparison school. Table T2, above, shows that there was often substantial variation in teachers’ technology use across the BWLI schools. Thus, after three years of the teacher laptop implementation and the BWLI pro-gram there is clear evidence that teachers have adopted and maintain frequent and widespread uses of technology and computers in their teaching practice. However, the patterns of use vary across each school indicating that teachers and schools have implemented and applied the program to suit their own educational needs. Table T3 continues the exploration of BWLI teachers’ adoption and use of technology since the beginning of the BWLI program with a summary of teachers’ use of technology use collected from the January 2006, May 2006, May 2007, and June 2008 survey administrations.

inTASC REPORT: Berkshire Wireless Learning Initiative, Final Evaluation Report, March 200941
Table T3: BWLI Teachers’ use of technology over time
Jan. 2006 May 2006 May 2007 June 2008
Use a computer to deliver instruction to your class 22.7 58.8 59.2 57.3
Prepare or maintain IEPs using a computer 17.0 9.0 18.4 15.8
Adapt an activity to students’ individual needs using computers 13.2 32.2 28.2 31.2
Make handouts for students using a computer 51.6 50.8 60.7 69.6
Create a test, quiz, or assignment using a computer 49.0 46.8 56.0 60.3
Perform research and lesson planning using the Internet 56.9 73.9 80.6 85.6
Create WebQuests or build the Internet into a lesson 8.8 20.3 21.9 19.9
Use a computer to present information to your class 23.9 56.7 47.4 47.4
Use a computer to help students better understand a concept 23.6 50.2 45.2 46.3
Use a computer to model relationships and/or functions 13.0 29.4 19.3 20.8
Create and/or maintain web pages 26.5 na 78.6 57.0
Assess students using a computer (including a test, quiz, or practice test) 24.1 na 43.6 40.5
Use a computer to communicate with teachers, parents, or administrators 89.6 105.4 111.2 120.9
Table T3 shows BWLI teachers’ reported use of educational technology over four survey admin-istrations since January 2006 when only teachers had recently received laptops and no students had been provided laptops yet. For the majority of surveyed technology applications, teachers reported a large increase in their use of technology during the last six months of the 2005–2006 school year. Comparing the January 2006 averages with the May 2006 averages, teachers’ frequency of “prepar-ing or maintaining IEPs using a computer”, “making handouts for students using a computer” and “creating a test, quiz, or assignment using a computer” showed relatively small decreases while all other surveyed applications increased. For example, BWLI teachers reported that they had used a computer to deliver instruction to their class 22.7 times per year when surveyed in January 2006. Five months later, when 7th grade students now had access to laptop computers, teachers’ frequency of delivering instruction using a computer increased to nearly 60 times per year, or once every three days during the 2005–2006 academic year. In the 2006–2007 school year, the frequency of computer use for the delivery of instruction increased nominally while many of teachers technology uses as-sociated with lesson planning increased more substantially (“make handouts for students”, “create a test, quiz, or assignment”, “perform research and lesson planning using the Internet”). In addition, a number of instructional technology uses that were reported by teachers to increase in May 2006 then decreased somewhat during the 2006–2007 school year, including the use of a computer “to present information to your class”, “help students better understand a concept”, and “model relation-ships and/or functions”.

inTASC REPORT: Berkshire Wireless Learning Initiative, Final Evaluation Report, March 200942
Thus, over the first two years of the BWLI program, participating teachers generally reported substantial increases in all uses of educational technology. However, uses of technology for plan-ning and preparing lessons continued to increase throughout the second year of the study while instructional uses (i.e. students’ direct experience of teachers’ technology use) decreased slightly in Year 2 of the program to more closely resemble the original January 2006 results. Previous research has shown the important role of the teacher in determining how and when students will use their laptops while in school. Comparing the June 2008 teacher technology use results with the May 2007 results show that teachers’ practices changed relatively little between the second and third year of the BWLI implementation. Across nearly most of the surveyed technology uses, BWLI teachers were consistent in their adoption and use of most technology applications in their work across the last two years of the laptop program. In the third year of the program BWLI teachers reported on average that they spent slightly less time using a computer to create and maintain web pages than in past surveys. However, professional uses of technology to support teaching continued increasing somewhat throughout the third year of the BWLI program with average reported increases reported for “using a computer to communicate with teachers, parent and administrators” (120.9 times), “make handouts for students” (69.6 times), “create a quiz, test or assignment using a computer” (60.3 times), and “perform research and lesson planning using the Internet” (85.6 times).
The teacher survey also asked teachers to reflect on how frequently they asked their students to create work and products using technology. Table T4, below, shows a comparison of the frequency with which BWLI and comparison school teachers assigned their students to create products using technology during the 2007-2008 survey administration.
Table T4: Comparison of BWLI and comparison teacher frequency of assigning students to create products using technology during the 2007–2008 school year (June 2008)
Comparison Schools
BWLI Schools
Mean Difference
Prepare for a standarized test or take practice tests 12.4 22.5 10.0*
Multimedia projects with technology 3.5 11.6 8.2*
Web pages, web sites, or other web-based publications 2.8 9.3 6.5*
Pictures or artwork with technology 8.4 14.1 5.7
Stories or books with technology 6.3 11.4 5.1
Reports and term papers with technology 7.5 11.1 3.6*
Graphs or charts with technology 5.3 7.1 1.8
Videos or movies 3.0 4.0 1.0
Total 49.1 90.9 41.8*
Note: * denote statistically significant differences (Unequal variances; p.<.01)

inTASC REPORT: Berkshire Wireless Learning Initiative, Final Evaluation Report, March 200943
Table T4 displays a comparison of the frequency which BWLI and comparison teachers as-signed their students to create products using technology during the 2007–2008 school year. In the June 2008 survey teachers were asked to reflect on the past year and to estimate the number of times they had asked their students to produce various products using technology. On average, BWLI teachers more regularly required their students to create products using technology during the 2007–2008 school year, the third year of the BLWI implementation. Table T4 shows that for the 180 potential days in the 2007–2008 academic year, BWLI teachers reported having their students use technology to create a product on 90.9 occasions, compared to 49.1 times in the comparison schools. The most frequent products assigned by BWLI teachers for their students to complete using technology were “prepare for a standardized test or take practice tests” (22.5 times per year), and “pictures or artwork” (14.1 times per year).
Comparing the averages of the BWLI teachers with comparison teachers across each of the different student uses revealed four statistically significant differences: “prepare for a standardized test or take practice tests”, “multimedia projects with technology,” “web pages, web sites, or other web-based publications” and “reports and term papers” although BWLI teachers more frequently required their students to create products using technology across all surveyed categories. Table T5 continues the exploration of the teacher technology use during the 2007–2008 school year by displaying BWLI and comparison teachers’ frequency of assigning students to create products using technology across the BWLI and comparison schools.
Table T5: Frequency of teachers’ assignments of technology based student products during the 2007–2008 school year by school (June 2008)
North South Conte Herberg Reid St. Mark
Reports and term papers with technology 9.5 5.9 9.8 12.7 10.5 8.0
Multimedia projects with technology 5.1 2.2 19.2 13.3 4.4 11.8
Web pages, web sites, or other web-based publications 3.7 2.1 6.2 9.7 11.2 9.0
Pictures or artwork with technology 9.6 7.3 11.7 14.0 16.1 12.0
Stories or books with technology 6.9 5.8 13.3 11.7 10.1 4.5
Graphs or charts with technology 4.4 6.0 7.0 8.2 5.6 11.5
Viedos or movies 1.2 4.5 6.8 3.4 2.4 3.5
Prepare for a standardized test or take practice tests 7.8 16.2 28.2 22.3 19.8 2.8
Total 48.1 50.0 102.2 95.2 80.1 63.0

inTASC REPORT: Berkshire Wireless Learning Initiative, Final Evaluation Report, March 200944
Based upon the June 2008 survey results shown in Table T5, patterns of different technology are evident across the different BWLI schools. Overall, when the variety of student products are summed, Conte and Herberg teachers report the most frequent use of technology by students to create products while Reid and St. Mark report the least frequent use of the BWLI schools. Teach-ers across both comparison schools (North and South) reported less frequent creation of student products using technology than any BWLI school.
Looking across the individual student products, a number of interesting use patterns emerge. Overall, the widest variation of technology enabled student products was observed for the use of a computer to “prepare for a standardized test or take practice tests” which Conte teachers reported as one of the most frequent student uses listed (28.2 times per year) while St. Mark teachers reported this as their least frequent technology use (2.8 times per year). For another example, Herberg teach-ers reported greater frequency of assigning their students “reports and term papers with technol-ogy” than at any other BWLI school. Similarly, Conte teachers reported assigning their students to create and work on “multimedia projects with technology” nearly twice as frequently as teachers in the other BWLI schools. Conversely, Reid teachers reported very rarely having their students use technology to create and work on “videos or movies ” and “multimedia projects.” Despite these variations across the BWLI schools, BWLI teachers nearly always reported more frequent use of technology by students for products than those teachers surveyed at the comparison schools. Table T6 continues the exploration of BWLI students’ use of technology to create products since the be-ginning of the BWLI program with a summary of such use averaged from the January 2006, May 2006, May 2007, and June 2008 survey administrations.
Table T6: Frequency of teachers’ assignments of technology based student products over time
Jan. 2006 May 2006 May 2007 June 2008
Reports and term papers with technology 2.9 12.2 16.1 11.1
Multimedia projects with technology 2.7 11.5 11.0 11.6
Web pages, web sites, or other web-based publications 2.0 13.1 10.8 9.3
Pictures or artwork with technology 4.2 6.7 14.2 14.1
Stories or books with technology 0.4 4.7 9.7 11.4
Graphs or charts with technology 5.5 7.3 10.8 7.1
Total 17.7 55.6 72.6 64.6
Looking across all types of surveyed products in Table T6, we see that there has been a sub-stantial and largely steady increase in the total frequency with which BWLI teachers assign their students to complete projects and create products using technology between January 2006 and May 2007, when most uses stabilized or decreased slightly for the third and final year of the initiative.

inTASC REPORT: Berkshire Wireless Learning Initiative, Final Evaluation Report, March 200945
For example, in the January 2006 survey, BWLI teachers reported having their students create prod-ucts using technology on 17.7 occasions. Six months later, including the 7th grade student laptop deployment, BWLI teachers report a substantial increase with students creating products on 55.6 occasions during the 2006–2007 school year. By the end of the second year of the BWLI deployment (May 2007), teachers again reported an increase in the frequency of technology-enabled student products with the average BWLI teacher reporting that their students used technology to create products an estimated 72.7 days over the 2006–2007 school year, a four-fold increase over the origi-nal January 2006 estimates. During the 2007–2008 school year, the general frequency of use de-creased slightly in the BWLI schools (64.6 occasions) although remained well above 2005–2006 and 2006–2007 levels. Based upon these findings, it is clear that, on average, BWLI teachers had their students use technology with regular frequency in school for a wide variety of purposes throughout the laptop initiative.
Looking at the individual list of student products, the greatest increases over time were reported for student creation of “reports and term papers” which went from under 3 instances a year in the January 2006 survey to over 16 times per year in May 2007 before leveling off to 11 times per year in June 2008. Between the 2006 and 2008 surveys, all measured uses of technology for student products increased including the creation of “pictures or artwork”, “stories or books”, and “graphs or charts” using technology. However, when looking across the three surveys when students had laptops (May 2006 through June 2008), BWLI teachers generally reported that use of technology had been fairly consistent with only small relative changes from year to year.
In general, the second year of implementation saw the highest frequency of uses while Year 3 use (as evidenced by the June 2008 survey) saw a decrease to 64.6 occasions for student products using technology. For example, students’ use of technology to create “graphs or charts” and “web pages, web sites, or other web-based publications” has decreased slightly in the second and third year of the program (May 2007 and June 2008) compared to the May 2006 teacher survey results. Such decreases, however small, are particularly interesting considering that nearly all students had access to individual laptops during the 2006–2007 school year while only 7th grade students had access to laptops when the May 2006 survey was completed by teachers.
Teacher Survey Results: BWLI Teacher Reflections Towards 1:1 Computing
In addition to the frequency and variety of technology use throughout the BWLI years, teachers were additionally asked in the survey to reflect on their experiences and perceptions of 1:1 comput-ing in improving teaching practices and their students learning. In a series of 5-point Likert scaled survey questions (Strongly Agree, Agree, Neither Agree/Disagree, Disagree, and Strongly Disagree) teacher attitudes and beliefs towards 1:1 computing and the BWLI program were addressed after three years of the initiative in the June 2008 survey. Specifically, these survey questions asked teach-ers to consider the broader impacts of the program and to provide their opinion on various aspects of the 1:1 initiative. Table T7 begins the summary of teacher attitudes towards 1:1 computing by addressing the degree to which teachers feel the laptop program has impacted their students.

inTASC REPORT: Berkshire Wireless Learning Initiative, Final Evaluation Report, March 200946
Table T7: BWLI teachers’ response to the statement “My students have benefited greatly from their participation in the 1:1 laptop program” (June 2008)
Conte Herberg Reid St. Mark Total
Srongly Disagree 0% 2% 2% 0% 1%
Disagree 0% 2% 5% 0% 3%
Neither Agree/Disagree 20% 24% 32% 0% 25%
Agree 27% 44% 37% 25% 37%
Strongly Agree 54% 29% 24% 75% 34%
Table T7 shows the frequency of teacher responses summarized across each of the BWLI schools for the statement: “My students have benefited greatly from their participation in the 1:1 laptop pro-gram”. Overall, the majority of BWLI teachers (71%) reported either agreement or strong agreement suggesting teacher sentiment was largely positive in their assessment of the 1:1 programs positive impact on their middle school students. In other words, 71% of BWLI teachers felt that their stu-dents had “benefited greatly” from their participation in the BWLI program. In contrast, only a very small portion of teacher (4% total) disagreed with the statement that students had greatly benefited from their participation in the 1:1 laptop program.
Looking across the BWLI schools, the small degree of negative teacher sentiment was greatest in the Pittsfield public schools where 4% of Herberg staff and 7% of Reid staff “disagreed or “strongly disagreed”. More commonly teachers who did not express positive sentiment expressed an impartial sentiment selecting “neither agree/disagree” from the survey response choices and comprising 25% of all respondents. Table T8, below, further explores teachers’ attitudes towards 1:1 laptop program using June 2008 survey results.
Table T8: BWLI teachers’ response to the statement “My teaching has improved as a result of the 1:1 laptop program” (June 2008)
Conte Herberg Reid St. Mark Total
Srongly Disagree 2% 2% 5% 0% 3%
Disagree 2% 3% 10% 0% 6%
Neither Agree/Disagree 20% 35% 33% 25% 30%
Agree 34% 31% 28% 0% 30%
Strongly Agree 42% 29% 24% 75% 32%

inTASC REPORT: Berkshire Wireless Learning Initiative, Final Evaluation Report, March 200947
Table T8 shows the frequency of teacher responses summarized across each of the BWLI schools for the statement: “My teaching has improved as a result of the 1:1 laptop program”. Overall, the ma-jority of BWLI teachers (62%) reported either agreement or strong agreement suggesting teacher sentiment was largely positive in their assessment of the 1:1 programs positive impact on their own teaching. Put another way, 62% of BWLI teachers felt that their teaching had “improved as a result of the 1:1 program”. Conversely, a small portion of teachers (9% total) disagreed or strongly disagreed with their teaching had improved from the BWLI. Looking across the BWLI schools, the negative teacher sentiment was concentrated at the Reid school where 15% of staff did not agree that the program improved their teaching. However, only a small percentage of teachers (under 5%) at the other participating public schools shared the lack of belief that BWLI improved their teaching. More commonly, teachers who did not express positive sentiment expressed an impartial sentiment selecting “neither agree/disagree” from the survey response choices comprising 30% of all respon-dents. Table T9, below, further explores teachers’ attitudes towards 1:1 laptop program using June 2008 survey results.
Table T9: BWLI teachers’ response to the statement “The impacts of any 1:1 computing program may take many years to be fully understood” (June 2008)
Conte Herberg Reid St. Mark Total
Srongly Disagree 5% 5% 3% 0% 4%
Disagree 10% 9% 9% 25% 9%
Neither Agree/Disagree 21% 20% 32% 25% 25%
Agree 49% 49% 41% 50% 46%
Strongly Agree 15% 17% 15% 0% 16%
Throughout the educational technology literature, there is frequent notation of the extended timeframe needed for technology initiatives such as the BWLI to impact teaching and learning. Earlier BWLI surveys demonstrated that many teacher and students behaviors changed within months of the laptop implementation in many settings, however many of the larger impacts expect-ed from 1:1 initiatives may take substantially longer to realize. Table T9 presents the results of asking BWLI teachers to consider this issue based upon their own experiences. As such, Table T9 presents the frequency of teacher responses summarized across each of the BWLI schools for the statement: “The impacts of any 1:1 computing program may take many years to be fully understood.”
Overall, Table T9 shows that the majority of BWLI teachers (62%) reported either agreement or strong agreement suggesting teachers typically agreed that the impacts of a 1:1 computing program may take many years to be fully understood. Approximately 15% of all BWLI teachers disagreed or strongly disagreed with the statement while 25% of teachers provided a neutral response. Table T10, below, further explores teachers’ attitudes towards 1:1 laptop program using June 2008 survey results, specifically how additional support may have improved the effectiveness program.

inTASC REPORT: Berkshire Wireless Learning Initiative, Final Evaluation Report, March 200948
Table T10: BWLI teacher attitudes towards increased curricular and technical support for improving the effectiveness of the BWLI program (June 2008)
Table T10 presents the results of asking BWLI teachers to respond on a 5-point scale the degree to which “increased curriculum support and increased technical support could have improved the effectiveness of the BWLI program” across the four BWLI schools. Overall, just over half of BWLI teachers agreed or strongly agreed that both increased curriculum support and technical support could have improved the program. Approximately one third of responding BWLI teachers neither agreed nor disagreed that increased curriculum support or technical support would have improved the BWLI program. Looking across the schools, Conte teachers reported the least amount of overall agreement potentially indicating a higher level of satisfaction with the support they received while St. Mark teachers reported the highest amount of agreement suggesting their teachers felt additional support could have improved the impacts of the laptop initiative.
In general, teachers generally responded quite similarly in evaluating the potential benefits of increased curriculum and technical support. These results suggest that overall BWLI teachers gen-erally did not feel that either the technical or curricular support had a disproportional negative impact on the effects of the program. Additional teacher sentiment towards 1:1 computing is further explored in Table T12 (next page), where BWLI teachers responded to a statement concerning the promotion of 1:1 computing programs in other Massachusetts middle schools.
0
1000
1000
1000
1000
100
22 21
6750
20 20295 5
18
39 45
0
2548 4131
46 49 43
2 2 000 122 0 2
32 26 332525 333639 39 32
5 7 007 637 7 6
Curriculum Support could have improved BWLI program effectiveness
StronglyDisagree
StronglyAgree
Neither AgreeNor Disagree
Agree
DisagreeTechnical Support could have improvedBWLI program effectiveness
Herberg Reid TotalSt. Mark
Conte %

inTASC REPORT: Berkshire Wireless Learning Initiative, Final Evaluation Report, March 200949
Table T11: BWLI teachers’ response to the statement “I would encourage other Massachusetts middle schools to adopt 1:1 computing programs” (June 2008)
Conte Herberg Reid St. Mark Total
Srongly Disagree 2% 3% 5% 0% 4%
Disagree 0% 7% 15% 0% 8%
Neither Agree/Disagree 12% 20% 27% 25% 21%
Agree 45% 42% 29% 0% 37%
Strongly Agree 41% 27% 24% 75% 31%
Overall, after three years of participation in the BWLI program, the majority of BWLI teachers expressed positive sentiments towards 1:1 computing with 68% of teachers reporting “strongly agree” or “agree.” About one in five teachers (21%) neither agreed nor disagreed that other Massachusetts middle schools should adopt 1:1 programs while the remaining 12% of BWLI teachers expressed disagreement with encouraging any future Massachusetts middle school laptop programs. Again, the highest concentration of positive teacher sentiment was observed at the Conte school (86%) and at St. Marks (75%) while negative teacher sentiment was concentrated in the Pittsfield public schools (particularly Reid). Table T12 continues the exploration of BWLI teachers’ beliefs and sentiments towards the future 1:1 programs based upon their own BWLI experiences. Specifically, Table T12 asks teachers to consider if “the considerable costs and expenses associated with 1:1 laptop programs are not justified based on my experiences”.

inTASC REPORT: Berkshire Wireless Learning Initiative, Final Evaluation Report, March 200950
Table T12: BWLI teachers’ response to the statement: “The considerable costs and expenses associated with 1:1 laptop programs are not justified based on my experiences” (June 2008)
Conte Herberg Reid St. Mark Total
Srongly Disagree 34% 22% 22% 25% 25%
Disagree 32% 34% 12% 25% 25%
Neither Agree/Disagree 27% 24% 29% 50% 27%
Agree 5% 15% 29% 0% 17%
Strongly Agree 2% 5% 9% 0% 6%
Table T12 presents the results of asking BWLI teachers to respond on a 5-point scale the degree to which they agree that: “the considerable costs and expenses associated with 1:1 laptop programs are not justified based on my experiences” across the four schools. For this question, half (50%) of all BWLI teachers reported that they disagreed or strongly disagreed with the surveyed statement indicating that the considerable costs and expenses associated with a 1:1 laptop program is in-deed justified based on their own experiences. Amongst the remaining half of teacher who did not expressly feel the expenses were justified, 23% noted that agreed the costs and expenses were not justifiable while 27% reported that they could neither agree or disagree with the statement. Thus, half of BWLI teachers found the cost and expenses justified while about one quarter of teachers did not and the remaining one quarter were not yet sure or neutral at the time of the survey (June 2008). Again, looking across the schools, different patterns of agreement are evident with teachers from Conte (7% agreement) and St. Mark (0% agreement) expressing the strongest support of laptop programs while Reid teachers expressed the least (38% agreement).
In addition to these queries above, in the Year 2 and 3 surveys teachers were also asked to reflect more directly on how their experiences with 1:1 computing had impacted their own teaching prac-tices. Specifically, questions were included to determine if and how the BWLI program was impact-ing the way teachers conduct their classes and how students of different ability levels are adjusting and learning with the new technology. Teachers were presented with twelve Likert response items (Strongly Agree, Agree, Neutral, Disagree, Strongly Disagree) in the survey that addressed specific changes in their beliefs, practices, and abilities since the adoption of the 1:1 program. Figure T1, next page, presents these results across the five BWLI schools focusing specifically on teacher beliefs and experiences having taught in a 1:1 laptop setting.
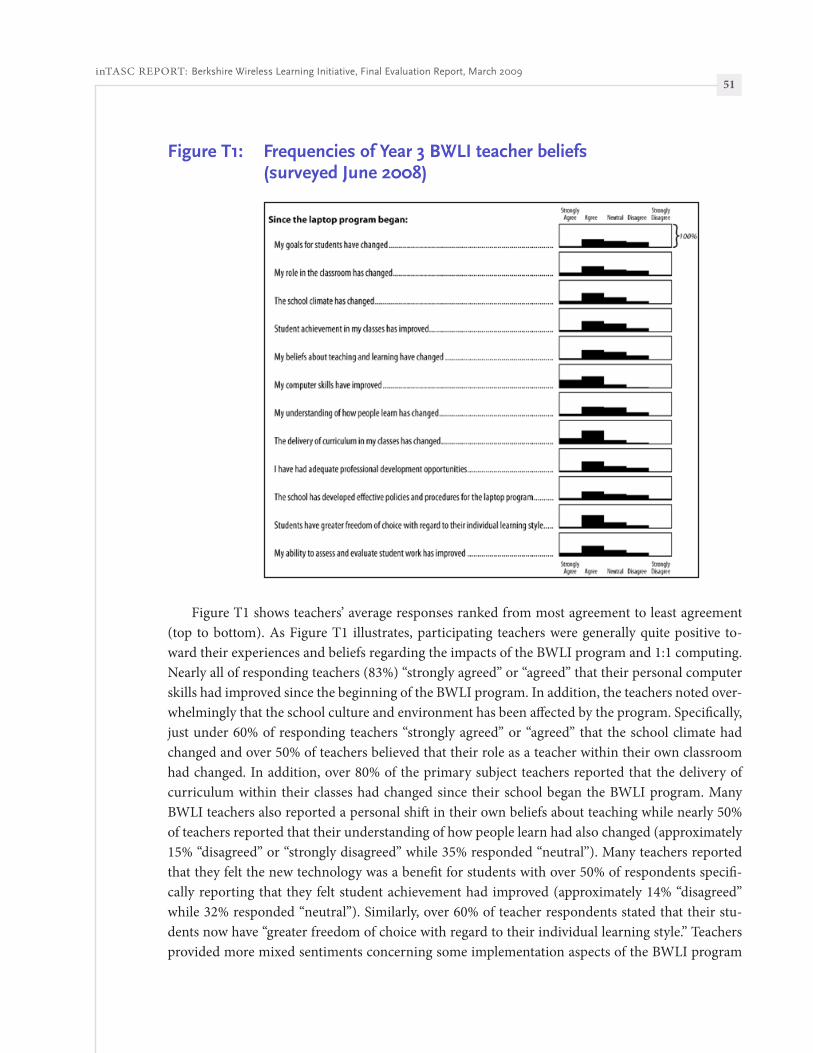
inTASC REPORT: Berkshire Wireless Learning Initiative, Final Evaluation Report, March 200951
Figure T1: Frequencies of Year 3 BWLI teacher beliefs (surveyed June 2008)
Figure T1 shows teachers’ average responses ranked from most agreement to least agreement (top to bottom). As Figure T1 illustrates, participating teachers were generally quite positive to-ward their experiences and beliefs regarding the impacts of the BWLI program and 1:1 computing. Nearly all of responding teachers (83%) “strongly agreed” or “agreed” that their personal computer skills had improved since the beginning of the BWLI program. In addition, the teachers noted over-whelmingly that the school culture and environment has been affected by the program. Specifically, just under 60% of responding teachers “strongly agreed” or “agreed” that the school climate had changed and over 50% of teachers believed that their role as a teacher within their own classroom had changed. In addition, over 80% of the primary subject teachers reported that the delivery of curriculum within their classes had changed since their school began the BWLI program. Many BWLI teachers also reported a personal shift in their own beliefs about teaching while nearly 50% of teachers reported that their understanding of how people learn had also changed (approximately 15% “disagreed” or “strongly disagreed” while 35% responded “neutral”). Many teachers reported that they felt the new technology was a benefit for students with over 50% of respondents specifi-cally reporting that they felt student achievement had improved (approximately 14% “disagreed” while 32% responded “neutral”). Similarly, over 60% of teacher respondents stated that their stu-dents now have “greater freedom of choice with regard to their individual learning style.” Teachers provided more mixed sentiments concerning some implementation aspects of the BWLI program

inTASC REPORT: Berkshire Wireless Learning Initiative, Final Evaluation Report, March 200952
with 47% of teachers stating that their “school had developed effective policies and procedures for the laptop program” while approximately 26% “disagreed” or “strongly disagreed” and 28% of teachers responded “neutral”. Also demonstrating a wide range of teacher sentiment, about 52% of teachers “agreed” or “strongly agreed” with the statement that they had been provided with “adequate professional development opportunities” while about 22% of teachers “disagreed” or “strongly disagreed.”
Teacher Perceptions Across Grade Levels
In addition to looking, as a whole, at the entire BWLI teacher population, the teacher beliefs survey data was also examined across each of the individual grade levels participating in the study (6th, 7th and 8th). Table T13, below, shows the mean responses of Year 2 BWLI teacher beliefs across grade level.
Table T13: Mean BWLI teacher beliefs across grade levels (June 2008)
6th Grade 7th Grade 8th Grade
My computer skills have improved 4.2 4.2 4.0
The delivery of curriculum in my classes has changed 4.0 4.1 3.9
The school climate has changed 3.7 3.7 3.4
Students have greater freedom of choice with regard to their individual learning style 3.7 3.7 3.5
My ability to assess and evaluate student work has improved 3.6 3.7 3.4
Student achievement in my classes has improved 3.6 3.6 3.4
The school has developed effective policies and procedures for the laptop program 3.5 3.5 3.1
My understanding of how people learn has changed 3.5 3.5 3.3
I have had adequate professional development opportunities 3.4 3.4 3.4
My beliefs about teaching and learning have changed 3.4 3.4 3.2
My role in the classroom has changed 3.3 3.5 3.3
My goals for students have changed 3.3 3.3 3.2
Scale: 5 = Strongly agree; 4 = Agree; 3 = Neutral; 2 = Disagree; 1 = Strongly disagree
As Table T13 illustrates, there was relatively little variation observed in teacher attitudes and be-liefs across the different grade levels. Despite the variations in student and teacher use of technology across the participating grade levels, it is not very surprising to see the lack of variation in teacher attitudes across grade levels, as the program was similarly implemented in each grade.

inTASC REPORT: Berkshire Wireless Learning Initiative, Final Evaluation Report, March 200953
Teacher Perceptions Across Schools
As prior analyses and research have shown differences in teacher practices across the BWLI schools, we also explored teacher attitudes across each of the BWLI schools in Table T14, below.
Table T14: Mean BWLI teacher beliefs across participating schools (June 2008)
Conte Herberg Reid St. Mark
My computer skills have improved 4.3 4.2 3.9 4.8
The delivery of curriculum in my classes has changed 4.0 4.0 3.9 4.5
The school climate has changed 3.9 3.4 3.7 4.0
The school has developed effective policies and procedures for the laptop program 3.9 3.1 2.8 4.3
Students have greater freedom of choice with regard to their individual learning style 3.9 3.6 3.3 4.3
My ability to assess and evaluate student work has improved 3.8 3.6 3.2 4.3
Student achievement in my classes has improved 3.8 3.5 3.2 4.3
My role in the classroom has changed 3.8 3.2 3.2 4.8
My understanding of how people learn has changed 3.7 3.3 3.3 4.3
My goals for students have changed 3.7 3.1 3.0 4.0
I have had adequate professional development opportunities 3.7 3.4 3.0 3.0
My beliefs about teaching and learning have changed 3.6 3.2 3.1 4.3
Scale: 5 = Strongly agree; 4 = Agree; 3 = Neutral; 2 = Disagree; 1 = Strongly disagree
As illustrated by Table T14, there was somewhat more variation in teachers’ beliefs and attitudes across the BWLI schools than there was across grade levels (Table T13). Concerning aspects of the program itself, there were many cases where the teacher sentiment varied across the participating schools. Like the Year 2 results (Bebell, 2007), teachers at the Reid school generally reacted some-what less positively than teachers at the other schools to many of the survey questions. Similarly, teachers from St. Mark generally reported more positively, on average, on the impacts of the 1:1 technology program as they had in past surveys. For example, St. Mark/Joseph teachers averaged 4.8 for the survey item “my role in the classroom has changed” compared to 3.8 for the Conte teachers, and 3.2 for the Reid and Herberg teachers. Teacher responses to the survey question “the school has developed effective policies and procedures for the laptop program” also produced results that var-ied somewhat across settings. Conte teachers were more favorable of the professional development opportunities they have been provided (3.7) compared with Herberg (3.4), Reid (3.0), and St. Mark/Joseph (3.0). Other survey items that exhibited notable differences across the schools included “My beliefs about teaching and learning have changed” and “My understanding of how people learn has changed.”

inTASC REPORT: Berkshire Wireless Learning Initiative, Final Evaluation Report, March 200954
Lastly, teachers were also presented a list of fourteen types of student behaviors, attitudes, and activities and were asked to rate how such actions have changed (Declined, No Effect, Improved) since the laptop program was first launched. Teachers were asked to focus the responses to these survey items based on specific groups of students. These groups included:
high achieving students,•
at-risk or low-achieving students, and•
traditional students•
Nearly all of the items used in this section of the survey were adapted from the 1:1 teacher survey used in the Piscataquis Community High School Study (Great Maine Schools Project, 2004) and were also applied in the evaluation of New Hampshire’s pilot 1:1 laptop program, Technology Promoting Student Excellence (Bebell, 2005; Bebell, 2007). The results reported below are averaged from all of the 108 BWLI primary subject teachers who completed the June 2008 survey. However, a small fraction of teachers did not always answer each and every survey question. Thus, the careful reader will note that the percentages reported below do not always add to 100% as a small percent-age of the teacher respondents did not answer each of the given questions. Thus, the percentages reported in the following graphs reflect nearly the full population of primary subject classroom teachers, including even those teachers who chose not answer a given question. Figure T2, on the next page, presents BWLI teachers’ beliefs on the impacts of 1:1 computing following three years of participation in the BWLI program.

inTASC REPORT: Berkshire Wireless Learning Initiative, Final Evaluation Report, March 200955
Figure T2: Teachers’ beliefs on the impact of 1:1 computing across different students (June 2008)
Figure T2 illustrates teachers’ beliefs on the impact of 1:1 computing across a wide variety of student behaviors, attitudes, and activities for their traditional, high-achieving, and low-achieving students. The fourteen student outcomes are sorted and organized by the degree of teacher senti-ment, such that areas where teachers have observed the greatest improvements are to be found in the top of the figure, while areas with the least improvements are located at the bottom. There is a great deal of information contained within Figure T2, however even a casual glance at the results reveal that participating classroom teachers were substantially more positive in their assessment of the BWLI program outcomes than negative or neutral.
0 100 0 100 0 100
1
3
3
41
42
7
44
44
5831
5
21
66
24
49
69
2
2
73
2
2171
3
122
83
39
4050
467
28
45
6
3
44
2468
513
0
3760
0
43
47
8
42
50
5831
4
17
73
28
43
65
3
2
76
2469
121
84
37
3851
457
194
40
7
6
45
1873
543
1
3855
5
1
3
39
31
6
39
41
6030
5
31
51
38
47
52
2
2
59
2861
193
71
37
3452
437
402
54
6
3
45
1767
494
1
3954
0
Improved
TraditionalStudents
% % %
At Risk/Low AchievingStudents
High AchievingStudents
No Effect
Declined
students’ motivation
students’ preparationfor class
students’ ability to retaincontent material
students’ interactionwith teachers
students’ quality of work
students’ attendance
students’ qualityof writing
students’ peer reviewin class
students’ interaction withother students
students’ ability to workindependently
students’ behavior
students’ ability to workin groups
engagement/interest level
students’ participationin class
Teachers’ beliefs on the impact of 1:1 computing on:

inTASC REPORT: Berkshire Wireless Learning Initiative, Final Evaluation Report, March 200956
Overall, the overwhelming majority of BWLI classroom teachers reported improvements were most concentrated in their students’ interest/engagement in class, students’ motivation, and stu-dents’ quality of work. Focusing only on student engagement, one of the targeted outcomes of the initiative, teachers reported their risk/low achieving students were most improved with 84% of all responding teachers reporting “improvements” in student engagement/interest level compared to 83% for traditional students and 71% for high achieving students. Similar to the results on stu-dent engagement, teachers overwhelmingly found that the BWLI program improved their students’ motivation. Again, the largest percentage of improvement was observed for at-risk/low achieving students with over 76% of 1:1 teachers reporting that student motivation improved compared to 73% for their traditional students and 59% for high achieving students as a result of their participa-tion in the program. Conversely, a very small minority of teachers (less than 2%) believed that the 1:1 laptops had led to declined student engagement and student motivation for their students.
In addition to most teacher participants reporting that the 1:1 program improved their students’ motivation and engagement, the majority of teachers expressed that the program had also served to improve the quality of their students work. This observation was found across all three types of student groupings. However, the category with the highest percent of improvement was for found for traditional students with 71% of 1:1 teachers reporting that students’ quality of work improved compared to 69% for at-risk/low achieving students and 61% for high achieving students. More specifically, the survey also addressed the impact on more specific student outcomes, such as the quality of student writing. For all types of students, teachers largely believed that the BWLI program improved the quality of their students’ writing. High achieving students’ writing quality was seen to benefit most from the 1:1 laptops with nearly 60% of teachers responding that their high-achieving students’ writing quality had improved, although at-risk/low achieving students and traditional students were seen to improve by nearly as many teachers. Conversely, a small number of teachers (under 5% for each category) felt that their students’ writing had declined as a result of the BWLI program.
Across many of the other student outcomes, teacher sentiment was somewhat less universally positive, such as the impact of 1:1 computing on students’ attendance, students’ preparation for class, and students’ peer review in class. Again, in these cases where teachers were not universally positive in their assessment of the impacts of the program, teacher sentiment was by no means neg-ative. Across the survey items found in the lower half of Figure T2, responding teachers were fairly evenly split between teachers reporting a positive effect and no effect. For example, across all types of students, teachers were generally split between believing that the BWLI program improved stu-dents’ ability to retain content material or had no effect. However, across all categories of students, less than 2% of teachers reported a decline in their students’ ability to retain to content materials after participation in the BWLI program.
Overall, only a very small number of teachers reported a decline in any of the student outcomes related to participation in the BWLI program. In other words, even in those cases where positive outcomes were not reported universally or overwhelmingly by the teachers, there were few instances where more than a tiny fraction of teachers reported negative impacts resulting from the program.

inTASC REPORT: Berkshire Wireless Learning Initiative, Final Evaluation Report, March 200957
Principal/School Leadership Interview Results: Summary
As earlier described in the methodology section, each school hosted numerous evaluation visits which included classroom observations, teacher interviews, and principal interviews throughout the implementation period. Upon the completion of the third and final scheduled year of the 1:1 laptop implementation, each principal or school building leader also participated in a final formal interview concerning their experiences and critical appraisal of the 1:1 program their school had experienced.
In the text and tables below, we summarize how the leadership across the five BWLI settings viewed the implementation as well as the outcome(s) of the BWLI program. Given that only five schools participated in the program, individual school results are not presented to preserve the anonymity and confidentiality of those school leaders we interviewed. Despite this limitation, the summary of the principal/school leadership interview results provide another valuable perspec-tive on the implementation and outcomes of the BWLI program. In addition, the selected excerpts reproduced below from the school leaders provide both rich and personal examples of how 1:1 computing impacted teaching and learning.
In the final interview, after three years of 1:1 computing, each principal/school leader was pre-sented with a number of statements addressing the potential impacts of the BWLI program and 1:1 computing. School leaders were asked to rate their degree of agreement with each statement using only the following scale: Strongly Agree, Agree, Disagree, Strongly Disagree). Responses were recorded during the interview and are reproduced below across all five BWLI settings in Tables P1 and P2.
Table P1: Summary of general attitudes and benefits of computers in education across BWLI principal/school leaders (2008 Interview)
Strongly Agree Agree Disagree Strongly
DisagreeStudents are more willing to write second drafts when using a computer. 100% 0% 0% 0%
Students would use technology more at my school if there was less pressure to perform on standardized tests. 67% 33% 0% 0%
Students create better-looking products with computers than with other traditional media. 60% 40% 0% 0%
Students work harder at their assignments when they use computers. 20% 60% 20% 0%
Students interact with each other more while working with computers. 20% 40% 40% 0%
Computers help students grasp difficult curricular concepts. 0% 100% 0% 0%
Students develop a deeper understanding of the subject material when using a computer. 0% 80% 20% 0%
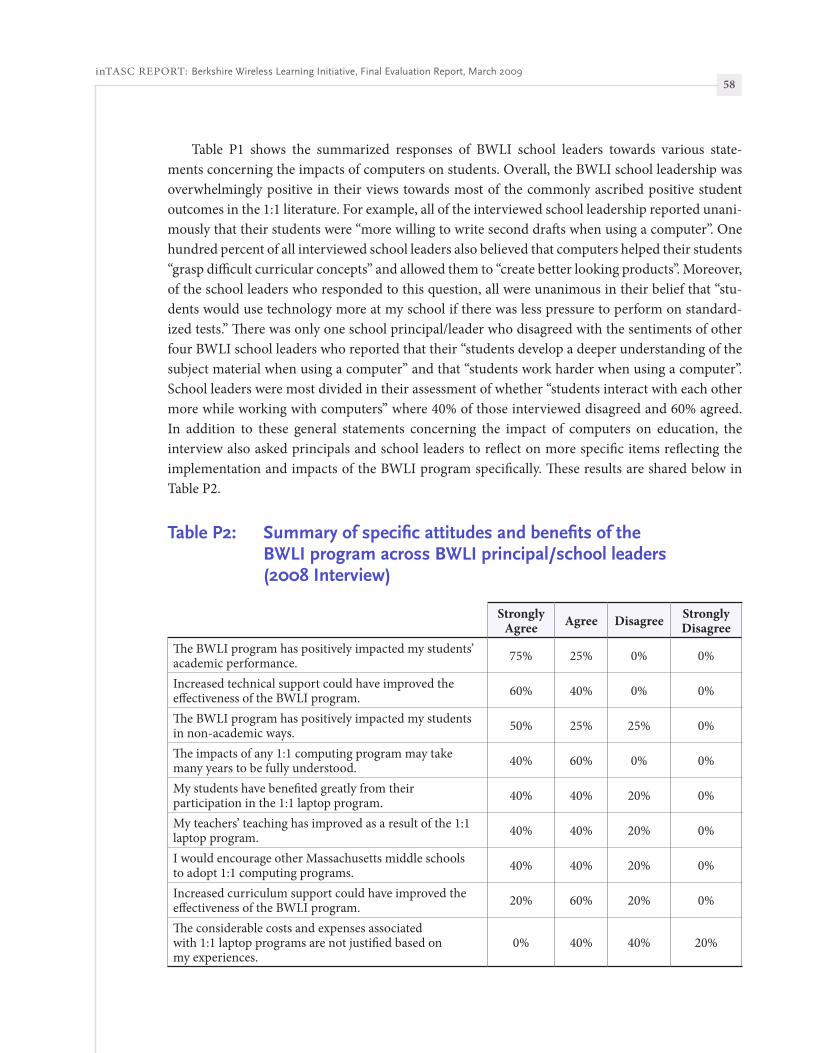
inTASC REPORT: Berkshire Wireless Learning Initiative, Final Evaluation Report, March 200958
Table P1 shows the summarized responses of BWLI school leaders towards various state-ments concerning the impacts of computers on students. Overall, the BWLI school leadership was overwhelmingly positive in their views towards most of the commonly ascribed positive student outcomes in the 1:1 literature. For example, all of the interviewed school leadership reported unani-mously that their students were “more willing to write second drafts when using a computer”. One hundred percent of all interviewed school leaders also believed that computers helped their students “grasp difficult curricular concepts” and allowed them to “create better looking products”. Moreover, of the school leaders who responded to this question, all were unanimous in their belief that “stu-dents would use technology more at my school if there was less pressure to perform on standard-ized tests.” There was only one school principal/leader who disagreed with the sentiments of other four BWLI school leaders who reported that their “students develop a deeper understanding of the subject material when using a computer” and that “students work harder when using a computer”. School leaders were most divided in their assessment of whether “students interact with each other more while working with computers” where 40% of those interviewed disagreed and 60% agreed. In addition to these general statements concerning the impact of computers on education, the interview also asked principals and school leaders to reflect on more specific items reflecting the implementation and impacts of the BWLI program specifically. These results are shared below in Table P2.
Table P2: Summary of specific attitudes and benefits of the BWLI program across BWLI principal/school leaders (2008 Interview)
Strongly Agree Agree Disagree Strongly
DisagreeThe BWLI program has positively impacted my students’ academic performance. 75% 25% 0% 0%
Increased technical support could have improved the effectiveness of the BWLI program. 60% 40% 0% 0%
The BWLI program has positively impacted my students in non-academic ways. 50% 25% 25% 0%
The impacts of any 1:1 computing program may take many years to be fully understood. 40% 60% 0% 0%
My students have benefited greatly from their participation in the 1:1 laptop program. 40% 40% 20% 0%
My teachers’ teaching has improved as a result of the 1:1 laptop program. 40% 40% 20% 0%
I would encourage other Massachusetts middle schools to adopt 1:1 computing programs. 40% 40% 20% 0%
Increased curriculum support could have improved the effectiveness of the BWLI program. 20% 60% 20% 0%
The considerable costs and expenses associated with 1:1 laptop programs are not justified based on my experiences.
0% 40% 40% 20%

inTASC REPORT: Berkshire Wireless Learning Initiative, Final Evaluation Report, March 200959
Table P2 shows the summarized responses of BWLI school leaders towards specific statements concerning the implementation and impacts of the BWLI program. Overall, the views of the BWLI school leadership were again overwhelmingly positive in their attitudes towards the BWLI pro-gram and successful outcomes of 1:1 computing. For example, all of the interviewed school leader-ship reported unanimously that the “BWLI program has positively impacted my student’s academic achievement”. Again, there was only one school principal/leader who disagreed with the sentiments of other four BWLI school leaders who reported that “The BWLI program had positively impacted my student’s in non academic ways” and “my students have benefited greatly from their participa-tion in the laptop program”. Similarly, in the interview questions weighing the costs and benefits of the BWLI program, again the same school leader disagreed with the other BWLI leaders who expressed universal agreement with the statement “I would encourage other Massachusetts middle schools to adopt 1:1 computing programs”. An additional school leader expressed some trepida-tion in a second (and more pointed) question concerning the costs and benefits associated with 1:1 computing. In total 60% of BWLI leaders disagreed with the statement the “considerable costs and expenses associated with 1:1 laptop programs are not justified based on my experiences” while 40% expressed agreement.
Table P2 also shows that school leaders were agreed in their assessment that “increased techni-cal support could have improved the effectiveness of the BWLI program” while 80% agreed with the related statement concerning “increased curricular support”. Eighty percent of BWLI school leaders additionally reported that their “teachers’ teaching has improved as a result of the BWLI program” while 100% reported that the “impacts of any 1:1 computing program may take many years to be fully realized.”
In addition to the summary across the shared interview questions, a post-implementation review of the open-ended interview data contained a number of themes and trends. First, it was widely acknowledged that the majority of students and staff clearly appreciated and made good efforts to use the increased technology resources made available to them through the BWLI pro-gram. Nearly all of the school leaders expressed positive accolades for educational technology and expressed sincere concern for sustaining their school’s 1:1 environment without BWLI funding. Second, it was clear that each school faced different implementation challenges and settings in their attempt to “transform teaching and learning”. For example, state and federal compliance to measur-ably improve student performance on standardized tests was a major school theme in some of the public BWLI settings, whereas in the two parochial schools this was not a consideration. Third, these variations across school settings resulted in the school principal’s role varying widely in how much participation and leadership they directed towards 1:1 computing. Given that much has been hypothesized and written about the importance of school leadership in successful educational tech-nology initiatives, below we provide some additional examples of how the leadership both managed and viewed the BWLI program.
Across the three years of the project implementation, three of the five participating BWLI schools experienced periods when the principal’s role was viewed by the evaluation team as being less than fully focused on the BWLI program. Although our purpose was not to evaluate the leader-ship styles or capabilities of any staff, we observed a couple trends across the BWLI implementation

inTASC REPORT: Berkshire Wireless Learning Initiative, Final Evaluation Report, March 200960
period when leadership practices and decisions seemed to directly impact the effectiveness of the program. In some cases, changes in school and district leadership created leadership “holes” dur-ing some periods of the BWLI planning and implementation. For example, one participating BWLI school experienced a substantially “greater than average” turnover of principals in addition to other school and district changes during the BWLI planning and implementation periods. Although the administrative changes made for some challenges in the implementation, this school did not differ much in terms of program implementation and outcomes given the increased role of supporting administration and staff.
In two other cases, the school principal made a conscious decision to minimize their attention on the BWLI program and instead focus on other school priorities. In the one case where the school principal did not serve a major leadership role respective to the BWLI program, the school notably faltered in the last period of the initiative. In the other school where the principal was not expressly concerned with the BWLI program, a teacher leader was formally appointed to fulfill this leader-ship role. For this particular school, this model worked very well. However, the success may have had more to do with the extraordinary time and resources this particular school leader devoted to promoting, maintaining, and supporting the program.
School principals and school leadership received little to no financial remuneration for their participation and time managing the program at their respective schools. Also, the program was implemented across nearly all of the participating schools using only existing school personnel.
Echoing the teacher interview results, the principal/school leadership interview reflected a con-cern for the initial investments in time and resources inherent with the adoption and implementa-tion of a 1:1 program. At each participating school, the job responsibilities for many school leaders swelled in unique and unforeseen ways. For example, one school leader reflected: “I don’t think anyone ever expected how we’d manage the 500+ laptops that kids were taking back and forth to their homes each day”. When the school began encouraging their students to take laptops home for “anywhere-anytime learning” this school was caught somewhat unsure who would take on the added responsibility of ensuring that these hundreds of student laptops did not contain objection-able materials as well as manage the day-to-day maintenance of implementation. Although this school finally enacted a more controlled take-home student laptop policy, all of the school leaders found themselves taking on added responsibility and extra work in addition to having to demarcate new responsibilities to their staff.

inTASC REPORT: Berkshire Wireless Learning Initiative, Final Evaluation Report, March 200961
At one of the smaller schools, the responsibilities and daily management of the 1:1 laptop pro-gram was nearly single handedly carried out by one full-time classroom teacher. After three years of successful implementation at this school, this school leader shared a post-BWLI appraisal of their time as the school’s BWLI leader:
The implementation, repair and integration of the software in to the curriculum would be best described as a second full time job for me. For the first year I would have to say that an average number of hours spent would be between 20-30 hours a week. The Year 1 initial set up was done after school, evenings and many weekends. The time during Year 2 did not decrease by any means, although the areas in which the hours were spent more on service/repair and less on the rollout and administrative tasks. Year 3, the hours are still in the same ballpark, but more time is being spent on integration as I am trying to use the laptops in all grade levels that I teach. It must also be noted that my hours can vary from week to week, but the average I am confident is accurate.
However, like many of the Western Massachusetts educators who invested a great deal of their own time and effort in transitioning their schools from “traditional” learning environments to a 1:1 model, this school leader was equally quick to speak of the reason behind his/her extensive level of personal and professional commitment:
The compensation for the extra time that the laptops required has been minimal but for me the payoff has been how the students have been able to learn to use the technology to better understand the world around them. The BWLI has been a success for several reasons: First, it is through the desire of school and its administration and faculty to offer our students the technology to carry them into the twenty-first century. Second, the freedom to direct the day to day needs of the project. Although it must also be noted that the laptops themselves did not propel us into the twenty first century and the lack of a budget for additional personnel could have derailed the project if it wasn’t for a dedicated few who had a clear understanding of the connection of technology and education.
Overall, based on the principal/school leader interview, 1:1 computing and the BWLI program was a major investment, but in four of the five participating schools, school leadership clearly found that the positive educational impacts and benefits justified the increased workload and investment. Further, nearly all of the leadership interviewed expressed some degree of feeling that their first years adopting 1:1 computing, although successful, had only “scratched the surface” of the full po-tential afforded by educational technology.

inTASC REPORT: Berkshire Wireless Learning Initiative, Final Evaluation Report, March 200962
Classroom Observation Results: Summary
As previously discussed, the classroom observation served numerous roles in the formative and summative functions of the BWLI evaluation. Now, after three years of 1:1 laptop implementation, the role of the classroom observation serves to provide an additional source of evidence for docu-menting the deployment and outcomes of the BWLI program. Specifically, examples and trends observed in the classrooms lend valuable insight and perspective into the other more methodologi-cal rigorous methods of inquiry. For example, in the second year of the program implementation (the first across all grade levels), the evaluation team reported classroom observation results that addressed obstacles and areas potentially impacting program outcomes. Culled from classroom ob-servations across all BWLI settings, these second year implementation observations now serve to highlight some of the many considerations and details inherent in a 1:1 technology program and portray realistic accounts of teaching and learning practices.
The Importance of the Teacher
As detailed in the April 2007 evaluation report, BWLI Evaluation Implementation Notes and Concerns (Bebell, 2007), the transition from traditional educational practices and roles to the type of 21st century learning afforded by ubiquitous computing required a major investment and com-mitment from educators across the BWLI settings. First and foremost, teachers must make a huge investment in time and effort to adapt their teaching to make the 1:1 environment effective. With the adoption of the BWLI program, teachers were asked to change their existing practices and in-tegrate technology across all aspects of their professional lives. As such, the classroom observations suggest that the burden of change was often higher for teachers than it was for either students or administrators.
Across nearly all of the classroom observations we conducted, it was fairly clear that teachers nearly always control when and how their students access and use laptops during the school day. For example, in many of the observed classes, students would anxiously ask the teacher “will we get to use our laptops today?” as they entered the classroom. On more than one occasion I observed students cheering when the teacher told the class that they would be using their laptops in the cur-rent lesson. Although this may seem obvious, the effects of this situation are that teachers basically control nearly all student access and uses of the laptops in school. Given that these middle school students typically traveled between teachers throughout the day, a student during the second year of the program could easily go through the day without using their laptop at all if none of their teach-ers had a “laptop lesson” prepared. Similarly, a student in different classes could use their laptop throughout the day in the same grade and school. This observation is also echoed by the student and teacher survey results where teacher and student laptop use in school had increased dramatically compared to the pre-1:1 conditions, but could still average once a week or less in specific subject areas for many of the participating schools. Thus, the potential success of any 1:1 program, such as the BWLI, rests largely on the participating teachers’ adoption and use of technology for educational purposes.

inTASC REPORT: Berkshire Wireless Learning Initiative, Final Evaluation Report, March 200963
In addition to highlighting the importance and significance of teachers role in a 1:1 environ-ment, the classroom observations also highlighted other facets impacting the 1:1 program includ-ing: role and impact of MCAS and standardized testing, lack of support/peripheral hardware, issues around transfer of information/data within schools, congested wireless network during peak usage, professional development and training new teachers, loaner laptops for students, and student en-gagement.
The Role of MCAS and Standardized Testing
At each of the three public BWLI schools, we clearly observed the increasingly pressure on schools to demonstrate adequate yearly progress (AYP) as measured through standardized tests. During the three years of the BWLI program, more than one BWLI school faced corrective action from the state based on “weak” test performance, underscoring the seriousness and importance of student test scores in these settings. In these settings, improving student test scores was seen as the top concern for nearly all interviewed administration and staff. Although most BWLI educators be-lieved that structured use of the technology may provide a path to improving student achievement, many expressed trepidation to experiment with technology at a time when more established prac-tices to improve student test scores were needed. Particularly in Math and ELA, our observations found many teachers who emphasized activities and exercises with their students to prepare for the upcoming assessments (i.e. practice testing) rather than experiment with innovative ways to inte-grate technology into their lessons. One teacher summarized the situation at their school by stating: “the test is the most important thing right now…not the technology.” Although the test-centric ap-proach was most evident in the months preceding the assessment, it clear that the high stakes nature and emphasis of the state testing program both directly and indirectly precluded the integration of technology in many observed and reported cases during the BWLI implementation period.
This important issue is by no means unique to only the BWLI schools. Indeed, schools across the nation are struggling with the increasing emphasis on testing by state and national leaders, as well as by district and school leadership. As we begin to better understand the effects of technology use on students’ test scores, a better understanding of the relationship between technology use and student achievement will be achieved. However, if teachers consciously choose to avoid using tech-nology, developing such a link will be challenging, if not impossible.
Lack of Support/Peripheral Hardware
Although every student and teacher across the five BWLI settings were provided laptops, teach-ers access to support/peripheral hardware continued to vary considerably throughout much of the implementation period. In the second year observations and teacher interviews, many teachers discussed that fact that they were sharing peripheral resources such as LCD projectors and print-ers while other classrooms had dedicated hardware. In most cases, the teachers who were using technology most frequently generally figured out how to gain access to the peripheral hardware they needed, but many of the teachers who used technology less frequently had to first locate the resources and supplemental technology. The distribution of peripheral resources across most BWLI settings was such that the teachers who make the most frequent use of technology had the greatest

inTASC REPORT: Berkshire Wireless Learning Initiative, Final Evaluation Report, March 200964
access. This scenario makes practical sense and appears generally effective for those high use teach-ers. However, teachers who were more hesitant or apprehensive about adopting and using technol-ogy faced often still faced access obstacles when they attempted to incorporate technology into their teaching. Teachers at some schools were particularly critical of the lack of printers and LCD projectors available to them and reported that this negatively influencing their own frequency and quality of technology use with their students. Indeed, as we have observed throughout the BWLI implementation period, there are considerable components to a successful 1:1 laptop program be-yond the actual laptops. Despite the huge leverage of technology resources within the BWLI schools, a number of teachers felt they were still lacking important access to peripheral hardware needed to maximize the use of laptops in their classroom. Clearly, a challenge for any new educational initia-tive is recognizing the needs of teachers and students for success and that these components are carefully considered and weighed throughout the planning and implementation period.
Transfer of Data and Information Within 1:1 Settings
Many theorists believe that the transition from paper to electronic media in educational settings offers a significantly more effective and efficient experience (mirroring the recent trends and results in business settings). Clearly, the transition from a traditional setting to a paperless (or nearly paper-less) classroom represents a marked shift in the ecology of middle school classrooms. However, to reap the benefits of the increased effectiveness and efficiency of a paperless classroom, teachers and students must again develop and employ new methods for transferring files and information from teachers to students, students to teachers, and even amongst students.
In the second year observations across BWLI settings, the evaluation team observed a number of instances where the new technology resources had replaced paper-based modes and materials. In particular, we observed and documented the challenges many BWLI teachers experienced trying to get files or information to and from their students’ computers. Many of the interviewed staff report-ed their frustration with attempts to develop strategies for sending all of their students’ information. Simply put, teachers felt they were lacking a quick and easy way to transfer files and information. In many of Year 2 and 3 classes we observed, students would print out their work on a printer and the paper copies are then collected and graded by the teacher. Both teachers and the observations sug-gested that this frequent process could waste instructional time, especially in settings where printers are shared across many classes or where printers are not located in the classroom. In addition, teach-ers often reported difficulty in accessing printers located outside of their classroom during the busy school day. At one of the BWLI schools, teachers reported that it would not be uncommon to find hundreds of printed pages scattered around the shared printers by the end of the day. In this case, teachers would meet at the end of the day to “go through the piles” trying to figure out which papers they were looking for. Teachers also described situations where the community printer would either malfunction or run out of paper at some point during the day, although the problem would often go undetected until the end of the day and the teachers would have to get their students to reprint their work the following day. Although, many teachers still preferred this scenario to collecting numer-ous drafts of hand written work from students, it is clear that in many BWLI settings, solutions and approaches for paperless learning environments were slow to be realized.

inTASC REPORT: Berkshire Wireless Learning Initiative, Final Evaluation Report, March 200965
Similarly, many teachers employed their own web site as a repository for relevant information, which students could access from their own laptops via the web. However, this approach was typi-cally limited to students accessing files and information from the teacher, and could not be used for teachers accessing information and files from their students. In other BWLI settings, teachers have experimented with web-based drop boxes, transfer of files via student email, and various net-working solutions as possibilities to streamline the transfer of digital information in their classes. However, as an efficiency tool, the new laptops often served to actually make the teachers’ role more complicated in the beginning years of the deployment. Again, these observation notes serve to illus-trate the many real world complexities and challenges that face teachers and schools transitioning to 1:1 computing.
Congested Wireless Networks
Although the majority of staff and observations revealed that schools wireless network was generally robust and dependable, it was not uncommon for problems to arise when an entire class of students is using bandwidth during the classroom observations. For example in one of the second year classroom observations, all students were using the Internet to access three-dimensional dia-grams of the Egyptian pyramids. When the class of students clicked on the link to load the images, many student computers froze and the page took many minutes to fully load. In another class, the time to access a Adobe Flash page took over two minutes for many students. In the time when web pages are loading, students grew impatient and were often easily distracted. In worst-case scenarios, the students became disengaged and the momentum of the lesson was quickly lost. In these cases the teacher was placed in a new and difficult classroom management position as evidenced by some teachers remarking that after a few experiences like this they were much less likely to rely upon high bandwidth resources in their teaching.
Again, the high-speed wireless Internet connectivity was generally considered quite good across the BWLI settings. However, as the classroom observations from Year 2 illustrate, teachers were faced with new and unique challenges when school networks failed and could not support the teachers’ lesson plans. From an implementation perspective, recognizing and addressing network and connectivity issues is of critical importance as teachers begin to develop and rely upon web-based resources in their teaching.
Professional Development and Training for New and Incoming Teachers
Across the second year BWLI classroom observations and interviews, we spoke with a num-ber of newly hired teachers who recently begun teaching in a BWLI school and missed the initial teacher training and professional development. These teachers described their enthusiasm, their issues, and the challenges of entering an existing 1:1 laptop program. In nearly every case, the newly hired teachers explained that the 1:1 program was discussed in their interview process and that the program actually served to positively influence their choice to accept the teaching position at their current school. In fact, teacher sentiment was so overwhelmingly positive that in second year of the program a large number of both new and veteran teachers remarked that they could not imagine teaching in a non-1:1 setting given their generally positive experiences to date in 1:1 settings.

inTASC REPORT: Berkshire Wireless Learning Initiative, Final Evaluation Report, March 200966
However, a sizable proportion of the newly hired teachers also reported that they felt they had not been adequately trained and prepared for the specific role of teaching in a 1:1 environment. Given that few teacher training institutions offer specific preparation for 1:1 settings, these teachers stated felt like they had “slipped through the cracks” since the same training offered to the original generation of BWLI teachers was offered to them. In settings trying to make 1:1 computing sustain-able, schools must begin to develop and offer programs for bringing their newly hired teachers up to speed on the hardware, software, network, and other important aspects of 1:1 computing. Again, this example shows the degree of commitment and planning that may be needed for 1:1 schools to meet their educational outcomes.
Loaner Laptops and Student Equity Within 1:1 Setting
Again, each BWLI school developed their own policies and practices for implementing the 1:1 program in their community. As observed across the second year classroom observations, the issue of what happens when a student’s computer breaks varied. When a student computer breaks or malfunctions, it is generally the teachers’ responsibility to take the first steps of corrective action. Typically, most teachers spend at least a few minutes trying to fix the problem themselves (often during class time). If the problem cannot be easily resolved the teacher must then arrange for additional help or send the laptop “out” for service. In a number of interviews with teachers and administration, most remarked that problems are “quickly resolved” and usually within a week or two the computer is fixed and returned to the student.
In most BWLI settings, the student is simply without a computer during this period, which can be substantially longer if the problem is serious or if the staff is busy. In most BWLI settings there were little or no backup, spare, or loaner machines available and the student must simply do without the laptop in all of his or her classes. Obviously, this situation can create a challenge to teachers who have planned to have their entire class work independently with their laptops only to find out that one or more student laptops is not available. I have personally witnessed instances where the teacher will give up his or her own laptop for the class period so a student may complete an assignment or project. If more than one student is without a laptop in a given class or if the teacher laptop was unavailable, this solution did not work. In these situations, long-term projects such as multi-media presentations could not be completed by the student without a laptop and the teacher must work quickly and creatively to develop a solution. Through the second year classroom observations we have observed multiple occurrences when teachers had no choice but to pair up students without technology with a laptop student, defeating the nature and equity of the 1:1 program. Again, one concern is that teachers must face the additional challenge of teaching a technology-rich lesson in a setting where some of their students may not be able to access a laptop. As with some of the other issues raised through the teacher interviews and classroom observations, this inequity can result in a challenging classroom management situation for those teachers trying to develop and teach using their new resources and tools. In some BWLI settings, classrooms and schools developed formal policies for managing students without laptops. In cases where the laptop was damaged or removed due to a student’s negligence, the student typically lost privileges to use any technology in school. In cases where students’ laptops were unavailable for non-negligence issues, students were provided

inTASC REPORT: Berkshire Wireless Learning Initiative, Final Evaluation Report, March 200967
an official loaner laptop until their laptop was repaired or replaced. However, most BWLI schools had no extra laptops available for students and little to offer students and teachers when anything went awry.
Student Engagement
Finally, across the classroom observations, student engagement and motivation was directly ob-served in each of the BWLI settings throughout the deployment period. These observations across the five participating schools, serve to triangulate the student and teacher survey results showing that the majority of students were more engaged and motivated when provided the opportunity to use technology in their classes. As described earlier, students would often walk into their class and greet the teacher by asking if they “would be using their laptops today”. When a teacher would respond positively, students would often cheer and express the pleasure. Once class was underway, the majority of students did appear to be more on task and engaged in their schoolwork when they were using their laptops. In fact, students typically appear to be so much more engaged and on task when using laptops in class, that it has become a frequent practice to encourage policy makers and educational observers to actually visit and observe 1:1 classes in action, such as when Senator John Kerry visited the Conte school’s 1:1 classrooms in October 2007.

inTASC REPORT: Berkshire Wireless Learning Initiative, Final Evaluation Report, March 200968
Student Drawing Results: Summary over Time
Across the three years of program implementation, over 3,500 student drawings were collected and analyzed from BWLI students. In each case, students were asked to:
Think about the work you do in your classroom. In the space below, draw a picture of yourself writing in school.
Specifically, baseline (pre-1:1) drawings were collected from 7th grade students beginning in December 2005 before student laptops were deployed. Students across all grade levels were subse-quently surveyed in June 2006, June 2007, and finally in June 2008.
Each student drawing was analyzed, coded and entered into a database by the research team. Given the multiple data collection points over the course of the student laptop deployment sched-ule, there are numerous ways to summarize the collection of student drawings. Table SD1 provides a summary of students drawing data over time by examining 7th grade student drawing character-istics from December 2005 (pre-laptop) to June 2008 across each BWLI school.

inTASC REPORT: Berkshire Wireless Learning Initiative, Final Evaluation Report, March 200969
Table SD1: Summary of BWLI 7th grade student drawing characteristics across schools from December 2005 (pre-laptop) to June 2008
Conte Herberg Reid St. Mark All BWLI Schools
12/05 6/06 6/08 12/05 6/06 6/08 12/05 6/06 6/08 12/05 6/06 6/08 12/05 6/06 6/08
N (# responding students) 123 119 82 219 213 179 174 161 165 61 61 90 577 554 517
Student Characteristics
At desk 80% 87% 95% 92% 94% 89% 91% 88% 88% 95% 92% 91% 89% 91% 90%
Writing with pencil 59% 28% 93% 63% 49% 53% 80% 41% 70% 72% 13% 39% 68% 38% 62%
Writing with laptop 0% 12% 1% 0% 5% 7% 0% 13% 19% 0% 34% 33% 0% 12% 15%
Writing with desktop computer 0% 1% 1% 0% 0% 0% 0% 1% 1% 0% 0% 3% 0% 0% 1%
Thinking 15% 13% 12% 16% 9% 13% 12% 4% 15% 11% 3% 20% 14% 8% 15%
Reading 0% 0% 0% 1% 0% 2% 0% 0% 1% 0% 0% 4% 0% 0% 2%
Talking with teacher 2% 2% 0% 0% 0% 4% 2% 2% 4% 3% 0% 0% 1% 1% 3%
Talking with other student 2% 0% 0% 0% 0% 1% 1% 1% 0% 2% 0% 1% 1% 0% 1%
Technology Present
Laptop computer 0% 14% 2% 1% 13% 8% 1% 24% 22% 2% 64% 43% 1% 22% 18%
Desktop computer 0% 2% 1% 0% 0% 0% 0% 1% 0% 2% 0% 7% 0% 1% 1%
Paper 71% 64% 93% 80% 72% 79% 91% 65% 78% 69% 30% 71% 80% 63% 79%
Pencil 67% 55% 93% 81% 72% 80% 87% 67% 81% 80% 25% 70% 80% 62% 81%
Other
Other students present 5% 8% 17% 5% 5% 9% 10% 5% 3% 10% 3% 8% 7% 5% 8%
Teacher present 15% 11% 15% 7% 4% 8% 13% 9% 12% 16% 3% 6% 12% 7% 10%
Classroom decorations 8% 9% 50% 6% 0% 16% 5% 2% 19% 3% 3% 34% 6% 3% 26%
Multi-frame drawing 2% 0% 2% 0% 0% 1% 0% 0% 6% 0% 0% 4% 1% 0% 3%
Student Demeanor
Positive 51% 51% 48% 60% 62% 61% 53% 52% 40% 51% 41% 53% 55% 54% 51%
Negative 11% 4% 1% 7% 4% 16% 5% 4% 12% 10% 0% 8% 8% 3% 11%
Neutral 20% 20% 32% 18% 13% 16% 22% 23% 30% 20% 26% 7% 20% 19% 21%
Can’t Discern 17% 24% 20% 15% 22% 12% 16% 20% 18% 21% 31% 32% 16% 23% 19%
Each cell in Table SD1 provides the percent of drawings where a given characteristic was noted by the coding team. In the December 2005 data collection, 7th grade students had not yet received BWLI laptops. By the June 2006 student drawing data collection, 7th grade students had approxi-

inTASC REPORT: Berkshire Wireless Learning Initiative, Final Evaluation Report, March 200970
mately four months of 1:1 computing experience. Lastly, the June 2008 survey results show the last cohort of BWLI 7th graders participating in the student drawing exercise after 2 years of 1:1 com-puting experience.
As the results across the BWLI schools show, the greatest difference in the collection of student drawings over time has been the presence of technology. Specifically, the presence of a laptop com-puter in the drawings went from less then 1% on December, 2005 to 22% six month later. During this same time period the depiction of paper and pencil in the drawing decreased from 80% of all drawing to 62–63%. This transition in how students depicted themselves writing in school was most dramatic at the St. Mark school where only 2% of the December 2005 drawings contained a depic-tion of a laptop but by June 2006 64% of students drew laptops. Across BWLI schools, the drawings collected from the final cohort of 7th graders in June 2008 show a return to the pre-laptop presence of paper and a decrease to 18% for drawings depicting laptops. This trend was realized in every BWLI setting, but was most dramatic at the Conte school where only 28% of drawings collected in June 2006 depicted students writing with pencil compared to 93% in June 2008.
Although the coded samples of drawings show some differences in student depictions and per-ceptions over time (notably the shifts in technology presence), individual student drawings allow a more direct window into students’ perception and view of themselves and their school. For example, a small number of students took the drawing exercise as an opportunity to provide their feedback and perspective on writing with and without technology in their school. As one example, a female 8th grade student from one of the Pittsfield public schools depicted herself seated alone at her desk with a paper, pencil and dictionary and looking rather unhappy. The text accompanying the student reads “Im sad because we have to write on paper insted (sic) of doing it on our computers :( ” and “Its better if we had out laptops because it is easier and faster to look up things”. On the table/desk behind her are two open laptops with the following text: “Im on Safari researching for examples for how to write a persuasive essay”. Also depicted in the drawing are the teacher’s desk, the teacher’s com-puter, and a ClassBoard (interactive whiteboard). There were numerous drawings where students expressly noted their preference for writing with laptops over paper and pencil. Space does not allow for the reproduction of individual student drawings in this report, however an interactive gallery showcasing examples of students unique perspective is available at www.bc.ed/bwli.

inTASC REPORT: Berkshire Wireless Learning Initiative, Final Evaluation Report, March 200971
Student Survey Results: Student Use of Technology in School
Year 3 Student Survey Results
Web-based surveys were administered in May and June 2008 to nearly all of the 1,800 BWLI students as well as over 1,100 comparison school students to provide an accurate appraisal of teach-ing and learning practices across the 1:1 laptop settings. Student surveys have also been collected across the 1:1 and comparison schools since the time of the first 7th grade student laptop deploy-ment halfway through the 2005–2006 school year. Thus, the following student survey results detail the impact of 1:1 computing from the perspective of BWLI students at various points in the deploy-ment of the BWLI program as well as in comparison to students in a non-1:1 setting.
The following tables report the frequency of technology using a 180-day scale corresponding to the 180 school days comprising one school year. In other words, technology use is measured on a 180 point scale where zero would mean that technology was never used and 90 would mean that technology was used on every other day, on average, during the 180 days comprising the academic year. The summary of students’ technology use begins with Table S1, below, which illustrates the frequency of students’ use of technology in the classroom during the 2007–2008 school year.
Table S1: Number of school days students reported using technology in the CLASSROOM (2007–2008 school year)
6th Grade 7th Grade 8th Grade
Conte Middle School 111 79 110
Herberg Middle School 86 89 97
Reid Middle School 84 102 82
St. Mark/St. Joseph 90 137 3
North 23 20 22
South 13 23 21
Table S1 shows the average number of times students reported using technology in the class-room during the 2007–2008 school year (the third year of the BWLI implementation) across each of BWLI and comparison schools. As the table shows, the average use of technology varied across grade levels and across each school. Despite this variation across school and grade levels, some pat-terns of students’ technology use are evident. For example, students across all grade levels reported a substantially more frequent use of technology in the BWLI classrooms than students at either comparison school where technology use generally occurred around 20 times per the year, or less than once per week. Across the BWLI schools, students’ frequency of technology use varied more substantially but was typically found to be at least four times more frequent than in the non-1:1 laptop comparison schools.

inTASC REPORT: Berkshire Wireless Learning Initiative, Final Evaluation Report, March 200972
Looking more closely at only the BWLI schools, 6th grade students generally reported some-what less frequent use compared to grades 7 and 8 where students had longer access and greater experience using school laptops. However, this was not observed at the Conte school where the 7th grade students reported less frequent use than either grade 6 or 8. Conversely, grade 7 use was found be greatest at the Reid school and at St. Marks. Clearly, the use of technology across the Pittsfield parochial schools (St. Mark serving grades 6th and 7th and St. Joseph serving 8th) varied substan-tially with St. Mark 7th graders reporting the most frequent 2008 average use (137 times per year) but St. Joseph 8th graders reporting the lowest frequency of use for any reporting school (3 times per year).
In addition to technology use in the classroom, technology use in non-classroom school set-tings was also examined in the student survey for the 2007–2008 school year. Table S2 shows the average number of times students from BWLI and comparison schools reported using technology in a computer lab during the 2007–2008 school year.
Table S2: Number of school days students reported using technology in a COMPUTER LAB (2007–2008 school year)
6th Grade 7th Grade 8th Grade
Conte Middle School 8 3 0
Herberg Middle School 25 21 9
Reid Middle School 7 23 12
St. Mark/St. Joseph 57 61 0
North 50 30 18
South 20 19 19
Table S2 displays the average number of times students reported using technology in computer labs during the 2007–2008 school year across both BWLI and comparison schools. Students in BWLI schools generally reported less frequent use of technology in computer labs compared to the frequency of use in the BWLI classrooms (reported above in Table S1). In other words, students in BWLI settings typically use technology more frequently in the classroom than in school computer labs. However, students reported wide variation in the frequency of their technology use in com-puter labs across each of the BWLI schools and each grade level. For example, Conte 8th graders and St. Joseph 8th graders reported no use of technology in a computer lab while St. Mark’s 7th grade students reported the most frequent use with an average of 61 times per school year, or once or twice a week.
In general, 8th grade students used technology in computer labs less frequently than students in the lower grades at the 1:1 schools. In addition, students also reported the frequency of their technology use in the school library as summarized below in Table S3 for both the BWLI and com-parison schools.

inTASC REPORT: Berkshire Wireless Learning Initiative, Final Evaluation Report, March 200973
Table S3: Number of school days students reported using technology in the LIBRARY (2007–2008 school year)
6th Grade 7th Grade 8th Grade
Conte Middle School 1 1 1
Herberg Middle School 17 16 11
Reid Middle School 6 8 7
St. Mark/St. Joseph 17 16 22
North 10 11 12
South 10 9 4
Table S3 shows the average number of times students reported using technology in the school li-brary during the 2007–2008 school year across both BWLI and comparison schools. Overall, BWLI students generally reported less frequent use of technology in the school library compared to class-room and computer lab use. Across the BWLI settings, use of technology in the library occurred most frequently at the Herberg school, as well as in the two parochial schools.
Looking cumulatively across Tables S1, S2, and S3 we can see that the majority of BWLI stu-dents used technology for at least some portion of every day during the 2007–2008 school year. Although some use was reported to occur in the school library and in computer labs, the majority of BWLI students’ technology use occurred in the classroom. However, the preceding tables also show that there was substantial variation in technology use across grade levels at many schools. In addition, summarizing such results across grade levels allows for a more succinct examination student technology use, however, the fact that such summaries fail to demonstrate the variation reported across grade levels should be remembered. Figure S1 shows the average number of days students reported using technology during the 2007–2008 school year across for each of the BWLI and comparison schools.

inTASC REPORT: Berkshire Wireless Learning Initiative, Final Evaluation Report, March 200974
Figure S1: Average number of school days students reported using technology (2007–2008 school year)
Figure S1 shows the average number of days students reported using technology in their class-rooms, in school computer labs, and in the school library during the 180 potential days of the 2007–2008 school year. In the figure, students’ use of technology in the classroom is displayed by blue horizontal bars while computer use in the computer lab and library are represented by red and green bars, respectively. Looking across the BWLI schools during the 2007–2008 school year, St. Mark students reported the most frequent average use of computers in school while St. Joseph 8th graders reported the least.
An analysis of variance between the BWLI students’ and comparison school students’ Year 2 survey results showed that the greater frequency of BWLI student technology use was statistical-ly significant “in the classroom” (F=1235.1; Sig.< .0005) and “in the computer lab” (F= 49.9; Sig. <.0005) but not “in the library” (F=.03; Sig. .859) compared to the non-BWLI students. In other words, the frequency of technology use in classrooms and in computer labs was so much greater in the BWLI settings than comparison settings that the difference could not be reasonably expected from chance. However, the difference between the average frequency of students’ computer use in the library was not statistically significant between the BWLI and comparison students.
0 30 60 90 120 150 180
1003
1
11859
16
22
1919
8
3411
1814
91
14
22
7
30
89
Herberg
Reid
St. Joseph’s
South
North
St. Mark
Conte Classroom
Computer Lab
Library

inTASC REPORT: Berkshire Wireless Learning Initiative, Final Evaluation Report, March 200975
The next series of Tables (S4–S11) further explores students’ use of technology in four primary subject areas across the BWLI and comparison schools during the 2007–2008 school year.
Table S4: Number of school days STUDENTS reported using a computer in READING/ELA class (2007–2008 school year)
6th Grade 7th Grade 8th Grade
Conte Middle School 54 16 66
Herberg Middle School 49 56 65
Reid Middle School 64 43 39
St. Mark/St. Joseph 48 108 0
North 12 7 17
South 19 12 24
Table S4 shows the average number of times students reported using technology in their Read-ing/English Language Arts classes during the 2007–2008 school year for both BWLI and compari-son schools. Despite a great deal of variation across the BWLI schools and across grade levels, BWLI students generally reported using computers in their Reading/ELA classes with much greater fre-quency than students in the two comparison schools during the 2007–2008 school year. As the table shows, each BWLI school exhibited different patterns of computer use across each of the different grade levels. For example, 7th grade Conte students reported the least frequent use of computers in Reading/ELA class compared to the other BWLI 7th grades, (16 times per year, or about once every 10 days) but exhibited the most frequent Reading/ELA use of any 8th grade class (66 times per year). Students in 6th and 7th grade at St. Mark reported using computers over 48 and 108 times per year respectively in their Reading/ELA classes, but 8th graders at St. Joseph reported the virtually no use whatsoever, with an average below once per year. Relatively less variation across grade levels was reported for Reid, Herberg, and the comparison schools.

inTASC REPORT: Berkshire Wireless Learning Initiative, Final Evaluation Report, March 200976
In addition to reporting how frequently they themselves used technology during the 2007–2008 school year across each of their primary subject areas, students also estimated the frequency that their teachers used technology in their classes during this same time period. For example, Table S5, below, displays the average number of school days students reported that their teachers used a com-puter in their Reading/English Language Arts classes during the 2007–2008 school year.
Table S5: Number of school days students reported their TEACHER using a computer in READING/ELA class (2007–2008 school year)
6th Grade 7th Grade 8th Grade
Conte Middle School 115 51 74
Herberg Middle School 110 101 106
Reid Middle School 84 107 106
St. Mark/St. Joseph 65 106 0
North 86 114 107
South 108 140 113
Unlike the Reading/ELA student use presented previously in Table S4, Table S5 shows that teachers’ use of technology in Reading/ELA did not vary as considerably across the BWLI schools and different grade levels within the schools. The large differences observed for student use between the BWLI and comparison schools was not observed for teachers’ computer use in Reading/ELA classes where comparison school teachers made widespread use of technology in their teaching, often more frequently then the BWLI teachers.
As the table above shows, most BWLI schools again exhibited different patterns of computer use across each of the different grade levels. For example, Conte 7th grade teachers were reported to use computers in Reading/ELA class less frequently than the other BWLI 7th grade teachers, (51 times per year) but exhibited the most frequent Reading/ELA use of any 6th grade class (115 times per year). Again, similar to the student use, teachers in 6th and 7th grade at St. Mark were reported to regularly use computers in their Reading/ELA classes, but 8th grade students at St. Joseph reported their Reading/ELA teachers rarely, if ever, used a computer with their class during the 2007–2008 school year. Looking at the Pittsfield public schools, relatively little variation was reported at Her-berg and Reid across grade levels. Table S6 continues the exploration of students’ use of technology during the second year of the BWLI implementation, showing the average number of school days students reported using a computer in Math class (2007–2008 school year).

inTASC REPORT: Berkshire Wireless Learning Initiative, Final Evaluation Report, March 200977
Table S6: Number of school days STUDENTS reported using a computer in MATH class (2007–2008 school year)
6th Grade 7th Grade 8th Grade
Conte Middle School 32 23 28
Herberg Middle School 40 31 27
Reid Middle School 37 62 8
St. Mark/St. Joseph 5 6 0
North 4 9 7
South 12 14 7
Like the Reading/ELA results, a great deal of variation across the BWLI schools as well as across grade levels was observed. Despite this variation, BWLI students typically reported using computers in their Math classes with greater frequency than students in the two comparison schools over the course of the 2007–2008 school year. As the table shows, each BWLI school exhibited different pat-terns of computer use across each of the different grade levels. For example, Reid students reported the most frequent use of computers in Math class compared to the other BWLI 7th grades (62 times per year, or about every third day), but exhibited substantially less use in the 8th grade class (8 times per year). St. Joseph 8th graders again reported not using their computers in Math class while use in the 6th and 7th grades at St, Mark was sporadic and comparable to students in the comparison schools who generally reported using computers in math between 4 and 14 times during this same period. Table S7, below, displays the average number of school days students reported that their teachers used a computer in their Math classes during the 2007–2008 school year.
Table S7: Number of school days students reported their TEACHER using a computer in MATH class (2007–2008 school year)
6th Grade 7th Grade 8th Grade
Conte Middle School 123 96 73
Herberg Middle School 113 113 87
Reid Middle School 66 98 81
St. Mark/St. Joseph 31 46 0
North 74 112 96
South 103 126 91

inTASC REPORT: Berkshire Wireless Learning Initiative, Final Evaluation Report, March 200978
Like the other patterns of Year 2 student and teacher computer use, Table 11 shows that teach-ers’ use of technology in Math classes varied across the BWLI schools as well as across different grade levels within the schools. Like the Reading/ELA results, the relationship between students’ and teachers’ use of technology within Math classes was found to be positive, indicating that class-rooms where teachers regularly used technology were often classes where students used technology. However, the large differences observed between the BWLI and comparison student use of comput-ers was not shared for teachers’ computer use in Math classes where the comparison school teachers actually made widespread use of technology in their teaching, often more frequently then the BWLI teachers.
As Table S7 displays, many of the BWLI schools again exhibited different patterns of computer use across each of the different grade levels. For example, Conte 6th grade teachers were reported to use computers in Math class more than the other BWLI grade levels, (123 times per year). Teach-ers of 6th and 7th grade at St. Mark were reported to regularly use computers in their Math classes, but much less frequently than at the other BWLI schools. However, 8th grade students at St. Joseph reported their Math teachers again used their computers so rarely during the 2007–2008 school year that the school average was below once per year.
Table S8 continues the exploration of students’ use of technology during the second year of the BWLI implementation, showing the average number of school days students reported using a com-puter in Social Studies class (2007–2008 school year).
Table S8: Number of school days STUDENTS reported using a computer in SOCIAL STUDIES class (2007–2008 school year)
6th Grade 7th Grade 8th Grade
Conte Middle School 7 27 40
Herberg Middle School 39 41 66
Reid Middle School 24 123 74
St. Mark/St. Joseph 47 86 3
North 4 7 12
South 7 12 6
Like the results for the other subject areas, there was again substantial variation in the frequency of Social Studies computer use across the BWLI schools and across grade levels within each 1:1 school. Despite this variation, BWLI students typically reported using computers in their Social Studies classes with much greater frequency than students in the two comparison schools over the course of the 2007–2008 school year. As Table S8 shows, each BWLI school exhibited somewhat dif-ferent patterns of computer use across different grade levels. For example, the Conte and Herberg results show an increasing use of computers in Social Studies as students reach the upper grade lev-els. A different pattern emerged at Reid where students reported the most frequent use of computers

inTASC REPORT: Berkshire Wireless Learning Initiative, Final Evaluation Report, March 200979
in Social Studies class occurred in the 7th grade classes, the greatest for any school cohort (123 times per year). Students at the comparison schools reported using computers in Social Studies between 4 and 12 times during the year, on average. Table S9, below, displays the average number of school days students reported that their teachers used a computer in their Social Studies classes during the 2007–2008 school year.
Table S9: Number of school days students reported their TEACHER using a computer in SOCIAL STUDIES class (2007–2008 school year)
6th Grade 7th Grade 8th Grade
Conte Middle School 80 37 62
Herberg Middle School 94 98 118
Reid Middle School 52 131 118
St. Mark/St. Joseph 49 129 35
North 56 107 107
South 93 126 102
For most grade levels and schools, the results show that teachers used computers more fre-quently than their students in Social Studies (Table S9), which was especially true in the two com-parison schools. However, like the results in other subject areas, the relationship between students’ and teachers’ use of technology within Social Studies classes was positive, indicating again that classrooms where teachers regularly used technology were often classes where students used tech-nology. As such, many of the patterns observed for students’ use of computers in Social Studies classes (Table S8) were similar across the different grade levels at BWLI schools.
Like the other results of Year 3 student and teacher computer use, Table S9 shows that teachers’ use of technology in Social Studies classes varied across the BWLI schools as well as across different grade levels within the schools. However, the large differences observed for student use between the BWLI and comparison schools was not shared for teachers’ computer use in Social Studies classes where comparison school teachers made widespread use of technology in their teaching. Unlike the other subject areas, students reported their St. Joseph teachers did use their BWLI laptops for Social Studies classes during the 2007–2008 school year (35 times on average), but still substantially less then the averages reported across the other BWLI (and comparison school) 8th grades.

inTASC REPORT: Berkshire Wireless Learning Initiative, Final Evaluation Report, March 200980
Table S10 completes the exploration of students’ use of technology during the second year of the BWLI implementation (2007–2008 school year) across primary subject areas showing the average number of school days students used a computer in Science class.
Table S10: Number of school days STUDENTS reported using a computer in SCIENCE class (2007–2008 school year)
6th Grade 7th Grade 8th Grade
Conte Middle School 56 38 58
Herberg Middle School 23 64 26
Reid Middle School 20 30 54
St. Mark/St. Joseph 29 58 2
North 7 6 9
South 5 12 6
BWLI students typically reported using computers in their Science classes much more frequent-ly than students across the two comparison schools during the course of the 2007–2008 school year. As Table S10 shows, each BWLI school exhibited somewhat different patterns of computer use across different grade levels. For example, the Conte students again reported the least use at 7th grade while the opposite was reported at Herberg where 7th grade use was most frequent. Reid showed an increase in use over the three grade levels. Students at the two comparison schools gen-erally reported infrequent use of computers in Science (between 5 and 12 times during the year, on average).
Table S11, below, shows the average number of school days students reported that their teachers used a computer in their Science classes during the 2007–2008 school year.
Table S11: Number of school days students reported their TEACHER using a computer in SCIENCE class (2006–2007 school year)
6th Grade 7th Grade 8th Grade
Conte Middle School 109 73 87
Herberg Middle School 97 99 92
Reid Middle School 48 91 94
St. Mark/St. Joseph 42 95 3
North 55 98 99
South 91 142 99

inTASC REPORT: Berkshire Wireless Learning Initiative, Final Evaluation Report, March 200981
For nearly all grade levels and schools, Table S11 shows that BWLI teachers used computers with a fairly similar frequency as Science teachers in the two comparison schools during the final year of the BWLI implementation. However, like the other subject areas results, Table S11 shows that teachers’ use of technology in Science classes varied across the BWLI schools as well as across the different grade levels within each schools. Conte 6th grade science teachers had the most fre-quent use of the BWLI grades and schools (109 days per year), however, the 7th grade science teachers at the South comparison school used technology nearly every day (142 days per year). At St. Mark, teachers were reported to use computers in science classes substantially more frequently in 7th grade than grades 6 while St. Joseph teachers again were reported to only very rarely use technology in class.
Tables S4 through S11 explore the average frequency of computer use across the core curricu-lum for BWLI and comparison school students and teachers during the second year of the BWLI implementation. Across nearly all BWLI schools, there was variation reported across grade levels in how frequently students and teachers within a school used their BWLI laptops. Such patterns and variation in computer use illustrates the complicated nature of summarizing and presenting com-plex technology use data.
Figure S2: Average number of school days students reported using technology by primary subject area (2007–2008 school year)
Figure S2 displays the average number of days students reported using computers across four primary subject areas during the potential 180 school days of the 2007–2008 school year. In the above figure, students’ frequency of computer use is represented by four horizontal bars cor- responding to the four surveyed subject areas. A number of interesting and noteworthy features are
0 30 60 90 120
4627
2650
42
826
15678
2211
98
6945
3350
57
49
00
3673
34
37Herberg
Reid
St. Joseph’s
South
North
St. Mark
Conte ELA/Reading
Math
Social Studies
Science

inTASC REPORT: Berkshire Wireless Learning Initiative, Final Evaluation Report, March 200982
prominent in Figure S2. First, there is substantial variability in the frequency of use across subject areas within most of the BWLI schools. For example, students across all grade levels at St. Mark reported using their computers over 80 times in ELA and nearly 70 times Social Studies classes dur-ing the 2007–2008 school year while only 6 times in their Math classes. Looking across the schools for subject area trends, we find that in two of the five BWLI schools, students used computers in social studies class more than other subjects, while students at Conte reported using computers the least social studies. In other words, no single subject area received universal high use at more than two BWLI schools, suggesting that factors within each school play a larger role in the adoption and student use of technology than factors related to individual subject areas. Despite this variation, student use of technology in Math class was reported less frequent than most other subjects in most of the BWLI settings.
Looking cumulatively across the BWLI school averages during the 2007–2008 school year, St. Joseph students reported the least frequent use with the average St. Joseph student reporting a total of 6 instances of computer use across these primary subject areas during the 2007–2008 school year. Students at St. Mark’s School reported the most frequent cumulative use with the average student re-porting that they had used a computer across these four classes on 202 occasions during the school year. Close behind, the average Reid students reported 192 cumulative uses of a computer in these subjects across this same period while Herberg and Conte students reported 177 and 149 respective instances of computer use. What this means is that, on average, BWLI students used their laptop computers on a daily or slightly greater-than-daily basis during the 2007–2008 school year.
When compared to the students in the two matched comparison schools, BWLI students typi-cally reported using technology four or five times more frequently during the 2007–2008 school year, although it is important to consider the variation across and within the 1:1 schools. The dif-ference between the BWLI students and comparison school students’ Year 3 survey results were tested for statistical significance using an analysis of variance. The results of the analysis of variance showed that the difference between the BWLI and comparison students use of technology was sta-tistically significant (p < .0005) across all surveyed subject areas.
In addition to the examination of cumulative student technology use across primary subject areas during the 2007–2008 school year, students also reported their teachers’ frequency of technol-ogy use in the classroom. Figure S3 shows the average number of school days teachers used technol-ogy with their classes as reported by their students during the 2007–2008 school year.

inTASC REPORT: Berkshire Wireless Learning Initiative, Final Evaluation Report, March 200983
Figure S3: Average number of school days teachers used technology with their classes as reported by their students (2007–2008 school year)
In the above figure, teachers’ reported frequency of computer use is represented by four verti-cal bars corresponding to the four surveyed subject areas. Looking cumulatively across the subject areas, we can see that teachers’ reported use of technology fluctuated less than students’ use of technology across subject areas and across schools. In other words, compared to the student use results in Figure S2, there is less variability in teachers’ frequency of technology use across subject areas than was observed for students’ use. In addition, teachers typically used computers substan-tially more frequently than their students did during the 2007–2008 school year. This increased use for teachers was a particularly prominent result in both of the comparison schools where teachers’ frequency of technology often averaged higher than many BWLI schools. In fact, when summing the results across all subject areas, only Herberg teachers averaged more frequent technology use than the teachers in the two matched comparison schools where students reported an average of 356 (North) and 444 (South) instances where their primary subject teachers used a computer during the 2007–2008 school year. St. Joseph students reported the least frequent cumulative use for their teachers with only 38 instances.
Although the difference between the BWLI school and comparison school tallies show that, on average, many BWLI teachers cumulatively used technology less than their comparison school colleagues, individual student data compared from BWLI and comparison school results for each subject area provides a more precise picture.
For each of the surveyed primary subject areas, analysis of variance testing was performed on the frequency of teachers’ computer use as reported by BWLI and comparison school students dur-
0 30 60 90 120 150
7895
5989
353
8739
10091
8580
120107107
110
9371
103105
106
99
00
82100
77
96Herberg
Reid
St. Joseph’s
South
North
St. Mark
Conte ELA/Reading
Math
Social Studies
Science

inTASC REPORT: Berkshire Wireless Learning Initiative, Final Evaluation Report, March 200984
ing the 2007–2008 school year. In Reading/ELA, math, and science classes, the results showed that BWLI teachers had used computers statistically less frequently than the comparison group teach-ers (F=21.5; p < .0005, F=9.1; p =.003, and F= 10.5; p=.001 respectively). However, the differences between the BWLI and comparison school social studies teachers did not yield statistically signifi-cant results. In other words, the difference between 1:1 and non-1:1 teachers’ computer use was no greater than chance for social studies teachers during the 2007–2008 school year.
In the following tables, student technology use is examined in greater detail. Given the fluctua-tions in computer use across grade levels, student results are presented separately across grade levels and schools in Tables S12 through S15. Table S12, below, examines 6th grade BWLI and comparison school students’ technology use in school during the 2007–2008 school year for a wide variety of different educational technology applications.
Table S12: Number of times during the 2007–2008 school year that 6th grade students reported using a variety of specific technology applications in school
Conte Herberg Reid St. Mark North South
In the last year how often did you use a computer in school to:
Send and receive email 0 11 29 0 2 3
Write first drafts 28 33 38 16 15 10
Edit papers 22 37 33 28 16 15
Create graphs or tables 16 11 13 11 4 2
Find information on the Internet 99 75 69 106 35 19
Create a PowerPoint presentation 35 11 11 6 4 2
Play computer games 71 49 51 25 21 10
Work with spreadsheets/databases 10 9 13 4 4 3
Solve problems 33 27 16 14 6 8
Analyze data 20 16 8 13 5 4
Take a test, quiz, or practice test 34 27 30 4 4 10
Take notes in class 41 16 22 19 4 8
Present information to the class 22 16 15 25 4 4
Keep track of dates and schedule/calendar 17 20 13 1 3 2
Access a teacher’s website 104 45 43 23 3 5
Email a teacher 5 13 28 0 1 2
Help a student fix a computer problem 14 12 9 12 12 9
Help a teacher fix a computer problem 16 7 4 9 5 5

inTASC REPORT: Berkshire Wireless Learning Initiative, Final Evaluation Report, March 200985
Table S12 displays the number of times during the 2007–2008 school year that 6th grade stu-dents reported using a variety of specific technology uses in school. Across the 6th grade classes, it is evident from Table S12 that students across the BWLI schools typically used technology for a wide variety of activities and with greater frequency than students at the comparison schools. An analysis of the variance between the BWLI and comparison school 6th grade students determined that the more frequent technology use exhibited by BWLI students represented a statistically significant dif-ference (p<.001) for all uses in Table S12 except using a computer to “help teacher fix a computer problem”. In other words, there was a substantially more frequent technology use in the BWLI 6th grade classes than in the comparison schools for nearly all measured technology uses.
Across the BWLI 6th grade classes, students generally reported that using a computer to “find information on the Internet”, “play computer games”, and “access a teacher’s website” were among the most frequently occurring uses. It should be noted that the typically negative association with computer games may not be warranted, given that the majority of the “games” played by the BWLI students on their computers were educationally based. However, there were substantial differences across patterns of 6th grade computer use at BWLI schools. For example, 6th grade students at St. Mark used computers more often than students at other schools to “find information on the In-ternet,” but rarely used their laptops to “keep track of dates and schedule/calendar” or “take a test, quiz or practice test”. Similarly, students at Conte used computers to “access a teacher’s website” more frequently than across other 6th graders at 104 days per year, 2 to 4 times the frequency at the other BWLI schools. Below, this same survey data is explored for 7th grade students at BWLI and comparison schools.

inTASC REPORT: Berkshire Wireless Learning Initiative, Final Evaluation Report, March 200986
Table S13: Number of times during the 2007–2008 school year that 7th grade students reported using a variety of specific technology applications in school
Conte Herberg Reid St. Mark North South
In the last year how often did you use a computer in school to:
Send and receive email 1 14 14 9 1 7
Write first drafts 16 34 32 51 11 12
Edit papers 11 34 35 54 11 16
Create graphs or tables 9 17 19 9 11 9
Find information on the Internet 72 96 90 143 34 40
Create a PowerPoint presentation 20 29 39 27 6 6
Play computer games 36 23 54 26 24 19
Work with spreadsheets/databases 8 11 9 11 6 6
Solve problems 24 31 25 32 9 13
Analyze data 8 16 17 18 7 8
Take a test, quiz, or practice test 15 20 36 70 11 21
Take notes in class 21 23 55 28 5 6
Present information to the class 14 28 24 25 5 7
Keep track of dates and schedule/calendar 11 16 15 16 4 4
Access a teacher’s website 50 50 72 53 4 5
Email a teacher 2 10 18 5 2 5
Help a student fix a computer problem 7 9 10 11 17 9
Help a teacher fix a computer problem 4 5 6 6 8 5
Table S13 shows the number of times during the 2007–2008 school year that 7th grade students reported using a variety of specific technology uses in school. Across the 7th grade classes, it is clear from Table S13 that students in the BWLI schools typically used technology for a wide variety of activities and with greater frequency than students at the comparison schools. An analysis of the variance between the BWLI and comparison school 7th grade students’ determined that the more frequent technology use exhibited by BWLI students represented a statistically significant difference (p<.05) for all of the uses listed in Table S13 except using a computer to “help teacher fix a computer problem”. In other words, like the 6th grade results, there was substantially more computer use in the BWLI 7th grade classes than in the respective comparison classrooms across nearly all measured technology uses.

inTASC REPORT: Berkshire Wireless Learning Initiative, Final Evaluation Report, March 200987
Across the BWLI 7th grade classes, students again reported that using a computer to “find information on the Internet,” “access a teacher’s website” and “play computer games” were gen-erally among the most frequently occurring uses. However, there were some substantial differ-ences across patterns of 7th grade computer use at BWLI schools. For example, Reid 7th graders reported accessing a teacher’s web site on 72 days during the school year while this occurred about 50 times for each of the other BWLI schools. While using a computer to “find information on the Internet” was the most frequent use across all four BWLI schools, this activity was substantially more frequent at St. Mark’s (143 days per year). The frequency of “playing computer games” and “take a test, quiz or practice test” was also reported by students to widely vary across the BWLI schools. Below, this same survey data is presented for 8th grade students across BWLI and compari-son schools.
Table S14: Number of times during the 2007–2008 school year that 8th grade students reported using a variety of specific technology applications in school
Conte Herberg Reid St. Joseph North South
In the last year how often did you use a computer in school to:
Send and receive email 2 19 20 14 2 1
Write first drafts 26 30 31 3 10 11
Edit papers 23 36 39 3 12 12
Create graphs or tables 15 17 14 1 5 4
Find information on the Internet 88 89 85 16 34 33
Create a PowerPoint presentation 39 18 28 2 10 2
Play computer games 19 19 20 8 11 10
Work with spreadsheets/databases 9 6 7 0 4 2
Solve problems 22 26 21 0 4 5
Analyze data 13 15 10 0 4 3
Take a test, quiz, or practice test 25 22 19 1 6 6
Take notes in class 38 61 47 2 5 2
Present information to the class 24 19 18 1 8 3
Keep track of dates and schedule/calendar 9 15 8 0 2 2
Access a teacher’s web site 71 58 29 1 3 5
Email a teacher 2 21 16 0 2 0
Help a student fix a computer problem 7 13 13 7 13 9
Help a teacher fix a computer problem 2 5 3 1 8 5

inTASC REPORT: Berkshire Wireless Learning Initiative, Final Evaluation Report, March 200988
Table S14 displays the number of times during the 2007–2008 school year that 8th grade stu-dents reported using a variety of specific technology uses in school. Table S14 shows that students across the BWLI schools used technology for a wide variety of activities and with greater frequency than students at the comparison schools. An analysis of the variance between the 8th grade BWLI and comparison school students showed that the more frequent technology use reported by BWLI students represented a statistically significant difference (p<.001) across all uses. Like the student results for the 6th and 7th grade, the grade 8 results show that there was substantially more frequent technology use in the BWLI 8th grade classes than in the comparison schools for all measured technology uses.
Across the BWLI 8th grade classes, students generally reported that using a computer to “find information on the Internet”, “take notes in class” and “access a teacher’s website” were among the most frequently occurring student uses. However, like the results from grades six and seven, notable differences were observed across the patterns of 8th grade computer use in the BWLI schools. For example, the frequency of students using a computer to “access a teacher’s web site”, “take notes in class” and use email was reported to vary widely across the BWLI 8th grade classes.
Below, this same survey data is explored across all grade levels for BWLI and comparison students. Table S15 shows the number of times during the 2007–2008 school year that students reported using a variety of specific technology uses during the 2007–2008 school year.

inTASC REPORT: Berkshire Wireless Learning Initiative, Final Evaluation Report, March 200989
Table S15: Number of times during the 2007–2008 school year that students across all grade levels reported using a variety of specific technology applications in school
Conte Herberg Reid St. Joe St. Mark North South
In the last year how often did you use a computer in school to:
Send or receive email 1 15 21 14 5 2 4
Write first drafts 23 32 34 3 37 13 11
Edit papers 19 36 36 3 43 14 14
Create graphs or tables 13 15 15 1 10 6 5
Find information on the Internet 86 87 81 16 127 35 30
Create a powerpoint presentation 32 19 26 2 18 6 3
Play computer games 41 30 42 8 26 19 13
Work with spreadsheets/databases 9 9 10 0 8 5 3
Solve problems 26 28 21 0 24 6 9
Analyze data 14 16 12 0 16 5 5
Take a test, quiz, or practice test 24 23 28 1 42 6 12
Take notes in class 34 35 42 2 25 4 5
Present information to the class 20 21 19 1 25 5 5
Keep track of dates and schedule/calendar 12 17 12 0 10 3 3
Access a teacher’s website 73 51 48 1 40 3 5
Email a teacher 3 15 21 0 3 1 2
Help a student fix a computer problem 9 11 10 7 11 13 9
Help a teacher fix a computer problem 5 6 4 1 7 6 5
Summarizing the grade-by-grade analyses of student use presented in Tables S12, S13, and S14, this table represents thousands of students’ survey responses to provide some estimate of the overall frequency of these specific types of technology across the five BWLI schools and the two comparison schools. As Table S15 shows, BWLI students used technology across a wide variety of applications and with substantially greater frequency than students in the comparison schools. Again, like the previously presented results and the individual grade level comparisons, there was often substantial variation in the frequency of technology use across the five BWLI schools.
When looking at the cumulative results across all of the technology use categories in Table S15, Herberg, Reid, and St. Mark students exhibited the highest frequency of specific technology uses per student, trailed slightly by Conte students. St. Joseph students reported the least frequent use of technology of any school, including the two comparison schools where students had limited tech-nology access.

inTASC REPORT: Berkshire Wireless Learning Initiative, Final Evaluation Report, March 200990
By far, the most frequently reported technology use at both BWLI and comparison schools was using a computer “to find information on the Internet”. Other frequent uses of technology in the 1:1 settings included using a computer to: “access a teacher’s web site”, “play computer games”, “take notes in class” and “edit papers using a computer”. Some of the least frequent in-school tech-nology uses during the 2007–2008 school year included were to “help a teacher fix a computer prob-lem,” “work with spreadsheets or databases,” “email a teacher,” and “help a student fix a computer problem.”
Comparing Student Use Over Time
Up until now all of the student survey data examined in this report explored the differences between patterns of technology use across grade levels, across subject areas, and across the BWLI and comparison schools collected during the third and final year of BWLI deployment (2007–2008 school year). However, student data was collected in BWLI and comparison schools on three occa-sions before the 2007–2008 school year which allows for further exploration of how computer use and teaching and learning practices have changed since the students began using laptops across the BWLI schools.
Before the data from past survey administrations can be compared to past results, survey data from the January 2006 7th grade survey and from the school wide May 2006 survey needed a math-ematical transformation to conform to the technology use scale used in the 2007 and 2008 surveys. This transformation is the result of a change in the way the student survey collected information about students’ use of computers. Specifically, a methodological improvement was made to the May/June 2007 student survey, which provided much broader and more realistic response options for students to describe the frequency of their technology use both at home and at school.
In the pre-2007 student surveys, the student survey response options consisted of five discrete categorical response options: “never”, “every couple of months”, “once a month”, “once a week”, and “everyday”. When the data was analyzed a numeric value was assigned to each response option such that “never” was coded as a zero and “every day” was coded as four. This common practice of assigning linear numeric values to survey responses allows for empirical analyses across schools and over time. However, from a measurement point of view, the values assigned to the preceding surveys were somewhat arbitrary (with the exception of zero which indicated that a student never used technology). Although nearly all educational research has employed the use of such discrete categorical response options on surveys, the Boston College researchers recognized an opportunity to provide students with a more expansive (and more accurate) means of reporting the frequency of their computer use. Custom designed Adobe Flash sliding scales were imbedded within the online student survey beginning with the May/June 2007 surveys. The “sliding scales” presented survey respondents with a visually accurate scale where they could quickly select the frequency of technol-ogy use on a 180 point scale representing the potential 180 days in the school year. In earlier pilot testing for these new scales, the Boston College researchers learned that responses on such scales were most accurate when the original categorical response option text (i.e. “never”, “every couple of months”, “once a month”, etc.) was presented in addition to the numeric equivalent (0–180) on screen (http://nimbletools.com/).

inTASC REPORT: Berkshire Wireless Learning Initiative, Final Evaluation Report, March 200991
With these Adobe Flash response options, students can select any value on a 180-point scale using their mouse to drag an arrow across a sliding scale. In every case, the same survey questions and categorical response names were presented, but the May 2007 and May 2008 surveys provided students with more realistic and accurate response options. However, to compare past categorical survey data with data collected using the full 180-point scale, the old data must first be converted to the 180 point scale. Assuming that the 2007–2008 school year equaled 180 days, or 9 months, or 36 weeks, the old five point scale was transposed to a 180-point scale to provide an equivalent estimate of computer use across survey administrations. This approach results in a 180-point scale where 0 represents a teacher never using technology and 180 represents everyday use of technology. Table S16, below, shows the conversion chart used to transpose the January 2006 and May 2006 student data onto the 180-point technology use scale.
Table S16: Conversion table for transposing the January 2006 and May 2006 student survey data to 180-point scale
2006 raw data Response Choice Assigned value (2007 and 2008 analysis)
0 Never 0
1 Every couple of months 5
2 Once a month 9
3 Once a week 36
4 Every day 180
This 180-point scale provides easier interpretation and presentation of summary data because the difference between the numbers actually reflects a real difference in the amount of attribute measured (Glass & Hopkins, 1996). However, the accuracy attributable to the May 2007 and May 2008 data (bolstered as well by the excellent Year 2 response rates) does not extend to the prior stu-dent survey data, despite the fact it can be presented on a 180-point scale. However, the figures and analyses presented below provide a detailed and accurate representation of students technology use across each grade before laptops were deployed and again at the end of the 2007–2008 school year.
In the following results, summaries of BWLI and comparison school students’ frequency of various technology uses are reported over multiple survey administrations. Given that the BWLI student laptop deployment was staggered across grade levels, the corresponding pre- and post- lap-top student surveys followed the same schedule. Thus, the figures below are presented for individual grade levels and subject areas before whole school summaries are presented. The individual trends across schools for pre- and post- student laptop averages are interesting in that they allow a more direct comparison across the BWLI schools and comparison schools than had been possible when only Year 1 data was available. For example, Figure S4 shows the average number of days students used technology in their classrooms across past survey administrations.

inTASC REPORT: Berkshire Wireless Learning Initiative, Final Evaluation Report, March 200992
In addition to providing a summary of the technology use in the classroom, Figure S4 also dis-plays the overall structure of the available longitudinal data. Only 7th graders completed the first January 2006 survey as the first year of the BWLI program provided laptop computers only to grade seven students beginning in early 2006. At the end of the 2005-2006 school year students across all grade levels completed a survey. So, the May 2006 survey is a pre-laptop survey for 6th and 8th grade students but reflects approximately four months of 7th graders in 1:1 classrooms. It was an unfortunate coincidence that no 7th grade students from either comparison school completed the May 2006 survey due to a scheduling error at the end of the 2005–2006 school year. However, 7th grade pre/post comparisons can be made using the subsequent June 2007 and June 2008 surveys collected from both BWLI and comparison school 7th graders.
Figure S4: Average number of days students reported using technology in their classrooms across past survey administrations
Figure S4 displays the average number of days students reported using technology in their class-rooms across all past survey administrations (January 2006, June 2006, June 2007, and June 2008). Overall, it is clear from viewing Figure S4 that there were substantial increases in the frequency of technology use for BWLI students between their pre-laptop surveys (January 06) and their post-laptop surveys (June 06). This increased use is found across all grade levels for BWLI students while in-class technology use in the comparison schools changed little. For example, in grades 7 and 8 there was almost a five-fold increase in the frequency of technology use in the classroom reported by the BWLI students while 6th graders reported a less substantial increase between survey ad-ministrations. After the initial increase in use, Grade 7 and 8 witnessed a gradual decrease in the frequency of use with subsequent survey administrations.
Figure S5 begins a grade by grade analysis of students’ reported technology use since the begin-ning of the BWLI program with a summary of the number of days that BWLI and comparison 6th grade students reported using computers across their primary subject classes.
0 20 40 60 80 100 120 140
Gra
de 6
Gra
de 7
Gra
de 8
2878
90
21
20106
2521
90
30
2418
37
128
32
10896
29
21
Comparison
BWLI
Comparison
Comparison
BWLI
BWLI Jan 06
June 06
June 07
June 08

inTASC REPORT: Berkshire Wireless Learning Initiative, Final Evaluation Report, March 200993
Figure S5: Number of days over the BWLI implementation years that BWLI and comparison 6th grade students reported using computers across their primary subject classes
Figure S5 shows the number of days that 6th grade BWLI and comparison students reported using computers in their primary subject classes. Specifically, average 6th grade students’ use of technology across Reading/ELA, Social Studies, Math, and Science classes are compared from June 2006 (when no 6th grade students had laptops) to the June 2007 survey (when 6th grade BWLI stu-dents had their 1:1 laptops for approximately five months) and June 2008 survey (when 6th grade students had 1:1 laptops for the full school year).
Accordingly, the average 6th grade students’ use of technology in the BWLI settings increased dramatically across all subject areas since the first student surveys, particularly when compared to comparison school averages were which little changed. From Year 2 to Year 3, ELA and Science student use continued to increase in the BWLI settings while use stayed about the same in Social Studies and decreased slightly in Math. There were fewer changes in the comparison schools. Addi-tionally, BWLI grade 6 students continued to use technology more in ELA than other classes, while the differences between subjects was not as great in the comparison schools.
0 10 20 30 40 50 60
ELA
Mat
hSo
cial
Stu
dies
Scie
nce
2147
55
28
1110
2428
615
3935
22
11
27
1415
5
888
612
6
Comparison
BWLI
Comparison
Comparison
BWLI
BWLI
June 06
June 07
June 08
Comparison
BWLI

inTASC REPORT: Berkshire Wireless Learning Initiative, Final Evaluation Report, March 200994
Figure S6, below, continues this exploration of pre/post 6th grade computer use by exploring the number of days that BWLI and comparison 6th grade teachers were reported by their students to be using computers across their primary subject classes across three different administrations of the student survey.
Figure S6: Number of days in the school year that BWLI and comparison students reported that their 6th grade teachers used computers in their primary subject classes
It should be noted here that all grade levels of BWLI teachers were provided their own lap-tops early in the 2005–2006 school year so that all three survey administrations represent learning settings where teachers in the BWLI schools had laptop computers. Thus, Figure S6 illustrates the difference between teachers’ use of technology with their students during a time period when stu-dent access to technology increased at the BWLI schools (June 07 and June 08 surveys) but not in the comparison schools.
Although BWLI teachers increased the frequency of technology use in every surveyed subject area, the differences over time in 6th grade teachers’ use of technology presents a more compli-cated story than the 6th grade student results. For example, results from the June 2006 survey show quite similar patterns and frequency of technology use across both BWLI and comparison teachers. Looking at the June 2007 survey results, after 6th grade BWLI students had access to laptops for about half the 2006–2007 school year, we observe a modest increase in the frequency of technology use across all subject areas in the BWLI setting. However, increases in the 6th grade comparison schools during the 2006–2007 were larger than those reported in the BWLI schools. Comparing the BWLI teachers’ and comparison school teachers’ use of technology collected during the June 2007 survey, we see that BWLI teachers used technology less than comparison school teachers in every
0 20 40 60 80 100 120 140
ELA
Mat
hSo
cial
Stu
dies
Scie
nce
80106
98
73
11372
8872
73
69
9488
79
79
80
11397
67
73118
91
73107
77
Comparison
BWLI
Comparison
Comparison
BWLI
BWLI
June 06
June 07
June 08
Comparison
BWLI

inTASC REPORT: Berkshire Wireless Learning Initiative, Final Evaluation Report, March 200995
surveyed subject area. Although, these differences are generally small they show that comparison group teachers were frequently using technology with students across all primary subject areas dur-ing the 2006–2007 school year.
Although the frequency of 6th grade teachers use of technology continued to be widespread across the curriculum during the third and final year of the BWLI implementation, the average frequency of teacher use in both BWLI and comparison settings nearly dropped back to the original June 2006 averages. For every subject, teachers reported frequency of technology use during Year 3 (June 2008) were still at least somewhat greater than recorded in the 6th grade pre-1:1 student laptop survey (June 06).
Figure S7: Number of days in the school year that BWLI and comparison 7th grade students reported using computers across their primary subject classes
Figure S7 shows the number of days that BWLI and comparison school 7th grade students reported using computers in their primary subject classes. Specifically, average 7th grade student use of technology in Reading/ELA, Math, Social Studies, and Science classes from the January 2006 survey (before 7th grade students had been issued laptops) is compared to the June 2007 results (after BWLI 7th grade students had 1:1 laptop access for nearly a full school year) and the June 2008 survey results (after two years of 1:1 student computing in 7th grade).
The average 7th grade students’ use of technology in the BWLI settings peaked across nearly subject areas during the second year of the BWLI program, except Social Studies where student use at BWLI schools peaked during Year 3 (June 2008). Despite the decrease in student use observed in Year 3 of the implementation, the use of technology at BWLI schools was still substantially greater
0 10 20 30 40 50 60 70 80
ELA
Mat
hSo
cial
Stu
dies
Scie
nce
1260
48
73
128
6546
10
6
6639
19
14
62
2820
5
1610
12
914
9
Comparison
BWLI
Comparison
Comparison
BWLI
BWLI
Jan. 06
June 07
June 08
Comparison
BWLI

inTASC REPORT: Berkshire Wireless Learning Initiative, Final Evaluation Report, March 200996
than at the comparison schools. For example, looking at only the January 2006 results (pre-1:1 lap-tops), we see that the BWLI 7th grade students reported using computers about twenty times per year in their Math classes, while 12 times per year in their Reading/ELA classes and approximately 5 times in Social Studies and Science. Comparison students during this same period report quite similar computer use in their classes. Looking to the June 2007 7th grade survey results (post- 1:1 laptops), BWLI students reported widespread and dramatic increases in the frequency of their com-puter use, with the most frequent use now reported in Math and Science classes. More specifically, 7th grade BWLI students reported using computers 60 or more times per year in each surveyed subject area with the largest proportional increases observed for Science and Social Studies class averages. In the comparison schools, such substantial increases were not observed, although the fre-quency of computer use in Reading/ELA classes doubled between the January 2006 and June 2007 surveys. In the June 2008 survey (Year 3), BWLI students report using computers most frequently in social studies classes where use continued to increase, while math and science classes witnessed the greatest decrease in use. Comparison schools had relatively little change from Year 2 (June 2007) to Year 3 (June 2008) surveys.
Figure S8, below continues this exploration of pre/post 7th grade computer use by exploring the average number of days that BWLI and comparison 7th grade teachers were reported to use their computers across their primary subject classes in all three school years.
Figure S8: Number of days in the school year that BWLI and comparison students reported that their 7th grade teachers used computers in their primary subject classes
0 20 40 60 80 100 120 140
ELA
Mat
hSo
cial
Stu
dies
Scie
nce
759494
102
103121
10391
118
63
10199
82
107
91
111129
66
11095
120
106100
123
Comparison
BWLI
Comparison
Comparison
BWLI
BWLI
June 06
June 07
June 08
Comparison
BWLI

inTASC REPORT: Berkshire Wireless Learning Initiative, Final Evaluation Report, March 200997
Figure S8 shows 7th grade teachers’ use of technology in Reading/ELA, Social Studies, Math, and Science classes compared from the January 2006 survey (before 7th grade students had been assigned laptops) to the June 2007 survey (after the BWLI 7th grade students had 1:1 laptop access for the school year) and June 2008 (the second year of 7th grade 1:1 computing). It should be noted again that all BWLI teachers were provided their own laptops early in the 2005–2006 school year so that all survey administrations represent learning settings where teachers in the BWLI schools had laptop computers. Thus, Figure S8 illustrates the difference between teachers’ use of technology with their students during a time period when student access to technology increased at the BWLI schools but not in the comparison schools.
Although BWLI teachers increased the frequency of technology use in every surveyed subject area between Year 1 (June 2006) and Year 2 (June 2007), the results were relatively similar between Year 2 (June 2007) and Year 3 (June 2008). The largest changes observed across BWLI teachers from Year 2 to Year 3 was a decrease in the frequency of use by Science teachers and an increase by Social Studies teachers.
However, 7th grade comparison teachers’ use during the 2006–2007 school year decreased somewhat since the January 2006 averages, but increased in all subjects during the third year of data collection (June 2008). Comparing the BWLI teachers and comparison school teachers’ use of technology during the final June 2008 survey, BWLI teachers used technology less on average than the comparison school teachers in each of the four primary subject areas. Looking only at the Year 3 usage (June 2008) BWLI 7th grade teachers used technology most frequently in social studies (102 times per year) and math (99 times per year).
Figure S9: Number of days in the school year that BWLI and comparison 8th grade students reported using computers across their primary subject classes
0 10 20 30 40 50 60 70 80
ELA
Mat
hSo
cial
Stu
dies
Scie
nce
1465
54
62
812
6841
9
8
2720
9
24
49
1621
9
810
7
166
8
Comparison
BWLI
Comparison
Comparison
BWLI
BWLI
June 06
June 07
June 08
Comparison
BWLI

inTASC REPORT: Berkshire Wireless Learning Initiative, Final Evaluation Report, March 200998
Figure S9 shows the average number of days that BWLI and comparison school 8th grade stu-dents reported using computers in their primary subject classes. Specifically, 8th grade student use of technology in Reading/ELA, Social Studies, Math, and Science classes are compared from the January 2006 survey (before 8th grade students had received laptops) to the June 2007 survey (after the BWLI 8th grade students had 1:1 laptop access for the school year) and June 2008 (the second year of 8th grade 1:1 computing).
Accordingly, the average 8th grade students’ use of technology in the BWLI settings peaked across nearly all subject areas during the second year of the BWLI program, except Social Studies where student use at BWLI schools peaked during Year 3 (June 08). Despite the decrease in student use observed in Year 3 of the implementation, the use of technology at BWLI schools was still sub-stantially greater across the comparison schools.
June 2006 results (pre-1:1 laptops), we see that the BWLI 8th grade students reported using computers about nine times per year in their Math classes, while 14 times per year in their Reading/ELA classes and approximately 8 times in Social Studies and Science. Comparison students during this same period report quite similar or greater computer use in their classes. Looking to the June 2007 8th grade survey results (post- 1:1 laptops), BWLI students reported widespread and dramatic increases in the frequency of their computer use, with the most frequent use now reported in ELA and Science classes. During this same period in the comparison schools, such substantial increases were not observed. In the June 2008 survey (Year 3), BWLI students report using computers most frequently in social studies classes where use continued to increase, while math, science and ELA classes witnessed decreases in Year 3 use. Like the 7th grade results, comparison schools results from the Year 2 (June 2007) to Year 3 (June 2008) surveys changed relatively little. Figure S10 com-pletes the exploration of student and teacher technology use across the curriculum over the course of the BWLI implementation showing the average number of days that BWLI and comparison 8th grade teachers were reported to use their computers across their primary subject classes in all three school years.

inTASC REPORT: Berkshire Wireless Learning Initiative, Final Evaluation Report, March 200999
Figure S10: Number of days in the school year that BWLI and comparison students reported that their 8th grade teachers used computers in their primary subject classes
Figure S10 shows the average number of days that 8th grade teachers were reported to use tech-nology across four primary subject areas. Specifically, grade 8 teachers’ use of technology in Read-ing/ELA, Social Studies, Math, and Science classes are compared from the June 2006 survey (before 8th grade students had been assigned laptops) to the June 2007 survey (after the BWLI 8th grade students had 1:1 laptop access for the school year) and the June 2008 survey (the second year of 8th grade 1:1 computing). Again, it should be noted again that all BWLI teachers were provided their own laptops early in the 2005–2006 school year so that all survey administrations represent learning settings where teachers in the BWLI schools had laptop computers. As such, Figure S10 illustrates the difference between teachers’ use of technology with their students during a time period when student access to technology increased at the BWLI schools but not in the comparison schools.
Although BWLI teachers increased the frequency of technology use in every surveyed subject area between Year 1 (June 2006) and Year 2 (June 2007), the results were more similar between Year 2 (June 2007) and Year 3 (June 2008). Despite the BWLI teachers increasing frequency of technol-ogy use across subject areas, the differences in 8th grade teachers’ use of technology were again less robust than their student results were over time. For example, results from the June 2006 survey show that comparison school teachers were using technology with greater frequency than BWLI teachers in all surveyed subject areas. Looking at the June 2007 survey results (after grade 8 BWLI students were provided laptops), we observe increases in BWLI teachers’ frequency of technology use across all subjects. However, when examining the Year 3 teacher data (June 2008), the BWLI 8th grade teachers were reported to be using technology slightly less frequently than the comparison group teachers.
0 20 40 60 80 100 120
ELA
Mat
hSo
cial
Stu
dies
Scie
nce
7889
97
104
98111
9789
104
75
7879
69
107
87
104110
64
9091
93
9793
99
Comparison
BWLI
Comparison
Comparison
BWLI
BWLI
June 06
June 07
June 08
Comparison
BWLI
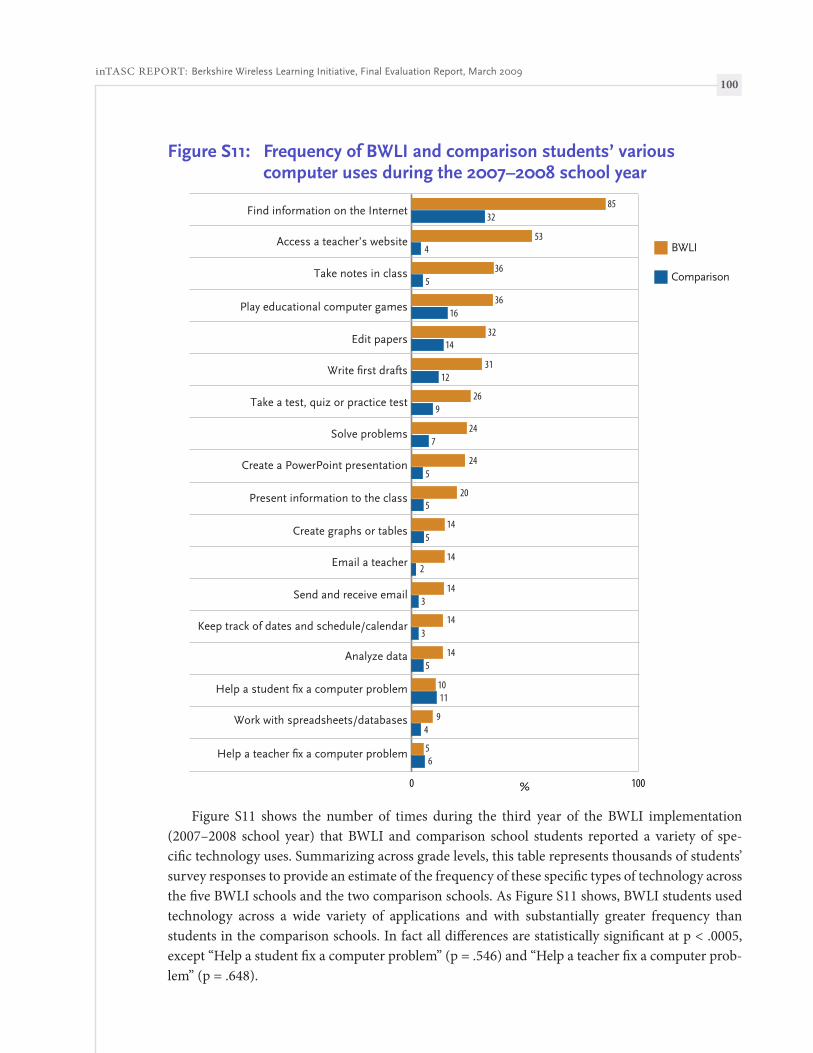
inTASC REPORT: Berkshire Wireless Learning Initiative, Final Evaluation Report, March 2009100
Figure S11: Frequency of BWLI and comparison students’ various computer uses during the 2007–2008 school year
Figure S11 shows the number of times during the third year of the BWLI implementation (2007–2008 school year) that BWLI and comparison school students reported a variety of spe-cific technology uses. Summarizing across grade levels, this table represents thousands of students’ survey responses to provide an estimate of the frequency of these specific types of technology across the five BWLI schools and the two comparison schools. As Figure S11 shows, BWLI students used technology across a wide variety of applications and with substantially greater frequency than students in the comparison schools. In fact all differences are statistically significant at p < .0005, except “Help a student fix a computer problem” (p = .546) and “Help a teacher fix a computer prob-lem” (p = .648).
0 100
36
36
12
20
14
24
24
269
4
32
7
16
14
5
5
5
5
5
56
32
53
85
14
14
14
2
31
3
3
14
49
1011
BWLI
%
Comparison
Access a teacher’s website
Send and receive email
Take a test, quiz or practice test
Present information to the class
Take notes in class
Keep track of dates and schedule/calendar
Analyze data
Help a student fix a computer problem
Work with spreadsheets/databases
Help a teacher fix a computer problem
Write first drafts
Email a teacher
Solve problems
Play educational computer games
Create a PowerPoint presentation
Create graphs or tables
Find information on the Internet
Edit papers

inTASC REPORT: Berkshire Wireless Learning Initiative, Final Evaluation Report, March 2009101
The table also allows for the comparison of the most-frequently occurring technology uses (found at the top of the table) to the least frequently occurring uses (found at the bottom of the table). By far, the most frequently reported technology use at both BWLI and comparison schools was using a computer “to find information on the Internet”. Other frequent uses of technology in the 1:1settings included using a computer to: “access a teacher’s web site”, “play computer games”, “take notes in class” and “edit papers using a computer”. Some of the least frequent in-school technology uses during the 2007–2008 school year included using a computer to “analyze data”, and “work with spreadsheets/databases”.
Students’ Home Access to Technology
In addition to surveying students’ use of technology in school, the student survey also measured students’ access and use of computers at their home during the academic year. In the following tables, BWLI and comparison students’ access to a home computer is examined across each of the BWLI and comparison schools using the third and final year (June 2008) of student survey results. To begin this exploration of computer use outside of school, Table S17 shows the average estimated number of home computers across BWLI and comparison students.
Table S17: Average number of home computers across BWLI and comparison schools during the 2007–2008 school year
Conte Herberg Reid St. Mark St. Joe North South
How many computers (including a school laptop) do you have at home?
0 7% 5% 6% 2% 0% 6% 5%
1 21% 22% 23% 23% 24% 23% 21%
2 30% 31% 35% 27% 44% 30% 34%
3 or more 42% 42% 37% 48% 32% 42% 40%
Although there are small differences across each of the BWLI and comparison schools, students overwhelmingly reported that they had one or more computers accessible to them at their home. Across all student survey respondents, only 5% of all survey respondents reported that they had no access to a computer at home. Interestingly, looking at a statewide survey data collected by the Massachusetts Department of Education similarly revealed that the 95% of the state’s 70,000 8th grade public school students reported having at least one home computer in a Spring 2007 Ques-tionnaire (2007 State Questionnaire Summary; Grade 8 Results Excel Report). In other words, the sample of students from the BWLI and comparison schools looks highly similar to the state average in terms of home access to computers.
Across all of the schools, the percent of students who reported no access to a computer at home ranged from 0% at St. Joseph to 7% at Conte. Despite the relative similarity in the BWLI and com-parison school results, the results summarized in Table S17 requested that students include in their

inTASC REPORT: Berkshire Wireless Learning Initiative, Final Evaluation Report, March 2009102
home computer estimate any school-issued computer if they were being taken home regularly. Thus, all BWLI students had a theoretical chance of taking home a school laptop that was rarely, if at all, afforded to the comparison school students. A more detailed examination of the percent of BWLI students who took school laptops home with them is presented below in Table S18.
Table S18: Percent of students who reported taking a school laptop home with them during the 2007–2008 school year
Conte Herberg Reid St. Mark St. Joe Total Comparison
Total BWLI
Every Day 31% 31% 28% 23% 20% 28% 29%
Once a Week 3% 2% 2% 4% 0% 2% 2%
Once a Month 2% 1% 1% 0% 4% 2% 1%
Every Couple of Months 2% 2% 2% 2% 0% 2% 2%
Never 62% 64% 68% 71% 76% 67% 65%
Table S18 illustrates the percent of students who reported taking a school laptop home with them during the third and final year of the BWLI implementation (2007-2008 school year). In this survey question, students were simply asked to select from five response options on “How often do you take a school computer home with you?” In addition to reporting how regularly students took a school laptop home with them during the third year of the BWLI implementation at each school, the table above also allows a summary of the cumulative take home rates across the BWLI and comparison schools. Overall, 67% of comparison school students reported that they “never” took home a school computer while 65% of all BWLI students reported that they “never” took a school computer home despite their participation in the 1:1 laptop program at their schools. In addition to a major decrease in past take home rates, students across the BWLI schools reported remarkably little variation in the percent of laptop take home rates. Table S19, below, continues the exploration of student access to technology during the 2007–2008 school year by examining students’ ease of access to a computer at their home.

inTASC REPORT: Berkshire Wireless Learning Initiative, Final Evaluation Report, March 2009103
Table S19: Students ease of access to a home computer during the 2007–2008 school year
Conte Herberg Reid St. Mark St. Joseph North South
When you are at home, how difficult is it for you to use a computer when you want to?
Often Difficult 4% 6% 6% 10% 4% 5% 5%
Sometimes Difficult 28% 25% 27% 24% 36% 25% 28%
Never Difficult 67% 68% 67% 66% 60% 70% 67%
Table S19 shows a summary of student responses1 to a June 2008 survey item asking “When you are at home, how difficult is it for you to use a computer when you want to”. Averages across the BWLI and comparison group schools provide an estimate of students’ ease of access to a computer at their home. Across all of the schools, students at the North School reported the least amount of difficulty with 70% of responding students reporting that they “never” have difficulty accessing a computer at home. However, despite some small differences across the schools, BWLI and com-parison school students overwhelmingly report that they experience relatively little difficulty in accessing a computer when they are at home. Despite efforts to have students take BWLI laptops home with them during the 2007–2008 school year, the survey results from the end of final year of implementation show that comparison school students generally had the same degree of access to technology at home. Lastly, in Table S20, below, is the percent of students’ access to the Internet from their home computer during the 2007–2008 school year.
Table S20: Percent of students’ access to the Internet from their home computer during the 2007–2008 school year
Conte Herberg Reid St. Mark St. Joseph North South
What type of internet connection do you have at home?
No home Internet 4% 4% 6% 3% 0% 5% 5%
Modem 13% 11% 11% 4% 4% 12% 11%
DSL or high speed 48% 54% 53% 62% 72% 52% 51%
Not sure 35% 42% 31% 32% 24% 31% 33%
Table S20 shows the average percent of students’ home access to the Internet across each of the BWLI and comparison schools during the 2007–2008 school year. Overall, students in all of the schools overwhelmingly reported that they had an Internet connection on their home computer. In addition, the majority of students at each school reported their home computer was connected to the Internet with high speed/DSL connection (particularly at the parochial schools) while fewer than 12% of students reported having a modem connection.

inTASC REPORT: Berkshire Wireless Learning Initiative, Final Evaluation Report, March 2009104
From Tables S17–S20 it is clear that BWLI and comparison school students had relatively simi-lar access to technology at their homes, despite the fact that BWLI students were provided more opportunities to bring school technology home. Specifically, the vast majority (about 95%) of stu-dents reported having at least one computer accessible at home which was likely connected to a high-speed Internet connection. In addition to the degree to which students could access a home computer, students were also asked to reflect on typical amount of time they use a computer while at home. The following section briefly summarizes students’ use of technology at home during the 2007–2008 school year.
Students’ Home Use of Technology
The tables below summarize students’ frequency and use of computers at home during the 2007–2008 school year. This summary begins with the average number of minutes that students estimated they spent using their home computer on a typical school day and a typical non-school day (weekend, vacation, etc.). Table S21, below, presents these summarized results across each of the BWLI and comparison schools.
Table S21: Average number of minutes students reported using their home computer on a typical day during the 2007–2008 school year
On a typical school day how many minutes would you say that you spend
using a computer at home?
On a typical day when you don’t have school (weekend, vacation, etc.) how many
minutes would you say that you spend using a computer at home?
Conte 60 73
Herberg 57 68
Reid 59 70
St. Mark 54 61
St. Joseph 53 66
North 60 70
South 61 71
Table S21 shows the average number of minutes that students reported they used their home computers during the 2007–2008 school year. Specifically, Table S21 shows the average number of minutes that students across the BWLI and comparison schools used computers on a typical school day and on a typical non-school day. The students who reported having at least one computer at home (95% of all June 2008 survey respondents) averaged about one hour per day using it. Individ-ual responses of students varied: many reported five or more hours of use per day while other stu-dents reported substantially less frequent use. For example, additional analyses showed that older students in both BWLI and non-laptop settings typically used their home computer more frequently

inTASC REPORT: Berkshire Wireless Learning Initiative, Final Evaluation Report, March 2009105
then the younger students reported. Thus, the frequency of home computer use increased as grade level increased. In addition, students across all schools reported that they generally used their home computers more frequently on days when they don’t have school than on typical school days. A more detailed investigation of home computer use is reported in Table S22, which shows the aver-age number of minutes that students estimated they spend using their home computers for a wide variety of tasks.
Table S22: Average number of minutes students reported using their home computer on a typical day for a variety of uses during the 2007–2008 school year
Conte Herberg Reid St. Mark St. Joe North South
How many minutes would you say that you use a computer at home to:
Chat/IM 48 45 46 36 65 51 48
Search the Internet for fun 38 36 34 34 41 40 34
Use a social networking website 38 34 37 27 42 40 37
Play games 32 29 30 33 17 31 29
Download music or video from the web 26 25 26 32 39 27 26
Work on school projects 28 26 27 24 36 28 26
Write papers for school 27 26 26 25 26 28 26
Use email 23 20 22 22 26 26 22
Search the Internet for school 22 18 21 17 25 22 20
Create your own music or video projects 14 12 13 13 18 13 14
Create or maintain a website 12 12 12 11 6 11 15
Shop online 9 9 9 10 13 10 10
Use video or teleconferencing (Skype) 7 5 8 7 10 7 7
Table S22 displays the average number of minutes that students reported using their home com-puter for a variety of uses during the final survey (June 2008). Overall, we can see from Table S22 that students across each of the schools used their home computer for a wide variety of purposes during the third year of the BWLI implementation. Across all of the schools students reported the most time was spent using a home computer to “chat/instant message” with school averages reported between 65 and 36 minutes on a typical day. Students also reported frequent use of their home computer to “search the Internet for fun”, “use a social networking website”, and “play games”. In past surveys (June 2007) students at the BWLI schools generally reported more time devoted to academic tasks on their home computer than students across the two comparison schools. Specifi-

inTASC REPORT: Berkshire Wireless Learning Initiative, Final Evaluation Report, March 2009106
cally, students in the BWLI settings reported somewhat more frequent use of their home computer to “write papers for school” and “search the Internet for school”. However, in the June 2008 survey results, the difference across 1:1 and comparison school shrank between the time devoted to school-related computer use at home. Looking cumulatively across all the measured home technology uses, it is clear that many students are multi-tasking with their home computer time performing various tasks simultaneously, such as downloading an mp3 while chatting with friends and searching the Internet for fun or school.
Given the widespread reported use of home computers by students to chat and instant message, the June 2007 and June 2008 student surveys additionally included a short section on students’ ex-perience and behaviors while chatting and instant messaging. The analyses of these results are being used to create a measurement scale for future research that serves to categorize and document stu-dent experience with this newly emerging social use of their home computer (Sandstrom, Bartini, and Bebell; 1998).

inTASC REPORT: Berkshire Wireless Learning Initiative, Final Evaluation Report, March 2009107
Analyses of Student Achievement The current investigation employs MCAS results to demonstrate the impacts of the BWLI pro-
gram and the subsequent experiences of 1:1 computing on students and schools. In the following exploration of student achievement, we will consider results from a variety of approaches including both school averages and individual student results for those 7th and 8th grade students who at-tended BWLI schools and experienced two years of 1:1 student computing. Specifically, the current investigation will address:
achievement trends in schools overall MCAS performance over time compared to •the comparison schools and state trends, and
which, if any, of students technology uses in school or home have impacted •student-level performance on various MCAS outcomes (while statistically controlling for students pre-BWLI academic performance using prior MCAS performance)
School-level Trend Analyses
As previously described in the methodology section, school-level MCAS results and perfor-mance indicators from 1998 to 2008 were accessed from the Massachusetts Department of Edu-cation. Given the non-experimental research design (i.e. students were not randomly assigned to 1:1 laptop or comparison settings), it is impossible to attribute changes in academic performance directly to participation in the BWLI program. Furthermore, since each of the participating schools were also engaged in other school reform practices and initiatives aimed at improving student achievement, the specific role of the BWLI program and technology practices in schools can not be fully isolated. However, both the school trends and student-level analyses provide an empirical window onto emerging trends in student achievement across both laptop and comparison settings.
We begin our investigation of student achievement by exploring general trends observed across school level achievement data for 7th and 8th grade students both before and during the BWLI implementation period. To appeal directly to school-level policy makers, we present the school-level MCAS results using the percent of students at each school who “passed” the various subject examinations on the Grade 7 and 8 MCAS exam. After experimenting with a number of ways of presenting a schools performance on the MCAS, the percent of students passing was found to be easily interpretable and familiar to those experienced with this assessment. This passing rate was calculated using the performance categories assigned to all MCAS students by the state. Specifically, the total percentage of students who received scores in the “Warning/Failing” category were sub-tracted from the total number of students, resulting in the overall percent of student who “passed” the MCAS.
In the following tables, school performance is weighted and averaged across the three public BWLI schools and compared to the combined student performance in the two comparison settings as well as to statewide student performance. This summary of student achievement trends begins below, with Figure SA1 which shows the percent of “passing” students on the 7th grade ELA MCAS for BWLI schools, comparison schools, and the average state pass rates from 2001 to 2008.

inTASC REPORT: Berkshire Wireless Learning Initiative, Final Evaluation Report, March 2009108
Figure SA1: Percent of students “passing” 7th grade ELA MCAS (2001–2008)
Figure SA1 shows the percent of 7th grade students who “passed” the ELA portion of the MCAS across the BWLI schools, the comparison schools, and the state average (n=72,799) going back to 20012. Overall, it is apparent that students across all groups performed generally well on the 7th grade ELA MCAS, with 84 to 95% of students typically receiving a “passing” score. In general, the pre-BWLI years (2001–2005) found the BWLI students lagging consistently about 5% below ELA pass rates in the comparison schools and the state averages. In the Spring 2006 7th grade MCAS administration, after the first months of transitioning to a 7th grade 1:1 learning environment, BWLI student performance on the ELA exam faltered somewhat (a 3% decrease in passing rates) com-pared to the non-1:1 schools in the comparison group and the state average. In trying to explain this data trend, we found that the Conte students did particularly poorly in 2006, when they experienced a 10% annual decrease in the percent of their students passing the ELA grade 7 examination.
However, in the first full year of 7th grade 1:1 computing, when student and teacher surveys suggest technology use had reached all time peaks, student performance on the 7th grade ELA MCAS saw its largest annual increase ever reported on the Spring 2007 assessment. This 6% per-centage point improvement across the BWLI settings outpaced the change in both state averages and comparison school performance during this same time period, effectively eliminating the long-time gap between BWLI 7th grade ELA performance and the state averages. Moreover, the 2007 MCAS saw 91% of BWLI students “passing” which corresponded to the highest pass rates since the beginning of MCAS testing. However, the Spring 2008 MCAS administration saw a 3% drop in student performance in the BWLI schools whereas comparison schools dropped 2% and state
70%
75%
80%
85%
90%
95%
100%
2001 2002 2003 2004 2005 2006 2007 2008
BWLI
Comparison
State
BWLI 84%
92%
88%
84%
92%
91%
88%
93%
93%
87%
93%
93%
88%
93%
93%
85%
92%
91%
91%
95%
92%
88%
93%
92%
Comaprison
State

inTASC REPORT: Berkshire Wireless Learning Initiative, Final Evaluation Report, March 2009109
averages were unchanged. The analyses of school-wide test data is continued below for the percent of 7th grade students who “passed” the Math MCAS across the BWLI schools, comparison schools, and the state average.
Figure SA2: Percent of students “passing” 7th grade Math MCAS (2006–2008)
50%
55%
60%
65%
70%
75%
80%
2006 2007 2008
BWLI
Comparison
State
BWLI 52%
72%
72%
75%
76%
76%
71%
69%
76%
Comaprison
State

inTASC REPORT: Berkshire Wireless Learning Initiative, Final Evaluation Report, March 2009110
Figure SA2 shows the percent of 7th grade students who “passed” the Math portion of the MCAS across the BWLI settings, the comparison schools, and the state average since 2006, when the Math assessment was first introduced at Grade 7 by the state. In the Spring 2006 testing admin-istration, which followed the first few months of 7th grade students transitioning to 1:1 computing, only about 52% of BWLI student “passed” the new 7th grade Math assessment, compared to 72% of students in the comparison settings and the state. Looking across the three BWLI schools (not presented in the figure), student pass rates at individual schools ranged from 49% to 55% in 2006. However across each of the BWLI schools, a substantial improvement in the number of students “passing” the 7th grade Math MCAS was observed for the Spring 2007 test administration brining the average BWLI pass rate up to 75%. This somewhat unusual jump in student performance corre-sponded with the first full year of BWLI implementation at grade 7 and was observed in each tested BWLI setting. In addition, the 2007 Math MCAS administration found BWLI 7th graders within 1% of comparison school and state averages. In the 2008 assessment, corresponding to the final year of the BWLI program, 7th grade student performance fell somewhat across both BWLI schools and comparison settings with 71% and 69% pass rates, respectively.
Collectively, our examination of school performance on the 7th grade ELA and Math MCAS (Figures SA1 and SA2) found the highest percentages of students passing were observed in 2007, the first full year of the BWLI implementation in grade 7 and the year when students and teachers reported the most widespread and frequent use of technology in respective surveys. Grade 7 student performance in the BWLI settings reached its highest historical levels on both the ELA (since 2001) and Math (since 2006) MCAS during the year when BWLI implementation and use was at its peak. Without a true experimental design, this trend analyses does little to prove that the BWLI program improved test scores, however even a conservative assessment of the 7th grade MCAS pass rates over this time period suggests that the BWLI participation was conducive or complementary to practices that fostered improvements in test performance.

inTASC REPORT: Berkshire Wireless Learning Initiative, Final Evaluation Report, March 2009111
Our trend analyses of student achievement across BWLI, comparison schools, and the state average is continued below with 8th grade class performance in ELA, Math, and Science. Specifi-cally, Figure SA3 illustrates the percent of BWLI and comparison students who received a “passing” score on the 8th grade ELA.
Figure SA3: Percent of students “passing” 8th grade ELA MCAS (1998–2001; 2006-2008)
Figure SA3 illustrates the percent of 8th grade students who “passed” the ELA portion of the MCAS across the BWLI settings, the comparison schools, and the state average from 1998 to 2001 and again from 2006 and 20083. In the three years of school performance data collected prior to 2006, average ELA performance generally increased across all settings, although BWLI schools gen-erally witnessed less growth than either state or comparison schools. However, the overall pass rate in each examined setting was 90% or better. When the ELA 8th grade assessment was resumed in 2006, 85% of students in the BWLI setting received “passing” scores compared to 95% percent of students in the comparison setting and 93% of the state’s 73,268 students who completed the as-sessment. In 2006, the 8th grade BWLI students had not participated in the BWLI program. By the Spring 2007 assessment, 8th grade students across the BWLI settings had 1:1 laptop access through-out their 8th grade year as well as during the last half of 7th grade. In 2007 the BWLI schools per-formed considerably better than the 2006 cohort had, with a 5% increase in the percent of students passing bringing the total back up to 90%. Student performance across the BWLI schools remained consistent at 90% for the 2008 assessment. However, despite these post-1:1 laptop increases, the
70%
75%
80%
85%
90%
95%
100%
1998 1999 2000 2001 ………… 2006 2007 2008
BWLI
Comaprison
State
BWLI 88%
85%
86%
84%
87%
87%
88%
94%
89%
90%
92%
92%
85%
95%
93%
90%
93%
94%
90%
93%
93%
Comaprison
State

inTASC REPORT: Berkshire Wireless Learning Initiative, Final Evaluation Report, March 2009112
percent of BWLI students passing the ELA 8th grade MCAS remained slightly less than in compari-son schools or the state average where scores experienced small fluctuations, but did not realize the improvements witnessed across each of the BWLI schools. Further comparisons of the pass rates in BWLI schools and other settings are continued below in Figure SA4 which shows average results from 1998 to 2008 on the 8th grade Math MCAS.
Figure SA4: Percent of students “passing” 8th grade Math MCAS (1998–2008)
Figure SA4 shows the percent of BWLI students, comparison students, and the state average who passed the 8th grade Math MCAS each year from 1998 to 2008. With the first MCAS assess-ment in 1998 both BWLI and comparison setting pass rates were 50% on average, 8% below the state average of 58%. Over the next seven years (the pre-BWLI period), scores in the comparison setting rose steadily eliminating their performance gap with the state average. In this same time, BWLI scores also increased although less dramatically so that by the 2005 and 2006 assessments, BWLI pass rates were increasingly lagging behind both comparison schools and state averages. In 2006, the overall pass rate for the 8th grade Math MCAS was 59% in the BWLI settings compared to 74% in the comparison schools and 71% statewide.
The Spring 2007 MCAS assessment represents the first time the 8th grade student cohort had 1:1 laptop access including most of their 8th grade year as well the last half of their 7th grade year across the BWLI schools. Like we have seen in other subject areas and grade levels, this cohort of
40%
45%
50%
55%
60%
65%
70%
75%
80%
1998 1999 2000 2003 2006 2007 2008
BWLI
Comaprison
State
BWLI 50%
50%
58%
50%
53%
60%
47%
58%
61%
58%
64%
67%
2002
54%
64%
67%
2001
57%
64%
69%
2004
60%
68%
71%
2005
55%
67%
70%
59%
74%
71%
65%
74%
75%
70%
76%
76%
Comaprison
State

inTASC REPORT: Berkshire Wireless Learning Initiative, Final Evaluation Report, March 2009113
BWLI students showed strong progress in improving pass rates 5% during each year of the 8th grade BWLI implementation, bringing the average pass rate up to 70% by 2008. In other words, this unprecedented two-year improvement in 8th grade Math pass rates across BWLI settings cor-responded with students participation in the 1:1 laptop program, and served to narrow the long term gap in test performance with both the comparison schools and the state averages. The analyses of the school-level trends in MCAS performance is completed below, in Figure SA5, with an exami-nation of the percent of students “passing” the 8th grade Science MCAS.
Figure SA5: Percent of students “passing” 8th grade Science MCAS
Figure SA5 illustrates the percent of 8th grade students who “passed” the science portion of the MCAS across the BWLI settings, the comparison schools, and the state average from 1998 to 2000 and again from 2005 and 2008. In the three years of school performance data collected prior to 2005, average science performance first decreased and then rebounded across all settings, al-though BWLI schools generally witnessed less growth than either state or comparison schools. In 2000, the BWLI 8th grade science pass rate was 55% compared to 63% statewide and 71% in the comparison schools. When the 8th grade science assessment was resumed in 2003, 62% of students in the BWLI setting received “passing” scores compared to 74% percent of students in the com-parison setting and70% of the states 73,203 students. In all settings, pass rates were generally stable or improved from 2003 to 2006 although BWLI average scores dropped slightly in 2006, the last available year of data before the 1:1 laptop cohort was tested in 2007. In the Spring 2007 and 2008 assesssments, corrsponding with the 1:1 deployment in the BWLI settings, BWLI pass rates rose to their highest recorded levels with 73% of 8th graders “passing” the Science MCAS in 2008. The large
40%
45%
50%
55%
60%
65%
70%
75%
80%
85%
1998 1999 2000 2003. . . . . . . . . 2006 2007 2008
BWLI
Comaprison
State
BWLI 56%
57%
59%
49%
54%
55%
55%
71%
63%
62%
74%
70%
2004
62%
73%
69%
2005
66%
78%
74%
64%
81%
75%
66%
78%
76%
73%
77%
78%
Comaprison
State

inTASC REPORT: Berkshire Wireless Learning Initiative, Final Evaluation Report, March 2009114
improvements in the BWLI setting served to close the historic gap in Science pass rates that was observed with the state and comparison school avergaes, since the state and comparison data rose less dramatically during this period.
Collectively, this examination of test results for 8th grade performance on the ELA, Math and Science MCAS (Figures SA3 through SA5) found the highest levels of student achievement were observed in 2007 and/or 2008, the two years that the BWLI implementation provided 1:1 laptops to grade 8 students. Like the patterns observed for the 7th grade assessments, grade 8 student perfor-mance in the BWLI settings reached its highest historical levels in every tested subject area (ELA, Math, and Science) when the BWLI implementation and use were at their peak. Again, without a true experimental design, this trend analyses does little to prove that the BWLI program improved test scores, however the trends presented for the 8th grade MCAS over time suggest that the BWLI participation was certainly conducive or complementary to practices that raised pass rates of stu-dents in BWLI schools. Given that each year of our MCAS analyses represents different cohorts of students, there is a possibility that the improvements realized during the BWLI years may also be attributed (in full or part) to pre-existing characteristics of the student body who completed the exam in 2007 and 2008. Although it seems fairly unlikely that the years of the full 1:1 laptop imple-mentation also witnessed better performing students in each of the BWLI schools than had existed historically, without a randomized experimental study it is impossible to completely attribute these test score gains to the BWLI program. However, it is possible to examine the potential of any “cohort effect” within these results through further examination of how individual students performance on the MCAS has changed during the BWLI implementation period. In other words, how much improvement, if any, was observed for 8th grade students test performance after two years of 1:1 computing compared to the same students two years earlier in grade 6. Table SA1 summarizes such an analyses for BWLI and comparison student performance levels on the ELA and Math MCAS.
Table SA1: Percent change in MCAS performance levels from 2006 6th grade administration to 2008 8th grade
ELA Math
ImprovedStayed the
Same Decreased ImprovedStayed the
Same Decreased
Conte Middle School 25% 71% 4% 33% 62% 5%
Herberg Middle School 36% 55% 9% 18% 67% 15%
Reid Middle School 32% 57% 11% 19% 62% 19%
North 21% 72% 6% 26% 68% 6%
South 20% 68% 12% 14% 67% 18%
BWLI Schools 32% 59% 9% 21% 64% 15%
Comparison Schools 21% 70% 9% 21% 68% 11%
inTASC REPORT: Berkshire Wireless Learning Initiative, Final Evaluation Report, March 2009115
Table SA1 shows the percent of BWLI and comparison students who improved, decreased, or stayed the same in their MCAS performance category from the 6th grade 2006 MCAS assessment to the 8th grade assessment in 2008 for these same students. In other words, these results summarize the percent of individual students who changed their MCAS performance category during their 7th and 8th grade years when 1:1 computing was available across the BWLI settings. For the ELA results, each of the BWLI schools witnessed between 25% (Conte) to 36% (Herberg) of their stu-dents improving one or more performance categories on the 8th grade MCAS compared to students previous 6th grade performance. Collectively, the weighted ELA average across all of the BWLI students resulted in improvements for 32% of students compared to only 21% in the comparison settings. In both 1:1 and comparison settings, there were 9% of students observed decreasing one or more performance categories over the two years corresponding with BWLI implementation. Math results during this same time period found more varied results across the BWLI schools than had been observed in ELA. Specifically, the Conte students saw the largest increase in their Math per-formance categories with 33% of 8th graders improving their grade 6 performance. However, results from the Herberg and Reid schools found only 18% and 19% of their respective students improved one or more performance categories on the 2008 Math MCAS, which was less than the average im-provement rate across the two comparison schools. Thus, the total average of improvement in BWLI settings in Math was equivalent to the improvement in performance observed on average in the comparison schools (21%). In addition, the average of BWLI students decreasing their performance in Math MCAS (15%) was greater than the average for comparison students (11%), although Conte observed the smallest percentage of their students decreasing in math performance (5%).
These ELA and Math results suggest that the 1:1 computing model ushered in by the BWLI program had somewhat different levels of impact across the BWLI schools. However, even when results are examined across all of the BWLI settings, more students improved their ELA and Math performance during the BWLI implementation years than had declined. Across subject areas, improvements were greatest for the ELA exam where BWLI students improved their performance levels with greater frequency than students in the comparison settings. Results in Math were also quite positive at the Conte school during the 1:1 implementation, but results in the other two 1:1 schools (Herberg and Reid) more closely resembled student performance in the comparison set-tings. Combined with the historical trend data presented in Figures SA1 through SA5, these results suggest that the cohort of BWLI students who performed historically well on the 2007 and 2008 MCAS likely represent school-based efforts to raise student scores such as 1:1 computing, as evi-denced by the impressive percent of individual students who improved their MCAS ELA perfor-mance level as they progressed through the two full years of the BWLI implementation. In other words, the positive test results observed in BWLI schools during the 1:1 implementation period are likely not simply a result of one or two classes of students who simply tested better than past cohorts for some unknown reason, given that when we followed a single cohort of students through the BWLI years we witnessed between 18% to 36% of students improving their MCAS performance these two years, particularly in ELA.

inTASC REPORT: Berkshire Wireless Learning Initiative, Final Evaluation Report, March 2009116
Student Level Relationship Between Achievement and Technology Use
To further explore the relationship between student achievement and participation in 1:1 com-puting activities, an analysis of individual student-level data was examined within the context of actual student technology practices during the third and final year of the BWLI implementation (2007-2008). (An exploratory analysis of student achievement and Year 2 student practices was presented in the BWLI Year 2 Annual Report (Bebell, 2008)). As previously described in the meth-odology section, a new data set was created that included the state’s MCAS results and demographic information as well as the BWLI student survey for each and every student in the BWLI and com-parison group settings. Thus, for each 7th and 8th grade student who completed the MCAS and the BWLI survey, the relationship between various technology uses and various outcome/student achievement measures could be examined.
Table SA2 provides demographic information from the newly merged 2007–2008 MCAS/BWLI data set across the 7th grade BWLI and comparison school settings.
Table SA2: Grade 7 achievement and demographic data summary
Conte Herberg Reid North South
% of Students eligible for free/reduced lunch 54% 41% 53% 19% 44%
% of non-white (A, B, H, M, N) students 17% 21% 22% 8% 16%
Mean ELA raw score 47.9 48.7 47.7 51.2 49.5
Mean Math raw score 29.0 35.2 31.6 31.3 31.7
# of Students who completed 2008 MCAS 110 223 235 281 226
# of Students who completed 2008 BWLI survey 106 210 213 141 175
# of Special education students 25 35 50 58 51
In addition to showing the mean MCAS scores across the each school’s 7th grade class, the state data shows the percent of students who were eligible to receive free or reduced lunch (a common indicator of students’ socioeconomic status), the percent of non-white students (an indicator for ethnic/racial diversity), the number of special education students, as well as the number of students who completed the final Year 3 BWLI survey (June 2008). Looking across the 7th grade settings, MCAS scores were similar although there was greater variance for the data summarizing the num-ber of students who received free/reduced lunch or were classified by the state as non-white. Across each school, a number of students were reported to receive Special Education services. Lastly, Table SA2 shows that the overwhelming majority of 7th grade BWLI students completed the June 2008 BWLI survey while a slightly smaller percentage of comparison school students completed the sur-vey. Table SA3 shows a similar table describing various achievement and demographic summary statistics for grade 8 students.

inTASC REPORT: Berkshire Wireless Learning Initiative, Final Evaluation Report, March 2009117
Table SA3: Grade 8 achievement and demographic data from the state
Conte Herberg Reid North South
% of Students eligible for free/reduced lunch 44% 38% 57% 26% 45%
% of non-white (A, B, H, M, N) students 16% 18% 24% 10% 20%
Mean ELA raw score 34.6 35.6 34.8 36.7 34.5
Mean Math raw score 31.4 31.9 29.7 33.7 30.5
# of Students who completed 2008 MCAS 116 268 219 237 238
# of Students who completed 2008 BWLI survey 115 253 211 172 177
# of Special education students 21 43 34 42 43
Table SA3 shows a summary of demographic and student achievement data across the grade eight BWLI and comparison school students who completed the MCAS in Spring 2008. In addition to showing the mean MCAS scores across the each school’s 8th grade class, the state data shows the percent of students who were eligible to receive free or reduced lunch, the percent of non-white stu-dents, the number of special education students, as well as the number of students who completed the final Year 3 BWLI survey (June 2008). Looking again across the schools, MCAS scores were fairly similar although there was greater variation in the data concerning the number of students who received free/reduced lunch or were classified by the state as non-white.
Exploratory data analyses were performed using the student data to investigate if the frequen-cies of teachers’ and students’ various technology uses (as measured by the BWLI student survey) exhibited any notable relationship with the 2008 student achievement results. More simply, did any of students’ specific uses of technology during the third year of the BWLI program relate to their test performance? For example, did the students who reported more frequent use of technology for presenting information in class perform any better on the MCAS math section than students who rarely used technology for this purpose? Given the fact that there was such wide variation in many of the computer use measures across and between the BWLI and comparison school students, the current sample provides a rich data set for such preliminary explorations.
Because there were such a wide ranging number of surveyed student technology uses, the com-mon statistical approach of factor analyses was applied across the student survey items to create more reliable and stable measures of student practices within the 1:1 and comparison school settings. Spe-cifically, principal component analysis was applied to create six scales representing different types of technology use in school for: writing and research, solving problems, presenting information, class-related activities, communicating, and teacher use of computers. Four additional scales were created from the student survey results to represent students varied home use of computers includ-ing: writing and research, multimedia, communication and social use, and recreational use. Lastly, student attitudes and beliefs were summarized across survey items to form two scales concerning students’ beliefs towards the 1:1 computing and students self-perception of their technology abili-ties. All of the student technology use and attitude scales used in across the current study of student

inTASC REPORT: Berkshire Wireless Learning Initiative, Final Evaluation Report, March 2009118
achievement are fully detailed in Appendix A: Construction and statistical qualities of the BWLI student survey measurement scales.
Through an analysis of student test performance and various indicators of technology practices, it is possible to get some general understanding of the complex relationship between student and teacher practices during the 2007–2008 school year and measures of student achievement. Through this type of analysis (including students from non-1:1 laptop settings in comparison groups) it can also be shown if specific technology practices appear to be impacting test scores positively, nega-tively, or not at all
In the following analyses, the relationship between BWLI teachers’ and students’ use of tech-nology and MCAS performance is demonstrated using Pearson’s correlation coefficients (r). For those readers unfamiliar with examining relationships between variables using correlation, accepted guidelines for interpreting the r values are reproduced in Table SA4 from Guilford’s (1954) Psychometric Methods.
Table SA4: Interpretation of correlation coefficient
r Value Interpretation
Less than .20 Slight; almost negligible relationship
.20 – .40 Low correlation; definite but small relationship
.40 – .70 Moderate correlation; substantial relationship
.70 – .90 High correlation; marked relationship
.90 – 1.00 Very high correlation; very dependable relationship
In the following example a positive correlation indicates that increased use of technology was associated with higher 2008 MCAS scores. A negative relationship would indicate that as students’ use of technology increased, their test performance decreased. A common method for evaluating the strength of a correlation is to test the value for statistical significance. Significance testing pro-vides an indication of the strength of the relationship and whether the relationship can be attributed to chance. For the correlation tables of student results presented in the current paper, correlation values found to be statistically significant are depicted in bold (p.<.05, 2-tailed test). Again, these correlation results are not intended to determine the effectiveness of the BWLI program or its vari-ous components, but rather to explore what student and teacher uses may be related to a common measure of student achievement. In the tables below, the correlation between Year 3 technology uses and Spring 2008 MCAS scores are presented below for 7th and 8th grade students. Specifically, Table SA5 shows the correlation table between 7th grade students’ commonly reported technology uses, demographic variables, and students’ grade 6 (2007) ELA and Math MCAS performance.

inTASC REPORT: Berkshire Wireless Learning Initiative, Final Evaluation Report, March 2009119
Table SA5: Correlation table between 7th grade students commonly reported technology uses, demographic variables, and 2008 MCAS performance
BWLI Comparison
ELA Math ELA Math
ELA raw score .68 .68
Math raw score .68 .68
ELA raw score 2007 (6th grade) .78 .70 .78 .68
Math raw score 2007 (6th grade) .67 .86 .68 .87
Socio-economic status .34 .38 .40 .37
Student use in school
In the past year, how often did you use technology in your classroom? .08 .16 –.40 –.19
Student computer use in Reading/ELA .02 .12 –.36 –.23
Student computer use in Social Studies –.02 –.04 –.20 –.15
Student computer use in Math –.06 .02 –.29 –.20
Student computer use in Science .02 .15 –.27 –.18
Writing and research .05 .10 –.24 –.17
Solve problems –.04 –.01 –.07 –.04
Present information –.08 –.05 –.11 –.05
Class-related activities –.08 –.09 –.17 –.08
Teacher use of computers .04 .09 –.02 .01
Communication –.04 –.01 –.07 –.04
Uses at home
Writing and research –.06 –.09 .01 –.04
Multimedia use .10 .01 .02 .05
Communication .06 .03 .02 .03
Recreational home use .10 .01 .03 .03
Technology beliefs –.03 –.01 .07 .04
Self-perceived abilities .02 .06 –.03 .01
Note: Bold correlations represent statistical significance at the .05 level (2 tail)

inTASC REPORT: Berkshire Wireless Learning Initiative, Final Evaluation Report, March 2009120
Table SA5 shows the correlational relationship between 7th grade students’ 2008 performance on the ELA and Math sections of the MCAS with socioeconomic status indicators and commonly reported technology uses. Overall, it appears that there are a number of student level indicators (including students’ and teachers’ technology uses measured by the Spring 2008 survey) which were found to have a statistically significant relationship with student achievement as measured by the Spring 2008 MCAS. It is noteworthy that for both the comparison school sample and the BWLI sample, that the relationship between the ELA raw score and Math raw score exhibited a strong positive correlation (.68 in each setting) indicating that students’ performance on the ELA sec-tion of the MCAS is strongly related with their performance on the Math sections. In addition, both samples of students exhibited very strong statistically significant relationships between their previous test performance and their 2008 MCAS performance, particularly in Math. Similarly, stu-dents’ socio-economic status (SES), as measured by a scale incorporating a student’s participation in free or reduced lunch programs and the number of books a student has at home as reported on the student survey, positively correlated with MCAS performance indicating that low-SES students received lower test scores than students with higher SES. All of these results suggest that students’ background environment plays a substantial role in their subsequent 8th grade test performance. Clearly, the very large positive correlations observed when comparing students 2007 and 2008 test performance shows that students prior test performance is the strongest predictor of future perfor-mance, independent of setting, educational reforms, or practices.
In terms of the relationship between students’ use of technology in the classroom and test per-formance, statistically significant (yet fairly weak) positive results were found for the BWLI 7th grade students (who had about two years of 1:1 use in school) while statistically significant negative results were found for the comparison school 7th grade students (who had never participated in a 1:1 laptop program). Specifically, BWLI students who reported using technology in the class-room during the 2007-2008 school year were found to score better on both the ELA and Math 7th grade assessment than those BWLI students who did not report as frequent use. This pattern was strongest for the Math assessment where the correlation between the raw score and frequency of in-class technology use was .16. In the comparison settings, the impact of technology use in the class-room was also correlated significantly with ELA and Math performance the relationship, however the relationship was negative and somewhat stronger. In other words, the students who reported the most frequent use of technology in the non-1:1 settings were the same students receiving lower MCAS scores, particularly in ELA where the observed Pearson correlation was –.40.
Also presented in Table SA5 is the relationship between the frequency of students’ reported use of technology across their four primary classes (ELA/Reading, Math, Social Studies, and Science) and 2008 MCAS performance. The relationship between BWLI students’ specific use and subse-quent test performance was largely negligible or weak. BWLI students, however, exhibited statisti-cally significant positive correlations between use in Reading/ELA and Science classes with their Math raw score on the 2008 MCAS, indicating greater technology use in these subjects was related to higher Math performance. Conversely, the relationship between student use of technology across the core curricular subjects and MCAS performance was entirely negative (as well as statistically

inTASC REPORT: Berkshire Wireless Learning Initiative, Final Evaluation Report, March 2009121
significant) for the comparison students, suggesting that these types of computer activities in non-1:1 settings was not positively related to increase student test performance.
Lastly, Table SA5 includes a summary of correlations between scales of specific student uses of technology in school and raw ELA and Math MCAS scores. As shown above, nearly all spe-cific technology uses exhibited weak, negative correlations with test results both for BWLI students and comparison school students. These results suggest that the specific skills gained by students who frequently use these technology applications in school may be unrelated or negatively related with MCAS performance. Again, in this analysis we see BWLI students receiving more positive im-pacts from their use of technology than comparison students in the non-1:1 setting where nearly all specific school uses were negatively correlated with test performance. Specifically, for the BWLI 7th grade students, statistically significant positive correlations were observed for students’ use of tech-nology in-class for “writing and research”, “and “teachers use of computers” with their 2008 Math performance. A statistically significant negative correlation was observed for BWLI students’ use of technology to present information in class with both ELA and Math sections of the MCAS. In addition, BWLI students frequency of home use of computers for “writing and research” as well as “recreational use” were observed to be positive statistically significant predictors for ELA raw scores, whereas no statistically significant predictors were observed across the non-1:1 settings. Neither students’ technology beliefs or their self-perceived abilities to use technology were found to be sta-tistically significant predictors of MCAS performance in BWLI or comparison settings.
Table SA6 continues the Year 2 analyses of student and teacher technology use during the 2007-2008 school year and 8th grade students’ 2008 performance on the ELA, Science, and Math MCAS.

inTASC REPORT: Berkshire Wireless Learning Initiative, Final Evaluation Report, March 2009122
Table SA6: Correlation table between 8th grade students commonly reported technology uses, demographic variables, and 2008 MCAS performance
BWLI ComparisonELA Math Science ELA Math Science
ELA raw score .71 .76 .69 .72
Math raw score .71 .77 .69 .80
Science raw score .76 .77 .72 .80
ELA raw score 2007 (7th grade) .77 .63 .65 .80 .66 .65
Math raw score 2007 (7th grade) .70 .87 .76 .65 .87 .75
ELA raw score 2006 (6th grade) .77 .66 .71 .76 .72 .74
Math raw score 2006 (6th grade) .66 .83 .71 .61 .87 .73
Socio-economic status .37 .42 .38 .41 .40 .42
Student use in school
In the past year, how often did you use technology in your classroom? .04 .11 .11 –.18 –.11 –.10
Student computer use in Reading/ELA .08 .14 .14 –.11 –.09 –.14
Student computer use in Social Studies –.10 –.04 –.04 .00 –.05 –.05
Student computer use in Math .03 .10 .10 –.06 –.09 –.07
Student computer use in Science –.15 –.06 –.06 –.03 –.01 –.02
Writing and research –.04 .00 .02 –.18 –.08 –.08
Solve problems –.06 –.07 –.03 –.04 –.02 .00
Present information –.10 –.10 –.07 –.05 .00 .03
Class-related activities –.08 –.06 –.09 –.16 –.10 –.05
Teacher use of computers .06 .09 .09 .05 .06 .03
Communication .05 .04 .04 .01 .06 .06
Uses at home
Writing and research .01 –.02 –.02 –.07 –.02 –.03
Multimedia use .09 .09 .06 –.06 –.12 –.06
Communication .06 .07 .03 –.05 –.04 .02
Recreational home use .09 .09 .07 –.05 –.09 –.05
Technology beliefs .01 .05 .01 –.01 .08 .00
Self-perceived abilities .12 .12 .09 –.04 –.01 .01
Note: Bold correlations represent statistical significance at the .05 level (2 tail)

inTASC REPORT: Berkshire Wireless Learning Initiative, Final Evaluation Report, March 2009123
Table SA6 shows the correlational relationship between 8th grade students’ 2008 performance on the ELA, Math, and Science sections of the MCAS with socioeconomic status indicators and commonly reported technology uses. Overall, it appears that there are a number of student level indicators (including students’ and teachers’ technology uses measured by the Spring 2008 sur-vey) which were found to have a statistically significant relationship with student achievement as measured by the Spring 2008 MCAS. It is again noteworthy that for both the comparison school sample and the BWLI sample, that the relationship amongst the 2008 tested subjects (ELA, Math, and Science) exhibited strong positive correlations (between .69 and .80) indicating that students’ performance on one section of the MCAS was likely to highly indicative of their performance in other tested subject areas. In addition, there was a very strong statistically significant relationship between students 2008 8th grade MCAS performance and their prior performance on MCAS, par-ticularly in Math where correlations were observed as high .87. Similarly, students’ socio-economic status (SES), as measured by a scale incorporating a student’s participation in free or reduced lunch programs and the number of books a student has at home as reported on the student survey, was positively correlated with MCAS performance indicating that low-SES students received lower test scores than students who were not eligible for assistance programs. As noted in the 7th grade re-sults, again all of these results in the 8th grade suggest that students’ background environment plays a substantial role in their subsequent test performance. In addition, the relationship between past achievement and student home variables on test performance has a long history in educational re-search and testing, and the results presented here echo much of this literature. Clearly, the very large positive correlations observed across students 2007 and 2008 test performance show that students prior test performance is the major predictor of future performance, independent of setting, educa-tional reforms, or practices.
In terms of the relationship between students’ use of technology in the classroom and test per-formance, statistically significant (yet fairly weak) positive results were found for the BWLI 8th grade students (who had about two years of 1:1 laptop use in school) while statistically significant negative results were found for the comparison school 7th grade students (who never participated in a 1:1 laptop program). Specifically, BWLI students who reported using technology in their class-room during the 2007–2008 school year more frequently were found to score better on both the Math and Science 8th grade assessment than those BWLI students who did not report as frequent use. In the comparison settings, the impact of technology use in the classroom was also correlated significantly with ELA and Math performance, however the relationship was negative.
Also presented in Table SA6 is the relationship between the frequency of students’ reported use of technology across their four primary classes (ELA/Reading, Math, Social Studies, and Sci-ence) and 2008 MCAS performance. The relationship between BWLI test performance and students subject specific technology use varied by subject area, however statistically significant relationships were observed for ELA, Math, and Science. Student use of computers in Social Studies and Science classes was negatively correlated with MCAS ELA scores across BWLI students. Conversely, student use of computers in Reading/ELA and Math classes was positively correlated with Math and Science MCAS performance in the BWLI settings. For the comparison students, the relationship between student use of technology across the core curricular subjects and MCAS performance was again

inTASC REPORT: Berkshire Wireless Learning Initiative, Final Evaluation Report, March 2009124
entirely negative. Statistically significant correlations were observed for students use of computers in Reading/ELA and student performance in ELA and Science, suggesting that the types of computer activities in non-1:1 settings were not necessarily conducive to increased student test performance.
Lastly, Table SA6 includes a summary of correlations between scales of specific student uses of technology in school and ELA, Math, and Science MCAS scores. As shown above, nearly all of the specific technology uses exhibited weak, negative correlations with test results both for BWLI students and comparison school students. These results suggest that the specific skills gained by students who frequently use these technology applications in school may be unrelated or even nega-tively related with MCAS performance. Again, in this analyses we see BWLI students witnessing somewhat more positive impacts from their use of technology than comparison students in the non-1:1 setting where nearly all specific school uses were negatively correlated with test perfor-mance. Specifically, for the BWLI 8th grade students, statistically significant positive correlations were observed for students’ in school use of technology for “communication” with their 2008 Math and Science performance. Two statistically significant negative correlations were additionally ob-served; for BWLI students’ use of technology in school to “present information in class” with ELA and Math performance and “in class activities” with Science. In addition, BWLI 8th grade students frequency of home use of computers for “recreational use” was observed to be a positive statistically significant predictors for ELA and Math raw scores, whereas multimedia use was a negative statisti-cally significant predictor in the non-1:1 settings. Lastly, students’ technology beliefs towards the 1:1 program were not found to be statistically significant predictor of MCAS performance in BWLI or comparison settings, however in the BWLI setting students perceived abilities to use technology exhibited a statistically significant correlation with students MCAS performance across all tested subjects.
Determining the Relationship Between Student Level Technology Use and Student Achievement
In the preceding tables and statistics, the relationship between students’ use of technology and measures of student achievement is explored for BWLI and comparison school students. Through these exploratory analyses on potential variables that may impact students’ achievement, previous achievement on prior MCAS exams was clearly the largest and most substantial predictor of stu-dents’ performance on the 2008 assessments. In addition, students’ socio-economic status was also a consistently strong predictor of all student achievement measures. Of more interest to the current inquiry, a number of student technology use indicators were also found to be statistically significant predictors of different student achievement measures. However, given that prior MCAS perfor-mance is such a strong predictor of current and future achievement, does participation in the BWLI program, or in any of students’ specific technology uses still have an impact of student achievement after the large effects of prior achievement are statistically controlled? In other words, did being in the BWLI program and using technology in school results in student test performance beyond what we would expect for students given their past performance? The following analyses of 8th grade 2008 BWLI and comparison student participants seek to address this question.

inTASC REPORT: Berkshire Wireless Learning Initiative, Final Evaluation Report, March 2009125
All 8th grade BWLI students completed the ELA and Math MCAS in Spring 2008 after nearly two full years of participation in 1 to1 learning environments. The Spring 2006 MCAS assessment (completed by these same students when they were in grade 6) represents the last available state as-sessment results before students were exposed to the 1:1 setting, and given that both ELA and Math subject exams were offered, is an excellent subject-specific measure of pre-laptop student achieve-ment. By combining 2006 and 2008 MCAS results along with the 2008 student survey results for each student it is possible to ascertain specifically how much scores for individual students rose or fell during this time period. Table SA7, below, shows average 2006 and 2008 MCAS raw scores for BWLI and comparison students:
Table SA7: Mean 2008 ELA and Math raw scores for 8th grade BWLI and comparison students compared to their 2006 MCAS raw scores
Table SA7 illustrates the mean ELA and Math MCAS performance for 8th grade students in 2008, compared to the same students performance on the grade 6 ELA and Math MCAS in 2006. The figure shows the averages for BWLI students, who had approximately two years experience in a 1:1 environment, as well as for comparison students from two similar schools where no laptop pro-gram was present; although teacher use of technology was notably widespread in both comparison settings. Compared to their 6th grade test performance in 2006, 8th grade BWLI students averaged about 2.7 points better on the 8th grade assessment with a mean raw score of 35.6. Students in the comparison schools also improved in the 2008 assessment, although to a lesser extent than BWLI students with only a 1.3 point difference. However, comparison school students scored higher on average than BWLI students in both assessments. Results are also presented in Table SA7 for the
25
30
35
40
32.9
35.5
36.7
34.735.6
36.7
38.137.2
33.1
35.1
37.1
35.3
31.4
33.6
35.7
33.0
BWLI
Comparison
BWLI without Special Ed.
Comparison without Special Ed.
MathELA
2006 20062008 2008

inTASC REPORT: Berkshire Wireless Learning Initiative, Final Evaluation Report, March 2009126
2006 and 2008 average Math MCAS raw scores for BWLI and comparison students. Although 11% more students “passed” the MCAS Math exam in BWLI schools in 2008 than had in 2006, the average of BWLI students raw scores decreased from 33.1 in 2006 to 31.4 in 2008, a mean drop of 1.7 points. During this same period in the comparison schools, the average 8th grade student also scored 1.4 points lower on the 2008 MCAS Math assessment than they had two years previously on the 2006 MCAS Math assessment. As also observed for ELA performance, school averages were higher for the comparison students on both the 2006 and 2008 tests than across the BWLI settings. Lastly, Table SA7 shows the average performance across all assessments for the BWLI and com-parison school populations with the 143 Special Education students excluded from the analyses. The observed net gains in 2008 scores for BWLI students were diminished in both the ELA and Math subject tests when the special education students were excluded from the statistical analyses. In other words, the BWLI population as a whole saw larger net gains in both ELA and Math when special education students were kept in the 2006 and 2008 test analyses.
To summarize, BWLI students averaged a net gain in ELA scores during their two years of 1:1 laptop experience. However, so did the students in the comparison group who had only limited computer access and resources. In Math, BWLI students’ averaged lower scores on the 2008 assess-ment after two years of 1:1 computing (a net loss), but then again, so did the students in the com-parison schools. So, to better determine if the “impact” on student achievement over the two years of 1:1 participation for 8th grade BWLI students was greater than the differences across comparison school students during the same time period, we will statistically assess how much of the net change in student performance can be possibly attributed to BWLI participation and experiences.
Student level regression models were created for ELA and Math 2008 raw scores across nearly all 8th grade BWLI and comparison students. Specifically, models were developed and analyzed to determine the overall program effect (i.e. 1:1 status) of BWLI participation on students’ test scores. Thus, the ELA regression model included 2008 MCAS ELA raw scores as the dependent variable, BWLI Status as an independent variable, and 2006 MCAS ELA raw scores as a controlling variable. BWLI status was a dichotomous variable with 1 representing a BWLI participant and 0 representing a comparison school student. The resulting equation for the 2008 8th grade ELA model was:
Predicted 2008 ELA MCAS= 0.764 (2006 ELA MCAS) + 1.04 (BWLI Status) + 9.83
The analyses found that the coefficients for both prior achievement (i.e. 2006 ELA score) and participation in the BWLI program were statistically significant (p < .0005 for the ELA 2006 and p = .006 for BWLI). In other words, the increase in ELA scores for BWLI students was statistically significant compared to the increase in scores observed for comparison students. Thus, we can con-clude there was a statistically significant difference observed between BWLI students’ 2008 ELA test performance (after two years participation in a 1:1 computer program) and the comparison students, after controlling for prior achievement in 2006.
In addition, the current analyses also sought to look more specifically at the relationship, if any, between BWLI students use of computers during their 8th grade year and their 2008 ELA performance. Since it was suggested in the correlation analyses that BWLI students may be

inTASC REPORT: Berkshire Wireless Learning Initiative, Final Evaluation Report, March 2009127
using technology resources in unique and specific ways that may not be present in the comparison schools, and to aid in interpretation, the analyses of student technology practices was limited to the 579 participating 8th grade BWLI students who completed the 2008 ELA MCAS.
To this end, any of the BWLI technology use variables that had statistically significant correla-tions with the ELA MCAS scores (Table SA6) were entered into the regression model for 2008 ELA achievement. Specifically, the following technology use variables and scales were examined across BWLI students:
Student computer use in Social Studies •
Student computer use in Science •
Present information scale (present) •
Recreational home use scale (recreation)•
Student perceived abilities scale (ability)•
The resulting regression equation was:
Predicted 2008 ELA MCAS = .76 (2006 ELA MCAS) – .004 (use in Social Studies) – .018 (use in Science) + .238 (present) + .62 (recreation) + .23 (ability) + 12.12
Overall, this model accounted for 61% of the variance in 2008 ELA scores across all BWLI 8th grade students, however a great deal of this variance was explained solely by the 2006 scores. Specifi-cally, after accounting for prior MCAS scores (p < .0005) two of the student technology use predic-tors: students computer use in science class (p=.003) and students recreation home use of computers (p = .013) were observed to exhibit statistically significant coefficients.
First, a negative statistically significant relationship was found between students’ frequency of computer use in Science class and their ELA achievement, even after controlling for past achieve-ment levels and all other variables within the model. In other words, students who reported more frequent use of computers in their Science classes were found to be actually less likely to perform better on the 2008 ELA MCAS then those students who used technology less frequently for in Science during their 2007–2008 8th grade year.
In addition, a positive statistically significant relationship was also found between students’ recreational home use of computers and their ELA achievement, even after controlling for past achievement levels. In other words, students who reported more frequent use of computers for recreation at home were actually more likely to perform better on the 2008 ELA MCAS then those students who used technology less frequently for recreation at home. To provide a clearer idea what types of student computer uses comprised the recreational home use scale, the original four origi-nal survey items comprising the scale included students’ use of a computer to: search the Internet for fun, create music or video projects, download music or videos, and shop online. Given that BWLI student home access and use appeared largely independent of students experience in BWLI program, it was theorized that the relationship between recreational home use and ELA achieve-ment may actually be an artifact of students socio-economic status (SES), which was previously observed to be a major correlate of student level 2008 ELA MCAS performance. In fact, the impact

inTASC REPORT: Berkshire Wireless Learning Initiative, Final Evaluation Report, March 2009128
and significance of students’ recreation home use of computers was completely diminished when we statistically controlled students’ socio-economic status, as measured by the SES scale (see Appendix A). Thus, the positive impacts associated with home recreational use and variance accounted for in the 2008 ELA model was a by-product of students’ socio-economic status. This result suggests that when students SES is statistically controlled, as well as their 2006 scores, there was no difference in the impacts of recreational home computer use on 2008 ELA achievement.
None of the other individual or scaled student technology uses were found to be statistically significant in the ELA model, once prior achievement scores were controlled.
8th grade student results were also examined for Math achievement. The Math regression model included 2008 MCAS Math raw scores as the dependent variable, BWLI Status as an inde-pendent variable and 2006 MCAS Math raw scores as the controlling variable. Again, BWLI status was a dichotomous variable with 1 representing a BWLI participant and 0 representing a compari-son school student. The resulting equation for the 2008 8th grade Math model was:
Predicted 2008 Math MCAS= 0.77 (2006 Math MCAS) + .75 (BWLI Status) + 7.05
As expected, students’ prior MCAS scores continued to be a major statistically significant pre-dictor variable of 2008 MCAS scores (p < .0005). However, students’ participation in the BWLI pro-gram was not a statistically significant predictor of the 2008 MCAS scores (p = .086), when students’ prior (pre-1:1) scores were also taken into account, as had been observed for ELA performance. Thus, there was no statistically significant relationship found between students’ participation in two years of a 1:1 computer program and Math standardized test performance.
In addition, the current analyses also sought to look more specifically at the relationship, if any, between BWLI students’ use of computers and Math performance. To this end, any scales or vari-ables that had significant correlations with the BWLI Math MCAS scores (Table SA6) were entered into the Math regression model below. In addition, since the correlation between BWLI students’ 2008 MCAS Math performance and multimedia home use was very close to statistically significant, it was included in regression model as well. In total, the following technology use variables and scales were examined:
Student computer use in Reading/ELA •
Student computer use in Math •
Writing and research at school scale (writing) •
Present information using computers scale (present) •
Multimedia use at home scale (multimedia) •
Recreational home use scale (recreation) •
Student perceived abilities scale (ability) •

inTASC REPORT: Berkshire Wireless Learning Initiative, Final Evaluation Report, March 2009129
The resulting regression equation was:
Predicted 2008 Math MCAS = .85 (2006 Math MCAS) + .016 (use in Reading/ELA) + .028 (use in Math) – .304 (writing) – .289 (present) + .528 (multimedia) + .607 (recreation) + .030 (ability) + 2.79
Overall, this model accounted for 43% of the variance in 2008 Math scores across all BWLI 8th grade students, however the great majority of this variance was explained solely by the pri-or scores. Specifically, across all of these predictor variables, only the 2006 Math raw scores (p < .0005) was found to be statistically significant predictor. In addition, student use of computers in Math class approximated a statistically significant coefficient with 2008 Math performance outcomes (p. = .09), but fell just outside the established criteria for statistical significance. However close, all of the predictor variables investigated fell shy of being classified as statistically significant predictors Math performance, after prior achievement scores were controlled.
In conclusion, the statistical analyses of student-level MCAS results revealed some positive, yet far from unanimous, results on the impacts of the BWLI program on student learning as mea-sured by the state standardized assessment. In terms of overall program impacts, 1:1 student score increases across BWLI settings were found to be statistically greater than increases in the non-1:1 settings for ELA achievement but not for Math during the final two years of the BWLI implementa-tion. When examining the specific relationships between the BWLI students use of technology in school and at home, nearly all of the individual and scaled technology use measures failed to result in statistically significant relationship on the ELA or Math scores, once student prior achievement was accounted for. However, in the ELA MCAS model, students’ frequency of use in Science class during the 2007-2008 school year was found be a negative predictor of ELA performance, while recreational home use was related to net score gains. The net score gains observed for recreation home use in Math was determined to be an artifact of student socioeconomic status, rather than the impact of specific home technology uses. In the Math model, students’ frequency of computer use in both Math and Reading class were found to be positive predictors of Math performance, however both fell below criteria established for determining statistically significant impacts.
In this analysis of school level and student achievement data, we have explored the impact of BWLI participation and likely technology practices on student achievement using the state stan-dardized assessment as a common metric of student performance in BWLI and comparison set-tings. However, the educational technology literature and the models themselves suggest that per-haps the MCAS may not be the most sensitive or appropriate measure of student achievement in 1:1 settings. To more fully explore the limitations of the MCAS as an outcome measures, we conclude our analyses of student achievement with the results of a randomized computer writing study con-ducted across all BWLI 7th grade participants in Spring 2008.
Computer Writing Study Results
In an attempt to get a better understanding of the relationship of 1:1 computing and student technology uses on student achievement, the research team devised and carried out an additional

inTASC REPORT: Berkshire Wireless Learning Initiative, Final Evaluation Report, March 2009130
study of students writing ability. Specifically, this study addresses concerns raised in previous re-search that students who have grown accustomed to writing using word processors may be at a considerable disadvantage when demonstrating their “true” writing ability in traditional paper and pencil assessments (Russell & Plati, 2001; Russell, 1999; Russell & Haney, 1997). As summarized in the Methodology section of this paper, the BWLI computer writing study randomly assigned all 7th grade BWLI students to complete a realistic MCAS extended writing test over two 45 minute sessions in Spring 2008. A total of 388 essays were collected from students in the “computer” envi-ronment while 141 essays were collected on paper before being transcribed and scored by a team of trained readers. Each essay was given two scores by separate raters on both Topic Development and Standard English Conventions. A summary of student performance across the computer and paper testing conditions is presented below across BWLI settings in Table SA7.
Table SA8: Comparison of 7th grade results for students completing an MCAS essay using their BWLI laptop or traditional paper/pencil
School Name Condition Topic Score Conventions Score Word Count n
Conte Middle SchoolComputer 7.0 5.6 517 50
Paper 6.6 4.7 309 26
Herberg Middle SchoolComputer 7.0 5.5 324 144
Paper 7.3 5.9 336 45
Reid Middle SchoolComputer 7.6 5.7 366 85
Paper 6.0 4.9 257 56
St. MarkComputer 7.9 6.1 545 30
Paper 6.9 5.9 362 14
ALLComputer 7.2 5.6 388 310
Paper 6.6 5.3 302 141
Table SA7 shows the comparison of 7th grade results for BWLI students across the computer writing study. After two years of 1:1 computing in school, 7th graders who participated in the com-puter writing study showed that students wrote both longer and more highly scored open response essays when using their laptops than students responding to the same prompt using traditional paper and pencil. To control for any pre-existing differences between the computer and paper stu-dents, 7th grade open response scores from the “official” paper/pencil ELA MCAS were used as a covariate to account for students writing ability in a traditional testing environment. Using a gen-eral linear model, we statistically “controlled” for paper-tested writing scores while evaluating the impact of computer use in testing conditions that allowed students to use their laptop and word processor rather than paper and pencil.
inTASC REPORT: Berkshire Wireless Learning Initiative, Final Evaluation Report, March 2009131
When controlling for students respective performance on the paper/pencil MCAS writing as-sessment, both the Topic Development and Standard English Conventions score difference observed between laptop students and paper/pencil students were found to be statistically significant. Specifi-cally, after controlling for students Topic Development score on the 2008 paper/pencil MCAS, stu-dents Topic Development score was substantially higher for those students who completed the essay using their laptop than for the paper students (F=4.79, sig. .029 Adjusted r2 = .203). To a somewhat lesser extent, after controlling for Standard English Conventions score on the 2008 paper-based MCAS, students Standard English Conventions score was also greater for those students who com-pleted the essay using their laptop than for the paper students (F=4.67, sig. .031, Adjusted r2 = .122). Given these results, it is clear that BWLI students, after using a laptop across their 6th and 7th grade years of middle school, performed better across both writing scales when allowed to complete the writing assessment using their BWLI computers.
These results highlight the challenges of measuring the impact of students and schools where technology has been adopted and widely used. These results also suggest that increasingly tech-savvy students may be at a considerable disadvantage to demonstrate their writing ability on official state assessments, which are exclusively paper and pencil in Massachusetts. Obviously, further com-plications are likely when the paper/pencil state test results are used to demonstrate the effectiveness of investments and programs involving computer based technologies.
Lastly, the frequent teacher sentiment in the educational technology literature that students are more motivated and engaged to compose lengthier and more developed essays when using a com-puter was substantiated by the BWLI computer writing study results. After controlling for Standard English Conventions score on the 2008 paper MCAS (word count is not reported in the official MCAS), the number of words students composed was still found to be substantially greater for those who completed the essay using their laptop than using traditional paper and pencil (F=19.95, sig. < .001, Adjusted r2 = .256). Specifically, students who completed the writing assessment using their laptop produced an average of 388 words compared to 302 words for the essays composed on paper across all BWLI settings.

inTASC REPORT: Berkshire Wireless Learning Initiative, Final Evaluation Report, March 2009132
FindingsObviously, there are many potential ways to summarize the findings and outcomes of such a
complicated and rich learning initiative. One of the most universal findings in the current investiga-tion was that both the implementation and outcomes of the program were somewhat varied across the five 1:1 settings and over the three years of the student laptop implementation. In this section of the paper, we explore common trends across the various research results that directly address the original targeted project outcomes. Each of the four targeted outcomes (enhanced student achieve-ment, improved student engagement, fundamental shifts in teaching practices, and enhanced student research and collaboration) are individually evaluated below.
Enhanced Student Achievement
There is emerging evidence that student achievement was positively enhanced through the types of educational access and opportunities afforded by 1:1 computing through the BWLI pro-gram. The chief results supporting this finding include the school-level and student-level analyses of the student achievement data, summary of teacher survey results, student survey results, and prin-cipal/leadership interviews. Specifically, the analyses of the pass rates on all of the available MCAS subject tests during the years when 7th and 8th grade students had full access to 1:1 computing saw growth compared to past averages as well as comparison school performance and state averages. After controlling for prior achievement levels, student level analyses of 8th grade test performance after two years of 1:1 computing in the BWLI setting revealed a statistically significant positive effect for BWLI participation in English Language Arts but not in Math. Further student level statistical models exploring students’ individual technology uses in Year 3 of the BWLI program revealed few major relationships with ELA or Math performance, once students prior ELA and Math scores were statistically controlled. However, a randomized computer writing study in the final year of the BWLI implementation demonstrated the students produced both lengthier and higher-scoring essays when allowed to compose and edit text using a computer, rather than the traditional paper and pencil required in the official state assessment. The computer writing study results also echo past literature suggesting that traditional paper/pencil assessments may be too insensitive for evalu-ating the impact of educational technology and technology savvy students.
In addition to the state test score analyses, teachers and principals were overwhelmingly posi-tive in their assessment of the initiative on student outcomes. Seventy one percent of all 1:1 teachers reported that their students’ quality of work had improved through participation in the program. The majority of surveyed teachers additionally reported that they had observed improvements in students writing quality and on student achievement. In respect to standardized assessment/state test score results, the final assessment from all school principals and leaders as well as the major-ity of BWLI teachers was that 1:1 computing has positively impacted student achievement (14% disagreed). The school principals were even more unanimous in their assessment of the impact of the BWLI and 1:1 computing on their students. For example, all of the interviewed school leader-ship reported unanimously that the “BWLI program has positively impacted my student’s academic achievement”. One hundred percent of all interviewed school leaders also believed that computers

inTASC REPORT: Berkshire Wireless Learning Initiative, Final Evaluation Report, March 2009133
helped their students “grasp difficult curricular concepts” and allowed them to “create better look-ing products.” There was only one school principal/leader who disagreed with the sentiments of the other four BWLI school leaders who reported that their “students develop a deeper understanding of the subject material when using a computer.” Lastly, all of the responding school leaders were unanimous in their belief that “students would use technology more at my school if there was less pressure to perform on standardized tests” while the majority of BWLI teachers (62%) agreed that “the impacts of a 1:1 computing program may take many years to be fully understood”.
Improved Student Engagement
There is strong evidence that student engagement increased dramatically in response to the enhanced educational access and opportunities afforded by 1:1 computing through the BWLI pro-gram. The chief results supporting this finding include the teacher survey, student survey, principal interviews, classroom observations, teacher interviews, and to a lesser extent the student drawings. In their final BWLI survey, teachers overwhelmingly reported improvements in student engage-ment and motivation. Eight three percent of teachers felt that engagement had improved for their traditional students, compared 84% for at-risk/low achieving students and 71% for high achieving students. Similar to the results on student engagement, teachers overwhelmingly found that the BWLI program enhanced their students’ motivation. Similarly, 76% of 1:1 teachers reported that student motivation improved for their low achieving students compared to 73% for traditional stu-dents and 59% for high achieving students. Conversely, a very small minority of teachers (less than 2%) believed that the 1:1 laptops had led to declined class participation and student motivation for their students.
Similarly, the principal interview results were equally as positive as the teachers in their belief that student participation in the program has led to dramatically improved student engagement in the classroom. Nearly all of the building leadership reported throughout the three-year implemen-tation period that the majority of students responded very favorably to the laptop initiative and that students’ engagement, attentiveness, and motivation was improved when they were using laptops in class. The classroom observation notes and analyses also found that a large majority of students clearly appeared more attentive and engaged when they were using their laptops in class. This senti-ment was expressed repeatedly by numerous teacher interviews over the duration of the three-year implementation. Both the classroom observation and teacher interviews additionally observed that student engagement could also be enhanced when the teacher used technology in class, such as a “cool” technology-enabled presentation to present curriculum. Lastly, the student drawing quan-titative analyses provided little additional evidence of changes in student engagement, however a number of students clearly depicted their preferences for writing with laptops.

inTASC REPORT: Berkshire Wireless Learning Initiative, Final Evaluation Report, March 2009134
Fundamental Changes in Teaching Practices
The third targeted project outcome was the documentation of fundamental paradigm chang-es in teaching, particularly teaching strategies, curriculum delivery, and classroom management. Without question, the BWLI program had major impacts across many aspects of teaching for the majority of teacher participants. The chief results supporting this finding include the teacher survey, student survey, principal interviews, classroom observations, and teacher interviews. The first year of teacher and student survey results speak volumes about the speed at which teachers adopted and implemented technology across their professional lives. Teachers quickly adopted and incorporated technology into a wide variety of new practices beyond use with their students in the classroom (which had itself increased nearly four times within the first six months of the student deployment). In the final teacher survey, nearly all of responding teachers (83%) reported that their personal computer skills had improved since the beginning of the BWLI program. Some of the most frequent “behind the scenes” uses of technology for teachers included such diverse professional tasks as re-searching and acquiring curricular materials, using email as a school-wide communication system as well as with parents and students, scheduling, record keeping and grades, managing educational web sites for their students, and creating tests, quizzes or assignments. Clearly, the majority of teach-ers’ non-instructional professional practices were impacted by the 1:1 initiative—representing a marked shift in many aspects of teaching strategies and methods. The impact of the new 1:1 tech-nology applied during actual instructional time was somewhat less universal across all BWLI class-rooms, however the impact was still quite notable considering the major investments required by teachers to “transform” and “fundamentally change” their existing classroom practices.
Despite these investments and challenges, the majority of teachers reported that they experi-enced some degree of “paradigmatic shift” in the classroom. In the final survey administration, over 80% of BWLI teachers reported that the delivery of curriculum within their classes had changed since their school began the BWLI program. In addition, just under 60% of responding teachers believed that their school climate had changed as a result of the program and over 50% of teachers further believed that their role as a teacher within their own classroom had changed. In assessing the impact of these changes in their own teaching, teachers were nearly unanimously positive (or neutral) with 62% of BWLI teachers reporting that their teaching had “improved as a result of the 1:1 program” while less than 10% disagreed.
In addition to the teacher’s own reflection in the surveys, there were also numerous examples in the classroom observations, teacher interviews and principal interviews of shifting teacher practices as a result of the 1:1 program. In some cases, teachers so fully embraced the multifaceted technolo-gies available to them in their teachers strategies, curriculum delivery, and classroom management that the idea of a complete “paradigm shift” is not an exaggeration. Most teachers’ experiences were somewhat more modest and nearly everyone involved expressed the sentiment that “even after a couple of years we still feel like were just getting accustomed to teaching in a 1:1 setting” and that the impacts of the initiative could take many years to be fully realized. Finally, there remained a very small number of teachers who were only negligibly impacted by the BWLI program and 1:1 com-puting. This small minority of staff generally felt satisfied with their pre-1:1 practices and teaching or were simply less confident experimenting with technology. However, in conclusion, 1:1 comput-

inTASC REPORT: Berkshire Wireless Learning Initiative, Final Evaluation Report, March 2009135
ing and the BWLI program substantially impacted all aspects of teachers’ professional lives in the vast majority of participating classrooms, and often with positive results.
Enhanced Student Research Skills and Collaboration
There is supporting evidence that student research skills and collaboration were enhanced by the improved educational access and opportunities afforded by 1:1 computing through the BWLI program. The chief results supporting this finding include the teacher and student survey data, teacher interviews, principal interviews, and classroom observations. Overall, the vast majority (about 95%) of BWLI students reported having at least one computer accessible at home which was most typically connected to a high-speed Internet connection and used for over 60 minutes per day, on average. Thus, we can conclude that the vast majority BWLI students entered the 1:1 laptop initiative with considerable computing and Internet experience.
Based on the early survey results, BWLI students and teachers quickly adopted the Internet as a research tool and resource. One of the most consistent results across the study findings has been the great frequency with which students reported adopting the Internet to access information in school. Furthermore, in the Year 3 student surveys, the second and third most frequent technology use reported across all BWLI students (after using the Internet to access information) was “accessing a teacher’s website” and “take notes in class.” The frequency and widespread nature of these results strongly suggests students had increased their research capabilities through the 1:1 initiative.
Certainly, in every BWLI setting students access to digital resources and tools increased expo-nentially with 1:1 student computing. In both the classroom observations and teacher interviews, there were numerous accounts of how the 1:1 computing and wireless Internet access had changed the way students’ access information and conduct research. It was generally observed that students quick adoption and preference for the Internet (and more specifically “google”) was emphatically reported to be the research tool of their choice. In the teacher survey, BWLI teachers reported that once beginning the 1:1 environment they assigned their students much more frequently to create products using a wider variety of tools and mediums than had been available previously or prior to the 1:1 program. Specifically, teachers reported multifold increases in the frequency of their students creation of multimedia projects, pictures and art, stories and book, web pages or other web-based publications all using their new technology resources throughout the student laptop deployment. Despite a peak in the variety and frequency of student products during the second year of implementation, after the third scheduled year of program implementation over 60% of teacher respondents still felt that their students have “greater freedom of choice with regard to their individual learning style” due to their participation in the BWLI program. Clearly, both practices and sentiments of participating students and teachers show that students’ capabilities to conduct independent research increased through participation in the 1:1 program.
There is also somewhat more limited evidence that student collaboration and interaction with peers increased with the resources and opportunities afforded to students through 1:1 computing and the BWLI program. Although a harder outcome to measure, teachers across the BWLI setting generally observed increases in student collaboration for a sizable portion of their students, al-

inTASC REPORT: Berkshire Wireless Learning Initiative, Final Evaluation Report, March 2009136
though not the majority. Specifically, in the final survey BWLI teachers reported that their students’ interactions with other students had increased as a result of 1:1 computing for 44% of their tradi-tional students, 42% of low-achieving students, and 39% of high-achieving students. Across all types of students, less than 7% of teachers reported decreases in student peer interaction as a result of the 1:1 initiative. The post-BWLI principal/school leadership interview also saw school leaders divided in their assessment that “students interact with each other more while working with computers” where 3 of respondents agreed (40%) or strongly agreed (20%) and 2 disagreed (40%). Alternatively, teachers were stronger in their assessment that the BWLI program had positively impacted students ability to work independently. For example in the final year-end survey, BWLI teachers reported that their students ability to work independently had increased for 69% of their traditional stu-dents, 65% of low-achieving students, and 52% of high-achieving students (less than 3% reported declines). Based on this evidence, we can conclude that student collaboration and interaction in-creased for many BWLI students and in many BWLI classrooms, but the impact of the initiative on student collaboration was less universal and dramatic than many of the other findings.

inTASC REPORT: Berkshire Wireless Learning Initiative, Final Evaluation Report, March 2009137
DiscussionIn school, it is important to keep kids informed and ready for the real world and the work force, and computers are becoming a very important part of our world. It is important that we know how to use a computer so that when we reach the workforce and higher levels of education, we are not struggling to keep up. Also, using computers in school is a great way to keep kids focused and ready to learn, and keep people interested in the education they are receiving. computers, especially laptops, are our links to an ever-expanding world of technology, and it is important to know how to connect to this world easily, which having laptops allows us to do.
8th grade Female Student Herberg Middle School, Pittsfield, MA Comment on June 2008 student survey
As educational theorist and critic Larry Cuban and others have demonstrated, educational tech-nology use in typical school environments (where technology resources are shared) has typically resulted in sporadic and limited use, particularly when considering teachers’ direct instructional use and students use (Cuban, 2001). Given that there has been historically sporadic and little use of technology in education, the impacts of various technologies in education have been slow to emerge. One of the earliest findings emerging from the pioneering 1:1 settings (the first 1:1 student laptop program was launched in 1989 in Sydney Australia) was that student and teachers use of technology increased exponentially. This dramatic increase in computer use is obviously related to the increased access and resources when technology is no longer shared, as well as the leadership and vision of these early adopting educational settings. However, with technology actually being used with some regularity it is possible to begin to realistically assess how different uses may impact teaching and learning.
The purpose of the BWLI program and this subsequent evaluation has been to determine the impacts of a 1:1 pilot program on reforming teaching and learning practices across five varied mid-dle school settings. Although the implementation and outcomes across each participating school varied, it is clear from the current investigation that 1:1 computing holds major promise for impact-ing the lives of teachers and students in meaningful ways, which may lead to many positive out-comes. Specifically, the current investigation was principally concerned with documenting the four targeted program objectives identified before the pilot program was launched in 2005: enhanced student achievement, improved student engagement, fundamental shifts in teaching practices, and enhanced student research and collaboration. Of specific interest within our study has been the way teachers transformed their teaching practices to accommodate technology and how these changes enhanced student engagement and learning. Within this context, the various methodological ap-proaches and subsequent statistical results reveal that teaching and learning were indeed impacted across the vast majority of BWLI classrooms, as reported in this report’s Findings section. However, as would be expected from any pilot program employed across dozens of classrooms in five unique

inTASC REPORT: Berkshire Wireless Learning Initiative, Final Evaluation Report, March 2009138
middle school environments, the degree of adoption, use, and subsequent realization of positive outcomes varied across and within settings.
As summarized in the Introduction and Background sections of this report, past research and evaluation on the impacts of 1:1 computing have generally focused on similar academic outcomes. However, given that 1:1 computing is still in its infancy and that few of the largest programs have had serious resources invested in evaluation and research efforts, there is still a great deal to learn about 1:1 laptop computing programs. Like studies in New Hampshire (Bebell, 2005) and Maine (Silvernail, 2008), the Massachusetts results from the BWLI program suggest that 1:1 computing can dramatically and radically change teaching and learning practices. There is little question that the student and teacher laptops, in addition to the increased professional development, support, and organizational structure provided through the Berkshire Wireless Learning Initiative, vastly changed teaching and learning conditions for the majority of students and teachers in these set-tings. Specifically, after three years of implementation we witnessed a marked change in teaching and learning in the participating schools. The consensus of the participants (school leaders, teach-ers, and students) was overwhelmingly positive towards these educational opportunities afforded through increased educational technology. As observed years earlier in the New Hampshire pilot program, it was very soon in the deployment process that teachers and students began incorporat-ing technology into their lessons. This suggests that 1) teachers and students felt ready for change and 2) the majority viewed educational technology as an improvement over existing practices.
The proponents of educational technology and 1:1 programs believe there is potential to radi-cally change the teaching and learning practices and even classroom structure via the adoption and use of 1:1 computing, much the same way other areas of our culture (communication, entertain-ment, etc) have been transformed through PCs, e-commerce, and the Internet. Indeed, many of the early visionaries of the 1:1 computing “movement” have pointed to outcomes and results that go well beyond the scope of most educational initiatives. Maine Governor Angus King, who is credited with launching the first statewide 1:1 laptop program, for example, promoted the Maine Learning Technology Initiative as an important component of Maine’s economic development initiative. Edu-cational theorist and author Seymour Papert argued over 30 years ago that providing students with powerful technologies could and will change the nature of how students think and retain informa-tion. Similarly, today’s students, as evidenced by their frequency of home computer use and through other regional and national appraisals, have quickly embraced computer technologies across all aspects of their lives. Indeed, students’ expectations for computers and their seemingly natural abili-ties to assimilate technology are so great that it can even be disconcerting to teachers and parents. For example, the explosion in popularity of websites such as Facebook and mySpace for social net-working and communication amongst middle and high school students cannot be exaggerated. Although the targeted objectives assessed in the BWLI program were somewhat more conservative by nature, 1:1 computing, given its ubiquitous nature and the ever-increasing power and adaptation of computing technologies, continues to represent a strong departure from the status quo and exist-ing educational practices in most public middle schools. As documented specifically in the detailed analyses of student and teacher practices and attitudes across the five BWLI settings, not every

inTASC REPORT: Berkshire Wireless Learning Initiative, Final Evaluation Report, March 2009139
teacher was willing or interested to experience a “radical shift” in their pedagogy and practices as the majority of their students seemed to be.
It is impossible to overstate the power of individual teachers in the success or failure of 1:1 com-puting. As discussed at greater length in the Results section on classroom observations, it is critically important to appreciate the pivotal role that classroom teachers play in the success of 1:1 computing. Looking across all of the current data, it is clear that teachers nearly always control how and when students access and use technology during the school day. In addition, teachers must make a mas-sive investment in time and effort to adapt their teaching materials and practices to make the 1:1 environment effective and relevant. With the adoption of the BWLI program, teachers were asked to change their existing practices and integrate technology across all aspects of their professional lives. As such, these results suggest that the burden of change is often greater for teachers than for any other participants in a 1:1 initiative.
In each of the 1:1 settings, there remained a small number of teachers who were reluctant to change their “tried and true” pre-1:1 teaching practices. In a few of these instances, school principals inferred that the BWLI program may have even led a few veteran teachers to decide to retire a little earlier than they had originally scheduled. However, the potential changes in pedagogical approach and resources afforded by 1:1 computing also served to attract and excite both existing and incom-ing teachers. In nearly every BWLI middle school, principals expressed pleasure at the excitement of incoming teacher applicants, many of whom commented specifically in their applications and job interviews that they were especially attracted to the school for its 1:1 program. Although the emphasis in the current study was not to determine how and why the majority of teachers exhibited enthusiasm for 1:1 computing while others were decidedly less inclined, some further discussion may be illuminating.
Despite widespread increases in teachers and student technology use, across the three years of the formal program implementation in the five participating 1:1 schools, there was no single subject area or grade level where technology uses were found to be universally more widespread or univer-sally unused. In other words, no single subject area received universal high or low use across more than a couple of schools. Similarly, although BWLI students generally reported using computers to “find information on the Internet”, “take notes in class” and “access a teacher’s website” as among the most frequently occurring student uses in each setting, notable differences were also observed across the patterns of student computer use in each of the individual BWLI settings. Furthermore, throughout a school day, a student during the second or third year of the program could easily go through the day without ever using their laptop if none of their teachers had a “laptop lesson” pre-pared. Similarly, a student in different classes with different teachers could use their laptop through-out the day within the same grade level and school setting. Taken collectively, we can conclude that it was factors within each school setting which played a larger role in the adoption and use of technology than factors related to trends across subject areas or grade level. Survey data, as well as the qualitative data collected in these 1:1 schools, suggest that teachers’ adoption of technology is related to a number of factors. These factors include teachers’ beliefs and attitudes about pedagogy and the value of educational technology, ease of access to technology, quality and timeliness of tech-

inTASC REPORT: Berkshire Wireless Learning Initiative, Final Evaluation Report, March 2009140
nology support, professional development and training, as well as a school culture and leadership that values and promotes technology.
In research going back decades, it has been shown that teachers’ pedagogical philosophy and beliefs towards educational technology can strongly shape how likely teachers will be to adopt and use technology for different purposes in school (Bebell, Russell, & O’Dwyer, 2004; Russell, Bebell, O’Dwyer, & O’Connor, 2003; Ravitz, Wong, & Becker, 1999). In every BWLI school there was a wide range of staff with varied beliefs and experiences concerning education technology. Again, it was suggested that some teachers reported to be very hesitant in changing what they regarded as their own time-tested and effective educational practices. However, just as we have witnessed in popular culture over the past decade, the overwhelming sentiment towards the new technology was one of general acceptance and optimism. Again, as both the classroom observations and teacher survey data show, BWLI teachers were very quick to begin making use of their BWLI laptops for a number of educational aims and purposes. Even before the student deployment had officially begun, the vast majority of BWLI teachers had already incorporated a wide variety of regularly occurring new technology applications. The most frequent of these uses included preparing and researching lesson plans using the Internet and other computer-based resources. Teachers widely commented that they had suddenly and infinitely expanded their available curricular materials and teaching resources. Use of the new computers for communication also grew rapidly as teachers used email both with leadership and other staff within their schools but also with students and parents. Many teachers also developed web sites for their classes, which typically served as repositories for student resources and digital curricular materials as well as organization and project based managerial sources for their classes.
Across most applications of technology, it was those teachers who adopted new uses for comput-ers (particularly for direct instructional use), who also reported the most comfort and ability to use technology. In other words, across BWLI settings, it was those teachers who adopted and frequently used technology for various aspects of their teaching who more highly rated the value of technology than those teachers who used technology with less frequency. Thus, if teachers do not value technol-ogy first and therefore make fewer attempts to use it, they may never realize the educational ben-efits that those teachers who more frequently use technology consistently cite. These cyclical results perhaps suggest that increased use of technology by teachers led to teachers increased valuations for technology while teachers who valued technology less, used it less, and therefore observed fewer positive outcomes. Hence, the importance of professional development and support, both of which teachers reported were most beneficial when the focus was shared between technology mechanics (i.e. learning new applications, software) and the integration of meaningful technology into to the curriculum.
There is also a fairly common assumption in education that new generations of teachers will promote and master the use of educational technology in the classroom given their personal expo-sure to technology while growing up. Research from non-1:1 settings as well as observations across the BWLI settings, suggests this assumption is only partially true. It was observed that in general the younger generation of teachers most quickly adopted and applied technology resources to support their teaching with widespread use of computers to research lesson plans and communicate with

inTASC REPORT: Berkshire Wireless Learning Initiative, Final Evaluation Report, March 2009141
professional peers. However, teachers’ age was largely unrelated to use of technology for instruc-tional purposes and with students in class, and found that newly hired teachers often took a few years of acclimation before they were regularly using technology as an instructional tool and with their students. Again, these results also underscore the myriad ways that teachers have applied and used technology to support teaching and learning in 1:1 settings.
Teachers’ access to technology resources also varied across the BWLI settings in ways that likely impacted the frequency of teacher and student use as well as the program outcomes across the dif-ferent settings. Although all students and teachers were provided laptop computers and wireless learning environments, access to peripheral and supporting resources varied greatly across the three years of the project deployment and across the five school settings. The results suggest that in some cases, 1:1 student and teacher laptops were not always entirely adequate or sufficient for meeting the hardware and software needs of each teacher. For example, despite 1:1 student laptops, teachers noted obstacles when LCD projectors were not easily available to them. Another example detailed in the classroom observation results section was a lack of printers available in some BWLI schools. The point of such examples is that even when student and teacher computers were universally provided, there were numerous examples when technology resources and equity issues still became obstacles in successfully transforming teaching and learning practices. Clearly, to those designing and man-aging 1:1 initiatives there are many considerations beyond teacher and student computers, which may impact the efficacy and outcomes of the program.
As the BWLI program was implemented in five varied different middle school environments, it is possible to consider the impacts of these differences on how the program was implemented as well as what outcomes were generated. Although the purpose and research design of this evaluation do not allow for a definitive exploration of what factors were critical to the success of 1:1 computing, however a number of naturally occurring differences across participating schools deserve greater scrutiny and attention. For example, school and district leadership led to differences in how the program was managed which seemed to then impact use and outcomes. For example, in one school, after the second year of implementation other priorities and obligations left the school basically without any clear leadership concerning the management and oversight of the BWLI program at their school. From a research perspective, it is worth noting that this was also the same school were the use of teacher and student technology use was often lowest in the student and teacher surveys, underscoring the potential link between school-level leadership and program outcomes.
As another example of differences across the three-year implementation period and across the participating schools, the percent of students who could take home their BWLI laptops varied con-siderably. Again, since the current research did not apply a randomized experimental design to determine the impacts of such differences, it is impossible to make causal connections between implementation differences and outcomes. However, based on the research carried out herein, 1:1 programs are clearly not always a simple and straightforward operation, but those schools that wit-nessed the highest degrees of implementation also seemed to be those schools with the most en-gaged leadership and project management.
inTASC REPORT: Berkshire Wireless Learning Initiative, Final Evaluation Report, March 2009142
In addition, it is impossible to determine how much of the positive educational outcomes real-ized in the BWLI settings would generalize to other schools who may adopt similar programs. As both past and current research has demonstrated, there is growing evidence that 1:1 computing has the potential to radically change teaching and learning practices. Even though nearly all classroom settings resulted in the variety and frequency of technology use increasing dramatically from pre-program levels, deeper changes in teaching and learning were not always universal. In the current investigation, the revolutionary rhetoric of the radical changes in teaching and learning that are possible in a 1:1 environment were largely isolated in individual classrooms and could often be at-tributed to the philosophy and investment by specific classroom teachers, as well as the increased technology resources.
Furthermore, it is also challenging to ascertain how the impacts of the BWLI program and 1:1 computing will be sustained following the three year study period investigated here. For example, it is possible there was some degree of “Hawthorne effect” where students and teachers made more use of technology because they were in a pilot study. Similarly, the novelty of computers in school may have led to their early use adoption and use that may not be sustained once these resources are more commonplace. Based on the student and teacher survey results most uses of technology in school peeked during the second year of the program implementation, with some small decreases reported in the third year. Conversely, it is also possible that as teachers and students grow increasingly com-fortable with education technology, future use and applications will increase. As the program con-tinued into its second and third year, the educational and professional benefits of the program were often more readily recognized by the participating teachers and staff. In both teacher surveys and principal interviews, the majority of faculty and leadership stated that the impacts of 1:1 computing may take many years to be realized. Again, given the research design and emphasis of the current study, neither of these claims can be definitively proven or disproven.
As is the case with nearly all research of interesting and evolving educational initiatives, perhaps as many questions are raised by the current examination as are answered. In describing his early enchantment and rich educational experiences resulting from his discovery of gears and transmis-sions at age two, educational theorist and mathematician Seymour Papert warns of the challenge (or impossibility) of addressing and quantifying the potential educational effects and impacts of provid-ing children with rich learning environments and tools. In the Preface to the seminal Mindstorms, Papert writes: “If any ‘scientific’ educational psychologist had tried to “measure” the effects of this encounter, he would probably have failed. It had profound consequences but, I conjecture, only many years later. A ‘pre- and post-‘ test at age two would have missed them.” (Papert, 1993, p. xx) In many ways, the impacts of the rich learning environments afforded by the BWLI program are equally hard to consider and quantify, especially such a short time after the program was started.
It is especially important to remember when considering these results that the current study and analysis is not without its own limitations. Given the exemplary participation rates for each year of data collection, the emphasis of the current investigation relies upon quantitative data collection techniques (student surveys, teacher surveys, student achievement analyses) whereby it is possible to determine how representative or widespread any finding or result may be across all participants. The site visit data summarized in the current paper (classroom observations, teacher interviews and

inTASC REPORT: Berkshire Wireless Learning Initiative, Final Evaluation Report, March 2009143
principal/school leadership interviews) does not provide much indication as to how widespread or universal the observations or the sentiments expressed in the interviews may actually be across all the BWLI classrooms and schools. Thus, to maximize the validity of the evaluation results, multiple data sources were employed to address each of the targeted learning outcomes in the Findings sec-tion of this report.
Throughout this report, every effort was made to present the data in a succinct yet transparent manner, while providing as much formative data as possible to BWLI and school leadership. The analyses presented in the paper represent only a fraction of the statistical iterations that were per-formed in exploratory analyses. It should be fairly clear based on the data presented in this paper that summarizing the student survey results is a complex task given that each of the three grade lev-els had different laptop implementation schedules. In addition, although each of the BWLI schools was provided similar resources through the BWLI program, each school had distinct characteristics in its technology resources, policies, support, and implementation, which is why results are often presented at the individual school level.
The response rates from the BWLI teacher and student surveys were generally excellent al-lowing us to place more confidence in the assertion that the data presented herein adequately and properly represents the use and beliefs of the BWLI students and teaching staff. However, when considering the “final” Year 3 results, it is also important to remember that responding students in June 2008 had been in a 1:1 setting for only two years or less. Similarly, it is important to consider that for the majority of the teacher respondents, the final June 2008 teacher survey was completed after less than two years of participation in 1:1 student computing. Only 7th grade teachers had more than two years of 1:1 experience when the final rounds of the survey were collected. As such, it is important to remember that many of the teacher survey respondents may be drawing only on their initial experiences when addressing these issues. However, given that BWLI teachers are in one of best positions to observe the effects of the program, they are equally one of the best sources of information for investigating its impact and current data provides an excellent examination of teachers’ beliefs and experiences in newly developed 1:1 settings.
As the opening quote in the Introduction by Seymour Papert warns, the long term impacts and effects of providing students with new learning tools and environments can be extremely dif-ficult or impossible to quantify. Given the thirty-six month evaluation timeline, only the imme-diate and short-term outcomes of the program can be addressed to suggest the possibility of the long-term impacts of providing teachers and students with technology resources. These long-term effects, however, cannot be understood without the quantification and documentation of technol-ogy use in the short term. Again, before any of the proposed benefits of an educational technology can be explored, the research team must be able to document if technology use is actually occur-ring. While there is a strong desire to examine the impact of technology on student achievement, research suggests that the impacts on learning must first be placed in the context of teacher and student technology use (Bebell, Russell, & O’Dwyer, 2004). However, through the current pre/post comparison study of teaching and learning practices across BWLI schools, it is possible to begin to frame the potential long term impacts resulting for teachers and students from increased exposure to computer-based technologies.

inTASC REPORT: Berkshire Wireless Learning Initiative, Final Evaluation Report, March 2009144
Again, as the quote that begins the Introduction of this paper suggests, one of the great chal-lenges facing educators and policy makers with educational technology is the rapid pace at which technology resources are constantly evolving. For example, the cutting edge Apple iBooks provided to all students and teachers at the beginning of the BWLI program, were showing the limitations of their age and amount of use by the second year of the program. Particularly for those teachers who became heavily invested in using their computer, the limitations of memory, hardware, and software were realized. In short, technology resources often have a particularly short shelf life compared to traditional educational resources. If the BWLI program was replicated at the time of this report (Spring 2009), project and school leadership would likely be investigating technologies that were largely unheard of even four years ago, such as cloud networking, interactive white boards, and web-based productivity software and resources such as google docs. Further, national rhetoric since Barack Obama’s election in November 2008 suggests a growing degree of federal interest and sup-port for investments in educational technology resources while the One Laptop Per Child (OLPC) Foundation has created considerable international attention for low energy, low cost student laptops as an educational and economic reform in some of the world’s emerging economies. Finally, we would be remiss to not mention that the increasing majority of students themselves in recent years have quickly adopted and widely employ technology across all aspects of their personal lives, from cell phones which increasingly contain computer functions, to the emerging ways students are using Internet resources for communication, recreation, and entertainment. This increasing gap between students and educators has led some to adopt the term “digital native” to describe just how differ-ently today’s students relate, think, and apply technology to their world than those of prior genera-tions who were not raised in a computer age (Prenksy, 2006).
For most participants and close observers of the initiative, the general observation has been that the program has had far many reaching and positive educational impacts, but not all of these impacts were realized universally across all participants and schools. As such, the results of this program do not address the actual potential of 1:1 computing as much as they speak to one specific implementation of a 1:1 program in five varied middle school settings. In other words, the study re-sults should not be viewed as a definitive assessment of 1:1 computing and educational technology, but an example of the potential of 1:1 computing as implemented through a program that brought 1:1 resources into five middle school settings from 2005 to 2008.
In conclusion, the current study found many positive educational impacts resulting from par-ticipation in 1:1 computing and the BWLI program. From these results, it is easy to conclude that the potential of 1:1 student and teacher computing holds major promises for transforming teaching and learning, although there are many clear and notable obstacles. It is also challenging to predict how technology itself will change in the future and how the educational needs of increasingly tech-savvy students will be met by future educators.

inTASC REPORT: Berkshire Wireless Learning Initiative, Final Evaluation Report, March 2009145
ReferencesBaldwin, F. (1999). Taking the classroom home. Appalachia, 32(1), 10–15.
Bebell, D. (2008). Berkshire Wireless Learning Initiative: Year 2 Annual Report. Boston, MA: Technology and Assessment Study Collaborative, Boston College. Retrieved August 26, 2008 from: http://www.bc.edu/research/intasc/researchprojects/bwli/pdf/BWLI_Year2_Report.pdf.
Bebell, D. (2007). Berkshire Wireless Learning Initiative Evaluation Implementation Notes and Concerns. Boston, MA: Technology and Assessment Study Collaborative. Retrieved August 26, 2008 from: www.bc.edu/bwli.
Bebell, D. (2005). Technology Promoting Student Excellence: An Investigation of the first year of 1:1 computing in New Hampshire Middle Schools. Boston, MA: Technology and Assessment Study Collaborative, Boston College. Retrieved August 26, 2008 from: http://www.bc.edu/ research/intasc/researchprojects/nhLaptop/nhtpse.shtml.
Bebell, D. (2001). 1000words: What can we learn from middle school students’ classroom drawings? Paper presented at the annual meeting of the New England Educational Research Organization, Northhampton, MA, April 2001.
Bebell, D. & Russell, M. (2006). Revised Evaluation Plan for Berkshire Wireless learning Initiative. Boston, MA: Boston College, Technology and Assessment Study Collaborative.
Bebell, D., Russell, M., & O’Dwyer, L.M. (2004). Measuring teachers’ technology uses: Why multiple-measures are more revealing. Journal of Research on Technology in Education, 37(1), 45–63.
Bessette, H. J. (2008). Using students’ drawings to elicit general and special educators’ perceptions of co-teaching. Teaching and Teacher Education, 24 (1376–1396 ).
Bull, G., Bull, G., Garofolo, J., & Harris, J. (2002). Grand Challenges: Preparing for the Technological Tipping Point. The International Society for Technology in Education (ISTE). Retrieved May 7, 2004, from http://www.iste.org/L&L/29/8/featured-article/bull/index.htm.
Cromwell, S. (1999). Laptops change curriculum—and students. Education World. Retrieved November 6, 2003 from http://www.education-world.com/a_curr/curr178.shtml.
Cuban, L. (2001). Oversold and Underused: Reforming Schools Through Technology, 1980–2000. Cambridge MA: Harvard University Press.
Dunleavy, M. & Heinecke, W.F. (2007). The Impact of 1:1 Laptop Use on Middle School Math and Science Standardized Test Scores. Computers in the Schools, 24(3/4), 7–22.
eSchool News. (2006, May 1). 1-to-1 computing on the rise in schools. eSchool News Online. Retrieved June 1, 2006, from http://www.eschoolnews.com/news/showstory.cfm?ArticleID=6278.
Glass, G., & Hopkins, K. (1996). Statistical methods in education and psychology (3rd ed.). Boston: Allyn and Bacon.

inTASC REPORT: Berkshire Wireless Learning Initiative, Final Evaluation Report, March 2009146
Great Maine Schools Project. (2004). One-to-One Laptops in High School Environment. Piscataquis High School Study Final Report. Retrieved April 25, 2007 from http://www.greatschoolspartnership.org/pdf/One-to-OneComputing_Report.pdf.
Guignon, A. (1998). Laptop computers for every student. Education World. Retrieved November 6, 2003, from: http://www.education-world.com/a_curr/curr048.shtml.
Gulek, J.C. & Demirtas, H. (2005). Learning with technology: The impact of laptop use on student achievement. Journal of Technology, Learning, and Assessment, 3(2).
Hayes, J. (2006). America’s digital schools; 2006: A five-year forecast. Retrieved April 9, 2006 from http://www.ads2006.org/ads2006/pdf/ADS2006KF.pdf.
Maine Education Policy Research Institute (MEPRI). (2003). The Maine Learning Technology Initiative: Teacher, Student, and School Perspectives Mid-Year Evaluation Report. Retrieved November 6, 2003 from http://www.usm.maine.edu/cepare/pdf/ts/mlti.pdf.
Massachusetts Department of Education. (2008). Ensuring Technical Quality: Policies and Procedures Guiding the Development of the MCAS Tests. Malden, MA: Massachusetts Department of Elementary and Secondary Education. Accessed January 15, 2008 from: www.doe.mass.edu/mcas/2008/release/technical_quality.doc.
Luke, D. A. (2004). Multilevel Modeling. Thousand Oaks, CA: Sage Publications.
O’Dwyer, L.M., Russell, M., Bebell, D., & Tucker-Seeley, K.R. (2005). Examining the relationship between home and school computer use and students’ English/language arts test scores. Journal of Technology, Learning, and Assessment, 3(3). Retrieved September 27, 2008 from http://www.jtla.org.
O’Dwyer, LM., Russell, M., Bebell, D., & Seeley, K. (2008). Examining the Relationship between Students’ Mathematics Test Scores and Computer Use at Home and at School. Journal of Technology, Learning, and Assessment, 6(5). Retrieved September 27, 2008 from http://www.jtla.org.
Oppenheimer, T. (2003). The flickering mind: The false promise of technology in the classroom and how learning can be saved. New York, NY: Random House.
Papert, S. (1996). The connected family: Building the digital general gap. Atlanta, GA: Long Street Press.
Papert, S. (1993). Mindstorms : Children, computers, and powerful ideas. 2nd ed. New York: Basic Books.
Papert, S (1992). The children’s machine. New York, NY: Harper Collins.
Prensky, M. (2006) Don’t bother me mom, I’m learning! St. Paul, MN: Paragon House Publishers.
Ravitz, J., Wong, Y., & Becker, H. (1999). Teacher and teacher directed student use of computers and software. Irvine, CA: Center for Research on Information Technology and Organizations.

inTASC REPORT: Berkshire Wireless Learning Initiative, Final Evaluation Report, March 2009147
Rockman, S. (1998). Powerful tools for schooling: Second year study of the laptop program. San Francisco, CA: Author.
Russell, M. (1999). Testing Writing on Computers: A Follow-up Study Comparing Performance on Computer and on Paper. Education Policy Analysis Archives, 7(20). Available: http://epaa.asu.edu/epaa/v7n20/.
Russell, M., Bebell, D., Cowan, J. & Corbelli, M. (2003). An AlphaSmart for each student: Does teaching and learning change with full access to word processors? Computers and Composition. 20, 51–76.
Russell, M., Bebell, D., & Higgins, J. (2004). Laptop Learning: A comparison of teaching and learning in upper elementary equipped with shared carts of laptops and permanent 1:1 laptops. Journal of Educational Computing Research. 30(3), 313–330.
Russell, M., Bebell, D., O’Dwyer, L.M., & O’Connor, K.M. (2003) Examining teacher technology use: Implications for pre-service and in-service teacher preparation. Journal of Teacher Education 54(4), pp. 297–310.
Russell, M. & Haney, W. (1997). Testing writing on computers: an experiment comparing student performance on tests conducted via computer and via paper-and-pencil. Education Policy Analysis Archives, 5(3). Available: http://epaa.asu.edu/epaa/v5n3.html.
Russell, M., O’Brien, E., Bebell, D., & O’Dwyer, L. (2003). Students’ beliefs, access, and use of computers in school and at home. Boston, MA: Boston College, Technology and Assessment Study Collaborative.
Russell, M. & Plati, T. (2001). Mode of Administration Effects on MCAS Composition Performance for Grades Eight and Ten. Teachers College Record, [Online]. Available: http://www.tcrecord.org/Content.asp?ContentID=10709.
Sandstrom, M. Bartini, M. and Bebell, D. (1998). Gender and Grade Differences in Internet Aggression: Development of the eBehavior Scale. Presented at the March 2008 Annual Meeting of the Society for Research on Adolescence, Chicago IL.
Shapley, K. (2008). Evaluation of the Texas Technology Immersion Pilot (eTxTIP): Year 2 Results. Paper presented at the 2008 Annual Meeting of the American Educational Research Association, New York, NY.
Silvernail, D. (2008). Maine’s Impact Study of Technology in Mathematics (MISTM). Paper presented at the 2008 Annual Meeting of the American Educational Research Association, New York, NY.
Silvernail, D.L. & Lane, D.M. (2004). The impact of Maine’s one-to-one laptop program on middle school teachers and students. Maine Education Policy Research Institute (MEPRI), University of Southern Maine.

inTASC REPORT: Berkshire Wireless Learning Initiative, Final Evaluation Report, March 2009148
Weston, M.E. & Bain, A. (2009). Achieving the elusive: Enhancing teaching, learning, and increasing student achievement. One-to-One newsletter, 2(2), 3–4.
Zucker, A. and Light, D. (2009). Laptop Programs for Students. Science Vol. 323 No. 82. Downloaded March 1, 2009 from www.sciencemag.org.
Zucker, A. and Hug, S. (2008). Teaching and Learning Physics in a 1:1 Laptop School. Journal of Science Education Technology. Vol. 17, No. 6, pp.586–594.

inTASC REPORT: Berkshire Wireless Learning Initiative, Final Evaluation Report, March 2009149
A measurement scale is created by examining the strength of the correlation between the responses to individual survey items or questions. The magnitude of the relationship between the items is evaluated by examining how high each item loads on a single scale and how much variabil-ity among the original number of items is explained by the created scales. For example, consider a scale created from the three items in Table A1. Each item represents some measure of how students use technology to present information to their class. When analyzed using principal components analysis, we find evidence that the three items, which were partially designed and written to form a scale, hang together and account for 66% of the variance in the individual item responses. The larger the percent of variance explained the more confident we can be that the scale is capturing the information in the individual items.
Table A1: Students use of technology to present information in class scale
Factor Loadings
In the past year, how often did you use a computer in school to create a PowerPoint presentation? .789
In the past year, how often did you use a computer in school to create graphs or tables? .821
In the past year, how often did you present information to the class? .834
Variance explained: 66.4%
Cronbach’s Alpha: .743
Damian Bebell, Ph.D.Rachel E. KayTechnology and Assessment Study Collaborative, Boston College
Appendix A
Construction and Statistical Qualities of the BWLI Student Survey Measurement Scales

inTASC REPORT: Berkshire Wireless Learning Initiative, Final Evaluation Report, March 2009150
The values of the factor loadings range from 0.789 to 0.834 and represent the correlation between the individual item and the scale. The percent of variance explained, the size of the factor loadings, and the value of Cronbach’s alpha support the creation of a “present information to the class” scale.
When items have been identified that form a meaningful scale, each subject’s score on the scale must be calculated. One way in which this can be done is to create a summated scale score. A summated scale score is formed by computing the sum or average for each person of all their responses to the items that make up the scale. Another way to calculate a subject’s score on the measurement scale is to create a factor score. Unlike a summated scale score, the factor score is computed based on the loadings of all the variables on the scale. A standardized factor score has a mean of zero and a standard deviation of 1. Individuals with high values on the items with high factor loadings will receive high positive factor scores.
For all scales created using the BWLI student survey data, principal component analysis was used. In addition, three criteria were applied when developing scales:
the scale had to account for at least 45% of the variance in the item level responses;a.
the minimum factor loading for any item comprising the scale was 0.5;b.
the items comprising the scale had to relate to a sensible theoretical construct.c.
Following are the survey items and related statistical information for each of the student survey scales used in the BWLI analyses of student achievement. First scales documenting students use of technology are presented, followed by scales concerning students home use as well as attitude towards 1:1 computing and ability to use computers.

inTASC REPORT: Berkshire Wireless Learning Initiative, Final Evaluation Report, March 2009151
Table A2: Scales for technology use at school
Factor Loadings
Writing and Research
In the past year how often did you use a computer in school for reading/language arts? .825
In the past year how often did you use a computer in school to write first drafts? .815
In the past year, how often did you use a computer in school to edits papers? .754
In the past year, how often did you use a computer in school to find information on the Internet? .658
Variance explained: 58.3%
Cronbach’s Alpha: 0.737
Solving Problems
In the past year, how often did you use a computer in school to work with spreadsheets/databases? .750
In the past year, how often did you use a computer in school to solve problems? .800
In the past year, how often did you use a computer in school to analyze data? .848
Variance explained: 64.5%
Cronbach’s Alpha: 0.708
Presenting Information
In the past year, how often did you use a computer in school to create a PowerPoint presentation? .789
In the past year, how often did you use a computer in school to create graphs or tables? .821
In the past year, how often did you present information to the class? .834
Variance explained: 66.4%
Cronbach’s Alpha: .743
Class-related Acttivities
In the past year, how often did you use a computer in school to play educational com-puter games? .652
In the past year, how often did you use a computer in school to takes notes in class? .729
In the past year, how often did you use a computer in school to keep track of dates and schedule/calendar? .655
In the past year, how often did you use a computer in school to access a teacher’s website? .779
Variance explained: 49.8%
Cronbach’s Alpha: .624

inTASC REPORT: Berkshire Wireless Learning Initiative, Final Evaluation Report, March 2009152
Table A2: Scales for technology use at school (continued)
Factor Loadings
Teacher Use of Computers
In the past year, how often did your teacher use a computer in reading/language arts class? .881
In the past year, how often did your teacher use a computer in social studies class? .858
In the past year, how often did your teacher use a computer in math class? .869
In the past year, how often did your teacher use a computer in science class? .885
Variance explained: 76.2%
Cronbach’s Alpha: 0.704
Communication
In the past year, how often did you use a computer in school to send or receive email? .874
In the past year, how often did you use a computer in school to email a teacher? .874
Variance explained: 76.4%
Cronbach’s Alpha: 0.691

inTASC REPORT: Berkshire Wireless Learning Initiative, Final Evaluation Report, March 2009153
Table A3: Scales for technology use at home
Factor Loadings
Writing and Research
On a typical day, about how many minutes do you use a computer at home to search the Internet for school? 0.870
On a typical day, how many minutes do you use a computer at home to write papers for school? 0.906
On a typical day, how many minutes do you use a computer at home to work on school projects? .895
Variance explained: 79.4%
Cronbach’s Alpha: 0.869
Multimedia Use
On a typical day, how many minutes do you use a computer at home to create or main-tain a website? .787
On a typical day, how many minutes do you use a computer at home to create music or video projects? .808
On a typical day, how many minutes do you download music or video from the Inter-net? .789
Variance explained: 63.2%
Cronbach’s Alpha: 0.700
Communication
On a typical day, how many minutes do you use a computer at home to chat/IM? .835
On a typical day, how many minutes do you use a computer at home to email? .796
On a typical day, how many minutes do you use a computer at home for video or tele-conferencing (Skype)? .566
On a typical day how many minutes do you use a computer at home to use a social networking site (MySpace or Facebook)? .566
Variance explained: 58.6%
Cronbach’s Alpha: .757
Recreational Home Use
On a typical day, how many minutes do you use a computer at home to search the Internet for fun? .698
On a typical day, how many minutes do you use a computer to create music or video projects? .734
On a typical day, how many minutes do you use a computer to download music or video? .811
On a typical day, how many minutes do you use a computer to shop online? .688
Variance explained: 53.9%
Cronbach’s Alpha: .704

inTASC REPORT: Berkshire Wireless Learning Initiative, Final Evaluation Report, March 2009154
Table A4: Scales for student beliefs and abilities around technology
Factor Loadings
Student Beliefs
Agree/disagree: having a laptop in school made learning new things easier. 0.870
Agree/disagree: having a laptop in school made learning new things more fun. 0.906
Variance explained: 86.4%
Cronbach’s Alpha: 0.842
Student Perceived Abilities
How well are you able to write papers using a computer? .676
How well are you able to communicate using email? .597
How well are you able to record and analyze data using a spreadsheet? .645
How well are you able to find information using the Internet? .561
How well are you able to create multimedia presentations? .673
How well are you able to type accurately? .647
How well are you able to separate facts from opinions when using the Internet? .702
How well are you able to take notes using a computer? .658
Variance explained: 41.8%
Cronbach’s Alpha: 0.783

inTASC REPORT: Berkshire Wireless Learning Initiative, Final Evaluation Report, March 2009155
Endnotes1 It should be noted that the summary statistics presented in Tables S17–S20 only represent those
students who reported access to at least one computer at home. The five percent of survey respondents who reported that they did not have a home computer were not presented any additional survey items regarding home computer access and use.
2 The MCAS data reproduced in Figures SA1 through SA5 was obtained directly from the Massachusetts Department of Education (http://profiles.doe.mass.edu/state_report/mcas.aspx). It should be noted the computation rules used to determine students MCAS performance levels was changed by the state in 2006 so that absent students were no longer automatically assigned the “Warning/Failing” performance level. For the data presented in this and all subsequent figures, the 2006 scoring rules were applied to all post-2003 data. Any data from 1998 through 2002 has the former (pre-2006) rules applied; although the difference between the old and new rules in these results is likely less than one percent.
3 The subject tests offered annually by the state have changed somewhat over the ten-year history of the MCAS. For the 8th grade Massachusetts students, the math test was offered each year while the science test was offered from 1998 until 2000 and again resumed in 2003. In 2001, the ELA exam was moved to 7th grade, so no MCAS ELA was offered at Grade 8 from 2002 until 2005 when it was reintroduced to fulfill requirements of the federal No Child Left Behind Act.