benthos and plankton community data for selected rivers and … · benthos and plankton community...
TRANSCRIPT

!(
87°41'40"87°42'87°42'20"87°42'40"
43°45'20
43°45'
43°44'40"
Source: Esri, DigitalGlobe, GeoEye, i-cubed, USDA, USGS, AEX, Getmapping, Aerogrid, IGN, IGP, swisstopo, and the GIS User Community
Sheboygan River
8th
Stre
et B
ridge
8th
Stre
et B
ridge
SheboyganSheboygan
!( Sampling location
EXPLANATION
0 0.2 0.4 MILE
0 0.2 0.4 KILOMETER
Figure 17. Photo showing the hydrolab QuantaTM Sonde used to record in-situ field measurements.
Figure 21. Photo showing a Van Dorn AlphaTM vertical water sampler being deployed for collection of phytoplankton.
Figure 18. Photo showing a Ponar® dredge being retrieved with a grab for a benthos community sample.
U.S. Department of the InteriorU.S. Geological Survey
Data Series 824
Prepared in cooperation with the Wisconsin Department of Natural Resources and the U.S. Environmental Protection Agency-Great Lakes National Program Office
Benthos and Plankton Community Data for Selected Rivers and Harbors along Wisconsin’s Lake Michigan Shoreline, 2012

Cover Background image: U.S. Geological Survey sampling location for benthos and plankton communities in the Sheboygan River, Wisconsin, Area of Concern (see figure 6). Satellite photo image courtesy of Esri© 2013, DeLorme, NAVTEQ. Small photos show various sampling methods used in this study. Photos taken by Barbara Scudder-Eikenberry.

Benthos and Plankton Community Data for Selected Rivers and Harbors along Wisconsin’s Lake Michigan Shoreline, 2012
By Barbara C. Scudder Eikenberry, Amanda H. Bell, Daniel J. Burns, and Hayley A. Templar
Prepared in cooperation with the Wisconsin Department of Natural Resources and the U.S. Environmental Protection Agency-Great Lakes National Program Office
Data Series 824
U.S. Department of the InteriorU.S. Geological Survey

U.S. Department of the InteriorSALLY JEWELL, Secretary
U.S. Geological SurveySuzette M. Kimball, Acting Director
U.S. Geological Survey, Reston, Virginia: 2014
For more information on the USGS—the Federal source for science about the Earth, its natural and living resources, natural hazards, and the environment, visit http://www.usgs.gov or call 1–888–ASK–USGS.
For an overview of USGS information products, including maps, imagery, and publications, visit http://www.usgs.gov/pubprod
To order this and other USGS information products, visit http://store.usgs.gov
Any use of trade, firm, or product names is for descriptive purposes only and does not imply endorsement by the U.S. Government.
Although this information product, for the most part, is in the public domain, it also may contain copyrighted materials as noted in the text. Permission to reproduce copyrighted items must be secured from the copyright owner.
Suggested citation:Scudder Eikenberry, B.C., Bell, A.H., Burns, D.J., and Templar, H.A., 2014, Benthos and plankton community datafor selected rivers and harbors along Wisconsin’s Lake Michigan shoreline, 2012: U.S. Geological Survey Data Series 824, 30 p. plus 8 appendixes, http://dx.doi.org/10.3133/ds824.
ISSN 2327-638X (online)http://dx.doi.org/10.3133/ds824
iii
Contents
Abstract ...........................................................................................................................................................1Introduction.....................................................................................................................................................1Site Descriptions ............................................................................................................................................2
Lower Menominee River Area of Concern .......................................................................................6Lower Green Bay and Fox River Area of Concern ..........................................................................6Sheboygan River Area of Concern ....................................................................................................7Milwaukee Estuary Area of Concern ................................................................................................7Escanaba River Non-Area of Concern Comparison Site .............................................................17Oconto River Non-Area of Concern Comparison Site ..................................................................17Ahnapee River Non-Area of Concern Comparison Site ...............................................................17Kewaunee River Non-Area of Concern Comparison Site ............................................................17Manitowoc River Non-Area of Concern Comparison Site ...........................................................17Root River Non-Area of Concern Comparison Site .......................................................................17
Data Collection .............................................................................................................................................24Benthos Collection and Processing ................................................................................................24Plankton Collection and Processing ................................................................................................26Quality Assurance and Quality Control ...........................................................................................28
References Cited..........................................................................................................................................29
Figures
1. Map showing ten sampling locations investigated for the evaluation of benthos and plankton communities for evaluation of Beneficial Use Impairments at Areas of Concern (AOCs) and non-AOC comparison sites along the western shoreline of Lake Michigan ..........................................................................................................................3
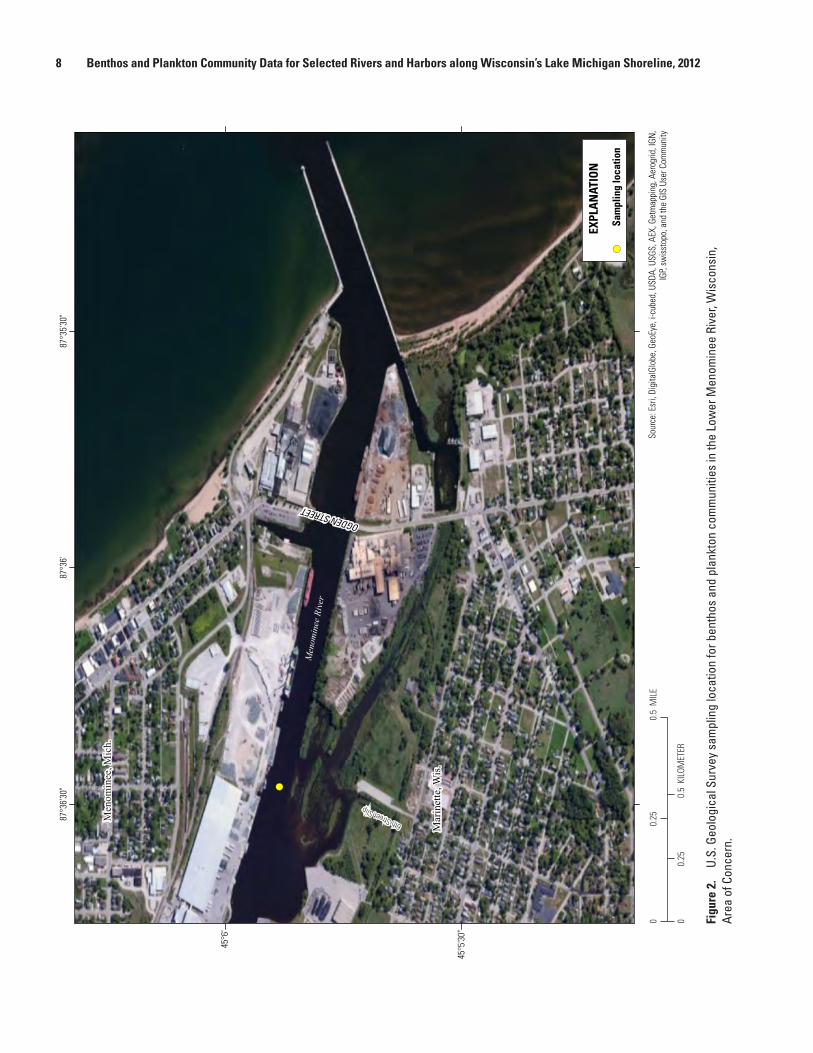
2. Map showing U.S. Geological Survey sampling location for benthos and plankton communities in the Lower Menominee River, Wisconsin, Area of Concern ......................8
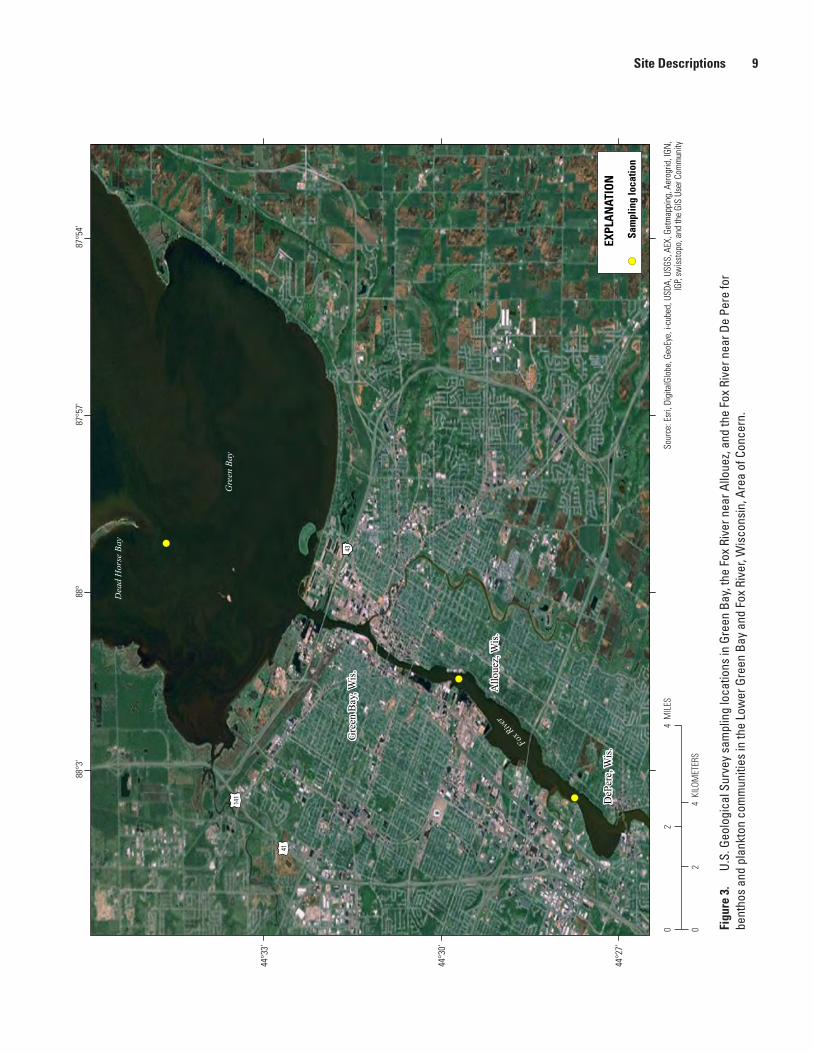
3. Map showing U.S. Geological Survey sampling locations in Green Bay, the Fox River near Allouez, and the Fox River near De Pere for benthos and plankton communities in the Lower Green Bay and Fox River, Wisconsin, Area of Concern ..........9
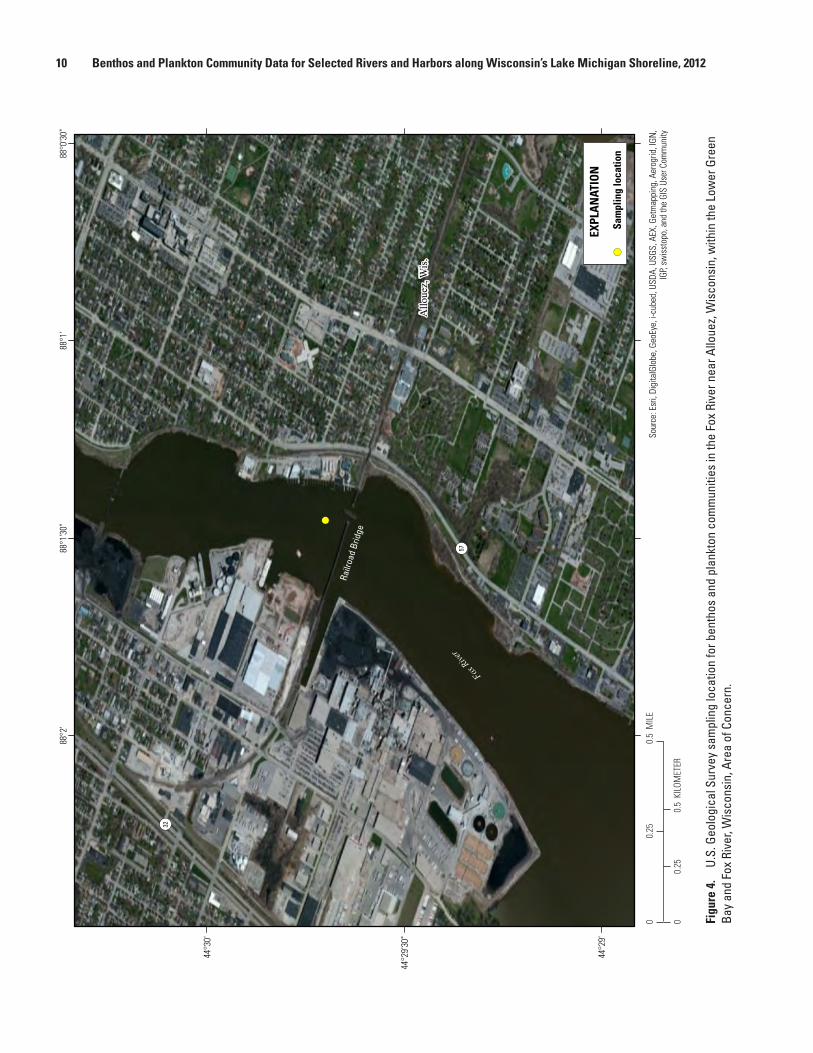
4. Map showing U.S. Geological Survey sampling location for benthos and plankton communities in the Fox River near Allouez, Wisconsin, within the Lower Green Bay and Fox River, Wisconsin, Area of Concern ...........................................10
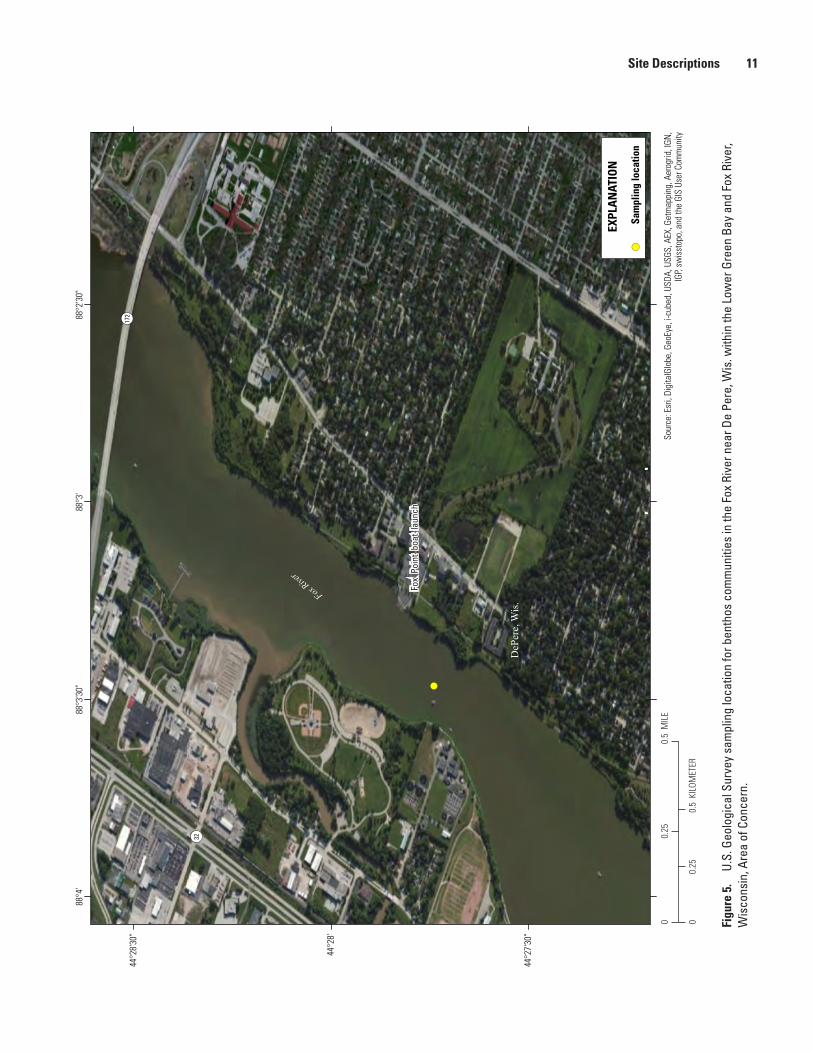
5. Map showing U.S. Geological Survey sampling location for benthos communities in the Fox River near De Pere, Wisconsin within the Lower Green Bay and Fox River, Wisconsin, Area of Concern .....................................................................................................11
6. Map showing U.S. Geological Survey sampling locations for benthos and plankton communities in the Sheboygan River, Wisconsin, Area of Concern .................13
7. Map showing U.S. Geological Survey sampling locations in the Milwaukee River, Menomonee River, and Milwaukee Harbor for benthos and plankton communities in the Milwaukee Estuary, Wisconsin, Area of Concern .............................15
8. Map showing U.S. Geological Survey sampling location for benthos and plankton communities in the Milwaukee River within the Milwaukee Estuary, Wisconsin, Area of Concern .....................................................................................................16

iv
9. Map showing U.S. Geological Survey sampling location for benthos and plankton communities in the Menomonee River within the Milwaukee Estuary, Wisconsin, Area of Concern .....................................................................................................15
10. Map showing U.S. Geological Survey sampling location for benthos and plankton communities in the Milwaukee Inner Harbor within the Milwaukee Estuary, Wisconsin, Area of Concern......................................................................................16
11. Map showing U.S. Geological Survey sampling locations for benthos and plankton communities in the Escanaba River, Michigan .....................................................18
12. Map showing U.S. Geological Survey sampling locations for benthos and plankton communities in the Oconto River, Wisconsin ........................................................19
13. Map showing U.S. Geological Survey sampling locations for benthos and plankton communities in the Ahnapee River, Wisconsin .....................................................20
14. Map showing U.S. Geological Survey sampling locations for benthos and plankton communities in the Kewaunee River, Wisconsin ..................................................21
15. Map showing U.S. Geological Survey sampling locations for benthos and plankton communities in the Manitowoc River, Wisconsin. ...............................................22
16. Map showing U.S. Geological Survey sampling locations for benthos and plankton communities in the Root River, Wisconsin .............................................................23
17. Photo showing Hydrolab Quanta™ Sonde used to record in-situ field measurements. ............................................................................................................................24
18. Photo showing Ponar® dredge being retrieved with a grab for a benthos community sample. .....................................................................................................................25
19. Photo showing Hester-Dendy artificial substrate samplers retrieved for benthos community assessment .............................................................................................................25
20. Photo showing a plankton net being washed to collect a sample of zooplankton ..................................................................................................................................26
21. Photo showing a Kemmerer™ vertical water sampler being deployed for collection of phytoplankton .......................................................................................................27
Tables
1. U.S. Geological Survey sampling locations at Wisconsin’s Lake Michigan Areas of Concern (AOCs) and non-AOC comparison sites in Wisconsin and Michigan, including station number, latitude, longitude, drainage area, and discharge. ...................4
2. Land use-land cover for U.S. Geological Survey sampling locations at Wisconsin’s Lake Michigan Areas of Concern (AOCs) and non-AOC comparison sites in Wisconsin and Michigan. ..............................................................................................5
3. Quality assurance and quality control (QA-QC) results for replicate samples of benthos and plankton collected at the Sheboygan and Manitowoc Rivers, Wisconsin, showing similarity for relative abundance of taxa collected within each season ................................................................................................................................28
v
Conversion Factors
SI to inch-pound
Multiply By To obtain
Length
centimeter (cm) 0.3937 inch (in)millimeter (mm) 0.03937 inch (in)meter (m) 3.281 foot (ft) meter (m) 1.094 yard (yd) kilometer (km) 0.6214 mile (mi)
Area
square centimeter (cm2) 0.1550 square inch (ft2) square meter (m2) 10.76 square foot (ft2) square kilometer (km2) 0.3861 square mile (mi2)
Volume
milliliter (mL) 0.0338 ounce (oz)liter (L) 0.2642 gallon (gal)
Mass
gram (g) 0.03527 ounce, avoirdupois (oz)kilogram (kg) 2.205 pound avoirdupois (lb)
Inch-pound to SI
Multiply By To obtain
Length
mile (mi) 1.609 kilometer (km)Area
square mile (mi2) 2.590 square kilometer (km2)Flow rate
cubic foot per second (ft3/s) 0.02832 cubic meter per second (m3/s)
Concentrations of chemical constituents in water are given either in milligrams per liter (mg/L) or micrograms per liter (µg/L); specific conductance is given in microsiemens per centimeter at 25 degrees Celsius (µS/cm at 25 °C).
Temperature in degrees Celsius (°C) may be converted to degrees Fahrenheit (°F) as follows: °F=(1.8×°C)+32.
Vertical coordinate information is referenced to the North American Vertical Datum of 1988 (NAVD 88).
Horizontal coordinate information is referenced to the North American Datum of 1983 (NAD 83).

vi
Abbreviations
AOC Area of Concern
BUI Beneficial Use Impairment
EPA U.S. Environmental Protection Agency
GBMSD Green Bay Metropolitan Sewage District
GIS Geographic information system
GLNPO Great Lakes National Program Office
H-D Hester-Dendy artificial substrate sampler
IBI Index of Biotic Integrity
PAHs Polycyclic Aromatic Hydrocarbons
PCBs Poly-Chlorinated Biphenyl compounds
QA-QC Quality assurance and Quality control
RAP Remedial Action Plan
SOP Standard Operating Procedure
USGS U.S. Geological Survey
VOCs Volatile Organic Compounds
WDNR Wisconsin Department of Natural Resources
WSLH Wisconsin State Laboratory of Hygiene

vii
Acknowledgments
This study was done in cooperation with the Wisconsin Department of Natural Resources (WDNR), with Legacy Act funding from the U.S. Environmental Protection Agency-Great Lakes National Program Office. Donalea Dinsmore, Andrew Fayram, Stacey Hron, Victor Pappas, Benja-min Uvaas, Laurel Last, Meghan O’Shea, and others of the WDNR assisted with study plan-ning and sampling logistics. Nicolas Buer of the U.S. Geological Survey (USGS) assisted with sampling. Dr. Kurt Schmude of the University of Wisconsin-Superior, Paul Garrison of the WDNR, and Dawn Perkins of the Wisconsin State Laboratory of Hygiene identified and enumerated benthos and plankton. We would like to thank USGS reviewers Karen M. Beaulieu, Elizabeth Enright, S. Bridgett Manteufel, and David A. Saad for their comments on an earlier version of the manuscript. James Kennedy and Michelle A. Lutz (USGS) assisted with geographic informa-tion systems and creation of the figure 1 map. Laura Nelson (USGS) assisted with finalization of maps in figures 2-16. Rosemary Stenback (USGS) completed the publication layout.


Benthos and Plankton Community Data for Selected Rivers and Harbors along Wisconsin’s Lake Michigan Shoreline, 2012
By Barbara C. Scudder Eikenberry, Amanda H. Bell, Daniel J. Burns, and Hayley A. Templar
Abstract
Four river systems on the Wisconsin shoreline of Lake Michigan are designated Areas of Concern (AOCs) because of severe environmental degradation: the Lower Menominee River, Lower Green Bay and Fox River, Sheboygan River, and Milwaukee Estuary. Each AOC has one or more Beneficial Use Impairments (BUIs) that form the basis of the AOC des-ignation and that must be remediated or otherwise addressed before the AOC designation can be removed. All four of these AOCs have BUIs for benthos (bottom-dwelling or benthic invertebrates), and all but the Menominee River have a BUI for plankton (free-floating algae and invertebrates, or phyto-plankton and zooplankton, respectively). The U.S. Geologi-cal Survey collected samples in 2012 at these four AOCs and at six non-AOCs to support the evaluation of the status of aquatic communities in the benthos and plankton at the AOCs. Samples were collected during three periods represent-ing spring, summer, and fall. Benthos samples were collected using a dredge grab sampler and artificial substrates; plankton samples were collected using a tow net for zooplankton and a vertical water sampler for phytoplankton. Benthos and plank-ton were identified to the lowest possible taxonomic category and counted; samples for documenting water temperature, pH, and specific conductance, as well as sediment particle size and organic carbon were also collected during biological sampling.
Introduction
The Laurentian Great Lakes of the United States and Canada contain one-fifth of all the freshwater in the world. They face common plights of many large water bodies, such as invasive species, native species loss, nutrient enrichment, chemical contamination, habitat degradation, bank erosion, and sedimentation. Within the Great Lakes, certain geographic areas are considered to have severe environmental degradation and were defined as Areas of Concern (AOCs) in the United
States-Canada Great Lakes Water Quality Agreement (Inter-national Joint Commission United States and Canada, 1987). Along the Great Lakes shoreline, 43 AOCs have been identi-fied: 26 in U.S. waters and 17 in Canadian waters, and five AOCs are shared between the nations. Four AOCs in Wiscon-sin are along Lake Michigan’s shoreline: the Lower Menomi-nee River, Fox River and Lower Green Bay, Sheboygan River, and Milwaukee Estuary. Each AOC is officially “listed” due to one or more Beneficial Use Impairments (BUIs), for example, degraded fish and wildlife populations, degradation of benthos (bottom-dwelling or benthic invertebrates), or degradation of plankton populations (free-floating algae and invertebrates, or phytoplankton and zooplankton, respectively). An AOC cannot be “delisted” until remediation has resulted in improvements meeting certain criteria, thus allowing the removal of all BUI designations for the AOC except in cases where a beneficial use cannot be fully restored (U.S. Policy Committee, 2001). A BUI may be removed without a full recovery only in cases where a) the BUI is due to natural, rather than human, causes; b) the BUI is not limited to the AOC but is instead typical of lakewide, regionwide, or areawide conditions; or c) the impairment was caused by stressors outside of the AOC (Grapentine, 2009).
The data presented in this report were collected to sup-port evaluation of the BUIs for degradation of benthos and degradation of plankton populations. Degradation of benthos is one of the most widespread BUIs in the United States, and these aquatic communities in many cases cannot be brought back to a predisturbance state. Degradation of benthos is most often related to sediment contamination, but water chemistry, substrate type, inadequate food supply, and river flows may also be important (Reynoldson, 1987; U.S. Environmental Protection Agency, 1994; Wisconsin Department of Natural Resources, 2009, 2011). The degradation of plankton popula-tions may be the result of poor water quality due to excessive nutrient enrichment or toxic chemicals, inadequate food sup-plies, high flows at river mouths, and other physical, chemi-cal, and biological stresses (Gannon and Stemberger, 1978; Wisconsin Department of Natural Resources, 1994).

2 Benthos and Plankton Community Data for Selected Rivers and Harbors along Wisconsin’s Lake Michigan Shoreline, 2012
Results of site-specific monitoring are required for determination of whether or not target criteria have been met to remove one or more BUIs. For example, if the phyto-plankton and zooplankton or benthos at an AOC do not differ significantly from one or more unimpacted control sites with comparable physical and chemical characteristics, the target criteria have been met to remove these BUIs (U.S. Policy Committee, 2001). In 2012, the U.S. Geological Survey (USGS), in collaboration with the Wisconsin Department of Natural Resources (WDNR) and the U.S. Environmental Pro-tection Agency (EPA) Great Lakes National Program Office (GLNPO), conducted a study of the benthos and plankton at 10 locations in rivers and harbors along Wisconsin’s Lake Michigan shoreline. Four sampling locations were in AOCs and six additional locations were relatively unimpacted or less-impacted comparison locations with similar physical and chemical characteristics (referred to hereafter as non-AOCs). The overall goal of the study was to inform the decision pro-cess with regard to removal of the BUI for degradation of ben-thos and the BUI for degradation of plankton populations. This report describes the study areas and field sampling methods, and it presents data on taxonomic identification and abundance of benthos and plankton for evaluation of related BUIs. Ben-thos were collected using grab samplers and artificial substrate samplers; plankton were collected using tow nets for zoo-plankton and vertical water samplers for phytoplankton. Physi-cal and chemical data that were sampled concurrently (specific
conductance, temperature, pH, chlorophyll a, total and volatile suspended solids in water samples; particle size and volatile-on-ignition in benthic grab samples) and the results of field quality assurance-quality control are also presented.
Site Descriptions
Ten geographic locations were selected for this investiga-tion (fig. 1). The WDNR and USGS are aware that there are no sites along the western Lake Michigan shoreline that are truly unimpacted; however, the non-AOC sites selected for comparison do not have the AOC designation and are there-fore assumed to have communities similar to those that would be present in AOCs if the AOCs did not have the specific contamination that was identified during designation and listing. The locations of sampling sites in the four AOCs and the six non-AOC comparison sites, including their drainage basin areas and annual mean discharges, are listed in table 1. Many areas of the Midwest and Wisconsin were experienc-ing a stretch of high heat and drought during the summer and fall sampling periods that resulted in low stream discharges to some of sampling locations. Land use-land cover (table 2) was determined using a geographic information system (GIS) based on the National Land Cover Dataset for 2001 (Homer, Huang, and others, 2004; Yang, Huang, and others, 2002).

!
!
!
!
#
#
#
#
#
#
6
9
8
7
5
4
3
2
1
10
Copyright: ©2013 Esri, DeLorme, NAVTEQ
86°87°88°89°90°
46°
45°
44°
43°
WISCONSIN
MICHIGAN
LA
KE
M
I CH
I GA N
L A K E S U P E R I O R
EXPLANATION
Type of sampling site
National Land Cover
! AOC
Site ID number# NON-AOC
Water
Urban
Barren/shrubland
ForestGrasslandAgriculture
Wetland
Drainage basin
5
WISCONSINWISCONSIN
0 20 40 MILES
0 20 40 KILOMETERS
Site Descriptions 3
Figure 1. Ten sampling locations investigated for the evaluation of benthos and plankton communities for evaluation of Beneficial Use Impairments at Areas of Concern (AOCs) and non-AOC comparison sites along the western shoreline of Lake Michigan.

4 Benthos and Plankton Community Data for Selected Rivers and Harbors along Wisconsin’s Lake Michigan Shoreline, 2012Ta
ble
1.
U.S
. Geo
logi
cal S
urve
y sa
mpl
ing
loca
tions
at W
isco
nsin
’s La
ke M
ichi
gan
Are
as o
f Con
cern
(AO
Cs) a
nd n
on-A
OC
com
paris
on s
ites
in W
isco
nsin
and
M
ichi
gan,
incl
udin
g st
atio
n nu
mbe
r, la
titud
e, lo
ngitu
de, d
rain
age
area
, and
dis
char
ge.
[SW
IMS,
Sur
face
Wat
er In
tegr
ated
Mon
itorin
g Sy
stem
of W
isco
nsin
; km
2, sq
uare
kilo
met
ers;
ft3/
s, cu
bic
feet
per
seco
nd; N
A, n
ot a
vaila
ble]
Map
nu
mbe
r (fi
g. 1
)Si
te n
ame
SWIM
S
stat
ion
nu
mbe
r
Latit
ude
(d
ecim
al
degr
ees)
Long
itude
(d
ecim
al
degr
ees)
Dra
inag
e ar
ea
(k
m2 )
Ann
ual m
ean
disc
harg
e1 20
12
(ft
3 /s)
Ann
ual m
ean
di
scha
rge1
hist
oric
al
(ft3 /s
)
Peri
od o
f di
scha
rge
reco
rd1
Map
nu
mbe
r of
com
pari
son
site
AO
Cs
1Lo
wer
Men
omin
ee R
iver
1003
7445
45.0
9810
-87.
6077
210
,490
1,98
33,
197
1945
–201
25,
62
Low
er G
reen
Bay
and
Fox
Riv
er
2a
L
ower
Gre
en B
ay10
0375
3044
.577
51-8
7.98
600
16,5
84N
AN
AN
AN
A2b
F
ox R
iver
nea
r Allo
uez
1003
7435
44.4
9499
-88.
0242
416
,178
4,34
64,
677
1989
–201
27,
82c
F
ox R
iver
nea
r De
Pere
1003
7433
44.4
6251
-88.
0577
616
,011
NA
NA
NA
7, 8
3Sh
eboy
gan
Riv
er10
0374
5143
.748
87-8
7.70
352
1,04
323
927
019
16–2
012
8, 9
4M
ilwau
kee
Estu
ary
4a
M
ilwau
kee
Riv
er10
0374
4843
.047
89-8
7.91
269
1,77
943
844
819
14–2
012
9, 1
04b
M
enom
onee
Riv
er10
0374
4643
.032
20-8
7.92
156
381
98.3
153
2009
–12
9, 1
04c
M
ilwau
kee
Har
bor
1003
7447
43.0
2501
-87.
8972
22,
193
562
716
1994
–201
2N
AN
on-A
OC
com
paris
on s
ites
5Es
cana
ba R
iver
, Mic
h.10
0374
3145
.778
45-8
7.06
325
2,39
3N
A82
919
88–9
01
6O
cont
o R
iver
1003
7449
44.8
9198
-87.
8367
82,
502
541
591
1989
–201
21,
2b,
2c
7A
hnap
ee R
iver
10
0374
3044
.609
79-8
7.43
484
274
NA
NA
NA
2b, 2
c8
Kew
aune
e R
iver
1003
7436
44.4
6073
-87.
5020
535
458
.182
.219
64–2
012
2b, 2
c, 3
9M
anito
woc
Riv
er10
0374
4444
.091
90-8
7.66
183
1,34
135
231
219
72–2
012
3, 4
a, 4
b10
Roo
t Riv
er10
0374
5042
.728
66-8
7.78
827
514
86.8
158
1963
–201
24a
, 4b
1 Bas
ed o
n th
e ne
ares
t U.S
. Geo
logi
cal S
urve
y st
ream
flow
gag
ing
stat
ion.

Site Descriptions 5Ta
ble
2.
Land
use
-land
cov
er fo
r U.S
. Geo
logi
cal S
urve
y sa
mpl
ing
loca
tions
at W
isco
nsin
’s La
ke M
ichi
gan
Are
as o
f Con
cern
(AO
Cs) a
nd n
on-A
OC
com
paris
on s
ites
in
Wis
cons
in a
nd M
ichi
gan.
[Lan
d us
e-la
nd c
over
was
bas
ed o
n th
e N
atio
nal L
and
Cov
er D
atas
et fo
r 200
1 (N
LCD
01);
%, p
erce
nt]
Map number (fig. 1)
Open water (%)
Developed, open space (%)
Developed, low intensity (%)
Developed, medium intensity (%)
Developed, high intensity (%)
Developed, total (%)
Barren (%)
Forested, deciduous (%)
Forested, evergreen (%)
Forested, mixed (%)
Forested, total (%)
Shrubland (%)
Grassland, herbaceous upland (%)
Planted-cultivated, pasture-hay (%)
Planted-cultivated, row crops (%)
Planted-cultivated, total (%)
Wetlands, woody (%)
Wetlands, emergent herbaceous (%)
Wetland, total (%)
AO
Cs
12.
933.
030.
620.
160.
063.
880.
1139
.73
5.68
9.70
55.1
10.
911.
761.
772.
564.
3229
.58
1.40
30.9
82a
6.11
3.90
2.53
0.78
0.32
7.53
0.05
23.1
72.
432.
7528
.35
1.16
1.39
9.93
30.8
740
.79
9.93
4.69
14.6
22b
6.26
3.87
2.30
0.69
0.27
7.13
0.04
23.5
52.
492.
8228
.86
1.17
1.40
9.47
30.7
740
.23
10.1
34.
7814
.91
2c6.
303.
852.
210.
630.
246.
920.
0423
.74
2.51
2.85
29.0
91.
181.
419.
3730
.63
40.0
010
.22
4.82
15.0
53
0.82
3.29
4.09
1.21
0.55
9.14
0.17
10.5
00.
120.
1110
.73
0.62
0.60
21.2
843
.04
64.3
19.
683.
9413
.62
4a1.
185.
317.
793.
311.
2617
.67
0.14
12.8
00.
630.
2713
.69
0.89
0.82
18.8
732
.71
51.5
711
.37
2.67
14.0
44b
0.19
12.4
429
.04
16.0
66.
9864
.52
0.04
6.91
0.00
0.39
7.30
0.54
1.19
5.59
15.2
820
.87
4.62
0.73
5.35
4c1.
026.
5511
.98
6.54
2.63
27.7
00.
1211
.42
0.51
0.29
12.2
20.
800.
8816
.14
28.8
144
.96
10.0
12.
2912
.30
Non
-AO
C co
mpa
rison
site
s
52.
232.
880.
840.
220.
114.
061.
6322
.57
12.7
713
.73
49.0
60.
893.
591.
890.
452.
3435
.76
0.44
36.2
06
2.25
4.19
0.60
0.11
0.05
4.95
0.01
35.3
73.
742.
7641
.87
0.59
0.56
6.16
15.3
921
.55
26.1
92.
0228
.21
70.
271.
943.
690.
400.
106.
120.
103.
300.
053.
576.
910.
620.
0748
.16
23.7
671
.93
13.6
70.
3013
.97
80.
202.
393.
580.
270.
196.
430.
105.
890.
082.
048.
000.
660.
4652
.66
25.9
178
.57
4.82
0.74
5.56
90.
553.
443.
220.
610.
267.
530.
125.
510.
010.
746.
250.
610.
5932
.11
37.5
269
.63
10.1
94.
5314
.72
100.
467.
2915
.16
5.86
2.53
30.8
30.
079.
280.
010.
369.
650.
702.
208.
5442
.83
51.3
74.
260.
464.
72

6 Benthos and Plankton Community Data for Selected Rivers and Harbors along Wisconsin’s Lake Michigan Shoreline, 2012
Lower Menominee River Area of Concern
The Lower Menominee River AOC along the Wisconsin-Upper Michigan border is the northernmost AOC in the study (figs. 1 and 2), and it has a drainage area of 10,179 square kilometers (km2). The sediment in the river is contaminated with arsenic, polycyclic aromatic hydrocarbons (PAHs, or coal tars), paint sludge, and heavy metals including cadmium, chromium, copper, lead, mercury, nickel, and zinc (Uvass and Baker, 2011). Remediation began in 2009 and continued in the turning basin through 2012 and 2013 (U.S. Environmental Protection Agency, 2013b; Uvass and Baker, 2011). During remediation, the dredging area is encompassed by a contain-ment curtain that prevents suspended dredged material from moving downstream. The sampling location for benthos and plankton was downstream of the proposed dredging area in the main channel, slightly upstream of the 6th Street Slip. Although artificial substrate samplers were placed in a location at the Menominee River site that was marked to be outside of proposed dredging areas for remediation, between the spring and summer sampler retrievals, the dredging containment cur-tain was placed such that it encompassed the samplers within the remediation dredging area. This may have adversely affected the benthos community in the summer Hester-Dendy (H-D) samplers.
The Menominee River watershed typically receives greater amounts of snowfall and generally has cooler tempera-tures than the more southern AOCs; therefore, the Escanaba and Oconto Rivers were selected as comparable river systems due to their similar climates and proximity to the Menominee River.
Lower Green Bay and Fox River Area of Concern
The Lower Green Bay and Fox River AOC (fig. 3) is the largest system in this study with a drainage area of 16,400 km2 at the mouth of the Fox River, and the bay is different from any other system in the Great Lakes because of its size and cir-culation patterns. The Fox River has a large number of paper mills on its banks and historic discharges of contaminants, primarily polychlorinated biphenyls (PCBs), that were noted as the primary cause of AOC designation (U.S. Environmental Protection Agency, 2013a). Extensive remediation efforts have been ongoing in the Fox Basin since the original Remedial Action Plan (RAP) in 1988 and will be continuing through at least 2017.
In previous studies, the diatom abundance and species found in Green Bay were markedly different than those in Lake Michigan. Average diatom concentrations were greater in Green Bay compared to Lake Michigan, and the species were those diatoms associated with eutrophic conditions (Holland, 1968). A study by Integrated Paper Services within the AOC stated that the benthos had remained relatively poor and indicated compromised physiochemical conditions during the 1980s and 1990s (Integrated Paper Services Inc., 2000). Index of Biotic Integrity (IBI) scores from a WDNR study also showed that the Lower Fox River benthos was “very poor” (Wisconsin Department of Natural Resources, 2012a). A burrowing mayfly, Hexagenia, once common in the region, has been documented only once in Green Bay since the 1950s (Ball, Harris, and Patterson, 1985; Wisconsin Department of Natural Resources, 2012a).
Because of the size of this AOC, three separate sites within the area were sampled: one in Green Bay and two in the Lower Fox River (fig. 3). Plankton samples were collected in the bay, just southeast of Dead Horse Bay near where Green Bay Metropolitan Sewage District (GBMSD) has collected cyanobacteria samples historically. Due to large depths and wave action, benthos samples were not collected in the bay. Benthos and plankton samples were collected in the Lower Fox River near Allouez, Wis., downstream of State Highway 172 at the railroad bridge near another GBMSD sample sta-tion (fig. 4). Additional benthos samples were collected each season in the Lower Fox River near De Pere, Wis., by the Fox Point boat launch and near a WDNR artificial substrate sampling location (fig. 5). These sampling locations have historical benthos data, and every effort was made to maintain spatial consistency with the locations sampled by the GBMSD and WDNR.
The Oconto, Ahnapee, and Kewaunee Rivers were chosen as comparable sites to the Fox River based on geol-ogy, latitude, and climate. However, Green Bay could not be compared directly to any other systems in this study.

Site Descriptions 7
Sheboygan River Area of Concern
The Sheboygan River AOC (fig. 6) is in the smallest of the AOC watersheds with a drainage area of 1,083 km2. It is also centrally located along Wisconsin’s Lake Michigan shoreline, with similar geology, climate, land-use, and other characteristics to several of the non-AOCs (fig. 1, table 2). The Sheboygan River AOC has several contaminant con-cerns: PCBs, PAHS, and volatile organic compounds (VOCs) (Wisconsin Department of Natural Resources, 1995, 2012b). Since the original RAP in 1993, extensive remediation efforts have been made through several programs such as the EPA’s Superfund, Sheboygan River Priority Watershed Project, Great Lakes Legacy Act, and most recently the Great Lakes Restora-tion Initiative (U.S. Environmental Protection Agency, 2013d). To avoid the ongoing dredging, which continued throughout the 2012 sampling year, the USGS sampling location was downstream of dredging activities taking place that year. The location was at the mouth of the river below the 8th Street Bridge and downstream of the bubble curtain that prevents suspended dredged material from moving downstream. The non-AOCs sites that were comparable to Sheboygan are the Kewaunee and Manitowoc Rivers.
Milwaukee Estuary Area of Concern
At the Milwaukee Estuary AOC, three separate and unique river systems converge to create the Milwaukee Inner Harbor (fig. 7). The Milwaukee River (fig. 8) is the larg-est river in the system, with watershed boundaries in seven counties (Wisconsin Department of Natural Resources, 2011; Wisconsin Department of Natural Resources and Milwaukee River Basin Land and Water Partners Team, 2001). The upper reaches of the watershed are heavily farmed and there are a few municipalities; however, the lower reaches transition to primarily urban land cover. The Milwaukee River sam-pling site was about 0.15 km upstream of Knapp Street. The Menomonee River (fig. 9) drains 352 km2, and the major-ity of the watershed is covered by municipalities and urban land; the sampling site was immediately downstream of the North-South Freeway. The Kinnickinnic River has the smallest drainage area (85 km2) and is the most urban of the Milwaukee River Basin watersheds (87 percent urban land cover); how-ever, the Kinnickinnic River was not sampled because it was the smallest in this system and also posed logistical sampling problems due to its generally shallow depth. The three river systems converge at the Inner Harbor (fig. 10) before flowing into Lake Michigan. Because these river systems represent vastly different land covers and areas, they were investigated individually for their contributions to the BUIs impacting the AOC. The original AOC boundary was expanded in 2008 to include upstream reaches with known sources of contamina-tion (U.S. Environmental Protection Agency, 2013c). The non-AOCs comparable to the Milwaukee and Menomonee Rivers were the Manitowoc and Root Rivers. As with Green Bay, the Milwaukee Harbor could not be compared directly to other systems in the study.
!(
87°3
5'30
"87
°36'
87°3
6'30
"
45°6
'
45°5
'30"
Sour
ce: E
sri,
Digi
talG
lobe
, Geo
Eye,
i-cu
bed,
USD
A, U
SGS,
AEX
, Get
map
ping
, Aer
ogrid
, IGN
, IG
P, sw
isst
opo,
and
the
GIS
User
Com
mun
ity
Men
omin
ee, M
ich.
Men
omin
ee R
iver
6th Street Slip
6th Street Slip
Mar
inet
te, W
is.
Mar
inet
te, W
is.
Men
omin
ee, M
ich.
! (Sa
mpl
ing
loca
tion
EXPL
AN
ATIO
N
OGDEN STREET
OGDEN STREET
00.
250.
5 M
ILE
00.
250.
5 K
ILOM
ETER
8 Benthos and Plankton Community Data for Selected Rivers and Harbors along Wisconsin’s Lake Michigan Shoreline, 2012
Figu
re 2
. U
.S. G
eolo
gica
l Sur
vey
sam
plin
g lo
catio
n fo
r ben
thos
and
pla
nkto
n co
mm
uniti
es in
the
Low
er M
enom
inee
Riv
er, W
isco
nsin
, A
rea
of C
once
rn.
!(
!(
!(
87°5
4'87
°57'
88°
88°3
'
44°3
3'
44°3
0'
44°2
7'
Sour
ce: E
sri,
Digi
talG
lobe
, Geo
Eye,
i-cu
bed,
USD
A, U
SGS,
AEX
, Get
map
ping
, Aer
ogrid
, IGN
, IG
P, sw
isst
opo,
and
the
GIS
User
Com
mun
ity
Gre
en B
ay
Fox Rive
r
Dea
d H
orse
Bay
Gre
en B
ay, W
is.
Gre
en B
ay, W
is.
DeP
ere,
Wis
.D
ePer
e, W
is.
Allo
uez,
Wis
.A
lloue
z, W
is.
! (Sa
mpl
ing
loca
tion
EXPL
AN
ATIO
N
£¤141
£¤41
¥43
02
4 M
ILES
02
4 K
ILOM
ETER
S
Site Descriptions 9
Figu
re 3
. U
.S. G
eolo
gica
l Sur
vey
sam
plin
g lo
catio
ns in
Gre
en B
ay, t
he F
ox R
iver
nea
r Allo
uez,
and
the
Fox
Rive
r nea
r De
Pere
for
bent
hos
and
plan
kton
com
mun
ities
in th
e Lo
wer
Gre
en B
ay a
nd F
ox R
iver
, Wis
cons
in, A
rea
of C
once
rn.
!(
88°0
'30"
88°1
'88
°1'3
0"88
°2'
44°3
0'
44°2
9'30
"
44°2
9'
Sour
ce: E
sri,
Digi
talG
lobe
, Geo
Eye,
i-cu
bed,
USD
A, U
SGS,
AEX
, Get
map
ping
, Aer
ogrid
, IGN
, IG
P, sw
isst
opo,
and
the
GIS
User
Com
mun
ity
Fox
River
Allo
uez,
Wis
.A
lloue
z, W
is.
Railr
oad
Brid
ge
! (Sa
mpl
ing
loca
tion
EXPL
AN
ATIO
N
¬«32
¬«57
00.
250.
5 M
ILE
00.
250.
5 K
ILOM
ETER
10 Benthos and Plankton Community Data for Selected Rivers and Harbors along Wisconsin’s Lake Michigan Shoreline, 2012
Figu
re 4
. U
.S. G
eolo
gica
l Sur
vey
sam
plin
g lo
catio
n fo
r ben
thos
and
pla
nkto
n co
mm
uniti
es in
the
Fox
Rive
r nea
r Allo
uez,
Wis
cons
in, w
ithin
the
Low
er G
reen
B
ay a
nd F
ox R
iver
, Wis
cons
in, A
rea
of C
once
rn.
!(
88°2
'30"
88°3
'88
°3'3
0"88
°4'
44°2
8'30
"
44°2
8'
44°2
7'30
"
Sour
ce: E
sri,
Digi
talG
lobe
, Geo
Eye,
i-cu
bed,
USD
A, U
SGS,
AEX
, Get
map
ping
, Aer
ogrid
, IGN
, IG
P, sw
isst
opo,
and
the
GIS
User
Com
mun
ity
DeP
ere,
Wis
.
Fox Rive
r
Fox
Poi
nt b
oat
laun
chFo
x P
oint
boa
t la
unch
! (Sa
mpl
ing
loca
tion
EXPL
AN
ATIO
N
¬«32
¬«172
00.
250.
5 M
ILE
00.
250.
5 K
ILOM
ETER
Site Descriptions 11
Figu
re 5
. U
.S. G
eolo
gica
l Sur
vey
sam
plin
g lo
catio
n fo
r ben
thos
com
mun
ities
in th
e Fo
x Ri
ver n
ear D
e Pe
re, W
is. w
ithin
the
Low
er G
reen
Bay
and
Fox
Riv
er,
Wis
cons
in, A
rea
of C
once
rn.

!(
87°4
1'40
"87
°42'
87°4
2'20
"87
°42'
40"
43°4
5'20
43°4
5'
43°4
4'40
"
Sour
ce: E
sri,
Digi
talG
lobe
, Geo
Eye,
i-cu
bed,
USD
A, U
SGS,
AEX
, Get
map
ping
, Aer
ogrid
, IGN
, IG
P, sw
isst
opo,
and
the
GIS
User
Com
mun
ity
Sheb
oyga
n Ri
ver
8th Street Bridge 8th Street Bridge
Sheb
oyga
nSh
eboy
gan
! (Sa
mpl
ing
loca
tion
EXPL
AN
ATIO
N
00.
20.
4 M
ILE
00.
20.
4 K
ILOM
ETER
12 Benthos and Plankton Community Data for Selected Rivers and Harbors along Wisconsin’s Lake Michigan Shoreline, 2012
Figu
re 6
. U
.S. G
eolo
gica
l Sur
vey
sam
plin
g lo
catio
ns fo
r ben
thos
and
pla
nkto
n co
mm
uniti
es in
the
Sheb
oyga
n Ri
ver,
Wis
cons
in,
Are
a of
Con
cern
.

!(
!(
!(
87°5
3'87
°54'
87°5
5'87
°56'
43°2
'
43°1
'
Sour
ce: E
sri,
Digi
talG
lobe
, Geo
Eye,
i-cu
bed,
USD
A, U
SGS,
AEX
, Get
map
ping
, Aer
ogrid
, IGN
, IG
P, sw
isst
opo,
and
the
GIS
User
Com
mun
ity
Milw
auke
e, W
is.
Milw
auke
e, W
is.
Milwau
kee River
Milwau
kee River
Men
omon
ee R
iver
Men
omon
ee R
iver
Kinnickinnic R
iver
Kinnickinnic R
iver
Milw
auke
e
Inne
r Har
bor
! (Sa
mpl
ing
loca
tion
EXPL
AN
ATIO
N
¥43
¥794
00.
40.
8 M
ILE
00.
40.
8 K
ILOM
ETER
Site Descriptions 13
Figu
re 7
. U
.S. G
eolo
gica
l Sur
vey
sam
plin
g lo
catio
ns in
the
Milw
auke
e Ri
ver,
Men
omon
ee R
iver
, and
Milw
auke
e H
arbo
r for
ben
thos
and
pla
nkto
n co
mm
uniti
es in
the
Milw
auke
e Es
tuar
y, W
isco
nsin
, Are
a of
Con
cern
.

!(
87°5
4'30
"87
°54'
40"
87°5
4'50
"87
°55'
43°3
'
43°2
'50"
43°2
'40"
Sour
ce: E
sri,
Digi
talG
lobe
, Geo
Eye,
i-cu
bed,
USD
A, U
SGS,
AEX
, Get
map
ping
, Aer
ogrid
, IGN
, IG
P, sw
isst
opo,
and
the
GIS
User
Com
mun
ity
Milw
auke
e, W
is.
Milw
auke
e, W
is.
E. K
NA
PP S
TREE
TE.
KN
APP
STR
EET
N. WATER STREETN. WATER STREET
Milw
auke
e Rive
r
! (Sa
mpl
ing
loca
tion
EXPL
AN
ATIO
N
E. CHERRY STREET
E. CHERRY STREET
00.
10.
2 M
ILE
00.
10.
2 K
ILOM
ETER
14 Benthos and Plankton Community Data for Selected Rivers and Harbors along Wisconsin’s Lake Michigan Shoreline, 2012
Figu
re 8
. U
.S. G
eolo
gica
l Sur
vey
sam
plin
g lo
catio
n fo
r ben
thos
and
pla
nkto
n co
mm
uniti
es in
the
Milw
auke
e Ri
ver w
ithin
the
Milw
auke
e Es
tuar
y, W
isco
nsin
, A
rea
of C
once
rn.

!(
87°5
4'50
"87
°55'
87°5
5'10
"87
°55'
20"
43°2
'10"
43°2
'
43°1
'50"
Sour
ce: E
sri,
Digi
talG
lobe
, Geo
Eye,
i-cu
bed,
USD
A, U
SGS,
AEX
, Get
map
ping
, Aer
ogrid
, IGN
, IG
P, sw
isst
opo,
and
the
GIS
User
Com
mun
ity
Milw
auke
e, W
is.
W C
AN
AL
STRE
ETW
CA
NA
L ST
REET
N 6TH STREETN 6TH STREET
Men
omon
ee R
iver
! (Sa
mpl
ing
loca
tion
EXPL
AN
ATIO
N
¥794
¥43
00.
10.
2 M
ILE
00.
10.
2 K
ILOM
ETER
Site Descriptions 15
Figu
re 9
. U
.S. G
eolo
gica
l Sur
vey
sam
plin
g lo
catio
n fo
r ben
thos
and
pla
nkto
n co
mm
uniti
es in
the
Men
omon
ee R
iver
with
in th
e M
ilwau
kee
Estu
ary,
W
isco
nsin
, Are
a of
Con
cern
.

!(
87°5
3'40
"87
°54'
87°5
4'20
"
43°1
'40"
43°1
'20"
Sour
ce: E
sri,
Digi
talG
lobe
, Geo
Eye,
i-cu
bed,
USD
A, U
SGS,
AEX
, Get
map
ping
, Aer
ogrid
, IGN
, IG
P, sw
isst
opo,
and
the
GIS
User
Com
mun
ity
Milw
auke
e, W
is.
Milw
auke
e, W
is.
Milw
au
kee Rive
r
Kinn
ick
innic
River
Milw
auke
e In
ner H
arbo
r
! (Sa
mpl
ing
loca
tion
EXPL
AN
ATIO
N
¥794
00.
10.
2 M
ILE
00.
10.
2 K
ILOM
ETER
16 Benthos and Plankton Community Data for Selected Rivers and Harbors along Wisconsin’s Lake Michigan Shoreline, 2012
Figu
re 1
0.
U.S
. Geo
logi
cal S
urve
y sa
mpl
ing
loca
tion
for b
enth
os a
nd p
lank
ton
com
mun
ities
in th
e M
ilwau
kee
Inne
r Har
bor w
ithin
the
Milw
auke
e Es
tuar
y,
Wis
cons
in, A
rea
of C
once
rn.

Site Descriptions 17
Escanaba River Non-Area of Concern Comparison Site
The Escanaba River (fig. 11) in Michigan’s Upper Peninsula was selected as a non-AOC comparison site based on similar climate, geography, and geology with the Menomi-nee River. Both the Menominee and the Escanaba Rivers are coldwater rivers with relatively high gradients and portions flowing over bedrock. Because of these similarities, the Menominee and Escanaba Rivers were expected to have simi-lar benthos communities, despite the significantly smaller size of the Escanaba River. There is historical contamination in the Escanaba River from point sources such as paper companies and water treatment plants, as well as nonpoint source runoff from urban areas. Additionally, there is a dam within 1 mile of the mouth that restricts fish migration upstream. The sampling location for this study was downstream of the dam near the boat launch at the mouth of the river.
Oconto River Non-Area of Concern Comparison Site
The Oconto River (fig. 12) drains into upper Green Bay and was selected as a non-AOC comparison site for the Menominee River as well as the Fox River. The Oconto has a smaller watershed area (2,502 km2) than the other two riv-ers, but it is still considered a coldwater stream with similar characteristics to the Menominee River. It too has historical contamination from paper mills, water-treatment facilities, urban runoff, and boat building. The sampling location for this site was about 1.8 km upstream of the mouth.
Ahnapee River Non-Area of Concern Comparison Site
The Ahnapee River (fig. 13) is a small river approxi-mately 48 km northeast of the mouth of the Fox River. Although it drains to Lake Michigan rather than Green Bay and has a much smaller in drainage area (303 km2), its proxim-ity to the Fox River lends to a comparison. The Ahnapee River is a low gradient stream, and it flows through predominantly agricultural land and wetlands. The Ahnapee River gener-ally has good water quality and supports a healthy warm-water fishery (Wisconsin Department of Natural Resources and Lakeshore Basin Partnership Team, 2001a). Other than water-treatment facilities, no industries directly discharge into the river. The sampling location for this site was near the 2nd Street Bridge in Algoma, Wis.
Kewaunee River Non-Area of Concern Comparison Site
The Kewaunee River (fig. 14) is a small (329 km2), predominantly agricultural watershed and was chosen as a comparison site for the Fox and Sheboygan Rivers. Most of the Kewaunee River supports a warmwater sport fishery and has seasonal runs of salmon and trout from Lake Michigan. Sediment sampling in 1988 by the WDNR found moder-ate levels of petroleum products, total phosphorus, lead, and chemical oxygen demand in sediments (Wisconsin Depart-ment of Natural Resources and Lakeshore Basin Partnership Team, 2001a). Along with nonpoint source contaminants from agricultural and urban runoff in the watershed, water-treatment facilities and several industries in the watershed may contrib-ute contaminants to the river. The sampling location for this study was near the State Highway 42 Bridge.
Manitowoc River Non-Area of Concern Comparison Site
The Manitowoc River (fig. 15) is approximately 40 km north of the Sheboygan River. It was selected as a comparison site for the Sheboygan, Milwaukee, and Menomonee Rivers based on similarities in drainage area size and land use and land cover. The land cover is predominantly agriculture with areas of protected wetlands and urban land cover primarily near the river mouth. Multiple water-treatment facilities and industries discharge to the river, which has fish consumption advisories for PCBs and heavy metals. In addition, an EPA Superfund site is near the river. Despite these known chemical issues, this river was selected as a non-AOC comparison site because it has water and sediment quality concerns similar to the AOCs mentioned above; however, this water body is not designated as an AOC. The sampling location for this site was just upstream of the 10th Street Bridge.
Root River Non-Area of Concern Comparison Site
The Root River (fig. 16) was selected as a comparison site for the Milwaukee and Menomonee Rivers. The Root River watershed is approximately 515 km2, and the land use ranges from mostly urban in the headwaters near Milwaukee, to agriculture in the middle drainage area, to highly urban at the mouth in Racine. There are fish consumption advisories for PCBs and heavy metals for the Root River (Wisconsin Depart-ment of Natural Resources and Lakeshore Basin Partnership Team, 2001b). In addition, several water-treatment facilities as well as several industries discharge into the river. The sam-pling location for this site was near the corner of Villa Street and Water Street, upstream of the State Street Bridge.

!(
87°3
'87
°3'3
0"87
°4'
87°4
'30"
45°4
7'30
"
45°4
7'
45°4
6'30
"
Sour
ce: E
sri,
Digi
talG
lobe
, Geo
Eye,
i-cu
bed,
USD
A, U
SGS,
AEX
, Get
map
ping
, Aer
ogrid
, IGN
, IG
P, sw
isst
opo,
and
the
GIS
User
Com
mun
ity
Escana
ba Rive
r
ESCA
NA
BA
RIV
ER
DA
M
Boa
t la
unch
Boa
t la
unch
! (Sa
mpl
ing
loca
tion
EXPL
AN
ATIO
N
£¤41
00.
250.
5 M
ILE
00.
250.
5 K
ILOM
ETER
18 Benthos and Plankton Community Data for Selected Rivers and Harbors along Wisconsin’s Lake Michigan Shoreline, 2012
Figu
re 1
1.
U.S
. Geo
logi
cal S
urve
y sa
mpl
ing
loca
tions
for b
enth
os a
nd p
lank
ton
com
mun
ities
in th
e Es
cana
ba R
iver
, Mic
higa
n.

!(
87°4
9'30
"87
°50'
87°5
0'30
"
44°5
4'
44°5
3'30
"
Sour
ce: E
sri,
Digi
talG
lobe
, Geo
Eye,
i-cu
bed,
USD
A, U
SGS,
AEX
, Get
map
ping
, Aer
ogrid
, IGN
, IG
P, sw
isst
opo,
and
the
GIS
User
Com
mun
ity
Oco
nto
Rive
r
Oco
nto,
Wis
.
! (Sa
mpl
ing
loca
tion
EXPL
AN
ATIO
N
00.
20.
4 M
ILE
00.
20.
4 K
ILOM
ETER
Site Descriptions 19
Figu
re 1
2.
U.S
. Geo
logi
cal S
urve
y sa
mpl
ing
loca
tions
for b
enth
os a
nd p
lank
ton
com
mun
ities
in th
e O
cont
o Ri
ver,
Wis
cons
in.

!(
87°2
5'50
"87
°26'
87°2
6'10
"87
°26'
20"
44°3
6'40
"
44°3
6'30
"
44°3
6'20
"
Sour
ce: E
sri,
Digi
talG
lobe
, Geo
Eye,
i-cu
bed,
USD
A, U
SGS,
AEX
, Get
map
ping
, Aer
ogrid
, IGN
, IG
P, sw
isst
opo,
and
the
GIS
User
Com
mun
ity
2nd Street B
ridge
2nd Street B
ridge
Alg
oma,
Wis
.A
lgom
a, W
is.
Ahna
pee R
iver
! (Sa
mpl
ing
loca
tion
EXPL
AN
ATIO
N
¬«42
00.
10.
2 M
ILE
00.
1
0.2
KIL
OMET
ER
20 Benthos and Plankton Community Data for Selected Rivers and Harbors along Wisconsin’s Lake Michigan Shoreline, 2012
Figu
re 1
3.
U.S
. Geo
logi
cal S
urve
y sa
mpl
ing
loca
tions
for b
enth
os a
nd p
lank
ton
com
mun
ities
in th
e A
hnap
ee R
iver
, Wis
cons
in.

!(
87°2
9'40
"87
°30'
87°3
0'20
"
44°2
8'
44°2
7'40
"
44°2
7'20
"
Sour
ce: E
sri,
Digi
talG
lobe
, Geo
Eye,
i-cu
bed,
USD
A, U
SGS,
AEX
, Get
map
ping
, Aer
ogrid
, IGN
, IG
P, sw
isst
opo,
and
the
GIS
User
Com
mun
ity
Kew
aune
e, W
is.
Kewaunee R
iver
! (Sa
mpl
ing
loca
tion
EXPL
AN
ATIO
N
¬«42
00.
10.
2 M
ILE
00.
10.
2 K
ILOM
ETER
Site Descriptions 21
Figu
re 1
4.
U.S
. Geo
logi
cal S
urve
y sa
mpl
ing
loca
tions
for b
enth
os a
nd p
lank
ton
com
mun
ities
in th
e Ke
wau
nee
Rive
r, W
isco
nsin
.

!(
87°3
8'40
"87
°39'
87°3
9'20
"87
°39'
40"
44°5
'40"
44°5
'20"
Sour
ce: E
sri,
Digi
talG
lobe
, Geo
Eye,
i-cu
bed,
USD
A, U
SGS,
AEX
, Get
map
ping
, Aer
ogrid
, IGN
, IG
P, sw
isst
opo,
and
the
GIS
User
Com
mun
ity
Man
itow
oc, W
is.
Man
itow
oc, W
is.
Man
itow
o c R
iver
10TH STREET 10TH STREET
! (Sa
mpl
ing
loca
tion
EXPL
AN
ATIO
N
¬«10
00.
150.
3 M
ILE
00.
150.
3 K
ILOM
ETER
22 Benthos and Plankton Community Data for Selected Rivers and Harbors along Wisconsin’s Lake Michigan Shoreline, 2012
Figu
re 1
5.
U.S
. Geo
logi
cal S
urve
y sa
mpl
ing
loca
tions
for b
enth
os a
nd p
lank
ton
com
mun
ities
in th
e M
anito
woc
Riv
er, W
isco
nsin
.

!(
87°4
6'20
"87
°46'
40"
87°4
7'87
°47'
20"
42°4
4'20
"
42°4
4'
42°4
3'40
"
Sour
ce: E
sri,
Digi
talG
lobe
, Geo
Eye,
i-cu
bed,
USD
A, U
SGS,
AEX
, Get
map
ping
, Aer
ogrid
, IGN
, IG
P, sw
isst
opo,
and
the
GIS
User
Com
mun
ity
Rac
ine,
Wis
.R
acin
e, W
is.
Root
Riv
er
STAT
E ST
REET
STAT
E ST
REET
WATER STREET
WATER STREET
VILLA STREET VILLA STREET
! (Sa
mpl
ing
loca
tion
EXPL
AN
ATIO
N
¬«32
00.
20.
4 M
ILE
00.
20.
4 K
ILOM
ETER
Site Descriptions 23
Figu
re 1
6.
U.S
. Geo
logi
cal S
urve
y sa
mpl
ing
loca
tions
for b
enth
os a
nd p
lank
ton
com
mun
ities
in th
e Ro
ot R
iver
, Wis
cons
in.

Figure 17. Photo showing the hydrolab QuantaTM Sonde used to record in-situ field measurements.
24 Benthos and Plankton Community Data for Selected Rivers and Harbors along Wisconsin’s Lake Michigan Shoreline, 2012
Figure 17. Hydrolab Quanta™ Sonde used to record in-situ field measurements.
Benthos Collection and Processing
Benthos samples were collected from each site using two methods: a grab sample and H-D samplers (U.S. Environ-mental Protection Agency, 1994). Grab samples of sediment were collected from each site using a stainless steel standard Ponar® dredge that collected a 229 by 229 millimeter (mm) sample from the upper layer of bed sediments with an approxi-mate volume of 8,200 milliliters (mL) (U.S. Environmental Protection Agency, 2010a). The dredge was lowered on a cable, which was marked at 0.5-meter (m) intervals to ensure accurate depth readings (fig. 18). The depth to the bottom was recorded, and the dredge was retrieved and checked to insure complete closure of the mechanism. If material such as woody debris or rock prevented closure, the grab material was discarded and a new grab was collected. Three to five grabs were taken at each site, depending on the substrate present. For example, hardpan substrates often required more dredges
to collect sufficient sediment to provide a representa-tive sample, whereas soft sediment allowed the dredge to sink deeper and collect larger amounts of sediment. The grabs were combined into a cooler for storage until processing on shore.
A small amount of sediment from each compos-ited dredge sample was placed into two plastic bags for analyses of sand-silt-clay fractions and volatile-on-ignition (appendix 2) to determine substrate size and type and estimate organic matter content at each location. The particle-size samples were analyzed by the Wisconsin State Laboratory of Hygiene (WSLH), and volatile-on-ignition samples were analyzed at the USGS in Middleton, Wis. (U.S. Geological Survey, 1989; Wentworth, 1922). The remainder of the com-posite sample was then washed through a series of sieves (1 centimeter (cm) and 500 micrometers (µm)) to remove debris, larger sand particles, inorganic particles, and finer sediment. The processed samples were then transferred into a collection pail, preserved with 10-percent formalin solution (buffered to pH 7), stained with Rose Bengal, and submitted to the Uni-versity of Wisconsin-Lake Superior Research Institute for benthos identification and enumeration (U.S. Envi-ronmental Protection Agency, 2010b) (appendix 3).
Data Collection
Samples were collected from each of the sites in rivers and harbors during three sampling periods in 2012. For AOCs, all sampling was done within the AOC boundaries. All sam-pling was done by boat, and coordinates of each sampling site were recorded with a GPS system and recorded on the field data sheets. In-situ water-quality measurements were taken at each site for pH, specific conductance, and water temperature by use of a Hydrolab Quanta™ Sonde that was calibrated daily (fig. 17, appendix 1). Samples taken at each site con-sisted of two benthos and two plankton sampling techniques. Benthic grabs, plankton tows, and water depth profiles were taken at the same location; artificial substrate samplers (Hes-ter-Dendy, H-D) were deployed nearby. The spring samples were collected in late May and early June; summer samples were collected in mid-July; and fall samples were collected in late August.

Figure 18. Photo showing a Ponar® dredge being retrieved with a grab for a benthos community sample. Figure 18. Ponar® dredge being retrieved with a grab for a benthos community sample.
The second benthos sample was collected using H-D samplers (Weigel and Dimick, 2011). Each H-D sam-pler consisted of eight 7.6-cm square plates of hardened Masonite sepa-rated by spacers to create three single spaces (0.32 cm), three double spaces (0.63 cm), and one triple space (0.95 cm), totaling 774 square centimeters (cm2) of surface area. At each location, two concrete blocks with two H-D samplers each were deployed; each block was independently anchored to an immobile structure such as a wing wall or pier piling. After about 6 weeks, to allow adequate time for colonization by invertebrates, the H-D samplers and blocks were retrieved. Three of the H-D samplers were randomly chosen to provide the sample for the site (fig. 19). The fourth H-D sampler was used as a backup if one or more of the samplers
Figure 19. Photo showing Hester-Dendy artificial substrate samplers retrieved for benthos community assessment.
Data Collection 25
Figure 19. Hester-Dendy artificial substrate samplers retrieved for benthos community assessment.

was compromised. For the summer sample at the Oconto River, one of the blocks that held two H-D samplers was found onshore; therefore, only the remaining two samplers on the other block were available for analysis. An equipment malfunction at the Root River resulted in loss of a block for the summer sample, so only two of three H-D samplers were available for analysis. Samplers were disassembled in the field and any attached organisms were gently scraped off with a soft bristle brush into a 4-liter (L) sample container, where they remained until processing on shore. Samplers were then reas-sembled and redeployed for the next sampling event. During processing, samples were rinsed with tap water to remove fine sediment through a 500-µm wash frame. The samples were preserved with a 10-percent formalin solution (buffered to pH 7), stained with Rose Bengal, and submitted to the University of Wisconsin-Lake Superior Research Institute for benthos identification and enumeration (U.S. Environmental Protection Agency, 2010b) (appendix 4).
Figure 20. Photo showing a plankton net being washed to collect a sample of zooplankton.
26 Benthos and Plankton Community Data for Selected Rivers and Harbors along Wisconsin’s Lake Michigan Shoreline, 2012
Figure 20. A plankton net being washed to collect a sample of zooplankton.
Plankton Collection and Processing
Plankton samples for each site consisted of a plankton tow sample, designed to capture larger zooplankton, and a vertical water sample to collect a set of whole water samples for identification of smaller phytoplankton and diatoms.
The zooplankton samples were collected based on the EPA’s Standard Operating Procedures (SOPs) for zooplankton sample collection and preservation (U.S. Environmental Pro-tection Agency, 2010f). Usually, the SOP requires two plank-ton tows, one from 20 m depth to the surface with a 63-µm net and one from 100 m depth to the surface with a 153-µm net. However, sampling was performed in bays, harbors, and rivers, where the depth for any given site did not exceed 10 m. Therefore, samples were collected from no greater than 5 m below the surface using a 63-µm plankton net with a 0.51-m diameter opening and a 500-mL dolphin bucket. A minimum of one 5-m tow was taken at each site; however, at sites
where the depth was less than about 7 m, additional tows were taken and composited until a minimum of 5 m of water depth were sampled, not including the length of the tow net (about 2 m). The net was then lifted out of the water and sprayed with tap water to wash organisms into the dolphin bucket, and then the sample was transferred to a 1-L bottle (fig. 20). For samples where algal blooms clogged the net, the sample was transferred to multiple sample bottles and all were sent to the lab for compositing and processing as a single sample. Samples were preserved on shore with 25 percent glutaraldehyde to a 1-per-cent solution. Preserved samples were sent to the WDNR for zooplankton identifica-tion and enumeration (U.S. Environmental Protection Agency, 2010e) (appendix 5).

For the phytoplankton samples, approximately 1 L of water from each meter of water depth was collected using a Kemmerer™ vertical water sampler (U.S. Environmental Pro-tection Agency, 2010d) (fig. 21). The sampler was attached to a cable marked at 0.5-m increments to ensure accurate depth samples. The sampling began at 1 m below the water surface and continued at 1-m increments until 5 m was sampled and a total of approximately 5 L of water was collected, which would provide enough water to split for the various samples. If the sampling location was less than 5 m deep, additional samples were collected beginning at 1 m and continuing until a minimum of 5 samples were collected. For example, if the depth was 3.5 m, samples were taken at 1 m, 2 m, 3 m, and again at 1 m and 2 m. The samples from each depth were com-posited in a bucket for subsampling and processing on shore.
Several subsamples were taken from this integrated depth-profile sample. Approximately 500 mL of the inte-grated sample was placed in a plastic bottle, preserved to a 1-percent solution with 25 percent glutaraldehyde, and sent to the WSLH for soft algae (that is, excluding diatoms) phytoplankton identification and enumeration (Karner, 2005) (appendix 6). Approximately 1 L of the sample was placed
in a plastic bottle, preserved to a 1-percent solution with 25 percent glutaraldehyde, and sent to the WDNR for diatom phytoplankton identification and enumeration (U.S. Environ-mental Protection Agency, 2010c) (appendix 7). A minimum of 50 mL was filtered in the field for chlorophyll a using Mil-lipore type SM, 47-mm diameter 5.0-μm pore size membrane filters, placed in analysis vials, wrapped in aluminum foil, and preserved with dry ice until delivery to the WSLH for analysis (Kennedy-Parker, 2011) (appendix 8). A minimum of 50 mL was filtered for total suspended solids and volatile suspended solids using a Whatman 1.5-μm pore size glass fiber filter, wrapped in aluminum foil, placed in a Petri dish, and pre-served with dry ice until delivery to the WSLH (American Public Health Association, American Water Works Associa-tion, and Water Environment Federation, 2006) (appendix 8). For July samples only, suspended solids analyses were done on glutaraldehyde-preserved samples; later test values for fresh and preserved samples were not significantly different. The total water volume, volume of each subsample, volume of preservative, and weight of filters were recorded on field sheets and sample labels for each site.
Figure 21. Photo showing a Van Dorn AlphaTM vertical water sampler being deployed for collection of phytoplankton.
Data Collection 27
Figure 21. A Kemmerer™ vertical water sampler being deployed for collection of phytoplankton.

28 Benthos and Plankton Community Data for Selected Rivers and Harbors along Wisconsin’s Lake Michigan Shoreline, 2012
Quality Assurance and Quality Control
To evaluate variability in the field for taxonomic results, quality assurance and quality control (QA-QC) samples were collected each sampling period at two sites, the Sheboygan River AOC and its non-AOC comparison site, the Manitowoc River. Primary and replicate samples were compared using similarity matrixes of the taxonomic data using PRIMER soft-ware (Clarke and Gorley, 2006). Similarities greater than 60 percent are considered acceptable for QA-QC purposes (Kelly, 2001). For each season, primary and replicate samples within
each site had similarities greater than 60 percent except for diatom samples and the combined algae samples (diatoms and soft algae) (table 3). In general, the diatom density was rela-tively low for all samples. For example, Manitowoc summer diatom samples had a similarity of 0, likely due to the fact that only 13 taxa total were found in the samples and none of those taxa were found in both primary and replicate samples. The total diatom cell counts for the primary and replicate samples were also low (appendix 7). Overall, however, QA-QC results indicated minimal variability among field replicates within each season for the majority of taxonomic groups.
Table 3. Quality assurance and quality control (QA-QC) results for replicate samples of benthos and plankton collected at the Sheboygan and Manitowoc Rivers, Wisconsin, showing similarity for relative abundance of taxa collected within each season.
[Average similarities greater than 60 percent, indicating QA-QC within acceptable limits, are highlighted in gray]
Site Taxonomic groupSpring
similarity (percent)
Summersimilarity (percent)
Fall similarity (percent)
Averagesimilarity (percent)
Sheboygan River Zooplankton with nauplii 74.96 80.93 85.97 80.62Zooplankton without nauplii 73.20 80.33 86.14 79.89Diatoms 51.32 28.59 48.67 42.86Soft algae 89.89 67.78 70.55 76.07Algae (combined) 67.19 45.91 53.54 55.55Benthos 79.52 79.84 77.30 78.89
Manitowoc River Zooplankton with nauplii 79.63 88.34 81.82 83.26Zooplankton without nauplii 78.06 88.63 81.82 82.84Diatoms 54.00 0.00 25.20 26.40Soft algae 59.83 63.31 71.00 64.71Algae (combined) 55.49 35.04 43.35 44.63Benthos 87.73 82.84 80.22 83.60

References Cited 29
References Cited
American Public Health Association, American Water Works Association, and Water Environment Federation, 2006, 2540 E. Fixed and Volatile Solids Ignited at 550°C, in Eaton, A.D., Rice, E.W., and Baird, R.B., eds., Standard Methods for the Examination of Water and Wastewater (20th ed.).
Ball, J.R., Harris, V.A., and Patterson, D.J., 1985, Lower Fox River-DePere to Green Bay Water Quality Standards Review: Wisconsin Department of Natural Resources, Bureau of Water Resources Management, Bureau of Fish Management [variously paginated].
Clarke, K.R., and Gorley, R.N., 2006, PRIMER v6: Users manual/tutorial: Plymouth, United Kingdom, Primer-E Ltd.
Gannon, J.E., and Stemberger, R.S., 1978, Zooplankton (espe-cially crustaceans and rotifers) as indicators of water qual-ity: Transactions of the American Microscopical Society, v. 97, no. 1, p. 16–35.
Grapentine, L.C., 2009, Determining degradation and restora-tion of benthic conditions for Great Lakes Areas of Con-cern: Journal of Great Lakes Research, v. 35, p. 36–44.
Holland, R.E., 1968, Correlation of Melosira species with tro-phic conditions in Lake Michigan: Limnology and Ocean-ography, v. 13, no. 3, p. 555–557.
Homer, C., Huang, C., Yang, L., Wylie, B., and Coan, M., 2004, Development of a 2001 national land cover database for the United States: Photogrammetric Engineering and Remote Sensing, v. 70, no. 7, p. 829–840.
Integrated Paper Services Inc., 2000, A macrointertebrate study of the depositional “soft” substrates of the Lower Fox River, Wisconsin–1999: Integrated Paper Services, Inc. Monitoring Study Series Report No. Four.
International Joint Commission United States and Canada, 1987, Protocol amending the 1978 agreement between the United States of America and Canada on Great Lakes water quality as amended on October 16, 1983, p. 75.
Karner, D., 2005, ESS BIO METHOD 2035: Phytoplankton identification and enumeration: Wisconsin State Laboratory of Hygiene.
Kelly, M.G., 2001, Use of similarity measures for quality control of benthic diatom samples: Water Research, v. 35, no. 11, p. 2784–2788.
Kennedy-Parker, D., 2011, ESS INO METHOD 151.1: Chlorophyll a, fluorescence: Wisconsin State Laboratory of Hygiene.
Reynoldson, T.B., 1987, Interactions between sediment con-taminants and benthic organisms: Hydrobiologia, v. 149, p. 53–66.
U.S. Environmental Protection Agency, 1994, Assessment of benthic invertebrate community structure, chap. 7 of Assess-ment and Remediation of Contaminated Sediments (ARCS) Program—Assessment guidance document: Chicago, Great Lakes National Program Office-U.S. Environmental Protection Agency.
U.S. Environmental Protection Agency, 2010a, Standard operating procedure for benthic invertebrate field sam-pling (LG406), in Sampling and analytical procedures for GLNPO’s open lake water quality survey of the Great Lakes: Chicago, Great Lakes National Program Office-U.S. Environmental Protection Agency, Report EPA 905–R–05–001, accessed January 19, 2011, at http://www.epa.gov/greatlakes/monitoring/sop/.
U.S. Environmental Protection Agency, 2010b, Standard operating procedure for benthic invertebrate laboratory analysis (LG407), in Sampling and analytical procedures for GLNPO’s open lake water quality survey of the Great Lakes: Chicago, Great Lakes National Program Office-U.S. Environmental Protection Agency, Report EPA 905–R–05–001, accessed January 19, 2011, http://www.epa.gov/greatlakes/monitoring/sop/.
U.S. Environmental Protection Agency, 2010c, Standard operating procedure for phytoplankton snalysis (LG401), in Sampling and analytical procedures for GLNPO’s open lake water quality survey of the Great Lakes: Chicago, Great Lakes National Program Office-U.S. Environmental Protec-tion Agency, Report EPA 905–R–05–001, accessed January 19, 2011, http://www.epa.gov/greatlakes/monitoring/sop/.
U.S. Environmental Protection Agency, 2010d, Standard oper-ating procedure for phytoplankton sample collection and preservation field procedures (LG400), in Sampling and analytical procedures for GLNPO’s open lake water quality survey of the Great Lakes: Chicago, Great Lakes National Program Office-U.S. Environmental Protection Agency, Report EPA 905–R–05–001, accessed January 19, 2011, http://www.epa.gov/greatlakes/monitoring/sop/.
U.S. Environmental Protection Agency, 2010e, Standard Operating Procedure for Zooplankton Analysis (LG403), in Sampling and analytical procedures for GLNPO’s open lake water quality survey of the Great Lakes: Chicago, Great Lakes National Program Office-U.S. Environmental Protec-tion Agency, Report EPA 905–R–05–001, accessed January 19, 2011, http://www.epa.gov/greatlakes/monitoring/sop/.

30 Benthos and Plankton Community Data for Selected Rivers and Harbors along Wisconsin’s Lake Michigan Shoreline, 2012
U.S. Environmental Protection Agency, 2010f, Standard operating procedure for zooplankton sample collection and preservation and secchi depth measurement field procedures (LG402), in Sampling and analytical proce-dures for GLNPO’s open lake water quality survey of the Great Lakes: Chicago, IL, Great Lakes National Program Office-U.S. Environmental Protection Agency, Report EPA 905–R–05–001, accessed January 19, 2011, http://www.epa.gov/greatlakes/monitoring/sop/.
U.S. Environmental Protection Agency, 2013a, Great Lakes Areas of Concern—Lower Green Bay and Fox River: accessed November 5, 2013, at: http://www.epa.gov/grtlakes/aoc/greenbay/index.html.
U.S. Environmental Protection Agency, 2013b, Great Lakes Areas of Concern—Menominee River: accessed November 5, 2013, at http://www.epa.gov/grtlakes/aoc/menominee/index.html.
U.S. Environmental Protection Agency, 2013c, Great Lakes Areas of Concern—Milwaukee Estuary: accessed Novem-ber 5, 2013, at http://www.epa.gov/grtlakes/aoc/milwaukee/index.html.
U.S. Environmental Protection Agency, 2013d, Great Lakes Areas of Concern--Sheboygan River: accessed November 5, 2013, at http://www.epa.gov/grtlakes/aoc/sheboygan/index.html.
U.S. Geological Survey, 1989, Solids–volatile-on-ignition–total-in-bottom-material–gravimetric, in Fishman, M.J., and Friedman, L.C., eds., Methods for determination of inorganic substances in water and fluvial sediments: U.S. Geological Survey Techniques of Water-Resource Investiga-tions book 5, chap. A1, p. 451.
U.S. Policy Committee, 2001, Restoring United States Areas of Concern: Delisting principles and guidelines: p. 29.
Uvass, B., and Baker, S., 2011, Stage 2 remedial action plan for the Lower Menominee River Area of Concern: Wiscon-sin Department of Natural Resources, Michigan Depart-ment of Environmental Quality.
Weigel, B.M., and Dimick, J.J., 2011, Development, valida-tion, and application of a macroinvertebrate-based Index of Biotic Integrity for nonwadeable rives of Wisconsin: Journal of the North American Benthological Society, v. 30, no. 3, p. 665–679.
Wentworth, C.K., 1922, A scale of grade and class terms for clastic sediments: Journal of Geology, v. 30, p. 377–392.
Wisconsin Department of Natural Resources, 1994, Mil-waukee Estuary Remedial Action Plan—Progress through January 1994: Madison, Wisconsin Department of Natural Resources, [variously paged].
Wisconsin Department of Natural Resources, 1995, Sheboygan River Remedial Action Plan: Madison, Wiscon-sin Department of Natural Resources, p. 271.
Wisconsin Department of Natural Resources, 2009, Lower Green Bay and Fox River Area of Concern Beneficial Use Impairment Delisting Targets: Madison, Wisconsin Depart-ment of Natural Resources, p. 29.
Wisconsin Department of Natural Resources, 2011, Draft stage 2 Remedial Action Plan for the Milwaukee Estuary Area of Concern: Wisconsin Department of Natural Resources-Office of the Great Lakes p. 80.
Wisconsin Department of Natural Resources, 2012a, Reme-dial Action Plan Update for the Lower Green Bay and Fox River Area of Concern: Madison, Wisconsin Department of Natural Resources, p. 72.
Wisconsin Department of Natural Resources, 2012b, Reme-dial Action Plan Update for the Sheboygan River Area of Concern: Madison, Wisconsin Department of Natural Resources, p. 72.
Wisconsin Department of Natural Resources, and Lakeshore Basin Partnership Team, 2001a, Appendix V: Twin Door Kewaunee Basin Watershed narratives and tables, the state of the Lakeshore Basin: Madison, Wisconsin Department of Natural Resources, p. 59.
Wisconsin Department of Natural Resources, and Lakeshore Basin Partnership Team, 2001b, The state of the Lake-shore Basin: Madison, Wisconsin Department of Natural Resources Publ WT 667 2000, p. 45.
Wisconsin Department of Natural Resources, and Milwaukee River Basin Land and Water Partners Team, 2001, The state of the Milwaukee River Basin: Milwaukee, Wiscon-sin Department of Natural Resources Publ WT 704 2001, p. 108.
Yang, L., Huang, C., Homer, C.G., Wylie, B.K., and Coan, M.J., 2002, An approach for mapping large-area impervi-ous surfaces—Synergistic use of Landsat 7 ETM+ and high spatial resolution imagery: Canadian Journal of Remote Sensing, v. 29, no. 2, p. 230–240.

Appendixes 1–8
The data files listed below are included as part of U.S. Geological Survey (USGS) Data Series 824 and are available for download at http://dx.doi.org/10.313/ds824. The data were collected in 2012 as part of the USGS benthic invertebrate and plankton community data for selected rivers and harbors along Wisconsin’s Lake Michigan shoreline. See the report text for details about the study and for information on collection and processing of all data. The data files are available in Microsoft© Excel (.xlsx) and formatted to properly display the data.
1. Water-quality measurements made in situ with a using a Hydrolab Quanta™ Sonde, collected as part of the U.S. Geological Survey benthos and plankton community data for selected rivers and harbors along Wisconsin’s Lake Michigan shoreline, 2012.
2. Sediment size fractions and volatile-on-ignition data for composite benthic grabs made with a Ponar® dredge, collected as part of the U.S. Geological Survey benthos and plankton community data for selected rivers and harbors along Wisconsin’s Lake Michigan shoreline, 2012.
3. Invertebrate taxonomic data for composite benthic grabs made with a Ponar® dredge, collected as part of the U.S. Geological Survey benthos and plankton community data for selected rivers and harbors along Wisconsin’s Lake Michigan shoreline, 2012.
4. Invertebrate taxonomic data for composited Hester-Dendy artificial substrate sam-plers, collected as part of the U.S. Geological Survey benthos and plankton community data for selected rivers and harbors along Wisconsin’s Lake Michigan shoreline, 2012.
5. Zooplankton taxonomic data for composited plankton tows, collected as part of the U.S. Geological Survey benthos and plankton community data for selected rivers and harbors along Wisconsin’s Lake Michigan shoreline, 2012. (*unavailable)
6. Soft algae taxonomic data for composited water samples from a Kemmerer™ vertical water sampler, collected as part of the U.S. Geological Survey benthos and plankton community data for selected rivers and harbors along Wisconsin’s Lake Michigan shoreline, 2012.
7. Diatom taxonomic data for composited water samples from a Kemmerer™ vertical water sampler, collected as part of the U.S. Geological Survey benthos and plankton community data for selected rivers and harbors along Wisconsin’s Lake Michigan shoreline, 2012.
8. Chlorophyll a, total and volatile suspended solids for composited water samples from a Kemmerer™ vertical water sampler, collected as part of the U.S. Geological Survey benthos and plankton community data for selected rivers and harbors along Wiscon-sin’s Lake Michigan shoreline, 2012.
*Note: Appendix 5 is temporarily unavailable while it is being updated.


Scudder Eikenberry and others—B
enthos and Plankton Comm
unity Data for Selected Rivers and H
arbors along Wisconsin’s Lake M
ichigan Shoreline, 2012—D
ata Series 824
ISSN 2327-638X (online)http://dx.doi.org/10.3133/ds824