bente halvorsen and tiril willumsen - ssb.no · discussion papers no. 334, november 2002 statistics...
TRANSCRIPT

Discussion Papers No. 334, November 2002 Statistics Norway, Research Department
Bente Halvorsen and Tiril Willumsen
Willingness to Pay for Dental Fear Treatment Is Supplying Fear Treatment Socially Beneficial?
Abstract: The aim of this paper is to discuss the social desirability of a treatment program for patients with dental fear. The program consisted of three different fear treatments, cognitive therapy, applied relaxation or nitrous oxide sedation, as well as dental treatment. To evaluate the effects of uncertainty on the patients' benefits from the program, we elicit their willingness to pay both before and after receiving treatment, since we expected patients to be uncertain about the outcome of the fear treatment. We find that the social desirability of the treatment is very sensitive towards uncertainty. While only 24 percent of the patients were willing to pay the actual cost of the treatment before attending, 71 percent were willing to pay afterwards. This implies that many patients who would benefit from the treatment ex post are not willing to pay the cost of the treatment ex ante, and will thus not receive any treatment unless it is subsidised.
Keywords: Dental fear treatment, willingness to pay.
JEL classification: I11, D61.
Address: Bente Halvorsen, Statistics Norway, Research Department, P.O. Box 8131 Dep., N-0033 Oslo, Norway E-mail: [email protected]
Tiril Willumsen, Department of Pediatiric Dentistry and Behaviour, University of Oslo, P.O. Box 1109, Blindern, N-0317 Oslo, Norway. E-mail: [email protected]

Discussion Papers comprise research papers intended for international journals or books. As a preprint a Discussion Paper can be longer and more elaborate than a standard journal article by in-cluding intermediate calculation and background material etc.
Abstracts with downloadable PDF files of Discussion Papers are available on the Internet: http://www.ssb.no For printed Discussion Papers contact: Statistics Norway Sales- and subscription service N-2225 Kongsvinger Telephone: +47 62 88 55 00 Telefax: +47 62 88 55 95 E-mail: [email protected]

3
1. Introduction
Dental phobia, or extreme dental fear, is a condition that affects approximately 5% of the population
(Hakeberg et al. 1993, Vassend, 1993). Patients with extreme dental fear are characterised by intense
physiological arousal and feelings of fear before and during dental treatment. Many of them avoid
dental treatment completely. Scott et al. (1998) reports that the most common reasons for not seeing a
dentist were the cost of the treatment and fear of dentists. Dental fear has been shown to be a major
determinant of both dental health and mental well-being (Kaufmann et al 1992, Hakeberg et al. 1993).
Aartmann (1997) finds that patients with dental fear have a higher score on general psychological
distress tests than the general population.
There are numerous reports on dental fear treatment showing significant reductions in dental fear
levels (see e.g. Ning & Lidell 1990, Liddell et al. 1994, Horowitz 1992, Krochak and Rubin 1993,
Carpenter et al. 1994, Kent 1985, 1987, 1990, Kent and Gibbons 1987, Smith et al. 1987, de Jongh
1995, van der Bijl 1992, Ter Horst and De Wit 1993). Even in long-term follow-ups from 2-10 years
the results are favourable. Positive treatment outcome of dental fear treatments is thus well
documented. These studies focus on treatment outcomes only. To our knowledge, no treatment study
has focused on the social desirability of supplying dental fear treatment to the public.
The purpose of this study is to examine if supplying fear treatment in addition to dental treatment to
patients with dental fear is socially desirable. In order to investigate the benefits of fear treatment
programs to dental fear patients, an experiment was conducted at the Institute for Clinical Odontology,
Dental Faculty at the University of Oslo, testing three different fear treatments: Nitrous oxide sedation,
cognitive therapy and applied relaxation. To investigate the social desirability of supplying these fear

4
treatments, the patients were asked to state their maximum willingness to pay (WTP) for the received
treatment. These WTP statements were then compared with the actual cost of the treatment.
One major problem in treating dental fear patients is the lack of motivation. Many have avoided dental
treatment for years and the thought of managing a regular dental treatment situation without urgent
treatment needs seems almost impossible. Thus, these patients are often very sensitive and unsure
about the benefits from dental and fear treatments. This dental aversion will most probably result in a
low WTP, in particular before uncertainty about the benefits from the fear treatment is revealed. If the
aversion is large, it may seriously influence the profitability of supplying the treatment, as patients
who benefit from the treatment ex post may not purchase it without knowing the outcome. To
investigate the effects of uncertainty, we asked the patients' to state their maximum WTP both before
and after they received the treatment.
The reminder of this paper is organised as follows: In section 2 we describe in further detail the design
of the experiment and the valuation survey. In section 3 we outline the theoretical foundation for the
analyses presented in this paper, modelling the patients' decision problem and discussing how to
evaluate profitability of dental fear treatments. In section 4 we present the results and conclusions
from our analyses, and in section 5, some concluding remarks are made.
2. The experiment
From February 1995 to June 1996, patients who contacted the Institute for Clinical Odontology,
Dental Faculty at the University of Oslo with dental fear problems were invited to attend a treatment
program receiving dental fear treatment. Three patients were referred from dentists and two from other
health workers, but the majority of patients made contact at their own initiative or through relatives or
friends. In total, 65 patients met the inclusion criteria and were assigned to a 10-session treatment

5
programme with random allocation to three contrasting treatment principles: nitrous oxide sedation,
cognitive therapy and applied relaxation. Half the patients had not been to the dentist the last 10 years
or more. The average number of years since the last dental visit was 12 years, with a maximum of 30
years for one patient and a minimum of one year for five patients. The need for dental treatment did
also vary considerably as one patient did not have to treat any surfaces, whereas the maximum number
of treated surfaces was 53. The patients paid a small fee for participating (NOK 1000) in order to
prevent dropout. Only three patients dropped out of treatment. At the end of the treatment, the
patients’ level of dental fear and general psychological distress were highly significantly reduced.
During the experiment, the patients were asked to answer questionnaires concerning dental fear, a
general distress survey, an assessment of personality three surveys three times during the experiment:
At enrolment, before attending the treatment and after receiving the treatment. A separate valuation
survey was conducted approximately one month after the treatment was finished in order to measure
the patients' benefits from the treatment. The aim of this questionnaire was to elicit the patients' WTP
for the treatment and their expectation prior to the experiment. The respondents were, among other
things, asked an open-ended contingent valuation question (see e.g. Mitchell and Carson 1989 for
more information) concerning their maximum WTP for the treatment. Before the WTP question, the
respondents were informed that they were to pay the actual cost of the treatment. Then they were
asked for the highest cost they were willing to cover in order to receive the treatment. This was done
to avoid respondents answering strategically to the WTP questions, as some patients expressed
concerns that their dentist would profit from supplying the fear treatment. In order to analyse the effect
on the social desirability of uncertainty, the patients were also asked to state their maximum WTP for
the treatment prior to the experiment.
To evaluate the net benefits from the fear treatment, we need to decompose the total WTP for the
experiment into WTP for dental and fear treatment separately. This was done by asking the patients to

6
distribute 100 points between the two motivations according to their importance for the total WTP. We
used a simultaneous approach to decompose the total WTP in order to avoid ordering effects. Ordering
effects occur when the sequence of valuation questions affects the WTP estimates when a set of goods
is valued in a sequence. (See e.g. Halvorsen, 1996 for more information)
3. Theoretical framework
In this section, we model the relation between the patients' expressed WTP and the benefits they
receive from the treatment, both dental and fear treatment, before and after uncertainty is revealed.
Then, we discuss the econometric specification of the model and how to use the data to obtain an
estimate of the WTP-function. Finally, we discuss how to use this information to evaluate the
desirability of the project, both for the consumers, the suppliers and for the society.
3.1. Benefits from the treatment
We use a two period model, before and after the experiment, for the patient's benefit from the
treatment. We assume that a patient gains utility from the consumption of goods conditional on his
dental and mental health, represented by the utility function:
( )tP
tD
tt HHUU ,;Xr
= (1)
where tXr
is a vector of private goods consumed in period t (t=1, 2), tDH is the patient's dental health
at period t and tPH is the patient's mental health at period t. The utility is assumed to increase with
diminishing returns in both the consumption of private goods and the health capital in all periods.
The patient has the ability to improve both his dental and his mental health capital in the second period
by investing in dental and fear treatment in the first period. We denote the consumption of dental

7
treatment in the first period 1DX and the consumption of fear treatment in period 1 1
PX . The health
capital in the second period is assumed to be function of the initial health capital and the investments
in health in the first period ( ( )112 , jjjj XHHH = , j = D, P). The investments in both dental and mental
health are given from the experimental design, represented by the type of fear treatment offered and
the number of treated surfaces. Thus, the quantity of the health investment is exogenous to the patient
after deciding whether to participate or not.
We assume that the patient's motivation for participating is to reduce his anxiety level and to enable
him to go to an ordinary dentist in the future. The patient is assumed to be able to go to a normal
dentist if his mental health exceeds a critical limit ( PH~ ). Here we assume that none of the patients
attending this experiment did have sufficient mental capital to go to a normal dentist in the first
period.1 Furthermore, we assume that the patient does not know exactly how much his investment in
fear treatment in the first period will affect his mental health capital in the second period. His
investment will, however, increase his probability of being able to go to the dentist in the second
period, given by ( )PP HHP ~2 ≥=π . The probability of not being able to go to the dentist in the second
period, evaluated in the first period, is thus π−1 . In the second period, after uncertainty is revealed,
the patient will either be able to go to the dentist ( PPwP HHH ~if 2 ≥ ) or not ( PP
sP HHH ~if 2 < ). The
expected mental health capital in the second period, evaluated in the first period, is thus defined as:
( ) ( ) sP
wPP HHHE ππ −+= 12 .2
Since the patient is not certain how his investment in health will affect him when deciding on
participating in the experiment in the first period, he is also uncertain about his benefits from the fear
1 The participants were, however, sufficiently motivated to volunteer for the experiment. That is, their mental health capital exceeded a lower limit deciding whether or not to attend such an experiment set in a University environment. 2 Here, we assume all factors affecting the patient's dental fear, other than participating in the experiment, to be constant.

8
treatment. The expected utility in the second period, as evaluated in the first period, is thus the
weighted utility of the patient being able to go to the dentist and not, given by:
( ) ( ) ( )sPD
wPD HHXUHHXUUE ,;)1(,; 22222
rrππ −+= (2)
To measure the patient's benefits from investments in dental and mental health, we apply the
compensating variation (CV), which is defined as the difference in expenditures necessary to be
indifferent between receiving the treatment and not.3 The expenditure function (C) is defined as the
minimum expenditure necessary to achieve a given utility level (U ) discounted over the two periods,
for a given set of prices:
( )( ) ( ) ( )[ ]{ }UHHXUHHXUHHXUts
XpXpHHppC
sPD
wPDPD
I
iii
I
iii
XXDPXX
ii
=−++
+≡ ∑∑==
,;)1(,;,;..
min,,;,
2222111
1
22
1
11
,
21
21
21
rrrππδ
π (3)
where tXp is a vector of all prices in period t, t
ip is the price on good i in period t, tiX is the
consumption of good i in period t and δ is the discount rate (t = 1, 2 and i = 1, 2, ..., tI ).
Since the outcome of the treatment is uncertain, the CV measure for the treatment, evaluated in the
first period, will also be uncertain for several reasons. If the patient does not receive the treatment, he
is assumed to know the state of his mental health capital in the second period, but assumed to be
uncertain of his dental health capital since he is not able to go to an ordinary dentist. If the patient
attends the experiment, we assume that he does not know for certain if he can go to a normal dentist in
the second period, but he will know the state of his dental health capital. That is, we assume all
damaged surfaces to be fixed in the experiment. Evaluated in the first period, we denote the expected

9
dental health capital and the mental health capital in the second period without any treatment
( )02DHE and
02PH and the dental health capital and expected mental health capital with treatment
12DH and ( )12
PHE . The CV for the experiment evaluated in the first period is given by:
( ) ( )
−
= UHEHHHppCUHHHEHppCCV PPDDXXPPDDXX ,,,,;,,,,,;,
12112121021021211 (4)
This is the patient's maximum WTP for the total treatment (both dental and fear treatment) evaluated
in period 1. In the second period, there is no uncertainty about the effect of the fear treatment if the
respondent has participated. The patient's CV in the second period for participating in the experiment
is thus given by:
( )
−
= UHHHHppCUHHHEHppCCV PPDDXXPPDDXX ,,,,;,,,,,;,
12112121021021212 (5)
Whether the maximum WTP for the total treatment in the first period (CV1) exceeds the maximum
WTP in the second period (CV2) depends on the patient's expectations about the benefits from the fear
treatment and his attitude towards dental treatment. Since all these patients have dental fear, it is
reasonable to believe that they are reluctant to attend dental treatment programs. If a patient with
dental fear and risk aversion has rational expectations, his CV for the treatment in the second period
after uncertainty is revealed will exceed his CV in the first period. This is because uncertainty about
the outcome of the treatment and dental fear reduces his expected utility and thus his WTP in the first
period. If the patient exaggerates the positive effects of the fear treatment and the negative state of his
dental health, it will reduce the effects of the dental fear and risk aversion on his WTP in the first
period, making the difference smaller.
3 See Varian (1992) or Mitchell and Carson (1989) for a discussion of the compensating variation.

10
3.2. Econometric specification
We approximate the patient's expected WTP in the first period (equation 4) by a linear function of the
patient's annual gross income (Y), the patient's dental and mental health capital in period one
( 11 and PD HH ) and a stochastic error term (ω ). We also assume that the patient's stated WTP before
the treatment reflects his CV in the first period, and that the stochastic error term (ω ) is normally
distributed with a zero expectation and a heteroscedastic variance.4 The expected WTP-function in the
first period before the treatment is given by:
ωββββ ++++= 14
1320
1PD HHYWTP (6)
As a measure of the patient's mental capital, we apply the results from the Symptom Checklist 90
Revised questionnaire, which is used to assess emotional distress. It consists of 90 items; each rated on
a five-point scale, where 0 is not relevant and 4 is very important (Derogatis, 1983). The patients
mean score of all 90 items is called the global severity index, which is the variable used in the
estimations as a proxy for the patient's mental health capital. The state of the patient's dental health
was recorded on the first session as the number of decayed, missing and filled surfaces in all 28
permanent teeth. Both these measures were recorded at enrolment to the experiment and before and
after the treatment took place.
Furthermore, we assume the WTP-functions for the total, the fear and the dental treatment in the
second period after all uncertainty is revealed (see equation 5) is given by:
jP
jD
jP
jD
jjjjj BBHHYCTWTP εααααααα +++∆+∆+++= 654321102 (7)

11
where 2jWTP is the patient's stated WTP for good j (j= total, dental and fear treatment) in the second
period, CT is a dummy for receiving cognitive therapy, Y is the patient's annual gross income and
PD HH ∆∆ and are the patient's change in health capital from the first to the second period. The
number of surfaces treated by the dentist measure the change in dental capital, and change in mental
capital is measured as the difference in the global severity index before and after the treatment. We
also include discrete variables, which measure the perceived benefits from both dental and fear
treatment ( PD BB , ). These variables equal 1 if the patient reported the benefits from the treatment to
be low, 2 if the benefits are medium and 3 if the patient reports the benefits from the treatment to be
high. Finally we include a stochastic error term ( jε ), which we assume is normally distributed with a
zero expectation and a heteroscedastic variance.
3.3. Evaluating the social desirability
One major concern of this experiment was to evaluate whether supplying fear treatment was socially
desirable. Since investments in health capital must be considered a private good, a competitive market
insures an efficient allocation when all externalities are reflected by the WTP and/or production cost. 5
It is reasonable to believe that the patients include all positive effects to themselves of increased dental
and mental health in their expressed WTP for the treatment. There might, however, be some positive
external effects to other family members, friends, the labour marked etc. not captured in the WTP
statements.
The socially optimal provision of the service is where the socially weighted marginal utility and cost
of providing the good are equal for all consumers and producers. Since an investment in health capital
is a private good, we may evaluate social desirability by comparing the socially weighted WTP and
4 See e.g. Greene (1995) or Battatjaraya and Johnson (1977) for more information. 5 See Myles (1995) for a definition of private and public goods.

12
the cost of supplying the treatment for the marginal consumer. The social welfare weights equal the
marginal utility of income times the marginal welfare weights (see e.g. Johansson 1993, chapter 7).
Since the social welfare weights consist of two unobservable components, it is not possible to evaluate
whether the project is socially optimal allocated, regardless of the choice of welfare function. Thus,
when discussing the social desirability of providing the good, we mainly focus an efficient allocation
of the good, not the optimal distribution between different patients as measured by the social welfare
function. We will, however, indicate in which direction including social welfare weights will affect the
conclusions.
4. The results
The treatment outcome of the patients who finished the experiment was very good. All patients were
able to receive regular dental treatment within the experiment. On average, the patients had filled 13
surfaces of dental fillings during their exposure part of the treatment programme. Their scores on
dental fear assessment and the general psychological distress test dropped significantly during and
after the treatment (see Willumsen, 1999).
4.1. The probability of being able to go to a dentist
The patients' motivation for attending the experiment was both to fix their teeth and to increase their
mental capital. It is thus interesting to compare the different fear treatments' effect on the patients'
ability to go to an ordinary dentist appointment. In table 1, we present the share of patients for the total
sample and by treatment groups, who reported that they would be able to go to a dentist by themselves
after completing the treatment.

13
Table 1. Proportion of the patients expecting to be able to return to an ordinary dentist ap-
pointment after the treatment, for the total sample and by treatment groups. T-value
in parentheses.
Total sample Nitrous oxide
sedation
Cognitive
therapy
Applied
relaxation
Proportion of sample who expect to
be able to go to an ordinary dentist
after the treatment
0.69
0.46
0.86
0.77
(T-value) (1.47) (0.90) (2.49) (1.83)
We see from the table that 69 percent of the patients expected to be able to go to a dentist after the
treatment, but the results in the different treatment groups differ considerably. Nitrous sedation has a
much lower success rate than treatments focusing on the patient's ability to handle the situation. The
fear treatments with a significant effect on the patient's probability of being able to go to the dentist
afterwards are cognitive therapy and applied relaxation training.
4.2. Willingness to pay for dental and fear treatment
In table 2, we present the mean WTP responses for the total treatment, dental and fear treatment
separately, and the expected total WTP before the treatment started. We also present the T-values
under the null hypothesis of a zero WTP for the treatment. This information is given separately for
each of the three treatment groups (nitrous oxide sedation, cognitive therapy and applied relaxation)
and for all patients combined.
We see from table 2 that the total WTP for both dental and fear treatment is higher after uncertainty is
revealed than the expected WTP before the treatment. This is true for all treatment groups and for all
patients combined. The expected WTP amount to approximately 50 percent of the WTP after
uncertainty is revealed. The relative share of the maximum WTP before and after the treatment is
highest for the group receiving cognitive therapy (56.5 percent) and lowest for the group receiving

14
nitrous sedation (46.4 percent). This is probably because uncertainty concerning the benefits from the
fear treatment is likely to be larger for treatment forms applying psychological techniques than
sedatives. Due to a lack of degrees of freedom, this difference is not significant for any of the groups.
Table 2. Maximum willingness-to-pay (WTP) before and after receiving the treatment, WTP for
fear treatment and WTP for dental treatment. By treatment groups and for all pa-
tients combined. T-values in parentheses. NOK.
Nitrous oxide
sedation
Cognitive therapy Applied
relaxation
All patients
Mean (T-value) Mean (T-value) Mean (T-value) Mean (T-value)
WTP before treatment 2 706 (0.964) 3 618 (0.959) 2 890 (1.128) 3 061 (1.010)
WTP after treatment 5 833 (2.045) 6 405 (1.691) 5 591 (1.495) 5 938 (1.720)
WTP fear treatment 2 680 (1.531) 3 126 (1.545) 2 987 (1.525) 2 931 (1.548)
WTP dental treatment 2 991 (1.625) 3 279 (1.423) 2 870 (1.221) 3 047 (1.418)
4.3. Determinants of willingness to pay
Looking at the decomposition of the maximum WTP into WTP for dental and fear treatment, it seems
that, on average, the patients have divided their WTP equally between the two treatments. In order to
reveal if there are any systematic differences, we estimate a WTP-function for both the maximum
WTP before and after receiving the treatment and the WTP for the dental and fear treatment
separately.
4.3.1. Expected WTP
We estimate the expected WTP-function in equation (6) applying ordinary least squares (OLS)
corrected for heteroscedasticity. The results from this estimation are presented in table 3. In the first
column, the explanatory variables are listed. In the second column, we present the estimated
coefficient. In the third column, we present the T-values and in the last column we present the P-
values, that is, the probability of falsely rejecting the hypothesis of no effect.

15
Table 3. Estimated determinants of expected WTP (in NOK) before the treatment.
Coefficient t-value p-value
Constant 194 0.2933 0.7709
Income (in 1000 NOK) 9.2 7.6476 0.0000
Dental health capital in period one, holes and tooth decay 18 1.4366 0.1591
Mental health capital in period one, psychological strain 509 0.7977 0.4300
R2 0.26 R2-adj 0.20
Wee see from table 3 that the only variable with a significant influence on the expected WTP is
household income. If household income increase by 1 000 NOK (approximately $111 US), the
expected WTP for the treatment increases by 9 NOK (approximately $1 US). If we calculate the
income elasticity, that is the estimated coefficient divided by the budget share, we find that a one-
percent increase in income gives a 0.5 percent increase in expected WTP for the treatment. The
treatment is thus considered to be a necessity good by the patients before the treatment is carried out.
We also see from table 3 that the expected WTP increases with increased mental stress and the
damage to the teeth, even though these effects are not significant on an acceptable level (p-value <
0.1). One reason for the lack of significance and explanation power is the small sample. Out of the 62
patients responding to the questionnaire, only 54 answered the expected WTP question and only 41 of
these had observations on all explanatory variables.
4.3.2. WTP after the treatment
We now turn to the estimation of the total WTP, and the WTP for the dental and phobia treatment after
the experiment was over. The results from this analysis are reported in the table 4. First, we look at the
WTP for the total treatment, presented in the first column of table 4.
Of the 64 respondents who answered the WTP question, 52 had observations on all explanatory
variables. As we see from table 4, several variables have a significant impact on the WTP after the
treatment was concluded in spite of the low degrees of freedom. First, income still influences the WTP

16
significantly, where a 1 000 NOK increase in income results in an 8.6 NOK increase in WTP. Since
the mean WTP after all uncertainty is revealed exceeds the expected WTP by approximately 50
percent (see table 2), the estimated income elasticity is halved, to 0.25. I.e., a one-percent increase in
income results in a 0.25 percent increase in the stated WTP. Thus, investments in dental and mental
capital are less income elastic after the treatment than before the treatment. The stated WTP also
increases with the benefits from the dental treatment, with the number of treated surfaces, with
benefits from fear treatment and a reduction in the global severity index, although the last two effects
are not significant. Whether the patient received cognitive therapy as compared to nitrous oxide
sedation or applied relaxation do not have a significant effect on the stated WTP.
Table 4. Estimated determinants of the total WTP and the WTP for dental and mental treat-
ment (in NOK) after the experiment was concluded.
Total WTP WTP for
dental
treatment
WTP for fear
treatment
Constant 4290*** 815 3909***
Cognitive therapy 84 -164 426
Income (in 1000 NOK) 8.6*** 4.2*** 2.0
Benefits from dental treatment 1041** 871** 324
Benefits from fear treatment 513 -901** 1385***
Change in dental health capital, treated surfaces 165*** 91*** 76***
Change in mental health capital, reduction in strain 1651 1356* 210
R2 0.53 0.46 0.45
a) *** implies that the coefficient differ significantly from zero with a probability of falsely rejecting the zero hypothesis at less than 1 per-cent. ** implies that the coefficient differ significantly from zero with a probability of falsely rejecting the zero hypothesis at less than 5 percent. * implies that the coefficient differ significantly from zero with a probability of falsely rejecting the zero hypothesis at less than 10 percent.

17
In order to examine if there are any systematic differences in the factors determining the stated WTP
for the dental and fear treatments, we have estimated the model for the WTP for dental and fear
treatment separately. The results from these estimations are presented in the second and third column
of table 4. First, we look at the result from the WTP estimation on dental treatment. We see from the
table that most explanatory variables have a significant effect on the WTP for dental treatment. The
only exception is the coefficient for receiving cognitive therapy. First, looking at the income
sensitivity, the estimated income elasticity for the demand for dental treatment is 0.24. This is
approximately the same income elasticity as for the total WTP. Second, we see that patients with high
benefits from the dental treatment have a higher WTP for dental treatment than patients who reported
the benefits to be low. We also find that patients who reported high benefits from the fear treatment
have a lower WTP for dental treatment than patients who reported low benefits from the fear
treatment. This indicates that these patients have allocated a larger share of their total WTP to the fear
treatment than to the dental treatment. Third, we find that the WTP for dental treatment increases with
both the number of treated surfaces and the measured reduction in mental strain. That is, those patients
who have benefited most from the treatment, both with regards to the reduction in distress and work
done on their teeth, are willing to pay more for the dental care than other patients are. Finally, we see
that this model have a relative good explanatory power as almost 40 percent of the total variation in
WTP for dental treatment is explained by the estimation. The explanatory power of the model is,
however, less than for the estimation on the total WTP.
Second, we turn to the estimation results for the WTP for fear treatment, reported in the last column of
table 4. We see from the table that the level of significance is not as good as in the previous
estimations. Only the coefficients for reported benefits from the fear treatment and the number of
treated surfaces differ significantly from zero at a 10 present level. We also see that patients who
reported high benefits from the fear treatment have as substantially larger WTP for the fear treatment

18
than other patients do. As for the WTP for the dental treatment, this model explains almost 40 percent
of the total variation in the expressed WTP for the fear treatment.
4.4. Is the treatment socially beneficial?
In Norway, dental treatment for adults is privately financed. The Public Dental Service offers
treatment to children 0-18 years, all mentally handicapped, groups of institutionalised, chronically ill
and elderly patients. This treatment is offered free of charge or at reduced rates. Until 1995, fees were
regulated by a fixed fee schedule negotiated between the Dental Association and national authorities.
The fees for adult patients in the Public Dental Service Treatment are still regulated by these annual
negotiations. In 1996, the official price tariff had two levels, depending on what kind of treatment
performed: one high tariff at 604 NOK per hour (which is approximately US$67) and one low tariff at
497 NOK per hour (which is approximately US$55). The cost of nitrous oxide sedation was 224 NOK
per hour (which is approximately US$25).
In this paper, we assume that the public dental ward will supply the dental fear treatment. The market
for dental services in the public ward is not competitive because, among other things, the price is still
regulated by a set of recommended prices. If the official price tariffs do not clear the market, we will
experience either excess demand or supply in the treatment of dental fear. Furthermore, we do not
have information on the actual costs of producing various dental services in the public dental ward.
Thus, we have to assume that supplying dental services is profitable at the official tariffs and that the
tariff equals costs at the margin.
In figure 1, we have plotted the patients' maximum and expected WTP per hour for dental treatment,
by the rank in the WTP distribution. Here, we assume that the patients have the same distribution of
their expected WTP on dental and fear treatment as for their maximum WTP. The curve to the left of
the point 0.1 shows the expressed WTPs of the 10 percent of the patients with highest WTP per hour,
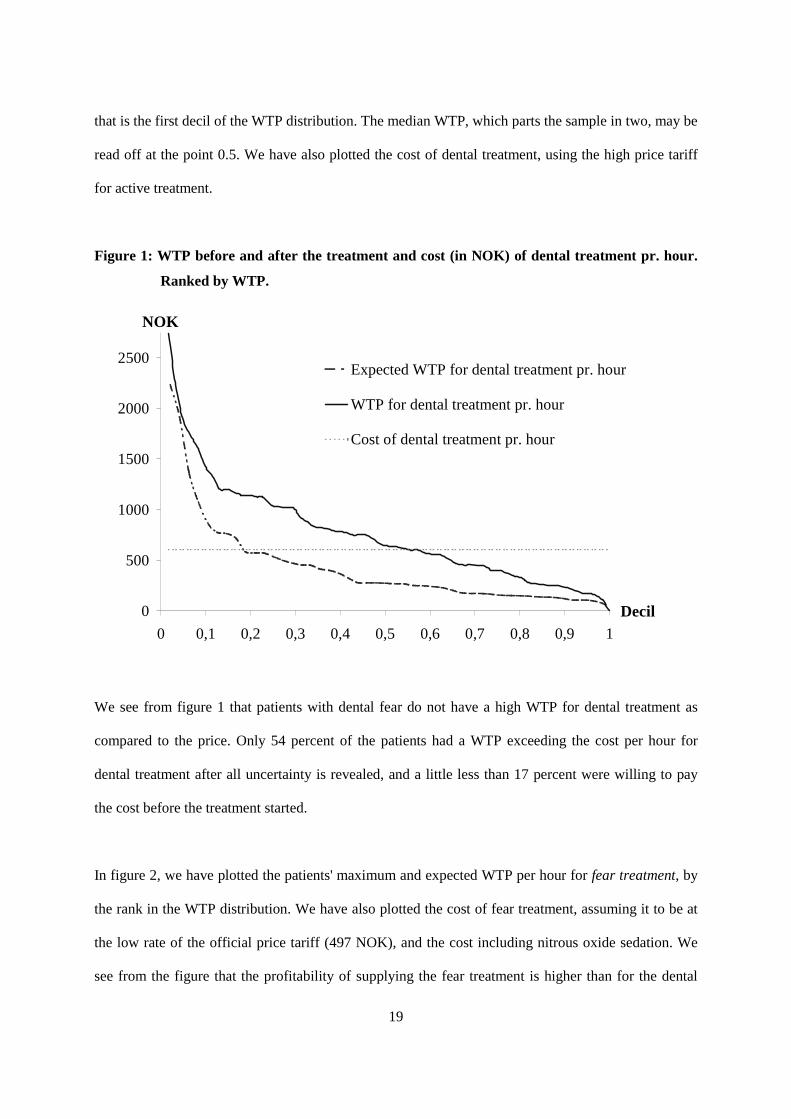
19
that is the first decil of the WTP distribution. The median WTP, which parts the sample in two, may be
read off at the point 0.5. We have also plotted the cost of dental treatment, using the high price tariff
for active treatment.
Figure 1: WTP before and after the treatment and cost (in NOK) of dental treatment pr. hour.
Ranked by WTP.
0
500
1000
1500
2000
2500
0 0,1 0,2 0,3 0,4 0,5 0,6 0,7 0,8 0,9 1
Decil
NOK
Expected WTP for dental treatment pr. hour
WTP for dental treatment pr. hour
Cost of dental treatment pr. hour
We see from figure 1 that patients with dental fear do not have a high WTP for dental treatment as
compared to the price. Only 54 percent of the patients had a WTP exceeding the cost per hour for
dental treatment after all uncertainty is revealed, and a little less than 17 percent were willing to pay
the cost before the treatment started.
In figure 2, we have plotted the patients' maximum and expected WTP per hour for fear treatment, by
the rank in the WTP distribution. We have also plotted the cost of fear treatment, assuming it to be at
the low rate of the official price tariff (497 NOK), and the cost including nitrous oxide sedation. We
see from the figure that the profitability of supplying the fear treatment is higher than for the dental

20
treatment, partly because the cost of providing the treatment is assumed to be lower. A little more than
70 percent of the patients had a WTP that exceeded the cost of providing one hour of fear treatment,
whereas 42 percent of the patients were willing to pay the cost before the treatment started. If we
include the cost of nitrous oxide sedation, the shares are reduced to 56 and 23 percent.
Figure 2: WTP before and after the treatment and cost (in NOK) of fear treatment (including
nitrous oxide sedation) pr. hour. Ranked by WTP.
0
500
1000
1500
2000
2500
3000
3500
0 0,1 0,2 0,3 0,4 0,5 0,6 0,7 0,8 0,9 1Decil
NOKExpected WTP for phobia treatment pr. hour
WTP for phobia treatment pr. hour
Cost of phobia treatment pr. hour
Cost of phobial treatment pr. hour includingnitrous oxide sedation
Based on this discussion, it seems that the social desirability per hour of supplying dental and fear
treatment differs considerably when supplied to patients with dental fear. We have also calculated
each patient's net benefit from the experiment in order to evaluate the social desirability of the total
treatment when differences in need for dental and fear treatment between patients are accounted for.
The net benefit is defined as the patient's maximum WTP for the total treatment net of the cost of his
individual treatment. The cost of the treatment was calculated based on the recorded time used for
different parts of treatment. The mean cost for the total treatment (both dental and fear treatment) was
NOK 4 344, which is approximately US$483.
21
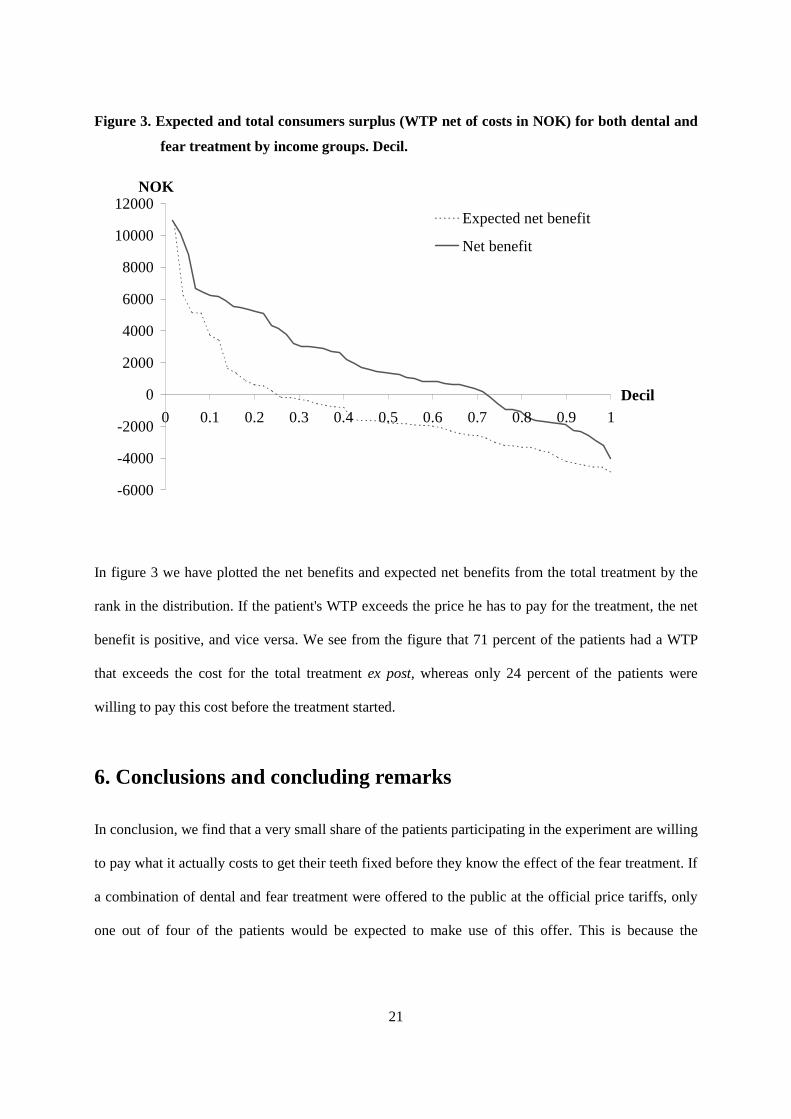
Figure 3. Expected and total consumers surplus (WTP net of costs in NOK) for both dental and
fear treatment by income groups. Decil.
-6000
-4000
-2000
0
2000
4000
6000
8000
10000
12000
0 0.1 0.2 0.3 0.4 0.5 0.6 0.7 0.8 0.9 1
Decil
NOK
Expected net benefit
Net benefit
In figure 3 we have plotted the net benefits and expected net benefits from the total treatment by the
rank in the distribution. If the patient's WTP exceeds the price he has to pay for the treatment, the net
benefit is positive, and vice versa. We see from the figure that 71 percent of the patients had a WTP
that exceeds the cost for the total treatment ex post, whereas only 24 percent of the patients were
willing to pay this cost before the treatment started.
6. Conclusions and concluding remarks
In conclusion, we find that a very small share of the patients participating in the experiment are willing
to pay what it actually costs to get their teeth fixed before they know the effect of the fear treatment. If
a combination of dental and fear treatment were offered to the public at the official price tariffs, only
one out of four of the patients would be expected to make use of this offer. This is because the

22
investment decisions are made in the first period under uncertainty. After the treatment, seven out of
ten of patients are willing to pay what the treatment costs.
Assuming that all externalities are included, it will not be economically efficient to supply more than
what the patients are willing to pay before the treatment has started, even if the number of patients
who are willing to pay the costs almost triples ex post. However, if we are concerned with the
distribution of well being in addition to an efficient allocation of resources, it might be optimal to
subsidise the fear treatment in order to increase the demand. First, one may argue that applying
standard rules for economic efficiency, assuming both rational behaviour and rational preferences, are
not meaningful in cases concerning treatment of mental sufferings. Thus, the desired level of supply
may be where the WTP ex post equals the cost, since this is the patients' WTP under full certainty
about the effects of the fear treatment and with reduced mental stress. Second, the high score on
general psychological distress tests often seen in this patient group (Aartmann, 1997 and Willumsen,
1999) may be an indication of reduced ability to function in the work place. Thus, dental fear may
both have external effects on the patients' productivity and reduce their income. In our sample, the
mean private income is very low, less than 43 percent of mean Norwegian private income in 1994. If
this is the case for dental fear patients in general, it has several impacts on the evaluation of efficiency
and social desirability of the fear treatment. If the external effects in the work place are not reflected in
the patients' expressed WTP for the treatment, the costs of dental fear is underestimated, and it may be
economically efficient to subsidise the supply of dental fear treatment. Furthermore, the low income in
this patient group implies that they have a large marginal utility of income as compared to more
wealthy groups.6 For this reason, the social desirability of the treatment is likely to be underestimated,
and it will be beneficial for the society to subsidise dental fear treatment. This is both because of the
6 Because the marginal utility of consumption is assumed to decline with quantity, it follows that the marginal utility of income decreases with income.

23
high marginal utility of income in this patient group and because society often wants to redistribute
resources to the less wealthy consumers (inequality aversion).
Since we are not able to measure neither the external effects through the labour market, the marginal
utility of income or the individual welfare weights, it is not possible to determine the exact subsidy
level which secure either economic efficiency or the social optimal allocation of resources. All these
effects do, however, suggest that the supply of dental fear treatment should bee subsidised to some
degree by the government. However, when discussing the social desirability of subsidising dental fear
treatment, one also need to take into consideration efficiency losses in the economy due to additional
tax increases in order to finance the subsidies.

24
References
Bhattacharyya, G.K. and R.A. Johnson (1977): 'Statistical Concepts and Methods', John Wiley &
Sons, New York.
Berggren, U. and Linde, A. (1984): 'Dental fear and avoidance: a comparison of two modes of
treatment', J. Dent. Res. 63(10), pp. 1223-1227
Carlsson, S.G., Linde, A., Berggren, U., and Harrison, J.A. (1986): 'Reduction of dental fear:
psychophysiological correlates', Community. Dent. Oral Epidemiol. 14(5), pp. 253-257.
Carpenter, D.J., Gatchel, R.J., and Hasegawa, T. (1994): 'Effectiveness of a videotaped behavioral
intervention for dental anxiety: the role of gender and the need for information', Behav.
Med. 20(3), pp. 123-132.
Derogatis, L.R (1983): 'SCL-90-R. Administration, scoring and procedures manual', Balimore:
Clinical Psychometric Research.
Gravelle, W. H. and R. Rees (1981): 'Microeconomics', Longman Group Limited, London and N.Y.
Greene, W. H. (1993): 'Econometric analysis', Macmillan Publishing Company, N. Y.
Hakeberg M, Berggren U, Grondahl HG. (1993): 'A radiographic study of dental health in adult
patients with dental anxiety', Community Dent Oral Epidemiol, Feb; 21(1), pp. 27-30
Hallonsten, A.L. (1988): 'Sedation by the use of inhalation agents in dental care', [Review] [29 refs].
Acta Anaesthesiol. Scand. Suppl. 88, pp. 31-35.
Halvorsen, B (1996): 'Ordering effects in contingent valuation surveys. Willingness to pay for reduced
health damages from air pollution', Environmental and Resource Economics, vol.8, no.9.
Halvorsen, B. (1997): ‘Methodological Issues in Applying Stated Preference Data to the Valuation of
Public Goods.’ Økonomiske doktorgrader Nr. 39 - 1997, Universitetet i Oslo.
Halvorsen, B. and K. Sælensminde (1998): 'Differences between Willingness-to-pay estimates from
Open-Ended and Discrete Choice Contingent Valuation Method: The effect of
hetroskedasticity', Land Economics (May).

25
Halvorsen, B. (2000): 'Comparing ranking and contingent valuation for valuing human lives, applying
nested and non-nested logit models', Environmental and resource economics, June.
Horowitz Horowitz, L.G. (1992): 'Audiotaped relaxation, implosion, and rehearsal for the treatment of
patients with dental fear', Gen. Dent. 40(3), pp. 242-247.
Johansson, P.-O. (1993): 'Cost-benefit analysis of environmental change', Cambridge University press,
Cambridge.
de Jongh, A., Muris, P., ter Horst, G., van Zuuren, F., Schoenmakers, N., and Makkes, P. (1995): 'One-
session cognitive treatment of dental fear: preparing dental phobics for treatment by
restructuring negative cognitions', Behav. Res. Ther. 33(8), pp. 947-954.
Kaufman, E., Rand, R.S., Gordon, M., and Cohen, H.S. (1992): 'Dental anxiety and oral health in
young Israeli male adults', Community. Dent. Health 9(2), pp. 125-132.
Kent, G. (1985): 'Cognitive processes in dental anxiety', Br .J. Clin. Psychol. 24(Pt 4), pp. 259-264.
Kent, G. and Gibbons, R. (1987): 'Self-efficacy and the control of anxious cognitions', J. Behav. Ther
Exp. Psychiatry 18(1), pp. 33-40.
Kent, G.G. (1990): 'Thinking about anxiety', Br. Dent. J. 169(5), pp. 133-135.
Klepac, R.K. (1975): 'Successful treatment of avoidance of dentistry by desensitization or by
increasing pain tolerance', J. Behav. Ther. Exp. Psychiatry 6, pp.307-310.
Krochak and Rubin Krochak, M. and Rubin, J.G. (1993): 'An overview of the treatment of anxious and
phobic dental patients', [Review]. Compendium. 14(5), pp. 604.
Liddell, A., Di Fazio, L., Blackwood, J., and Ackerman, C. (1994): 'Long-term follow-up of treated
dental phobics', Behav. Res. Ther. 32(6), pp. 605-610.
Maddala, G.S. (1988): 'Introduction to Econometrics', Macmillan Publishing Company, New York.
Makkes, P.C., Schuurs, A.H., van Velzen, S.K., Duivenvoorden, H.J., and Verhage, F. (1987): 'Effect
of a special dental program upon extreme dental anxiety', Community. Dent Oral
Epidemiol. 15(3), pp. 173.

26
Mas-Colell, A., M. D. Whinston and J. R. Green (1995): 'Microeconomic Theory', Oxford University
Press, New York.
Mitchell, R. C. and R. T. Carson (1989): 'Using survey to value public goods: The contingent
valuation method', Hopkins University press, Washington D. C.
Myles, G. D. (1995): 'Public economics', Cambridge University press, Cambridge.
Ning, L. and Liddell, A. (1991): 'The effect of concordance in the treatment of clients with dental
anxiety', Behav. Res. Ther. 29(4), pp. 315-322.
Scott et al (1998):
Smith, T., Getz,T., Milgrom, P., and Weinstein, P. (1987): 'Evaluation of treatment at a dental fears
research clinic', Spec. Care Dentist. 7(3), pp. 130-134.
Ter Horst, G. and De Wit, C.A. (1993): 'Review of behavioural research in dentistry 1987-1992: dental
anxiety, dentist-patient relationship, compliance and dental attendance', [Review] [139
refs]. Int .Dent. J. 43(3:Suppl 1): Suppl 1), pp. 265-78.
Van der Bijl Van der Bijl, P. (1992): 'The benzodiazepines in dentistry: a review', [Review],
Compendium. 13(1), pp. 46-50.
Vassend, O. (1993): 'Anxiety, pain and discomfort associated with dental treatment', Behav. Res. Ther.
31(7), pp. 659-666.
Vassend, O., Willumsen, T., and Hoffart, A. (2000): 'Effects of dental fear treatment on general
distress: The role of personality variables and treatment method', Behaviour Modification,
In press.
Varian, H. R. (1992): 'Microeconomic Analysis', W. W. Norton & Company, New York.

27
Willumsen, T. (1999): 'Treatment of dental phobia: Short-time and long-time effects of nitrous oxide
sedation, cognitive therapy and applied relaxation', thesis, Department of Pediatiric
Dentistry and Behavioural Science, Institute of Clinical Dentistry, Faculty of Dentistry,
University of Oslo.
Aartman, I., de Jong, A., and van der Meulen, M.R. (1997): 'Psychological characteristics of patients
applying for treatment in a dental fear clinic', Eur. J. Oral Sci. 105(5), pp. 384-388.

28
Recent publications in the series Discussion Papers
242 B. Bye (1998): Labour Market Rigidities and Environmental Tax Reforms: Welfare Effects of Different Regimes
243 B.E. Naug (1999): Modelling the Demand for Imports and Domestic Output
244 J. Sexton and A. R. Swensen (1999): ECM-algorithms that converge at the rate of EM
245 E. Berg, S. Kverndokk and K.E. Rosendahl (1999): Optimal Oil Exploration under Climate Treaties
246 J.K. Dagsvik and B.H. Vatne (1999): Is the Distribution of Income Compatible with a Stable Distribution?
247 R. Johansen and J.K. Dagsvik (1999): The Dynamics of a Behavioral Two-Sex Demographic Model
248 M. Søberg (1999): Asymmetric information and international tradable quota treaties. An experimental evaluation
249 S. Grepperud, H. Wiig and F.A. Aune (1999): Maize Trade Liberalization vs. Fertilizer Subsidies in Tanzania: A CGE Model Analysis with Endogenous Soil Fertility
250 K.A. Brekke and Nils Chr. Stenseth (1999): A Bio-Economic Approach to the study of Pastoralism, Famine and Cycles. Changes in ecological dynamics resulting from changes in socio-political factors
251 T. Fæhn and E. Holmøy (1999): Welfare Effects of Trade Liberalisation in Distorted Economies. A Dynamic General Equilibrium Assessment for Norway
252 R. Aaberge (1999): Sampling Errors and Cross-Country Comparisons of Income Inequality
253 I. Svendsen (1999): Female labour participation rates in Norway – trends and cycles
254 A. Langørgen and R. Aaberge: A Structural Approach for Measuring Fiscal Disparities
255 B. Halvorsen and B.M. Larsen (1999): Changes in the Pattern of Household Electricity Demand over Time
256 P. Boug (1999): The Demand for Labour and the Lucas Critique. Evidence from Norwegian Manufacturing
257 M. Rege (1999): Social Norms and Private Provision of Public Goods: Endogenous Peer Groups
258 L. Lindholt (1999): Beyond Kyoto: CO2 permit prices and the markets for fossil fuels
259 R. Bjørnstad and R. Nymoen (1999): Wage and Profitability: Norwegian Manufacturing 1967-1998
260 T.O. Thoresen and K.O. Aarbu (1999): Income Responses to Tax Changes – Evidence from the Norwegian Tax Reform
261 B. Bye and K. Nyborg (1999): The Welfare Effects of Carbon Policies: Grandfathered Quotas versus Differentiated Taxes
262 T. Kornstad and T.O. Thoresen (1999): Means-testing the Child Benefit
263 M. Rønsen and M. Sundström (1999): Public Policies and the Employment Dynamics among new Mothers – A Comparison of Finland, Norway and Sweden
264 J.K. Dagsvik (2000): Multinomial Choice and Selectivity
265 Y. Li (2000): Modeling the Choice of Working when the Set of Job Opportunities is Latent
266 E. Holmøy and T. Hægeland (2000): Aggregate Productivity and Heterogeneous Firms
267 S. Kverndokk, L. Lindholt and K.E. Rosendahl (2000): Stabilisation of CO2 concentrations: Mitigation scenarios using the Petro model
268 E. Biørn, K-G. Lindquist and T. Skjerpen (2000): Micro Data On Capital Inputs: Attempts to Reconcile Stock and Flow Information
269 I. Aslaksen and C. Koren (2000): Child Care in the Welfare State. A critique of the Rosen model
270 R. Bjørnstad (2000): The Effect of Skill Mismatch on Wages in a small open Economy with Centralized Wage Setting: The Norwegian Case
271 R. Aaberge (2000): Ranking Intersecting Lorenz Curves
272 J.E. Roemer, R. Aaberge , U. Colombino, J, Fritzell, S.P. Jenkins, I. Marx, M. Page, E. Pommer, J. Ruiz-Castillo, M. Jesus SanSegundo, T. Tranaes, G.G.Wagner and I. Zubiri (2000): To what Extent do Fiscal Regimes Equalize Opportunities for Income Acquisition Among citizens?
273 I. Thomsen and L.-C. Zhang (2000): The Effect of Using Administrative Registers in Economic Short Term Statistics: The Norwegian Labour Force Survey as a Case Study
274 I. Thomsen, L.-C. Zhang and J. Sexton (2000): Markov Chain Generated Profile Likelihood Inference under Generalized Proportional to Size Non-ignorable Non-response
275 A. Bruvoll and H. Medin (2000): Factoring the environmental Kuznets curve. Evidence from Norway
276 I. Aslaksen, T. Wennemo and R. Aaberge (2000): "Birds of a feather flock together". The Impact of Choice of Spouse on Family Labor Income Inequality
277 I. Aslaksen and K.A. Brekke (2000): Valuation of Social Capital and Environmental Externalities
278 H. Dale-Olsen and D. Rønningen (2000): The Importance of Definitions of Data and Observation Frequencies for Job and Worker Flows - Norwegian Experiences 1996-1997
279 K. Nyborg and M. Rege (2000): The Evolution of Considerate Smoking Behavior
280 M. Søberg (2000): Imperfect competition, sequential auctions, and emissions trading: An experimental evaluation
281 L. Lindholt (2000): On Natural Resource Rent and the Wealth of a Nation. A Study Based on National Accounts in Norway 1930-95
282 M. Rege (2000): Networking Strategy: Cooperate Today in Order to Meet a Cooperator Tomorrow
283 P. Boug, Å. Cappelen and A.R. Swensen (2000): Expectations in Export Price Formation: Tests using Cointegrated VAR Models
284 E. Fjærli and R. Aaberge (2000): Tax Reforms, Dividend Policy and Trends in Income Inequality: Empirical Evidence based on Norwegian Data
285 L.-C. Zhang (2000): On dispersion preserving estimation of the mean of a binary variable from small areas

29
286 F.R. Aune, T. Bye and T.A. Johnsen (2000): Gas power generation in Norway: Good or bad for the climate? Revised version
287 A. Benedictow (2000): An Econometric Analysis of Exports of Metals: Product Differentiation and Limited Output Capacity
288 A. Langørgen (2000): Revealed Standards for Distributing Public Home-Care on Clients
289 T. Skjerpen and A.R. Swensen (2000): Testing for long-run homogeneity in the Linear Almost Ideal Demand System. An application on Norwegian quarterly data for non-durables
290 K.A. Brekke, S. Kverndokk and K. Nyborg (2000): An Economic Model of Moral Motivation
291 A. Raknerud and R. Golombek: Exit Dynamics with Rational Expectations
292 E. Biørn, K-G. Lindquist and T. Skjerpen (2000): Heterogeneity in Returns to Scale: A Random Coefficient Analysis with Unbalanced Panel Data
293 K-G. Lindquist and T. Skjerpen (2000): Explaining the change in skill structure of labour demand in Norwegian manufacturing
294 K. R. Wangen and E. Biørn (2001): Individual Hetero-geneity and Price Responses in Tobacco Consumption: A Two-Commodity Analysis of Unbalanced Panel Data
295 A. Raknerud (2001): A State Space Approach for Estimating VAR Models for Panel Data with Latent Dynamic Components
296 J.T. Lind (2001): Tout est au mieux dans ce meilleur des ménages possibles. The Pangloss critique of equivalence scales
297 J.F. Bjørnstad and D.E. Sommervoll (2001): Modeling Binary Panel Data with Nonresponse
298 Taran Fæhn and Erling Holmøy (2001): Trade Liberalisation and Effects on Pollutive Emissions and Waste. A General Equilibrium Assessment for Norway
299 J.K. Dagsvik (2001): Compensated Variation in Random Utility Models
300 K. Nyborg and M. Rege (2001): Does Public Policy Crowd Out Private Contributions to Public Goods?
301 T. Hægeland (2001): Experience and Schooling: Substitutes or Complements
302 T. Hægeland (2001): Changing Returns to Education Across Cohorts. Selection, School System or Skills Obsolescence?
303 R. Bjørnstad: (2001): Learned Helplessness, Discouraged Workers, and Multiple Unemployment Equilibria in a Search Model
304 K. G. Salvanes and S. E. Førre (2001): Job Creation, Heterogeneous Workers and Technical Change: Matched Worker/Plant Data Evidence from Norway
305 E. R. Larsen (2001): Revealing Demand for Nature Experience Using Purchase Data of Equipment and Lodging
306 B. Bye and T. Åvitsland (2001): The welfare effects of housing taxation in a distorted economy: A general equilibrium analysis
307 R. Aaberge, U. Colombino and J.E. Roemer (2001): Equality of Opportunity versus Equality of Outcome in Analysing Optimal Income Taxation: Empirical Evidence based on Italian Data
308 T. Kornstad (2001): Are Predicted Lifetime Consumption Profiles Robust with respect to Model Specifications?
309 H. Hungnes (2001): Estimating and Restricting Growth Rates and Cointegration Means. With Applications to Consumption and Money Demand
310 M. Rege and K. Telle (2001): An Experimental Investigation of Social Norms
311 L.C. Zhang (2001): A method of weighting adjustment for survey data subject to nonignorable nonresponse
312 K. R. Wangen and E. Biørn (2001): Prevalence and substitution effects in tobacco consumption. A discrete choice analysis of panel data
313 G.H. Bjertnær (2001): Optimal Combinations of Income Tax and Subsidies for Education
314 K. E. Rosendahl (2002): Cost-effective environmental policy: Implications of induced technological change
315 T. Kornstad and T.O. Thoresen (2002): A Discrete Choice Model for Labor Supply and Child Care
316 A. Bruvoll and K. Nyborg (2002): On the value of households' recycling efforts
317 E. Biørn and T. Skjerpen (2002): Aggregation and Aggregation Biases in Production Functions: A Panel Data Analysis of Translog Models
318 Ø. Døhl (2002): Energy Flexibility and Technological Progress with Multioutput Production. Application on Norwegian Pulp and Paper Industries
319 R. Aaberge (2002): Characterization and Measurement of Duration Dependence in Hazard Rate Models
320 T. J. Klette and A. Raknerud (2002): How and why do Firms differ?
321 J. Aasness and E. Røed Larsen (2002): Distributional and Environmental Effects of Taxes on Transportation
322 E. Røed Larsen (2002): The Political Economy of Global Warming: From Data to Decisions
323 E. Røed Larsen (2002): Searching for Basic Consumption Patterns: Is the Engel Elasticity of Housing Unity?
324 E. Røed Larsen (2002): Estimating Latent Total Consumption in a Household.
325 E. Røed Larsen (2002): Consumption Inequality in Norway in the 80s and 90s.
326 H.C. Bjørnland and H. Hungnes (2002): Fundamental determinants of the long run real exchange rate:The case of Norway.
327 M. Søberg (2002): A laboratory stress-test of bid, double and offer auctions.
328 M. Søberg (2002): Voting rules and endogenous trading institutions: An experimental study.
329 M. Søberg (2002): The Duhem-Quine thesis and experimental economics: A reinterpretation.
330 A. Raknerud (2002): Identification, Estimation and Testing in Panel Data Models with Attrition: The Role of the Missing at Random Assumption
331 M.W. Arneberg, J.K. Dagsvik and Z. Jia (2002): Labor Market Modeling Recognizing Latent Job Attributes and Opportunity Constraints. An Empirical Analysis of Labor Market Behavior of Eritrean Women
332 M. Greaker (2002): Eco-labels, Production Related Externalities and Trade
333 J. T. Lind (2002): Small continuous surveys and the Kalman filter
334 B. Halvorsen and T. Willumsen (2002): Willingness to Pay for Dental Fear Treatment. Is Supplying Fear Treatment Social Beneficial?