benin review of public expenditures,...
TRANSCRIPT

Report No. 6951-BEN
BeninReview of Public Expenditures, 1985-90January 12, 1988
Africa Regional Office
FOR OFFICIAL USE ONLY
Document of the World Bank
This document has a restricted distribution and may be used by recipientsonly in the performance of their official duties. Its contents may not otherwisebe disclosed without World Bank authorization.
Pub
lic D
iscl
osur
e A
utho
rized
Pub
lic D
iscl
osur
e A
utho
rized
Pub
lic D
iscl
osur
e A
utho
rized
Pub
lic D
iscl
osur
e A
utho
rized

CURRENCY EQITIVALENTS
Currency Units = CFA francs (CFAF)
1984 US$ = CFAF 436.96
1985 US$ = CFAF 449.26
1986 US$ = CFAF 346.30
FISCAL YEAR
January 1 - December 31

Definitions of Social Indicators FOR OFCIL USE ONLY
The dc! nition of a particular social indicator may 71'tal tirti/itY rute - Average number of children thatvarn among countries or within one country over would hx born alive to a woman during her lifetime,time. For instance. liflercint coutitrics deline "urban il durinig her childbearing years she were to bearare.t" or sale water" it tililerent vwavs. For more childrein at each agc in accordance wit!. prevailing
-ddctailed detinitions. sec tle tehlinicall notes to the a£eg-specilic fertility rates.W\orld Development Indicaiors. Inant igedl0-.) nmorrtalitv rate - Num,er of infarts
per thousand lIve births, in a given =ar. who dieAREA (thousand sLlLtare kilometcrs) before reaching one year of agc.7'otal - Total surli.ce area comprising land arca and Child ti aged 1-4) nwrtalitl rate - Number of deathsinland waters. of children, aged 1-4. per thousand children in theA4gricultura, t percentage ol total) - Estimate of agri- same agc group, in a given year.cutltural aIreai luscd for crops. pastures. market and Foiwiiil/ planning'- acceptors, (thousands) - Annualkitchen gardens or lying 1l,llow, as a percentage of number of acceptors of birth-control measures re-total. ceived under the auspices of a national family plan-
ning program.GNP PER CAPITA (USS) - 1986 GNP per capita Fatmtily planning- u-sers (percentage of married wom-estimates at current market prices, calculatcd by the en) - Percentage of married women of child-bearingconversion method used for the Worl(d Bank Atdac. age who are practicing, or whose husbands are
practicing. any form of contraception. Child-bearingPOPULAlION AND VITAL STATISTICS age is generally 15 to 44. although fot some coun-Total population - mid-year (millions), 1986 data. tries contraceptive usage is measured for other ageU rban population (percentIge vf total) - Different groups.countries follow different definitions of urban pop-ulation u aich may affect cormparability of data FOOD, HEALTH AND NUTRITIONamong countries. Index oJfood productiono per capita (1979-81 = 100)Population gro wnth rate (percent) - total and urban - - Index of per capita annual production of all foodAnnual growvth rates of total and of urban popula- commodities. Production excludes a .imal feed andtions. seed for agriculture. Food commodities include pri-Lt c e.pectancY at hirdit (years) - Numbcr of years a mary commodities (for examp.e, suga-cane insteadnewborn int:ant would live if prevailing patterns of of sugar) which are edible and which contain nu-mortality at the time of its birth werc to stay the trients (for example, tea and coffee are excluded).same throughout its life. They include nuts, fruits, pulses, cereals, vegetables,Poputlation proiections oil seeds. sugarcane and sugar beets, livestock, and
Po-ptpulation in 2000 - Projections of population lIvestock products. Aggregate production of eachgiven total population by ag4 and sex, fertility and country is based on national average producer pricethe demographic parameters of mortality rates, and weights.migration in the base year 1980. Per capita supply of calories - Computed from energy
Stationtary populationt - Projected population level equivalent of net food supplies available in a coun-when zero population growth is achieved: i.e., the try, per capita, per day. Available supplies comprisebirth rate is constant and is equdl tp the death rate, domestic production. imports less exports, andthe age structure is stable. and the growth rate is changes in stock. Net supplies exclude animal feed,zero. seeds for use in agriculture, quantities used in foodPopulatio1n density, agricultural landl - Population per processing, and losses in distribution,square kilometcr (100 hectares) of agricultural area. Per capita supply of protein (grants per day) - ProteinPopulation age structure (percent) - Children 0-14 content of per capita nct supply of food per day. Netyears. working agc group 15-64 years. and people of supply of food is defined as above. Requirements for65 years and over as percentages of population. all countries, established by United States Depart-Crank'e birth rate - Annual live births per thousand ment of Agriculture, provide for minimum allow-population. ances of 60 grams of total protein per day and 20Crnde' death rate - Annual deaths per thousand grams of animal or pulse protein.population. Population per physi(ian - Population divided by the
This document has a restricted distribution and miy be used by! recipients only in the performanceof their official duties. Its contents may not othe.wise be disclosed without World Bank authorization.Thi dou_thsarsrce itiuinadmy eue ~rcpet nyi h efra

number of practicing physicians qualificd from a and rural- Conventional dwellings with electricity inmedical school at university lvel. living quarters. as a perccntage of all dwellings.Population per nursing person - Population divided bythe number of practicing graduate nurses. assistant EDUCATIONnurses, practical nurses and nursing auxiliaries. L'n. .lnent ratesPopultation pe, hospital bed - Population divided by Prin*ary .school enrollment - total, mtale andfemalethe number of hospital beds availabic in public and - Gross enrollment of all ages at primary level as aprivat,~. general and specialized hospitals. and reha- percentage of school-age children as defined by eachhilitation centers. Hospitals are establishmcnts per- country. and reported to Unescr. While many coun-manently staffed by at least one physician. tries consider primary schlool age to be 6-11 years.Access to sqae * ater (percentage of populationI) - others use different age groups. For some countriestotal, urban, and rural - People (total, urban. and with universal education. gross enrollment may ex-rural) with reasonable access to safe water supply ceed 100 percent since some pupils are younger(includes treated surface waters or urntreated but ot older than the country's own standard primaryuncontaminated water such as that from springs, school age.sanitary wells, and protected boreholes). In an urban Secondary school enroll/went - total, male and fent-area this may be a public fountain or standpost ale - Computed in a similar manner, but includinglocated not more than 200 meters away. In rural pupils enrolled in vocational, or teacher trainingareas this im, lies that members of the household do secondary schools. The age group is usually 12 to 17.not have to spend a disproportionate part of the day Pupil-teaciher ratio -primar.y, and secondar.v -Totalfetching water. students enrolled in school divided by the total
number of teachers.LABOR FORCE Percentage pupils reaching grade six - The percent-Total labor force (millions) - Economically active, age of children starting primary school, that contin-including armed forces and unemployed but exclud- ue until grade six.ing housewives and students.Feniale (percent) - Female labor force as a percent- INCOME, CONSUMPTION, AND POVERTYage of total labor force. Energy consumption per capita (kilograns of' oilAgricul'ure (percent) - Labor force in farming, equivalent) - Annual consumption of ccenmercialforestry, hunting and fishing as a percentage of total primary energy (coal, lignite, petroleum, natural gas.labor force. and hydro. nuclear and geothermal electricity).lndustry (percent) - Labor force in mining, construc- Income distribution - Income (both in cash and kind)tion. manufacturing and electricity, water and gas as accruing to percentile groups of households rankeda percentage of total labor force. by total household income.Participation rate (percent ) - total, male, and fteiale Passenger cars (per thoutsand population ) - Includes- Participation rates are the percentage of population motor cars seating fewer than eight persons.of all ages in the labor force. These are based on ILO Newspaper eiretlation (per tihousand pop!lation) -data on the age-sex structure of the population. Average circulation of a "daily, general interestAge dependency ratio - Ratio of population under IS. newspaper." defined a. a news periodical publishedand 65 and over, to the working age population (age at least four times a week.15-64). Estimated absolute povertr income level (USS per
cap.;ta) - urban antd rurtl - Absolute povcrty incomeHOUSING lcvel is that below which a minimal nutritionallyAverage si:e of household (personLs per household) - adequatc diet plus essential nonfood requirementstotal, urban, and rural - A houschold consists of a are not affordable.group of individuals who share living quarters and Estimnated population below absolute poveri' incomemain meals. level (percent) - Percentage of urban and rural pop-Percenta,ge ot dvellings wt ith electriwit! - totaJl urhan, ulations who live in 'absolutc poverty."

1987 SOCIAL INDICATOR DATA SHEET
BENINReference Groups (MRE)
MostRecent Lower mid
19$5 1973 Esttmate Low-income income
AREATotal land area (thou sq km) 112.6 112.6 112.6Agricultural (% of total) 17.8 19.0 20.0
GNP PER CAPITA (current USS) 100 130 280 260 820
POPULATION AND VITAL STATISTICSTotal population (thou) 2,332 2,874 3.920Urban pop. (% of totul) II 13 15 22 36Population growth rate(%):
Total 2.6 2.8 2.1 2.5Urban 4.4 5.0 3,9 4.2
Life expect. at birth (yrs) 42 45 49 60 58Population projections:
Pop. in 2000 (thou) 6.474Stationary pop. (thou) 20.200
Population density per sq kmof agricultural land 116 134 174 349 284Pop. age structure (%):
0-14 yrs 45 46 47 37 3915-64 yrs 52 51 50 59 5565 and above 3 3 3 4 6
Crude birth rate (per thou) 49 SO 49 29 36Crude death rate (per thou) 25 21 17 10 11Total fertility rate 6.9 6.9 6.5 3.2 3.6Infant mort. rate (per thou) 168 149 116 72 82Child death rate (per thou) 52 39 19 9 11Family planning;Acceptors, annual (thou)Users (% of married women) 17
FOOD. HEALTH AND NUTRITIONIndex of food production percav1ta (1979-81 i 100a 96 118 115 108Per capita supply of:
Calories (per day) 2.008 2.017 2.173 2.339 2,514Proteins (grams per day) 45 45 42 55 56
Pop. per physician (thou) 17.5 8.9 6.9Pop. per nu-se (thou) 2.4 1.4Pop. per hospital bed (thou) 0.7 1.1 0.8Access to safe water
(% of population): Total 20 20Urban ,, 42 26Rural 16 15s
Populatlon Growth Infant Mortality Primary School Enrollment150 2
1001 1 S. *---a so.
is,0 1070 Its0 1960 1070 190
et nmsT Ri?r Goup * n1SI5p' EW

1987 SOCIAL INDICATOR DATA SHEET
BENINReference Groups (MRE)
MostRecent Lower mid
1965 1973 Estimate Low-income income
LABOR FORCETotal Labor force (thou) 1,154 1.360 1.699
Female (%) 46 45 46 31 29Agriculture 1%) 83 78 70 72 55Industry (%) 5 6 7 13 16
Participation raze (%):Total 49 47 43 41 35Male 55 53 49 54 49Female 44 42 38 28 20
Age dependency ratio 0.9 0.9 1.0 0.7 0.8
HOUSINGAverage size of household:
TotalUrbanRural
Percentage of dwellings withelectricity:TotalUrbanRural
EOUCATIONEnrollment rates:Primary: Total 34 36 67 97 103
Male 48 51 92 109 110Female 21 22 43 84 97
Secondary; Total 3 5 22 32 40Male 5 6 32 41 48Femalt 2 3 12 25 39
Pupil-Teacher ratio:Primary 42 52 38 36 32Secondary 25 46 .. la 20
Pupils reachitng grade 6 (%) .. 50 52 49 71
INCOME. CONSUMPTION. AND POVERTYEnergy consumptior per cap.(kg of oil equivalent) 21 49 35 310 345Percentage of private incomereceived by:Highest 10% oF householdsHighest 20% 52 a ..
Lowest 20% 6 aLowest 40% 16 a
Est. absolute poverty incomelevel (USS per capita):
UrbanRural 84 b.
Est. pop. below absoluteiverty income level (%)UrbanRural 65 b
Passenger cars/thou pop. 3.0 4.7 .. 0.3 4.0Newspaper circulation(per thousand population) 0.9 0.7 0.3 16.0 14.0
IECSE August 1987Not available. Note: Most wecent estimetos of population and GliP psr capita are for 1986 unloss otherwise noted.
Grouo averas are population weighted. Country crtegse depends on date availability and s not uniorm. Unless otherwise noted.19 refets to any year between 192 end lS11; 197) bOtwbon 1970 *nd 1976: and most reW1nt ettmte betweetn 1930 and 16.e. 1Wo. b. IM.

88IN - ECUNCNIC ItOICATORB
Mid-1988 Population (mile.) 4 Page I of 81986 Per* Capita ON? in US$: 270 Septembir 1987
A. Shares of Gross DomestIc Product I. Orowth Raes. (S per annum)(frew current price data) (from constant price data)
1968 1973 1980 1984 1988 1984p 1988-78 1978-80 1980-88 1985 1986
arose Domestic Product M.P. 100.0 100.0 100.0 100.0 100.0 100 0 .. 2.4 8.4 8.2 '-0.2Net Indirect Tax"s 6.8 10.1 9.2 6.6 5.9 8.8 . .
Aariculture 84.7 41.8 43.4 42.4 48.8 46.8 3. 8, 0.9 138.8 6.0Industry 7.9 11.1 11.1 14.8 14.7 12.6 .. 0.7 18.5 11.8 -9.9(of which Manufacturing) .. 7,4 8.8 8.9 4.2 8.8 . -2.6 7.2 17.5 -12.8Services 80.8 87.6 86.8 86.7 84.1 88.1 .. 1.8 2.4 0.6 0.2
Resource Waants -8.2 -9.0 -24.6 -18.8 -14.8 -12.4.. ,
Exports of ONFS 12.9 27.9 28.2 24.6 28.8 14.4 16.2 7.8 0.8' "0.1 -12.:6Imports of ONFS 21.2 86.9 88.0 88.4 88.1 26.8 11.9 7.6 -10.2 -0.8 -21.7
Total Expenditures 108.2 108.9 124.9 113.8 114.8 112.4 .. .4 -0.9 6.6 .0.8
Total ConsVumption 97.8 92.9 108.8 108.4 100.8 99.8 .. 2.8 1.2 8.8 '4.1Private Consumption 88.6 80.7 98.7 98,2 92.2 90.2 .. .8 0.8 8.8 0.8Ceneral Oovernment 10.8 12.2 10.6 10.2 8.7 9.4 8.0 -8.1 4.8 8.7 -4.4
Gross Domestic Inveatment 10.8 16.0 18.6 7.4 18.6 12.6 9.1 9.0 -17.9 14.0 -8.8Fixed Investment . . . . .. ... .
Changes in Stock . . . . . ... .
Oroas Domestic Saving 2.8 7.1 -14.8 -7.1 -0.8 -0.1 . .
Net Factor Income 0.0 0.0 -0.8 -1.8 -0.9 -1,0 . .
Not Current Transfer* . 0.8 8.8 2.2 1.9 2.85. .
Oro"s National Saving .. 7.9 -10.9 -8.7 0.8 1.4 . .
In billions of CPA franca 1988 1978 1980 1984 1988 1988p(at constant 1980 prices) ---- ---- ---- --- -- ---
Oross Domestic Product .. 202 242 288 801 800 ,. 2.4 8.4 8.2 '.0.2Capacity to Import 21 84 68 8s 88 82 17.8 8.5 -1.4 -1.0 -28.6Terms of Trade Adjustment 8 24 0 -8 -8 -10 . .
Gross Domestic Income .. 228 242 280 298 290 .. 1.8 8.2 8.8 -2.8Gross National Product .. 202 242 278 298 297 .. 2.4 8.2 7.0 -0.2Crossx National Income. 228 242 278 29S 287 .. 1.8 3.0 7.1 -2.6
- -------- (1980 100)…-----nflation---Rates (S p.a.)…------C. Pr j Indices 1980 1982 1988 1984 1985 i948p 1968-73 1973-80 1980-84 1988 1 .R6p
--- -- --- -- -- --- -- -- --- - -- --- - -- ---- - -- - --- - - - - - - - - - - - - '..
Consumer Prices (IFS 64) 100.0 .. . . . . .7 10.8Wholesale Prices (IFS 63) . . . . .. ,. ,
Implicit CDP Deflator 100.0' 120.1 184.'4 148.9 188.1 180.3 . 11.8 10.4 8.6 8.8Implicit Expenditures Deflator 100.0 120.8 188.1 148.0 157.4 181.8 .. 12.8 10.6 6.4 2.8
D. Other Indicators 1955-73 1973-80 1980-88 -- I---------------------
Orowth Rates (1 p.m.):Population 2.6 2.7 8.1 p a preliminary dataLabor Force 2.1 1.9Cross National Income p.c. ..- 1.1 -0.2Privste Consumption P.C. . 0.8 -2.3
Import Elasticity:Imports (CtNFS) / aDP (mp) 3. .2 -2.7
Marginal Savings Rates:
Grose National Saving . .0.8
Oross Domestic Saving 21.1 -401.4 88.2
ICOR (period averages): .. 7.8 2.0
Share of Total 1988 1973 1980 1988pLabor force in: ---- ---- ---- ---
Agriculture 83.0 78.0 70.0 72.0Industry 8.0 6.0 7.0 6.0Services 12.0 18.0 28,0 22.0Total 100.0 100.0 100.0 100.0 -- •------------

1NN
BENIN - ECONOP4ZC INDICATORS___------- - -____ -_* ______._P e 2 of 8
Volume Index (1O94 a 100) Value at Current Price (eilIlose UN):._.,._..__.._...................__..__ _ _________._ _ ____. _ _ _____. ......
S. Merchandls Export. 1980 1982 l988 1984 1984 1986p 1980 1982 198 1984 198 IOOp
PsiI OI 100 0 71.0 8 8889 64.8 7 1966. B.G -- 1.2 0.7 7 1 8.8Coton 100.0 60.8 182.2 288.8 896.7 414.0 14.2 6.1 12.9 27.o 89.6 48.8Cocoa 100.0 6.3 60.0 188.8 20.9 21.9 14.5 0.6 4,8 15.8 42.2 88.OCrude oil 100.0 202.6 207.1 21864 w2.8 60.2 68.6 u.0Manufactures 100.0 1.0 138.1 121.4 142.7 212.8 48.4 19.2 40.8Other Egport0 10.2 1.6 24.1Total Merchendi e Exporte FOB 222.0 144.0 175.8 170.8 17*8? 181.1
P. Merchandise Imports
Food 78.2 97.9 e 116 188.7POL and Other Energy 278.6 245.4 67.2 61.7Othor Imports 106.4 296.2 .. 183.4 152.6
Other Coneumer Ooode 45.2 W8 .. .9 6.2Other Intermediate Good o 60. 94.0 90.4 100.8Cp Itol oods 90.8 164.1 . 8.% 86.6
Total Merchandise Iaport. CIF ., .. .. .. .. .. 848.4 89.8 2826 285.0 812.2 869.8
0. Term, of Trade (1980 100) 1980 1982 1988 1984 1985 1986p ------------------------------------------------------------------- ---- .. ------ ---- --- ----- Notes:Merch. Exports Price Index 100.0 79.9 87.6 86.8 01.7 78.0Merch. Import. Price Indox 100.0 97.3 94.2 92.9 92.0 100.4 1. Debt Servica Indlaetore roflectMerchandise Term, of Trade 100.0 82.1 93.0 94.1 0.$8 78.7 actual payments excluding arrears.
US$ millions (at current price.)i
H. Bciance C4 Paymonte 1980 1982 1988 1984 1985 -- 98p p * preliminery date
Export. of Goods and NFS 3o0 215 241 285 242 190Merchandise (MS8) 222 144 17S 170 177 181Non-Factor Services 84 71 $66 6 66 t8
Import. of Goodo and NFS 808 700 854 867 891 871Merch.ndise (FO8) 499 576 251 266 276 8 aNon-Factor Services 109 124 104 101 115 SO
Reeource 8. lanc -302 -485 -113 -132 -149 -172
Not Factor Incom" -S -6 -13 -17 -9 -14(interest per DRS) a a 18 17 9 14
Net Current Transfers 44 85 24 21 20 S6(workers remittancea) 44 85 24 21 20 8S
Current Account Balance -261 -456 -103 -128 -187 -181
Long-Term Capital Inflow 129 278 160 72 74 65Direct Investment 0 0 0 0 0 0Official Capital Crant. 63 65 S5 S5 51 28Net LT Loan. (ORS data) S6 213 105 17 24 W9Other LT inflow. (Net) 0 0 0 0 0 0
Total Other Items (Net) 107 28 -58 55 64 86Net Short-term Capital 149 55 -62 50 64 8BCapital Flow. N.E.!. 0 0 0 0 0 0Error. and Omissions -43 -27 4 5 0 0
Chnge.o in Net Reaerves 25 180 1 1 -1 1Not Crodit from TM 2 C 0 0 0 0Other Reserve Changes( - indicates increnae) 23 150 1 1 -1 1
A. *hare, of ODP:R eourc 8alance -26.3 -46.9 -11.5 -13.8 -t4.5 -12.8Interest Payment. 0.8 0.6 1.3 1.8 0.9 1.0Current Account Balance -22.8 -44.1 -10,5 -13.4 -18.4 -10.8
Memorandum Items.tntOrnat'I Rftorvea (mil. USS) 8 5 4 8 4 4Re.orvee Incl. Oold (mil U'S) 18 10 8 6 8 SOfficial X-Rate (CFAF/P/USU 211.80 828.62 381.07 4U8.96 449.26 946.80Index Real Eff. X-R 8... 1980MOP (million. of current US$) 1147 1035 980 958 1026 1897

8ENIN - ECONOMIC SI#CCATORSPage 3 of 8
Share, of CDP (I) Orowtb Rates (7 p.%.)
I. Budget (apocify level) 1960 1982 1983 1984 1985 1986p 1980 - 89 1984 1988 1986p_______._ - - -- -- -- - - ----__ __ _ __ _ _ ---- ---- ---- ----- ----- ---- --- ____ ___ ___-_ __- _ __
Current Receipta 14.4 20.3 16.4 18.6 14.7 13.1 25.2 -7.7 19.8 -8.8Current Expenditures 11.6 16.8 17.8 17.0 16.6 16.4 45.8 6.6 7.7 3.8Current Budget al,bnce 2.8 8.5 -1.4 -3.8 -1.9 -8.3 -6.8 -168.7 39.7 -81.4
Capital Receipts 0.0 0.0 0.0 0.0 0.0 0.0 .. 7.9 0,0 0.0Capital Expenditurea 8.4 13.? 12.2 10.4 5.9 8.5 41.6 -4.5 -38.1 -1.5Overall Deficit -5.6 -10.2 -13.6 -13.9 -7.7 -8.a -91.2 -13.8 38.4 -18.9
Official Capital Oranto 5.5 6.3 5.6 8.8 5.0 1.9 -4.2 0.0 -7.8 -49.0External Borrowing (nrt) 3.4 2.3 2.9 3.0 2.8 2.3 9.8 18.8 1.8 -14.0Domestic Non-Bank Financing 0.3 0.9 -0.7 -1.8 0.4 0.0 -9S.8 -19S.8 73.6 0.0Domestic Bank Financing 1.9 1.7 8.2 3.8 -1.1 0.0 S2.0 33.2 -67.2 0.0
Net Oiebureements (US$ millions) Debt Outstanding & Disbursed (USl oil.)J. External Capital Flo-*,DObt ------------------------------------------------ ---------------------------------------------------
and Debt Burden Rn.ios lqO 1982 1983 1984 1985 1984p 1980 1982 1963 1984 19e6 1986p
Public & Publicly Ousranteed LT 66 218 105 17 24 89 382 S70 621 685 677 581
Official Creditor. 66 41 62 24 27 .. 219 253 299 301 848 890Multilateral 32 25 34 22 28 .. 117 159 18? 201 238 251
of which IBMD .. .. .. .. .. .. .. .. ..of which IDA 12 11 16 1S 19 24 52 73 89 100 123 146
Bi lateral 34 16 28 2 a .. 102 94 113 100 112 139
Private Creditor. 0 172 48 -7 -4 .. 113 817 321 284 328
Suppliers 0 10 0 -1 -2 .. 20 29 24 20 22Financial Markets 0 162 43 -6 -1 .. 93 288 297 264 306
Privet* Non-Ouaranteed LT 0 0 0 0 0 0 0 0 0 0 0 0Tota I LT 66 213 106 17 24 39 332 670 621 685 677 561
IF Net Credit 0 0 0 0 0 0 0 0 0 0 0 0Noet Short-Term Capital 149 55 -62 s0 64 86 68 77 70 62 99Total including IWP & Not ST 215 268 43 67 88 125 400 647 691 647 776
Bank and lOA Ratio& 1980 1982 1983 1984 1096 1986p -------------------------- ---- ---- ---- ---- ----- ----- Notes:
Share of Total Long-Term DOD1. IBRD as % of Total .. . .. .. .. .. 1. Debt Service Indicators reflect2. IDA as S of Total 15.66 12.77 14.28 17.13 18.10 26.10 actual payments excluding r.rreara.S. 1i010DA as S of Total 15.66 12.77 14 28 17.13 18.10 26.10Share of Total LT Debt Services 2. Public Finance arrears not shown1. IS as I of Total .. .. .. .. .. .. in financing.2. IDA as S of Total 4.55 4.11 3.29 2.83 7.14 5.003. llOD-IDA am S of Total 4.55 4.11 3.29 2.88 7.14 5.00 3. Some movements in trade data are
not analysed at this time.DOD-to-Exports Ratiow_____________________ p a preliminary data
1. Long-Trem Debt/Exports 108.50 265.12 257.68 248.94 279.75 281.912. IMP Credit/Exports 0.00 0.00 0.00 0.00 0.00 0.003. Short-Term Debt/Exports 22.22 35.81 29.05 26.38 40.914. LT+IMFST DOD/Exports 130.72 300.93 288.72 278.32 820.66
OOD-to-GDP Ratio*
1. Long-Term Debt/GDP 28.9 856.09 683.37 61.27 65.98 40.162. IMF Credit/GDP 0.00 0.00 0.00 0.00 0.00 0.003. Short-Term Debt/GDP 6.93 7.44 7.14 6.49 9.65
4. LT+.WF.ST DOD/GDP 34.87 62.53 70.51 67.77 75.63
Debt Service/Exports
1. Public A Quaranteed LT 2.72 4.57 10.07 16.57 9.24 9.612. Private Non-Ouranateed LT .. .. .
3. Total LT Debt Service 2.72 4.67 10.07 16.87 9.24 9.614. IHF Repurchaos * Serv Chga.5. Interest Only on ST Debt6. Total (LT+IFw+Sr Int.) -------------------------------------------------

This Public Expenditure Report is based on thefindings of World Bank missions that visited Beninin November 1986 and in June 1987. The first missionconsisted of Messrs. Emmanuel Akpa (Country Economist,APlCO, mission chief), Simon N'Guiamba (Economist, IMF),and Peter Osei (Research Assistant). A final missionled by Mr. Akpa, and comprising Mr. Katsu, discussedthe report with the authorities In October 1987.

LIST OF ABBREVIATIONS
UMOA - West Africa Monetary Union
CAA - Caisse Autonome d'Amortis6ement, the Debt Management Agency
OECD - Organization for Economic Cooperation dnd Development
BCEAO - Banque Centrale des Etats de l'Afrique de l'Ouest,the common Central Bank of the West Africa French-speakingcountries.
CARDER - Centre d'Action R6gionale pour le Developpement Rural, theRegional Agricultural Extension Agency
SBEE - Societe Bninoise d'Eau et d'Electricite, the Water andElectricity public enterprise.

Table of Contents
I. EXECUTIVE SUMMARY
II. THE REPORT ................... * 1
A. Macroeconomic Setting ...... 1
B. Budgeting Procedureso c e d u r es.................... 2
C. Budget Execution Procedures............................. 4
D. Current ExpenditureConsumptionr ........................ 5
E. Capital Expenditure/Investment ...... 9
F. Net External Financing. a n.c... ... g.. ... *. .. .... 12
III. RECOMMENDATIONS.............. 18
IV. ANNEXs SECTOR OVERVIEW
Agriculture .... 20
EAneriy .lu ................. .............. .444* ..... 22
Water ............................ 23
Transport ............................ 23
Telecommunications ...................... ..*.*. .24
Industry ......... ................ ............................ 24
Education ...................................... 25
Health ....................................... 25

EXECUTIVE SUMMARY
i. This report presents a review of Benin's public expenditures overthe period 1985-90. It follows another teport that reviewed the 1985 publicinvestment program and which made proposals for improved investmentprogramming, most of which were adopted in July 1986. By undertaking theanalysis of all public expenditure, this report seeks to provide the basisfor reviewing other elements of public finance policy, the acea in whichconcrete first steps towards reforms are awaited to pave the way for a fullprogram of needed macroeconomic reforms. Accordingly, the report paysparticular attention to the issues of institutional procedures andsustainability of the financial outlook.
Background
ii. After a decade of State-dominated resource allocation decisions,Benin is now endowed with a largely publicly owned productive capacity andan outsized Administration, both underperforming in a weak and financiallyover-leveraged economy. The authorities recognized these disappointingresults of past policies in the public enterprise sector, as early as 1982.They then decided on corrective measures which have been developed withBank assistance into a program of reforms, now entering its implementationphase, supported by an IDA credit. They also recognize that in view of thepublic finance, external debt and banking system dimensions of theproblems, a generalized program of macroeconomic reforms is needed. It hasalso become clear that economic reform must begin with improving efficiencyin public sector management and the creation of a favorable policyenvironment to spur private sector initiative. But progress in the designof such a program has been blocked by apparent uncertainty on the part ofthe authorities as to the nature of the key issues and how serious theyare. In c-der to help advance the dialogue, this report examines the mainpublic expenditure issues and recommends courseb of action on each.
Budgetina Procedures
iii. Five shortcomings plague Benin's expenditure budgeting andmonitoring procedures. These occur in: i) the estimation of receipts; ii)the budgeting of expenditure obligations; iii) the determination ofbudgetary equilibria; iv) expenditure record keeping; and v) the state ofthe budgetary codes.
iv. Owing to excessive optimism, revenue estimates for the past 8years have exceeded actual receipts by 17 percent on average each year.This has resulted mainly from the leadership's call for upward revision ofthe technician's first estimates, without new taxes being introduced. Theway to eliminate this weakness iF for the leadership to accept theestimates produced by the technicians. As to the more basic isst-e ofstrengthening the economy's revenue performance, the first course of actionshould be a simplification of the parts of the fiscal system which are

- ii -
overly complex in a way that lightens the burden of tax administrationwhile improving buoyancy. A full reform of the tax system could followlater. The fiscal system report prepared by the IMF' mission of October1985 gives valuable advice on how to proceed.
v. Underbudgeting has occurred in the cases of debt service andmaterials, supplies and services. In the case of debt service, theunderbudgeting has been deliberate. With materials, supplies and services,it has occurred more as a result of cumulative deficiencies in records onthe basis of which future needs are decided. The effects have been, inboth cases, to ignore the true level of financial imbalance faced at thebeginning of the year and make imprecise tne accounting of arrears. Areturn to full budgeting of obligations would permit decision-making thatfaces up early to the disequilibria, and also lead to improved accountingof arrears in cases of unpaid obligations.
vi. The use of a West African Monetary LLion (UHOA) requirement thata voted budget be in equilibrium as a pretext to overstate revenues andunderstate expenditure constitutes another procedural weakness. The UMOAregulation actually expects policy makers to eliminate disequilibria notedduring budgeting by taking appropriate measures, not cover them up. Theauthorities should only reflect budgetary equilibria after they have beenachieved in the work leading up to the finalization of the budget. As abeginning, the Budget Commission should be given a free hand to work withrealistic estimates and to identify imbalances where these exist. TheCommission should also be given a standing authorization to proposemeasures that would close the gaps identified in the course of their work.
BudRet Execution Procedures
vii. Incomplete expenditure records have hampered accurate budgetingfor subsequent periods for supplies, services and utilities in particular.This shortcoming has its origins in the Budget Directorate's practice ofnot establishing commitments on vouchers referred t3 it unless theDirectorate is reasonably certain that the payments can be made. Areversal of this practice in the case of services and utilities, for whichvouchers represent obligations actually incurred, would strengthenaccounting and expenditure monitoring.
viii. The lack of budgetary codes for capital expenditure has hinderedthe effective integration of capital with current expenditure. The work onnomenclature currently under way should remedy that shortcoming. Theconceptual framework developed so far for the nomenclature has to bechanged, however. It would be more appropriate to make Titles covereconomic classification; Chapters should apply to functionalclassification; and Articles should refer to functional sub-categories.

- iii -
Current Expenditure
ix. In 1985, committed current expenditure (excluding interest ondebt) absorbed 85 percent of all government receipts in 1985; it actuallyexceeded receipts in 1986 by about 8 percent. This situation, which islikely to get worse if current policies were to remain unchanged, is duemainly to the growth in personnel expenditures.
x. Wages and salaries increased three-fold during 1980-86, risingfrom around 60 percent of current outlays in 1980-81 to 73 percent in1985-86. Only by curbing this growth can the current expenditure explosionbe contained. The civil servants census of November/December 1986 providesthe first opportunity for tackling the personnel expenditure problem. Thepreliminary data show that, on the basis of the number of actual employeesand average salaries paid them, the 1986 wage bill should have been no morethan CFAF 37 billion instead of the CFAF 42 billion actually expended. Anew personnel budget formulated on the so-called 'zero-base, furnished bythe census data would mark a beginning towards controlling personnelexpenditure. Next, a new personnel roll ought to be constructed with thecensus data. This should be supported by ths proscription of wholesalerecruitment of new graduates and scrupulous adherence henceforth toregulations on retirement. Further measures to spin off some public sectoremployees into new private sector activities can then be incorporated in abroader reform program. Other deliberate outlays constituting thedifference between CFAP 42 billion and CFAF 37 billion in 1986 should bebudgeted separately, and the t,uestion of whether they can be affordedshould be confronted on the merit of the particular purposes.
xi. In contrast to personnel, the budget allocation for materials,supplies and services has diminished since 1980. In the case of utilities,where consumption has simply surpassed the meagre budget, payment arrearshave accumulated as a result. Alongside the reduction of personnelexpenditures, therefore, there ought to be higher allocations made formaterials, supplies and services.
Capital Expenditure
xii. The revised 1986 investment p.ogram marked the beginning ofprogramming by questioning the economic value of proposed projects andbudgeting the annual trarhoes of those accepted with greater realism.Nevertheless, the prngrsnms continue to budget greater domesticconitributions than are avai3a':-' and, as a partial consequence, end up withoveroptimistic tranches. rMi qavings capacity should be reinforced toenable the public sector to contribute 12-15 percent of the financing ofthe annual investmert progrwu. This is all the more critical since overthe period 1987-90 the ecrr. faces an annual external financing gap equalto the size of the annt1a publ4c investment program.
Net External financing
xiii. With rising scheduled debt service and stagnating newexternal commitments the economy faces potential negative external
- iv -
transfers averaging CFAP 17 billion per year during 1987-90. The only wayto reverse that outlook is through debt rescheduling to reduce thescheduled payments and improve the chances for sustained disbursements outof eristing, and possibly new, commitments. Such rescheduling on ParisClub-type terms during 1987-90 would turn the potential nega*ive transfersof CFAF 17 billion into positive net transfers of CFAF 9 billion, which isstill meager compared to the country's needs. Nevertheless the possibilityof achieving this improvement and mobilizing increased new commitments,constitute compelling reasons why Benin should prepare the economic reformprogam which creditors require as the framework into which debt relief isto be integrated.
xiv. The expected rescheduling of the domestic banking system's debt tothe common central bank, the Central Bank of West African States (BCEAO).should be on terms at least as favorable as those to be expected from otherdonors in order not to jeopardize the sustainability of the financialframework of the economic reform program.

II. THE REPORT
A. Macroeconomic Setting
1. Benin's policy of accelerated expansion of the modern sector ofthe economy under public sector ownership pursued during 1978-83 achievedimportant shifts in the economy. The most direct impact was on grossdomestic investment, which rose by about 15 percent per annum. It alsoexpanded the Administration, with the number of civil servants growing byabout 9 1ercent per year, raising operating expenditures by some 17 percentannually Ar.d narrowing the savings base. Consequently, although real GDPgrew concurrently by a satisfactory 5 percent per annum, the externalbalance resource gap widened rapidly, reaching a peak of 30 percent of GDPin 1982, as the investment/GDP ratio reached 34 percent. Substantialborrowing took place to effect the transfers that closed the gap, leadingto a more than six-fold increase in the external debt.
2. Capital expenditures have since fallen to more modest levels, bitconsumption continues along the higher path traced out in 1978-83. Moreover, many of the public sector ventures undertaken in the expansionaryyears are performing far below expectations for a number of reasons,including lack of market outlets, shortage of working capital andunavailability of inputs. At the same time, unfavorable economicconditions in the West African subregion since 1982 has kept Benin'scrucial overland transit and re-export trade activities depressed. Underboth influences, the economy faces the problem of an overextended publicsector largely responsible for enlarged aggregate demand that far outstripssupply. This imbalance shows up in public finance difficulties leading todomestic payment arrears, in external balance deficits covered by debtservice arrears, and in banking system insolvency that has reducedfinancial intermediation to a trickle.
3. Real GDP growth over the period since 1983 has averaged 2.7percent only because of an exceptional performance of cotton and food cropsin 1985. With deterioration in the international terms of trade (duemainly to declining cotton prices), the impact of that performance onincomes was lessened. As a result, given the high level of consumptionexpenditures, domestic savings, even when positive, remained below 1percent of GDP. Gross domestic investment equivalent to 10.7 percent ofGDP was managed, but with financing almost exclusively from externalsources.
4. This weak economic performance has been accompanied bydeteriorating public finance and balance of payments, with the consequenceof growing domestic and international payments arrears. In spite of amodest recovery in revenues in 1985 and reduced capital expenditures since1984, the fiscal deficit as a percent of GDP has averaged about 7 percentover the period 1984-86. In none of these years could smooth financing ofthe deficit be arranged and arrears occurred. In external transactions,debt service due continued to exceed the means for meeting it, leading tothe accumulation of external arrears of about CFAF 30 billion per yearduring 1984-86. These unmet obligations, in their turn, threaten to weakenparts of the economy further by reducing the flow of financial resources.

- 2 -5. The Government became concerned over the poor performance of thepublic enterprise sector, as early as 1982. It then decided on a number ofmeasures towards rehabilitating the sector, implemented some immediatelyand developed the remainder into a broader reform program. That broaderattack on the problems of the public enterprises is just getting under way,with the support of an IDA credit. But there is vastly more to do toadjust the economy to the changed environment and, thereby, to prepare itto effectively use its growth opportunities once the wider internationaleconomic situation improves. In the short term, the excess domestic demandmust be brought in line with sustainable net external inflows. This wouldbe followed by the introduction of structural, market and institutionalreforms needed to elicit improved resource allocation in both the privateand public sectors. In the medium- to long-term, investible public sectorresources should be targetted to areas where, in conjunction withappropriate policy changes, they facilitate higher growth performance.
6. The IMF and the World Bank have assisted the Government toexamine these issues. Two Bank missions, undertaken in November 1986 andJune 1987 respectively, examined developments in public expenditure with aview to identifying ways in which the Government might use the managementof its resources to help bring about the needed adjustment. This reportpresents the findings of those missions.
7. The report is organized in five sections treating, respectively,budgeting procedures, budget execution procedures, current expenditure(consumption), capital expenditure (investment) and external financingflows. A listing of the main recommendations appears in Chapter III. Anannex on sectors analyzes the issues and sectoral priorities worthconsidering in the formulation of policies and the allocation of investableresources over the next few years.
B. Budgeting Procedures
8. In the middle of each year, the Budget Commission is set up bypresidential decree to prepare the following year's current budget andinvestment program. That Commission works in two subcommissions - aresources subcommission and an objectives subcommission. Under thedirection of the Minister of Finance and Economy, the resourcessubcommission reviews overall resource prospects (receipts of the Treasuryand the Caisse Autonome d'Amortissement (CAA), other miscellaneousreceipts, external grants and loan disbursements). The objectivessubcommission works under the supervision of the Miuister of Planning andStatistics to propose a pattern of expenditures. The draft budget andinvestment program prepared by the Budget Commission are submitted to thepolitical authorities together with a report (Rapport de Presentation),that summarizes the thought process underlying the Commission's work.
9. The summaries of the work of the Budget Commission which arepresented in the RaRport de Pr6sentation show that the Commission workswith little flexibility. The language in the report is kept fairlystandard, and the Commission does not paint a realistic picture ofdevelopments and make appropriate recommendations. Since the onset offinancial difficulties in 1983 that shortcoming has become quite glaring,and the Budget Commission's work has become less and less relevant to the

- 3 -
actual fiscal situation. If the budgeting process is to become credibleagain and the budgets useful tools of fiscal management, changes will haveto be made in at least three areas: estimation of receipts, recognition ofexpenditure obligations, determination of budgetary equilibria.
10. Estimation of receiRts. Estimates of Treasury receipts havealways been overly optimistic. Over the eight year period, 1979-86inclusive, actual receipts were below estimates in all but two exceptionalyears -- the percentage shortfall averaging 17 percent per annum. 1/Quite often, the overestimates occur when the revenue officials are askedto come up with more receipts than were forecast in first-round estimateswithout new taxes being levied. The practice leads to the budgeting ofparts of expenditure against fictitious income.
11. The persistence ot this revenue overestimation postponescorrective action on the public finance imbalances and puts a question markagainst the Government's readiness to follow declarations with action. Inoruer to makc a break with the past in this area, the revenue departmentsshould be given a free hand in preparing revenue estimates. The revenueservices should sharpen their "spread technique' by which each revenuesub-item is estimated on the basis of the probable performance of its basein the forecast year. And to support them, the authorities should resistthe temptation to call for upward revisions of the initial estimateswithout authorizing the introduction of new taxes. On the basic issue ofmeasures to improve the performance of the tax system, a two-step approachto a solution is recommended. First, the system should be simplified inareas where it has become very complicated, to lighten the burden ofadministration and raise its efficiency. Second, a full reform should beundertaken as part of a global reform program. The fiscal system reportprepared by the IMF mission of October 1985 provides valuable advice on howto proceed.
12. Recognition of expenditure obligations. In an attempt to 'budgetonly what it can afford' the National Budget has since 1983 underbudgetedfor materials, supplies and services, and has deliberately chosen not toprovide for portions of the domestic debt service that it could not meet.A similar approach has been u'ed in the Caisse Autonome d'Amortissement(CAA) where budgeted external debt service has been set at the level ofresources that the Government has felt should go to meet debt service. Inthe case of the National Budget, since each year's budget appropriationsare based on the previous year's appropriations and not the actualexpenditure, the problem has got worse from one year to the next. Theprocedure makes expenditure plans unreliable, a phenomenon that diminishesthe value of the budgeting exercise.
1/ When the two windfall years of 1981-82 are excluded, the averageshortfall becomes 26 percent.

- 4 -
13. This issue can be dealt with through changing the wayexpenditures are budgeted and the actuals reported. There is nothing wrongwith budgeting low amounts as long as they represent the probable level ofexpenditure. In fact it is absolutely necessary that for wages as much asfor materials, supplies and services, the needs be pared down to theminimum necessary for efficiency. In the case of wages, after assessingthat need on the basis of an accurate personnel roll, such as the one to beprepared with the civil service census (paras. 23-24), and in the case ofmaterials, supplies and services, determining the minimum necessary on thebasis of past actuals, full appropriations should be made to cover them.Similarly, with debt service, the full minimum required by contractualobligations must be budgeted. In this way, the authorities will have abetter appreciation of their obligations when they decide on the allocationof the means of meeting them. It would also permit them to develop aclearer picture of the arrears when some of the obligations remain unmet.
14. Determination of budgetary equilibria. Owing to a Monetary Unionregulation forbidding the presentation of unfinanced gaps in the votedbudgets of the member states, the Beninese National Budget is drawn up insuch a way as to show an equilibrium between receipts and expenditures.Indeed, the overstatement of receipts and the underbudgeting of non-wagecurrent expenditures occur in part because of the need to present a budgetin equilibrium at all costs. As has been the case in the past few years,that practice has contributed to the inclination to conceal deficits which,in turn, leads to the avoidance of the hard decisions necessary to dealwith a chronic deficit situation.
15. The real purpose of the UMOA regulation about the voted budgetbeing in equilibrium is not that the deficits be covered up but rather thatthey be addressed during the budget preparation. The repeated difficultiesencountered during the execution of a budget inherently in disequilibriumdemonstrate the futility of the artificial upward adjustment of receipts inorder to present a balanced budget. The area in which to begin makingimprovements in public finance management is at the planning stage. Asfar as budget equilibria are concerned, they ought to be achieved byaddressing any imbalances that emerge from realistic budgeting. In the2ontext of the current budget, addressing a deficit consists InA4entifying a combination of previously accumulated resources, statutorilyavailable banking system credit, and fiscal measures that together wouldsuff ce to cover the gap during budget execution. (See Table 1, Page 7).
C. Budget Execution Procedures
16. The budget is executed through the Budget Directorate which makescommitments and authorize3 payments to be made by the Treasury. The BudgetDirectorate keeps the records on commitments it makes as well as onobligations referred to it but for which it is unable (often owing tofinancial constraints) to establish commitments. The Treasury, in turn,keeps records of payments made as well as of commitments made by the BudgetDirectorate but on which the Treasury is unable to make payments. Thus atany point in time, Treasury records provide a full picture of budgetary

- 5 -
expenditures paid and the Budget Directorate records provide fullinformation on committed budgetary expenditure. In order to obtain acomplete picture of all budgetary expenditure obligations and determine thecorrect level of expenditure arrears, however, one has to take into accountuncommitted obligations at the Budget Directorate as well as the committedbut unpaid obligations held by the Treasury. Further, the quality of theserecords, and hence the information base for monitoring expenditures, suffertwo additional shortcomings: the incomplete coverage of expenditureobligations referred to in para. 12, and the ineffective integration ofcapital expenditures with current expenditure.
17. Expenditure record keeping. As a matter of course, the BudgetDirectorate refuses to establish commitmenits unless it is reasonablycertain that the obligations can be met. This method of expenditurecontrol works well where commitments are obtained before expenditures aremade. It fails to achieve its purpose where the obligations reported tothe Budget Directorate are obligations already incurred. This is often thecase with services and utilities. The failure to recognize the obligationsincurred in these areas creates understatement of expenditures and leads ttunrecognized expenditure artears. Clearly, expenditure monitoring andcontrol would be improved by replacing current practices with the budgetingof realistic appropriations by expenditure unit, on one hand, and thecomprehensive commitment and monitoring of the use of the appropriations,on the other.
18. Budgetary Codes. The capital expenditures made by the Treasuryare not yet recorded according to budgetary codes similar to those used forcurrent expenditures. This makes it impossible to classify budgetarycapital expenditures by function as is the case with current expenditures.The work currently underway towards the unification of the nomenclature ofboth parts of the budget through the creation of budgetary codes forinvestment expenditures is a step in the right direction. However, thedraft codes prepared so far have one major shortcoming: they mix theeconomic and functional classification of activities, and their use in thepresent form would limit the value of the records for analytical work. Abetter approach would be to use Titles to cover the economic classification(transfers, portfolio investments, investments in tangible assets),Chapters to cover functional classification (defense, education,agriculture, etc.) and Articles to cover sub-components under thefunctional categories (studies, construction, etc.)
D. Current Expenditure/Consumption
19. One effect of the expansion of the Government's role in theeconomy was an increase in current expenditures to a point where they areno longer sustainable. By 1985, current non-debt expenditure was absorbing94 percent of current receipts, of which personnel 67 percent. This madeit impossible for the Government to contribute adequately to the financingof the investment program and meet its debt service obligations. Theimbalance got worse in 1986, with current non-debt cxpenditure commitments

exceeding receipts by 20 percent. An examination of the evolution of thevarious components of current expenditure is revealing.
20. Wages and Salaries. Current expenditure became non-sustainablebecause of the surge in its wages and salaries component after 1980, as thenumber of civil servants rose and unit wage rates were raised. Accordingto budget data, the number of employees (excluding the military) covered bythe Budget de Fonctionnement rose from 29,517 in 1980 to 40,290 in 1986, anannual rate of 5.3 percent. In addition, salary measures taken in February1980, October 1980 ard December 1981, raised individual wages. Inconsequence, the wage bill went from CFAE 15.051 billion in 1980 to anestimated CFAF 43.716 billion in 1986 -- implying an annual rate ofincrease of 19 percent. These increases (for personnel, higher than thelabor force growth rate of about 3 percent and for average wage rates,higher than the annual rate of inflation of about 8 percent) may haveappeared affordable during 1980-82, when the Treasury experienced windfallgains as a result of increased trading opportunities with Benin'sneighbors.
21. As events since 1983 have shown, however, the improvement inBenin's trading opportunities with neighboring countries as a result ofpositive shifts in the terms of trade of those countries is a transientphenomei'on. The expansion of the personnel expenditure (which is notreadily compressible in case of need) was an inappropriate response. Inthe absence of drastic corrective action, all possible scenarios about thefuture point to non-sustainability of the expenditures.
22. We examine one such scenario by projecting the currentexpenditure outlook over the period 1987-90 under the followingassumptionst
(i) real GDP grows at 2-3 percent per annum;
(ii) personnel expenditure rises annually at 10 percent;- about half the rate that prevailed during 1980-86, andequivalent to 1.5 percent real increase and 8 percentinflation.
(iii) supplies and services expenditure grows at about 5 percent perannum;
(iv) revenue performance remains at the post-1982 rate of 11-12percent of GDP.

- 7 -
The general results appear in Table 1 below:
Table 1. Benin: Projected Current Expenditure Trends. 1987-90(In billions of CPA francs)
1987 1988 1989 1990
Revenue 2/ 60.6 65.7 71.6 78.2Current Non-debt Expenditure 64.4 72.4 83.3 95.9Wages and Salaries (48.4) (55.6) (64.0) (73.7)Supplies and Services (16.0) (16.8) (19.3) (22.2)
Current Surplus -3.8 -6.7 -11.7 -17.7…----------------------------------------------------------------__--------
23. These results predict increasing chaos in the public finances ifcurrent policies remain unchanged. They indicate the continuance of asituation where economic management capacity would have to focus onmonth-to-month worries about meeting personnel expenditures, to thedetriment of reflection on longer-term growth and development policyissues. These will coexist with growing payment arrears on services andsupplies consumed and on debt service, while no current savings areavailable to contribute to financing capital expenditures. Correctiveaction by the Government must proceed from a recognition of the origins ofthe imbalances.
24. In the short run, there is a basis for corrective action toadjust the government employee-labor force and government wage-per capitaincome ratios of today, towards proportions that proved sustainable in the1970s. According to a study on government employment and pay released bythe IMF in 1983 3/ , Benin had in 1979 one of the lowest ratios ofgovernment employees-to-population among 16 African countries in thesample. In terms of government average wage-to-per capita income, however,Benin ranked third highest in the same sample of 16 countries. That isnotwithstanding the fact that Benin has one of the lowest absolute wagelevels in the Western Africa forest zone. What happened during 1980-86 wasa deterioration that raised the employee-to-population ratio whilemaintaining the already exorbitant average wage-per capita income ratio.
2/ Consolidated central Government Revenues of Treasury and CA-M combined.
3/ Heller P. S. and A. Tait, "Government Employment and Pay: SomeInternational Comparisons," International Monetary Fund, Washington,D.C., October 1983, revised March 1984.

- 8 -25. The census of civil servants carried out in November-December1986 offers an opportunity for streamlining the wage roll by eliminatingirregularities. The preliminary results indicate that a total of some57,000 civil servants and military personnel were enumerated. The wages(including wage-related allowances) paid out for the month of November cameto about CFAF 2.5 billion. If we take into account the 20 percentcontribution to the National Pension Fund (14 percent from the Governmenton behalf of each employee and 6 percent retained at source for each civilservant) and the further 6 percent withheld as income tax on wages, weobtain a gross monthly wage total about CFAF 3.0 billion. On an annualbasis, this implies a wage bill of under CFAF 37.0 billion for thosecounted and paid. Compared to estimated personnel expenditure commitLentsfor 1986 of about CFAF 44 billion, even allowing for about 1000 individualsthat were counted but not paid, the preliminary findings of the censussuggest that the possibility exists for achieving some savings through anoverhaul of the personnel budget. This overhaul can be carried out bypreparing a new personnel budget, starting from a zero base for eachministry and using the names and wage levels recorded during the census asthe basis. Other deliberate outlays which may account for part or all thedifference between CFAF 44 billion and CFAF 37 billion ought to be budgetedseparately. That way the issue of whether they can be afforded or not canbe confronted as is the case for any other outlay, during the course ofbudgeting.
26. In the longer term, the new personnel roll to be developed out ofthe census records should enable the Government to eliminate former payrollirregularities. Subsequently, personnel and wage increase decisions shouldtake into account the fact that the sustainable growth rate of receipts ismodest and that beyond wages, current receipts must also pay for goods andservices and pay part of capital expenditure.
27. Materials, Supplies and Services. Normally, with the risingnumber of civil servants, the need for materials, supplies and servicesshould also increase. In reality, however, the growing personnelexpenditures in the face of stagnant receipts squeezed the allocations formaterials, supplies and services. The underbudgeting for materials,supplies and services got progressively worse as the crowding out becamemore severe.
28. In 1980, an amount of CFAF 4.3 billion was budgeted for goods andservices and an amount of CFAF 5.1 billion was spent. Between 1981 and1986, the annual budget for this category of expenditure remained at aboutCFAF 5.0 billion on the average, while actual need rose progressively toabout CFAF 15.0 billion. Some of that need was met by increasing theobligations and not paying for them. The budgetary practice ofacknowledging only that portion of the obligations likely to be honoredexacerbated matters by constantly underrepresenting the needs and causingunderbudgeting. The effects have been the weakening of the performance ofparts of the civil service and the accumulation of payment arrears onservices such as the utilities.
29. The issues on which the authorities should focus here are theeffects of the underprovision of material and supplies, on one hand, and ofthe build-up of expenditure arrears on services, especially utilities, on

- 9 -
the other. The one limits the proper functioning of Government; the otherprogressively impairs the financial health of the public utility companies.The solution lies in containing, if not reducing, personnel expenditures inorder to make room for reasonable levels of expenditure on materials,supplies and services.
E. Capital Expenditure/Investment
30. When the public sector finances weakened after 1982, the responsein trimming down the puhlic investment program was not decisive. Instead,the annual programs remained closely linked to the tranches of the ratherambitious 1983-87 development plan. The response consisted of the adoptionof a two-part programming system in 1984 by which annual programs preparedthrough the first half of 1986 attempted to order priorities in a mainprogram and an alnex. This approach, however, was unsuccessful as thepriority of the main program over the annex was not respected duringprogram execution. Both parts of the program were executed concur-rently. 4' The result was a combination of low overall program executionrates and dectoral resource allocation not in conformity with preferencesrevealed in the first priority program.
31. A definite improvement was made in the programming of investmentexpenditures when in July 1986 a revised program was adopted containingprojects that were screened more carefully, with an overall expenditurelevel more in line with financial and technical constraints. The greaterrealism of the revised 1986 program is reflected in the fact that some 64percent of the programmed expenditure was attained, as against about 30percent during 1984-85. The sectoral distribution of the realisedexpenditures also closely followed the program.
32. For 1987, the authorities used the same principles as for therevised 1986 program to produce an investment program that is qualitativelysound. In other respects, however, the programming of capital expendituresfaces another challenge which arises from the weakened broader financialsituation, namely, the availability of investible domestic resources.
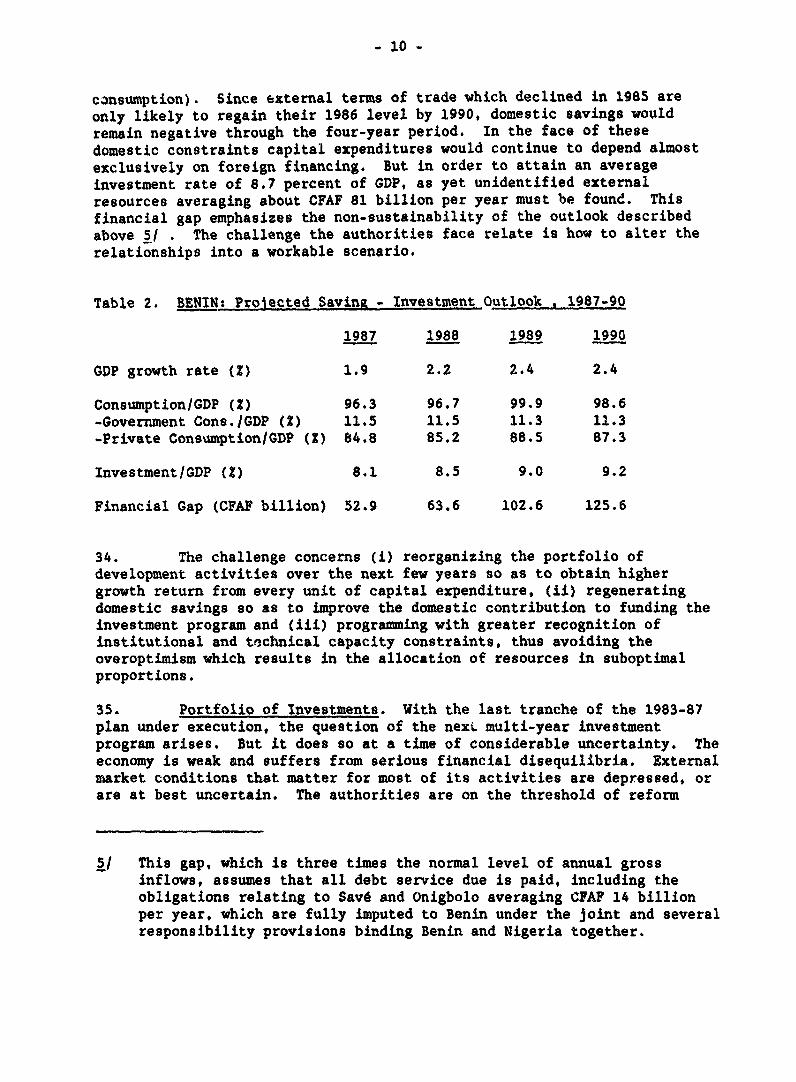
33. The projected savings-investment outlook for 1987-90, assumingunchanged policies, points up the nature of that challenge. Theserelationships, which are summarized in Table 2, show a framework consistingof a fairly high marginal productivity of investment (ICOR of about 4:1),and a real GDP average growth rate of 2.2 percent requiring an averageinvestment ratio of 8.7 percent per annum. We assume that the growth ofreal government consumption slows down to a rate of 1.5 percent per annum,in order to maintain a constant 11.4 percent share in GDP. Privateconsumption grows at 2.4 percent (implying a gradual fall in per capita
41 See Benin: Public Investment Review, IBRD Report No. 5910, November1985.
- 10 -
consumption). Since external terms of trade which declined in 1985 areonly likely to regain their 1986 level by 1990, domestic savings wouldremain negative through the four-year period. In the face of thesedomestic constraints capital expenditures would continue to depend almostexclusively on foreign financing. But in order to attain an averageinvestment rate of 8.7 percent of GDP, as yet unidentified externalresources averaging about CFAF 81 billion per year must be found. Thisfinancial gap emphasizes the non-sustainability of the outlook describedabove 5/ . The challenge the authorities face relate is how to alter therelationships into a workable scenario.
Table 2. BENIN: Projected Saving - Investment Outlook . 1987-90
1987 1988 1989 1990
GDP growth rate (C) 1.9 2.2 2.4 2.4
Consumption/GDP (Z) 96.3 96.7 99.9 98.6-Government Cons./GDP (Z) 11.5 11.5 11.3 11.3-Private Consumption/GDP (X) 84.8 85.2 88.5 87.3
Investment/GDP (2) 8.1 8.5 9.0 9.2
Financial Gap (CPAF billion) 52.9 63.6 102.6 125.6
34. The challenge concerns (i) reorganizing the portfolio ofdevelopment activities over the next few years so as to obtain highergrowth return from every unit of capital expenditure, (ii) regeneratingdomestic savings so as to improve the domestic contribution to funding theinvestment program and (iii) programming with greater recognition ofinstitutional and technical capacity constraints, thus avoiding theoveroptimism which results in the allocation of resources in suboptimalproportions.
35. Portfolio of Investments. With the last tranche of the 1983-87plan under execution, the question of the nexi multi-year investmentprogram arises. But it does so at a time of considerable uncertainty. Theeconomy is weak and suffers from serious financial disequilibria. Externalmarket conditions that matter for most of its activities are depressed, orare at best uncertain. The authorities are on the threshold of reform
5/ This gap, which is three times the normal level of atnual grossinflows, assumes that all debt service due is paid, including theobligations relating to Save and Onigbolo averaging CFAF 14 billionper year, which are fully imputed to Benin under the joint and severalresponsibility provisions binding Benin and Nigeria together.

- 11 -
programs that would help address the issues posed. It would appear thatapart from realism and project quality a key attribute for a multi-yearinvestment program would be flexibility. As to program type, theauthorities should perhaps seriously consider making the next multi-yearprogram a 3-year rolling program. With regards to cortent, we presentbelow in the Sector Annex a review of the current portfolio and offersuggestions as to priority activities, including rehabilitation of thecotton subsector, fuller development of the foodcrop production potential,and rationalization of the industrial sector.
36. Investible Savings. Next, efforts must be made to regenerate thepublic savings needed for domestic contribution to the financing of theprograms. On the basis of the composition of total costs as prescribed bythe financing agreements of various projects, we estimate the requiredcontribution to the financing of recent public investment programs at 10-12percent of planned expenditures. In line with these counterpart fundingarrangements, the 1987 investment program requires an amount of CPA? 6billion in government contribution. The program actually provides for onlyCFAF 2.9 billion. Since the overall financial situation of the Governmentis one of net dissaving in 1987, even the provision of CPA? 2.9 billion incounterpart funds would be at the expense of the supplies budget and/ordebt service. The above picture underscores the fact that the issue isreally one of curbing and containing public consumption expenditure so thatother public expenditure needs can be accommodated.
37. We saw earlier that the results of the census of civil servantsoffers the opportunity for an immediate attack on the wage bill issue. Thepreparation of a new personnel budget from the zero base offered by thecensus records will be a first action to curb personnel expenditures and,hence, consumption. The creation of new personnel rolls out of the censusdata, the institution of rigorous personnel management practices and ageneral shift away from wholesale to selective public sector employment arecomplementary steps towards containing future growth of public sectorconsumption.
38. Tranching with Greater Realism. Finally, the annual tranching ofprojects should be done with greater realism, so that the limited financialresources available are allocated among the priority projects in theproportions in which they are most likely to be executed. In 1985, whenthe two-part investment programming practice was still in effect, themeager domestic savings affordable in that year were allocated throughout aprogram of which only 35 percent could be executed. This approach clearlytakes no account of relative priorities within the program. In 1986, about80 percent of the revised program was executed -- a vast improvement over1985 in terms of the implied quality of resource allocation. Still morerea'istlc programming of this nature -- of tranches of priority projectsrather than across the board -- will be the means to further improvementin t-he allocation of the available investible resources.

- 12 -
P. Net External Financing
39. When capital expenditures fell to more modest levels after 1982,gross disbursements from foreign loans also fell. At the same time, withthe grace period ended for the loans to the Sav6 sugar, Onigbolo cement andS4md projects, scheduled debt service surged upwards. Together, thesefactors ushered in a period of potential negative net external financingflows.
40. In 1983, the year in which the last of the large projects wascompleted, scheduled debt service was CFAF 9 billion. With the star% ofthe repayment phase of the loans to rhe large projects, scheduled debtservice reached an average of CFAF 40 billion during 1984-86. Over thesame period, gross disbursement declined from CFAF 44 billion in 1983 to anaverage of CFAF 17 billion during 1984-86. The implied negative transfersin 1984-86 were avoided through the accumulation of arrears on the externaldebt payments. But the arrears themselves (totalling about CFAF 99billion at end-1986, including Save and Onigbolo debts) now threaten futuredisbursements on the loans already in the portfolio.
41. The outlook for the period 1987-90 gives urgency to action onsecuring the continuance of positive net foreign flows. Scheduled debtservice during the period 1987-90 averages CFAF 39 billion (Table 3) asagainst future disbursements out of existing loans of CFMF 22 billion.This implies potential negative net transfers averaging CFAF 17 billion.The challenge faced here concerns how to manage the net external flows incombination with domestic efforts to support target levels of investment.In the near term, the issue simplifies to one of how to raise domesticsavings to a level. where they can cope with debt service, reduced to theminimum through negotiation with external financiers. On the one hand,this touches on the need to contain consumption. On the other, it relatesto the need to seek restructuring of debt to reduce the payments fallingdue. But how much of the debt service falling due during 1987-90 can berescheduled?
42. Over the period in question, payments due to multilateralcreditors and non-OECD bilateral creditors average CFAF 1C billionannually. The multilateral debts are non-reschedulable ViL existingpractices. The non-OECD bilateral debt may be renegotiated on acase-by-case basis, but in lieu of any indication as to what Benin may beable to work out with this category of creditors, we exclude their debtfrom this part of the analysis. The remainder -- combined payments ondirect debt owed to OECD governrents and banks and suppliers, the latterwith insurance from official export credit institutes -- amounts to aboutCFAF 29 billion annually. But these estimates include the full scheduledpayments on the debts of the Save and Onigbolo projects, in line with thejoint and several obligations that Benin faces with Nigeria.

Table 3. BENIN: PROJECTED EXTERNAL DEBT SERVICE, 1987-90(In Billions of CFA Francs)
Principal Interest Total
CREDITOR 1987 1988 1989 1990 1987 1988 1989 1990 1987 1988 1989 1990
TOTAL(excl. BCEAO) 31.589 30.085 27.051 24.618 13.540 11.S92 9.919 8.198 45.129 41.878 36.970 32.817
MULTILATERALS 4.188 S.4S9 5.401 5.710 2.367 2.5S 2.827 2.585 6.s54 8.025 8.028 8.294
(of which IDA) (0.204) (0.285) (0.328) (0.397) (0.586) (0.628) (0.BS2) (0.889) (0.790) (0.912) (0.980) (1.086)
OECD 26.001 22.774 19.113 18.887 10.828 8.704 7.010 5.374 38.830 31.478 26.123 22.046
OECD(Direct) 2.377 2.873 3.144 3.470 1.758 1.793 1.754 1.822 4.144 4.868 4.898 5.096
OECD(Indirect) 23.624 19.901 15.989 13.197 9.062 6.911 5.258 3.752 32.686 26.812 21.226 18.949
of which debtors:
SSS (8.275) (8.275) (6.275) (6.275) (3.748) (3.277) (2.807) (2.338) (10.023) (9.5S3) (9.082) (8.811)
SCO (2.816) (2.816) (2.818) (2.020) (1.551) (1.340) (1.129) (.708) (4.388) (4.156) (3.945) (2.729)
Seme (11.119) (7.750) (4.381) (2.456) (2.957) (1.641) (0.807) (0.288) (14.076) (9.391) (6.188) (2.745)
OTHER 1.400 1.852 2.537 2.239 0.345 0.323 0.282 0.239 1.746 2.1.5 2.819 2.478
East Bloc 1.031 1.483 1.935 1.637 0.149 0.116 0.079 0.045 1.180 1.698 2.014 1.682
Africa 0.195 0.196 0.195 0.195 0.009 0.007 0.008 0.005 0.204 0.202 0.201 0.290
Kuwait 0.174 0.174 0.407 0.407 0.188 0.200 0.197 0.188 0.381 0.375 0.05" 0.596
Note: OECD Indirect covers private-source debt guaranteed by creditor country official institutions.

- 14 -
43. In January 1987, Nigeria rescheduled its debt to the OECDcreditors and the debts of Sav4 and Onigbolo were 'rescheduled to theextent that the guarantee of the Government of Nigeria is invoked."Although no clear interpretation of the reference to the debts of Sava andOnigbolo is as yet available, we may assume that the action clears the wayfor Benin and Nigeria to pay the debt according to new schedules but in theproportions in which they own the companies' capital. In addition to theassumption, therefore, that Benin henceforth will be responsible for about51 percent of the debts of Save and Onigbolo, we assume the following:
(i) all OECD direct and indirect government debt is rescheduledrecurrently (here, one year at a time) over the period 1987-90;
(ii) 100 percent of the principal and interest due each year isconsolidated over a period of 20 years including 10 years ofgracet
(iii) a moratorium interest rate of 5 percent per annum is applied toall postponed payments. 6/
Under these assumptions, the debt service to be met during the period1987-90 falls to an annual average of CPAF 13 billion. The distribution bytime and by creditor is as in Table 4.
6/ These assumptions are illustrative. They do not preclude thepossibility of Benin obtaining more favorable conditions.

Table 4. BENIN: DEBT SERVICE AFTER POSSIBLE RESCHEDULING, 1987-90(In Billions of CFA Francs)
Principal Interest Total
CREDITOR 1987 1988 1989 1990 1987 1988 1989 1990 1987 1988 1989 1990
TOTAL(incl. BCEAO) 8.688 9.305 10.716 18.706 8.324 e.823 7.098 7.207 12.989 18.129 17.813 23.912
TOTAL(excl. 8CEAO) 8.B88 9.305 10.715 11.30B 3.084 3.683 3.858 3.967 9.749 12.889 14.573 15.272
MULTILATERALS 4.188 6.469 5.401 5.710 2.387 2.S86 2.827 2.S85 8.5U 8.025 8.028 8.294
(of which IDA) (0.204) (0.284) (0.328) (0.397) (0.586) (0.828) (0.685) (0.889) (0.790) (0.912) (0.980) (1.068)
BILATERALS 2.478 3.846 5.314 S.598 0.717 1.018 1.231 1.382 3.196 4.884 6.545 8.978
OECD 1.078 1.994 2.777 3.357 0.372 0.895 0.949 1.143 1.460 2.889 3.726 4.500
Direct (0.119) (0.283) (0.420) (0.593) (0.088) (0.178) (9.2W8) (0.347) (0.207) (0.441) (0.888) (0.940) 1
Indirect (0.959) (1.731) (2.357) (2.784) (0.284) (0.517) (0.888) (0.798) (1.248) (2.248) (3.040) (3.560) u
OTHER 1.400 1.862 2.6B7 2.2B9 0.845 0.823 0.282 0.289 1.746 2.176 2.819 2.478
East Bloc (1.031) (1.483) (1.985) (1.8B7) (0.149) (0.115) (0.079) (0.046) (1.180) (1.598) (2.014) (1.882)
Africa (0.196) (0.195) (0.196) (0.195) (0.009) (0.007 (0.00W ) (0.005) (0.204+ (0.202) (0.21) (0.200)
Kuwait (0.174) (0.174) (0.407) (0.407) (0.188) (0.200) (0.197) (0.188) (0.31) (0.875) (0.615) (0.596)
aCEAO 0.000 0.000 .000 6.400 8.240 3.240 3.240 8.240 8.240 8.240 8.240 8.640
Note: OECD Indirect covers private-source debt guaranteed by creditor country official institution.

- 16 -
44. The effect of the above rescheduling scenario would be areduction in the scheduled average annual payments (principal plusinterest) from CFAF 39 billion to CFAF 13 billion. It implies a conversionof average annual negative net inward transfers of CFA? 17 billion intopositive net transfers of CPAF 9 billion. But there is an additionalbenefit to be expected from the reorganization of the debt schedules withexternal creditors and, as a consequence, the orderly resumption ofscheduled payments. The smoothened relationships will pave the way for newcommitments and, hence, an increase in the volume of gross inflows.
45. There is, however, one condition which Benin has to meet to makedebt restructuring possible. That condition for debt rescheduling is theexistence of a program of financial stabilization into which the debtrelief can be integrated. The essence of such a program is that it shouldrepresent a framework aimed at financial recovery, including the orderlyresumption of debt payments. And this should be done within a context ofrenewed growth.
46. Once the debts are restructured, some extra effort would beneeded to comply with the new schedules. This is because thepost-rescheduling average annual payments slightly exceed the average ofthe pre-rescheduling period when most of the payments falling due onOECD-source commercial debt simply went into arrears. Under rescheduling,Benin would pay on the average some CFAF 1 billion more than it does atpresent. However, since the post-rescheduling amounts start out smallerthan the average of CPA? 13 billion, the extra effort would becomesignificant only after 1988. Another dimension of the issue of the capacityto meet the rescheduled payments relates to the very real possibility ofthe postponed payments simply reappearing as an insurmountable hump in theearly-to-mid 1990s. The way to avoid such an occurrence is for Benin andthe donors to ensure that the program of reforms in which the reschedulingsare intergrated and the terms of such reschedulings lead to improvedeconomic performance on one hand and a manageable debt profile on theother, as envisaged in the current IMP-Bank initiative.
47. Up to this point, we have considered Benin's external debtportfolio without taking into account the debt of the public enterprises tothe domestic banking system, which is in turn a debt to the Banque Centraledes Etats de l'Afrigue de l'Ouest (BCEAO). Since preliminary discussionshave concluded that the Government would accept responsibility for thatdebt and service it according to an agreed schedule, the structure of theimplied debt service ought to be included in the debt service schedulesdiscussed earlier. That debt is estimated at CFAF 54 billion 7/ (Banque
7/ This amount has been given at levels varying between CFAF 43 billionand CFAF 54 billion. Part of this amount is the accumulated penaltyinterest on principal overdue. Benin can certainly negotiate theterms cited here, including some write-off of the penalty interest.

- 17 -
Beninoise de Developpement CFAF 18 billion, Banque Commerciale du BeninCFAF 20 billion, and Caisse Nationale de Credit Agricole CFAF 16 billion).Its scheduled payments on a 10-year repayment term including 3 years ofgrace, at 6 percent interest rate are shown in Table 4 above. The effectof the inclusion of the debt to BCEAO in the schedule of possiblerestructured payments is to raise the average annual payments by CFAF 2billion over the 1987-90 period. The potential net inward transfers arealso lower by CFAF 2 billion, indicating that the challenge of restoring asustainable financial framework is all the stiffer when one recognizes theexistence of the banking sys.em debt. This also means that in the interestof ensuring the sustainability of the financial framiework, Benin ought towork towards obtaining on its BCEAO debt rescheduling terms which are moreconcessional than those reflected in the Table 4 above.
48. Furthermore, Table 4 above excludes the repayments to be made insettlement of the arrears of CFAF 99 billion accumulated since 1983 (orCFAF 78 billion if Benin's responsibility for the debts of Save andOnigbolo are limited to 51 percent of the amounts due). A reschedulingworkout would include a schedule for the repayment of these amounts. Thusthe existence of past arrears means that a greater effort will be necessaryto meet the repayments than is evident from considering current maturitiesand interest alone.

- 18 -
III. RECOMMENDATIONS
49. Procedures
- Technicians' revenue estimates should be accepted; no calls for upwardrevisions without new tax measures.
- Budget should cover all valid obligations, except those deferredfollowing negotiations, and imbalances should be explicitly addressed.
- The Budget Commission should have a standing aut.horization to proposemeasures towards eliminating deficits identified in the course of their-work.
- Budget equilibria should be reflected only after measures sufficient toeliminate deficits have been identified, quantified, and integrated intothe budget.
- Expenditure records should cover all commitments - including those likelyto be unpaid in the relevant period owing to weakness of Treasuryposition.
- The classification proposed for the capital budget nomenclature should bealtered to have Titles cover economic classification; Chapters shouldapply to functional classification; and Articles should refer tofunctional sub-categories.
50. Current Expenditure
- The civil census data should be used to prepare a new personnel roll,eliminating past irregularities and achieving a once-for-all reduction inpersonnel expenditures. In addition, regulations on new employment andretirement should henceforth be rigorously applied.
- Allocation for supplies and services should be protected against erosionby personnel expenditures and transfers.
51. Capital Expenditure
- The public sector's consumption expenditure should be contained in orderto raise stavings need as local counterparts to carefully selected highpriority projects.
- In view of several uncertainties and the need for flexibility, the nextmulti-year investment program should be a 3-year rolling plan.

- 19 -
52. Net External Financing
The prospect of negative net external flows should be turned around by
- the preparation of a credible financial recovery program based on aframework of growth resumption,
- the negotiation of debt relief on very concessional terms from externalbilateral creditors on the basis of the economic and financial reformprogram into which it is integrated,
- the negotiation of the banking system debt with BCEAO on the basis of aneconomic recovery plan with a reformed banking sector.

- 20 -
IV. ANNEX - SECTOR OVERVIEW
53. As stated in para. 35 above, in the prevailing environment ofeconomic weakness and strained finances, efforts to regenerate investiblesavings must be accompanied by improved allocation of the modest amounts ofsavings that can be marshalled. Since the current medium-term investmentprogram is in its last year, we are unable to analyze, and offerrecommendations on, the future public investment programs. Consequentlywhat follows is a review of the existing portfolio of investments and therelevant policy issues, with suggestions on areas where attention need tobe paid during the preparation of the next medium-term investment plan.
Agriculture
54. Agriculture remains the sector offering the strongest growthpotential in the economy. It has the resource base and does not suffermuch from the large periodic swings in demand which are the plight of theeconomy's other sectors. Over the next few years, however, that potentialcan only be further developed if both policy and investable resources areused to address issues in the areas of (i) institutional arrangements; (ii)the cotton sub-sector deficit; (iii) foodcrop marketing; (iv) cropdiversification research.
55. Institutional arrangements. The first issue here relates to thedeclining efficiency of the regional rural development organizations - theCARDERs. Introduced in 1972, the CARDER organization's objective was theprovision of extension services to farmers. In that role, the organizationhas proven to be a success. But the progressive involvement of the CARDERsin directly productive (industrial and commercial) activities beyond theiroriginal role is making their tasks overly complex and is overtaxing themmanagerially. In addition, the widening of their responsibilities to coversocial services (health, roads, etc.) without matching growth in theresources put at their disposal has weakened them financially.
56. In the interest of efficiency these trends ougb to be reversed.In fact the temptation to replicate the current organiz 'i * structure ineach province should be resisted. The CARDERs should give primaryattention to the delivery of technical packages to the farmers and theyshould be endowed with the resources needed to accomplish that mission, andthat mission alone. These objectives are being pursued in the Second BorgouRural Development Project being financed by IDA, the Caisse Centrale, andthe West African Development Bank.
57. Cotton Subsector Deficit. The recent supply changes on theinternational market for cotton mean that world market prices will remainbelow the 1983 levels through 1990. Given its cost structure, and thefixed parity between the CFA franc and the French franc, Benin's cottonsubsector faces potential deficits in the face of these price developments.

- 21 -
But with the resources in its price stabilization fund .epleted, thesubsector needs to make cost-saving adjustments if it s to survive theexpected deficits and be able to weather similar shocks in the future.
58. Near-term cost saving measures include: (i) paying for seedcotton according to quality grades; (ii) better handling, storage andginning of cotton so as to raise the fibre recovery ratio from the current38 percent to 41 percent; (iii) better financial management and placementof funds, including transferring of net amounts between SONAPRA and theCARDERs; and (iv) the acquisition of a better market information serviceand sales representation in order to reduce the margin between the wor1dmarket price and the price that Benin receives. These ought to be followedby actions to reinforce the commercial character of cotton production,processing and marketing activities. The steps to be taken here includethe (i) transfer of the ginneries from the CARDERs to a commercial entity;and (ii) the adoption of cost and price mechanisms that price goods andservices marketed in the chain at their true values.
59. Food Crop Marketing. The economy's potential in food cropproduction is constrained by the absence of marketing arrangements thatwould assure producers dependable outlets for their crops and thedisincentive effects of official policy meant to ensure the availability ofaffordable foodstuff in the country's urban centers. The absence ofdependable markets causes the farmers to limit production primarily totheir own needs, in which case marketable surpluses are more incidentalthan deliberate. In turn, with production geared primarily at satisfyingon-farm consumption, the urban centers experience shortages in years i-.which poor weather conditions reduce yields. The latter influence leads toofficial attempts to discourage exports, thus further limiting farmers'market opportunities. Both influences retard the development of Benin'sfood-crop production potentia1 as a structural exporter of food crops.
60. The food crop subsector will increase its contribution to growthonly if food policy ceases to be a limiting factor on the size of theproducers' market and producers' support services improve. An appropriatefood policy for Benin would be one that deals with transient and notabsolute food insecurity, since the zountry is food self sufficient in allbut the extreme drought years. That policy should therefore aim atcombining timely information and rapid access to external supply sourcesinto a mechanism that could fill the occasional shortages. Coupled withthe development of that mechanism scheme would be the liberalization offood crop trade so that farmers take advantage of the extended marketopportunities of export trade. In addition, support services for storageand handling would enhance the capability of the producers to takeadvantage of the wider opportunities.
61. Diversification. Currently, the main cash crops are cotton andoil palm since tobacco, peanuts and shea nuts have become insignificant.But in order to take advantage of ecological variations in differentagricultural zones as well as increase the product mix and reduceagricultural income instability, attention must be focussed on crop

- 22 -
diversification. Research will have to be geared towards investigatingwhether, where and how the cash crops that have dwindled in significancecan be revived, and to examine the prospects for other crops such as cocoa,coffee and coconuts.
62. From the foregoing, we may conclude that the next crop ofinvestments in the agricultural sector shouldt (i) avoid replicating thepresent institutional structure in the rural development projects; inparticular the CARDERs should be enabled to concentrate on the delivery ofextension services; (ii) break the storage and marketing bottleneckslimiting the fuller development of the economy's food crop potential; (iii)explore the means to diversify Benin's range of cash crops. A generalagricultural services project would address the sector support issues andresearch now crop possibilities. This could be followed by projects todevelop food crops and other cash crops proved suitable in the meantime.
Energy.
63. In the energy subsector, current efforts center on thedevelopment of domestic sources of electric power (the NangbetoHydroelectric Project) and the recovery of petroleum deposits firstdiscovered in 1978 (Seme Oilfield project). The Nangbeto project entersits productiva phase in 1988 and the Sbmb project's currently provenreserves run out in 1992. Now, some thought has to be given to what thenext set of activities in the subsector should be.
64. In the area of fossil fuels, further activities would be theexploration for oil in the areas adjoining the presently producing fieldsand the investigation and commercial development (if warranted) of the gasdeposits below the S&mb oil reserves. Earlier plans to involve the privatesector in this activity should be revived as soon as practicable. In thecase of electric power, possible new activities are the development offurther generating capacity by the construction of smaller dams furtherupstream on the Mono river and the investment in an improved distributionnetwork to distribute current production. The investments to exploreextensions to the petroleum field are already programmed. In addition,should the testing of the gas deposits prove the existence of commercialquantities, further investments to develop the field would be appropriate.
65. As to electric energy, further investment in the near term toraise domestic capacity appeers unwarranted for two reasons. First,electric energy will not constitute a constraint on growth any time soon.Second, investing in smaller dams in order to secure domestic supply wouldnot address the presumed reliability issue since the droughts that curbedGhanaian production, and hence supply to Benin, during 1983-84 would hitsmaller reservoirs just as hard and raise their already high unit costsfurther. Hence, in the case of electric energy, it would be more rationalto turn attention over the next five years to strengthening thedistribution network and reducing losses. In fact, if the tests on the gasdeposits reveal comercial quantities, serious thought should be given to

- 23 -
the development of gas for domestic energy purposes along with itqdevelopment for export markets.
Water
66. Current investment activity in this subsector aims at theprovision of potable water for the main regional centers. Even though someof these works are being financed with grants (giving them the appearanceof free goods), their operating and maintenance costs are still a factorthat would determine their viability if not the appropriateness of theinvestments. These regional centers weigh heavily on the financial healthof the national company, the Societe Beninoise d'Eau et d'Electricite(SBEE), owing to their high unit cost-return ratio. As such they are amajor factor in the enterprise contract between Government and the SBEE onthe pacing of new investments in a manner compatible with the orderlydevelopment of the subsector.
67. The present plans for extending rural water development must takeinto account the need for a balance between the provision of the facilitiesand the safeguarding of the ftnancial viability of the executing agencies.In the case of rural water development (for which the Direction del'Hydraulique has responsibility) the constraint (in terms of of budgetaryresources) is as binding as it is in the case of urban center supplies forwhich the SBEE has responsibility. In view of the foregoing, it wouldappear reasonable that the subsector consolidate its current crop of urbancenter investment activities over the next five years rather than add tothem.
Transport
68. Benin's road transport system has a network density that comparesfavorably with the regional average and is adequate for the country'spresent needs. This is all the more so with the on-going pavement of theDassa-Parakou stretch of the north-south axis, making that major arterymotorable year round. Road transport enjoys superiority over rail, beingbetter suited to the country's needs which, outside the north-south axis,are characterised by short distances and absence of the heavy/bulkymaterial that would make railroads a paying proposition. Policy decisionsand investible resource allocation should recognize the inherent advantagethat road transport enjoys over rail and concentrate on maintaining pastinvestments and selective extension of the rural area network as well asthe introduction of greater efficiency in corridor operations. Support forthis orientation is being provided through the IDA credit, and financingfrom the Caisse Centrale and the European Development Fund among others,for the rehabilitation and maintenance of transport sector infrastructure.
Maintenance
69. Over the next few years, when resource constraints are going tobe firmly binding, maintenance of past existing assets should have priorityover new constructions, the net marginal returns from the former being
- 24 -
higher than from the latter. The proposed transport infrastructurerehabilitation provides a vehicle for the efforts.
70. Simultaneously, sector institutions should be invigorated to makethem more efficient. Their personnel rolls ought to be lightened, theiroperations put on commercial footing and their staff's technical competenceregularly upgraded. In support of all the above, policy making shouldfavor competition over regulation, including allowing increasing privatesector participation in the sector's activities. Hence, the next set ofinvestments in the sector should focus ons (i) rehabilitation andmaintenance of existing secto, Infrastructure; (ii) maintenance of therailway to keep it operable until after the opening of the Dassa-Parakouroad when consumers should be entitled to a free modal choice, therebydeciding the final resolution of the road/rail issue.
Telecommunications
71. Major investments were made in this subsector in the mid-1970sbut the local network needed to take advantage of the larger investments ismissing. In addition, the subsector's finances are weak, in part, becauseof low subscriber density to the telephone system and, in part, because ofweaknesses in the postal services that go back to the colonial days.
72. The important needs in the subsector over the next few years arefor the local netiork, improved accounting that separates postal systemaccounts from those of telecommunications proper and improved costrecovery. The next group of investments should support the above areas,the planned expansion of the television network, for instance, should bepostponed till the much later.
Industry
73. The industrial sector witnessed considerable expansion during theexecution of the 1978-83 plan when plants were constructed to producesugar, cement, fertilizer, among others. These efforts have produceddisappointing results because of an assortment of problems including marketlimitations, working capital shortages, inherent design problems and thelack of raw materials. Initiatives made in 1982 to deal with the problemsof the affected enterprises have finally been launched as a detailedprogram of reforms aimed at the public enterprise sector as a whole. Owingto the magnitude of the resources at stake, the application of theresources will have to be resolute be they in privatization, liquidation orrehabilitation of selected enterprises or in the reform of theinstitutional framework or market prices.
74. In conformity with the orientation in the public enterprisesector reform program, the next round of investments should consist of therehabilitation within carefully prepared plan of selected enterprises inwhich the State is retaining shares. A good deal of effort should centeron improving the instituti,nal and policy environment to make it conducive

- 25 -
to the success of the privatisation efforts and generally greater privatesector participation in industrial sector activities.
Education
75. The new educational orientation adopted in 1975 broadened accessto primary education to a larger segment of the population than before and,in so doing, increased the potential demand for post-primary education inthe 1980s. The present bias in the education sector investment programtowards the construction of new middle level institutes is largely inresponse to that outcome. But the quality concerns raised by the 1981national review of the sector and the current financial constraints dictatea rethinking of the education sector policy, especially as a new planperiod approaches.
76. A first consideration is how to improve sector resourceallocation relative to others. Education now consumes about 351 of thecurrent budget but schools remain underfunded. Given present resourceconstraints it is impossible to increase that allocation without seriouslyharming other programs. At this juncture, should the private sector not beencouraged to expand its educational activities that have proved soeffective in technical/vocational training? How about the increased use ofcost recovery to strengthen the role of the market place in allocatingeducational services. A second consideration concerns how to improveinternal efficiency of the sector. The mismatch between the skillsproduced and the demand for trained manpower is one reason why largenumbers of the graduates of public technical/vocational institutes end upin civil service jobs. And new institutes are being constructed whileexisting ones are starved of pedagogic materials. Shouldn't curriculumreform and the proper equipping of existing institutes take precedence overthe construction of new ones? Also should the market place not be reliedupon to re-orient more students towards practicallfunctional disciplines?
Health
77. While the enunciated national health sector strategy parallelsthat advocated by the World Health Organization -- the health pyramid, withprimary preventive services at the base -- recent investment programs haveemphasized secondary and tertiary health services through theconstruction/rehabilitation of hospitals. Admittedly, there is a dilemmahere. A number of provincial hospitals are in utter disrepair and need tobe rehabilitated even though that will be at the expense of expandingprimary, preventive health care. Beyond the rehabilitation andre-equipping of those hospitals, there is a real question about the timingof the construction of new hospitals which are costly to maintain and run,but which are less appropriate as investments a3ainst Benin's epidemiology.The balance should be redressed in favor of preventive health care in thenext plan period.