benefits of enhanced event analysis in datacenter otdr testing
TRANSCRIPT

Benefits of enhanced event analysis in data center OTDR testing
Mark MillerDr. Fang Xu
AFL/Noyes Test & Inspection1

Topics• Overview• Challenges• Techniques and Improvements
2

EVENT ANALYSIS OVERVIEWBenefits of enhanced event analysis in data center OTDR testing
3

Data Center Architecture• Characteristics
– Huge number of fiber runs– Structured cabling uses short jumpers and contains many connectors– Short networks with closely spaced events
• OTDR Requirements– Short Dead Zones are required to characterize fibers and locate faults– Auto event analysis needed to cope with large number of cables
4

What are Events?• Additional structures along a fiber optic
network, such as connectors, fusion splices, optical splitter or macro-bends are called events
• These additional structures leave characteristic “foot prints” on a trace acquired by an Optical Time-Domain Reflectometer (OTDR)
5

Events on OTDR Trace and their Measurements
Event Measurements•Location•Type of Event•Reflectivity•Loss
6

Why Measure Events?• “Tier 2” OTDR testing required by standards
– Data Center: Standard ANSI/BICSI 002-2011 Data Center Design and Implementation Best Practices
– TIA 568-C.3 Connector Spec– ISO/IEC 11801:2010
• Baseline documentation of networks– Certification reports– Future troubleshooting
7

OTDR Event AnalysisAuto Event Analysis
– Computerized finding and measuring of events in optical network from OTDR trace is called Auto Event Analysis
– Fully automatic Event Analysis allows a consistent interpretation of events regardless of user expertise
Manual Trace Analysis– Use of cursors across trace– Time consuming– Subject to human error
8
If you can’t trust the accuracy of an OTDR’s event analysis:If you can’t trust the accuracy of an OTDR’s event analysis:

Manual Event Trace Analysis
9
Move cursors and zoom for each event

EVENT ANALYSIS CHALLENGESBenefits of enhanced event analysis in data center OTDR testing
10

Event Analysis Challenges• Incomplete knowledge of network• Time required to analyze trace• Closely spaced events
– Connector followed by connector– Connector followed by splice– Splice followed by connector
• Accurate determination of start and end of fiber under test– Use of launch and receive cables– Necessity of running a separate calibration test to compensate for length
variations (+/- 10m)• Event types
– Connectors– Splices– Splitters– Macrobends
11

Why Event Analysis Misses Events• Perfect event analysis is not achievable• It is hard to find all events in practice as we also want
limit false events• What conditions can trick auto event analysis?
– Small event magnitude – hard to separate from noise– Close events – limited by used pulse-width– Event sequence – i.e.. non-reflective followed by a
reflective event– Hardware limitation - event during saturation recovery – Algorithm problem – usually seen as missing obvious event
12
1.5 dB
EDZ
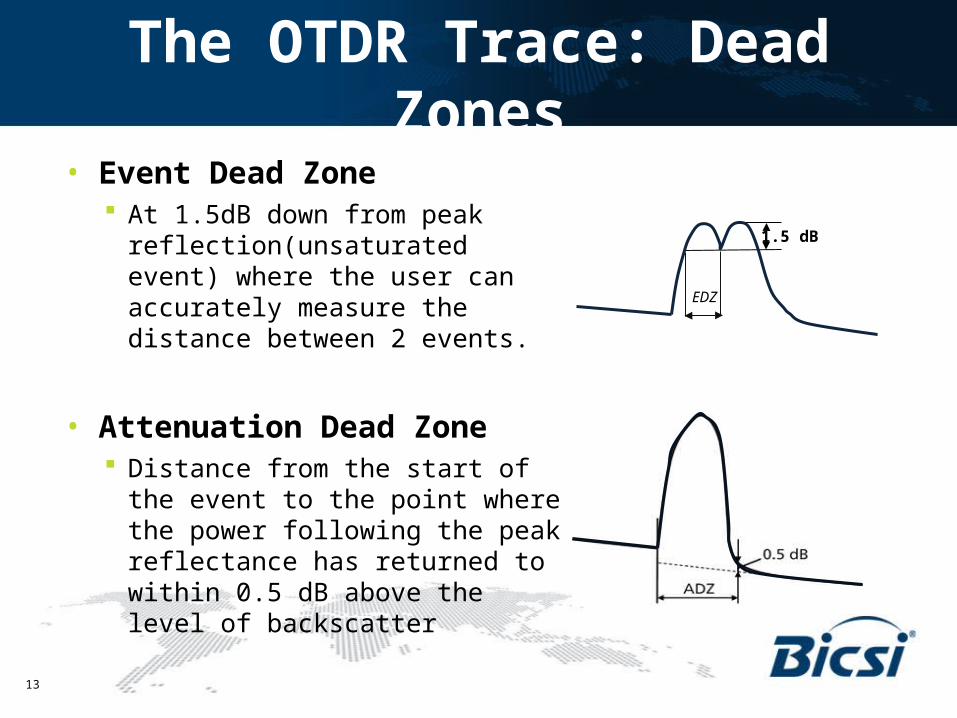
The OTDR Trace: Dead Zones
13
• Event Dead Zone At 1.5dB down from peak
reflection(unsaturated event) where the user can accurately measure the distance between 2 events.
• Attenuation Dead Zone Distance from the start of the event
to the point where the power following the peak reflectance has returned to within 0.5 dB above the level of backscatter

Effect of ADZ on Trace EventsSeparated and “overlapping” events
14
Events with similar reflectance
Separated
Overlapping
Events with different reflectance
Separated
Overlapping

No Industry Event Analysis Specification
• There is no standard method for specifying the performance of auto event analysis
• Good event analysis performance is taken for granted by OTDR users
• Dead zone specifications only apply to the trace
15

Event Analysis Performance Evaluation
• Matched event rate: Are all actual events being detected? This should be as high as possible, with 100% being perfect.
• False event rate: Are false events being detected? This is usually due to noise spikes. This should be as low as possible, with 0% being perfect
• Pass rate: Are the results repeatable when the same network is tested multiple times? This should be as high as possible, with 100% being perfect.
16
Satisfactio
n
Frustratio
n
Confidence

Tools for Event Analysis Evaluation
What people see is a tip of an iceberg: Lab and field testing
17
Fiber networksGolden trace library
Traces collected from different units
Event Regression tool
Performance comparison
Networks description

EVENT ANALYSIS TECHNIQUES AND IMPROVEMENTS
Benefits of enhanced event analysis in data center OTDR testing
18
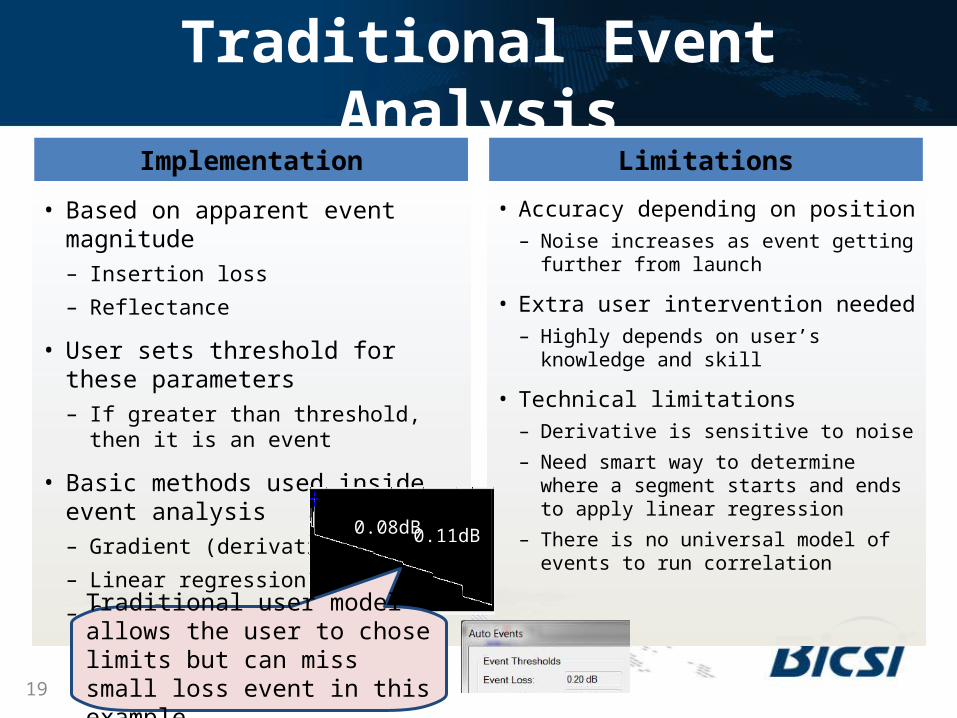
Traditional Event Analysis
• Based on apparent event magnitude– Insertion loss– Reflectance
• User sets threshold for these parameters– If greater than threshold, then it is an
event
• Basic methods used inside event analysis– Gradient (derivative)– Linear regression– Correlation
Implementation
• Accuracy depending on position– Noise increases as event getting further
from launch
• Extra user intervention needed– Highly depends on user’s knowledge and
skill
• Technical limitations– Derivative is sensitive to noise– Need smart way to determine where a
segment starts and ends to apply linear regression
– There is no universal model of events to run correlation
Limitations
19
Traditional user model allows the user to chose limits but can miss small loss event in this example
0.08dB 0.11dB

Traditional Event Analysis Algorithm
20
Gradient (derivative) Derivative is sensitive to noise
Linear regression Determine segment start and end is challenging
Correlation There is no universal event model to correlate with before finding events

Traditional Event Analysis
21
Traditional user model allows the user to chose limits but can miss small loss event in this example
0.08dB 0.11dB
Implementation Limitations
Based on apparent event magnitudeInsertion lossReflectance
Accuracy depending on positionNoise increases as event getting further from launch
User sets parameter thresholdIf greater than threshold, then it is considered an event
Extra user interventionHighly depends on user’s knowledge and skill

Dead-end for Magnitude Based EAExample of true event and false event found at different threshold using a major OTDR market player
•A slight increase of few event at smaller magnitude raises chance of exponentially increasing false events•1 : 12 is true event to false event increase ratio!•Hard to make further progress due to excessive false event
22
Threshold Matched events % False events %0.1dB 60.33 11.54
0.01dB 61.63 27.08

Introduction of Likelihood• Wikipedia
– Likelihood is a function of how likely an event is, which is weaker than probability (or odds in favor).
– In statistics, a likelihood function is a function of the parameters of a statistical model, defined as follows: the likelihood of a set of parameter values given some observed outcomes is equal to the probability of those observed outcomes given those parameter values.
• Wolfram MathWorld– Likelihood is the hypothetical probability that an event
that has already occurred would yield a specific outcome. The concept differs from that of a probability in that a probability refers to the occurrence of future events, while a likelihood refers to past events with known outcomes.
23

Likelihood Applied to EA• How event Likelihood is measured
– Expected noise level surrounding event– Shape of event– Magnitude of event– Slope of line segments surrounding event– Etc.
24
Smaller magnitudeHigher likelihood
Larger magnitudelower likelihood

Benefits of New ApproachUser can trade-off of sensitivity or reliability by setting likelihood threshold after event analysis
25
Default value is balanced between
sensitivity and reliability
Experienced user can choose higher sensitivity if he feels expected event is missing
High reliability is useful in certain cases.
False events
True events

Completely New Event AnalysisEvent analysis built from ground-upMultiple factors are taken into account
26
Threshold Matched events % False events %0.1dB 73.42 12.29
0.01dB 74.83 12.83
True event and false event found at different threshold using new algorithm for same test networks
True event to false event increase ratio is 1 : 0.38 !It is still on it’s way for further progress

F @ 0.01dB
Event Analysis Quality Comparison Among OTDRs
27
Found event %
False event %
Using magnitude as event criteria has exponential increase on false events(Slope > 45)
Tier 1 performer
Tier 2 performer
Tier 3 performerUsing likelihood as event criteria limits false events(Slope < 45)
D @ 0.02 dB
M310 @ 0.01dB
Default loss threshold at 0.1dB
Increasing matched events with moderate increase of false events is challenging M310 @0.07 dB

Prefect Score on 16-Event Network
28
M310 – 16 events (prefect score) OTDR “A” – 29 Events

Application: Jumper Cable Testing Using M310
• Reflectance and loss measured at both ends of cable using estimation algorithm
29
2 m jumper cable

Application: Data Center Network Using M310
30
9-Event Network: Closely spaced events - Short jumper cables – Gainer- Splice

Event Analysis Checklist• Matched/Missed event occurrence• False event occurrence• Correct identification of event type• Ability to separate closely spaced events• Ability to locate beginning and end of fiber
under test without a separate launch and receive cable calibration test
• Provide all relevant measurements for each event
31

Potential for Future Improvement
32
Found event
False event
Likelihood technique allows for ongoing improvement
Traditional methods cannot be improved
Traditional algorithms
Direction of progress
Improvement is possible only if false event rate is lowFalse event rate: an indicator of improvement potential
Actual path of progress

Conclusion• Introduction of likelihood in event analysis offers balance between
sensitivity and reliability• New event analysis increases user satisfaction level by offering higher found
event rate• It reduces user frustration with fewer false events• Lower false event rate indicates it’s potential for future performance
improvement
33
OTDR performance evolution to match Data Center evolution
Dynamic Range
Short Dead Zones
Event Analysis
Past Present Future