bending the curve: toward global sustainabilitysupervivir.org/archi01/btcurve.pdfglobal scenario...
TRANSCRIPT

GlobalScenarioGroup
Bending the Curve:Toward Global Sustainability
Paul Raskin, Gilberto Gallopin, Pablo Gutman, Al Hammond and Rob Swart
A report of the Global Scenario Group
PoleStar Series Report no. 8, 1998

The P O L E S T A Rë Publication SeriesThis publication series is produced by the Stockholm Environment Institute’s PoleStar Project.Named after the star that guided voyagers through uncharted waters, the multi-year PoleStarProject addresses critical aspects of the transition to sustainability. Scenario analysis illuminateslong-range problems and possibilities at global, regional, national and local levels. Capacitybuilding strengthens professional capabilities for a new era of development. Policy studies fashionstrategies and actions. The PoleStar System© provides a user-friendly tool for organizing pertinentdata, formulating scenarios, and evaluating strategies for sustainable development. For moreinformation, visit http://www.seib.org/polestar.html on the Internet. The Global Scenario Groupwas established to carry forward the global aspects of this work.
The PoleStar publication series includes:1. The Sustainability Transition: Beyond Conventional Development (Raskin, Chadwick, Jackson
and Leach)2. PoleStar System Manual (Raskin, Heaps and Sieber)3. Global Energy in the 21st Century: Patterns, Projections and Problems (Raskin and Margolis)4. Water and Sustainability: A Global Outlook (Raskin, Hansen and Margolis)5. Global Land and Food in the 21st Century: Trends and Issues for Sustainability (Leach)6. Accounting for Toxic Emissions from the Global Economy: The Case of Cadmium (Jackson
and MacGillivray)7. Branch Points: Global Scenarios and Human Choice (Gallopin, Hammond, Raskin and Swart)8. Bending the Curve: Toward Global Sustainability (Raskin, Gallopin, Gutman, Hammond and
Swart)9. Conventional Worlds: Technical Description of "Bending the Curve" Scenarios (Heaps, Kemp-
Benedict and Raskin)
Global Scenario GroupThe Global Scenario Group engages a diverse group of development professionals in a long-termcommitment to examining the requirements for sustainability. The GSG is an independent,international and inter-disciplinary body, representing a variety of geographic and professionalexperiences. Its work program includes global and regional scenario development, policy analysisand public education. The diversity and continuity of the GSG offer a unique resource for theresearch and policy communities. The GSG pursues its objectives through research, publicationand collaboration with regional sustainable development projects. This report relies on the scenarioframework developed in Branch Points: Global Scenarios and Human Choice (PoleStar #7) toexamine alternative global futures. A companion document (PoleStar #9) provides technicaldetails. For reports and more information, visit http://www.gsg.org on the Internet.

Bending the Curve:Toward Global SustainabilityPaul Raskin, Gilberto Gallopin, Pablo Gutman, Al Hammond and Rob Swart
Stockholm Environment InstituteLilla Nygatan 1, Box 2142
S-103 14 StockholmSweden
Phone: +46 8 412 14 00Fax: +46 8 723 0348
Email: [email protected]: http://www.sei.se
© Copyright 1998 by the Stockholm Environment Institute.No part of this report may be reproduced in any form by photostat, microfilm, or any other means,
without the written permission of the publisher.
Front cover photo: View of Africa and Saudi Arabia from Apollo 17. NASA/NSSDC.
ISSN: 1400-7185ISBN: 91-88714-57-8

Bending the Curve: Toward Global Sustainability iii
TABLE OF CONTENTS
ACKNOWLEDGMENTS..................................................................................................... VII
SUMMARY............................................................................................................................ IX
1. ISSUES AND CONCEPTS...................................................................................................1
1.1 Triumphalism and Counterpoint .................................................................................................11.2 Dimensions of Sustainable Development .....................................................................................11.3 Scenarios of the Future................................................................................................................31.4 Aim and Structure of the Report..................................................................................................6
2. GOALS..................................................................................................................................7
2.1 Social Objectives.........................................................................................................................72.2 Environmental Objectives ......................................................................................................... 14
3. THE PROBLEM OF UNSUSTAINABILITY ................................................................... 23
3.1 Reference Scenarios .................................................................................................................. 233.2 An Illustration........................................................................................................................... 243.3 Environmental Risk .................................................................................................................. 283.4 Persistent Poverty...................................................................................................................... 373.5 Conclusions .............................................................................................................................. 43
4. STRATEGIES FOR A TRANSITION............................................................................... 45
4.1 Policy Reform Scenarios............................................................................................................ 454.2 Meeting the Social Goals........................................................................................................... 464.3 Climate ..................................................................................................................................... 494.4 Energy ...................................................................................................................................... 524.5 Food and Land .......................................................................................................................... 564.6 Freshwater ................................................................................................................................ 614.7 Materials and Waste.................................................................................................................. 66
5. IMPLICATIONS FOR ACTION ....................................................................................... 69
5.1 Challenges ................................................................................................................................ 695.2 Agents of Change...................................................................................................................... 705.3 Science for Sustainability .......................................................................................................... 725.4 Symptoms and Causes: A Framework for Guiding Policy .......................................................... 735.5 Policy Directions....................................................................................................................... 765.6 Conventional Worlds and Beyond ............................................................................................. 80
REFERENCES........................................................................................................................ 83
ANNEX - SCENARIO HIGHLIGHTS................................................................................A-1

iv Raskin, Gallopin, Gutman, Hammond and Swart
TABLE OF FIGURESFIGURE 1. SCENARIOS STRUCTURE WITH ILLUSTRATIVE PATTERNS OF CHANGE............................................ 5FIGURE 2. THE TEN REGIONS ................................................................................................................... 11FIGURE 3. POPULATION SUFFERING FROM HUNGER AND A LACK OF SAFE DRINKING WATER IN 1995........... 11FIGURE 4. GLOBAL OVERVIEW OF THE REFERENCE SCENARIO .................................................................... 25FIGURE 5. CO2 EMISSIONS TO 2100 CORRESPONDING TO DIFFERENT STABILIZATION CONCENTRATIONS..... 30FIGURE 6. INDUSTRIAL CO2 EMISSIONS IN REFERENCE AND IPCC SCENARIOS ............................................ 31FIGURE 7. POPULATION IN WATER STRESS................................................................................................ 35FIGURE 8. FOREST AREAS IN DEVELOPING REGIONS IN THE REFERENCE SCENARIO ..................................... 37FIGURE 9. THE LORENZ CURVE AND GINI COEFFICIENT ............................................................................. 38FIGURE 10. HISTORICAL U.S. GINI COEFFICIENTS ..................................................................................... 39FIGURE 11. CHANGING INCOME DISTRIBUTIONS........................................................................................ 40FIGURE 12. RELATIONSHIP BETWEEN NUMBER OF HUNGRY AND THE HUNGER LINE.................................... 41FIGURE 13. HUNGER LINES VS. MEAN INCOME.......................................................................................... 42FIGURE 14. SCENARIO TRAJECTORIES....................................................................................................... 48FIGURE 15. ENERGY-RELATED CO2 EMISSIONS PER CAPITA ...................................................................... 51FIGURE 16. ANNUAL CO2 EMISSIONS........................................................................................................ 52FIGURE 17. PRIMARY ENERGY REQUIREMENTS ......................................................................................... 53FIGURE 18. ENERGY INTENSITIES IN THE SCENARIOS................................................................................. 54FIGURE 19. OECD ENERGY INTENSITY IMPROVEMENTS BY SECTOR IN THE SCENARIOS.............................. 55FIGURE 20. LAND-USE IN THE SCENARIOS ................................................................................................ 61FIGURE 21. WATER INTENSITIES IN THE SCENARIOS .................................................................................. 64FIGURE 22. OECD WATER INTENSITY IMPROVEMENTS BY SECTOR IN THE SCENARIOS ............................... 65FIGURE 23. POPULATION IN WATER STRESS IN THE SCENARIOS.................................................................. 66FIGURE 24. UNSUSTAINABILITY TRENDS AND DRIVERS ............................................................................. 74
TABLE OF TABLESTABLE 1. INCOME, POPULATION, AND POVERTY IN 1995............................................................................. 8TABLE 2. SELECTED SOCIAL INDICATORS IN 1995 ....................................................................................... 9TABLE 3. SELECTED INDICATORS BY REGION IN 1995................................................................................ 10TABLE 4. GLOBAL INDICATORS AND TARGETS .......................................................................................... 12TABLE 5. ENVIRONMENTAL INDICATORS AND TARGETS ............................................................................ 16TABLE 6. POLICY INSTRUMENTS TO ATTAIN THE PROPOSED SOCIAL OBJECTIVES ....................................... 77TABLE 7. POLICY INSTRUMENTS TO ATTAIN THE PROPOSED ENVIRONMENTAL OBJECTIVES ........................ 78

Bending the Curve: Toward Global Sustainability v
DEDICATION
As this document was going to print, we learned of the untimely passing of Katsuo Seiki.The world has lost a great champion for a just and liveable future, and we have lost a closecolleague and friend. He will live on in the work of those he inspired.

vi Raskin, Gallopin, Gutman, Hammond and Swart

Bending the Curve: Toward Global Sustainability vii
ACKNOWLEDGMENTS
The authors are deeply indebted for the substantive input and critical feedback on earlierdrafts of this manuscript. Our topic — the requirements for a global sustainabilitytransition — is complex, cross-disciplinary and inherently normative. The comments ofnumerous individuals from diverse perspectives and backgrounds were invaluable inshaping our approach and formulations. These include our Global Scenario Groupcolleagues (Khaled Fahmy, Tibor Farago, H.W.O. Okoth-Ogendo, Atiq Rahman, SetijatiSastrapradja, Katsuo Seiki, Nicholas Sonntag, and Veerle Vandeweerd), Mike Chadwick,Gordon Goodman, Dan Kammen, Meir Carasso, Dale Rothman and many more. One ofus (Raskin) wishes to acknowledge the many insights gleaned from discussions with BobKates, Bill Clark, and other colleagues on the Board on Sustainable Development, U.S.National Research Council. Drs. Charles Heaps, Eric Kemp-Benedict and Gil Pontius ofthe GSG Secretariat provided excellent scientific support and assistance throughout a longprocess of analysis, consultation, and documentation. We are grateful to Michael Keatingfor editorial assistance. That said, any oversights or deficiencies in the manuscript are thesole responsibility of the authors.
We thank the United Nations Environment Programme for supporting a review meeting inTokyo. Finally, we are grateful to the Nippon Foundation for its generous assistance tothe work of the Global Scenario Group. The support of the Foundation and its staff madethis study possible.

viii Raskin, Gallopin, Gutman, Hammond and Swart

Bending the Curve: Toward Global Sustainability ix
SUMMARY
IntroductionOver the last few centuries, a mere heartbeat of historic time, humanity has moved to thebrink of a new evolutionary milestone — the planetary phase of civilization. The worldeconomy is expanding and becoming more integrated, profoundly reshaping the culturaland political landscape everywhere. This expansion is taking its toll on the naturalresources that support development. The human impact on the global environment hasgrown from diminutive to elephantine. And, despite great wealth in the world, there is stillgreat poverty and suffering. As we drift along the arc of history, we see ahead of us therisk of both greater environmental peril and social friction. We also see the opportunity ofa safer passage to a more just and sustainable global society.
Bending the Curve looks at what it would take to steer human development onto amore sustainable pathway during the 21st century. In its previous publication, BranchPoints: Global Scenarios and Human Choice, the Global Scenario Group developed threeclasses of scenarios to show possible pathways for the future. Conventional Worldsscenarios assume we will continue on the current pathway of economic globalization, withevolutionary changes in institutions, and that developing regions of the world will movetoward industrial country patterns and values. Another set of scenarios, calledBarbarization, depict a world in which deepening social and environmental tensions arenot resolved, civilized norms erode, and great human misery ensues. The third type ofscenario, Great Transitions, envision fundamental social and institutional transformationtoward more sustainable forms of economic and social development, bringing a new andarguably higher stage of human civilization.
Bending the Curve examines the possibilities for sustainable development bypushing for important changes within an evolutionary Conventional Worlds context. Theshift to more sustainable forms of development must at least begin at this level, althoughwe will likely need more fundamental social changes to complete the transition to asustainable global society. This study shows how a comprehensive set of policy reformscould bend the curve of development toward sustainability.
The Challenge of Sustainable DevelopmentTo assess the implications of current trends, and to guide policies to change those trends,we introduce a set of explicit goals for long range sustainability. In developingsustainability goals, we include both the environmental and social dimensions of thesustainable development concept. Environmental sustainability means changing humanactivities so they no longer threaten the natural resource base and ecological systems uponwhich economic development, human health and social well-being depend. Socialsustainability highlights the need to reduce absolute poverty and extreme inequality onboth moral and practical grounds. Social sustainability is essential because poverty is botha cause and an effect of environmental degradation. Moreover, a society festering withsocial tension will not have the means or inclination to make the environment a priority.

x Raskin, Gallopin, Gutman, Hammond and Swart
There are no blueprints for a transition to sustainability, but there are policyreforms that could reduce environmental degradation, income disparity, and persistentpoverty. Humanity’s sustainability goals of today will need to be refined over time in lightof new information and events in the spirit of “adaptive management.” However, settingprovisional targets for sustainability will allow us to start developing strategies to avoidcritical risks, and will keep options open for the future.
We suggest sustainability indicators and targets for five broad environmentalchallenges: stabilizing the climate within safe ecological limits, reducing the flow ofmaterials through economies, decreasing toxic waste loads on the environment, easing thepressure on freshwater resources and maintaining the integrity of ecosystems. The targetscall for substantial decreases in environmental pressures from OECD economies.Developing and transitional regions of the world would increase some impacts, thengradually move toward OECD standards. The targets for carbon dioxide emissions,shown below, illustrate the pattern.
Transitional
OECD
Developing
0
2
4
6
8
10
1990 2010 2030 2050 2070 2090
2 E
mis
sions (
GtC
/year)
CO2 Emissions Targets
There can be no easy consensus on broad social goals, which will vary acrossworldviews and societies. We consider only a minimal set of objectives that have wideinternational consensus: the provision of basic human needs such as adequate food, cleandrinking water, and access to health care and education. It is a sad legacy of our time thatthe extraordinary expansion of the aggregate global economy, which grew by a factor offive since 1950 alone, has not diminished the sum total of human misery. Some 1.3 billionpeople live in absolute poverty, with nearly 900 million undernourished. The followingtable underscores both the scale of destitution and the contrast between industrializedOECD countries and other regions.

Bending the Curve: Toward Global Sustainability xi
Social Indicators in 1995
Macro-Region Income ($/capita)
Population(millions)
Hunger (%)
Unsafe Water(%)
Illiteracy(%)
OECD 20,250 910 1 1 2
Non-OECD 3,130 4,770 19 28 29
World 5,880 5,690 16 24 24
Guided by the declarations of recent international conferences, we propose a set ofchallenging though attainable social goals. They are reducing the incidence of hunger,unsafe water and illiteracy in half by 2025 and in half again by 2050, based on 1995figures. The number of hungry, for example, would fall from 900 billion in 1995 to 445billion by 2025, and 220 billion by 2050. As a fraction of projected world population,hunger would fall even faster, from 16% in 1995 to about 2% in 2050.
The Problem of UnsustainabilityAre the sustainability goals compatible with conventional development premises?Drawing on the analyses and assumptions of many international organizations, we havepainted a picture of global development under a business-as-usual approach. We call thisthe Reference scenario and use it to examine emerging problems. We use this baseline toassess the types of policy changes needed.
The conventional wisdom is that we will have larger, older and more urbanpopulations. Economies will continue to grow rapidly everywhere, driven by expandingglobal trade, financial transactions and capital flows. Advances in information technology,biotechnology and other innovations will gradually change production and consumptionpatterns. Developing countries will emulate the industrial country development model,and there will be progressive homogenization of global culture around the values ofmaterialism and individualism. Significant income disparity between rich and poorcountries, and between the rich and poor within countries, will remain a tenacious anddebilitating social trend. Development will continue to run down the environmental baseupon which it depends by using resources faster than nature can produce them, and byreleasing pollution faster than it can be safely assimilated.
Among the implications of the Reference scenario:
• Between 1995 and 2050, world population increases by more than 50 per cent, averageincome grows over 2.5 times and economic output more than quadruples.
• Food requirements almost double, driven by growth in population and income.
• One billion remain hungry as growing populations and continuing inequity in thesharing of wealth counterbalance the poverty-reducing effects of general economicgrowth.
• Requirements for energy and water increase substantially.

xii Raskin, Gallopin, Gutman, Hammond and Swart
• Carbon dioxide emissions soar, threatening the global climate, and risking seriousecological, economic and human health impacts.
• Forests are lost to the expansion of agriculture and human settlement areas, and otherland-use changes.
0
1
2
3
4
5
Population GDP perCapita
WorldGDP
FoodDemand
Hunger PrimaryEnergy
Water CO2Emissions
ForestArea
Rel
ativ
e to
199
5
199520252050
Overview of Reference Scenario
Measured against our sustainability criteria, the Reference scenario would be arisky bequest to our 21st century descendants. The increasing pressure on environmentalsystems — the combined effects of growth in the number of people, the scale of theeconomy and the throughput of natural resources — is environmentally unsustainable.Environmental degradation could undermine a fundamental premise of the scenario:perpetual economic growth on a global scale. Conventional development patterns also failto address the social goals for sustainability, because the level of absolute poverty andhunger persists into the middle of the next century.
Strategies for a TransitionWhat strategies could bend the curve of development toward the sustainability goals?Policy Reform scenarios begin with visions of the future that satisfy the sustainabilitygoals. Rather than a forecast, the scenario is constructed as a backcast from a desiredfuture in 2050 and beyond. The aim is to identify plausible development pathways forgetting there, including the choices and actions for shaping a sustainable future.
In the Policy Reform scenario, poverty reduction goals are realized throughinitiatives to increase the incomes of the poor. Two types of equity increases relative tocurrent trends are critical to meeting these goals: greater international equity between richand poor countries and greater national equity within countries. International equity isaided by strategies that accelerate the convergence of developing and transitional regionstoward OECD levels of development. National equity is improved through incomedistribution policies. Under the scenario, “growth with equity” becomes the prevailingphilosophy in development strategies.

Bending the Curve: Toward Global Sustainability xiii
Meeting the environmental goals in the Policy Reform scenario requires dramaticadjustments in the use of resources, abatement of pollution, and protection of ecosystems.In the face of increasing populations and rapid economic growth, the simultaneoussatisfaction of environmental and social targets presents an exceedingly dauntingchallenge. Energy, water and resource use efficiency must increase substantially.Renewable energy, ecologically based agricultural practices, and integrated eco-efficientindustrial systems must become the norm. To live within water and land constraints, anumber of developing countries must rely more heavily on food imports, countering recenttrends in industrialized regions of withdrawing lands from agricultural production. Thescale of the required transition is illustrated by comparing Reference and Policy Reformscenarios across selected social and environmental dimensions, as shown in the figurebelow.
International Equity
1995 2050
National Equity
1995 2050
Hunger
1995 2050
Energy Requirements
1995 2050
Water Use
1995 2050
Forest Loss
1995 2050
Carbon Emissions
1995 2050
Sulfur Emissions
1995 2050
Toxic Waste
1995 2050
Reference Policy Reforrm
Global Patterns Compared

xiv Raskin, Gallopin, Gutman, Hammond and Swart
ConclusionEnvironmental degradation is not a necessary outcome of development. It results from aset of historically contingent choices for technology, production processes andconsumption patterns. Similarly, poverty and extreme inequity are not inevitable, but arethe outcome of a specific set of social policy choices. Reversing the negative trends, andcreating a transition to global sustainability will not be easy. It will require a widespreadconviction that action is necessary and will depend on finding sufficient political will foraction. Then, the institutions, policies, and technologies for translating intentions intoreal-world solutions must be harnessed or forged. The primary agents for change aregovernments, businesses, and the new institutions of civil society, the proliferatingcollection of non-governmental organizations engaged in addressing the full range ofenvironmental and social issues.
Science has a critical role in the sustainability transition. It must broaden its focusand develop a systems approach to understanding complex social and ecological processesand their interactions. The challenge is to develop a science of sustainability thatmaintains a commitment to rigor, while recognizing the inherent uncertainty in complexsystems and the need for advice on how to make sustainable choices. Scenario analysiscan play a linchpin role by synthesizing diverse findings from natural and social sciences,and linking science to the public and policy dialogues on the future.
The message of the Reference scenario is that emerging environmental and socialstresses pose grave risks. Complacency is not a valid option for those who take theresponsibility of passing on a secure future to our descendants as a moral imperative. ThePolicy Reform scenario shows that the cumulative effects of a comprehensive family offeasible incremental technological and policy adjustments can take us a long way down thesustainability path. Numerous policy levers could be used to induce environmentallysustainable practices and promote poverty alleviation. The appropriate package ofinstruments, including eco-taxes, market mechanisms, regulation, income transfers, humancapital investment, technology transfer, economic stimulation, information campaigns, willvary with the issue, level of governance, and local concerns.
The challenge ahead is to mobilize the political will needed to pick up the policytools. Can the global movement for sustainability overcome the resistance of specialinterests, the myopia of narrow outlooks, and the inertia of complacency? Arefundamental changes required in values and lifestyles that transcend Conventional Worldsassumptions — a Great Transition? If this generation can begin to bend the curve ofdevelopment toward sustainability, it will keep future options open, bestowing the gift ofchoice to posterity.

1. ISSUES AND CONCEPTSOurs is an age of profound transformation and great uncertainty about the future. Overthe last few centuries — a mere heartbeat of historic time — the human impact on theglobal environment has grown from diminutive to elephantine. Now the human enterpriseis on the brink of a new evolutionary milestone — the planetary phase of civilization. Thisepochal transition poses weighty challenges for thought, policy, and action. To reflect onthe human condition and destiny at the end of the 20th century is to enquire about thetroubling perils ahead as we drift along the arc of history. But it is also to examine thepossibility of a salutary passage to a more just and sustainable global society.
1.1 Triumphalism and CounterpointA striking feature of the current era is the astounding expansion of the world economicsystem, the culmination of forces launched several centuries ago with the emergence ofEuropean capitalism. By liberating nascent human potential for innovation and ingenuity,capacity for greed and acquisitiveness, and hunger for liberty and modernism, the newsystem set in motion a perpetual revolution in values, institutions, technology andknowledge. This process was further accelerated by the industrial explosion, whichcontinues in the form of the tumultuous technological changes of our time.
Looking ahead to the new century, conventional wisdom sees further massivechange as these historic forces play out on a global field — populations may double, theworld economy quadruple, and environmental pressures surge (IPCC, 1992b; Raskin etal., 1996). A common theme is that societies everywhere will gradually converge towardcommon institutional and cultural assumptions in the context of globalizing economies(OECD, 1997). War, social opposition, and stubborn traditionalism impeded the forwardmarch of the ascendant market system in the past. But with the collapse of the socialistexperiments in Russia and elsewhere, the expansion of global markets, and the headyadvance of new technology, the millennial glee of cheerleaders for global capitalism,anticipating a cornucopia for all in the new century is, perhaps, understandable (Schwartzand Leyden, 1997).
But there are substantial challenges that must be overcome and fundamentalquestions addressed. How will a growing human enterprise, one that already issignificantly perturbing natural planetary processes, be reconciled with environmentallimits? How will the deep social fissures between the north and the south, the rich and thepoor, parochialism and globalism, be ameliorated? And the question posed by Socrateslong ago remains: how shall we live?
1.2 Dimensions of Sustainable DevelopmentIn rhetoric, if not yet in agenda and action, the nations of the world pronounced theircommitment to sustainable development at the 1992 Earth Summit. In its classicformulation, sustainable development “meets the needs of the present withoutcompromising the ability of future generations to meet their own needs” (WCED, 1987).At the heart of the concept is the powerful ethical imperative that we strive to consume

2 Raskin, Gallopin, Gutman, Hammond and Swart
and produce in a manner that is tempered by concern for the well-being of ourdescendants. The new paradigm for development demands that we take a multi-generational view in seeking to harmonize socio-economic and environmental goals.
Broadly, what sustainable development seeks to sustain is the integrity ofcombined human and natural systems as they interact and condition one another over time.The sustainability of such socio-ecological systems is a dynamic process of development,not a static condition. A sustainable system is resilient to disturbance and flexible inadapting to changing circumstances (Raskin et al., 1996).
Not surprisingly, in the translation of the principle of sustainable development intospecific targets and action, the philosophical consensus shatters into a cacophony ofdefinitional debates, interpretations and slogans. The concept is sufficiently rich andprotean to refract the full diversity of human interests, values and aspirations. Bankers,social critics and environmentalists have all decanted old wine into this new bottle.Nevertheless, sustainability remains an irreducibly holistic concept that compelsintegration over perspectives, spatial scales, and time.
Sustainable development as a quality of coupled environmental and human systemshas both biophysical and socio-economic dimensions. Biophysical sustainability seeks tomaintain ecosystems, bio-geochemical cycles, and natural resources for perpetual humandevelopment. Beyond such anthropocentric requirements, for many, the preservation ofthe natural heritage and the survival of species are intrinsic values not requiring utilitarianjustification. In any case, endless quantitative growth is an impossibility on a finite planet,though qualitative improvement in products, skills and culture need never cease in anenvironmentally sustainable world (Daly, 1996). Biophysical sustainability draws attentionto the scale of the economic system and the degree to which human activity transformsnature and threatens environmental systems. Biophysical goals can be made operationalby setting criteria in terms of key environmental and resource indicators.
The second face of sustainability is socio-economic. For many who have joinedthe sustainability discussion, though certainly not all, achieving basic social goals — the“needs” of today and of future generations in the Brundtland formulation — is taken as apre-analytic moral imperative. Eliminating hunger, providing access to education andhealth services, and diminishing inequality between and within regions are sufficient onethical grounds alone, whether or not they are necessary antecedents to environmentalsustainability. Indeed, there are plausible “solutions” to the problem of environmentalsustainability that are politically and socially repressive (Gallopin et al., 1997).
However, beyond the moral imperative for reducing human deprivation, there areimportant objective links that couple social goals to environmental conditions. Forexample, poverty is both a cause and an effect of environmental degradation (World Bank,1996). The desperately poor are likely to mine nature for immediate survival, not preserveit for a dubious future. Moreover, the social cohesion required for a comprehensivesustainability transition is undermined in a society where the needs of its citizens formaterial well-being and just treatment are not met. At the global level, regional disparitiesfoster migration pressure, environmentally unfriendly trade and development patterns, anddifficulty negotiating international environmental agreements.

Bending the Curve: Toward Global Sustainability 3
Thus, the socio-economic and environmental aspects of sustainability are highlyinterdependent. If a society permits excessive environmental deterioration, it risksundermining the economic welfare of its citizens, the legitimacy of its political systems,and the endurance of its institutions. If a society festers with social tension and instability,it is not likely to make the environment a priority, or enjoy the institutional capacity forimplementing a sustainable form of development. We take as a fundamental principle,therefore, that the socio-economic and biophysical dimensions of the sustainabilitytransition must be treated in a unified framework.
1.3 Scenarios of the FutureScenario analysis offers structured accounts of possible long-range futures. The value ofscenarios lies not in their capacity to predict the future, but in their ability to provideinsight into the present. By helping to identify drivers of change, the implications ofcurrent trajectories and options for action, scenarios bring the future to bear in today’sdecisions. This is a critical contribution since the world is dominated by fragmentedrationality — firms concerned with profit, decision-makers with short-term agendas,scientists with subspecialties, and households with material accumulation. The danger isthat such local rationality taken in aggregate leads to global irrationality, to a pattern forthe whole system that would have been chosen by no one.
Scenarios enlarge the canvass for reflection to include a holistic perspective overspace, issues and time. They illuminate the ways in which the contradiction of unabatedgrowth of human activity on a finite planet might be resolved. In conventionaldevelopment paradigms, long-range global affluence and environmental preservation areassured, it is hoped, through market adaptations, perhaps with the prod of well-designedpolicies. But there are other ways in which the tension between economic growth andenvironmental limits might be reconciled. Some visions are bleak, including the possibilityof catastrophic environmental and social collapse — or, perhaps to prevent suchbreakdown, the emergence of authoritarianism. Some are idealistic, picturing a root andbranch transition where post-consumerist values and lifestyles form the basis for a morejust, humane and ecological stage of civilization.
These three archetypal scenarios of the future — Conventional Worlds,Barbarization, and Great Transitions are described in a previous publication (Gallopin etal., 1997). The Conventional Worlds class of scenarios assumes that current trends playout without major discontinuity and surprise in the evolution of institutions, environmentalsystems and human values. In Barbarization scenarios, fundamental social change occurs,but is unwelcome, bringing great human misery and collapse of civilized norms. Finally,Great Transitions also represent fundamental social transformation but a new andarguably higher stage of human civilization is posited.
This wide and contrasting scan of possible futures, all consistent with currentconditions and trends, is necessary because the long-range future is not predictable. Theglobal socio-ecological system is far too complex for that. Scientific understanding ofcurrent conditions, forces of change, and systems dynamics is limited. But even withprecise knowledge, uncertainty and surprise are inherent in complex systems.

4 Raskin, Gallopin, Gutman, Hammond and Swart
Moreover, the future is subject to human choices that have not yet been made andactions that have not yet been taken. Indeed, the entire discussion of a transition tosustainable development is premised on the notion that humankind can, to a degree,influence its destiny. In this sense, scenarios can serve as self-fulfilling attractors,desirable visions of the future that help galvanize effective actions for their realization.The future beckons to the present through our capacity to envision goals and act toachieve them.
Scenarios can be elaborated in great narrative and quantitative detail with manyvariations possible within each of our major classes. Figure 1 shows two such variants foreach of our three classes along with illustrative sketches of how key variables —population growth, economic scale, environmental quality, distributional equity,technological change and social conflict — might change over time. In fact, the curves ofchange will vary depending on the worldview of the observer. For example, the curvesuggesting increasing environmental deterioration under the market-driven ConventionalWorlds-Reference scenario would be unacceptable if one believed that market responses(e.g., through changing prices) would induce the required behavioral changes andinnovations for environmental protection.
The focus of this study is the Conventional Worlds-Policy Reform scenario. ThePolicy Reform scenario is distinguished from the business-as-usual Reference scenario bythe assumption that comprehensive and coordinated government action is taken forsustainability. The scenario is used to explore the requirements for achieving sustainabilityand the challenges for policy within a Conventional Worlds framework. Of course, theemergence of the necessary political will for imposing sustainability constraints on agrowth-driven global economy and consumerist culture — the essence of the PolicyReform scenario — is by no means assured. Nevertheless, policy reforms are the point ofdeparture for a sustainability transition, even if, ultimately, one must imagine more basicchanges in human institutions and values.

Bending the Curve: Toward Global Sustainability 5
Figure 1. Scenarios Structure with Illustrative Patterns of Change Source: Gallopin, et al. (1997)
Such changes might draw on elements of Great Transitions scenarios, which intheir pure forms are visionary responses to the sustainability challenge that include aresurgence of quality values as a component of human welfare, high valorization ofnature, equitable wealth distribution, and strong social solidarity. The Eco-communalismvariant embraces the principles of strong decentralization, small-scale technology, andeconomic autarky. The New Sustainability Paradigm variant is a more cosmopolitanvision that would transcend and transform urban and industrial civilization, and maintainglobal linkages and solidarity, rather than retreat into localism.
But what if increasing environmental and social crises overwhelm marketadaptations, and policy intervention and value change are insufficient? Then, the threatof a descent into Barbarization would loom. In an extreme variant, Breakdown scenariosenvision cultural disintegration and economic collapse, a degeneration of civilization intoa primitive world of all-against-all. The Fortress World variant features an authoritarianresponse to the threat of breakdown. Ensconced in protected enclaves, an elite safeguardsits privilege by controlling an impoverished majority and managing critical naturalresources. Outside the fortress there is repression, environmental destruction, and misery.

6 Raskin, Gallopin, Gutman, Hammond and Swart
1.4 Aim and Structure of the ReportThe taxonomy of scenarios offers a useful point of departure for understanding where theworld system might be going — and where it would need to go to meet social andenvironmental goals. Though the framework is highly idealized, greater texture andrichness can be introduced by allowing for variation across regions and providing concretestories of how the scenario themes might play out. Also, a scenario may jump to aqualitatively different one at critical moments when unresolved socio-ecological tensionsand contradictions lead to a branching of possibilities.
In this report, we reduce this complexity by narrowing our focus to theConventional Worlds class of scenarios. It is true that the fundamental premises of thesescenarios — evolutionary change in institutions, global convergence of economies andcontinuity in values — are not inevitable. As we have argued, discontinuities lurk in theform of Barbarization nightmares and Great Transitions visions — or as surprises that wecannot anticipate. Complacency about deep threats to civilization would certainly be bothimprudent and unethical. Moreover, the emergence of life-styles and values that transcendthe conventional paradigm must be part of a sustainability transition.
Nevertheless, the center of the policy discussion today lives in the ConventionalWorlds niche of the landscape of future visions. Political processes inherently tend to seekto resolve conflicting interests gradually. When it comes to sustainable development, theperception of conflict — between the environment and economic growth, between richand poor, between the present and the future — is on a colossal scale. Despite somepositive trends, the 1997 United Nations General Assembly review of progress in the fiveyears since Rio found that critical problems were deepening (UNDPCSD, 1997). In thenear term, a gradual tilt toward effective policies for sustainable development is the mostthat can be expected. Even this would constitute a critical historical shift towardsustainability.
In this spirit, we introduce a broad set of environmental and social criteria to serveas goals for long-term sustainability (Section 2). Then, to clarify the character and scaleof the policy challenge, we examine how an illustrative business-as-usual ConventionalDevelopment-Reference scenario fares against these criteria (Section 3). Next, wedevelop a Conventional Development-Policy Reform scenario that includes an alternativeset of socio-economic, environmental and resource patterns, which seeks to meet thesustainability criteria (Section 4). Finally, we discuss the strategic implications — thekinds of policy steps needed to begin bending the curve of history toward a sustainabledevelopment path (Section 5).
Bending the Curve: Toward Global Sustainability 7
2. GOALSSustainable development is about harmonizing human development with the environmentalconstraints of the planet. It is also about reconciling the needs of present generations withthe needs of the future. In broad brush, a vision of sustainability for the next centurymight include (Gallopin et al., 1997):
• eradication of absolute poverty, malnutrition and famine, and universal entitlement tobasic social services such as health care and education;
• improving quality of life everywhere and expanding possibilities for fulfillment;
• declining economic and social disparities;
• increasing environmental quality, with critical biological resources recovering, pollutionunder control, and climate stability in sight;
• infrequent violence and armed conflict; and
• stable global population.
The challenge is to move the international commitment to sustainability from visionto action. To design and test appropriate policies, the broad goals must be expressed interms of specific quantitative objectives. Recognizing that any set of criteria for asustainable world must necessarily be tentative and partial, it is nonetheless useful todescribe a preliminary set of minimum objectives — both social and environmental — andthe indicators that might gauge progress toward them.
To establish quantitative objectives, three sets of choices must be made: first,which indicators are to be used to measure progress toward sustainability; second, whichvalues of these indicators represent sustainable conditions and hence provide targetsagainst which to measure progress; and third, how rapidly these targets are to be achieved.These choices are to some degree subjective by nature, dependent not only on theinterpretation of uncertain scientific information, but also on the cultural preferences andinterests of an individual, a community, a country. This implies that different societiesmight choose different sustainability criteria.
For reasons of simplicity and comparability, a common set of core globalindicators is used in this report. The indicators and targets set the constraints on PolicyReform scenarios. They provide provisional guidelines for the scope, scale, and timing ofstrategic actions required for a transition to sustainability. However, there are noblueprints — sustainability indicators and targets will need to be refined over time in lightof new information, events and perspectives. Sound sustainable development practiceswill be an instance of “adaptive management.” Today we can only begin the long processof navigating a path across uncharted seas toward sustainability.
2.1 Social ObjectivesTaken broadly, the notion of setting social goals could be construed to imply fundamentalnormative questions, such as visions of the good society of the future. There can be noeasy consensus on these matters, since the range of perspectives will vary across the full

8 Raskin, Gallopin, Gutman, Hammond and Swart
range of worldviews and political philosophies. The discussion here is more limited inscope, focusing on a narrower set of goals that have wide international consensus: theprovision of basic human needs, such as adequate food, clean drinking water, and accessto health care and education.1
At a minimum, this report argues, sustainability must mean achieving such socialgoals. However measured, the human condition today falls far short of this standard. It isa sad legacy of our time that the extraordinary expansion of the aggregate global economy— by a factor of five since 1950 alone — has not diminished the sum total of humanmisery. The percentage of people destitute may have declined, but not the absolutenumber. Not only has absolute poverty coexisted with rapid economic growth, to a largedegree it has been generated by the very systems that provide the engine of that growth(Gallopin, 1994).
The prevalence of poverty in the world today is an oft-told story that can only besummarized here (UNDP, 1997). We begin by considering the stunning contrast betweenhighly developed countries (OECD) and others (Table 1).2
Table 1. Income, Population, and Poverty in 1995
Macro-Region Income ($/capita)
Population(millions)
Absolute Poverty(millions)
OECD 20,250 910 12
Non-OECD 3,130 4,770 1,300
World 5,880 5,690 1,312
Sources: Income from CIA (1997); Population from UN (1997); Non-OECD poverty figures from UNDP(1997); OECD poverty figures equated with hunger estimates
Nearly 85% of world population resides in non-OECD countries, where 27% livein absolute poverty.3 The 1.3 billion living in such dire poverty exceeds the entirepopulation of the OECD countries. Using GDP per capita as a proxy for average income,we see from Table 1 that people in OECD countries are 6.5 times richer than in non-
1 A broader perspective on alternative social visions will be the subject of a subsequent study of the Global Scenario
Group that will take up Great Transition scenarios, which were referred to in Section 1 and elaborated in Gallopinet al. (1997).
2 Throughout the report we summarize results for two macro-regions, a more developed region as represented by themember countries of the Organization for Economic Cooperation and Development (OECD), and the rest of theworld (non-OECD). Mexico, the Czech Republic, Hungary, Poland and Korea are not included in the OECD,although they are recent members.
3 The absolute poverty level is defined by the World Bank (1990) as individual consumption expenditures less than$1/day or about $370/year in 1985 dollars, which is equivalent to about $525/year when inflated to 1995 dollars.

Bending the Curve: Toward Global Sustainability 9
OECD countries.4 Note that the 15% of world population that resides in the wealthiercountries claims 55% of global income (the figure is 75% when GDP is expressed in MERrather than PPP terms). Moreover, the disparity between the world’s rich and poor hasbeen increasing. According to one estimate, the richest 20% were 30 times better off thanthe poorest 20% thirty years ago, and are now 61 times better off (UNDP, 1996).
There are many possible measures of the status of human development. We focushere on four indicators that serve to represent key categories of human well-being. Theseare: chronic undernourishment (represented by hunger levels), availability of clean water(measured in terms of the population with unsafe drinking water), education (gauged bythe level of adult illiteracy), and human health (a proxy is life expectancy at birth). Theglobal situation for the four indicators is reported in Table 2. The indicators can beexpanded and combined, for example, the Human Development Index (UNDP, 1997)combines average income per capita, literacy, and life span.
Table 2. Selected Social Indicators in 1995
Macro-Region Hunger (%)
Unsafe Water(%)
Illiteracy(%)
Life Expectancy(years)
OECD 1 1 2 77
Non-OECD 19 28 29 64
World 16 24 24 66
Sources: See notes to Table 3
Not surprisingly, the disparities that were observed in the incidence of povertybetween OECD and non-OECD regions are also reflected in these more tangiblemeasures. In non-OECD regions, about 880 million people are undernourished today,18% of the population in those regions. Moreover, 1.35 billion people, roughly 28% ofthe population, do not enjoy reliable and sanitary sources of drinking water. Thecumulative effects of the lack of basic education are indicated by the 29% of the adultpopulation that is illiterate. Finally, life expectancy at birth in non-OECD regions remainssubstantially below OECD averages, though there have been impressive increases in recentdecades. Life expectancy in developing countries rose from 46 to 62 years between 1960and 1994, as infant mortality declined from 149 to 39 per 1000 live` births (UNDP, 1997),and death from infectious diseases declined (WHO, 1997c).
Values for the social indicators by region are presented in Table 3. The ten global
4 Unless stated otherwise, national currencies in this report are expressed in common units adjusted for Purchasing
Power Parity (PPP). National PPP-adjusted GDP per capita are taken from CIA (1997). The PPP approach, inwhich prices of a common “basket of goods” are compared across countries, gives a more realistic picture ofrelative incomes than the more commonly used Market Exchange Rates (MER) (WRI, 1996a). Use of PPP has theeffect generally of raising the estimated incomes in developing countries relative to rich countries. In MER-converted terms, the ratio between OECD and non-OECD GDP per capita is about 19, considerably higher than thefigure of 6.5 reported in the text.

10 Raskin, Gallopin, Gutman, Hammond and Swart
regions used for the analysis throughout this report are shown in Figure 2. For context,also shown on Table 3 are GDP per capita and a measure of income inequality (the ratioof the income of the poorest 20% to that of the richest 20%).5 Africa fares least wellacross all four indicators. More than one-third of the population is undernourished andnearly half are without safe drinking water. South and Southeast Asia and the MiddleEast also register high levels of deprivation, with China and Latin America not muchbetter. The information on hunger and unsafe drinking water is presented graphically inFigure 3.
Table 3. Selected Indicators by Region in 1995
RegionHunger
(%)
UnsafeWater
(%)Illiteracy
(%)
LifeExpectancy
(years)GDP/Cap
($)
Poorest 20%divided by
Richest 20%
Africa 34 49 45 55 1,620 0.13
China+ 16 20 18 69 2,890 0.14
Latin America 14 17 14 69 6,000 0.07
Middle East 16 27 38 65 5,260 0.10
South & SEAsia
19 35 40 63 2,580 0.18
Eastern Europe 1 7 0 71 5,950 0.23
FSU 4 8 0 67 4,110 0.22
North America 2 0 0 77 26,950 0.11
Pacific OECD 1 0 0 79 21,100 0.16
Western Europe 1 1 4 76 15,730 0.19
Sources: Hunger (see notes to Sheet S-2); unsafe water = 100% - access to safe drinking water; access tosafe drinking water for 1980-1995 (WHO, 1997b; World Bank, 1997), set to 100% for high-income OECDcountries, value for Ukraine used for missing values in FSU; illiteracy = 100% - adult literacy; adult literacyfor 1990-1995 (World Bank, 1997), set to 100% for countries in the OECD, Eastern Europe and FSU withno data; life expectancy at birth for 1990-1995 (World Bank, 1997); GDP per capita in PPP (CIA, 1997);income ratios (see notes to Sheet S-1).
5 Regional income inequality is computed as the population-weighted average of country level data.

Bending the Curve: Toward Global Sustainability 11
Figure 2. The Ten Regions
0
250
500
750
1,000
1,250
1,500
Hunger Unsafe Water
mill
ions
of
pe
op
le
Africa
China +
Latin America
Middle East
S+SE Asia
Eastern Europe
FSU
OECD
Figure 3. Population Suffering from Hunger and a L ack of Safe Drinking Water in 1995 Source: See Table 3
Poverty levels in a given country depend on both average income and distributionof income. As a general principle, for a given average level of income, the more skewedthe distribution, the greater the fraction of the population in absolute poverty. Thisrelationship can be gleaned from the data in Table 3. Eastern Europe and Latin Americahave similar average incomes, but income disparities are much greater in Latin America, asare levels of hunger. Income distributions are similar in China+ and Africa, but averageincomes in Africa are much lower than in China+, with correspondingly higher levels of

12 Raskin, Gallopin, Gutman, Hammond and Swart
absolute poverty. The compact income distributions for the Former Soviet Union andEastern Europe — the ratios of the incomes of the poorest 20% to the richest 20% aregreater than 0.2 — are consistent with the historic emphasis on meeting the basic needs oftheir citizens.
Social goals for sustainability may be expressed in the language of reductiontargets for each measure of human deprivation. Here we rely on the work of a series ofinternational conferences that over the past few years have attempted to define goals forthe reduction of human deprivation and the provision of the opportunity for a dignified lifefor all.6 Each of the indicators reflects a different dimension of poverty.
At the 1996 World Food Summit, it was resolved that undernutrition was to behalved by the year 2015 (FAO, 1996d). To achieve this goal, the number ofundernourished people must decline from 900 million today to roughly 445 million over20 years. Based on the historical record, this is a quite ambitious goal, because thenumber undernourished fell only about 70 million between 1970 and 1990 (FAO, 1996d).
In the spirit of the World Food Summit goal, but allowing for some slippage, thisreport proposes a minimum target for hunger reduction in Policy Reform scenarios ofhalving undernourishment by 2025 and halving it again by 2050. The targets are definedin terms of the absolute number of undernourished: by 2050, the number ofundernourished people is targeted to fall to one-quarter of its 1995 value (Table 4). As afraction of world population, hunger falls faster, from about 16% in 1995 to just over 2%in 2050, since population is assumed to grow from about 5.7 billion in 1995 to 9.4 billionover this period, assuming mid-range population projection levels (UN, 1997).
Table 4. Global Indicators and Targets
Indicator 1995 2025 2050Hunger millions of people
% of 1995 value
% of population
900
-
16%
445
50%
6%
220
25%
2%
Unsafe Water millions of people
% of 1995 value
% of population
1,360
-
24%
680
50%
9%
340
25%
4%
Illiteracy millions of people
% of 1995 value
% of population
1,380
-
24%
690
50%
9%
345
25%
4%
Life Expectancy Years 66 > 70 in all countries
6 The approach follows BSD (1998).

Bending the Curve: Toward Global Sustainability 13
Strong commitments to universal provision of safe drinking water have been arecurrent theme in human development conferences and in the policy goals of multi-national organizations (WHO, 1997a). Unfortunately, there is a history of boldpronouncements that go unmet, such as the Decade of Safe Drinking Water in the 1980s.As with hunger, we assume that the population without safe water is cut in half by 2025.This corresponds to a minimum level of safe water service of about 85% for rural and95% for urban dwellers. The goal for 2025 may be compared to today figures of 50% and75% safe water access in rural and urban areas, respectively, in many developingcountries. The 2050 target assumes another halving, corresponding to over 95% access tosafe water everywhere.
Similarly, the World Summit for Social Development (WSSD, 1995) and The FifthInternational Conference on Adult Education (UNESCO, 1997) articulated extremelyambitious goals for the reduction of illiteracy, such as the elimination of female illiteracyby the year 2000. While these are no doubt unrealistic, meeting the goals of halving by2025 and again by 2050, as shown in Table 4, is certainly a plausible minimal target in aworld in which education for all is made a priority.
Finally, there is every reason to believe that aggressive policy actions in the healthsector can continue. The goals expressed at such meetings as the international WorldSummit for Social Development (WSSD, 1995) have been quite optimistic, thoughimprecise. A specific near term goal is for life expectancy at birth to be greater than 60years for every country of the world (WHO, 1997a). Ultimately, life expectancy indeveloping regions can be expected to approach that of the OECD regions. A reasonableintermediate goal is that average life expectancy in all countries exceeds 70 years by 2025.
The social goals for the sustainability transition that we have introduced here set achallenging agenda for development. Even as general economic growth tends to driveabsolute poverty down, trends in population growth and increasing income disparity tendto drive it higher. Indeed, as will be seen in Section 3, the Reference scenario analysisshows that conventional development assumptions alone are not likely to lead to thesereductions. Rather, the number of people in hunger, to take one example, would notdiminish.
As expressions of different faces of poverty, the social needs represented by thevarious indicators have common roots. In assessing and constraining scenarios, we shallfind it convenient to focus attention on a single indicator to highlight results and to boundthe technical analysis. In particular, hunger-reduction targets will play a critical role inevaluating the sustainability of Reference scenarios and in defining targets for PolicyReform scenarios. A reduction in hunger is correlated with the alleviation of the entirenexus of unfulfilled basic needs associated with absolute poverty. The broad correlationbetween hunger levels and other aspects of poverty is apparent from the data in Table 3.In addition, there are virtuous circles coupling progress across a number of indicators; forexample, reducing hunger also reduces vulnerability to disease, and in turn improvesaccess to livelihoods and food entitlements.
The reduction of absolute human deprivation as discussed here is a necessarycondition for a humane transition to sustainability. However, it may not be sufficient. Inparticular, improved social equity within societies may be an important goal in its own

14 Raskin, Gallopin, Gutman, Hammond and Swart
right, not merely as one mechanism for eradicating poverty. At issue is the possible linkbetween social equity and social cohesion — between the perceived sense of fairness inthe distribution of wealth and privilege in a society on the one hand, and allegiance toprevailing social institutions on the other. Inegalitarian societies are likely to besusceptible to relatively high rates of political violence and social instability (Gurr, 1968;Muller and Seligson, 1987; Muller, 1988), though the detailed empirical findings aredebated (Wang, 1993). We must be satisfied here with simply noting the linkage betweensocial sustainability and distributional equity, and observing that strategies for alleviatingpoverty by moderating social inequality, may also enhance social stability.
2.2 Environmental ObjectivesIn principle, changes to the Earth’s environment that are irreversible on human time scalesare not sustainable, since they diminish the opportunities for future generations. Inpractice, there is an inherent tension between such a strong formulation of thesustainability principal and more immediate goals, such as meeting current human needsand aspirations. Expanding food production may require clearing land for farming orwithdrawing more water from streams for irrigation — putting additional pressure onnatural ecosystems. Providing the jobs, products, and lifestyles of an industrialized, urbaneconomy will require expanded use of energy — potentially increasing pollution.
The proper balance between the goals of sustainability in the long term anddevelopment in the near term is not easily resolved. The relative weight one puts on therights of future generations and current generations has strong ethical and moraldimensions. Complicating the issue further is a lack of scientific certainty on many criticalissues: how will the global climate change in response to rising greenhouse gasconcentrations in the atmosphere? How much pressure from human activities canecosystems withstand before collapsing?
The discussion here will focus on a limited set of environmental objectives. Aswith the social indicators, international conventions and agreements provide a startingpoint for selecting environmental criteria for sustainability. There is broad agreement, forexample, that the stratospheric ozone layer and the global climate should be protected andthat urban and industrial pollution—especially toxic pollution — should be curbed. Thereis agreement that various ecosystems should be preserved so that the services they providecan continue — from water purification to nutrient recycling to providing habitats fordiverse species of plants and animals — and that future generations can enjoy the naturalbeauty and genetic wealth of forests, coral reefs, and the Earth’s biological bounty. Thereis agreement that steps need to be taken to maintain the fertility of soils and preventdegradation or desertification.
Beyond such agreements, however, there is as yet no consensus on how tomeasure progress toward sustainability, although many different groups have proposedsets of indicators for this purpose (Munasinghe and Shearer, 1995; Moldan et. al, 1997).Moreover, lack of data is a serious barrier to making many proposed indicatorsoperational. The indicators chosen for use in this report constitute a minimum but hardlysufficient set.
However measured, global environmental trends are not encouraging. Despite

Bending the Curve: Toward Global Sustainability 15
improvements in reducing some local environmental pollution in OECD countries,pollution levels remain high and are rising rapidly in most developing regions. Pressureson the global commons — the atmosphere and the oceans — are steadily increasing(UNDPCSD, 1997). For example, most marine fisheries are now fished at or abovesustainable levels (FAO, 1991; McGoodwin, 1990) and the incidence of toxicphytoplankton blooms in coastal waters is rising (WRI, 1994). Pressures on forests, coralreefs, and other vital ecosystems and on such renewable but finite resources as freshwaterare also escalating (Bryant et al., 1997; Burke and Bryant, 1998).
A transition to sustainability will require reversing these trends. For the purpose ofsetting plausible targets for the Policy Reform scenario, this report adopts the point ofview that such a transition should and could be completed in the second half of the 21stcentury. This will require abating or reversing, by 2025, the trend of rising pressures fromhuman activity that drive environmental degradation and, by 2050, demonstratingobservable improvements in environmental quality worldwide. These criteria applied toclimate change, for example, would require that global emission of greenhouse gases peakno later than 2025 and that atmospheric concentrations begin to stabilize by 2050, withstabilization completed by 2100.
Indicators and targets are proposed for five environmental issues in Table 5 anddiscussed below. The indicators fall into two broad categories. Climate destabilization,eco-efficiency, and toxic wastes relate primarily to industrial activities and the demands ofmodern lifestyles. Deforestation, degradation of land, over-exploitation of fisheries, andpotential scarcity of freshwater relate, in addition, to poverty and growing populations.The targets call for substantial decreases in the environmental pressures from OECDeconomies. At the same time, the targets for developing countries acknowledge that theprocess of development and industrialization must continue in these regions, and generallypropose that developing regions converge gradually toward the decreasing OECD targets.

16 Raskin, Gallopin, Gutman, Hammond and Swart
Table 5. Environmental Indicators and Targets
Region Indicator 1995 2025 2050
ClimateWorld CO2 concentration 360 ppmv stabilize at < 450 ppmv by 2100
Warming rate average 0.1°/decade, 1990-2100CO2 emissions < 700 GtC cumulative, 1990-2100
OECD CO2 emissions rate various and rising < 65% of 1990(< 90% of 1990 by
2010)
<35% of 1990
non-OECD CO2 emissions rate various and rising increases slowing,energy efficiency rising
reach OECD percapita rates
by 2075
Resource UseOECD Eco-efficiency $100 GDP/300 kg 4-fold increase
($100 GDP/75 kg)10-fold increase
($100 GDP/30 kg)Materials use/capita 80 tonnes < 60 tonnes < 30 tonnes
non-OECD Eco-efficiency various but low converge toward OECD practicesMaterials use/capita various but low converge toward OECD per capita values
ToxicsOECD Releases of persistent
organic pollutants &heavy metals
various but high < 50% of 1995 < 10% of 1995
non-OECD Releases of persistentorganic pollutants &heavy metals
various and rising increases slowing Converge to OECDper capita values
FreshwaterWorld Use-to-Resource ratio various and rising reaches peak values 0.2-0.4 maximum
(in countries>.4 in1995, less than1995 values)
Population in waterstress
1.9 billion(34%)
less than 3 billion(<40%)
less than 3.5 billion,begins decreasing
(<40%)
Ecosystem PressureWorld Deforestation various but high no further deforestation net reforestation
Land degradation various but high no further degradation net restorationMarine over-fishing fish stocks declining over-fishing stopped Healthy fish stocks
ClimateThe long-term goal for climate, as formulated in the Framework Convention on ClimateChange, is to stabilize concentrations of greenhouse gases in the atmosphere, althoughthere is as yet no agreement on when and at what concentration levels stabilization shouldoccur. The approach taken in this report is to first identify a goal for the protection ofecosystems and then, through a chain of arguments, link the ecological goal to arestriction of carbon dioxide emissions. The criterion selected here is that warming shouldoccur no faster than 0.1oC/decade on average between 1990 and 2100, a value that willallow many—but not all—ecosystems to adapt (Rijsberman and Swart, 1990; Hare, 1997).

Bending the Curve: Toward Global Sustainability 17
As will be discussed in Section 3, this implies that the concentration of carbondioxide in the atmosphere should stabilize at less than 450 parts per million by volume(ppmv) by 2100. This constraint, in turn, places limits on the cumulative carbon dioxideemissions from human activities of about 700 billion tonnes of carbon (GtC). Theaggregate global emissions must be allocated to regions and countries. The targetsintroduced here take into account equity and burden-sharing considerations in theallocation of emission rights (see Section 4). Relative to 1990 levels, OECD regions areassumed to decrease emissions 10% by 2010 (more than the tentative targets ofapproximately 5% adopted in the Kyoto accords) and 35% by 2025. All regions approacha common emissions per capita target by 2075. Though ambitious, the targets arenonetheless required if climate stabilization at reasonably safe levels is to be achieved inthe coming century.
Resource UseExtracting, refining, manufacturing, transporting, and ultimately disposing of materials is amajor cause of pollution and waste in industrial societies. These materials include themetals and plastics in automobiles, the chemicals that provide the basis for paints,pesticides, and thousands of other products; and the minerals, fibers, and other naturalresources that comprise everything from clothes to computer chips. As global industrialactivity expands several-fold over the next half century, pollution and wastes and theresulting environmental degradation may also expand, unless there is a transition to acleaner and more efficient — or eco-efficient — industrial system.
To simultaneously increase economic output and reduce environmental stressrequires profound changes in the technological infrastructure of modern societies.Historically, the throughput of materials into economies has risen with economic growth.In the sustainability transition, material use and economic scale must be delinked in aprocess sometimes referred to as dematerialization in order to moderate or reduce thepressure on resources and the environment. There are some signs of dematerializationprocesses now — the use of energy and various materials has grown less rapidly thanGDP in many industrial countries in recent years. However, the expansion of economicactivity has tended to outpace the improvement in efficiency (e.g., the increase in demandfor road transport has exceeded improvements in auto efficiency) so that aggregate use ofmaterials and energy has continued to increase.
In order to stabilize environmental pressure as economies and populations grow,the flow of material into societies must be controlled through designing more durableproducts, reducing waste streams through reuse of materials, and cleaner productionprocesses. Moreover, the mix of economic activity itself must shift (from resource-intensive to knowledge-intensive activities, for example), and ultimately consumerlifestyles may need to change, as well. One aggregate indicator of such a transformation iseco-efficiency, which is defined here as the ratio of economic outputs to natural resourceinputs into an economy. Two useful indicators for resource use are the eco-efficiencyindicator, defined here as the ratio of economic output divided by resources required, andmaterials use per capita.
Current values of the eco-efficiency ratio in the OECD regions are typically about

18 Raskin, Gallopin, Gutman, Hammond and Swart
$100 GDP per 300 kilograms of materials (Adriaanse et al., 1997).7 Material use percapita ranges between about 45 and 80 tons per person per year. The heterogeneouscharacter of the material stream hampers the formulation of sustainability goals formaterial efficiency. In practice, the problem of reducing material intensities will need to bedisaggregated into a number of component flows, indicators, and targets in nationalsustainability plans. Nevertheless, we introduce here provisional aggregate targets tosuggest the direction and magnitude of improved eco-efficiency. The summary goal canbe met by varying improvements across the various material components and sectors. Awidely discussed goal is the reduction of resource intensities by a factor of ten (Factor 10Club, 1995). With this level of improvement in the rich countries, it is possible to preventglobal material requirements from increasing while allowing poor countries to approach anequitable claim on use (Carley and Spapens, 1998).
We take, as a sustainability target for OECD countries, a 10-fold increase in theeco-efficiency ratio by 2050. With this target, $100 of economic output requires only 30kilograms of natural resources, as reported in Table 5. An ambitious but achievableinterim goal is a 4-fold increase in the eco-efficiency ratio by 2025. Allowing foreconomic growth, these targets correspond roughly to a 25% reduction in materials useper capita by 2025 and an additional 50% decrease by 2050.
Developing economies have eco-efficiencies even lower than in OECD regions, butwith generally much lower values of materials use per capita because the level of outputper capita is much lower. In a scenario that assumes a transition to sustainabledevelopment, developing regions may be able to improve rapidly by adopting and adaptingmore efficient technologies and operating practices from developed countries or, in someinstances, leapfrogging to advanced technologies. The sustainability target is thatdeveloping countries converge toward OECD practices in the course of economic growth.
Toxic SubstancesSome forms of resource use have such pronounced environmental impacts that morespecific objectives are needed. An important subset is the widespread industrial use andrelease of toxic substances — such as heavy metals and persistent organic pollutants —that can remain in the environment for long periods of time and accumulate to dangerouslevels in soils and sediments, potentially entering the food chain. Long-lived toxicsubstances pose a growing threat of uncertain magnitude both to human health and toecosystems. International efforts on persistent organic substances are focusing initially onlimits to the production and use of twelve substances (aldrin, dieldrin, endrin, DDT,chlordane, heptachlor, hexachlorobenzene, mirex, toxaphene, PCBs, dioxins, and furans),but have not yet reached agreement on specific targets or timetables.
The target adopted here assumes an intermediate target of a 50% reduction, inOECD countries, of all emissions, discharges and losses by 2025 and a 90% reduction by2050 (allowing some unavoidable emissions related to high priority applications). For
7 Included in the estimates of material requirements are direct inputs of minerals, metals, construction materials, and
biomass from either domestic or foreign sources along with material that is moved or discarded in the process ofextraction and processing.

Bending the Curve: Toward Global Sustainability 19
heavy metals, which tend to accumulate in the soils and sediments, the proposed targetsare the same as for persistent organic pollutants. Use and emissions of toxic substances indeveloping countries are far below OECD levels on a per capita basis but are rising rapidlyand are likely to increase further as industrial activity intensifies. The target set here isthat these increases begin to slow by 2025 and converge toward OECD per capita levelsby 2050.
FreshwaterFreshwater is critical for meeting human needs, supporting economic activity and
ecosystem preservation. It is a finite and vulnerable resource that must be protected andallocated for these diverse needs. Sustainable development requires the provision ofsufficient freshwater of good quality to growing economies, while protecting aquatic andmarine ecosystems. Water sustainability presents one of the major challenges that humansocieties will face in the coming decades (UNDPCSD, 1997; UNEP, 1997; UN, 1997a).
The natural hydrological unit for water assessment is the river basin. Nevertheless,the global situation can be illuminated by introducing indicators of water stress at thenational level, an exercise that was conducted for the recent Comprehensive Assessmentof the Freshwater Resources of the World8 (Raskin et al., 1997). The basic measure ofwater stress that will be used in this study is the use-to-resource ratio, defined as nationalannual withdrawals divided by annual renewable resources. There is no firm relationshipbetween values of this measure and the degree of water stress. Countries differ in theamount of flow lost through floodwater runoff, in the accessibility of surface andgroundwater resources to centers of demand, in down-river claims on water resources,and in the requirements for ecosystem preservation. Nevertheless, when values of theuse-to-resource ratio exceed 0.4 a country is generally experiencing a high level of waterstress. Indeed, signs of imminent competition between user groups, or between humanand natural requirements, can begin when the ratio is as low as 0.1.
In principle, a valid sustainability goal would be that over the next decades waterpressure decreases in all areas where water scarcity threatens to impede development ordegrade ecosystems. In practice, the momentum of growing water requirements isunstoppable. Water withdrawals have increased by nearly a factor of three since 1950(Shiklomanov, 1997), and the continuing momentum of expanding populations,production and food needs will imply continuing growth in water requirements (Section3). Furthermore, if climate change significantly alters hydrological patterns, sustainablewater strategies may be further complicated.
In light of these difficulties, a realistic sustainability goal is that, in river basinswhere freshwater has become or will become scarce, withdrawal requirements should peakby 2025. Specifically, in countries where there are indications of freshwater stress (use-to-resource ratios greater than 0.1), the target is for withdrawals to stop increasing by2025. Since this goal allows for increasing use until 2025 water stress will increase.
8 The Assessment was conducted in response to a 1994 call by the UN Commission for Sustainable Development by
UN/DPCSD, FAO, UNEP, WMO, UNESCO, WHO, UNDP, UNIDO, the World Bank, and the StockholmEnvironment Institute.
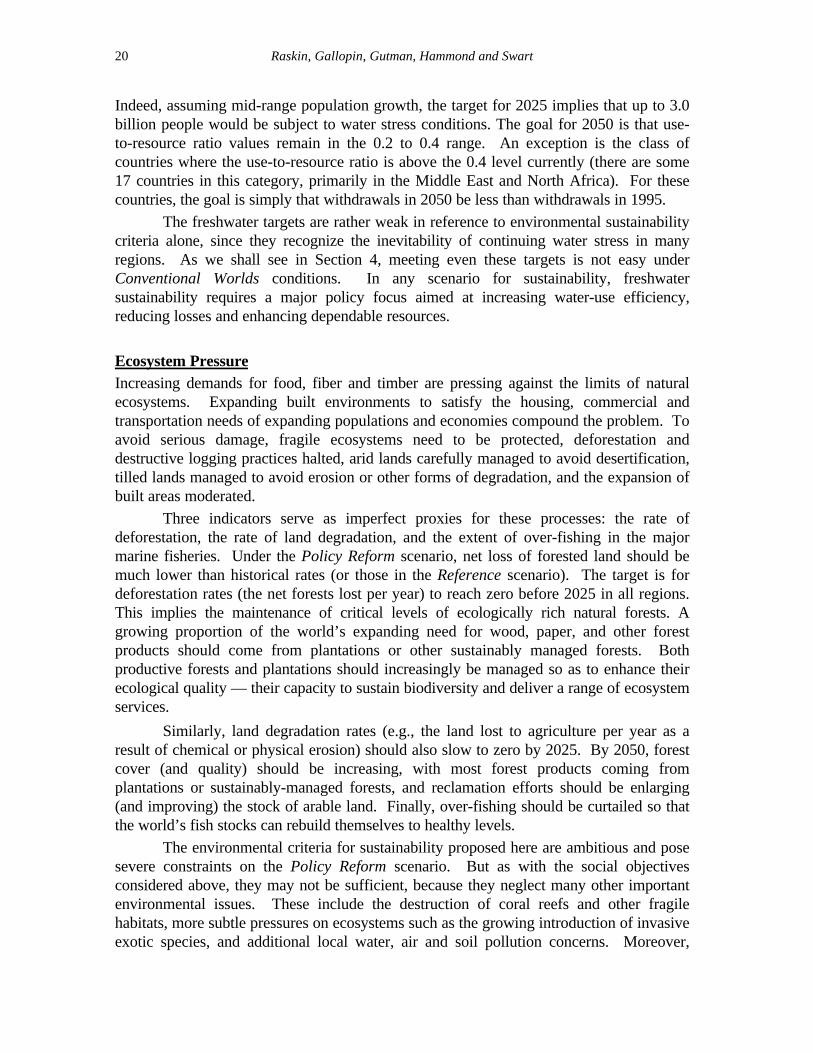
20 Raskin, Gallopin, Gutman, Hammond and Swart
Indeed, assuming mid-range population growth, the target for 2025 implies that up to 3.0billion people would be subject to water stress conditions. The goal for 2050 is that use-to-resource ratio values remain in the 0.2 to 0.4 range. An exception is the class ofcountries where the use-to-resource ratio is above the 0.4 level currently (there are some17 countries in this category, primarily in the Middle East and North Africa). For thesecountries, the goal is simply that withdrawals in 2050 be less than withdrawals in 1995.
The freshwater targets are rather weak in reference to environmental sustainabilitycriteria alone, since they recognize the inevitability of continuing water stress in manyregions. As we shall see in Section 4, meeting even these targets is not easy underConventional Worlds conditions. In any scenario for sustainability, freshwatersustainability requires a major policy focus aimed at increasing water-use efficiency,reducing losses and enhancing dependable resources.
Ecosystem PressureIncreasing demands for food, fiber and timber are pressing against the limits of naturalecosystems. Expanding built environments to satisfy the housing, commercial andtransportation needs of expanding populations and economies compound the problem. Toavoid serious damage, fragile ecosystems need to be protected, deforestation anddestructive logging practices halted, arid lands carefully managed to avoid desertification,tilled lands managed to avoid erosion or other forms of degradation, and the expansion ofbuilt areas moderated.
Three indicators serve as imperfect proxies for these processes: the rate ofdeforestation, the rate of land degradation, and the extent of over-fishing in the majormarine fisheries. Under the Policy Reform scenario, net loss of forested land should bemuch lower than historical rates (or those in the Reference scenario). The target is fordeforestation rates (the net forests lost per year) to reach zero before 2025 in all regions.This implies the maintenance of critical levels of ecologically rich natural forests. Agrowing proportion of the world’s expanding need for wood, paper, and other forestproducts should come from plantations or other sustainably managed forests. Bothproductive forests and plantations should increasingly be managed so as to enhance theirecological quality — their capacity to sustain biodiversity and deliver a range of ecosystemservices.
Similarly, land degradation rates (e.g., the land lost to agriculture per year as aresult of chemical or physical erosion) should also slow to zero by 2025. By 2050, forestcover (and quality) should be increasing, with most forest products coming fromplantations or sustainably-managed forests, and reclamation efforts should be enlarging(and improving) the stock of arable land. Finally, over-fishing should be curtailed so thatthe world’s fish stocks can rebuild themselves to healthy levels.
The environmental criteria for sustainability proposed here are ambitious and posesevere constraints on the Policy Reform scenario. But as with the social objectivesconsidered above, they may not be sufficient, because they neglect many other importantenvironmental issues. These include the destruction of coral reefs and other fragilehabitats, more subtle pressures on ecosystems such as the growing introduction of invasiveexotic species, and additional local water, air and soil pollution concerns. Moreover,

Bending the Curve: Toward Global Sustainability 21
scientific understanding of the Earth system is still fragmentary. It would be unwise toassume that additional, unexpected, and possibly urgent environmental concerns will notarise.
Future increases in economic activity will tend to aggravate environmental stress.Indeed, the Reference scenario analysis in Section 3 shows that under conventionaldevelopment assumptions and weak environmental and social policies, the indicators ofenvironmental sustainability are likely to drift further and further away from thesustainability targets. Nevertheless, economic development is not only probable, but alsodesirable if the social goals for sustainability described earlier are to be met. This definesthe challenge for policy in the transition to a sustainable world.

22 Raskin, Gallopin, Gutman, Hammond and Swart

Bending the Curve: Toward Global Sustainability 23
3. THE PROBLEM OF UNSUSTAINABILITYIn the previous section, sustainable development goals were expressed in terms of specifictargets for key social and environmental indicators. These provide an operationalframework for defining the quantitative requirements for a sustainability transition and fordevising strategies for inducing such a transition. Naturally, the set of indicators can beexpanded and the targets refined. Moreover, the global perspective must becomplemented with indicators and targets for guiding sustainable development at regional,national and local levels.
In the spirit of adaptive management, sustainability criteria will need to be revisedfrom time to time in response to new information and priorities. Nevertheless, ourprovisional suite of sustainability criteria offer reasonable initial directions for navigatingtoward sustainable development — and for weighing how far off course current trendsmay be taking us, the topic to which we now turn.
3.1 Reference ScenariosThe tension between the current patterns of world development and sustainability goalscan be illustrated with Conventional Worlds-Reference scenarios. A Reference scenario isa story of a market-driven world in the 2lst Century in which current demographic,economic, environmental, and technological trends unfold without major surprise.Continuity, globalization, and convergence are key characteristics of world development— institutions gradually adjust without major ruptures, international economic integrationproceeds apace and the socio-economic patterns of poor regions converge slowly towardthe model of the rich regions.
Reference scenarios are distinguished from Conventional Worlds-Policy Reformscenarios, the topic of the next section, by the absence of strong and coordinated actionfor achieving sustainability goals. Rather, policy focuses heavily on the removal ofbarriers to markets at national and international levels (OECD, 1997). In the internationalarena, an integrated world economy is promoted through liberalization of trade andfinance. At the national level, the push is for thorough and rapid structural adjustment,deregulation, and privatization.
A number of trends and forces already in the pipeline drive Reference scenariosforward. The global population becomes larger, more urban and older. Expanding globaltrade, financial transactions and capital flows drive economic growth. The free cross-border flow of goods, services and capital becomes a reality. Transnational corporationsincreasingly dominate economic activity and enjoy growing political influence. Spurred bymodern media and information technology, people everywhere and especially the youngare drawn to consumerism. Materialism and individualism spread as core human values.
Despite economic growth, extreme income disparity between rich and poorcountries, and between the rich and poor within countries, remains a critical social trend.Environmental transformation and degradation is a progressively more significant factor inglobal affairs. Technology is a continuing source of change through advances ininformation technology, biotechnology and myriad innovations that change the way we

24 Raskin, Gallopin, Gutman, Hammond and Swart
produce and consume. The trends are allowed to play out without major changes inpolicy.
3.2 An IllustrationThough many variations are possible, a specific quantitative example can shed light
on the implications of Reference scenarios for sustainability in the next century. Byincorporating conventional mid-range assumptions in our illustration, the main contours ofa business-as-usual future are revealed. In that spirit, demographic, economic andtechnology assumptions are drawn from international assessments wherever possible, e.g.,United Nations projections and the scenarios of the Intergovernmental Panel on ClimateChange (IPCC, 1990; 1992a).9
A global overview of the scenario is presented in Figure 4. Relative to 1995values, world population increases by slightly more than 50% by 2050, income (expressedas GDPPPP per capita10) grows to over 2.5 times the 1995 value, and economic outputmore than quadruples. Food requirements almost double, driven by growth in populationand income. Despite higher incomes and greater agricultural output world hunger remainsalmost constant, the result of population growth and unequal access to food.Requirements for energy and water increase by factors of 2.4 and 1.6, respectively.Resource requirements grow less rapidly than the economy as a whole in the scenario fortwo reasons: improving efficiency of use and a gradual shift toward less resource-intensiveeconomic activities. Global carbon dioxide emissions from energy use, a major driver ofglobal warming, increase by a factor of 2.4 over the scenario period. Increasing landrequirements for agriculture and human settlements leads to a 17% drop in forest area.
9 Technical details on the scenario are presented in Heaps et al. (1998). The Conventional Worlds-Reference
scenario is an update of the Conventional Development scenario (CDS) (Raskin et al., 1996). The CDS waselaborated in separate reports on energy (Raskin and Margolis, 1995), food and agriculture (Leach, 1995), water(Raskin et al., 1995, 1997) and toxic substances (Jackson and MacGillivray, 1995). RIVM/UNEP (1997) assessedthe environmental implications of the CDS, while UNEP (1997) and DPCSD (1997) considered the scenario from apolicy perspective. The base year in the Conventional Worlds-Reference is 1995 versus 1990 in the CDS, andconsiderable additional data and research are incorporated.
10 GDP expressed using purchasing power parity is denoted by GDPPPP, to distinguish it from GDP expressed atmarket exchange rates, GDPMER.

Bending the Curve: Toward Global Sustainability 25
0
1
2
3
4
5
Population GDP perCapita
WorldGDP
FoodDemand
Hunger PrimaryEnergy
Water CO2Emissions
ForestArea
Rel
ativ
e to
199
5199520252050
Figure 4. Global Overview of the Reference Scenario
The global results mask considerable regional variation in economic, social andenvironmental patterns. The scenario analysis in this report is conducted for the ten majorregions shown in Figure 2. Regional results are collected in the Annex as a series of tablesand graphs. The population assumptions in the Reference scenario are summarized onSheet D-1. In these mid-range projections, world population approaches 10 billion duringthe middle of the next century (UN, 1997) with nearly all the growth occurring in thedeveloping regions. Of the net increase of 3.7 billion people by the year 2050, only 2% isin the OECD regions. The populations in Eastern Europe and the former Soviet Unionactually decrease slightly in the scenario. The world continues to become more urban asthe population in cities rises from 2.5 billion in 1995 to 6.7 billion in 2050 at which time72% of the world population will live in cities (Sheet D-2).
Economic trends based on mid-range assumptions (IPCC, 1992a) are highlightedin Sheets E-1, E-2 and E-3. Global GDPPPP increases from $33.4 trillion in 1995 to over$145 trillion in 2050, an average growth rate of 2.7% per year. The higher growth rate indeveloping region economies, about 3.4% per year, causes their share of world product torise from about 40% to 60%. The immense scale of the economy implied by theseassumptions is illustrated by the case of China+ where the GDPPPP in 2050 is greater thanthe whole of the OECD today.
In all regions, GDPPPP growth exceeds population growth, so GDPPPP per capita(or “income”) increases in every region (see Sheet E-3). The projections show a gradualconvergence of the developing regions toward the industrialized ones in the sense that theratio of average income of the OECD regions to that of the non-OECD decreases from6.5 to 5.5. At the same time, the absolute difference between OECD and developingregions increases from about $17,000 per capita in 1995 to $47,000 per capita by 2050.In general, the scenario is one of wide prosperity by mid-century in which developingregions approach standards of living enjoyed in Western Europe circa 1980 while OECDincomes soar, reaching $73,000 per capita in North America.

26 Raskin, Gallopin, Gutman, Hammond and Swart
As the scale of economic output grows in the scenarios, the structure of economicactivities changes. The share of GDP from agriculture continues to decline, a pattern longassociated with the process of industrialization and development. Moreover, asconsumption patterns shift toward greater emphasis on services and light manufacturing,the share of industry in economic output declines. These patterns are reflected in Sheet E-2. Finally, the composition of industrial production from heavy industry decreases in thescenario reflecting de-materialization trends in advanced economies (Williams et al., 1987;Bernardini and Galli, 1993). Specifically, in OECD regions output per capita of resource-intensive industries remains constant (non-ferrous metals, paper and pulp, and chemicals)or decreases by about 10% (iron and steel and non-metallic minerals). Non-OECDregions converge toward these patterns as GDPPPP per capita increases.
The economic expansion assumed in the scenario drives energy demand higher (seeSheet En-3). The energy needs in developing regions grow by a factor of 3.7, reaching60% of world demand by 2050 compared to 40% today. By the end of the scenarioperiod, the energy requirements of China+ approach those of North America, while theenergy requirements of South and South East Asia exceed them. While significant, energygrowth is less than economic growth, a result of the changing composition of economicactivity and the continued penetration of more energy-efficient devices and practices. Putanother way, aggregate energy intensity (the ratio of energy requirements to GDP)decreases globally from 11.5 to 6.4 MJ/$GDPPPP between 1995 and 2050 (Sheet En-1).11
While fossil fuels continue to dominate in energy production (see Sheet En-2), there is anotable absolute expansion in renewable and nuclear energy, by factors of 2.2 and 2.5,respectively.12
Population increases and diet changes drive the near doubling of world foodrequirements. The Reference scenario assumes continuity with past trends. Dietarypatterns adjust with rising incomes, including greater food consumption in developingregions, with an increasing share of calories derived from animal products (Sheet F-1).The demand for fish and other seafood increases in the scenario from roughly 100 milliontonnes per year currently to 170 million tonnes by 2050 (Sheet F-3). Assuming thatmarine resources, which are already overtaxed, remain steady at about 85 million tonnes,this requires substantial expansion of aquaculture (Sheet P-9), which adds to theagricultural requirements for feed.
On the production side, the scenario shows increased agricultural output in allregions. In the OECD regions as a whole, production of animal and crop productsincreases by almost 40% between 1995 and 2025 (Sheets F-2 and F-4, respectively). InEastern Europe and the former Soviet Union, production rebounds from the collapseduring the 1990s and then expands, as these regions become significant agriculturalexporters. In Africa and the Middle East, populations nearly triple by 2050 and food 11 Energy units are defined in the appendix.12 To convert renewable energy to primary energy equivalents, this study uses the International Energy Agency
convention, which expresses hydropower and non-biomass renewables in their electrical energy equivalent(assuming 100% conversion efficiency). Since other studies (e.g., WEC/IIASA, 1995) express these as thermalenergy equivalent values, which increases the reported values by about a factor of 3, care should be taken incomparing results.

Bending the Curve: Toward Global Sustainability 27
requirements go up even faster due to increased caloric intake and more reliance on meatproducts. To meet the growing demands, agricultural production more than triples andimports rise — from about 37% of total requirements in 1995 to almost 44% by 2050 inthe Middle East and from 12% to almost 15% in Africa. Both China+ and South andSoutheast Asia maintain self-sufficiency in rice production, although rice declines as afraction of the total diet in these regions in preference to other grains, meat and higher-valued crops.
Underlying the increase in production in the scenario are assumptions on yieldimprovements, and expansion of pastureland and cropland. The scenario is broadlycompatible with the results of recent assessments of the prospects for world agricultureover the next two decades such as those of the Food and Agriculture Organization(Alexandratos, 1995) and the International Food Policy Research Institute (Rosegrant, etal., 1995). It shares their optimism of sustained improvement in agricultural performance.Yields gradually increase in all regions (Sheet F-5), the result of greater reliance onirrigated farming (Sheet F-7), and assumed improvements in plant varieties and farmpractices. Global average cereal yields increase by about 1.3% per year between 1995 and2025 and 0.8% per year between 1995 and 2050. While these increases are substantial,they are less than the 2.2% cereal yield improvement per year between 1961 and 1994, inpart due to constraints on the expansion of irrigated farming (Leach, 1995). In addition tothe intensive increases in yields, farmland expands extensively into forests and pasturelands (Sheets F-6 and P-6). The expansion is checked by the reduced availability ofsuitable land, constraints on irrigation expansion due to rising costs and limited freshwaterresources and competition for land-use. Globally, farmland increases some 10%, mostly inAfrica. Irrigated farm area increases slowly from 250 to 288 million hectares, remaining ataround 18% of total farmland throughout the scenario (Sheet F-7). In addition, thenumbers of harvests per year (“cropping intensities”) gradually grow, further increasingfarm output per area (Sheet F-5).
On the demand side, the requirements for food and other agricultural products risewith income. At the same time, higher-valued foods are slowly substituted for cerealstaples as incomes rise. An exception is in North America, where health concernscontinue to cause a gradual decline in reliance on animal products. In this picture, enoughfood can be produced to feed growing populations, a conclusion that is subject toimportant caveats: sufficient water must be available, serious land degradation andagrochemical pollution must be avoided, and trade flows from rich to poor regions mustnot face impediments. Finally, the problem of access to food among the very poor willremain and hunger will persist, as we discuss in Section 3.3.
The issue of water sufficiency and quality requires special attention. During the1990s, awareness that water may be a limiting factor for development has grown, alongwith the recognition of water as a finite and fragile resource for ecosystem maintenance.The character of the looming water problem and strategies for the future were developedin a series of international meetings and studies including the Rio meeting (UNCED,1992), the Comprehensive Assessment of the Freshwater Resources of the World (SEI,1997) and the United Nations Commission on Sustainable Development (UNCSD, 1998).

28 Raskin, Gallopin, Gutman, Hammond and Swart
Water use increased four-fold between 1940 and 1990, driven by irrigationexpansion, population growth, and economic development (Shiklomanov, 1993). Aswater requirements rise, so does competition over the entitlement to finite waterresources. The competition takes multiple forms depending on the conditions at the riverbasin level — between the farm and the city, between environmental and human use, andbetween upstream and downstream riverine countries.
In the Reference scenario, water requirements for development continue toincrease driven by growing populations, economies and agricultural requirements. Globalwater requirements grow by a factor of 1.6 over the scenario period, and in developingregions by factors ranging from 1.7 in China+ to 2.2 in Africa (Sheet P-1). Whilesubstantial, the pace of water demand growth is much slower than was experienced overthe past 50 years, an average growth rate of about 0.9% per year versus about 2.5% peryear historically. There are three reasons for the moderation in growth rate: slowerexpansion of irrigated lands, shifts in the composition of economic activity toward lesswater intensive sectors, and greater efficiency in water use. The changing sectoral patternof water use is summarized in Sheet P-2. Note that about 70% of current globalfreshwater withdrawals are for irrigation, decreasing to about 60% by 2050.Nevertheless, the absolute requirements for irrigation water increases by almost 50% asagricultural land under irrigation gradually expands (Sheet F-7), increasing by 15% by2050, and more water is taken up by higher yielding plants (Raskin et al, 1997).
3.3 Environmental RiskThe Reference scenario presents a picture of increasing resource use and environmentalpressure. By comparing these patterns to the sustainability goals introduced in Section 2,the scenario provides a benchmark for gauging — in the absence of major course changesin technology, demographics and consumption patterns — the degree and character ofenvironmental unsustainability.
3.3.1 Climate change
The proposed sustainability goal is to limit human-induced temperature change to no morethan 0.1° per decade, or a cumulative change of about 1.1° between 1990 and 2100.13
The rising temperatures are caused by increases in the atmospheric concentration ofgreenhouse gasses, which trap some of the heat generated by sunlight falling on the earth’ssurface. As a consequence, eventual stabilization of average global temperature willrequire stable levels of greenhouse gasses in the atmosphere. These concentrations, inturn, are determined by the rate at which the gasses are emitted to and absorbed from theatmosphere as a result of both human activity and natural processes.
13 Climate models relate changes in atmospheric concentrations of greenhouse gasses to estimates of changes in
equilibrium temperature from pre-industrial levels. Due to inertia in the climate system, it may take severaldecades to reach such equilibrium. The target of experienced temperature changes of about 1.1° (all temperaturesare reported for the Celsius scale) between 1990 and 2100 corresponds roughly to a committed change of about 1.5° over that period. Assuming greenhouse gas concentrations stabilize in 2100, and including the estimated 0.5°increase already experienced between pre-industrial times and 1990, the total change due to human activities underthese conditions would be ultimately about 2°.

Bending the Curve: Toward Global Sustainability 29
Are climate goals met in the scenario? The answer to this question requiresseveral stages of analysis. First, the sustainability goal, expressed above in terms oftemperature change, must be linked to a corresponding level of atmosphericconcentrations of carbon dioxide and other greenhouse gasses. Second, theconcentrations must be related to an allowable cumulative quantity of CO2 emissions fromhuman activity. Finally, this “carbon budget” for meeting the sustainability goal must becompared to the emissions computed for the scenario. In the Policy Reform scenariodiscussed in Section 4, the goal is imposed on the scenario and the global carbon emissionbudget is allocated to regions (and ultimately countries) on the basis of economic,technological and equity considerations, and political feasibility.
In order to link equilibrium CO2 concentrations to temperature change,assumptions must be made about the contributions of greenhouse gasses other than CO2.Also, the estimated temperature change depends upon the assumed value for the climatesensitivity parameter — the equilibrium temperature change associated with a doubling ofCO2 concentration. The climate sensitivity is estimated by the IPCC to lie within the range1.5° to 4.5° (IPCC, 1996). Assuming a climate sensitive of 2.5°, global mean temperatureis estimated to increase by about 1.0° between 1990 and 2100, assuming an equilibriumCO2 concentration of 450 ppmv and a range of non-CO2 gas emissions profiles (IPCC,1997). This 1.0° change is close to the sustainability goal of 1.1° temperature change overthe same period. This suggests an equilibrium concentration target of about 450 ppmv asa reasonable goal for policy.
The relationship between atmospheric CO2 concentrations and cumulativeemissions is summarized in Figure 5. Shown in the figure are long-term equilibriumconcentrations for atmospheric carbon ranging from 350 parts per million by volume(ppmv) to 750 ppmv and the corresponding cumulative carbon emissions from humanactivity between 1990 and 2100 (IPCC, 1995). The carbon sources are primarily fromenergy combustion and net biomass loss through deforestation and land clearing. Theuncertainty ranges reflect differences in the outputs of carbon cycle models, whichsimulate the interactions between atmospheric, oceanic and terrestrial systems. The policytarget of 450 ppmv corresponds to a cumulative carbon emissions allowance between1990 and 2100 in the 640-800 GtC range.

30 Raskin, Gallopin, Gutman, Hammond and Swart
0
250
500
750
1,000
1,250
1,500
350 450 550 650 750Atmospheric CO2 Concentration (ppmv)
Cum
ulat
ive
CO
2 E
mis
sion
s to
210
0
(GtC
)
Figure 5. CO2 Emissions to 2100 Corresponding to Different Stabilization ConcentrationsSource: IPCC (1995)
We stress that the goal of 450 ppmv is conservative in that it accepts thatconsiderable global change is inevitable. Also, if the higher values in the climate sensitivityrange (that is, 4.5°) turn out to be more accurate, an additional 0.5° of climate changewould occur and the sustainability target would be exceeded. Stronger goals —stabilization at 350 ppmv or even a return to the pre-industrial level of 280 ppmv — arearguable from an environmental sustainability perspective.14 But given the recalcitranceto date among key countries for adopting vigorous greenhouse gas abatement strategies, itappears that achieving such ecologically driven goals would indeed require a GreatTransition (Section 1). Within the Conventional Worlds framework, the focus of thescenarios considered in this study, the 450 ppmv goal presents a strong but realizablechallenge for policy.
The Reference scenario does not meet the target. Annual carbon emissions areplotted in Figure 6 along with emissions in the IPCC IS92 scenarios. The Referenceemissions trajectory tracks closely the mid-range IS92a scenario. This correspondence isdue to the underlying compatibility of demographic, economic and technologicalassumptions in the two scenarios. Assuming that the Reference scenario continues tofollow the IS92a path after 2050, cumulative carbon emissions between 1990 and 2100
14 According to Azar and Rodhe (1997): “If the climate system is sensitive to CO2 increases in the IPCC upper
range, then a CO2 concentration of only 550 ppmv will be sufficient to yield a change in average globaltemperature of a magnitude approaching that which occurs during a transition to an ice age; it appears that to keepthe changes in global temperature within the range of natural fluctuations during the past millennium, the climatesensitivity has to be low and the atmospheric CO2 concentration has to be stabilized at around 350 ppmv.”

Bending the Curve: Toward Global Sustainability 31
would be about 1500 GtC (which includes about 80 GtC from tropical deforestation).This is about double the 640-800 GtC cumulative emissions to 2100 required to stabilizeconcentrations compatible with the sustainability goals. The total temperature changebetween 1990 and 2100 ranges from 1.4° to 2.9°, depending on the value of the climatesensitivity parameter (IPCC, 1997), exceeding the sustainability target of 1.1°.
0
5
10
15
20
25
30
35
40
1990 2010 2030 2050 2070 2090
CO
2 E
mis
sions
(GtC
/year)
770
980
1430
1500
1830
Cumulative = 2190 GtC
IS92e
IS92c
IS92d
IS92b
IS92a
IS92f
Reference
Figure 6. Industrial CO2 Emissions in Reference and IPCC ScenariosSource: CSIRO, 1994; IPCC, 1996Note: Emissions from land clearing included in IPCC scenarios (about 80 GtC in IS92a)
Global patterns of carbon emissions in the Reference scenario are reported byregion on Sheet P-4. Annual emissions more than double over the 1995-2050 period.The share of emissions from OECD regions drops from about 50% to 30% over thistimeframe as developing region emissions soar, driven by population growth and the long-range economic and technological convergence assumptions in the scenario. Thechanging regional composition of emissions is striking. In 1995, North America isresponsible for 1.5 GtC emissions, accounting for 25% of the global total. During the firstdecades of the next century, two developing regions — China+ and South and SoutheastAsia — surpass North American emissions. Emissions in Africa increase by over a factorof eight in the scenario.
Despite the rapid rise in developing country emissions in the Reference scenario,substantial inequities remain. Emissions per capita grow much faster in developingregions so there is some convergence — the ratio of the value in North America to that inAfrica is 22 in 1995 but falls to 9 by 2050 (Sheet P-4). Nevertheless, large absolutedifferences in emission loads persist throughout the scenario period, another expression ofthe slow process toward the amelioration of current disparities in economic development

32 Raskin, Gallopin, Gutman, Hammond and Swart
the Reference scenario. Reduction in regional differences in emission rates is an elementof the normative goals defining the Policy Reform (Section 4).
3.3.2 Fossil Fuel Reserves
The question of the adequacy of fossil fuel resources over the long term is closely relatedto the issues of climate change and sustainable energy. Since the oil crises of the 1970s,concern over petroleum reserve limits has vanished from the newspapers and dropped offthe policy agenda. Prices have dropped, new oil fields have been brought into productionand advanced techniques have increased the recovery rates at existing fields. At existingrates of extraction, proven reserves are adequate for 40-50 years. Despite the comfortingoil scene today, from the long-term perspective of the Reference scenario, with rapidgrowth in global demands, the oil problem is likely to re-emerge. Estimates of ultimatelyrecoverable reserves — the total of previously extracted, proved and undiscoveredreserves recoverable — have not increased greatly since the 1960s (Masters et al., 1990).Rather, estimated additional reserves have been gradually reclassified as proved reserves.
Remaining proved and estimated undiscovered oil reserves are approximately 1600billion barrels (WEC, 1995; Masters et al., 1994), of which 1000 billion barrels is proved.15
As the demand for oil grows in the scenario, these reserves would be depleted around2035 (see Sheet En-5). However, according to standard theories of oil exploitation,production decreases may occur much sooner, perhaps as early as 2010 when half of theglobal resource will have been extracted (Hubbert, 1956; Mackenzie, 1996). Thegeopolitics of oil becomes a resurgent theme in the scenario as industrialized regionsincreasingly depend on imports from the Middle East and Latin America (Swart, 1996).
Of course, the gap between oil supply and demand will be closed in practice.Supply might be increased by vast new discoveries of conventional sources, though this isnot likely, or by unconventional options such as tar sands and oil shale. However,exploitation of unconventional resources is likely to pose severe environmental problemsand to be much more costly than conventional crude.16 On the demand side, the pressureon oil resources could be curtailed through massive fuel switching and efficiencyimprovements, options taken up in the Policy Reform scenario (Section 4). In theReference scenario, the heightened risk of economic vulnerability and international conflictchallenges the continuity and growth assumptions of the scenario.
Global proved and undiscovered natural gas reserves are estimated at about 10-15 EJ (WEC, 1995; Masters et al. 1994), roughly 300-400 trillion cubic meters. In theReference scenario, cumulative requirements for natural gas between 1995 and 2050 areabout 200 trillion cubic meters, implying growing stress on reserves, though not as severe
15 A recent critique of industry figures suggests that remaining reserves may only be about 1000 billion barrels
(Campbell and Laherre, 1998), far less than the 1600 billion barrels assumed here. On the other hand, anotherrecent study (WEC/IIASA, 1995) assumes nearly 2100 billion barrels, but these are based on “P05% estimates”,i.e., reserves that are only 5% likely to be met or exceeded.
16 Natural gas hydrates (icy substances composed of methane and water) are a potentially enormous source of fossilenergy, perhaps more than 8500 billion barrels of oil equivalent (WEC/IIASA, 1995), but would also beeconomically and environmentally costly.

Bending the Curve: Toward Global Sustainability 33
as petroleum (Sheet En-5).17 Coal reserves remain abundant despite the increasingdemands in the scenario; environmental concerns are the limiting factor on coal use.
3.3.3 Nuclear energy
The long-term role of nuclear power in addressing the climate problem and a transition tosustainable energy use is a key uncertainty for the future. The nuclear power industryenjoyed an astonishing boom from its inception in the mid-1950s to the late 1980s. In1995, nuclear reactors accounted for 17% of world electricity production. But in recentyears, the industry stagnated, with new construction starts barely keeping pace with plantretirements. Both the rising costs of nuclear energy and public concerns about nuclearsafety have plagued the industry and brought it to a standstill.
Nevertheless, as world electricity demand grows, there will be great pressure toturn to the nuclear option, a relatively abundant and virtually CO2-free resource (OECD,1997). In the Reference scenario, global electricity demand grows by a factor of fourbetween 1995 and 2050, and more than a factor of ten in developing regions. In thiscontext, nuclear installed generating capacity more than doubles by 2050. All of thegrowth is in non-OECD countries, where nuclear energy expands by a factor of 3.5. Thescenario assumes that nuclear cost and safety concerns are mitigated, perhaps through anew generation of modular units with advanced designs. The environmental and resourceproblems associated with growing demands for fossil fuels help to revive the nuclearalternative.
However, serious challenges to the sustainability of nuclear energy will persist.First, another Chernobyl-like accident could trigger renewed public outcry for nuclearmoratoria. Second, the need to contain highly toxic radioactive waste for tens ofthousands of years is an imposition on future generations that does not square easily withthe basic sustainability notion of increasing, not limiting, future options.
Finally, the most vexing problem for nuclear energy may be the link betweencivilian commercial power generation to issues of peace and security. Civilian nuclearprograms have fostered nuclear weapons development in a number of countries.Moreover, an expansion of the global commerce in reactor-grade fuel and plutonium, asenvisioned in the scenario, would increase the danger of the diversion of these materials tonuclear weapons fabrication and to nuclear proliferation. These problems could intensifyas the once-through nuclear technology that dominates today gradually gives way to aclosed-cycle process, in which plutonium is recovered from spent fuel in reprocessingfacilities and resold on global markets. With the growth of nuclear energy comes therising risk that extremist social movements and rogue states gain nuclear weaponscapability. The increased threats to domestic and international security, and the danger ofregional conflicts spiraling out of control, could compromise the institutional stability ofthe scenario.
17 Rogner (1996) suggests that an additional 820,000 EJ unconventional resources (mainly in the form of clathrates)
can be made at least partly available.

34 Raskin, Gallopin, Gutman, Hammond and Swart
3.3.4 Toxic Waste
The material and chemical flows underlying a modern industrial economy are immenselycomplex and are neither well tracked nor well understood. Nearly 100,000 syntheticindustrial chemicals contribute to the toxic and hazardous loads on the environment. Thepathways into the environment of hazardous chemicals and heavy metals are from mineralextraction and refinement processes, emissions at industrial production facilities, anddissipative losses from materials embodied in products. While some of the substances maynot pose environmental or toxicological threats, there is insufficient scientific informationfor assessing about 90% of them (NAS, 1984).
Estimates of current and future values under Reference scenario conditions arecollected in Sheet P-10 (Heaps et al., 1998). Assuming that current practices and levels ofregulatory control persist in developed regions and that developing regions graduallyconverge toward these practices, toxic emissions by 2050 are about three times higherthan current levels. There is a roughly five-fold increase in the developing regions as awhole and an almost two-fold increase in the OECD regions. These increases aresomewhat less than the growth in the global economy, due to structural shifts in outputsand the playing out of current policies.
International efforts to limit waste production remain at current levels in theReference scenario and are unable to initiate the “clean production” revolution required tocounteract the growth in the scale of production and consumption. By contrast, oursustainability goals for persistent organic pollutants (POPs), heavy metals and radio-activewastes are reductions of 50% in 2025 and 90% in 2050 in OECD regions, withconvergence toward the implied emission intensities in developing regions.
3.3.5 Water resources
In the Reference scenario, the pressure on freshwater resources grows more severe in allregions. The situation in Middle East countries, which is already grave, deteriorates, whileproblems deepen in Eastern Europe, China, Africa, and in various river basins elsewhere.Despite the much greater water-use efficiencies assumed in the scenario, population andeconomic growth drive up overall requirements. Of course, regional analysis is far tooaggregate for water assessment and can mask problems at the basin level. Therefore, theevaluation of water sustainability for the scenario has been conducted on a national basis(Raskin, et. al., 1997).
In 1995, some 1.9 billion people lived in countries experiencing some water stress(use-to-resource ratio greater than 0.1) and of these nearly one half billion were in highstress areas (ratio greater than 0.4).18 An additional 1.6 billion people had sufficient wateron average, but the supply was unreliable due to variations in precipitation, dependence onimport flows from external sources, or inadequate infrastructure such as storage capacity.In the scenario, the population experiencing some water stress rises to about 4 billion bythe year 2025, with 2.3 billion under high stress. In 2050, nearly 5 billion people contend 18 For each country, the population in water stress is assumed to rise from zero to 100 percent as the use-to-resource
ratio increases from 0.1 to 0.4, with high stress defined as a use-to-resource ratio greater than 0.4 (Raskin et al.,1997).

Bending the Curve: Toward Global Sustainability 35
with water stress, with 3 billion of them, over half of the total, in areas of high stress(Figure 7). Regional water stress indicators are summarized on Sheet P-3, while regionaland sectoral breakdowns of water withdrawals are summarized on Sheets P-1 and P-2respectively. The Middle East, already short of water today, faces a deepening watercrisis, while huge populations in the Asian regions move toward high water stress levels.Africa is another region with increasingly intense water “hot spots.”
0
1
2
3
4
5
1995 2025 2050
billi
ons
of p
eopl
e
SevereStressModerateStress
Figure 7. Population in Water Stress
Finally, the climate change impacts of the scenario may exacerbate the watersituation in vulnerable areas (Alcamo et al., 1997; Morita et al., 1995). Water scarcitywould also pose increasing security risks in shared water basins, such as in the MiddleEast (Wallensteen and Swain, 1997). Finally, competition for scarce freshwater resourceswould hamper attempts to increase access to safe drinking water and sanitation. Far frommeeting our sustainability criteria, water scarcity may be a limiting factor on the robustpopulation and income growth of the Reference scenario.
3.3.6 Land Resources and Biodiversity
In the course of development, human activity alters the landscape. The dynamics of landchange are complex, depending on settlement patterns, agricultural practices, economicgrowth and natural resource industries. Several key factors drive land change in theReference scenario:
• Settlement area. The so-called “built environment” expands onto agriculture, forest,pasture and other land types as populations grow (Sheet D-1) and economiesmodernize. The settled area per person has been increasing historically and currentlyis estimated at 0.13 hectares per capita in North America and 0.06 hectares per capitain Western Europe and Pacific OECD (Heaps et al., 1998). In the scenario, thegrowth is assumed to abate as area per person gradually approaches 0.15 and 0.07hectares in North America and the other OECD regions, respectively. Africa and

36 Raskin, Gallopin, Gutman, Hammond and Swart
Latin America, where population densities are relatively low, converge graduallytoward average OECD values, while other developing regions are assumed toconverge toward the more compact Western European standards (Sheet P-7). With aglobal increase of some 345 million hectares (Sheet P-6), the expansion of settledareas places significant pressure on agricultural lands and valued ecosystems. Settledareas expand into agriculture, forest, rangeland or other land types with the sharesvarying from region to region (Heaps et al., 1998).
• Pasture and Rangeland. The utilization of land for grazing livestock changes in thescenario for several reasons. First, total output of meat products grows, primarily inresponse to population growth and diet changes, and to a lesser extent due to tradeadjustments in these products. Second, the share of livestock in feedlots continues thehistoric pattern of increasing with economic growth, thereby moderating the increasedpressure on grazing lands. These patterns are reflected in the figures reported onSheet F-2. Finally, in developing regions the intensity of livestock production (outputper hectare) increases in the scenario on the assumption that changing pasturingpractices and improved livestock characteristics accompany economic developmentand scientific advances (e.g., related to biotechnology). Despite the increased intensityof use, grazing areas increase in all developing regions (Sheet P-7). The increase is atthe expense of cropland, forest and marginal land. Due to substantial uncertainty incurrent data on all these factors, changing pastureland requirements in the scenario canonly be considered indicative of trends.
• Crop land. New farmland comes from potentially cultivable land under forest,pasture and rangeland (Sheet F-8), with the shares varying by regions (Heaps, et al,1998). In addition, in some regions agriculture expands onto marginal land, which willrequire considerable inputs and careful management.
• Land degradation. Unsustainable land-use practices can lead to various forms ofland degradation including wind and soil erosion, soil compaction, waterlogging,salinization and nutrient depletion. Global land degradation of various degrees ofseverity has been estimated at 2 billion hectares in the last fifty years, or nearly aquarter of agricultural land, forest, woodland and pastureland (Oldeman et al., 1991).Much of the effect of the degradation is reflected in diminished yields anddeforestation assumptions. The quantity of land so severely degraded that it isremoved from agriculture production has been reported at from 5-10 million hectaresper year (Kendall and Pimentel, 1994) though the basis for these estimates is weak andthey may be high (Alexandratos, 1995). In the Reference scenario it is assumed thatabout 3 million hectares per year are withdrawn from agricultural production globallydue to severe land degradation.
The combined effect of these various factors is to alter regional land cover. Inparticular, the area under forest decreases by nearly 700 million hectares during the 1995to 2050 period, a loss of about 17% of existing forest stands. Deforestation by region isreported in Figure 8. The Reference scenario forest loss rate is compatible with recenttrends in which over 200 million hectares were lost between 1980 and 1995 (FAO,1997b). The scenario is consistent with other “business-as-usual” scenarios, which

Bending the Curve: Toward Global Sustainability 37
generally suggest that deforestation persists during the first decades of the next century(Alcamo et al., 1995).
0
500
1,000
1,500
2,000
2,500
1995 2025 2050
mill
ion
hect
ares
S+SE AsiaLatin AmericaChina+ Africa
Figure 8. Forest Areas in Developing Regions in the Reference Scenario
As a result of the competing pressures, land change in general, and deforestation inparticular, is substantial under Reference scenario conditions. For example, the target forenvironmental sustainability (Section 2) of decreasing annual rates of deforestation towardzero by 2025 and reforestation after that point are severely violated. Instead,deforestation rates are about 12 million hectares per year throughout the 1995-2025period and, rather than reversing, continue after that period at about the same rate.Moreover, the maintenance of protected forest areas, let alone their expansion, would notbe easy in the scenario with its free market emphasis and avoidance of governmentintervention. With respect to sustainable use of land resources — and biodiversitypreservation that is closely correlated with the maintenance of ecosystem integrity — theReference scenario fares poorly.
3.4 Persistent PovertyThe Reference scenario presents a picture of increased pressure on resources and theenvironment. If the environmental criteria for sustainability are to be met, policies will beneeded to induce alternative patterns of resource use and to stimulate the development anddeployment of better technologies. The kinds of adjustments necessary to meetenvironmental goals will be taken up in the Policy Reform discussion (Section 4).
The Reference scenario also is problematic with respect to the social goalsintroduced in Section 2. We focus on the changing levels of poverty in the scenario andthe manifestation of poverty in the form of chronic hunger, lack of clean water and othershortfalls in the provision of basic needs. The number of people in poverty in any countrywill depend on several factors. On the one hand, all else equal, population growth in thescenario (Sheet D-1) will increase the absolute numbers of impoverished people. On the

38 Raskin, Gallopin, Gutman, Hammond and Swart
other hand, the rapid growth assumed for average income will tend to reduce poverty(Sheet E-3). The third key factor is the manner in which income is distributed over thepopulation. If the trend in income distribution is toward more egalitarian distributions, theeffect will be to reduce poverty. Increasing inequality will exacerbate poverty levels.
To proceed, we must further examine income distribution patterns. Nationalincome distributions are typically skewed, with most of the population concentrated atlower incomes. A useful measure of the degree of inequality in a given society is the Ginicoefficient. The Gini coefficient is defined with reference to the Lorenz curve, a plot ofthe fraction of total income held by a given fraction of the population, beginning with thelowest-income populations (see Figure 9). In a society where everyone has the sameincome, the Lorenz curve would be a straight line, while in actuality the curves take theconcave form as illustrated in the figure. The Gini coefficient, a measure of the deviationof an actual income distribution from a condition of perfect equality, equals the ratio of theareas A/(A+B). The coefficient ranges from values of zero (complete equality) to one(extreme inequality).
B
A
0
0.2
0.4
0.6
0.8
1
0 0.2 0.4 0.6 0.8 1
Cumulative population fraction
Cum
ulat
ive
inco
me
frac
tion
Gini coefficient = A/(A+B)
Figure 9. The Lorenz Curve and Gini Coefficient
The degree of income inequality found in the world today varies widely fromcountry to country. Gini coefficients by region are presented in Sheet S-1, computed byaveraging country level coefficients weighted by population (Heaps et al., 1998). Notethat the values of the Gini coefficient range from around 0.30 to over 0.50.
The trends in the income distribution in the Reference scenario are based on theassumption of a general pattern of regional convergence toward industrial country

Bending the Curve: Toward Global Sustainability 39
standards, in a context of economic globalization and weak social policies to addresspoverty and inequality. For thirty years, inequality has been increasing in the UnitedStates as redistributive social policies have eroded (Figure 10). In the scenario, incomeinequality continues to increase in the United States, but at half the historic rate as policyshifts play out. The Gini coefficient reaches 0.50 in 2050, with other countries graduallyconverging toward this pattern (Sheet S-1). The general trend is one of increasing Ginicoefficients, with the largest increases occurring in the “transitional” regions of EasternEurope and the former Soviet Union.
Gini = 0.0023 x (year -1970) + 0.387
0.37
0.39
0.41
0.43
0.45
0.47
1965 1970 1975 1980 1985 1990 1995 2000
Gin
i Co
effi
cien
t
Figure 10. Historical U.S. Gini Coefficients
Source: U.S. Census (1997)
The assumptions on regional population, economic growth and distributionprovide a picture of changing income distributions in the course of time. This is illustratedfor the United States and China in Figure 11.19
19 Income distributions are approximated throughout this study by a lognormal curve:
( )
+−=22
22)/ln(
2
1
2)( exp σ
σσπave
iii
Pip
where iip ∆⋅)( is the number of people with incomes between i and ii ∆+ , P is total population, iave is the mean
income andσ characterizes the degree of income inequality. The Gini coefficient is an increasing function of σ(Heaps, et al., 1998).

40 Raskin, Gallopin, Gutman, Hammond and Swart
0 10,000 20,000 30,000 40,000 50,000 60,000 70,000 80,000
$ GDP per capita
Inco
me
Dis
trib
utio
n1995
2050
2025
United States
0 2,000 4,000 6,000 8,000 10,000 12,000
$ GDP per capita
Inco
me
Dis
trib
utio
n
1995
2050
2025
China
Figure 11. Changing Income Distributions
We turn our focus now to hunger levels in the scenario — the changing pattern ofchronic undernourishment. In this study, hunger serves as a proxy indicator for poverty(see Section 2). The approach is to define a “hunger line,” the income at which a family orindividual is just barely able to meet the minimum dietary requirement for a normallyactive life (Heaps et al., 1998). This is analogous to the “poverty line,” a minimumincome or expenditure level below which a person or household is barely able to satisfybasic needs requirements. For the poorest countries, the poverty line used by the WorldBank is about $525 per person annually in today’s dollars (PPP). The relationship

Bending the Curve: Toward Global Sustainability 41
between the number of hungry people in a region and the hunger line is shown in Figure12.
# of Hungry
Income
Inco
me
Dis
trib
utio
n
Hunger Line (yH.L.)
Figure 12. Relationship Between Number of Hungry and the Hunger Line
Survey data on hunger and income distribution are used to compute the currentvalues of the hunger line (Heaps, et al., 1998). The hunger line cut-off tends to increaseas countries develop (Figure 13).20 This may be due to decreased access to informalsources of food — informal food gathering is a form of income that is not well-captured inhousehold surveys. Furthermore, as countries grow wealthier, more must be spent onnon-food items even by those just able to acquire the nutrients they need for a normallyactive life. The increase in hunger lines is analogous to the well-known observation thatpoverty lines tend to rise as average incomes do (Ravallion et al., 1991; World Bank,1990). It takes a larger income to barely survive as traditional sources of material supportare eroded in the process of modernization.
20 In the scenarios, hunger lines increase toward $3,670, the current inferred value for the United States, as mean
income approaches $21,880 (based on a linear fit to the data in Figure 13), and remain constant thereafter. Sincewe do not have evidence that hunger lines stop increasing, this may be a conservative assumption.
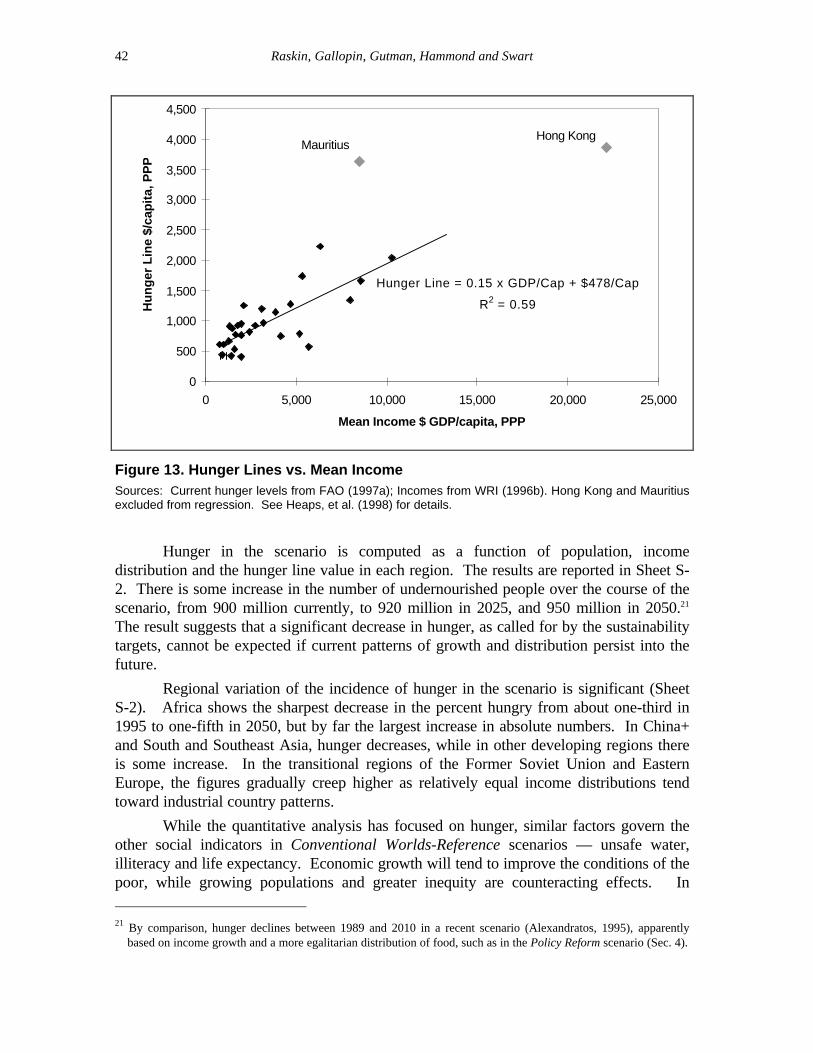
42 Raskin, Gallopin, Gutman, Hammond and Swart
Hunger Line = 0.15 x GDP/Cap + $478/Cap
R2 = 0.59
0
500
1,000
1,500
2,000
2,500
3,000
3,500
4,000
4,500
0 5,000 10,000 15,000 20,000 25,000
Mean Income $ GDP/capita, PPP
Hu
ng
er L
ine
$/ca
pit
a, P
PP
MauritiusHong Kong
Figure 13. Hunger Lines vs. Mean IncomeSources: Current hunger levels from FAO (1997a); Incomes from WRI (1996b). Hong Kong and Mauritiusexcluded from regression. See Heaps, et al. (1998) for details.
Hunger in the scenario is computed as a function of population, incomedistribution and the hunger line value in each region. The results are reported in Sheet S-2. There is some increase in the number of undernourished people over the course of thescenario, from 900 million currently, to 920 million in 2025, and 950 million in 2050.21
The result suggests that a significant decrease in hunger, as called for by the sustainabilitytargets, cannot be expected if current patterns of growth and distribution persist into thefuture.
Regional variation of the incidence of hunger in the scenario is significant (SheetS-2). Africa shows the sharpest decrease in the percent hungry from about one-third in1995 to one-fifth in 2050, but by far the largest increase in absolute numbers. In China+and South and Southeast Asia, hunger decreases, while in other developing regions thereis some increase. In the transitional regions of the Former Soviet Union and EasternEurope, the figures gradually creep higher as relatively equal income distributions tendtoward industrial country patterns.
While the quantitative analysis has focused on hunger, similar factors govern theother social indicators in Conventional Worlds-Reference scenarios — unsafe water,illiteracy and life expectancy. Economic growth will tend to improve the conditions of thepoor, while growing populations and greater inequity are counteracting effects. In
21 By comparison, hunger declines between 1989 and 2010 in a recent scenario (Alexandratos, 1995), apparently
based on income growth and a more egalitarian distribution of food, such as in the Policy Reform scenario (Sec. 4).
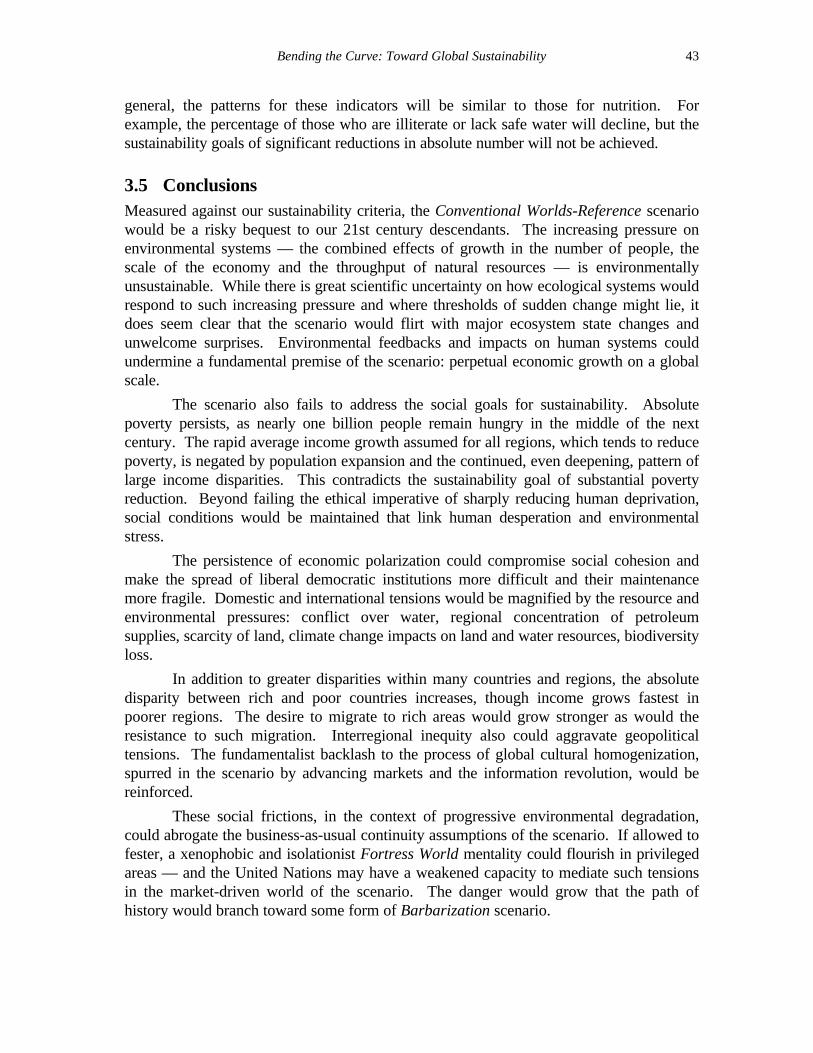
Bending the Curve: Toward Global Sustainability 43
general, the patterns for these indicators will be similar to those for nutrition. Forexample, the percentage of those who are illiterate or lack safe water will decline, but thesustainability goals of significant reductions in absolute number will not be achieved.
3.5 ConclusionsMeasured against our sustainability criteria, the Conventional Worlds-Reference scenariowould be a risky bequest to our 21st century descendants. The increasing pressure onenvironmental systems — the combined effects of growth in the number of people, thescale of the economy and the throughput of natural resources — is environmentallyunsustainable. While there is great scientific uncertainty on how ecological systems wouldrespond to such increasing pressure and where thresholds of sudden change might lie, itdoes seem clear that the scenario would flirt with major ecosystem state changes andunwelcome surprises. Environmental feedbacks and impacts on human systems couldundermine a fundamental premise of the scenario: perpetual economic growth on a globalscale.
The scenario also fails to address the social goals for sustainability. Absolutepoverty persists, as nearly one billion people remain hungry in the middle of the nextcentury. The rapid average income growth assumed for all regions, which tends to reducepoverty, is negated by population expansion and the continued, even deepening, pattern oflarge income disparities. This contradicts the sustainability goal of substantial povertyreduction. Beyond failing the ethical imperative of sharply reducing human deprivation,social conditions would be maintained that link human desperation and environmentalstress.
The persistence of economic polarization could compromise social cohesion andmake the spread of liberal democratic institutions more difficult and their maintenancemore fragile. Domestic and international tensions would be magnified by the resource andenvironmental pressures: conflict over water, regional concentration of petroleumsupplies, scarcity of land, climate change impacts on land and water resources, biodiversityloss.
In addition to greater disparities within many countries and regions, the absolutedisparity between rich and poor countries increases, though income grows fastest inpoorer regions. The desire to migrate to rich areas would grow stronger as would theresistance to such migration. Interregional inequity also could aggravate geopoliticaltensions. The fundamentalist backlash to the process of global cultural homogenization,spurred in the scenario by advancing markets and the information revolution, would bereinforced.
These social frictions, in the context of progressive environmental degradation,could abrogate the business-as-usual continuity assumptions of the scenario. If allowed tofester, a xenophobic and isolationist Fortress World mentality could flourish in privilegedareas — and the United Nations may have a weakened capacity to mediate such tensionsin the market-driven world of the scenario. The danger would grow that the path ofhistory would branch toward some form of Barbarization scenario.

44 Raskin, Gallopin, Gutman, Hammond and Swart
These risks are not inevitable. The tensions inherent in a Reference scenario canbe relaxed if development becomes more sustainable. While a Great Transition in socialarrangements and values may ultimately emerge, the transition to sustainability can besubstantially advanced within a Conventional Worlds paradigm. We turn now to aconsideration of the scope for such Policy Reform scenarios.

Bending the Curve: Toward Global Sustainability 45
4. STRATEGIES FOR A TRANSITIONCan a successful transition to sustainability be achieved within the confines ofConventional Worlds development assumptions? The policy-complacent Referencescenario presents a picture of widening international prosperity in the next century. But itis also a picture with disquieting elements — increasing environmental risk, resourcescarcity, tenacious poverty, and social stress. These threats could well negate thecontinuity assumption that underlies Conventional Worlds futures — steady economicgrowth, gradual globalization, and cultural convergence. In other words, Reference-likescenarios may be both unsustainable and unrealistic. We ask next what types of strategiescould bend the curve of future development toward sustainability goals.
4.1 Policy Reform ScenariosPolicy Reform scenarios maintain the essential assumptions of the Conventional Worldparadigm. The elements are by now familiar — the steady march of economicglobalization, the gradual convergence of all regions toward the evolving model ofdevelopment in industrial regions, and progressive homogenization of global culturearound the values of materialism and individualism. But there is a critical differencebetween the scenarios. In contrast to the Reference scenario, Policy Reform scenariosassume the emergence of a popular consensus and strong political will for taking action toensure a successful transition to a sustainable future. In this context, an integrated set ofinitiatives are crafted and implemented including economic reform, regulatory instruments,social programs, and technology development.
In constructing the Reference scenario, we began with existing global conditionsand drivers of change. We then examined how the future might unfold over time. Adifferent method is required for formulating Policy Reform scenarios. Rather than aforecast into the future, a normative scenario like the Policy Reform scenario isconstructed as a backcast from the future (Robinson, 1990). We begin with a vision of adesired future state, defined by the sustainability goals, and seek to identify plausibledevelopment pathways for getting there. Whereas business-as-usual scenarios pose thequestion of the forecaster — “where are we going?” — normative scenarios add thequestions of the traveler — “where do we want to go? How do we get there?”
Policy Reform scenarios elucidate the requirements for simultaneously achievingsocial and environmental goals of sustainability. The illustrative scenarios developed inthis study are based on the provisional sustainability goals described in Section 2. In someways these two sets of objectives are at cross-purposes — the economic growth requiredfor poverty reduction and greater equity tends to increase environmental pressure. Inother ways they are compatible, since more countries would have the economicwherewithal for greater attention to long-range resource and environmental preservation.
We begin with the conditions for meeting the social goals, specifically the targetsfor the reduction of human deprivation. The demographic, social equity and economicdevelopment assumptions for meeting the social goals in Policy Reform scenarios becomethe drivers of resource use and environmental impact in the scenario. Environmental

46 Raskin, Gallopin, Gutman, Hammond and Swart
sustainability goals are addressed in the scenarios through strategies at the sectoral level— energy, food, land, water, waste. These are discussed in subsequent subsections.
4.2 Meeting the Social GoalsThe absolute number of those in deprivation in the various regions of the world
will be determined by population levels and the entitlement of the poor to the means toobtain food and other basic services (Sen, 1981). In Policy Reform scenarios, povertyreduction and social goals are achieved through increasing the incomes of the poor. Inprinciple, this could be achieved both through structural changes that provide greateraccess to income-generating activities and through welfare transfers, such as direct foodaid. Targeted assistance programs for meeting basic needs must have high priority, asthey address urgent and immediate needs, and can contribute to a self-sustaining processof raising the incomes of the poor (UNDP, 1997). However, a sustainable and resilientresponse to the challenge of poverty reduction must ultimately be reflected structurally inaccess to decent and secure livelihoods.
Population growth is assumed to be lower in Policy Reform scenarios than theReference scenario for two reasons. First, the improved condition of the lives of the verypoor are assumed to be associated with declines in fertility rates as the cycle of poverty isbroken, access to education increases, and women become more empowered. Second,more active family planning efforts in the policy scenario are assumed to reduce thenumber of unwanted pregnancies.
The critical elements in achieving the poverty reduction targets in the PolicyReform scenarios are two types of equity increases. First, greater equity is assumedbetween regions, aided by strategies that lead to more rapid economic growth indeveloping and transitional regions, and faster convergence toward OECD levels ofdevelopment. Second, greater equity within regions and countries is incorporated, as“growth with equity” becomes the prevailing philosophy in national developmentstrategies. Human development indicators become as important as the aggregate growthin gauging national economic performance (UNDP, 1996).
These considerations inform the quantitative assumptions of the illustrative PolicyReform scenario. Non-OECD population in 2025 is taken to be 98% of the UN mid-rangeprojection, and in 2050 to be 95% of the UN value (see Sheet D-1). This is a conservativebut reasonable assumption given the great uncertainty on the drivers of population growth(Bongaarts, 1997). The lower population levels help modestly in meeting the scenariogoals of reducing poverty and environmental stress. In all regions the tendency towardincreasing urbanization persists, as shown in Sheet D-2.
The economic and equity assumptions of the scenario are governed by three keyvariables: world economy, international equity and national equity. The world economy,expressed in terms of global GDP, is a measure of aggregate output, while theinternational equity variable characterizes the level of interregional equity, the manner inwhich the world economic pie is apportioned between poor and rich nations. The measureof international equity is the ratio of average income per capita in non-OECD regions toOECD regions. The current value of this ratio is about 0.15, while perfect interregionalequity corresponds to a value of 1.0.

Bending the Curve: Toward Global Sustainability 47
Future values of these two factors — the scale of the world economy and therelative incomes between rich and poor countries — determine the average incomes ineach country over time. To go beyond average income in order to describe the level ofpoverty in a scenario, we must also specify the income distribution within a given society.The national equity variable is defined here as the ratio of the incomes of the lowest-earning 20% of a population to the highest-earning 20% (alternative ways of representingincome distributions were discussed in Section 3.3). Perfect equity within a given societywould correspond to a value of 1.0. Actual values range widely across countries, e.g.,0.14 in Denmark, 0.08 in the United States, and 0.04 in Brazil. Current average regionalvalues are reported in Sheet S-1 along with values for the illustrative scenarios. It is alsoconvenient to introduce a single global variable describing the average pattern of nationalequity in a given scenario (see Sheet S-1).22
These variables — world economy, international equity and national equity —define a three-dimensional space (Figure 14). For a given year, a scenario appears as apoint in the space. Scenarios move through the space as the values of the variables changeover time. All trajectories depart from a common point, given by current values of theworld economy, international equity and national equity (1995 is the base year in thisstudy). In the course of time, each scenario defines a trajectory.
Reference scenario trajectories are shown in the figure as a family of scenariosconsistent with the underlying narrative and reflecting an uncertainty range across thevariables. The spheres suggest ranges of uncertainty in the variables. The centralReference scenario described in Section 3 traces a path in which the world economyquadruples by 2050, international equity improves gradually, and national equitydecreases.
Policy Reform scenarios also define a family of trajectories in the economic spaceof Figure 14, all of which must satisfy the sustainability goals. A specific goal is therequirement that the number of people who remain hungry in 2025 is one half and in 2050is one-fourth current levels. In principle, there are multiple possibilities for lifting theincomes of sufficient numbers of the very poor above the “hunger line.”23 At one extreme,if national equity continues to decrease, extraordinarily high global economic growth isrequired. At the other extreme, if the world economy grows at the same general levels asin the Reference scenario, then a much more equitable world would be necessary in orderto meet the social goals.
22 The global average value of national equity (X) is computed as the population-weighted average of the national
equity in each country (Xc). Thus, ( )X P X Pt c t c t tc= ⋅∑ , , ,where Pt is global population and the indices c and t
signify country and year, respectively.
23 The hunger line and the approach for linking incomes to estimates of hunger are discussed in Section 3.3.

48 Raskin, Gallopin, Gutman, Hammond and Swart
0.100.15
0.20
0.25
0.30
0.35
1
2
3
4
0.06
0.08
0.10
0.12
0.14
0.16
0.06
0.08
0.10
0.12
0.14
0.16
World E
conomy
(1995 =1)
International Equity
Nat
iona
l Equ
ity
Reference
Policy Reform
2025
2050
20252050
1995
Figure 14. Scenario Trajectories
Note: International Equity = average income in non-OECD/OECDNational Equity = income of poorest 20%/richest 20%
The sphere of uncertainty for the Policy Reform scenario in Figure 14 suggestsranges of economic scale and distribution variables that satisfy the social targets. Inpractice, the set of scenarios of interest is limited to values of the economic growth andequity levels that are both compatible with the scenario narrative and lie within plausibleranges. For example, since economic growth and global convergence are fundamentalpremises of the Policy Reform story, the world economy and international equity variablesmust increase substantially. National equity would also be expected to increase in ascenario where poverty eradication became a policy priority.
At the same time, reasonable upper limits on GDP growth rates over the half-century time horizon of the scenario can be gleaned from an examination of historical data.For example, the growth of the United States economy was around 3% annually over thelast 30 years. Some of the “Asian tiger” economies grew much faster over the sameperiod, by as much as 9% annually in some cases, but that era seems to be drawing to aclose in light of recent economic downturns and instability. Taking a longer perspective,Thurow (1996) claims that “…over the past century, no country’s economic growth ratehas averaged better than 3.6 percent per year.”
The illustrative Policy Reform scenario assumes high but plausible economicgrowth, in light of the robust global economy that is a key premise of the scenario. Theaverage annual GDP growth rate to 2050 is 2.7% for the world and 3.8% for developing

Bending the Curve: Toward Global Sustainability 49
regions (Sheet E-1). To meet the hunger targets under these conditions, national equityneeds to improve. This would be the case even if one were to posit very high averageeconomic growth to 2050. With the levels of inequality assumed in the Referencescenario, GDPPPP in developing regions would have to increase at 6.5% per year to meetthe sustainability target. Such high growth is implausible and implies an immenseexpansion in the scale of the world economy — by a factor of 15 — with correspondinglygreater strains on environmental systems.
In the illustrative Policy Reform scenario, the social targets are met through abalanced combination of effects — relatively strong regional economic growth, significantbut gradual motion toward international equity and maintaining national equity at close tocurrent levels. The scenario satisfies the hunger reduction target of 50% percent by 2025and an additional 50% by 2050 (see Sheet S-2). As a result of differential income growth(Sheet E-3), international equity — the ratio of non-OECD to OECD incomes —increases from 0.15 in 1995 to 0.36 in 2050. Though the gap between rich and poornations is far from closed, the level of international equity is twice that of the Referencescenario.
National equity in the Policy Reform scenario stays roughly constant at about 0.14(Sheet S-2). While this is nearly twice the Reference scenario value in the year 2050, it iswell within the bounds of recent historical experience. For example, the United States hadcomparable levels of national equity as recently as 1970 (Figure 10), while Europe ishigher today. The scenario calls for negating the trends toward high inequity, throughreforms in the policies governing distributional systems — policy reform, not extremeegalitarianism.
The challenges are to simultaneously foster world economic growth, developmentconvergence and greater national equity, while remaining within environmentalsustainability goals. With the Policy Reform economic development assumptions set tomeet the social targets, we turn to the environmental aspects of the sustainabilitytransition.
4.3 ClimateIn a Policy Reform scenario, strategies for the energy sector are strongly influenced byclimate change goals. The sustainability target for climate change is set as an upper limiton global temperature change of 0.1° per decade (Section 2). To achieve this,atmospheric concentrations of carbon dioxide should stabilize at no more than 450 ppmvby the year 2100, implying a cumulative carbon dioxide emission allowance of the order of700 GtC between 1990 and 2100 (Section 3).
The issue of setting goals for carbon emissions has been the subject of considerableinternational negotiation and contention. In these early years of the United NationsFramework Conventions on Climate Change the focus is on near-term targets for carbonreductions for the so-called Annex I countries.24 These more industrialized countries,which have accounted for the bulk of carbon emissions historically, are committed to 24 The Annex I parties to the FCCC correspond roughly to our three OECD regions and the two transitional regions of
Eastern Europe and FSU.

50 Raskin, Gallopin, Gutman, Hammond and Swart
taking positive initiatives to reducing carbon emissions as an initial phase towards acomprehensive agreement. To attain climate stabilization, eventually all countries willneed to adopt greenhouse gas emission constraints. How should the burdens be shared?What levels of allowable emissions are reasonable for each region and country?
An acceptable global agreement must include realistic reduction goals for theindustrialized countries while allowing some emission increases in developing countries aseconomies converge in the course of the 21st century. Some form of equitable emissionrights must ultimately guide long-term policy. These principles are reflected in the PolicyReform scenario. Several conditions determine regional emissions. First, abatementtargets are set for OECD and transitional regions through the year 2025. Second, allregions approach a common per capita emission allowance in the long term. Third,developing region emissions are restricted so that the cumulative global emissions from allregions to the year 2100 are about 700 Gt.
Relative to 1990 levels, OECD regions are assumed to reduce annual emissions by10% in 2010 and by 35% in 2025. The 2010 reduction target is somewhat greater thanagreed at the Kyoto climate meetings (UNFCCC, 1997). The goal for 2025, as we shalldiscuss below, is achievable through policies to promote additional energy efficiency,renewable energy use and forest protection. The transitional regions, where emissionsdropped precipitously between 1990 and 1995 as their economies shrank, increaseemissions per capita between 1995 and 2010 as their economies recover, and then reduceemissions from 2010 onwards.
The assumption of eventual convergence of all countries toward common percapita emissions (or “emission rights” in a tradable permit approach) addresses equityconcerns. The immense disparities in per capita emissions today (Sheet P-4) are the resultof many decades of divergent economic growth between rich and poor countries. Theycannot be eliminated rapidly without politically unacceptable disruption. However, thegoal of eventual equality is compatible with the assumptions in the Policy Reform world ofeventual equity and convergence across regions. In the scenario, it is assumed that annualemissions converge to a common rate of 0.6 tC per capita in 2075, with equal per capitaemissions thereafter. This constrains emissions to about 3 GtC per year by 2100, given themid-range population projections in the scenario, which is required by the climatestabilization goal. Finally, developing country emissions increase substantially over thenext decades, constrained by the global cap on cumulative emissions of 700 GtC and theconvergence target. The emission pattern for each of the three macro-regions, expressedas emissions per capita, is shown in Figure 15.

Bending the Curve: Toward Global Sustainability 51
0.0
0.5
1.0
1.5
2.0
2.5
3.0
3.5
1990 2010 2030 2050 2070 2090
tC/y
ear Transitional
OECD
Developing
World
Figure 15. Energy-Related CO2 Emissions per Capita
In the developing regions, per capita emissions start from a much lower level thanin the OECD or transitional ones. They grow steadily until 2025, without ever exceedingthe industrial or transitional rates, then drop gradually to reach the 2075 convergencetarget. On a global basis, emissions per capita remain almost constant between 1990 and2025, and decrease from 2025 to 2100. Combining emissions per capita with thepopulation projections we obtain total annual emissions in each macro-region, which areplotted in Figure 16. The total integrated emissions from fossil fuel combustion of about700 GtC — the area under the curve in the figure — achieve the sustainability target.
Applying the same approach, emission goals can be assigned at the regional andcountry level (Sheet P-4). The OECD and transitional regions follow the general patternsoutlined above, while emissions in the developing regions follow various paths, dependingon their base year levels and their differing rates of economic growth. Achieving thesecarbon emission constraints requires a significant improvement in the way energy is usedand produced, a topic to which we now turn.

52 Raskin, Gallopin, Gutman, Hammond and Swart
Transitional
OECD
Developing
0
2
4
6
8
10
1990 2010 2030 2050 2070 2090
2 E
mis
sions (
GtC
/year)
Figure 16. Annual CO2 Emissions
4.4 EnergyIf there is to be a passage to an environmentally sustainable world over the next fifty years,an energy transition will be at its foundation. The era of industrial development was basedon the emergence of modern forms of energy — coal, oil, natural gas and electricity —that were abundant, inexpensive and increasingly flexible. But energy has been a scourgeas well as an engine for industrial society, implicated deeply in many of its environmentaldepredations — air and water pollution, acid rain, climate change, oil spills, toxicemissions and many others.
The lesson of the Reference scenario is that gradual energy efficiency improvementand modest renewable energy growth is insufficient to meet sustainability goals (Section3). Aggressive action will be needed on both the demand and supply sides of the energyequation. First, the intensity of energy use (energy requirements per unit of activity) willneed to be significantly moderated through the adoption of highly efficient energy-usepractices. Second, energy supplies must come increasingly from natural gas, as atransition fuel, and ultimately from solar, wind, biofuel and other renewables sources.Assuming appropriate levels of regulation, research, and economic incentives,technologically and economically feasible pathways are available for each region that meetthe stringent constraints imposed by climate stabilization and other environmental goals.
Energy IntensityThe Policy Reform scenario illustrates how a sustainable energy transition might
be realized (Figure 17). Global energy requirements increase from 384 EJ in 1995 to 599EJ in 2050, a 56% increase from present consumption, but 35% lower than the 929 EJ in2050 in the Reference scenario (Sheet En-1). Energy use declines in the OECD by about40% in 2050 relative to 1995 levels, compared to an increase of about 46% in theReference scenario. In the transitional regions, energy requirements remain stable to 2025because improvements in energy efficiency are negated by a strong economic recovery.

Bending the Curve: Toward Global Sustainability 53
Developing region energy requirements increase by a factor of 3.1 between 1995 and2050, less than in the Reference scenario, despite more rapid economic growth (Sheet E-1).
World OECD
0
200
400
600
800
1,000
1995 2025 2050 2025 2050
EJ
Reference Policy Reform
0
100
200
300
1995 2025 2050 2025 2050EJ
RenewablesHydropowerUraniumNatural GasOilCoal
Reference Policy Reform
Transitional regions Developing regions
0
20
40
60
80
1995 2025 2050 2025 2050
EJ
Reference Policy Reform
0
100
200
300
400
500
600
1995 2025 2050 2025 2050
EJ
Reference Policy Reform
Figure 17. Primary Energy RequirementsRenewables include traditional and modern biofuels, as well as other renewable energy forms such as solar, wind, and geothermalenergy.
Energy intensity changes for the Policy Reform and Reference scenarios are shownin Figure 18. In the Policy Reform scenario, the energy required per unit of economicactivity decreases in OECD regions by 70% between 1995 and 2050. In developingregions, the decrease is 60%. In transitional regions, where energy use is currently veryinefficient, energy intensities decrease by 78% between 1995 and 2050. The patterns inthe scenario are developed by first setting goals for OECD regions, based on technologicaland economic feasibility, and allowing gradual convergence toward these standards inother regions as income increases. In the scenario, some degree of technological“leapfrogging” is assumed as developing regions approach best future practices for energy
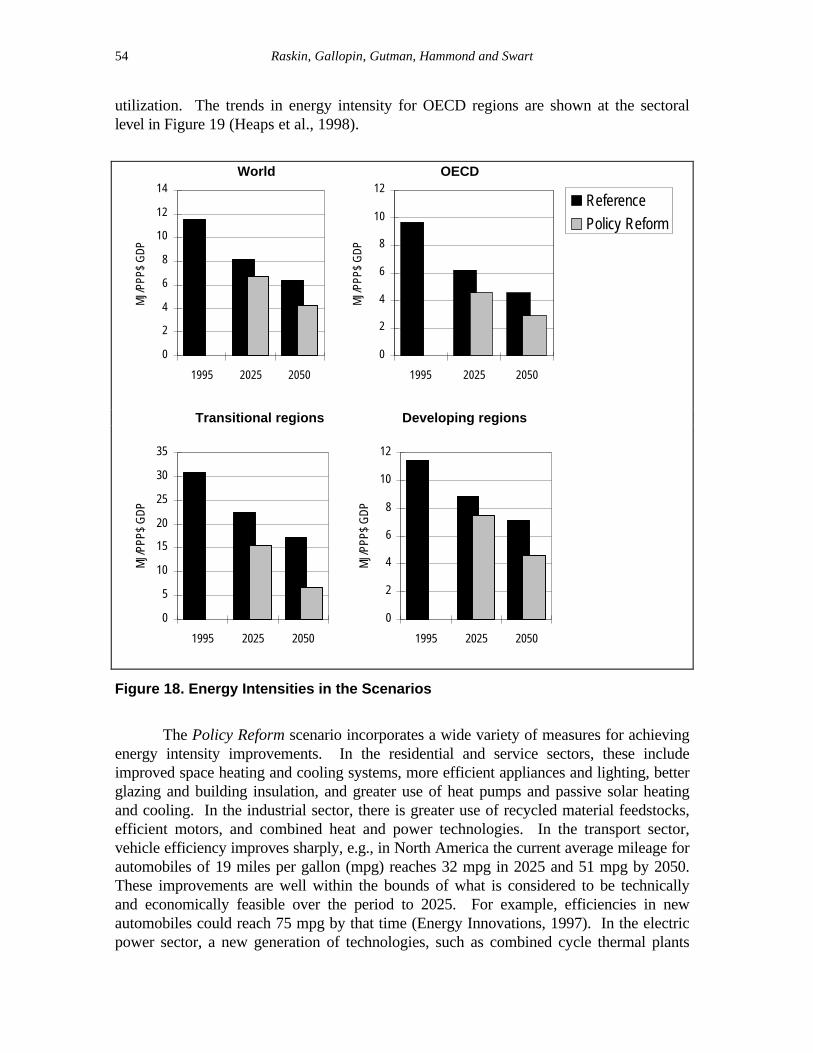
54 Raskin, Gallopin, Gutman, Hammond and Swart
utilization. The trends in energy intensity for OECD regions are shown at the sectorallevel in Figure 19 (Heaps et al., 1998).
World OECD
0
2
4
6
8
10
12
14
1995 2025 2050
MJ/
PPP$
GDP
0
2
4
6
8
10
12
1995 2025 2050M
J/PP
P$ G
DP
ReferencePolicy Reform
Transitional regions Developing regions
0
5
10
15
20
25
30
35
1995 2025 2050
MJ/
PPP$
GDP
0
2
4
6
8
10
12
1995 2025 2050
MJ/
PPP$
GDP
Figure 18. Energy Intensities in the Scenarios
The Policy Reform scenario incorporates a wide variety of measures for achievingenergy intensity improvements. In the residential and service sectors, these includeimproved space heating and cooling systems, more efficient appliances and lighting, betterglazing and building insulation, and greater use of heat pumps and passive solar heatingand cooling. In the industrial sector, there is greater use of recycled material feedstocks,efficient motors, and combined heat and power technologies. In the transport sector,vehicle efficiency improves sharply, e.g., in North America the current average mileage forautomobiles of 19 miles per gallon (mpg) reaches 32 mpg in 2025 and 51 mpg by 2050.These improvements are well within the bounds of what is considered to be technicallyand economically feasible over the period to 2025. For example, efficiencies in newautomobiles could reach 75 mpg by that time (Energy Innovations, 1997). In the electricpower sector, a new generation of technologies, such as combined cycle thermal plants

Bending the Curve: Toward Global Sustainability 55
and integrated coal and biomass gasification provide substantial efficiency increases in themedium term. In the longer term, fuel cell-based technologies and greater use ofcombined heat and power will be required to meet the sector efficiency goals of thescenario.
Household Energy Intensities Industrial Energy Intensities
2
4
6
8
1995 2025 2050
MJ/
$PPP
val
ue a
dded
15
18
21
24
27
1995 2025 2050G
J/ca
pita
Passenger Transport Energy Intensities Thermal Electric Generation Efficiencies
0.5
1.0
1.5
2.0
2.5
1995 2025 2050
GJ/
pass
-km
30%
40%
50%
60%
70%
1995 2025 2050
Reference Policy Reform
Figure 19. OECD Energy Intensity Improvements by Sector in the Scenarios
Fuel Switching
The second prong of a sustainable energy strategy is fuel switching to a greaterreliance on renewable energy sources, with natural gas as a near-term bridge fuel. Thecomposition of energy supplies shifts fundamentally in the Policy Reform scenario drivenby carbon emission targets (Figure 17). Similar patterns apply at the regional level (SheetEn-2).
The combined share of the most carbon-intensive fuels, coal and oil, decreasesfrom 62% in 1995 to 37% in 2050, while the share of natural gas increases from 19% in1995 to 36% in 2050. This can be compared to the Reference scenario in which the shareof coal and oil remains almost constant (60% in 2050). Severe pressure on fossil fuel

56 Raskin, Gallopin, Gutman, Hammond and Swart
resource availability (Section 3.3.2) is postponed but not entirely alleviated (Sheet En-5).In addition, the scenario assumes the phase-out of nuclear generation for reasons noted inSection 3.2. If the nuclear option were included, carbon emission and other environmentaltargets could be met with corresponding decreases in the requirements for renewables andefficiency improvement.
The mix of renewable energy forms varies from region to region according tonatural resource endowments — hydro potential, insolation, availability of land, and thepresence of suitable water and soil conditions for modern biomass plantations. Renewableoptions include biofuels as a feedstock for the industrial, transport and electricitygeneration sectors, solar energy for electric generation and for direct applications inhouseholds and industries, and wind and geothermal energy for electric power generation.Hydropower development is limited to the same levels foreseen in the Reference scenario,due to the need to avoid the environmental impacts often associated with many largehydro schemes. Solar and wind development for electricity generation is limited by theirintermittent nature.
Levers of Change
The efficiency and fuel-switching initiatives in the scenario require neither heroictechnological assumptions nor economic disruption. Indeed, the promotion of energyefficiency and renewables is not only compatible with economic development and jobstimulation, it may in fact further these goals (Energy Innovations, 1997). The primaryconstraints to achieving the energy goals are institutional and political.
Numerous policy options are available. Fiscal mechanisms can be used tointernalize environmental costs into energy prices, e.g., through the use of carbon taxes orcarbon-trading systems. Carbon taxes can be coupled to reductions in other taxes as intax shift policies already adopted in some European countries. Fossil fuel subsidies can beeliminated. Progressively more stringent energy efficiency standards can be set. Newfinancing initiatives and economic incentives can help spur investment in energy-efficientand renewable technologies. Increased research, development and demonstration effortscan offer new technological opportunities. Market barriers to efficiency and renewablesinvestment can be overcome through better information, capacity building and institutionalframeworks. Globally, initiatives to transfer technology and know-how can help makeenergy efficiency and renewables a foundation for the growing infrastructure ofdeveloping economies.
4.5 Food and LandThe Reference scenario offers a mixed picture for food and agriculture. On the one hand,production keeps pace with steadily increasing requirements for food and otheragricultural commodities. On the other hand, the doubling of agricultural output by 2050contributes to substantially increased pressures on land and water resources. Also,increased chemical inputs to farming systems add to terrestrial and water pollution. Theneed for new agricultural land is amplified by the continuing degradation of existingcropland. Along with expanding settlement areas, this leads to the loss of forest areas andother ecosystems, at rates comparable to those in the recent past.

Bending the Curve: Toward Global Sustainability 57
The difficulties of meeting global food requirements in environmentally sustainableways are even greater in Policy Reform scenarios. Meeting the social goals of thescenarios implies rapid economic development, more equitable income distributions andgreater food demands. While dietary patterns remain invariant in rich countries, dietsimprove and animal products grow as a share of dietary intake elsewhere (Sheet F-1).Global food requirements for cereals increase 60%, from 990 million tonnes to 1,560million tonnes over the scenario, while the demand for meat rises almost 2.5 times, from260 million tonnes to 630 million tonnes.
The challenge of simultaneously meeting all the sustainability criteria introduced inSection 2 is formidable. Increased agricultural requirements must be met under multipleconstraints: forest and habitat protection reduces the scope for the expansion ofagricultural land; decreasing the level of stress on water resources in water scarce areaslimits the use of irrigated water; and reducing land degradation and chemical inputs toagriculture requires more sustainable farming practices, while maintaining yield increases.
In the Policy Reform scenario, the often conflicting goals of providing space forhuman settlements, protecting ecosystems, and feeding human populations can bereconciled only through a combination of measures. These include:
• Sustainable farming practices. A transition to agricultural sustainability will requirea “doubly green” revolution, in which agricultural productivity continues to improvebut with practices that preserve the environmental foundation for the long term(Conway, 1997). The focus shifts from the genetic manipulation of crops to increaseyields toward enhancing the productivity of complex farming systems (Swaminathan,1997). In the scenario, a campaign for sustainable agriculture is launched resulting ina gradual shift toward ecologically sound practices, rather than the replication of high-input farming. The challenge is to maintain yield improvements at something likeReference scenario levels. As part of the pollution-reduction goals of the PolicyReform scenario, fertilizer and pesticide use per hectare declines. To maintain yields,the nutrient requirements of plants must be met, and pests kept in check, in other ways(Conway, 1997). Nutrient recycling partly substitutes for fertilizer, for example, byusing livestock manure in combined crop-livestock systems and through large-scalecomposting. Nitrogen requirements are met in part through the use of nitrogen-fixingplants that can be grown in rotation with or in combination with other crops. Pesticiderequirements are reduced through the development of pest-resistant strains of plantsand the widespread use of integrated pest management. The poverty alleviation goalsof the scenario support these trends, as increasing income allows farmers to diversifytheir production (Scherr and Yadav, 1996). Additional actions needed include thedevelopment and application of biotechnology and other research (e.g., diseaseresistant varieties), education and training of farmers, land reform, infrastructuredevelopment and reform of economic policies. Programs for sustainable agriculturemust be carried out in cooperation with farmers and targeted to local needs (Leach,1995).
• Fisheries and Aquaculture. In the Policy Reform scenario, fish consumptionincreases, from about 100 million tonnes in 1995 to about 160 million tonnes in 2050,only slightly less than the 170 million tonnes required in the Reference scenario (Sheet

58 Raskin, Gallopin, Gutman, Hammond and Swart
F-3). Better management of capture fisheries extends the current production ofaround 85 million tonnes per year to a sustained annual production of 100 milliontonnes (FAO, 1997c). About 10 million tonnes of the total increase comes fromreplenished stocks, as access to overexploited fisheries is restricted through thecreation of limited fishing rights and other initiatives. A further 5 million tonnes isgained through a reduction of losses and discarded by-catch. These changes arebrought about by better technology, legal limits on discards, and the expansion ofmarkets for the products of by-catch. About 60 million tonnes of global requirementscannot be met on a sustained basis from capture fisheries. Aquaculture expands tomeet this additional demand, with production roughly tripling from the 20 milliontonnes from this source in the base year (FAO, 1997c). In the past, aquaculture hasled to pollution and pressures on freshwater resources (Brown, et al, 1998). These arereduced in the scenario by the introduction of water-conserving technologies,encouraged by water-conservation and pollution-prevention policies.
• Pasture and rangeland. Changes in grazing land for livestock production are subjectto competing effects. On the one hand, the robust Policy Reform economic growthassumptions drive the demand for meat products higher. On the other hand, thescenario assumes a greater reliance on feedlots in livestock production (Sheet F-2).Greater reliance on feedlot production is both a consequence of rapid economicgrowth and a matter of policy. While agriculture production must expand to meetincreased livestock feed demand, reducing the requirements for grazing land has thenet effect of reducing pressure on forests and other ecosystems. In addition, someimprovement in grazing land productivity can also be expected due to the adoption ofmodern practices and improvements in herd quality. At the same time, both grazingand feedlot production practices must become more sustainable in order to reduceenvironmental pollution. For example, large feedlot facilities produce vast quantitiesof concentrated manure, contributing to nitrate pollution of ground water andammonia emissions, a precursor of acid rain. Part of the answer is more integratedcrop-livestock systems in which manure is recycled to crops as fertilizer (Durning andBrough, 1991; Bender, 1994). The transition to sustainable livestock practices can bereinforced by providing information through extension services, and by enforcing anti-pollution laws. In arid lands, where the availability of forage can vary greatly fromyear to year due to climate fluctuations, policies to provide timely access to marketsand land can allow pastoralists to cope without overtaxing biomass resources(Conway, 1997).
• Cropland. Driven by the combination of food and feed requirements, global croplandarea expands by about 20% between 1995 and 2050, a larger increase than the 11% ofthe Reference scenario. However, because of land and water constraints in manyregions, the largest increases occur in regions with the least land and water constraints(Sheet F-6). This implies more extensive trade in food commodities, as discussedbelow. In North America, where cropland grows by over 40%, some of the increase ismet by returning to production land held in the U.S. Conservation Reserve Program.Globally, a greater share of the cropland is on rainfed land than in the Referencescenario. Expansion of irrigated land is discouraged by increases in water prices, ascountries try to limit the incidence of water stress, the topic of the next section.

Bending the Curve: Toward Global Sustainability 59
• Land degradation. Consistent with the sustainability goals (Section 2), the rate ofland degradation slows between 1995 and 2025, and then reverses between 2025 and2050. Loss of cropland due to severe degradation drops to 1.5 million hectares peryear over the first half of the scenario, half the rate assumed in the Reference scenario.From 2025 to 2050 cropland is restored, leading to the return of degraded land tocropland, forests and other land types. Depending on the nature of the land and itsuse, degradation is reduced through different means. Improving drainage and deliverysystems for irrigation water can restore irrigated land subject to waterlogging andsalinization, and conserve water resources at the same time. Nutrient loss fromshifting cultivation can be reduced by lengthening fallow periods. Loss of landthrough water erosion can be reduced by building terraces and through conservationtillage. When the terraces are reinforced by planting nitrogen-fixing trees, they canadd to the fertility of the soil, as well as retaining water and reducing erosion(Conway, 1997).
• Built environment. Under business-as-usual conditions, the expansion of settlementareas is likely to claim a significant amount of arable land, forest area and drylands, asillustrated in the Reference scenario (Sheet P-6). The expansion of the builtenvironment is curtailed in the Policy Reform scenario, as concerns for protectingproductive cropland, forests and other ecosystems lead to urban planning policies thatfavor more compact settlement patterns. This would be supported by a highervalorization of arable lands driven by increasing domestic demands and, in someregions, profitable opportunities for increased trade. All regions gradually movetoward Western European patterns (Sheet P-7).
• Forest land. The preservation of forests and other valued habitats and ecosystems is akey sustainability goal. Specifically, the rate of forest loss gradually decreases in thescenario to zero by 2025 and forest areas increase thereafter. These goals contrastwith both historic and Reference scenario patterns in which deforestation proceeds atabout 10 to 15 million hectares per year. These trends are reversed by forestprotection policies and land-use strategies that support more compact settlements, thecontraction of grazing lands and land restoration. In the scenario, the amount of forestland set aside as protected areas increases. Also, opportunities are developed forencouraging the sustainable use of forest products among the poor, e.g., by grantingsecure land rights (Scherr and Yadav, 1996). Finally, the sustainable management offorests by the timber trades becomes a priority everywhere, including the preservationof critical levels of old forests and other ecosystems for the support of biodiversity.As a result, loss of forest is reduced from 700 million hectares in the Referencescenario to below 250 million hectares between 1995 and 2025. Between 2025 and2050, there is net reforestation.
• Agricultural Trade. Many countries and regions butt against the limits of theirresource constraints in the Policy Reform scenario. Indeed, we find that meetingexpanding food requirements while staying within environmental constraints willrequire greater reliance on imports in a number of countries (e.g., Africa and theMiddle East). Increased reliance on imports is made possible by the rapid economicdevelopment assumed in the Policy Reform scenario, which supports enhancedparticipation of developing regions in international commerce (Sheet F-4). This

60 Raskin, Gallopin, Gutman, Hammond and Swart
requires considerable expansion of production from exporting regions, such as NorthAmerica, Western Europe and Latin America, and from the transitional regions of theformer Soviet Union and Eastern Europe (RIVM/UNEP, 1997). While this wouldcounter trends over the last twenty years of withdrawing lands from production inindustrialized regions, the scenario assumes heightened concern in the OECD regionsfor maintaining forests and other ecosystems in developing regions. Furthermore,growing demand for agricultural commodities from increasingly wealthy developingregions makes expanded production more profitable. However, to maintainproduction so that the food requirements of developing regions are met whilepreserving ecosystems worldwide will likely require far-sighted policy measures thatdo not rely on markets alone (Leach, 1995).
Land-use patterns in the Policy Reform scenario that result from theseconsiderations are reported in Sheets P-6 and P-7 and summarized in Figure 20. Therapid expansion of the built environment and grazing land areas in developing regions thatoccurs in the Reference scenario is slowed or reversed. In OECD and transitional regions,the slowly changing land-use distributions of the Reference scenario are replaced by amore dynamic picture, as cropland area grows to supply the increasing import needs ofcountries facing land and water constraints.

Bending the Curve: Toward Global Sustainability 61
World OECD
0
2,000
4,000
6,000
8,000
10,000
12,000
14,000
1995 2025 2050 2025 2050
mill
ions
hec
tare
s
Reference Policy Reform
0
500
1,000
1,500
2,000
2,500
3,000
3,500
1995 2025 2050 2025 2050
mill
ion
hect
ares
Protected
Past./Range
Other
Forest
Cropland
BuiltEnvironment
Reference Policy Reform
Transitional Regions Developing Regions
0
500
1,000
1,500
2,000
2,500
1995 2025 2050 2025 2050
mill
ions
hec
tare
s
Reference Policy Reform
0
2,000
4,000
6,000
8,000
1995 2025 2050 2025 2050
milli
ons
hect
ares
Reference Policy Reform
Figure 20. Land-use in the Scenarios
The task of feeding a world with almost twice as many people as today, whilemaintaining the productivity of cropland and forests, and avoiding unmanageablepollution, presents numerous challenges. There is no simple recipe for achievingsustainability in land-use and agricultural production. The scenario presents a picture ofhow this might be accomplished. It also underscores the multidimensional character of theproblem, the variety of the types of initiatives needed and the immense policy challenge.Concerted government action will be needed to build the required capacity for researchand extension services, provide well-functioning markets and adequate infrastructure,correct perverse subsidies, and implement incentives for a shift toward more ecologicalagriculture, forestry, and land-use practices. The adequacy of water resources will play acritical role in achieving these goals.
4.6 FreshwaterApproximately one-third of the world’s population lives in areas experiencing some formof water stress. In the Reference scenario, the figure rises to over 50% in 2050, or closeto 5 billion people. The heightened competition for water increasingly threatens valuableecosystems and habitats that depend on an adequate supply of clean water, and causes

62 Raskin, Gallopin, Gutman, Hammond and Swart
tension between users sharing common water resources. These trends violatesustainability criteria.
Abating freshwater degradation and scarcity is an exceedingly daunting task. Thepractical difficulty is reflected already in the sustainability goals articulated in Section 2.They accept that increased water stress is unavoidable, though at levels well below thosein the Reference scenario. In the Policy Reform scenario, the transition to theenvironmentally sustainable use of water resources is in some ways at cross purposes withefforts to meet the social goals. The requirements for water services increase as a result ofefforts to deliver household water services to the poor and by the rapid expansion ofdeveloping country economies.
In the context of rising end-use requirements, freshwater withdrawal is moderatedin the scenario through several types of measures: efficiency improvement, resourceenhancement and agricultural trade increase. The scenario analysis is conducted at thenational level in order to more accurately match water demands and resources. Measuresare introduced in each country for satisfying the freshwater sustainability goals of Table 5.Aggregate global water requirements in the Policy Reform scenario increase 10% between1995 and 2025, and then decrease by less than 5% from 2025 to 2050. Regional patternsare shown in Sheet P-1 and are compared to the Reference scenario. In the developingregions as a whole, requirements change little between 2025 and 2050, after a 25%increase between 1995 and 2025. In the water-stressed Middle East, water withdrawalsincrease by about 15% from 1995 to 2025, substantially less than the 50% increase in theReference scenario, and between 2025 and 2050 withdrawals decline, to reach levelsslightly above those in the base year. Industrial intensity improvements in the formerSoviet Union, where current values are relatively high, lead to lower total requirements in2050 than in 1995. In the OECD as a whole, withdrawals decrease throughout thescenario, dropping by over 30% between 1995 and 2050.
The major features underlying these results include:
• Increasing drivers of water use. All else equal, growing economies, particularly indeveloping regions under Policy Reform assumptions, drive water demands beyondenvironmentally sustainable limits in many countries and river basins. As discussedbelow, end-use water requirements would have to be met far more efficiently and, tosome extent, with non-conventional water sources. In addition, in some cases waterdemands can only be kept within sustainability goals by reducing requirements, e.g.,land under irrigation. In the Middle East, where water scarcity is particularly acutetoday, irrigated land areas decrease in the scenario, by about 10% relative to 1995levels. The reduced agricultural production is made up through trade; in effect,countries in this region import the water embodied in agricultural products.
• Efficiency improvement. Overall improvements in aggregate water intensity (use perunit GDP) are summarized in Figure 21 for the macro-regions. Two factors contributeto the decrease in aggregate intensity. First, the composition of economies changes inthe scenario so that the water-intensive agriculture sector contributes a diminishingshare. This alone lowers water intensities in the scenarios. Second, water is usedmore efficiently as illustrated by the sectoral water intensity trends illustrated in Figure22 for the OECD region. We begin with irrigation intensities. Recall that water

Bending the Curve: Toward Global Sustainability 63
requirements increase to meet the water requirements of higher-yielding crops asreflected in the increasing Reference scenario intensities in Figure 22. The lowerintensities in the Policy Reform scenario are due to the implementation of a variety ofmethods to increase the efficiency of irrigation over conventional practices (Postel,1992; Seckler, et al., 1998). For example, spray irrigation systems can be replaced bytrickle and drip irrigation systems; open canals can be covered; and subirrigation, inwhich groundwater is raised to the level of roots, can be introduced in some areas.Numerous opportunities are available in the domestic sector, as well, through highermarket penetration of water-efficient appliances and tighter plumbing codes. In manydeveloping regions, domestic water intensities increase as incomes rise, but moreslowly than in the Reference scenario. Industrial water intensities also decreasetowards best practice levels today, such as those in Israel, where aggressive water-pricing schedules and standards for water-conserving technologies have led to highlyefficient water use by industry (Lonergan and Brooks, 1994). Measures to achievethese targets include water recycling, using saline or brackish water for cooling, andchanging to less water-intensive industrial processes. Aggregate intensities alsochange in response to changing industrial mix, toward less water intensive subsectors.
• Resource expansion. The scenario assumes greater investment in desalinizationfacilities, particularly in coastal water-scarce areas, and increased capture of treatedwastewater for reuse in selected applications. Currently, in the Middle East and NorthAfrica some countries meet a substantial amount of their domestic and industrial waterrequirements through desalinization and wastewater treatment (FAO, 1996a). Forexample, in Kuwait over half of water withdrawals are met with these non-conventional sources. For the region as a whole, desalinization and wastewaterrecapture is not cost-effective for most countries, constituting less than 1% of totalsupplies. In the scenario, water shortages stimulate increased investment in thesesources, and by 2050 the Middle East meets about 6% of its water requirements fromdesalinization and wastewater treatment. Individual countries satisfy between 10%and over 50% of their requirements this way. In North Africa, countries that currentlysupply some of their water requirements through water treatment plants expand theircapacity so that by 2050, 10% of their water withdrawals are supplied by desalinatedor treated wastewater.

64 Raskin, Gallopin, Gutman, Hammond and Swart
World OECD
0
25
50
75
100
125
1995 2025 2050
m3
/ $10
00
0
20
40
60
1995 2025 2050
m3
/ $10
00
ReferencePolicy Reform
Transitional Developing
0
50
100
150
200
250
300
1995 2025 2050
m3
/ $10
00
0
50
100
150
200
1995 2025 2050
m3
/ $10
00
Figure 21. Water Intensities in the Scenarios
Cubic meters per $1000 of GDPPPP

Bending the Curve: Toward Global Sustainability 65
Agricultural Intensities Domestic Intensities
9
10
11
12
1995 2025 2050
km3
/ Mha
90
110
130
150
1995 2025 2050
m3
/ cap
ita
Industrial Intensities
0
20
40
60
80
100
1995 2025 2050
m3
/ $10
00
ReferencePolicy Reform
Figure 22. OECD Water Intensity Improvements by Sector in the Scenarios
These factors combine to keep national freshwater withdrawal requirements withinthe sustainability targets (Table 5). Aggregating to the regional level, trends in the use-to-resource ratio in the scenario are reported in Sheet P-3. Globally, the population inwater stress rises to nearly 40% in 2025, and stays at that level from 2025 to 2050.25
Global totals for the number of people in water stress in the Reference and Policy Reformscenarios are shown in Figure 23. In the Policy Reform scenario the incidence of severestress (national use-to-resource ratios greater than 0.4) remains almost constant between2025 and 2050, in contrast to the Reference scenario, where it increases by about 30%over the same period. The population in moderate stress is greater in the Policy Reformscenario than in the Reference scenario, but this increase is from countries that areseverely stressed in the Reference scenario.
25 As with the Reference scenario, the fraction of national populations in water stress is assumed to rise from zero to
100% as the use-to-resource ratio rises from 0.1 to 0.4.

66 Raskin, Gallopin, Gutman, Hammond and Swart
0
1
2
3
4
5
1995 2025 2050 2025 2050
billi
ons
of p
eopl
eSevereStress
ModerateStress
Reference Policy Reform
Figure 23. Population in Water Stress in the Scenarios
The Policy Reform scenario suggests that pressures on freshwater resources canbe substantially reduced. The sustainability goals, though rather weak, can be met inprinciple but would require vigorous policy initiatives. The most efficient new irrigationtechnologies are expensive, as are desalinization plants, and their introduction will need tobe encouraged by water-pricing policies and efficiency standards. In many places today,water use is subsidized, perversely favoring inefficient use (Postel, 1992). To reach thesustainability goals these subsidies must be removed or reduced, and water priced toreflect its full economic and environmental value. Policies directed at other sustainabilitygoals will also be useful; for example, water pollution abatement can induce benefits suchas increased water-use efficiency.
In the past, freshwater development was largely about water systems engineering,infrastructure development and flood control. Water sustainability will require anexpanded perspective that considers the multi-faceted role that water plays in servicinghuman and ecological systems. If water development remains fragmented and wasteful,the prospects for sustaining the environment diminish and the possibilities for conflict riseas economies grow. But if an integrated river basin planning framework takes hold, onethat can involve stakeholders in a process of collaboration in order to balance the manyclaims on freshwater, then the water sustainability era can begin. The goals of developinga new paradigm for sustainable water use, and building the capacity for its implementation,command policy attention.
4.7 Materials and WasteThe resource use sustainability targets (Section 2.2) are partially addressed throughstrategies already discussed to reduce the intensity of fossil fuel extraction, to control soilerosion, and so on. But much more would be required to manage the level of material

Bending the Curve: Toward Global Sustainability 67
inputs to industrial economies and the environmental impacts of waste loads.Dematerialization at the required level requires efforts across several dimensions (Jackson,1993).
At the facility level, processes can become cleaner and far more efficient in theiruse of natural resources. At the commodity level, product lifetimes can be lengthened,thereby reducing the discard rate and need for virgin materials. At the system level,“waste” streams can be reconceptualized as resource streams through the reuse ofproducts, remanufacturing of components and recycling of materials. Ultimately, detailedconsideration must be given to the system impacts of alternative processes and materialsthrough life-cycle analysis that considers both the direct and indirect impacts ofalternatives.
In addition, aggregate reduction in the intensity of resource use will be aided byshifts in the composition of the economy from resource-intensive to knowledge-intensivesectors. In the end, reducing the throughput of materials to lie within tolerablesustainability boundaries may require a moderation in consumerist lifestyles. However, thiswould carry us beyond the premises of Policy Reform scenarios.
Scanning across the various elements that comprise the Policy Reform scenario,the complex and multi-dimensional character of a policy-driven sustainability transitionbecomes apparent. The discussion of the food-water-land nexus of issues illustrates themany obstacles that will be faced in servicing growing economies, meeting human needs,and passing on a healthy environment. Moreover, the tension between two assumptions inthe scenario will not be easily reconciled — the continuity of dominant values andinstitutions, on the one hand, and the greater equity for addressing poverty reduction,climate protection, and other goals, on the other hand. At the very least, a comprehensiveaction agenda will be needed to begin to bend the curve of development towardsustainability.

68 Raskin, Gallopin, Gutman, Hammond and Swart
Bending the Curve: Toward Global Sustainability 69
5. IMPLICATIONS FOR ACTIONThe Conventional Worlds-Reference scenario allows us to gauge the risk of inaction. Thescenario fails to meet fundamental sustainability goals across a number of dimensions —basic human welfare, international equity, environmental quality, and resourcepreservation. The case is compelling for immediate and strong initiatives to changecourse. But history teaches that a need for action, in principle, does not mean thatappropriate action will be taken, in practice.
The Conventional Worlds-Policy Reform scenario gives a concrete illustration ofhow a redirection towards sustainability could come to pass. It shows that simultaneouslymeeting social, environmental and resource goals requires overcoming a daunting andinteracting set of constraints. Nevertheless, gradual changes in social, technological andresource-use patterns become cumulatively significant over the coming decades. Thecurve of global development bends toward a more equitable and environmentally healthyfuture. What then are the challenges to a transition to a Policy Reform scenario? Whatpolicies are needed? Is policy reform enough?
5.1 ChallengesThe quest for a sustainability transition within the Policy Reform framework poseschallenges that should not be underestimated. Recall that this scenario assumes essentialcontinuity with current institutions and trends. The values, lifestyles, governance systems,and economic structures of Conventional Worlds may evolve slowly, but theirfundamental character endures. Change comes as a set of corrections and adjustments tomarket-driven development, rather than as a passage to a new mode of civilization, asenvisioned in Great Transition scenarios.
In the Policy Reform context, an effective campaign for a sustainability transitionwill require the fulfillment of several conditions:
• widespread awareness of the issues and the conviction that action is necessary;
• adequate institutions, policies, and technologies; and,
• sufficient political will to accept the costs of carrying out the required actions.
Growing scientific understanding of the risks of unsustainable development is anecessary ingredient. But science alone is insufficient to galvanize timely and appropriateaction: witness the many climate change skeptics despite the high level of internationalscientific consensus on the threat of global warming. In the social realm, resistancepersists to strong measures to reduce inequity and eliminate poverty. Even among theinternational financial institutions charged with poverty alleviation, such as the WorldBank, there is continued reliance on “trickle down” economics. In developing countries,the structural adjustment programs of the last decade, while correcting macroeconomicfailures, have not adequately addressed increasing income disparities.
Ultimately, the greatest challenge is the third item identified above: the willingnessto implement and accept the costs of necessary changes. Many stakeholders —governments, businesses, political parties, and other social groups — remain reluctant tomake sustainability a real priority for action. In the absence of that resolve, pressures that

70 Raskin, Gallopin, Gutman, Hammond and Swart
reinforce unsustainable patterns prevail: economic subsidies often foster environmentaldisruption, emphasis on short-term economic benefits discounts the future, policiesweaken support for the poor out of concern for global economic competitiveness, businesspractices pollute and deplete resources, and consumerism remains the dominant lifestyle.
The sustainability transition calls for placing higher values on interests thatheretofore have been neglected: the plight of the poor, the rights of future generations,and the integrity of ecological systems. As with any call for a major reordering of socialpriorities, the transition to sustainability can expect resistance. Proposals for theempowerment of disenfranchised people, for more moderate per capita materialconsumption of affluent groups, and for increased international commitments forsustainable development will be contested, particularly by those who benefit most from thecurrent state of affairs. The dialectic of political change — public pressure from belowand leadership from above — will need to overcome such resistance by building a newvision and consensus for a politics of sustainability.
5.2 Agents of ChangeWithin a Conventional Worlds framework, the transition to sustainability entails both thedeployment of environmentally friendly technologies and the reform of institutions. ThePolicy Reform scenario, summarized in Section 4, confirms that much of the technologyand practices necessary for a transition to sustainability are at hand. A vast repertoire oftechnical means is available for sustainable food production, cleaner energy, materialsrecycling, efficient water use and pollution prevention. While continuing research anddevelopment will further enrich the technological possibilities, the immediate challenge isthe redirection of institutional forces.
Environmental degradation is not an inherent fact of our time. It results from a setof historically contingent choices for technology, production processes, and consumptionpatterns. Similarly, poverty and extreme inequity are not inevitable, but rather are theoutcome of a specific period of world history. These distributional patterns are embeddedin a set of institutional mechanisms that are stubborn, but not immutable. For millennia,human societies produced little surplus and functioned near the edge of survival. Withlimited social wealth, economic redistribution could not eradicate the poverty of the many.The surge in productivity since the industrial revolution has changed the problem ofpoverty eradication from a technological to an institutional issue. The challenge is not somuch to increase output as it is to fairly distribute resources, know-how and entitlements.
The precondition for sustainability is forging the political and social will forchange. That resolve will need to then find expression through reshaping traditionalinstitutions and harnessing the potential of emerging ones. The former refers to the formalprocesses of economies and governance, and the latter to the full gamut of socialarrangements that offer opportunity for discussion and action concerning social goals andmeans.
Regarding economic institutions, some advocates of laissez-faire see modernmarket economies as something akin to natural phenomena. Yet economies are humanarrangements, which are not above society, but are part of it. Economic institutions haveundergone enormous changes through history including the abolition of slavery, the rise of

Bending the Curve: Toward Global Sustainability 71
the welfare state, the transformation of financial sectors, and globalization. In thediscussion of strategies for sustainability, economic institutions need to be understood, notas a given, but as part of both the problem and the solution. Eventually, changes in socialvalues and technology could lead to fundamental economic transformation. But even in aPolicy Reform world, a wide array of economic instruments is readily available tomotivate environmental sustainability in the market place, as we shall review in thefollowing section.
Large corporations are increasingly powerful agents of change as the global sweepof their influence advances. On the one hand, they have the capacity to accelerate thetransition to sustainability. On the other hand, they are accountable ultimately to theirshareholders, not to an electorate, since the primary objective of business is profit, notsocial welfare. Nevertheless, there are preliminary signals that the private sector may bechanging in response to the challenges of sustainability and environmental responsibility,as some of its leaders articulate a genuine concern for the state of the future.
It is naïve to blame government and international agencies for all of society’s flaws— or look to them as the panacea for the transition to sustainability. Enlightenedinitiatives by governments and agencies, spurred by politically engaged constituencies, willbe necessary ingredients of major change. Governments remain the locus of public policyand the primary bodies concerned with public welfare. Yet nation-states are in some waystoo big for the small problems, and too small for the big ones. The power of nation-stateshas been diminishing as globalization makes national borders more porous. Moreover,governmental bodies are constrained by inertia, the lobbying pressure of powerfulstakeholders, and a short-term interpretation of voters’ aspirations — a naturalconsequence of electoral cycles that last just a few years. The momentum for overcomingthese constraints will need to come from outside, rising among the countless newassociations taking shape today.
Myriad new institutional actors have entered the stage in recent years. A chorus ofnew social actors is appearing: grass roots movements, non-governmental organizations(NGOs), interest groups and emerging forms of social organization such as virtualnetworks. The agendas are as diverse as the players. Some address broad themes such asgender, the environment and the rights of indigenous peoples. Specific local mattersmotivate many others. The capacity of these groups to educate, articulate demands, andfoster change is growing. As never before, transnational businesses, international agenciesand governments must acknowledge and answer the challenge of these new institutions.Meanwhile, traditional organizations, such as religious groups and charities are changingtheir roles, and networks of scientists, citizens, artists, special interest groups, and manyothers proliferate.
As with any major technological breakthrough, the communications revolutionoffers contrasting possibilities for society as a whole. It provides the means tocommunicate at a scale and speed that is unprecedented. The communication revolutioncan serve to foster social mobilization for a more sustainable and just world. But it canalso lead to a media-dependent citizenry that overreacts to contradictory messages,marketing slogans and media-manipulated fears.

72 Raskin, Gallopin, Gutman, Hammond and Swart
The primary agents for a Policy Reform scenario are likely to be governments,businesses and NGOs. The new institutions of civil society have a critical role to play inchampioning such a change of direction. Furthermore, for the fundamental valuetransformations envisioned in Great Transition scenarios to emerge, these groups will playthe critical role.
5.3 Science for SustainabilityScience has much to contribute to the sustainability transition, supporting discussion andaction with analysis, information and solutions. The last twenty years have witnessed anaccelerating translation of environmental concerns into scientific research programs.Stratospheric ozone depletion, global warming, biodiversity loss, and ocean pollution areonly a few of the issues that have received focused research attention. We can be hopefulthat others will follow.
As society turns increasingly to science for answers to environmental dilemmas,the scientific professions progressively have come to see environmental studies aslegitimate areas of research. Conventional disciplinary boundaries have been transcendedas the needs are acknowledged for interdisciplinary approaches and for scientificparticipation in the discussion of social choices. Indeed, we hope this study will be seen aspart of the initiative to build bridges between scientific discourse, social values and thepolicy agenda.
The challenge is considerable: to understand the dynamics and possibilities ofwhole socio-ecological systems with approaches that are scientifically rigorous yetsensitive to the inherent uncertainty and the normative character of the problem. There isgrowing recognition of the need for such a new scientific paradigm. The discussion ofscientific research priorities for a sustainability transition is continuing within the scientificcommunity (BSD, 1998), and need not be elaborated here.
What is worth stressing is that scenario analysis can play a key integrative role incoupling science to the public dialogue on the future. Scenarios provide a framework forsynthesizing diverse findings from natural and social sciences. Moreover, scenario analysisguides research by identifying missing information and key areas of uncertainty. Scenariosfor the sustainability transition must be both comprehensive and integrated, and are neededat various spatial levels in order to “see” issues that only come into focus in the zoomfrom the global, to the regional, to the local.
This implies practical action. One of the most urgent knowledge-needs is forintegration across policies, instruments, sectors and issues. The need for a systemicapproach was explicitly recognized in Agenda 21, but there has been little progress since.Integrated sustainability studies should be conducted at all levels. They should becomprehensive, participatory and adaptive. Useful science for the transition must stressintegration, recognize uncertainty, appreciate irreducible normative aspects, and engagethe public in discourse on sustainable development. Action is needed to developappropriate methodologies, train a new cadre of sustainability professionals and buildinstitutional capacity. The task is no less than forging a new science of sustainability.

Bending the Curve: Toward Global Sustainability 73
5.4 Symptoms and Causes: A Framework for Guiding PolicyWe have associated the unsustainability of the current global trajectory with three majortrends:
• environmental degradation and resource depletion;
• increasing income disparity; and
• poverty and marginalization.
Each defines a major area for policy attention. A set of proximate drivers isimmediately responsible for propelling and regenerating these trends. Ultimate driverscondition the proximate drivers. For example, water pollution from factories dependsdirectly on the process technology in use, the volume and pattern of industrial activity, andprevailing regulation and economic incentives. Ultimately, these depend on the valuesociety puts on environmental quality, the lobbying power of interested parties,consumption patterns setting the demand for the industry’s products, and the scientificunderstanding of the causes, impacts, and dynamics of water pollution.
A structure for critical trends and their drivers is introduced in Figure 24. The“critical trends” are associated with the Reference scenario. The “proximate drivers”draw attention to the direct levers of change that define Policy Reform variations. The“ultimate drivers” refer to the shape of the fundamental structure of values, knowledgeand empowerment that, if suitably altered, could initiate a Great Transition scenario.Though the distinction is not always sharp, the grouping of drivers into proximate andultimate categories is useful for discussing policies and priorities. Proximate driversinclude those factors that have a direct influence on trends, and are subject to short-termpolicy intervention. Ultimate drivers are more stable and are a subject for the long-termpolicy-making agenda: they tend to influence trends indirectly by acting upon proximatedrivers.
Instances of ultimate drivers, proximate drivers, and critical trends can be seen atdifferent spatial levels from the local to the global. At each level, the analysis of criticaltrends and drivers will provide the framework for developing effective policy strategies.Each level requires its own analysis, and each will require disaggregation of the broadcategories mentioned below in order to gain sufficient precision.

74 Raskin, Gallopin, Gutman, Hammond and Swart
Environmentaldegradation and
resource depletion
Increasingincome
disparity
Poverty andmarginalization
Population sizeand growth
Economicvolume and
pattern
Technologicalchoice
GovernanceEnvironmental
quality
Values, desiresand aspirations
Structure ofpower
Knowledge andunderstanding
Human needsLong-termecologicalprocesses
CR
ITIC
AL
TR
EN
DS
PR
OX
IMA
TE
DR
IVE
RS
UL
TIM
AT
ED
RIV
ER
S
Figure 24. Unsustainability Trends and Drivers
With reference to Figure 24, the major proximate drivers requiring policy attentioninclude:
• Population size and growth. Population size is a major determinant of total pressureon the environment and resources. Population density often correlates to localenvironmental pressure. Rapid rates of population growth tax the capacity ofgovernments to provide adequate infrastructure and services. The stresses are manifestin developing regions in both burgeoning urban centers and zones of rural poverty.

Bending the Curve: Toward Global Sustainability 75
• Economic volume and pattern. All else equal, the bigger the economy, the larger thethroughput of material resources and energy. Levels of natural resource consumptionand waste production tend to correlate with the level of economic output. The detailedrelationship is closely linked to the pattern of consumption, lifestyles, incomedistribution, and poverty.
• Technological choice. The choice of technology — the means by which societies,organizations and individuals accomplish tasks — influences the environmental andsocial impact per unit of production or consumption. Eco-efficient productiontechnologies play a major role in formulating Policy Reform scenarios, as do the choiceof consumption technologies, e.g., use of recycled and resource-efficient products. Thechoice of technology depends on engineering criteria, cost, and cultural preference.
• Governance. Construed broadly, governance includes the aggregate of processes,systems, relationships, and arrangements by which human communities interact, boththrough governments and non-governmental mechanisms. Current governancestructures are a serious obstacle to sustainable development in many countries. Atnational and regional levels, institutional and legal fragmentation undermines thedevelopment of the integrated policy responses required for a transition to a PolicyReform scenario. Inappropriate allocation mechanisms contribute both toenvironmental degradation and to poverty (e.g., land tenure systems in some parts ofthe world foster deforestation and impoverishment). Meanwhile, global systems ofgovernance are struggling to cope with the immense challenges of economicglobalization and transnational environmental threats.
• Environmental quality. Poor soils, extreme climate, or fragile ecosystemscharacterize some areas of the world. These conditions may either be natural or theresult of human-induced environmental degradation. Many of the rural poor live inresource-poor and fragile lands, while often the urban poor are confined to the mostpolluted areas. Impoverishment and low environmental quality can combine in adownward spiraling process. Human action can address certain aspects ofenvironmental quality through environmental restoration efforts and the reduction ofpressure on environmental systems.
The categories of ultimate drivers introduced in Figure 24 are:
• Values, desires and aspirations. The prevailing values in a society set the criteria forindividual ambition, ethics and aesthetic sensibility. Values are culturally conditioned,defining the social consensus on what is considered normal or desirable. Depending onthe underlying values, a society will be characterized somewhere along a spectrumbetween a sense of common purpose and antagonism, between social solidarity andindividualism, between materialism and a concern for deeper meaning. Consumerism isa significant value in shaping current trends and driving human desires and aspirationsin directions that appear to be unsustainable. A sense of solidarity with both currentand future generations, were it to become a defining global value, would form themotivational basis for a transition to sustainable development.
76 Raskin, Gallopin, Gutman, Hammond and Swart
• Human needs. Here, we include material needs, such as for food and shelter, as wellas non-material needs, such as for love and meaning. Fundamental human needs — thegeneric human requirements for health — are invariable and universal. But the specificelements to satisfy them are to a high degree culturally determined. Policies cannotmodify underlying human needs, but they can affect the choice of specific “satisfiers.”Furthermore, advertising and the media can influence the creation of wants and theirconversion into felt needs.
• Knowledge and understanding. The scientific enterprise — the formal organizationof knowledge into theory and observation — shapes both the world view of modernsocieties and the capacity to manipulate natural and social systems. The evolution ofscience to reflect the complexity, holism and normative character of the sustainabilityproblem could be both a harbinger and a driver of change. In addition, informalknowledge — the manner in which people perceive and make sense of their conditionsas individuals and participants in society — is critical in influencing behavior andresponses to changing circumstances. Culture, education, and the media are importantin shaping understanding.
• Structure of power. The control of resources, influence, and decision-makingauthority defines the power structure. The structure circumscribes the limits of thepossible, particularly for the non-powerful, and sets priorities for society. It influencesallocation and redistribution processes, and, through the media, even shapes humanvalues, preferences, and consumption patterns. A notable property of the currentglobal power structure is its pronounced international asymmetry.
• Long-term ecological processes. Ecological processes mold the physical backgroundagainst which human trends and scenarios play out. These include long-termevolutionary processes; short-term natural changes and disturbances such as hurricanesand volcanic eruptions; and natural cycles such as seasonal variations or El Niñoevents. At this stage of history, the human footprint on the environment has grown toa point where global ecology is significantly disturbed. Notable are the severe impactson biodiversity loss and the perilous modification of the global climate system due togreenhouse gas emissions.
Policy Reform scenarios examine the instrumental changes that are needed withoutaltering fundamental values and institutions. The focus is on redirecting the proximatedrivers through economic reform, regulation, redistribution, and technological initiative.Whether this would suffice is an open question. The ultimate drivers concern the basiccharacter of human motivation and social structure. The greater challenge of addressingultimate drivers is left for Great Transition scenarios.
5.5 Policy DirectionsAs its name implies, the Policy Reform scenario has numerous implications for policymaking. Targets for poverty alleviation, international economic convergence, socialequity, and the environment set specific goals for the sustainability transition. Social goalsare represented, for example, by a call to reduce the hungry population to one quarter ofcurrent figures by the middle of the 21st century, and patterns of convergent development

Bending the Curve: Toward Global Sustainability 77
both between and within economic regions. Environmental goals are expressed in termsof regional targets, such as carbon emission levels with convergence toward equal percapita emissions. The Policy Reform scenario defines directions for change: the issue nowbecomes choosing the set of policy instruments that can help steer development in thesame direction.
Innumerable policy proposals for sustainable development have been put forward.The array of options for attaining social objectives is summarized in Table 6 and forenvironmental objectives in Table 7. Within each of these aggregate policy categories,there is an enormous variety of specific alternatives and variations. Specific sectoralinitiatives are suggested in Section 4. It is encouraging that many of the instruments arecurrently being employed at local, national or international levels. Yet, policy packages donot have the necessary breadth and depth required for a transition to sustainabledevelopment. While success stories exist — the international ban on ozone-depletingsubstances, the worldwide reduction in lead use, the significant increase in life expectancyamong developing countries’ populations — much more is needed for global changes onthe scale of a Policy Reform scenario.
Table 6. Policy Instruments to Attain the Proposed Social Objectives
• International income transfers through multilateral or bilateral official developmentassistance, special international funds, and voluntary donations mobilized by UN agencies,charities, NGOs, and others.
• International agreements to safeguard the rights of the poor from, e.g., child exploitationand trade, labor and migration discrimination.
• National income transfers through public taxes and subsidies, and voluntary donationsmobilized by charities, NGOs, and others.
• Economic growth stimulation in less developed countries through international assistanceprograms, trade arrangements, capacity building, and a variety of national structural adjustmentefforts (note that social objectives are addressed only to the extent that increased incomeinequality does not negate the benefits of overall growth accruing to the poor).
• Social empowerment measures to recognize the rights of women, minorities, and children.
• Investment in people ("human capital") through education, health care, and training.
• Participation by new social actors through encouragement of communities, grass rootsorganizations and NGO initiatives, and provision of mechanisms for taking part in decision-making.
• Access of the poor to productive assets and income generating opportunities through avariety of steps including land and natural resources tenure, technology transfer, infrastructureinvestment such as transport and storage facilities, and credit and marketing services targetedfor poor producers.
• Solidarity policies ("safety nets") for disadvantaged groups such as destitute households, poorchildren, the sick, the handicapped and the elderly.
• Persuasion efforts to promote solidarity values conducted by governments, religious groups,NGOs, advocacy organizations, and others through formal and informal education, informationprovision, public debate, media programming, etc.

78 Raskin, Gallopin, Gutman, Hammond and Swart
Table 7. Policy Instruments to Attain the Proposed Environmental Objectives
• International agreements on treatment of global commons, biodiversity, and resource andtechnology transfers.
• Environmental codes of conduct associated with international commerce, investment, tourism,transport, migration, biodiversity uses, etc.
• Reactive regulations, laws and rules that discourage known environmental disruption (e.g.,regulation to control pollution and natural resource depletion).
• Proactive regulations, laws and rules that encourage the introduction of sustainable practices(e.g., measures that foster energy efficiency, recycling and clean technologies, biodiversity andnatural resource conservation).
• Scientific and technological development for a) pollution prevention, b) clean production andconsumption technologies, c) sustainable use of natural environments and resources, d)deepening the understanding of environment and society interactions, and e) enhancing decisionmaking tools (e.g., green accounting, long range assessment, EIA).
• Green budgets which use fiscal measures as a lever to promote environmental goals, including:a) directing public expenditure to ecologically-friendly products (e.g., efficient technologies,recycled products), b) using pollution and natural resource depletion taxes ("eco-taxes") as aprimary source of public revenue, and c) moving subsidies from activities that foster resourceinefficiency and environmental degradation to those that promote sustainability.
• Social empowerment policies that acknowledge and support traditional property rights of localand indigenous communities and traditional sustainable uses of biodiversity.
• Persuasion efforts to promote environmental sustainability values conducted by governments,religious groups, NGOs, advocacy organizations, and others through formal and informaleducation, information provision, public debate, media programming, etc.
• Economic policies to motivate sustainable behavior based on individual and corporateeconomic self-interest, and to use market allocation mechanisms to attain environmental goalsin an economically efficient manner, including:
� full pricing of environmental goods and services ("internalization of externalities") through a)charges or royalty fees on pollution, production, resource extraction, or resource development,b) ecological taxes, c) deposit-refund systems, bond and deposit systems, and d) import tariffsand export taxes.
� stimulation of environmental markets through a) tradable permits for pollution and resourceuse, b) assigning property rights to own, use, or develop resources, and c) liability andinsurance markets.
� distribution of subsidies through a) tax breaks, b) tax differentials, c) exemptions fromcharges, d) grants, e) soft loans, f) accelerated depreciation allowances, etc.
There is no single best package of options. Rather, diverse approaches will beneeded that are appropriate to the issue, level of governance and local concerns. Anumber of considerations come into play such as social and political acceptability,economic efficiency, implementation and enforcement hurdles, equity impacts and the

Bending the Curve: Toward Global Sustainability 79
local environmental features. Many of these concerns are specific to national and localcontexts, and cannot be properly addressed from the global perspective assumed here.Nevertheless, the global scenario approach can offer the following important guidelines forformulating policies for the transition:
• Seek consistency across sectors. A complex and interacting set of processes that spanenvironmental, economic, technological, social, cultural, and political dimensions drivethe global system. Policies aimed at one aspect, such as poverty alleviation, mayexacerbate other problems, such as environmental degradation. Contradictory sectoralpolicies can negate one another or backfire. Scenario analysis helps identifyopportunities for mutual reinforcement between sectoral policies. For example, thePolicy Reform scenario provides a guide for avoiding measures for environmentallysustainable goals that are at the expense of the poor, or that promote social goals in anenvironmentally unsustainable way. Similarly, the need for compatibility and synergybetween initiatives in agriculture, water and energy sectors is underscored in theintegrated scenario analysis.
• Aim for spatial integration while recognizing local diversity. Policies need to beconsistent across scales, as well as across sectors. For instance, national policiesshould neither inhibit local initiatives, nor undermine global policies. Moreover, sinceeach human community and ecosystem is unique, policies should allow for andencourage adaptations to the local context and conditions. Again, the integratedscenario approach can illuminate the requirements for a multilevel policy framework.
• Harmonize short-term and long-term outlooks. A long time horizon is an obviousrequirement for policies that aim to affect development over many decades. But long-term policy is often, by default, the cumulative result of a series of policies with ashorter-term outlook. Therefore, short-term policies should be designed and assessedfor their long-range impacts. Alternative policies may achieve similar short-term goalsbut have very different long-term impacts. Ideally, policies should create a platform forthe next round of new and more advanced policies. The scenario approach isparticularly appropriate for incorporating long-term considerations into today’s policydiscussions.
• Preserve flexibility and future options. Due to the many uncertainties inherent in theunfolding future, flexibility and adaptability to change is critical for the design ofresilient policies. Wherever possible, major policy proposals should be assessed in thisregard, and scenario techniques can help in doing so.
• Promote pluralism. As we have noted, new social actors are becoming increasinglyimportant, complementing traditional modes of decision-making and action. Inparticular, NGOs encompass a dizzying variety of interests including educationalorganizations, trade unions, religious organizations, charities, and media. Whilegovernments must shoulder their responsibility for confronting the challenge of thesustainability transition, the policy process should involve and mobilize all relevantinstitutions, tapping into their diverse capacity and potential for interaction, synergyand complementarity. This means that participation, negotiation and the articulation ofmultiple goals should substitute for antagonism and exclusion. Again, a scenario-

80 Raskin, Gallopin, Gutman, Hammond and Swart
building process that can cultivate contrasting visions and perspectives is a criticaltechnique for fostering pluralistic dialogue.
The Policy Reform scenario focuses on policies for adjusting the current trends,not on a fundamental alteration in institutions and values. Nevertheless, sustainabilitypolicy must be open to opportunities for addressing the evolution of what we have calledultimate drivers, as well. An appreciation of the interplay between immediate and ultimatecauses is important to the design of the appropriate policy instruments, sinceenvironmental problems can have similar symptoms but different causes. For instance,very different policy instruments are necessary when land erosion is driven by thecommercial search for short-term profits, instead of by the survival needs of the poor.Regulations or economic incentives can discourage environmentally disruptive practices,while education for new social values can change behaviors.
5.6 Conventional Worlds and BeyondThe lesson of the Conventional Worlds-Reference scenario is not that the world willinevitably follow an unsatisfactory development path in the absence of proactive policyinterventions. Even without action, it is possible that unforeseen surprises, feedbacks andadaptations could mitigate the social and environmental pressures of the Reference world— or exacerbate them. The message is, rather, that there are deepening risks anduncertainties, and that complacency is not a valid option for those who believe thatpassing on a more secure future is a moral imperative.
The discussion of Conventional Worlds-Policy Reform scenarios brought bothgood news and bad news. The good news is that making great strides toward thesustainability transition does not require that we posit either a social revolution or the deusex machina of a technological miracle. Though there are numerous constraints andchallenges, the cumulative effects of a comprehensive family of feasible incrementaladjustments can make a substantial difference. An evolutionary process that promotesappropriate technology, improved environmental management and greater internationaland social equity would take us a long way. The bad news is that Policy Reformscenarios do require a strong postulate — the hypothesis of sufficient political will. Theyassume that an unprecedented commitment arises for achieving sustainability goals, andthat effective economic, social and institutional reforms are introduced for achieving them.The hypothesis poses critical questions for the Policy Reform route to the sustainabilitytransition. Can today’s nascent political formations acting on behalf of sustainabilityovercome the resistance of special interests, the myopia of narrow outlooks, and theinertia of complacency? Or are fundamental changes required in values and lifestyles thattranscend Conventional Worlds assumptions — a Great Transition?
These basic questions will be addressed in the struggle over the design andimplementation of specific actions. The scenario approach reminds us that there is morethan one route to sustainability, and that a successful transition does not depend on aworld-wide endorsement of any blueprint. We see before us a process of socialdiscussion, of forging alliances to foster the implementation of short and medium termagendas, and of the ascendancy of new values in the long run. Progress will probably notbe linear — social and environmental surprises are likely to jolt the world system and

Bending the Curve: Toward Global Sustainability 81
reorient public awareness. Slowly a consensus can be built for an agenda to avoid majorsocial and environmental disruptions. This generation will bestow the gift of choice toposterity if it can begin to bend the curve of development toward sustainability.

82 Raskin, Gallopin, Gutman, Hammond and Swart
Bending the Curve: Toward Global Sustainability 83
REFERENCES
Adriaanse, A., S. Bringezu, A. Hammond, Y. Moriguchi, E. Rodenburg, D. Rogich andH. Schutz. 1997. Resource Flows: The Material Basis of Industrial Economies.World Resources Institute/Wuppertal Institute/Netherlands Ministry of Housing,Spatial Planning and Environment/Japan National Institute for EnvironmentalStudies. Washington, D.C.: World Resources Institute.
Alcamo, J., A. Bouwman, J. Edmonds, A. Grübler, T. Morita and A. Sugandhy. 1995. AnEvaluation of the IPCC IS92 Emissions Scenarios. In: Hougthon, J.T., L.G. MeiraFilho, J. Bruce, Hoesung Lee, B.A. Callander, E. Haites, N. Harris and K. Maskell:Climate Change 1994. Cambridge: Cambridge University Press.
Alcamo, J., P. Döll, F. Kaspar and S. Siebert. 1997. Global Change and Global Scenariosof Water Use and Availability: an Application of WaterGAP 1.0. Kassel, Germany:Wissenschaftliches Zentrum für Umweltsystemforschung, UniversitätGesamthochschule Kassel.
Alexandratos, N. (ed.) 1995. World Agriculture: Towards 2010. Chichester, U.K.: JohnWiley and Sons.
Azar, C. and H. Rodhe. 1997. “Targets for Stabilization of Atmospheric CO2,” Science276, pp. 92-93.
Bender, J. 1994. Future Harvest: Pesticide-Free Farming. Lincoln: University ofNebraska Press.
Bernardini, O. and R. Galli. 1993. “Dematerialization: Long-term Trends in the Intensityof Use of Materials and Energy,” Futures May, pp. 431-448.
Bongaarts, J. 1997. Personal communication.
Brown, L., M. Renner and C. Flavin. 1998. Vital Signs 1998. New York: W.W. Norton& Company.
Bryant, D., et al. 1997. Frontier Forests. Washington, D.C.: World Resources Institute.
BSD (Board on Sustainable Development, U.S. National Research Council). 1998. OurCommon Journey: Navigating a Sustainability Transition. Washington, D.C.:National Academy Press. (forthcoming).
Burke, L. and D. Bryant. 1998. Reefs at Risk. Washington, D.C.: World ResourcesInstitute,
Carley, M. and P. Spapens. 1998. Sharing the World: Sustainable Living and GlobalEquity in the 21st Century. London: Earthscan.
CIA (Central Intelligence Agency). 1997. The World Factbook 1996. McLean, Virginia:Central Intelligence Agency. Available from http://www.odci.gov/cia/; INTERNET.
Conway, G. 1997. The Doubly Green Revolution: Food for All in the 21st Century.London: Penguin Books.
CSIRO (Australian Commonwealth Scientific and Industrial Research Organisation).1994. Future Emissions and Concentrations of Carbon Dioxide: Key

84 Raskin, Gallopin, Gutman, Hammond and Swart
Ocean/Atmosphere/Land Analyses. I. G. Enting, T. M. L. Wigley and M. Heimann(eds.). Aspendale, Victoria: CSIRO. CSIRO Division of Atmospheric ResearchTechnical Paper No. 31.
Daly, H. 1996. Beyond Growth: The Economics of Sustainable Development. Boston:Beacon Press.
Deininger, K. and L. Squire. 1996. “A New Data Set Measuring Income Inequality,” TheWorld Bank Economic Review 10(3), pp. 565-591.
DPCSD (Department for Policy Coordination and Sustainable Development of the UnitedNations). 1996. Indicators of Sustainable Development: Framework andMethodology. New York: United Nations. Available fromhttp://www.un.org/dpcsd/dsd/isd.htm; INTERNET.
Durning, A. B. and H. B. Brough. 1991. Taking Stock : Animal Farming and theEnvironment. Washington, D.C.: Worldwatch Institute. Worldwatch Paper 103.
Energy Innovations. 1997. Energy Innovations: A Prosperous Path to a CleanEnvironment. Washington, D.C.: Alliance to Save Energy, American Council for anEnergy-Efficient Economy, Natural Resources Defense Council, Tellus Institute, andUnion of Concerned Scientists.
Factor 10 Club. 1995. Carnoules Declaration. Wuppertal: Wuppertal Institut.
FAO (Food and Agricultural Organization). 1991. Recent Developments in WorldFisheries. Rome: Food and Agricultural Organization.
———. 1996a. AQUASTAT Database. Rome: Food and Agricultural Organization.Available from http://www.fao.org; INTERNET.
———. 1996b. FAOSTAT·PC. Rome: FAO.
———. 1996c. Report of the World Food Summit. Rome: Food and AgriculturalOrganization. Available from http:///www.fao.org/wfs/homepage; INTERNET.
———. 1996d. Sixth World Food Survey. Rome: Food and Agricultural Organization.
———. 1997a. Mapping Undernutrition (poster). Rome: Food and AgriculturalOrganization.
———. 1997b. State of the World’s Forests 1997. Rome: Food and AgricultureOrganization.
———. 1997c. The State of World Fisheries and Aquaculture 1996. Rome: Food andAgricultural Organization.
FASEB (Federation of American Societies for Experimental Biology, Life SciencesResearch Office). 1995. Third report on Nutrition Monitoring in the United States:Volume 1. Washington, D.C.: U.S. Government Printing Office.
Fischer, Günther. 1993. Personal communication.
Gallopin, G. 1994. Impoverishment and Sustainable Development, A Systems Approach.Winnipeg: International Institute for Sustainable Development.
Gallopin, G. A. Hammond, P. Raskin and R. Swart 1997. Branch Points: Global
Bending the Curve: Toward Global Sustainability 85
Scenarios and Human Choice. Stockholm, Sweden: Stockholm EnvironmentInstitute. PoleStar Series Report No. 7.
Gurr T. R. 1968. “A Causal Model of Civil Strife: A Comparative Analysis Using NewIndices,” American Political Science Review 62, pp. 1104-1124.
Hare, W.. 1997. The Carbon Logic. Amsterdam: Greenpeace.
Heaps, C., E. Kemp-Benedict and P. Raskin. 1998. Conventional Worlds: TechnicalDescription of “Bending the Curve” Scenarios. (forthcoming).
Hubbert, M. K. 1956. “Nuclear energy and the fossil fuels”; American PetroleumInstitute Drilling & Production Practice Proceedings, Spring Meeting, SanAntonio, Texas, 7-25.
IEA (International Energy Agency). 1997a. Energy Balances of Non-OECD Countries,1960-1995 (electronic distribution). Paris: OECD.
———. 1997b. Energy Statistics of OECD Countries, 1960-1995 (electronicdistribution). Paris: OECD.
IPCC (Intergovernmental Panel on Climate Change). 1990. Climate Change: The IPCCScientific Assessment. J. Houghton, G. Jenkins and J. Ephraums (eds.). Cambridge:Cambridge University Press.
———. 1992a. 1992 IPCC Supplement. Geneva: World Meteorological Organization.
———. 1992b. Emissions Scenarios for the IPCC An Update: Assumptions,Methodology, and Results. Intergovernmental Panel on Climate Change WorkingGroup I.
———. 1995. Climate Change 1994: Radiative Forcing of Climate Change and AnEvaluation of the IPCC IS92 Emission Scenarios. J. T. Houghton, L. G. MeiraFilho, J. Bruce, Hoesung Lee, B. A. Callander, E. Haites, N. Harris and K. Maskell(eds.). Cambridge: Cambridge University Press.
———. 1996. Climate Change 1995: The Science of Climate Change. J. T. Houghton,L. G. Meira Filho, B. A. Callander, N. Harris, A. Kattenberg and K. Maskell (eds.).Cambridge: Cambridge University Press.
———. 1997. Stabilization of Atmospheric Greenhouse Gases: Physical, Biological andSocio-economic Implications. John T. Houghton, L. Gylvan Meria Filho, David J.Griggs and Kathy Maskell (eds.). Geneva: World Meteorological Organization.IPCC Technical Paper 3.
Jackson, T. (Ed.). 1993. Clean Production Strategies: Developing PreventiveEnvironmental Management in the Industrial Sector. London: Lewis.
Jackson, T. and A. McGillivray. 1995. Accounting for Toxic Emissions from the GlobalEconomy: the Case of Cadmium. Stockholm: Stockholm Environment Institute.PoleStar Series Report No. 6.
Kendall, H. and D. Pimentel. 1994. “Constraints on the Expansion of the Global FoodSupply,” Ambio 23, No. 3, pp. 198-205.
Kuylenstierna, J. 1998. Personal communication.
86 Raskin, Gallopin, Gutman, Hammond and Swart
Lonergan, S. and D. Brooks. 1994. Watershed: The Role of Fresh Water in the Israeli-Palestinian Conflict. Ottawa: International Development Research Centre.
Leach, G. 1995. Global Land & Food in the 21st Century: Trends & Issues forSustainability. Stockholm: Stockholm Environment Institute. PoleStar Series ReportNo. 5.
Mackenzie J. J. 1996. Oil as a Finite Resource: When is Global Production Likely toPeak? World Resources Institute. On-line resource paper. Available fromhttp://www.wri.org/wri/climate/finitoil; INTERNET.
Masters, C., D. Root and E. Attanasi. 1990. “World Oil and Gas Resources — FutureProduction Realities,” Annual Review of Energy 15, p. 23.
Masters, C. D., E. D. Attanasi and D. H. Root. 1994. World Petroleum Assessment andAnalysis. Proceedings of the 14th World Petroleum Congress, held in Stavanger.Norway.
McGoodwin, J. R.1990. Crisis in the World’s Fisheries: People, Problems, and Policies.Stanford, California: Stanford University Press.
Moldan, B., S. Billharz and R. Matravers. 1997. Sustainability Indicators: A Report onthe Project on Indicators of Sustainable Development. Chichester, U.K.: John Wileyand Sons. SCOPE 58.
Morita, T., M. Kainuma, H. Harasawa, K. Kai and Y. Matsuoka. 1995. Long-term GlobalScenarios based on the AIM Model. Nagoya. Japan: National Institute forEnvironmental Studies. AIM Interim Paper IP-95-03.
Muller E. N. 1988. “Democracy, Economic Development and Income Inequality,”American Sociological Review 53, pp. 50-68.
Muller, E. N. and M. A. Seligson. 1987. “Inequality and Insurgency,” American PoliticalScience Review 81, p. 425.
Munasinghe, M. and W. Shearer (eds.). 1995. Defining and Measuring Sustainability.Washington, D.C.: United Nations University, World Bank.
Myers, N. 1998. Perverse Subsidies: Tax $s Undercutting our Economies andEnvironments Alike. Winnipeg: International Institute for Sustainable Development.
NAS (National Academy of Sciences). 1984. Toxicity Testing: Strategies to DetermineNeeds and Priorities. Washington, D.C.: National Academy of Sciences.
Najlis, P. (Officer-in-Charge, Energy and Natural Resources Branch. Division forSustainable Development, DPCSD). 1996. Personal communication.
OECD (Organisation for Economic Co-operation and Development). 1997. The World in2020: Towards a New Global Age. Paris: OECD.
Oldeman, L., R. Hakkeling and W. Sombroek. 1991. World Map of the Status of Human-Induced Soil Degradation: An Explanatory Note. Second revised edition. Nairobi:United Nations Environment Program.
Posch, M., J.-P. Hettelingh, J. Alcamo and M. Krol. 1996. “Integrated Scenarios ofAcidification and Climate Change in Asia and Europe,” Global Environmental

Bending the Curve: Toward Global Sustainability 87
Change 6(4), pp. 375-394.
Postel, S. 1992. Last Oasis: Facing Water Scarcity. New York: W.W. Norton &Company.
Raskin, P. M. Chadwick, T. Jackson and G. Leach. 1996. The Sustainability Transition:Beyond Conventional Development. Stockholm: Stockholm Environment Institute.PoleStar Series Report No. 1.
Raskin, P., P. Gleick, P. Kirshen, G. Pontius and K. Strzepek. 1997. Water Futures:Assessment of Long-range Patterns and Problems. Background Document for theSEI/United Nations Comprehensive Assessment of the Freshwater Resources of theWorld. Stockholm: Stockholm Environment Institute.
Raskin, P., E. Hansen and R. Margolis. 1995. Water and Sustainability: A GlobalOutlook. Stockholm: Stockholm Environment Institute. PoleStar Series Report No.4.
Raskin, P. and R. Margolis. 1995. Global Energy in the 21st Century: Patterns,Projections and Problems. Stockholm: Stockholm Environment Institute. PoleStarSeries Report No. 3.
Ravallion, M., G. Datt and D. van de Walle. 1991. “Quantifying Absolute Poverty in theDeveloping World,” Review of Income and Wealth 37(4), p. 345
Rijsberman, F. and R. Swart (eds.). 1990. Targets and Indicators of Climate Change.Stockholm: Stockholm Environment Institute.
RIVM/UNEP (Netherlands Institute of Public Health and the Environment/United NationsEnvironment Program). 1997. The Future of the Global Environment: A Model-based Analysis Supporting UNEP’s First Global Environment Outlook. Bakkes, J.and J. van Woerden (eds.). Bilthoven, The Netherlands: RIVM.
Robinson, J. 1990. “Futures under glass: a recipe for people who hate to predict,” FuturesOctober 1990.
Rogner, H-H. 1996. An Assessment of World Hydrocarbon Resources. Laxenburg,Austria: International Institute for Applied Systems Analysis. IIASA Working PaperWP-96-56.
Rose, D., P.P. Basiotis and B.W. Klein. 1995. “Improving Federal Efforts to AssessHunger and Food Insecurity,” Food Review 18, Jan-Apr.
Rosegrant, M., M. Agacaoili-Sobilla and N. Perez. 1995. Global Food Projections to2020: Implications for Investment. Washington, D.C.: International Food PolicyResearch Institute, Washington.
Scherr, S. and S. Yadav. 1996. Land Degradation in the Developing World: Implicationsfor Food, Agriculture, and the Environment to 2050. Washington, D.C.: IFPRI.
Schwartz, P. and Leyden, P. 1997. “The Long Boom: A History of the Future,” WiredJuly 1997, pp. 115-129.
SEI (Stockholm Environment Institute). 1997. Comprehensive Assessment of theFreshwater Resources of the World. Stockholm: Stockholm Environment Institute.

88 Raskin, Gallopin, Gutman, Hammond and Swart
Sen, A. 1981. Poverty and Famines: An Essay on Entitlement and Deprivation. Oxford:Clarendon Press.
Seckler, D., U. Amarasinghe, D., Radhika de Silva and R. Barker. 1998. World WaterDemand and Supply, 1990 to 2025: Scenarios and Issues. IIMI Research Report 19.
Shiklomanov, I. 1993. “World Fresh Water Resources,” in P. Gleick, Water in Crisis: AGuide to the World’s Fresh Water Resources. New York: Oxford University Press.
———. 1997. Assessment of Water Resources and Water Availability of the World.Geneva: World Meteorological Organization.
Simon, J. 1981. The Ultimate Resource. Princeton, N.J.: Princeton University Press.
Swaminathan, M. 1997. “Sustainable Development: Five Years after Rio,” in A BetterFuture for Planet Earth. Tokyo: Asahi Glass Foundation.
Swart, R. 1996. “Security Risks of Global Environmental Changes: Viewpoint,” GlobalEnvironmental Change 3(3), pp. 187-192.
Tabatabai, H. 1996. Statistics on Poverty and Income Distribution: An ILO Compendiumof Data. Geneva: International Labour Office.
Thurow, L. C. 1996. The Future of Capitalism: How Today’s Economic Forces ShapeTomorrow’s World. New York: Penguin Books.
UN (United Nations). 1997. Annual Populations 1950-2050 (1996 rev., electronicdistribution). New York: United Nations.
UNCED (United Nations Conference on Environment and Development). 1992. Agenda21: Programme of Action for Sustainable Development. New York: United Nations.
UNCSD (United Nations Commission on Sustainable Development). 1998. Availablefrom: http://www.un.org/esa/sustdev.
UNDP (United Nations Development Program). 1992. Human Development Report 1992.Oxford: Oxford University Press.
———. 1996. Human Development Report 1996. Oxford: Oxford University Press.
———. 1997. Human Development Report 1997. Oxford: Oxford University Press.
UNDPCSD (Department for Policy Coordination and Sustainable Development of theUnited Nations). 1997. Critical Trends: Global Change and SustainableDevelopment. New York: United Nations.
UNEP (United Nations Environment Program). 1997. Global Environmental Outlook.Nairobi, Kenya: United Nations Environment Program.
UNESCO (United Nations Educational, Scientific and Cultural Organization). 1997. FifthInternational Conference on Adult Education. Paris: United Nations Educational,Scientific and Cultural Organization.
UNFCCC (United Nations Framework Convention on Climate Change). 1997. KyotoProtocol to the United Nations Framework Convention on Climate Change.Document FCCC/CP/1997/7/Add.1. Available from http://www.unfccc.de;INTERNET.

Bending the Curve: Toward Global Sustainability 89
U.S. Census (United States Census Bureau). 1997. Historical Income and Poverty Tables(Table H-4). Washington, D.C.: United States Census Bureau. Available fromhttp://www.census.gov/hhes/income/histinc/index/html; INTERNET.
Wallensteen, P. and A. Swain. 1997. International Fresh Water Resources: Conflict orCooperation? Background Document for the SEI/United Nations ComprehensiveAssessment of the Freshwater Resources of the World. Stockholm: StockholmEnvironment Institute.
Wang, T. Y. 1993. “Inequality and Political Violence Revisited,” American PoliticalScience Review 87(4), pp. 979-83.
WCED (World Commission on Environment and Development). 1987. Our CommonFuture. Oxford: Oxford University Press.
WCMC (World Conservation Monitoring Centre). 1998a. Global Forest InformationService World Tables. Cambridge: WCMC. Available from:http://www.wcmc.org.uk; INTERNET.
———. 1998b. Global Protected Areas Summary Statistics. Cambridge: WCMC.Available from: http://www.wcmc.org.uk; INTERNET.
WEC (World Energy Council). 1995. 1995 Survey of Energy Resources, 17th Edition.London, UK: World Energy Council.
WEC/IIASA (World Energy Council, International Institute for Applied SystemsAnalysis). 1995. Global Energy Perspectives to 2050 and Beyond. London: WorldEnergy Council.
WHO (World Health Organization). 1997a. Health for All in the 21st Century. Geneva:World Health Organization. Available from: http://www.who.ch/; INTERNET.
———. 1997b. Global Health-for-All Database. Geneva: World Health Organization.Available from: http://www.who.int/whosis/; INTERNET.
———. 1997c. The World Health Report 1997: Conquering Suffering, EnrichingHumanity. Geneva: World Health Organization.
Williams, R., E. Larson and M. Ross. 1987. “Materials, Affluence and Energy Use,”Annual Review of Energy 12, pp. 99-144.
World Bank. 1990. World Development Report 1990: Poverty. New York: OxfordUniversity Press.
———. 1996. Towards Environmentally Sustainable Development in Sub-SaharanAfrica: A World Bank Agenda. Washington, D.C.: World Bank.
———. 1997. World Development Indicators (electronic distribution). Washington, D.C.:World Bank.
———. 1998. World Development Indicators 1998. Washington, D.C.: World Bank.
WRI (World Resources Institute). 1994. World Resources, 1994-95. New York: OxfordUniversity Press.
———. 1996a. World Resources, 1996-97. New York: Oxford University Press.

90 Raskin, Gallopin, Gutman, Hammond and Swart
———. 1996b. World Resources 1996-97 Database Diskette. Washington, D.C.: WorldResources Institute.
WSSD (World Summit for Social Development). 1995. The Copenhagen Declaration andProgramme of Action. New York: United Nations.

Bending the Curve: Toward Global Sustainability A-1
Annex - Scenario Highlights
DEMOGRAPHYSheet D-1. Population .............................................................................................................A-3Sheet D-2. Urbanization..........................................................................................................A-4
ECONOMYSheet E-1. GDP.......................................................................................................................A-5Sheet E-2. Structure of GDP....................................................................................................A-6Sheet E-3. Income...................................................................................................................A-7
SOCIETYSheet S-1. Income Distribution................................................................................................A-8Sheet S-2. Hunger ...................................................................................................................A-9
ENERGYSheet En-1. Primary Energy Requirements by Region ........................................................... A-10Sheet En-2. Primary Energy Requirements by Source............................................................ A-11Sheet En-3. Final Fuel Demand by Region ............................................................................ A-12Sheet En-4. Final Fuel Demand by Sector ............................................................................. A-13Sheet En-5. Fossil Fuel Reserves ........................................................................................... A-14
FOOD AND AGRICULTURESheet F-1. Diets..................................................................................................................... A-15Sheet F-2. Meat and Milk Requirements and Production ....................................................... A-16Sheet F-3. Fish Requirements and Production ....................................................................... A-17Sheet F-4. Crop Requirements and Production ...................................................................... A-18Sheet F-5. Cereal Yields........................................................................................................ A-19Sheet F-6. Cropland .............................................................................................................. A-20Sheet F-7. Irrigation.............................................................................................................. A-21Sheet F-8. Potential Cultivable Land ..................................................................................... A-22
ENVIRONMENTAL PRESSURESheet P-1. Water Withdrawals by Region .............................................................................. A-23Sheet P-2. Water Withdrawals by Sector ............................................................................... A-24Sheet P-3. Water Stress ......................................................................................................... A-25Sheet P-4. Carbon Emissions................................................................................................. A-26Sheet P-5. Sulfur Emissions .................................................................................................. A-27Sheet P-6. Land-Use by Land Type........................................................................................ A-28Sheet P-7. Land-Use by Region ............................................................................................. A-29Sheet P-8. Fertilizer Consumption......................................................................................... A-31Sheet P-9. Fisheries............................................................................................................... A-32Sheet P-10. Toxic Waste ....................................................................................................... A-33
ABBREVIATIONS .............................................................................................................A-35
SELECTED CONVERSION FACTORS ..........................................................................A-35
DATA NOTES ...................................................................................................................A-37

A-2 Raskin, Gallopin, Gutman, Hammond and Swart

Bending the Curve: Toward Global Sustainability A-3
Sheet D-1. Population
Growth Rates - Reference P opulation - Ref erence
-1.0 0.0 1.0 2.0 3.0
W. Europe
Pacific OECD
N. America
FSU
E. Europe
S+SE Asia
Middle East
Latin America
China +
Africa
%/year
25-5095-25
0
2,000
4,000
6,000
8,000
10,000
1995 2025 2050
mill
ions
AfricaChina +Latin AmericaMiddle EastS+SE AsiaE. EuropeFSUN. AmericaPacific OECDW. Europe
ReferencePopulation (millions) Growth Rate (%/year) Index (95=1)
Region 1995 2025 2050 95-25 25-50 95-50 2025 2050Africa 719 1,454 2,046 2.4 1.4 1.9 2.0 2.8China + 1,330 1,642 1,704 0.7 0.1 0.5 1.2 1.3Latin America 477 689 810 1.2 0.6 1.0 1.4 1.7Middle East 178 365 499 2.4 1.3 1.9 2.1 2.8S+SE Asia 1,677 2,479 2,925 1.3 0.7 1.0 1.5 1.7E. Europe 99 97 92 -0.1 -0.2 -0.1 1.0 0.9FSU 293 297 291 0.0 -0.1 0.0 1.0 1.0N. America 297 369 384 0.7 0.2 0.5 1.2 1.3Pacific OECD 149 154 146 0.1 -0.2 0.0 1.0 1.0W. Europe 467 492 469 0.2 -0.2 0.0 1.1 1.0Developing 4,382 6,630 7,985 1.4 0.7 1.1 1.5 1.8Transitional 392 394 383 0.0 -0.1 0.0 1.0 1.0OECD 913 1,015 998 0.4 -0.1 0.2 1.1 1.1World 5,687 8,039 9,367 1.2 0.6 0.9 1.4 1.6
Policy ReformPopulation (millions) Growth Rate (%/year) Index (95=1)
Region 1995 2025 2050 95-25 25-50 95-50 2025 2050Africa 719 1,425 1,944 2.3 1.3 1.8 2.0 2.7China + 1,330 1,609 1,619 0.6 0.0 0.4 1.2 1.2Latin America 477 676 770 1.2 0.5 0.9 1.4 1.6Middle East 178 358 474 2.4 1.1 1.8 2.0 2.7S+SE Asia 1,677 2,430 2,779 1.2 0.5 0.9 1.4 1.7E. Europe 99 95 87 -0.1 -0.3 -0.2 1.0 0.9FSU 293 291 277 0.0 -0.2 -0.1 1.0 0.9N. America 297 369 384 0.7 0.2 0.5 1.2 1.3Pacific OECD 149 154 146 0.1 -0.2 0.0 1.0 1.0W. Europe 467 492 469 0.2 -0.2 0.0 1.1 1.0Developing 4,382 6,498 7,586 1.3 0.6 1.0 1.5 1.7Transitional 392 386 364 -0.1 -0.2 -0.1 1.0 0.9OECD 913 1,015 998 0.4 -0.1 0.2 1.1 1.1World 5,687 7,899 8,948 1.1 0.5 0.8 1.4 1.6

A-4 Raskin, Gallopin, Gutman, Hammond and Swart
Sheet D-2. Urbanization
-
20
40
60
80
100
Afr
ica
Chi
na +
Latin
Am
eric
a
Mid
dle
Eas
t
S+S
E A
sia
E. E
urop
e
FS
U
N. A
mer
ica
Pac
ific
OE
CD
W.
Eur
ope
Per
cent
199520252050
Urbanization (%)Region 1995 2025 2050Africa 34 54 69 China + 31 54 69 Latin America 74 84 90 Middle East 58 72 80 S+SE Asia 31 48 62 E. Europe 62 76 80 FSU 66 75 80 N. America 76 85 88 Pacific OECD 78 82 87 W. Europe 75 85 90 Developing 37 56 70 Transitional 65 75 80 OECD 76 84 89 World 45 61 72

Bending the Curve: Toward Global Sustainability A-5
Sheet E-1. GDP
0
50,000
100,000
150,000
1995 2025 2050 2025 2050
billi
on U
S$ P
PP
AfricaChina +Latin AmericaMiddle EastS+SE AsiaE. EuropeFSUN. AmericaPacific OECDW. Europe
Reference Policy Reform
ReferenceGDP (billion US$) MER PPP Growth Rate (%/year) Index (95=1)Region 1995 1995 2025 2050 95-25 25-50 95-50 2025 2050Africa 475 1,165 3,958 9,279 4.2 3.5 3.8 3.4 8.0China + 893 3,839 12,099 22,555 3.9 2.5 3.3 3.2 5.9Latin America 1,651 2,858 7,449 14,071 3.2 2.6 2.9 2.6 4.9Middle East 522 938 3,159 6,554 4.1 3.0 3.6 3.4 7.0S+SE Asia 1,769 4,329 14,160 30,745 4.0 3.1 3.6 3.3 7.1E. Europe 274 588 1,039 1,396 1.9 1.2 1.6 1.8 2.4FSU 528 1,206 2,197 3,032 2.0 1.3 1.7 1.8 2.5N. America 7,464 7,995 18,552 28,016 2.8 1.7 2.3 2.3 3.5Pacific OECD 5,544 3,146 6,082 8,524 2.2 1.4 1.8 1.9 2.7W. Europe 9,085 7,352 14,422 20,953 2.3 1.5 1.9 2.0 2.8Developing 5,310 13,129 40,825 83,204 3.9 2.9 3.4 3.1 6.3Transitional 802 1,794 3,236 4,427 2.0 1.3 1.7 1.8 2.5OECD 22,094 18,493 39,056 57,492 2.5 1.6 2.1 2.1 3.1World 28,205 33,416 83,117 145,124 3.1 2.3 2.7 2.5 4.3
Policy ReformGDP (billion US$) MER PPP Growth Rate (%/year) Index (95=1)Region 1995 1995 2025 2050 95-25 25-50 95-50 2025 2050Africa 475 1,165 6,381 16,427 5.8 3.9 4.9 5.5 14.1China + 893 3,839 13,762 25,368 4.3 2.5 3.5 3.6 6.6Latin America 1,651 2,858 8,026 15,177 3.5 2.6 3.1 2.8 5.3Middle East 522 938 3,501 7,383 4.5 3.0 3.8 3.7 7.9S+SE Asia 1,769 4,329 17,013 36,417 4.7 3.1 3.9 3.9 8.4E. Europe 274 588 1,120 1,533 2.2 1.3 1.8 1.9 2.6FSU 528 1,206 2,501 3,610 2.5 1.5 2.0 2.1 3.0N. America 7,464 7,995 13,341 16,494 1.7 0.9 1.3 1.7 2.1Pacific OECD 5,544 3,146 4,742 5,451 1.4 0.6 1.0 1.5 1.7W. Europe 9,085 7,352 12,202 14,524 1.7 0.7 1.2 1.7 2.0Developing 5,310 13,129 48,683 100,772 4.5 3.0 3.8 3.7 7.7Transitional 802 1,794 3,622 5,143 2.4 1.4 1.9 2.0 2.9OECD 22,094 18,493 30,285 36,468 1.7 0.7 1.2 1.6 2.0World 28,205 33,416 82,590 142,383 3.1 2.2 2.7 2.5 4.3

A-6 Raskin, Gallopin, Gutman, Hammond and Swart
Sheet E-2. Structure of GDP
1995 2050 - Policy Reform
0%
20%
40%
60%
80%
100%
Afr
ica
Chi
na +
Latin
Am
eric
a
Mid
dle
Eas
t
S+S
E A
sia
E. E
urop
e
FS
U
N. A
mer
ica
Pac
ific
OE
CD
W. E
urop
e
Wor
ld
Sha
re o
f G
DP
Afr
ica
Chi
na +
Latin
Am
eric
a
Mid
dle
Eas
t
S+
SE
Asi
a
E. E
uro
pe
FS
U
N. A
mer
ica
Pac
ific
OE
CD
W. E
uro
pe
Wor
ld
ServicesIndustryAgriculture
ReferenceShare of GDP (%) 1995 2025 2050Region Agriculture Industry Services Agriculture Industry Services Agriculture Industry ServicesAfrica 21 31 47 15 31 54 11 31 59 China + 20 47 34 10 42 48 7 36 58 Latin America 11 32 57 8 31 62 6 29 65 Middle East 18 37 44 12 35 53 8 33 59 S+SE Asia 21 34 45 11 33 56 8 31 61 E. Europe 10 38 52 7 35 58 6 32 62 FSU 12 38 51 8 36 56 7 34 59 N. America 2 27 72 1 26 73 1 25 74 Pacific OECD 2 37 61 1 37 62 1 37 63 W. Europe 11 28 61 6 28 66 4 28 68 Developing 18 37 44 11 35 55 8 30 62 Transitional 11 38 51 8 35 57 7 31 62 OECD 6 29 65 3 26 71 2 24 74 World 11 33 56 7 31 63 5 28 67
Policy ReformShare of GDP (%) 1995 2025 2050Region Agriculture Industry Services Agriculture Industry Services Agriculture Industry ServicesAfrica 21 31 47 11 31 59 8 30 62 China + 20 47 34 9 41 51 6 33 61 Latin America 11 32 57 7 31 62 6 28 66 Middle East 18 37 44 10 35 55 7 31 62 S+SE Asia 21 34 45 10 33 57 7 31 63 E. Europe 10 38 52 7 34 59 6 30 64 FSU 12 38 51 8 35 57 7 32 61 N. America 2 27 72 1 26 73 1 25 74 Pacific OECD 2 37 61 2 37 62 1 37 62 W. Europe 11 28 61 7 28 65 6 28 66 Developing 18 37 44 9 34 57 7 28 65 Transitional 11 38 51 7 34 59 6 29 64 OECD 6 29 65 4 26 70 3 24 73 World 11 33 56 7 31 62 6 27 67
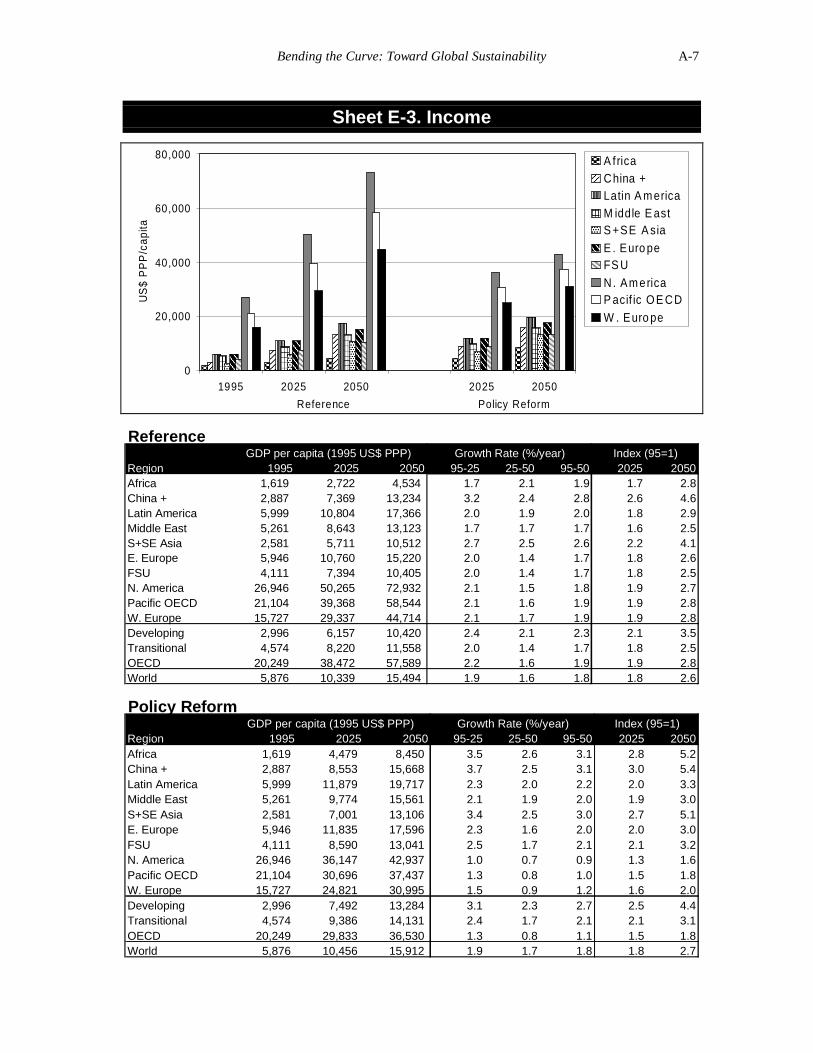
Bending the Curve: Toward Global Sustainability A-7
Sheet E-3. Income
0
20,000
40,000
60,000
80,000
1995 2025 2050 2025 2050
US
$ P
PP
/cap
ita
A f ricaChina +Latin A mericaM iddle E astS +SE A siaE . Euro peFS UN. AmericaP acif ic OE CDW . Euro pe
Reference Policy Reform
ReferenceGDP per capita (1995 US$ PPP) Growth Rate (%/year) Index (95=1)
Region 1995 2025 2050 95-25 25-50 95-50 2025 2050Africa 1,619 2,722 4,534 1.7 2.1 1.9 1.7 2.8China + 2,887 7,369 13,234 3.2 2.4 2.8 2.6 4.6Latin America 5,999 10,804 17,366 2.0 1.9 2.0 1.8 2.9Middle East 5,261 8,643 13,123 1.7 1.7 1.7 1.6 2.5S+SE Asia 2,581 5,711 10,512 2.7 2.5 2.6 2.2 4.1E. Europe 5,946 10,760 15,220 2.0 1.4 1.7 1.8 2.6FSU 4,111 7,394 10,405 2.0 1.4 1.7 1.8 2.5N. America 26,946 50,265 72,932 2.1 1.5 1.8 1.9 2.7Pacific OECD 21,104 39,368 58,544 2.1 1.6 1.9 1.9 2.8W. Europe 15,727 29,337 44,714 2.1 1.7 1.9 1.9 2.8Developing 2,996 6,157 10,420 2.4 2.1 2.3 2.1 3.5Transitional 4,574 8,220 11,558 2.0 1.4 1.7 1.8 2.5OECD 20,249 38,472 57,589 2.2 1.6 1.9 1.9 2.8World 5,876 10,339 15,494 1.9 1.6 1.8 1.8 2.6
Policy ReformGDP per capita (1995 US$ PPP) Growth Rate (%/year) Index (95=1)
Region 1995 2025 2050 95-25 25-50 95-50 2025 2050Africa 1,619 4,479 8,450 3.5 2.6 3.1 2.8 5.2China + 2,887 8,553 15,668 3.7 2.5 3.1 3.0 5.4Latin America 5,999 11,879 19,717 2.3 2.0 2.2 2.0 3.3Middle East 5,261 9,774 15,561 2.1 1.9 2.0 1.9 3.0S+SE Asia 2,581 7,001 13,106 3.4 2.5 3.0 2.7 5.1E. Europe 5,946 11,835 17,596 2.3 1.6 2.0 2.0 3.0FSU 4,111 8,590 13,041 2.5 1.7 2.1 2.1 3.2N. America 26,946 36,147 42,937 1.0 0.7 0.9 1.3 1.6Pacific OECD 21,104 30,696 37,437 1.3 0.8 1.0 1.5 1.8W. Europe 15,727 24,821 30,995 1.5 0.9 1.2 1.6 2.0Developing 2,996 7,492 13,284 3.1 2.3 2.7 2.5 4.4Transitional 4,574 9,386 14,131 2.4 1.7 2.1 2.1 3.1OECD 20,249 29,833 36,530 1.3 0.8 1.1 1.5 1.8World 5,876 10,456 15,912 1.9 1.7 1.8 1.8 2.7

A-8 Raskin, Gallopin, Gutman, Hammond and Swart
Sheet S-1. Income Distribution
Distributional Equity Reference P olicy Reform
0.04
0.08
0.12
0.16
0.20
0.24
1995 2025 2050
L20%
/H20
%
1995 2025 2050
AfricaChina +Latin AmericaMiddle EastS+SE AsiaE. EuropeFSUN. AmericaPacific OECDW. Europe
ReferenceDistributional Equity (L20%/H20%) Gini Coefficient
Region 1995 2025 2050 1995 2025 2050Africa 0.13 0.09 0.07 0.42 0.46 0.50 China + 0.14 0.10 0.08 0.38 0.44 0.47 Latin America 0.07 0.06 0.06 0.50 0.51 0.52 Middle East 0.10 0.07 0.06 0.45 0.49 0.51 S+SE Asia 0.18 0.11 0.09 0.34 0.41 0.45 E. Europe 0.23 0.14 0.11 0.29 0.37 0.42 FSU 0.22 0.14 0.10 0.30 0.38 0.43 N. America 0.11 0.08 0.06 0.43 0.47 0.51 Pacific OECD 0.16 0.11 0.08 0.36 0.43 0.47 W. Europe 0.19 0.12 0.09 0.33 0.41 0.45 World (pop. weighted) 0.15 0.10 0.08
Policy ReformDistributional Equity (L20%/H20%) Gini Coefficient
Region 1995 2025 2050 1995 2025 2050Africa 0.13 0.13 0.14 0.42 0.42 0.39 China + 0.14 0.14 0.14 0.38 0.38 0.38 Latin America 0.07 0.08 0.12 0.50 0.47 0.41 Middle East 0.10 0.10 0.12 0.45 0.44 0.41 S+SE Asia 0.18 0.15 0.15 0.34 0.36 0.37 E. Europe 0.23 0.18 0.16 0.29 0.33 0.35 FSU 0.22 0.17 0.16 0.30 0.34 0.36 N. America 0.11 0.11 0.12 0.43 0.43 0.40 Pacific OECD 0.16 0.14 0.15 0.36 0.37 0.37 W. Europe 0.19 0.16 0.15 0.33 0.36 0.36 World (pop. weighted) 0.15 0.14 0.14

Bending the Curve: Toward Global Sustainability A-9
Sheet S-2. Hunger
0
200
400
600
800
1,000
1995 2025 2050 2025 2050
mill
ions
of
peo
ple
AfricaChina +Latin AmericaMiddle EastS+SE AsiaE. EuropeFSUN. AmericaPacific OECDW. Europe
Reference Policy Reform
ReferenceIncidence (% of population) Incidence (millions) Index (95=1)
Region 1995 2025 2050 1995 2025 2050 2025 2050Africa 34 25 20 247 361 404 1.46 1.63China + 16 9 8 211 142 136 0.67 0.64Latin America 14 11 9 65 73 72 1.13 1.11Middle East 16 16 14 29 57 72 1.95 2.45S+SE Asia 19 10 8 320 259 240 0.81 0.75E. Europe 1 2 3 1 2 3 2.72 4.24FSU 4 5 6 11 14 18 1.24 1.55N. America 2 1 1 7 3 2 0.45 0.34Pacific OECD 1 1 0 1 1 0 0.53 0.32W. Europe 1 1 1 4 4 4 1.06 0.94Developing 20 13 12 873 893 924 1.02 1.06Transitional 3 4 5 12 16 21 1.33 1.71OECD 1 1 1 12 8 6 0.64 0.52World 16 11 10 898 917 951 1.02 1.06
Policy ReformIncidence (% of population) Incidence (millions) Index (95=1)
Region 1995 2025 2050 1995 2025 2050 2025 2050Africa 34 12 5 247 174 87 0.70 0.35China + 16 4 2 211 59 29 0.28 0.14Latin America 14 7 2 65 49 18 0.75 0.28Middle East 16 11 5 29 40 24 1.39 0.81S+SE Asia 19 4 2 320 109 54 0.34 0.17E. Europe 1 1 1 1 1 1 1.01 0.94FSU 4 2 2 11 7 5 0.57 0.40N. America 2 1 0 7 4 1 0.50 0.12Pacific OECD 1 0 0 1 1 0 0.35 0.11W. Europe 1 1 0 4 3 1 0.69 0.37Developing 20 7 3 873 431 212 0.49 0.24Transitional 3 2 1 12 7 5 0.60 0.43OECD 1 1 0 12 7 2 0.54 0.19World 16 6 2 898 445 220 0.50 0.25

A-10 Raskin, Gallopin, Gutman, Hammond and Swart
Sheet En-1. Primary Energy Requirements by Region
0
200
400
600
800
1,000
1995 2025 2050 2025 2050
EJ
AfricaChina +Latin AmericaMiddle EastS+SE AsiaE. EuropeFSUN. AmericaPacific OECDW. Europe
Reference Policy Reform
ReferencePrimary Energy (EJ) Growth Rate (%/year) Index (95=1) Intensity (MJ/$ PPP)
Region 1995 2025 2050 95-25 25-50 95-50 2025 2050 1995 2025 2050Africa 17 50 98 3.6 2.7 3.2 2.9 5.7 15 13 11China + 48 105 144 2.7 1.3 2.0 2.2 3.0 12 9 6Latin America 24 55 84 2.7 1.8 2.3 2.3 3.5 8 7 6Middle East 18 38 60 2.5 1.9 2.2 2.1 3.3 19 12 9S+SE Asia 43 114 205 3.3 2.4 2.9 2.7 4.8 10 8 7E. Europe 10 13 12 0.8 -0.2 0.4 1.3 1.2 17 12 9FSU 45 60 64 0.9 0.3 0.6 1.3 1.4 38 27 21N. America 94 138 152 1.3 0.4 0.9 1.5 1.6 12 7 5Pacific OECD 23 29 31 0.8 0.2 0.5 1.3 1.3 7 5 4W. Europe 63 76 79 0.6 0.2 0.4 1.2 1.3 9 5 4Developing 150 361 591 3.0 2.0 2.5 2.4 3.9 11 9 7Transitional 55 73 76 0.9 0.2 0.6 1.3 1.4 31 22 17OECD 179 243 262 1.0 0.3 0.7 1.4 1.5 10 6 5World 384 677 929 1.9 1.3 1.6 1.8 2.4 12 8 6
Policy ReformPrimary Energy (EJ) Growth Rate (%/year) Index (95=1) Intensity (MJ/$ PPP)
Region 1995 2025 2050 95-25 25-50 95-50 2025 2050 1995 2025 2050Africa 17 63 107 4.4 2.1 3.4 3.7 6.2 15 10 6China + 48 104 105 2.6 0.0 1.4 2.2 2.2 12 8 4Latin America 24 45 48 2.1 0.2 1.2 1.9 2.0 8 6 3Middle East 18 37 41 2.4 0.4 1.5 2.1 2.3 19 11 6S+SE Asia 43 114 160 3.3 1.4 2.4 2.7 3.8 10 7 4E. Europe 10 9 6 -0.3 -1.4 -0.8 0.9 0.7 17 8 4FSU 45 47 28 0.1 -2.0 -0.9 1.0 0.6 38 19 8N. America 94 73 57 -0.8 -1.0 -0.9 0.8 0.6 12 5 3Pacific OECD 23 17 12 -1.0 -1.3 -1.2 0.7 0.5 7 4 2W. Europe 63 49 36 -0.8 -1.3 -1.0 0.8 0.6 9 4 2Developing 150 363 460 3.0 0.9 2.1 2.4 3.1 11 7 5Transitional 55 56 35 0.1 -1.9 -0.9 1.0 0.6 31 16 7OECD 179 138 105 -0.9 -1.1 -1.0 0.8 0.6 10 5 3World 384 558 599 1.2 0.3 0.8 1.5 1.6 12 7 4

Bending the Curve: Toward Global Sustainability A-11
Sheet En-2. Primary Energy Requirements by Source
0%
20%
40%
60%
80%
100%
1995 2025 2050 2025 2050
fuel
sha
re
Coal
Crude Oil
Natural Gas
Uranium
Hydropower
Renewables
Reference Policy Reform
ReferencePrimary Energy (EJ) Share of Total (%) Growth Rate (%/year) Index (95=1)
Fuel 1995 2025 2050 1995 2025 2050 95-25 25-50 95-50 2025 2050Coal 95 166 224 25 25 24 1.9 1.2 1.6 1.8 2.4Crude Oil 141 256 332 37 38 36 2.0 1.0 1.6 1.8 2.3Natural Gas 73 136 203 19 20 22 2.1 1.6 1.9 1.9 2.8Uranium 25 39 64 7 6 7 1.5 2.0 1.7 1.5 2.5Hydropower 9 16 20 2 2 2 1.9 0.9 1.4 1.7 2.2Renewables 41 64 87 11 9 9 1.5 1.3 1.4 1.6 2.1Total 384 677 929 100 100 100 1.9 1.3 1.6 1.8 2.4
Policy ReformPrimary Energy (EJ) Share of Total (%) Growth Rate (%/year) Index (95=1)
Fuel 1995 2025 2050 1995 2025 2050 95-25 25-50 95-50 2025 2050Coal 95 113 63 25 20 11 0.6 -2.3 -0.7 1.2 0.7Crude Oil 141 183 153 37 33 26 0.9 -0.7 0.1 1.3 1.1Natural Gas 73 156 215 19 28 36 2.6 1.3 2.0 2.1 2.9Uranium 25 22 - 7 4 - -0.4 - - 0.9 0.0Hydropower 9 16 20 2 3 3 1.9 0.9 1.4 1.7 2.2Renewables 41 68 148 11 12 25 1.7 3.2 2.4 1.7 3.6Total 384 558 599 100 100 100 1.2 0.3 0.8 1.5 1.6

A-12 Raskin, Gallopin, Gutman, Hammond and Swart
Sheet En-3. Final Fuel Demand by Region
0
100
200
300
400
500
600
700
1995 2025 2050 2025 2050
EJ
AfricaChina +Latin AmericaMiddle EastS+SE AsiaE. EuropeFSUN. AmericaPacific OECDW. Europe
Reference Policy Reform
ReferenceFinal Energy Demand (EJ) Growth Rate (%/year) Index (95=1) Intensity (MJ/$ PPP)
Region 1995 2025 2050 95-25 25-50 95-50 2025 2050 1995 2025 2050Africa 13 35 66 3.3 2.6 3.0 2.7 5.1 11 9 7China + 37 77 103 2.5 1.1 1.9 2.1 2.8 10 6 5Latin America 18 39 56 2.7 1.4 2.1 2.2 3.2 6 5 4Middle East 9 26 42 3.7 2.0 2.9 2.9 4.8 9 8 6S+SE Asia 33 82 143 3.1 2.2 2.7 2.5 4.3 8 6 5E. Europe 6 8 8 0.8 -0.1 0.4 1.3 1.2 11 8 6FSU 29 40 42 1.0 0.2 0.7 1.4 1.4 24 18 14N. America 64 101 112 1.5 0.4 1.0 1.6 1.7 8 5 4Pacific OECD 17 19 20 0.5 0.1 0.3 1.2 1.2 5 3 2W. Europe 46 55 58 0.6 0.2 0.4 1.2 1.3 6 4 3Developing 109 260 409 2.9 1.8 2.4 2.4 3.7 8 6 5Transitional 36 48 50 1.0 0.2 0.6 1.3 1.4 20 15 11OECD 126 176 190 1.1 0.3 0.7 1.4 1.5 7 4 3World 272 483 649 1.9 1.2 1.6 1.8 2.4 8 6 4
Policy ReformFinal Energy Demand (EJ) Growth Rate (%/year) Index (95=1) Intensity (MJ/$ PPP)
Region 1995 2025 2050 95-25 25-50 95-50 2025 2050 1995 2025 2050Africa 13 46 84 4.3 2.4 3.4 3.5 6.4 11 7 5China + 37 76 80 2.5 0.2 1.4 2.1 2.2 10 6 3Latin America 18 37 37 2.5 0.0 1.4 2.1 2.1 6 5 2Middle East 9 26 33 3.7 1.0 2.5 2.9 3.8 9 7 5S+SE Asia 33 88 129 3.3 1.5 2.5 2.6 3.9 8 5 4E. Europe 6 6 5 0.1 -1.0 -0.4 1.0 0.8 11 6 3FSU 29 37 24 0.7 -1.7 -0.4 1.2 0.8 24 15 7N. America 64 59 47 -0.3 -0.9 -0.6 0.9 0.7 8 4 3Pacific OECD 17 13 9 -0.9 -1.2 -1.0 0.8 0.6 5 3 2W. Europe 46 38 29 -0.6 -1.1 -0.8 0.8 0.6 6 3 2Developing 109 272 363 3.1 1.2 2.2 2.5 3.3 8 6 4Transitional 36 43 29 0.6 -1.6 -0.4 1.2 0.8 20 12 6OECD 126 109 85 -0.5 -1.0 -0.7 0.9 0.7 7 4 2World 272 425 476 1.5 0.5 1.0 1.6 1.8 8 5 3

Bending the Curve: Toward Global Sustainability A-13
Sheet En-4. Final Fuel Demand by Sector
0%
20%
40%
60%
80%
100%
1995 2025 2050 2025 2050
fuel
sha
re
Agriculture
Households
Industry
Services
Transport
Reference Policy Reform
ReferenceFinal Energy Demand (EJ) Share of Total (%) Growth Rate (%/year) Index (95=1)
Sector 1995 2025 2050 1995 2025 2050 95-25 25-50 95-50 2025 2050Agriculture 8 11 14 3 2 2 1.1 1.0 1.0 1.4 1.8Households 72 102 123 27 21 19 1.2 0.7 1.0 1.4 1.7Industry 104 188 250 38 39 39 2.0 1.1 1.6 1.8 2.4Services 19 34 58 7 7 9 2.1 2.1 2.1 1.9 3.1Transport 69 147 204 25 30 31 2.6 1.3 2.0 2.1 3.0Total 272 483 649 100 100 100 1.9 1.2 1.6 1.8 2.4
Policy ReformFinal Energy Demand (EJ) Share of Total (%) Growth Rate (%/year) Index (95=1)
Sector 1995 2025 2050 1995 2025 2050 95-25 25-50 95-50 2025 2050Agriculture 8 10 12 3 2 3 0.9 0.6 0.8 1.3 1.5Households 72 102 116 27 24 24 1.2 0.5 0.9 1.4 1.6Industry 104 175 184 38 41 39 1.7 0.2 1.0 1.7 1.8Services 19 29 44 7 7 9 1.5 1.7 1.6 1.6 2.4Transport 69 108 121 25 26 25 1.5 0.4 1.0 1.6 1.8Total 272 425 476 100 100 100 1.5 0.5 1.0 1.6 1.8

A-14 Raskin, Gallopin, Gutman, Hammond and Swart
Sheet En-5. Fossil Fuel Reserves
Conventional Crude Oil
0
500
1,000
1,500
2,000
2,500
1995 2025 2050
billi
on b
arre
ls
Conventional Natural Gas
-
100
200
300
1995 2025 2050
10^1
2 cu
bic
met
ers
Proven
Proven +Undiscovered
Policy ReformCumulativeConsumptionReferenceCumulativeConsumption
Uranium
0
1,000
2,000
3,000
4,000
5,000
6,000
7,000
1995 2025 2050
thou
sand
tonn
es
Coal
0
500
1,000
1,500
2,000
1995 2025 2050
billio
n to
nnes
Total Remaining ReservesProven + Undiscovered, 1995
Coal Crude Oil Natural Gas Uranium Share of Reserves (%)
Region (109 t) (109 barrels) (1012 m3) (103 t) Coal Crude OilNatural Gas UraniumAfrica 62 84 15 1,142 4 5 6 35 China+ 265 276 4 5 16 17 2 0 Latin America 20 407 20 174 1 26 8 5 Middle East 0 670 80 - 0 42 31 - S+SE Asia 151 24 13 57 9 2 5 2 E Europe 92 2 2 21 5 0 1 1 FSU 241 58 91 - 14 4 36 - N America 249 45 21 799 15 3 8 24 Pacific OECD 525 3 2 926 31 0 1 28 W Europe 105 25 8 157 6 2 3 5 Developing 499 1,461 131 1,378 29 92 52 42 Transitional 333 60 92 21 19 4 36 1 OECD 879 73 31 1,881 51 5 12 57 World 1,711 1,594 254 3,281 100 100 100 100 World (EJ) 51,336 9,279 8,900 1,102
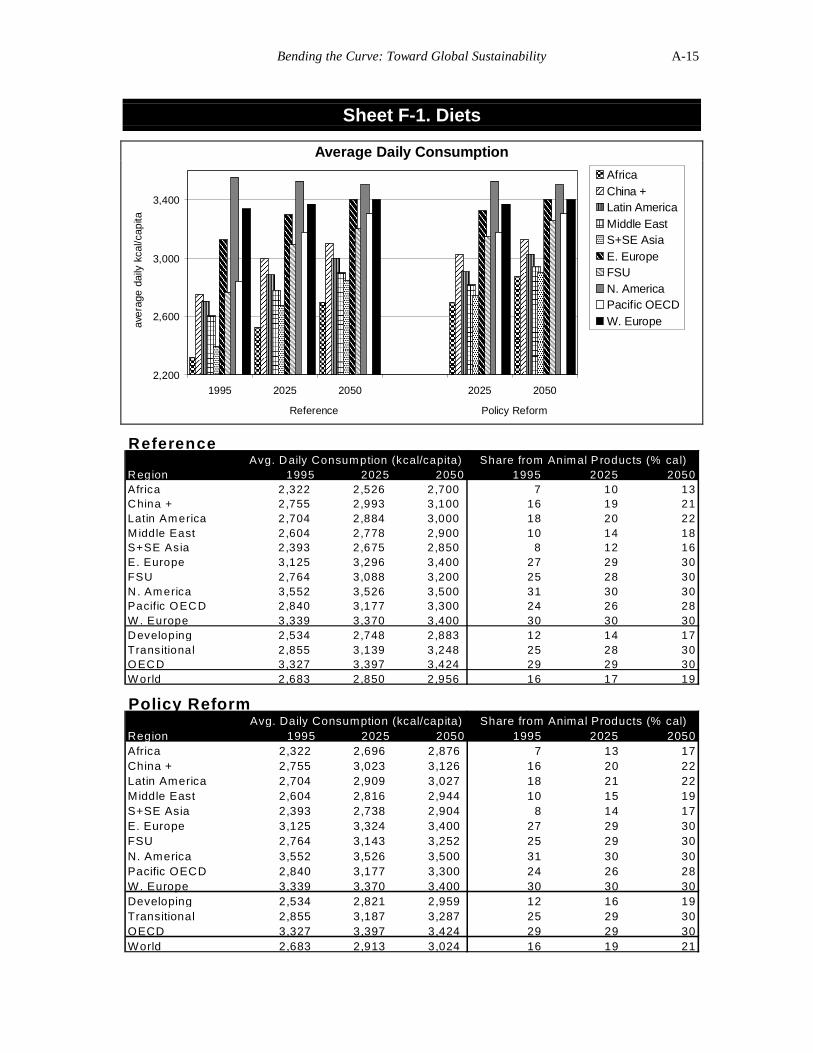
Bending the Curve: Toward Global Sustainability A-15
Sheet F-1. Diets
Average Daily Consumption
2,200
2,600
3,000
3,400
1995 2025 2050 2025 2050
aver
age
daily
kca
l/cap
ita
AfricaChina +Latin AmericaMiddle EastS+SE AsiaE. EuropeFSUN. AmericaPacific OECDW. Europe
Reference Policy Reform
ReferenceAvg. Daily Consum ption (kcal/capita) Share from Anim al P roducts (% cal)
Region 1995 2025 2050 1995 2025 2050Africa 2,322 2,526 2,700 7 10 13China + 2,755 2,993 3,100 16 19 21Latin Am erica 2,704 2,884 3,000 18 20 22M iddle East 2,604 2,778 2,900 10 14 18S+SE Asia 2,393 2,675 2,850 8 12 16E. Europe 3,125 3,296 3,400 27 29 30FSU 2,764 3,088 3,200 25 28 30N. Am erica 3,552 3,526 3,500 31 30 30Pacific OECD 2,840 3,177 3,300 24 26 28W . Europe 3,339 3,370 3,400 30 30 30Developing 2,534 2,748 2,883 12 14 17Transitional 2,855 3,139 3,248 25 28 30OECD 3,327 3,397 3,424 29 29 30W orld 2,683 2,850 2,956 16 17 19
Policy ReformAvg. Daily Consumption (kcal/capita) Share from Animal Products (% cal)
Region 1995 2025 2050 1995 2025 2050Africa 2,322 2,696 2,876 7 13 17China + 2,755 3,023 3,126 16 20 22Latin America 2,704 2,909 3,027 18 21 22Middle East 2,604 2,816 2,944 10 15 19S+SE Asia 2,393 2,738 2,904 8 14 17E. Europe 3,125 3,324 3,400 27 29 30FSU 2,764 3,143 3,252 25 29 30N. America 3,552 3,526 3,500 31 30 30Pacific OECD 2,840 3,177 3,300 24 26 28W. Europe 3,339 3,370 3,400 30 30 30Developing 2,534 2,821 2,959 12 16 19Transitional 2,855 3,187 3,287 25 29 30OECD 3,327 3,397 3,424 29 29 30World 2,683 2,913 3,024 16 19 21

A-16 Raskin, Gallopin, Gutman, Hammond and Swart
Sheet F-2. Meat and Milk Requirements and Production
Milk and Meat Requirements
0
500
1,000
1,500
2,000
1995 2025 2050 2025 2050
mill
ion
tonn
es
AfricaChina +Latin AmericaMiddle EastS+SE AsiaE. EuropeFSUN. AmericaPacific OECDW. Europe
Reference Policy Reform
ReferenceRequirements (million tonnes) Production (million tonnes) Self-Sufficiency Ratio Fraction of Meat from Feedlots (%)
Region 1995 2025 2050 1995 2025 2050 1995 2025 2050 1995 2025 2050Africa 41 120 232 36 101 197 0.9 0.8 0.9 28% 32% 33%China + 80 159 203 79 160 205 1.0 1.0 1.0 18% 19% 20%Latin America 86 146 196 79 143 194 0.9 1.0 1.0 40% 41% 40%Middle East 18 50 90 14 34 60 0.8 0.7 0.7 75% 85% 89%S+SE Asia 117 269 435 110 254 419 0.9 0.9 1.0 18% 21% 23%E. Europe 32 35 35 34 38 39 1.1 1.1 1.1 71% 75% 76%FSU 95 115 125 102 126 142 1.1 1.1 1.1 73% 79% 81%N. America 126 152 157 127 166 179 1.0 1.1 1.1 70% 76% 79%Pacific OECD 30 42 47 40 50 59 1.3 1.2 1.3 30% 45% 52%W. Europe 185 201 195 196 217 221 1.1 1.1 1.1 35% 42% 46%Developing 343 744 1,156 317 691 1,075 0.9 0.9 0.9 24% 27% 29%Transitional 127 150 160 135 163 181 1.1 1.1 1.1 72% 78% 80%OECD 341 394 399 363 434 459 1.1 1.1 1.2 49% 56% 61%World 811 1,288 1,715 816 1,288 1,715 1.0 1.0 1.0 37% 39% 39%
Policy ReformRequirements (million tonnes) Production (million tonnes) Self-Sufficiency Ratio Fraction of Meat from Feedlots (%)
Region 1995 2025 2050 1995 2025 2050 1995 2025 2050 1995 2025 2050Africa 41 162 306 36 136 261 0.9 0.8 0.9 28% 45% 58%China + 80 171 208 79 172 210 1.0 1.0 1.0 18% 19% 24%Latin America 86 152 188 79 150 187 0.9 1.0 1.0 40% 42% 50%Middle East 18 53 92 14 36 61 0.8 0.7 0.7 75% 87% 92%S+SE Asia 117 309 445 110 291 429 0.9 0.9 1.0 18% 30% 35%E. Europe 32 34 33 34 38 38 1.1 1.1 1.1 71% 75% 78%FSU 95 118 121 102 131 140 1.1 1.1 1.2 73% 80% 81%N. America 126 152 157 127 168 182 1.0 1.1 1.2 70% 78% 82%Pacific OECD 30 42 47 40 52 60 1.3 1.2 1.3 30% 50% 55%W. Europe 185 201 196 196 220 224 1.1 1.1 1.1 35% 43% 47%Developing 343 846 1,239 317 786 1,148 0.9 0.9 0.9 24% 31% 41%Transitional 127 153 155 135 169 178 1.1 1.1 1.2 72% 79% 80%OECD 341 395 400 363 440 467 1.1 1.1 1.2 49% 58% 63%World 811 1,394 1,793 816 1,394 1,793 1.0 1.0 1.0 37% 41% 47%

Bending the Curve: Toward Global Sustainability A-17
Sheet F-3. Fish Requirements and Production
Fish Requirements
0
50
100
150
1995 2025 2050 2025 2050
mill
ion
tonn
es
AfricaChina +Latin AmericaMiddle EastS+SE AsiaE. EuropeFSUN. AmericaPacific OECD
W. Europe
Reference Policy Reform
ReferenceRequirements (million tonnes) Production (million tonnes) Self-Sufficiency Ratio
Region 1995 2025 2050 1995 2025 2050 1995 2025 2050Africa 6 15 23 5 11 17 0.8 0.8 0.8China + 31 39 40 27 35 38 0.9 0.9 0.9Latin America 8 13 15 20 31 35 2.4 2.3 2.3Middle East 2 7 11 1 3 5 0.4 0.5 0.5S+SE Asia 22 36 44 21 35 42 1.0 1.0 1.0E. Europe 1 1 1 1 0 0 0.6 0.4 0.5FSU 4 5 4 4 4 4 1.0 1.0 1.0N. America 9 11 11 7 11 11 0.8 1.0 1.0Pacific OECD 14 14 11 10 12 10 0.7 0.9 0.9W. Europe 16 11 9 13 8 7 0.8 0.7 0.8Developing 68 109 132 73 115 137 1.1 1.1 1.0Transitional 5 5 5 5 5 5 0.9 0.9 0.9OECD 39 37 32 30 32 28 0.8 0.9 0.9World 113 151 170 108 151 170 1.0 1.0 1.0
Policy ReformRequirements (million tonnes) Production (million tonnes) Self-Sufficiency Ratio
Region 1995 2025 2050 1995 2025 2050 1995 2025 2050Africa 6 14 22 5 11 17 0.8 0.8 0.8 China + 31 38 37 27 34 35 0.9 0.9 0.9 Latin America 8 13 15 20 30 33 2.4 2.4 2.3 Middle East 2 7 11 1 3 5 0.4 0.5 0.5 S+SE Asia 22 35 41 21 34 40 1.0 1.0 1.0 E. Europe 1 1 1 1 0 0 0.6 0.4 0.5 FSU 4 5 4 4 5 4 1.0 1.0 1.0 N. America 9 11 11 7 11 11 0.8 1.0 1.0 Pacific OECD 14 14 11 10 12 10 0.7 0.9 0.9 W. Europe 16 11 9 13 8 7 0.8 0.7 0.8 Developing 68 107 126 73 113 130 1.1 1.1 1.0 Transitional 5 5 5 5 5 5 0.9 0.9 0.9 OECD 39 37 32 30 32 28 0.8 0.9 0.9 World 113 149 163 108 149 163 1.0 1.0 1.0

A-18 Raskin, Gallopin, Gutman, Hammond and Swart
Sheet F-4. Crop Requirements and Production
Crop Requirements
0
2,000
4,000
6,000
8,000
10,000
12,000
1995 2025 2050 2025 2050
mill
ion
tonn
es
AfricaChina +Latin AmericaMiddle EastS+SE AsiaE. EuropeFSUN. AmericaPacific OECDW. Europe
Reference Policy Reform
ReferenceRequirements (million tonnes) Production (million tonnes) Net Exports (million tonnes) Self-Sufficiency Ratio
Region 1995 2025 2050 1995 2025 2050 1995 2025 2050 1995 2025 2050Africa 500 1,080 1,610 438 887 1,369 -61 -193 -241 0.9 0.8 0.9China + 908 1,283 1,424 864 1,228 1,412 -44 -55 -12 1.0 1.0 1.0Latin America 729 1,131 1,438 836 1,268 1,534 106 137 96 1.1 1.1 1.1Middle East 153 347 503 95 201 273 -58 -146 -231 0.6 0.6 0.5S+SE Asia 1,101 1,941 2,578 1,094 1,917 2,562 -7 -24 -16 1.0 1.0 1.0E. Europe 163 183 191 156 211 238 -7 28 47 1.0 1.2 1.2FSU 405 563 614 310 612 691 -95 48 77 0.8 1.1 1.1N. America 515 659 708 659 821 928 144 161 219 1.3 1.2 1.3Pacific OECD 130 177 194 101 146 157 -29 -31 -37 0.8 0.8 0.8W. Europe 638 724 738 610 798 836 -29 74 97 1.0 1.1 1.1Developing 3,390 5,782 7,553 3,327 5,501 7,150 -64 -281 -403 1.0 1.0 0.9Transitional 569 747 805 466 823 929 -103 76 124 0.8 1.1 1.2OECD 1,284 1,560 1,641 1,369 1,765 1,920 86 204 279 1.1 1.1 1.2World 5,243 8,089 9,999 5,162 8,089 9,999 -81 0 0 1.0 1.0 1.0
Policy ReformRequirements (million tonnes) Production (million tonnes) Net Exports (million tonnes) Self-Sufficiency Ratio
Region 1995 2025 2050 1995 2025 2050 1995 2025 2050 1995 2025 2050Africa 500 1,211 1,865 438 956 1,412 -61 -255 -453 0.9 0.8 0.8China + 908 1,272 1,425 864 1,236 1,466 -44 -36 40 1.0 1.0 1.0Latin America 729 1,104 1,635 836 1,259 1,758 106 155 124 1.1 1.1 1.1Middle East 153 349 494 95 192 252 -58 -157 -242 0.6 0.5 0.5S+SE Asia 1,101 2,001 2,642 1,094 1,899 2,279 -7 -102 -363 1.0 0.9 0.9E. Europe 163 186 188 156 228 264 -7 42 76 1.0 1.2 1.4FSU 405 575 615 310 640 807 -95 65 192 0.8 1.1 1.3N. America 515 668 732 659 892 1,201 144 224 469 1.3 1.3 1.6Pacific OECD 130 184 199 101 146 154 -29 -39 -45 0.8 0.8 0.8W. Europe 638 733 744 610 835 946 -29 103 202 1.0 1.1 1.3Developing 3,390 5,937 8,060 3,327 5,542 7,167 -64 -395 -893 1.0 0.9 0.9Transitional 569 761 803 466 869 1,071 -103 107 268 0.8 1.1 1.3OECD 1,284 1,585 1,676 1,369 1,873 2,301 86 288 626 1.1 1.2 1.4World 5,243 8,284 10,539 5,162 8,284 10,539 -81 0 0 1.0 1.0 1.0

Bending the Curve: Toward Global Sustainability A-19
Sheet F-5. Cereal Yields
0
2
4
6
8
10
1995 2025 2050 2025 2050
tonn
es/h
ecta
re-y
ear
AfricaChina +Latin AmericaMiddle EastS+SE AsiaE. EuropeFSUN. AmericaPacific OECDW. Europe
Reference Policy Reform
ReferenceHarvest yield (tonnes/hectare) Cropping Intensity (harvests/yr) Annual yield (tonnes/hectare-yr) Index (95=1)
Region 1995 2025 2050 1995 2025 2050 1995 2025 2050 2025 2050Africa 1.2 2.3 2.8 0.85 0.85 0.89 1.0 1.9 2.5 1.9 2.4China + 4.4 5.8 6.2 1.44 1.53 1.62 6.3 9.0 10.1 1.4 1.6Latin America 2.4 3.2 3.5 0.81 0.84 0.87 2.0 2.7 3.1 1.3 1.5Middle East 1.6 2.6 3.1 0.64 0.71 0.85 1.0 1.9 2.6 1.8 2.5S+SE Asia 2.4 3.9 4.3 1.01 1.10 1.18 2.4 4.3 5.1 1.8 2.1E. Europe 3.0 5.2 5.7 0.80 0.79 0.79 2.4 4.1 4.4 1.7 1.8FSU 1.5 3.3 3.5 0.55 0.63 0.65 0.8 2.1 2.3 2.5 2.7N. America 4.9 6.0 6.2 0.56 0.55 0.58 2.7 3.3 3.6 1.2 1.3Pacific OECD 2.1 3.0 3.1 0.38 0.40 0.42 0.8 1.2 1.3 1.5 1.6W. Europe 4.1 6.0 6.2 0.72 0.75 0.74 2.9 4.5 4.6 1.5 1.6Developing 2.5 3.7 4.1 0.98 1.01 1.06 2.5 3.7 4.3 1.5 1.7Transitional 1.8 3.6 3.8 0.59 0.65 0.67 1.1 2.4 2.6 2.2 2.4OECD 4.3 5.7 5.9 0.58 0.58 0.60 2.5 3.3 3.5 1.3 1.4World 2.8 4.1 4.4 0.77 0.81 0.84 2.2 3.3 3.7 1.5 1.7
Policy ReformHarvest yield (tonnes/hectare) Cropping Intensity (harvests/yr) Annual yield (tonnes/hectare-yr) Index (95=1)
Region 1995 2025 2050 1995 2025 2050 1995 2025 2050 2025 2050Africa 1.2 2.3 2.8 0.85 0.85 0.89 1.0 1.9 2.5 1.9 2.4China + 4.4 5.6 6.0 1.44 1.51 1.59 6.3 8.5 9.5 1.4 1.5Latin America 2.4 3.1 3.5 0.81 0.83 0.87 2.0 2.6 3.0 1.3 1.5Middle East 1.6 2.6 2.9 0.64 0.69 0.82 1.0 1.8 2.4 1.7 2.3S+SE Asia 2.4 4.1 4.7 1.01 1.11 1.20 2.4 4.6 5.7 1.9 2.4E. Europe 3.0 5.2 5.6 0.80 0.79 0.78 2.4 4.1 4.4 1.7 1.8FSU 1.5 3.3 3.5 0.55 0.63 0.65 0.8 2.0 2.2 2.4 2.7N. America 4.9 5.9 5.9 0.56 0.54 0.57 2.7 3.2 3.4 1.2 1.2Pacific OECD 2.1 3.0 3.1 0.38 0.40 0.42 0.8 1.2 1.3 1.5 1.6W. Europe 4.1 5.9 6.0 0.72 0.75 0.73 2.9 4.4 4.4 1.5 1.5Developing 2.5 3.7 4.2 0.98 1.01 1.06 2.5 3.7 4.4 1.5 1.8Transitional 1.8 3.6 3.8 0.59 0.65 0.67 1.1 2.3 2.5 2.2 2.4OECD 4.3 5.6 5.7 0.58 0.58 0.60 2.5 3.3 3.4 1.3 1.4World 2.8 4.1 4.5 0.77 0.80 0.81 2.2 3.3 3.7 1.5 1.7

A-20 Raskin, Gallopin, Gutman, Hammond and Swart
Sheet F-6. Cropland
0
500
1,000
1,500
1995 2025 2050 2025 2050
mill
ion
hect
ares
AfricaChina +Latin AmericaMiddle EastS+SE AsiaE. EuropeFSUN. AmericaPacific OECDW. Europe
Reference Policy Reform
ReferenceTotal Cropland (million ha) Growth Rate (%/year) Index (95=1)
Region 1995 2025 2050 95-25 25-50 95-50 2025 2050Africa 186 255 277 1.1 0.3 0.7 1.4 1.5China + 107 110 105 0.1 -0.2 0.0 1.0 1.0Latin America 144 162 176 0.4 0.3 0.4 1.1 1.2Middle East 44 46 46 0.1 0.1 0.1 1.0 1.1S+SE Asia 289 294 309 0.1 0.2 0.1 1.0 1.1E. Europe 39 38 38 -0.2 0.0 -0.1 1.0 1.0FSU 228 219 226 -0.1 0.1 0.0 1.0 1.0N. America 233 225 237 -0.1 0.2 0.0 1.0 1.0Pacific OECD 55 63 65 0.4 0.1 0.3 1.1 1.2W. Europe 124 122 127 0.0 0.2 0.0 1.0 1.0Developing 770 867 913 0.4 0.2 0.3 1.1 1.2Transitional 268 256 264 -0.1 0.1 0.0 1.0 1.0OECD 412 410 429 0.0 0.2 0.1 1.0 1.0World 1,450 1,534 1,606 0.2 0.2 0.2 1.1 1.1
Policy ReformTotal Cropland (million ha) Growth Rate (%/year) Index (95=1)
Region 1995 2025 2050 95-25 25-50 95-50 2025 2050Africa 186 275 287 1.3 0.2 0.8 1.5 1.5China + 107 114 109 0.2 -0.2 0.0 1.1 1.0Latin America 144 171 196 0.6 0.5 0.6 1.2 1.4Middle East 44 53 57 0.6 0.3 0.5 1.2 1.3S+SE Asia 289 283 258 -0.1 -0.4 -0.2 1.0 0.9E. Europe 39 40 41 0.0 0.1 0.1 1.0 1.0FSU 228 235 251 0.1 0.3 0.2 1.0 1.1N. America 233 252 331 0.3 1.1 0.6 1.1 1.4Pacific OECD 55 63 60 0.4 -0.1 0.2 1.1 1.1W. Europe 124 133 153 0.2 0.6 0.4 1.1 1.2Developing 770 896 907 0.5 0.1 0.3 1.2 1.2Transitional 268 275 293 0.1 0.2 0.2 1.0 1.1OECD 412 447 545 0.3 0.8 0.5 1.1 1.3World 1,450 1,618 1,744 0.4 0.3 0.3 1.1 1.2

Bending the Curve: Toward Global Sustainability A-21
Sheet F-7. Irrigation
0
100
200
300
1995 2025 2050 2025 2050
mill
ion
hect
ares
AfricaChina +Latin AmericaMiddle EastS+SE AsiaE. EuropeFSUN. AmericaPacific OECDW. Europe
Reference Policy Reform
ReferenceIrrigated Cropland (million ha) Index (95=1) Fraction of Cropland Irrigated (%)
Region 1995 2025 2050 2025 2050 1995 2025 2050Africa 12 14 14 1.1 1.1 7 5 5 China + 53 56 58 1.1 1.1 49 51 56 Latin America 18 20 22 1.1 1.3 12 12 13 Middle East 15 17 17 1.1 1.1 34 37 37 S+SE Asia 84 95 99 1.1 1.2 29 32 32 E. Europe 5 5 5 1.1 1.2 12 14 14 FSU 19 21 23 1.1 1.2 8 10 10 N. America 22 23 24 1.0 1.1 9 10 10 Pacific OECD 5 6 6 1.1 1.1 9 9 9 W. Europe 16 17 19 1.1 1.2 13 14 15 Developing 182 201 211 1.1 1.2 24 23 23 Transitional 24 26 28 1.1 1.2 9 10 11 OECD 43 46 49 1.1 1.1 11 11 11 World 250 274 288 1.1 1.2 17 18 18
Policy ReformIrrigated Cropland (million ha) Index (95=1) Fraction of Cropland Irrigated (%)
Region 1995 2025 2050 2025 2050 1995 2025 2050Africa 12 14 14 1.1 1.1 7 5 5 China + 53 56 58 1.0 1.1 49 49 53 Latin America 18 20 22 1.1 1.3 12 12 11 Middle East 15 14 13 0.9 0.9 34 27 24 S+SE Asia 84 95 99 1.1 1.2 29 34 38 E. Europe 5 5 5 1.1 1.1 12 13 13 FSU 19 21 23 1.1 1.2 8 9 9 N. America 22 23 24 1.0 1.1 9 9 7 Pacific OECD 5 6 6 1.1 1.1 9 9 10 W. Europe 16 17 19 1.1 1.2 13 13 12 Developing 182 198 206 1.1 1.1 24 22 23 Transitional 24 26 28 1.1 1.2 9 9 10 OECD 43 46 49 1.1 1.1 11 10 9 World 250 271 283 1.1 1.1 17 17 16

A-22 Raskin, Gallopin, Gutman, Hammond and Swart
Sheet F-8. Potential Cultivable Land
Policy Reform Scenario PCL per Capita Cropland/PCL
0
1
2
3
1995 2025 2050
PC
L he
ctar
es/c
apita
0
20
40
60
80
100
1995 2025 2050
crop
land
are
a/P
CL
area
(%
)
A f ricaC hina +Latin A m ericaM idd le E astS + S E A siaE . E uro peFS UN . A m eric aP acif ic O E C DW . E uro pe
ReferencePC L (m illion ha) PC L per cap ita (ha/capita) C rop land/PC L (% )
R egion 1995 2025 2050 1995 2025 2050 1995 2025 2050Africa 1,077 1,024 978 1.5 0.7 0.5 17 25 28 C hina + 206 178 153 0.2 0.1 0.1 52 62 68 La tin A merica 1,010 981 953 2.1 1.4 1.2 14 16 18 M iddle East 59 52 47 0.3 0.1 0.1 75 87 99 S+SE A sia 420 391 356 0.3 0.2 0.1 69 75 87 E. Europe 57 56 54 0.6 0.6 0.6 69 68 70 FSU 716 713 710 2.4 2.4 2.4 32 31 32 N . Am erica 705 697 693 2.4 1.9 1.8 33 32 34 Pacific O EC D 333 331 330 2.2 2.1 2.3 17 19 20 W . Europe 229 227 226 0.5 0.5 0.5 54 54 56 D eve loping 2,772 2,626 2,487 0.6 0.4 0.3 28 33 37 T ransitional 773 768 764 2.0 2.0 2.0 35 33 35 O EC D 1,267 1,254 1,249 1.4 1.2 1.3 33 33 34 W orld 4,812 4,649 4,500 0.8 0.6 0.5 30 33 36
Policy ReformPCL (million ha) PCL per capita (ha/capita) Cropland/PCL (%)
Region 1995 2025 2050 1995 2025 2050 1995 2025 2050Africa 1,077 1,043 1,048 1.5 0.7 0.5 17 26 27 China + 206 188 189 0.2 0.1 0.1 52 61 57 Latin America 1,010 996 1,003 2.1 1.5 1.3 14 17 20 Middle East 59 55 57 0.3 0.2 0.1 75 96 100 S+SE Asia 420 392 369 0.3 0.2 0.1 69 72 70 E. Europe 57 56 57 0.6 0.6 0.7 69 71 73 FSU 716 714 714 2.4 2.5 2.6 32 33 35 N. America 705 702 704 2.4 1.9 1.8 33 36 47 Pacific OECD 333 333 333 2.2 2.2 2.3 17 19 18 W. Europe 229 229 230 0.5 0.5 0.5 54 58 67 Developing 2,772 2,674 2,667 0.6 0.4 0.4 28 34 34 Transitional 773 770 771 2.0 2.0 2.1 35 36 38 OECD 1,267 1,264 1,267 1.4 1.2 1.3 33 35 43 World 4,812 4,708 4,705 0.8 0.6 0.5 30 34 37

Bending the Curve: Toward Global Sustainability A-23
Sheet P-1. Water Withdrawals by Region
0
2,000
4,000
6,000
1995 2025 2050 2025 2050
billi
on m
3
AfricaChina +Latin AmericaMiddle EastS+SE AsiaE. EuropeFSUN. AmericaPacific OECDW. Europe
Reference Policy Reform
ReferenceWithdrawals (billion m3) Growth Rate (%/year) Index (95=1)
Region 1995 2025 2050 95-25 25-50 95-50 2025 2050Africa 167 255 371 1.4 1.5 1.5 1.5 2.2China + 553 755 933 1.0 0.8 1.0 1.4 1.7Latin America 257 389 543 1.4 1.3 1.4 1.5 2.1Middle East 200 302 377 1.4 0.9 1.2 1.5 1.9S+SE Asia 1,142 1,674 2,128 1.3 1.0 1.1 1.5 1.9E. Europe 63 75 73 0.6 -0.1 0.3 1.2 1.2FSU 381 535 568 1.1 0.2 0.7 1.4 1.5N. America 540 607 626 0.4 0.1 0.3 1.1 1.2Pacific OECD 121 144 150 0.6 0.2 0.4 1.2 1.2W. Europe 275 308 311 0.4 0.0 0.2 1.1 1.1Developing 2,319 3,375 4,352 1.3 1.0 1.2 1.5 1.9Transitional 444 610 641 1.1 0.2 0.7 1.4 1.4OECD 936 1,059 1,088 0.4 0.1 0.3 1.1 1.2World 3,699 5,044 6,081 1.0 0.8 0.9 1.4 1.6
Policy ReformWithdrawals (billion m3) Growth Rate (%/year) Index (95=1)
Region 1995 2025 2050 95-25 25-50 95-50 2025 2050Africa 167 227 276 1.0 0.8 0.9 1.4 1.7China + 553 647 650 0.5 0.0 0.3 1.2 1.2Latin America 257 331 364 0.8 0.4 0.6 1.3 1.4Middle East 200 228 206 0.5 -0.4 0.1 1.1 1.0S+SE Asia 1,142 1,442 1,414 0.8 -0.1 0.4 1.3 1.2E. Europe 63 56 47 -0.4 -0.8 -0.5 0.9 0.7FSU 381 386 315 0.0 -0.8 -0.3 1.0 0.8N. America 540 391 335 -1.1 -0.6 -0.9 0.7 0.6Pacific OECD 121 110 95 -0.3 -0.6 -0.4 0.9 0.8W. Europe 275 235 199 -0.5 -0.7 -0.6 0.9 0.7Developing 2,319 2,876 2,909 0.7 0.0 0.4 1.2 1.3Transitional 444 442 361 0.0 -0.8 -0.4 1.0 0.8OECD 936 736 628 -0.8 -0.6 -0.7 0.8 0.7World 3,699 4,054 3,899 0.3 -0.2 0.1 1.1 1.1

A-24 Raskin, Gallopin, Gutman, Hammond and Swart
Sheet P-2. Water Withdrawals by Sector
0%
20%
40%
60%
80%
100%
1995 2025 2050 2025 2050
sect
or s
hare
Agricultural
Industrial
Domestic
Reference Policy Reform
ReferenceWithdrawals (billion m3) Growth Rate (%/year) Sectoral Share (%)
Sector 1995 2025 2050 95-25 25-50 95-50 1995 2025 2050Agricultural 2,538 3,301 3,782 0.9 0.5 0.7 69 65 62 Industrial 738 1,090 1,417 1.3 1.1 1.2 20 22 23 Domestic 423 653 882 1.5 1.2 1.3 11 13 15 Total 3,699 5,044 6,081 1.0 0.8 0.9 100 100 100
Policy ReformWithdrawals (billion m3) Growth Rate (%/year) Sectoral Share (%)
Sector 1995 2025 2050 95-25 25-50 95-50 1995 2025 2050Agricultural 2,538 2,788 2,756 0.3 0.0 0.1 69 69 71 Industrial 738 659 475 -0.4 -1.3 -0.8 20 16 12 Domestic 423 607 667 1.2 0.4 0.8 11 15 17 Total 3,699 4,054 3,899 0.3 -0.2 0.1 100 100 100

Bending the Curve: Toward Global Sustainability A-25
Sheet P-3: Water Stress
Water Stress
0
1,000
2,000
3,000
4,000
5,000
1995 2025 2050 2025 2050
mill
ions
of
peop
le
AfricaChina +Latin AmericaMiddle EastS+SE AsiaE. EuropeFSUN. AmericaPacific OECDW. Europe
Reference Policy Reform
ReferenceUse/Resource Ratio Water Stress (millions of people) Water Stress (% of population)
Region 1995 2025 2050 1995 2025 2050 1995 2025 2050Africa 0.03 0.05 0.07 155 309 442 22 21 22 China + 0.16 0.21 0.26 338 751 1,083 25 46 64 Latin America 0.02 0.03 0.04 74 167 223 16 24 28 Middle East 0.56 0.84 1.05 164 353 496 92 97 99 S+SE Asia 0.10 0.15 0.19 816 1,764 2,119 49 71 72 E. Europe 0.09 0.11 0.10 17 25 23 17 26 25 FSU 0.08 0.11 0.12 - 9 15 - 3 5 N. America 0.10 0.11 0.12 88 137 151 30 37 39 Pacific OECD 0.10 0.12 0.12 29 41 41 19 27 28 W. Europe 0.12 0.13 0.13 182 223 207 39 45 44 Developing 0.07 0.10 0.13 1,549 3,346 4,366 35 50 55 Transitional 0.08 0.11 0.11 17 34 38 4 9 10 OECD 0.10 0.12 0.12 298 400 399 33 39 40 World 0.08 0.10 0.13 1,863 3,780 4,803 33 47 51
Policy ReformUse/Resource Ratio Water Stress (millions of people) Water Stress (% of population)
Region 1995 2025 2050 1995 2025 2050 1995 2025 2050Africa 0.03 0.04 0.05 155 285 393 22 20 20 China + 0.16 0.18 0.18 338 562 545 25 35 34 Latin America 0.02 0.02 0.03 74 122 116 16 18 15 Middle East 0.56 0.64 0.57 164 336 450 92 94 95 S+SE Asia 0.10 0.13 0.13 816 1,526 1,750 49 63 63 E. Europe 0.09 0.08 0.07 17 11 6 17 12 7 FSU 0.08 0.08 0.06 - - - - - - N. America 0.10 0.07 0.06 88 50 28 30 14 7 Pacific OECD 0.10 0.09 0.08 29 21 11 19 14 8 W. Europe 0.12 0.10 0.08 182 139 88 39 28 19 Developing 0.07 0.08 0.09 1,549 2,833 3,256 35 44 43 Transitional 0.08 0.08 0.06 17 11 6 4 3 2 OECD 0.10 0.08 0.07 298 210 127 33 21 13 World 0.08 0.08 0.08 1,863 3,055 3,391 33 39 38

A-26 Raskin, Gallopin, Gutman, Hammond and Swart
Sheet P-4. Carbon Emissions
Reference P olicy Reform
0
4
8
12
16
1995 2025 2050
Gt
C
1995 2025 2050 2075 2100
AfricaChina +Latin AmericaMiddle EastS+SE AsiaE. EuropeFSUN. AmericaPacific OECDW. Europe
ReferenceTotal Annual Emissions (Gt C) Index (95=1) Annual Per Capita (t C) Annual Per Dollar GDPPPP (kg C)
Region 1995 2025 2050 2025 2050 1995 2025 2050 1995 2025 2050Africa 0.17 0.65 1.39 3.9 8.3 0.2 0.4 0.7 0.14 0.16 0.15 China + 0.87 2.00 2.60 2.3 3.0 0.7 1.2 1.5 0.23 0.17 0.12 Latin America 0.30 0.75 1.15 2.5 3.8 0.6 1.1 1.4 0.10 0.10 0.08 Middle East 0.25 0.64 0.93 2.5 3.7 1.4 1.8 1.9 0.27 0.20 0.14 S+SE Asia 0.57 1.75 3.22 3.1 5.6 0.3 0.7 1.1 0.13 0.12 0.10 E. Europe 0.19 0.23 0.20 1.2 1.1 1.9 2.3 2.2 0.32 0.22 0.15 FSU 0.75 0.94 0.96 1.3 1.3 2.6 3.2 3.3 0.62 0.43 0.32 N. America 1.49 2.22 2.40 1.5 1.6 5.0 6.0 6.2 0.19 0.12 0.09 Pacific OECD 0.39 0.44 0.44 1.1 1.1 2.6 2.8 3.0 0.12 0.07 0.05 W. Europe 0.95 1.16 1.24 1.2 1.3 2.0 2.4 2.6 0.13 0.08 0.06 Developing 2.16 5.79 9.29 2.7 4.3 0.5 0.9 1.2 0.16 0.14 0.11 Transitional 0.94 1.17 1.16 1.2 1.2 2.4 3.0 3.0 0.52 0.36 0.26 OECD 2.83 3.82 4.08 1.3 1.4 3.1 3.8 4.1 0.15 0.10 0.07 World 5.94 10.78 14.53 1.8 2.4 1.0 1.3 1.6 0.18 0.13 0.10
Policy ReformTotal Annual Emissions (Gt C) Index (95=1) Annual Per Capita (t C) Annual Per Dollar GDPPPP (kg C)
Region 1995 2025 2050 2025 2050 1995 2025 2050 1995 2025 2050Africa 0.17 0.89 1.19 5.3 7.2 0.2 0.6 0.6 0.14 0.14 0.07 China + 0.87 1.95 1.47 2.2 1.7 0.7 1.2 0.9 0.23 0.14 0.06 Latin America 0.30 0.61 0.61 2.0 2.0 0.6 0.9 0.8 0.10 0.08 0.04 Middle East 0.25 0.61 0.54 2.4 2.2 1.4 1.7 1.1 0.27 0.17 0.07 S+SE Asia 0.57 1.78 1.86 3.1 3.2 0.3 0.7 0.7 0.13 0.10 0.05 E. Europe 0.19 0.15 0.10 0.8 0.5 1.9 1.6 1.1 0.32 0.14 0.06 FSU 0.75 0.68 0.38 0.9 0.5 2.6 2.3 1.4 0.62 0.27 0.11 N. America 1.49 0.90 0.59 0.6 0.4 5.0 2.4 1.5 0.19 0.07 0.04 Pacific OECD 0.39 0.21 0.14 0.6 0.4 2.6 1.4 1.0 0.12 0.05 0.03 W. Europe 0.95 0.59 0.41 0.6 0.4 2.0 1.2 0.9 0.13 0.05 0.03 Developing 2.16 5.83 5.67 2.7 2.6 0.5 0.9 0.7 0.16 0.12 0.06 Transitional 0.94 0.83 0.48 0.9 0.5 2.4 2.2 1.3 0.52 0.23 0.09 OECD 2.83 1.70 1.15 0.6 0.4 3.1 1.7 1.1 0.15 0.06 0.03 World 5.94 8.37 7.30 1.4 1.2 1.0 1.1 0.8 0.18 0.10 0.05

Bending the Curve: Toward Global Sustainability A-27
Sheet P-5. Sulfur Emissions
0
50
100
150
1995 2025 2050 2025 2050
mill
ion
tonn
es S
AfricaChina +Latin AmericaMiddle EastS+SE AsiaE. EuropeFSUN. AmericaPacific OECDW. Europe
Reference Policy Reform
ReferenceEm issions (m illion tonnes S) G row th Rate (% /year) Index (95=1)
Region 1995 2025 2050 95-25 25-50 95-50 2025 2050Africa 3 9 15 3.9 2.2 3.1 3.1 5.4China + 13 25 32 2.1 0.9 1.6 1.9 2.4Latin Am erica 3 7 11 2.3 1.9 2.1 2.0 3.2M iddle East 2 5 7 2.6 1.3 2.0 2.1 2.9S+SE Asia 7 18 34 3.1 2.5 2.8 2.5 4.6E . Europe 2 2 2 0.2 0.0 0.1 1.1 1.0FSU 10 10 9 -0.1 -0.4 -0.2 1.0 0.9N . America 12 11 12 -0.3 0.2 -0.1 0.9 1.0Pacific OECD 5 4 4 -0.9 -0.3 -0.6 0.8 0.7W . Europe 9 8 7 -0.3 -0.4 -0.3 0.9 0.8Developing 29 65 99 2.7 1.7 2.2 2.2 3.4T ransitional 13 12 11 -0.1 -0.3 -0.2 1.0 0.9O ECD 26 23 23 -0.4 -0.1 -0.3 0.9 0.9W orld 68 100 133 1.3 1.1 1.2 1.5 2.0
P o licy R e fo rmE m iss ions (m illion tonnes S) G row th R ate (% /year) Index (95=1)
R eg ion 1995 2025 2050 95-25 25-50 95-50 2025 2050A frica 3 6 6 2 .5 -0 .1 1 .3 2 .1 2 .0C h ina + 13 19 14 1 .2 -1 .4 0 .0 1 .4 1 .0Latin A m erica 3 6 6 1 .9 0 .0 1 .1 1 .8 1 .8M idd le E ast 2 3 3 1 .0 -0 .2 0 .5 1 .4 1 .3S +SE A s ia 7 15 13 2 .4 -0 .6 1 .0 2 .0 1 .7E . Europe 2 1 1 -2 .3 -2 .1 -2 .2 0 .5 0 .3F SU 10 5 2 -2 .3 -3 .0 -2 .6 0 .5 0 .2N . A m erica 12 6 3 -2 .5 -2 .7 -2 .6 0 .5 0 .2P ac ific O E C D 5 2 1 -2 .7 -2 .8 -2 .7 0 .4 0 .2W . E urope 9 4 2 -2 .7 -2 .7 -2 .7 0 .4 0 .2D eve lop ing 29 49 41 1 .7 -0 .7 0 .6 1 .7 1 .4T rans itiona l 13 6 3 -2 .3 -2 .8 -2 .5 0 .5 0 .2O EC D 26 12 6 -2 .6 -2 .7 -2 .6 0 .5 0 .2W orld 68 67 50 0 .0 -1 .2 -0 .6 1 .0 0 .7

A-28 Raskin, Gallopin, Gutman, Hammond and Swart
Sheet P-6. Land-Use by Land-Type
0%
20%
40%
60%
80%
100%
1995 2025 2050 2025 2050
Other
Pasture
Protected
Forest
Cropland
BuiltEnvironment
Reference Policy Reform
ReferenceLand area (million ha) Growth Rate (%/year) Index (95=1)
Land Type 1995 2025 2050 95-25 25-50 95-50 2025 2050Built Environment 268 440 613 1.7 1.3 1.5 1.6 2.3Cropland 1,450 1,534 1,606 0.2 0.2 0.2 1.1 1.1Forest 4,022 3,650 3,334 -0.3 -0.4 -0.3 0.9 0.8Pasture 3,395 3,674 3,862 0.3 0.2 0.2 1.1 1.1Protected 825 825 825 0.0 0.0 0.0 1.0 1.0Other 3,042 2,880 2,762 -0.2 -0.2 -0.2 0.9 0.9Total 13,002 13,002 13,002 - - - 1.0 1.0
Policy ReformLand area (million ha) Growth Rate (%/year) Index (95=1)
Land Type 1995 2025 2050 95-25 25-50 95-50 2025 2050Built Environment 268 404 505 1.38 0.89 1.16 1.5 1.9Cropland 1,450 1,618 1,744 0.37 0.30 0.34 1.1 1.2Forest 4,022 3,803 3,845 -0.19 0.04 -0.08 0.9 1.0Pasture 3,395 3,691 3,605 0.28 -0.09 0.11 1.1 1.1Protected 825 821 821 -0.02 0.00 -0.01 1.0 1.0Other 3,042 2,666 2,483 -0.44 -0.28 -0.37 0.9 0.8Total 13,002 13,002 13,002 - - - 1.0 1.0
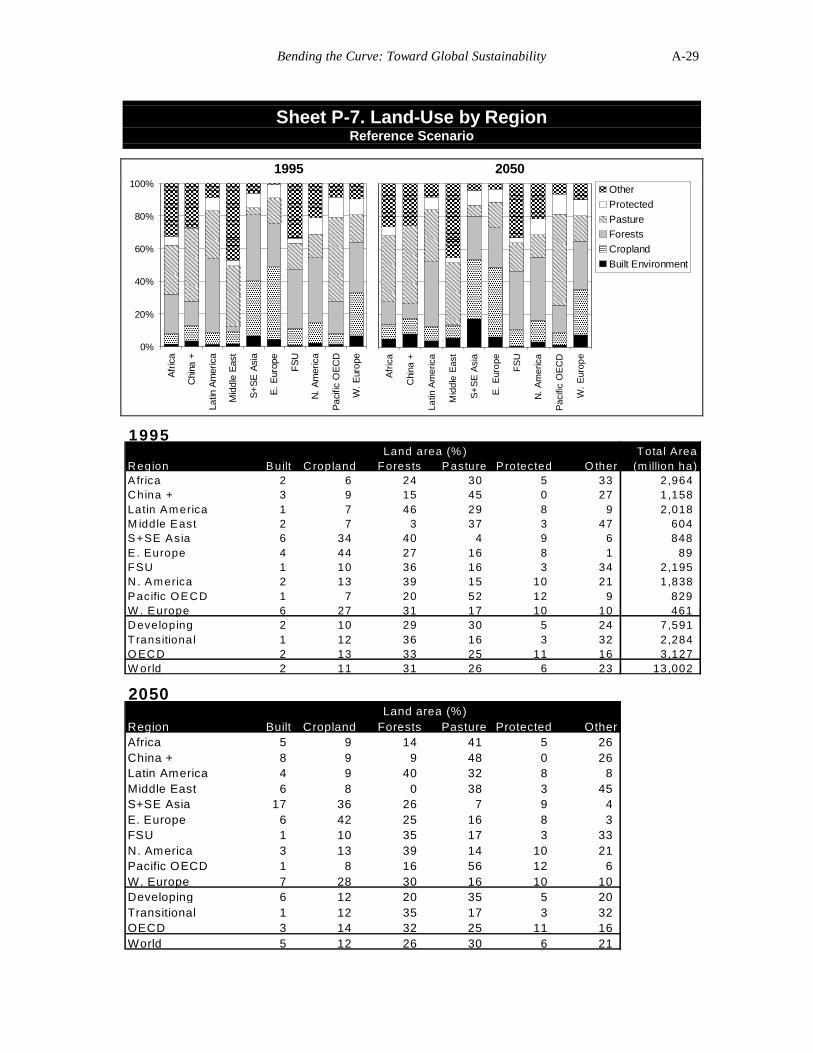
Bending the Curve: Toward Global Sustainability A-29
Sheet P-7. Land-Use by RegionReference Scenario
1995 2050
0%
20%
40%
60%
80%
100%A
fric
a
Chi
na +
Latin
Am
eric
a
Mid
dle
Eas
t
S+
SE
Asi
a
E.
Eur
ope
FS
U
N.
Am
eric
a
Pac
ific
OE
CD
W.
Eur
ope
Afr
ica
Chi
na +
Latin
Am
eric
a
Mid
dle
Eas
t
S+
SE
Asi
a
E.
Eur
ope
FS
U
N.
Am
eric
a
Pac
ific
OE
CD
W.
Eur
ope
Other
Protected
PastureForests
Cropland
Built Environment
1995Land area (% ) Total Area
Region Built C ropland Forests Pasture Protected O ther (m illion ha)A frica 2 6 24 30 5 33 2,964 China + 3 9 15 45 0 27 1,158 Latin Am erica 1 7 46 29 8 9 2,018 M iddle East 2 7 3 37 3 47 604 S+SE Asia 6 34 40 4 9 6 848 E . Europe 4 44 27 16 8 1 89 FSU 1 10 36 16 3 34 2,195 N . America 2 13 39 15 10 21 1,838 Pacific OECD 1 7 20 52 12 9 829 W . Europe 6 27 31 17 10 10 461 Developing 2 10 29 30 5 24 7,591 T ransitional 1 12 36 16 3 32 2,284 O ECD 2 13 33 25 11 16 3,127 W orld 2 11 31 26 6 23 13,002
2050Land area (%)
Region Built Cropland Forests Pasture Protected OtherAfrica 5 9 14 41 5 26 China + 8 9 9 48 0 26 Latin America 4 9 40 32 8 8 Middle East 6 8 0 38 3 45 S+SE Asia 17 36 26 7 9 4 E. Europe 6 42 25 16 8 3 FSU 1 10 35 17 3 33 N. America 3 13 39 14 10 21 Pacific OECD 1 8 16 56 12 6 W. Europe 7 28 30 16 10 10 Developing 6 12 20 35 5 20 Transitional 1 12 35 17 3 32 OECD 3 14 32 25 11 16 World 5 12 26 30 6 21

A-30 Raskin, Gallopin, Gutman, Hammond and Swart
Sheet P-7. Land-Use by Region (continued)Policy Reform Scenario
1995 2050
0%
20%
40%
60%
80%
100%
Afr
ica
Chi
na +
Latin
Am
eric
a
Mid
dle
Eas
t
S+
SE
Asi
a
E.
Eur
ope
FS
U
N.
Am
eric
a
Pac
ific
OE
CD
W.
Eur
ope
Afr
ica
Chi
na +
Latin
Am
eric
a
Mid
dle
Eas
t
S+
SE
Asi
a
E.
Eur
ope
FS
U
N.
Am
eric
a
Pac
ific
OE
CD
W.
Eur
ope
Other
ProtectedPastureForestsCroplandBuilt Environment
1995Land area (% ) T ota l A rea
R eg ion B u ilt C rop land F ores ts P asture P ro tec ted O ther (m illion ha)A frica 2 6 24 30 5 33 2 ,964 C h ina + 3 9 15 45 0 27 1 ,158 La tin A m erica 1 7 46 29 8 9 2 ,018 M idd le E ast 2 7 3 37 3 47 604 S +SE A s ia 6 34 40 4 9 6 848 E . Europe 4 44 27 16 8 1 89 F SU 1 10 36 16 3 34 2 ,195 N . A m erica 2 13 39 15 10 21 1 ,838 P ac ific O E C D 1 7 20 52 12 9 829 W . E urope 6 27 31 17 10 10 461 D eve lop ing 2 10 29 30 5 24 7 ,591 T rans itiona l 1 12 36 16 3 32 2 ,284 O EC D 2 13 33 25 11 16 3 ,127 W orld 2 11 31 26 6 23 13 ,002
2050Land area (% )
R eg ion Bu ilt C rop land Fores ts Pasture Pro tec ted O therA frica 4 10 21 37 5 23 C h ina + 7 9 15 44 0 24 La tin Am erica 2 10 45 29 8 7 M idd le East 5 9 3 35 3 45 S+S E As ia 16 30 37 6 9 2 E . E urope 5 46 26 14 8 0 FS U 1 11 36 16 3 33 N . Am erica 2 18 39 14 10 17 Pac ific O EC D 1 7 19 56 12 5 W . Europe 6 33 30 16 10 5 D eve lop ing 5 12 27 32 5 18 T rans itiona l 1 13 35 16 3 31 O E C D 2 17 32 25 11 12 W orld 4 13 30 28 6 19

Bending the Curve: Toward Global Sustainability A-31
Sheet P-8. Fertilizer Consumption
0
50
100
150
200
250
1995 2025 2050 2025 2050
mill
ion
tonn
esAfricaChina +Latin AmericaMiddle EastS+SE AsiaE. EuropeFSUN. AmericaPacific OECDW. Europe
Reference Policy Reform
ReferenceConsum ption (m il lion tonnes) G rowth Rate (% /year) Index (95=1)
Region 1995 2025 2050 95-25 25-50 95-50 2025 2050Africa 4 13 30 4.4 3.5 4.0 3.7 8.6China + 32 42 43 1.0 0.1 0.6 1.3 1.4Latin Am erica 9 20 30 2.6 1.6 2.1 2.1 3.2M iddle E ast 2 6 6 2.9 0.4 1.8 2.4 2.6S+SE A sia 24 51 64 2.6 0.9 1.8 2.1 2.7E. Europe 3 5 6 2.2 0.7 1.5 1.9 2.3FS U 5 13 17 3.7 0.9 2.4 3.0 3.7N. Am erica 22 26 28 0.7 0.3 0.5 1.2 1.3Pacif ic O ECD 4 4 3 0.3 -1.1 -0.3 1.1 0.8W . Europe 20 24 23 0.7 -0.3 0.3 1.2 1.2Dev elop ing 71 132 174 2.1 1.1 1.6 1.9 2.5Transitional 7 19 23 3.2 0.9 2.1 2.6 3.2O E CD 45 55 55 0.7 0.0 0.3 1.2 1.2W orld 123 205 251 1.7 0.8 1.3 1.7 2.0
Policy ReformConsum ption (m illion tonnes) G rowth Rate (% /year) Index (95=1)
Region 1995 2025 2050 95-25 25-50 95-50 2025 2050Africa 4 11 17 3.8 1.7 2.9 3.1 4.7China + 32 31 21 0.0 -1.5 -0.7 1.0 0.7Latin America 9 15 17 1.6 0.5 1.1 1.6 1.8M iddle East 2 4 3 1.9 -1.2 0.5 1.7 1.3S+SE Asia 24 38 30 1.6 -1.0 0.4 1.6 1.2E. Europe 3 4 3 1.5 -0.9 0.4 1.6 1.3FSU 5 10 10 2.8 -0.3 1.4 2.3 2.1N. Am erica 22 21 19 0.0 -0.6 -0.3 1.0 0.9Pacif ic OECD 4 3 2 -0.6 -2.8 -1.6 0.8 0.4W . Europe 20 19 13 -0.1 -1.5 -0.7 1.0 0.7Dev eloping 71 100 88 1.1 -0.5 0.4 1.4 1.2Transitional 7 15 13 2.4 -0.5 1.1 2.0 1.8O ECD 45 44 34 -0.1 -1.1 -0.5 1.0 0.7W orld 123 158 134 0.8 -0.7 0.2 1.3 1.1

A-32 Raskin, Gallopin, Gutman, Hammond and Swart
Sheet P-9. Fisheries
0
50
100
150
200
1995 2025 2050 2025 2050
mill
ion
tonn
es
Aquaculture
ConventionalFisheries
Reference Policy Reform
Maximum SustainableConventionalFisheries Catch
ReferenceProduction (million tonnes) Growth Rate (%/year) Index (95=1)
Type 1995 2025 2050 95-25 25-50 95-50 2025 2050Conventional Fisheries 88 88 88 0.0 0.0 0.0 1.0 1.0Aquaculture 20 63 82 3.9 1.0 2.6 3.2 4.1Total 108 151 170 1.1 0.5 0.8 1.4 1.6
Policy ReformProduction (million tonnes) Growth Rate (%/year) Index (95=1)
Type 1995 2025 2050 95-25 25-50 95-50 2025 2050Conventional Fisheries 88 93 93 0.2 0.0 0.1 1.1 1.1Aquaculture 20 56 70 3.5 0.9 2.3 2.8 3.5Total 108 149 163 1.1 0.4 0.7 1.4 1.5

Bending the Curve: Toward Global Sustainability A-33
Sheet P-10. Toxic Waste
0
10
20
30
40
50
60
70
1995 2025 2050 2025 2050
mill
ion
tonn
es
AfricaChina +Latin AmericaMiddle EastS+SE AsiaE. EuropeFSUN. AmericaPacific OECDW. Europe
Reference Policy Reform
ReferenceToxic Waste (million tonnes) Growth Rate (%/year) Index (95=1)
Region 1995 2025 2050 95-25 25-50 95-50 2025 2050Africa 0.7 2.3 5.3 4.0 3.3 3.7 3.2 7.3China + 3.8 8.8 13.6 2.9 1.7 2.4 2.3 3.6Latin America 1.9 4.4 7.3 2.7 2.1 2.4 2.3 3.8Middle East 0.8 2.2 3.9 3.5 2.3 2.9 2.8 4.9S+SE Asia 3.0 8.6 17.2 3.6 2.8 3.3 2.9 5.8E. Europe 0.4 0.6 0.8 1.6 0.8 1.2 1.6 2.0FSU 1.2 1.7 2.0 1.1 0.7 0.9 1.4 1.7N. America 3.9 6.4 7.9 1.6 0.9 1.3 1.6 2.0Pacific OECD 2.2 3.0 3.4 1.0 0.6 0.8 1.4 1.6W. Europe 3.8 5.3 6.1 1.1 0.6 0.9 1.4 1.6Developing 10 26 47 3.2 2.4 2.8 2.6 4.6Transitional 2 2 3 1.2 0.8 1.0 1.4 1.7OECD 10 15 17 1.3 0.7 1.0 1.5 1.8World 22 43 68 2.3 1.8 2.1 2.0 3.1
Policy ReformToxic Waste (million tonnes) Growth Rate (%/year) Index (95=1)
Region 1995 2025 2050 95-25 25-50 95-50 2025 2050Africa 0.7 1.4 0.6 2.1 -3.0 -0.2 1.9 0.9China + 3.8 3.6 1.0 -0.2 -4.9 -2.4 0.9 0.3Latin America 1.9 1.8 0.5 -0.4 -4.6 -2.3 0.9 0.3Middle East 0.8 0.9 0.3 0.3 -4.3 -1.8 1.1 0.4S+SE Asia 3.0 3.8 1.4 0.8 -3.9 -1.4 1.3 0.5E. Europe 0.4 0.2 0.1 -1.5 -5.7 -3.4 0.6 0.1FSU 1.2 0.7 0.2 -1.9 -5.7 -3.6 0.6 0.1N. America 3.9 2.0 0.4 -2.3 -6.2 -4.1 0.5 0.1Pacific OECD 2.2 1.1 0.2 -2.3 -6.2 -4.1 0.5 0.1W. Europe 3.8 1.9 0.4 -2.3 -6.2 -4.1 0.5 0.1Developing 10 11 4 0.4 -4.2 -1.7 1.1 0.4Transitional 2 1 0 -1.8 -5.7 -3.6 0.6 0.1OECD 10 5 1 -2.3 -6.2 -4.1 0.5 0.1World 22 17 5 -0.8 -4.8 -2.6 0.8 0.2

A-34 Raskin, Gallopin, Gutman, Hammond and Swart

Bending the Curve: Toward Global Sustainability A-35
Abbreviations
GDP gross domestic productMER market exchange ratePPP purchasing power parityGDPPPP GDP in international dollars adjusted for PPPGDPMER GDP in US dollars at MEROECD Organization for Economic Cooperation and DevelopmentPCL potential cultivable land
o degree centigradecal caloriesg gramha hectarem metermpg miles per gallont tonnetC tonne of carbonJ Joules
E Exa, 1018
P Peta, 1015
T Tera, 1012
G Giga, 109
M Mega, 106
k kilo, 103
Selected Conversion Factors
Energy1 GJ = 0.172 BOE = 0.0239 TOE = 0.0341 TCEVolume1 km3 = 264.2⋅109 US gallons = 810.7⋅103 acre⋅footMass1 tonne = 1000 kg = 1.10 short ton = 2.20⋅103 poundsArea1 ha = 2.47 acre = 0.0100 km2
Fuel Efficiency1 mpg (US) = 0.425 km/liter

A-36 Raskin, Gallopin, Gutman, Hammond and Swart

Bending the Curve: Toward Global Sustainability A-37
Data Notes
All Sheets: Scenario assumptions are summarized in text and described in detail in Heaps, et al. (1998).
Sheet D-1: Base year and Reference population from mid-range UN (1997). For Policy Reformpopulation, see Section 4.2.
Sheet D-2: Values for 1995 and 2025 computed using data from WRI (1994; 1996). Changes from 2025to 2050 assume a slowing urbanization trend relative to 1995-2025.
Sheet E-1: GDPPPP and GDPMER computed using GDPPPP per capita from CIA (1997), GDPMER per capitafrom World Bank (1997) and populations from mid-range UN (1997).
Sheet E-2: Value added by sector from World Bank (1997). Estimates based on market exchange rates,using the most recent available data from 1992-1995. Percentages based on countries where dataavailable.
Sheet E-3: Regional values are population-weighted averages of country GDPPPP per capita from CIA(1997). Scenario growth rates based on GDPMER growth rates (IPCC, 1992a), adapted for the regions inthis study and converted to PPP growth rates (Heaps, et al., 1998).
Sheet S-1: All values weighted by national populations. Based on Gini coefficients from Deininger andSquire (1996), U.S. Census (1997), Tabatabai (1996) and World Bank (1998), with additional estimates(Heaps, et al., 1998). Distributional equity is the ratio of the average income of the lowest earning 20% tothe highest earning 20% of the population, estimated assuming lognormal national income distributions.
Sheet S-2: For most developing countries, data are based on FAO estimates of the incidence of chronicundernutrition (FAO, 1997a); for the US, the incidence of food insecurity was used (Rose et al., 1995); forall other countries estimates are based on income distribution (Heaps, et al., 1998).
Sheets En-1…4: Data from IEA energy statistics (IEA, 1997a,b). In sheets En-3 and En-4, final energydemand is defined as consumption of electricity and fuels by end-users. In sheets En-1 and En-2, primaryenergy in each region is the sum of final energy demand in the region, energy lost through thetransformation of primary to secondary fuel forms, and net energy lost or used during transmission anddistribution. Care should be taken in interpreting primary energy supply figures since different statisticalsources use different conventions for reporting the primary energy content of nuclear and renewablesources of energy. The conventions for efficiency adopted in this study are: uranium at 33%, geothermalat 10%, and hydro, wind, solar and other renewables at 100%. Other sources may express hydro resourcesin terms of an equivalent fossil fuel feedstock requirement.
Sheet En-5: Data from WEC Survey of Energy Resources (WEC, 1995). See definition of proven andundiscovered reserves in Section 3.3.2. Uranium estimates assume conventional fission reactors.Estimates do not include non-conventional oil and natural gas resources.
Sheet F-1: Base year values from FAO (1996b). Daily consumption is the amount available forconsumption.
Sheets F-2…4: Base year values from FAO (1996b). Self-sufficiency ratio calculated asproduction/requirements. Net exports in the base year include net additions to stocks. Meat includeseggs; milk includes all products derived from milk. Fraction from feedlots is the fraction of totalproduction in caloric terms. Fish includes all seafood.
Sheet F-5: Base year values from FAO (1996b). Annual yield defined as total annual production per unitarea of cropland. Harvest yield is production per unit area per harvest. Cropping intensity is a measure ofmultiple cropping, given by:
cropping intensity = annual yield harvest yield .
The index shown is for Annual yield.
Sheets F-6, 7: Base year values from FAO (1996b). Cropland includes land for growing sugarcane forenergy and food.

A-38 Raskin, Gallopin, Gutman, Hammond and Swart
Sheets F-8: Existing cropland from FAO (1996b). Potential cropland for developing regions based ondata from Fischer (1993). For OECD and transitional regions, see Heaps, et al. (1998). Potentialcultivable land includes active farmland and other land-types potentially suitable for farming. It is lostthrough land degradation and conversion to other land uses.
Sheets P-1, 2: Data are for total freshwater withdrawals from Najlis (1996) and Shiklomanov (1997),supplemented by Raskin et al. (1995).
Sheet P-3: Use/Resource ratio is total freshwater requirements divided by renewable freshwater resources,including river flows from adjacent countries. Base year data from Najlis (1996) and Shiklomanov(1997), supplemented by Raskin et al. (1995). Water stress is discussed in Sections 2.2, 3.3 and 4.6.
Sheet P-4: Emissions are estimated from energy consumption data and emissions factors based on IPCC(1995b). 1 GtC = 1 billion tonnes carbon. Emissions are from combustion of fossil fuel only; theyexclude net emissions from land-use changes and from non-energy industrial processes, which contributedan additional 1.5 GtC in 1995 (IPCC, 1996).
Sheet P-5: Data based on Posch et al. (1996) and Kuylenstierna (1998) with additional assumptions.Includes energy sector SOx emissions and industrial process SOx emissions.
Sheets P-6, 7: Areas currently under cropland, forest and pasture from FAO (1996b); areas under builtenvironment for developing regions from Fischer (1993); other regions estimated from various sources(see Heaps, et al., 1998); protected areas Fischer (1993) and WCMC (1998a,b); area of “Other Land”computed as balance using total land area from FAO (1996b).
Sheet P-8: Consumption of manufactured fertilizer (FAO, 1996b).
Sheet P-9: Total production from FAO (1996b); aquaculture production and maximum sustainablefisheries catch from FAO (1997). Maximum sustainable catch is higher in the Policy Reform scenario.Better management of capture fisheries is assumed to extend the current production of around 85 milliontonnes per year to a sustained annual production of 100 million tonnes (FAO, 1997c).
Sheet P-10: Data based on World Bank Industrial Pollution Projection System (Hettige et al., 1994).