benchmarking states, districts, and consortia. the ways in ... · cyprus no czech republic yes...
TRANSCRIPT

chap
te
r
The first part of Chapter 5 presents information about
the curricular goals in the timss 1999 countries and
Benchmarking states, districts, and consortia. The ways
in which the curriculum is supported and monitored
within each entity, and the relationship between the
curriculum and system-wide testing, are examined.
The second part of the chapter contains teachers’
reports about the science topics actually studied in
their classrooms.
5The Science
Curriculum

5

149The Science Curriculum
1 Mayer, D.P., Mullens, J.E., and Moore, M.T. (2000), Monitoring School Quality: An Indicators Report, NCES 2001-030,Washington, DC: National Center for Education Statistics.
In comparing achievement across systems, it is important to considerdifferences in students’ curricular experiences and how they may affectthe science they have studied. At the most fundamental level, students’opportunity to learn the content, skills, and processes tested in thetimss 1999 assessment depends to a great extent on the curriculargoals and intentions inherent in each system’s policies for scienceeducation. Just as important as what students are expected to learn,however, is what their teachers choose to teach them, which ultimatelydetermines the science students are taught.
Teacher’s instructional programs are usually guided by an “officialcurriculum” that describes the science education that should beprovided. The official curriculum can be communicated by documentsor statements of various sorts (often called guides, guidelines, stan-dards, or frameworks) prepared by the education ministry or bynational or regional education departments. These documents,together with supporting material such as instructional guides ormandated textbooks, are referred to as the intended curriculum.
To collect information about the intended science curriculum at theeighth grade, the coordinators in each participating country andBenchmarking jurisdiction responsible for implementing the studycompleted questionnaires and participated in interviews. Informationwas gathered about factors related to supporting and monitoring theimplementation of the official curriculum, including instructionalmaterials, audits, and assessments aligned with the curriculum.
In many cases, teachers need to interpret and modify the intendedcurriculum according to their perceptions of the needs and abilities oftheir classes, and this evolves into the implemented curriculum. Researchhas shown that, even in highly regulated education systems, this is notidentical to the intended curriculum. Furthermore, what is actuallyimplemented is often inconsistent across an education system. Studies,including the Second International Mathematics Study, suggest that theimplemented curriculum in the United States varies considerably fromclassroom to classroom – calling for more research into not only what isintended to be taught but what content is covered.1 To collect dataabout the implemented curriculum, the science teachers of thestudents tested in timss 1999 completed questionnaires about whetherstudents had been taught the various science topics covered in the test.

2 3 4 5 6 7150 Chapter 1

151The Science Curriculum
Science Subjects Offered Up To and Including Eighth Grade
The most striking difference among science curricula of the timss1999 countries in the eighth and earlier grades is that the sciences aretaught as separate subjects in some countries and integrated to form ageneral science course in others. Exhibit 5.1 shows how science instruc-tion is organized in these grades in the timss 1999 countries andBenchmarking jurisdictions. By the eighth grade, Chinese Taipei,Indonesia, and most of the European countries were teaching some orall of earth science, biology, physics and chemistry as separate subjects,not necessarily contemporaneously. Three of the Benchmarking states(Connecticut, Missouri, and Oregon) and four of the districts andconsortia (the Academy School District, the Jersey City Public Schools,the Miami-Dade County Public Schools, and the Rochester City SchoolDistrict) reported teaching science as separate subjects by the eighthgrade, predominantly life science, earth science, and physical science.Among the others, the practice was to integrate the sciences into ageneral science curriculum. Of the countries that taught science asseparate subjects, most taught chemistry and physics as separatesubjects by the eighth grade, while in separate-science Benchmarkingjurisdictions these were taught together as physical science.

Separate ScienceCourses Offered
Science Subjects and Grades Taught
United States No General/integrated science course
Australia 1 No General/integrated science course
Belgium (Flemish) Yes
Bulgaria Yes General/integrated science (3-5); biology (6-8); chemistry (7-8); physics (7-8); earth science (6-8)
Canada 2 No General sciences organized by strands (grades K-8)
Chile No General integrated science (4-8) with some earth science taught in history/geography/social studies
Chinese Taipei Yes
Cyprus No
Czech Republic Yes
England No
Finland Yes
Hong Kong, SAR No General studies (1-6); science (7-8)
Hungary Yes Environment (5); biology, physics, geography (6-8); chemistry (7-8)
Indonesia Yes
Iran, Islamic Rep. No
Israel No General/integrated science course
Italy No General/integrated science course
Japan No General/integrated science course
Jordan No General/integrated science course
Korea, Rep. of No Intelligent life (combined with social studies) (1-2); science (3-8)
Latvia (LSS) Yes Biology (5-8); chemistry (8); physics (8)
Lithuania 3 Yes
Macedonia, Rep. of Yes Nature and some earth science (1-4); biology (5-8); geography (5-8); chemistry (7-8); physics (7-8)
Malaysia No General/integrated science course
Moldova Yes Separate science subjects are taught in grade 8: biology, chemistry, physics, and geography
Morocco Yes Biology and physics (7); physics/chemistry and biology/geology (8)
Netherlands Yes
New Zealand No General/integrated science course
Philippines No General/integrated science course (1-7)
Romania Yes General/integrated science (3-4); biology (5-8); geography (5-8); physics (6-8); chemistry (7-8)
Russian Federation Yes
Singapore No General/integrated science course
Slovak Republic Yes
Slovenia 3 Yes
South Africa No General/integrated science and geography
Thailand No General/integrated science course
Tunisia No General/integrated science course
Turkey No General/integrated science course (grades 4-8)
Science integrated with social studies (2-4); integrated science (5); geography (6-8); physics (7-8); biology (6-8);chemistry (8)
Biology, physics, and earth science taught separately, but one composite grade is given; chemistry is not taught untilhigh school
World orientation (3-6); biology and earth science (7-8); scientific work (7-8); technological education (7-8);physics (8); applied science (8); natural science (8)
General/integrated science course taught at grade 8. This course may be taught by separate subject area teachers insome schools. General science includes a combination of physics, chemistry and biology topics
Integrated course of biology, geography and environmental studies (1-6); physics (7-8); chemistry (7-8); biology (7-8);natural geography (7-8); physics, chemistry, biology and natural geography are also taught at grade 9
Natural science (1-6); biology (7); integrated physics/chemistry (8); integrated physics/chemistry continues to betaught at grade 9 in addition to earth science
General/integrated science course, though some schools (especially independent ones) may offer physics, chemistry,and biology, separately
Integrated science course ‘cognition of the world’ (1-4); integrated science course ‘man and nature’ (5); integratedscience course ‘man and nature’/geography (6); biology/geography (7); biology, physics, chemistry and geography (8);subjects taught at grade 8 continue through grade 10
Elementary science (1-3), General/integrated science (4-5); physics (6-8); chemistry (8); life science/biology (6-8); earthscience (6-8)
Knowledge about nature and society (1-3); knowledge about nature (4-5); geography (6-8); biology (6-8); chemistry(7-8); physics (7-8)
General/integrated science (primary school up to grade 6); physics/chemistry, biology, geography which includesearth science (7-8)
General/integrated science (1-4); physics, chemistry, geography/geology, and biology taught as separate subjects(5-8)
General/integrated science course (includes life sciences, physical sciences, earth sciences, and environmental andresource issues)
SOU
RCE:
IEA
Thi
rd In
tern
atio
nal M
athe
mat
ics
and
Scie
nce
Stud
y (T
IMSS
), 19
98-1
999.
2 3 4 5 6 7152 Chapter 1
T IMSS 1999Benchmarking
Boston CollegeExhibit 5.1
8th Grade Science
Science Subjects Offered Up to and Including Eighth Grade
Background data provided by National Research Coordinators.
1 Australia: Yes in 4 of 8 states/territories.
2 Canada: Results shown are for the majority of provinces.
3 Lithuania and Slovenia: Geography is considered to be an integrated social studies and natural science course at grade 8; geography teachers were not sampled in the TIMSS studies.

Background data provided by coordinators from participating jurisdictions. A dash (–) indicates data are not available.
Separate ScienceCourses Offered Science Subjects and Grades Taught
StatesConnecticut Varies throughout the state
Idaho General/integrated science course
Illinois General/integrated science course
Indiana General/integrated science course
Maryland General/integrated science course
Massachusetts General/integrated science course
Michigan –
Missouri Different schools teach earth science, life science, and physical science in middle school
North Carolina There are not separate courses but each grade level has specific science areas that are emphasized
Oregon Many districts offer science as separate subjects (e.g. life science, physical science, and earth science)
Pennsylvania
South Carolina
Texas General/integrated science course (K-8)
Districts and ConsortiaAcademy School Dist. #20, CO General/integrated science course (K-5), earth science or integrated science (6), life science (7), physical science (8)
Chicago Public Schools, IL
Delaware Science Coalition, DE
First in the World Consort., IL General/integrated science course (K-8)
Fremont/Lincoln/WestSide PS, NE General/integrated science course (K-8)
Guilford County, NC There are not separate courses but each grade level has specific science areas that are emphasized
Jersey City Public Schools, NJ Different science courses are offered in middle school: earth science (6); physical science (7); life science (8)
Miami-Dade County PS, FL
Michigan Invitational Group, MI General/integrated science course (K-8)
Montgomery County, MD General/integrated science course (K-8)
Naperville Sch. Dist. #203, IL General science course (K-8) with emphasis on earth science, life science, and physical science
Project SMART Consortium, OH General/integrated science course (K-8)
Rochester City Sch. Dist., NY Integrated physical science, life science, and earth science (K-6), life science (7), physical science (8)
SW Math/Sci. Collaborative, PA Districts have the ability to decide the structure of their science instruction
Districts have the ability to decide the structure of their science instruction
Integrated science course (K-8); science content in life science, earth science, and physical science will be integratedin grades 6-8 beginning 2000
Currently in grades K-5, curriculum units are available to cover required topics in physical science, earth science, lifescience, and ecology each year; at grades 6-8, a similar set of units is being piloted for eventual adoption
Comprehensive science, regular and advanced (6-8); earth/space science and biology honors courses (acceleratorcourses for 7-8)
Schools have the ability to decide the structure of their science instruction as long as it meets the achievementstandards set by the school district
Yes
No
No
No
No
No
–
Yes
No
Yes
Varies
No
No
Yes
Varies
Varies
No
No
No
Yes
Yes
No
No
No
No
Yes
Varies
153The Science Curriculum
SOU
RCE:
IEA
Thi
rd In
tern
atio
nal M
athe
mat
ics
and
Scie
nce
Stud
y (T
IMSS
), 19
98-1
999.
T IMSS 1999Benchmarking
Boston College
Exhibit 5.1(Continued)
8th Grade Science
Science Subjects Offered Up to and Including Eighth Grade

2 3 4 5 6 7154 Chapter 1
Does Decision Making About the Intended Curriculum Take Placeat the National, Regional, or Local Level?
Depending on the education system, students’ learning goals are set atdifferent levels of authority. Some systems are highly centralized, with theministry of education (or highest authority in the system) being exclu-sively responsible for the major decisions governing the direction ofeducation. In others, such decisions are made regionally or locally. Eachapproach has its strengths and weaknesses. Centralized decision makingcan add coherence and uniformity in curriculum coverage, but mayconstrain a school or teacher’s flexibility in tailoring instruction to theneeds of students.
Exhibit 5.2 presents information for each timss 1999 country about thehighest level of authority responsible for making curricular decisions andgives the curriculum’s current status. The data reveal that 35 of the 38countries reported that the specifications for students’ curricular goalswere developed as national curricula. Australia determined curricula atthe state level, with local input; the United States did so at both the stateand local (district and school) levels, with variability across states; andCanada did so at the provincial level.
In recent decades, it has become common for intended curricula to beupdated regularly. At the time of the timss 1999 testing, the officialscience curricula in 31 countries had been in place for less than a decade,and more than three-quarters of them were in revision. Of the sevencountries with a science curriculum of more than 10 years’ standing, fourwere being revised. In Australia, Canada, and the United States,curriculum change is made at the state, provincial, or local level, andsome science curricula were in revision at the time of testing. Thecurricula in these three countries were relatively recent, having beendeveloped within the 10 years preceding the study.
The development and implementation of academic content standardsand subject-specific curriculum frameworks has been a central focus ofeducational change in the United States at both the state and local level.In science, most states are in the process of implementing new contentor curriculum standards or revising existing ones.2 Much of this efforthas been based on work done at the national level over the past decadeto develop standards aimed at increasing the science literacy of allstudents. The two most prominent documents are the AmericanAssociation for the Advancement of Science (aaas) Benchmarks for ScienceLiteracy and the National Research Council’s National Science Education
2 Glidden, H. (1999), Making Standards Matter 1999, Washington, DC: American Federation of Teachers.

155The Science Curriculum
Standards (nses), both of which define standards for the teaching andlearning of science that many state and local educational systems haveused to fashion their own curricula.3 All but four states now have stan-dards in science.4
In all 13 states that participated in timss 1999 Benchmarking,curriculum frameworks or content standards in science were publishedbetween 1996 and 2000 (see Exhibit 5.3). Four states detailed the stan-dards for every grade including the eighth grade, seven states detailedthem by a cluster or pair of grades that included the eighth grade, andtwo states reported the eighth grade as a benchmark grade at whichcertain standards should be met. Most states provided standards docu-ments to guide districts and schools in developing their owncurriculum, while some states, such as North Carolina, developed astatewide curriculum for all schools to use.
Exhibit 5.4 presents information about the curriculum of participatingdistricts and consortia. Of the eight districts that participated, onereported that it used the statewide curriculum in all schools (GuilfordCounty); five had a district-wide curriculum that supported the state-developed frameworks or standards (the Jersey City Public Schools, theMiami-Dade County Public Schools, Montgomery County, theNaperville School District, and the Rochester City School District); andtwo had a curriculum developed at the school level (the AcademySchool District and the Chicago Public Schools), with Chicago alsooffering an optional structured curriculum district-wide. Each partici-pating consortium indicated that all or most of its districts developedtheir own curriculum at the district level.
3 Smith, T.A., Martin, M.O., Mullis, I.V.S., and Kelly, D.L. (2000), Profiles of Student Achievement in Science at the TIMSSInternational Benchmarks: U.S. Performance and Standards in an International Context, Chestnut Hill, MA: Boston College.
4 Key State Education Policies on K-12 Education: 2000 (2000), Washington, DC: Council of Chief State School Officers.

National orRegional Curriculum Year Curriculum Introduced Status of Curriculum
United States Regional & Local 1990-1999 As of 1999, 47 out of 50 states havecompleted content standards
Australia Regional & Local 1984-1999 In revision (in 4 states/territories);As introduced (in 4 states/territories)
Belgium (Flemish) 1 National 1989-1999 As introduced
Bulgaria National 1989 (biology and chemistry);1996 (physics); 1995 (earth science)
In revision
Canada Regional 1987-1998 In revision (5 provinces);As introduced (5 provinces)
Chile National 1980 In revision
Chinese Taipei National 1997 In revision
Cyprus National 1978 As introduced
Czech Republic National 1996 In revision
England National 1995 In revision, same structure with minorrevisions (to be implemented 2000/01)
Finland National 1994 As introduced
Hong Kong, SAR National 1986 In revision
Hungary National 1995 As introduced
Indonesia National 1994 In revision
Iran, Islamic Rep. National 1996 In revision
Israel National 1997-1998 In revision
Italy National 1979 As introduced
Japan National 1993 As introduced
Jordan National 1993 Slight revisions annually
Korea, Rep. of National 1995 As introduced
Latvia (LSS) National 1992-1994 In revision
Lithuania National 1997 In revision
Macedonia, Rep. of National 1979 (adaptations in 1995) As introduced
Malaysia National 1990 In revision
Moldova National 1991 In revision
Morocco National 1991 In revision
Netherlands National 1993 (slight adaptations in 1998) As introduced
New Zealand National 1995 As introduced
Philippines National 1998 In revision
Romania National 1993 In revision
Russian Federation National 1998 In revision
Singapore National 1993 In revision
Slovak Republic National – –
Slovenia National 1983 In revision
South Africa National 1984 In revision
Thailand National 1990 In revision
Tunisia National 1997 In revision
Turkey National 1992 In revision
SOU
RCE:
IEA
Thi
rd In
tern
atio
nal M
athe
mat
ics
and
Scie
nce
Stud
y (T
IMSS
), 19
98-1
999.
2 3 4 5 6 7156 Chapter 1
T IMSS 1999Benchmarking
Boston CollegeExhibit 5.2
8th Grade Science
Countries’ Science Curriculum
Background data provided by National Research Coordinators.
1 Belgium (Flemish): Curricula were introduced as follows: 1997-98 (biology); 1997 (technologicaleducation), early 1990 (physics); 1997 (earth science); 1997-99 (applied sciences); 1989 (scientificwork); 1989-97 (natural science).
A dash (–) indicates data are not available.

Background data provided by coordinators from participating jurisdictions. 1 Indicates year(s) in which curriculum frameworks/content standards were instituted.
Connecticut Connecticut’s K-12 Science Curriculum Framework (1998) Grade clusters: K-4, 5-8, 9-12
Idaho Skills-Based Scope and Sequence Guides K-6 (1996);Achievement Standards K-8 (In draft);Achievement Standards 9-12 (1999)
Every grade: K-6 Grade clusters: 7-8, 9-12
Illinois Illinois Learning Standards for Science (1997) Grade clusters: Early Elementary School, Late ElementarySchool, Middle/Junior High School, Early High School,Late High School
Indiana Indiana Science Proficiency Guide (1997); revisedIndiana’s Academic Standards for Science (2000)
Grade clusters: K-2, 3-5, 6-8, 9-12 (1997 version);Every grade: K-8, individual courses in high school(2000 version)
Maryland Learning Outcomes (1990); Content Standards forScience (2000)
Grade clusters: K-3, 4-5, 6-8, 9-12
Massachusetts Massachusetts Science & Technology CurriculumFrameworks (1996; under revision)
Grade clusters: pK-4, 5-8, 9-10, 11-12
Michigan Michigan Essential Goals and Objectives for ScienceEducation (1991); Michigan Curriculum Frameworks:Content Standards and Benchmarks (1996)
Grade clusters: Elementary School, Middle School,High School
Missouri Frameworks for Curriculum Development in Science(1996)
Grade clusters: K-2, 3-4, 5-8, 9-12
North Carolina North Carolina Standard Course of Study (1994; revised2000-01)
Every grade: K-8, individual courses in high school
Oregon Oregon Science Content Standards (1996, 1998) Benchmark grades: 3, 5, 8, 10, 12
Pennsylvania Academic Standards for Science and Technology (2000) Benchmark grades: 4, 7, 10, 12
South Carolina South Carolina Science Curriculum Standards (2000) Every grade: K-8; Grade clusters: 9-12
Texas Texas Essential Knowledge and Skills (1998) Every grade: K-8, individual courses in high school
Curriculum Framework/ContentStandards and Year1
Grades Detailed inFramework/Standards
157The Science Curriculum
SOU
RCE:
IEA
Thi
rd In
tern
atio
nal M
athe
mat
ics
and
Scie
nce
Stud
y (T
IMSS
), 19
98-1
999.
T IMSS 1999Benchmarking
Boston CollegeExhibit 5.3
8th Grade Science
States’ Curriculum Frameworks/Content Standards

Level of Curriculum Development
Academy SchoolDist. #20, CO
Curriculum is developed at the school level. Curriculum is currently in revision to reflect statestandards.
Chicago PublicSchools, IL
Curriculum is developed at the school level. The district writes standards statements which are alignedwith state standards; schools translate these into a curriculum. The district also offers an optionalstructured curriculum.
Delaware ScienceCoalition, DE
Districts share a common curriculum in grades K-5 based on NSF-funded modules. In middle school,schools use NSF-funded units (FOSS, BCSC, STC, etc.) or units developed through the local systemicchange program. The high school curriculum is mainly textbook driven with some NSF-funded modulesand units developed by teachers with university faculty.
First in the WorldConsort., IL
Most districts within the Consortium have district-wide objectives and/or a curriculum based onstate standards.
Fremont/Lincoln/WestSide PS, NE
Each district has locally-developed standards and a curriculum based on state standards.
Guilford County, NC The district uses the state-developed curriculum, the North Carolina Standard Course of Study.
Jersey City PublicSchools, NJ
The science curriculum (pK-12) is developed by the district and is aligned with the New Jersey CoreCurriculum Content Standards.
Miami-DadeCounty PS, FL
The district has developed a science curriculum, Competency-Based Curriculum (CBC), which is correlatedto the Florida Sunshine State Standards for Science and the National Science Education Standards. Mostrecently, the state has developed Grade Level Expectations (GLEs) that further define what a studentshould know and be able to do at specific grade levels. The district is currently making revisions to theCBC to reflect the GLEs.
Michigan InvitationalGroup, MI
Most districts have district-wide curriculum guides aligned to the state standards.
MontgomeryCounty, MD
The district develops curriculum based on state standards.
Naperville Sch.Dist. #203, IL
The district develops curriculum based on state standards.
Project SMARTConsortium, OH
Each district in the consortium has a separate curriculum.
Rochester City Sch.Dist., NY
The district develops curriculum based on state standards.
SW Math/Sci.Collaborative, PA
Each district in the collaborative has a separate curriculum. District-level curriculum is not necessarilybased on the state standards.
SOU
RCE:
IEA
Thi
rd In
tern
atio
nal M
athe
mat
ics
and
Scie
nce
Stud
y (T
IMSS
), 19
98-1
999.
2 3 4 5 6 7158 Chapter 1
T IMSS 1999Benchmarking
Boston CollegeExhibit 5.4
8th Grade Science
Districts’ and Consortia’s Curriculum
Background data provided by coordinators from participating jurisdictions.
159The Science Curriculum
How Do Education Systems Support and Monitor CurriculumImplementation?
During the past decade, content-driven systemic school reform hasemerged as a promising model for school improvement.5 That is,curriculum frameworks establishing what students should know and beable to do provide a coherent direction for improving the quality ofinstruction. Teacher preparation, instructional materials, and otheraspects of the system are then aligned to reflect the content of theframeworks in an integrated way to reinforce and sustain high-qualityteaching and learning in schools and classrooms.
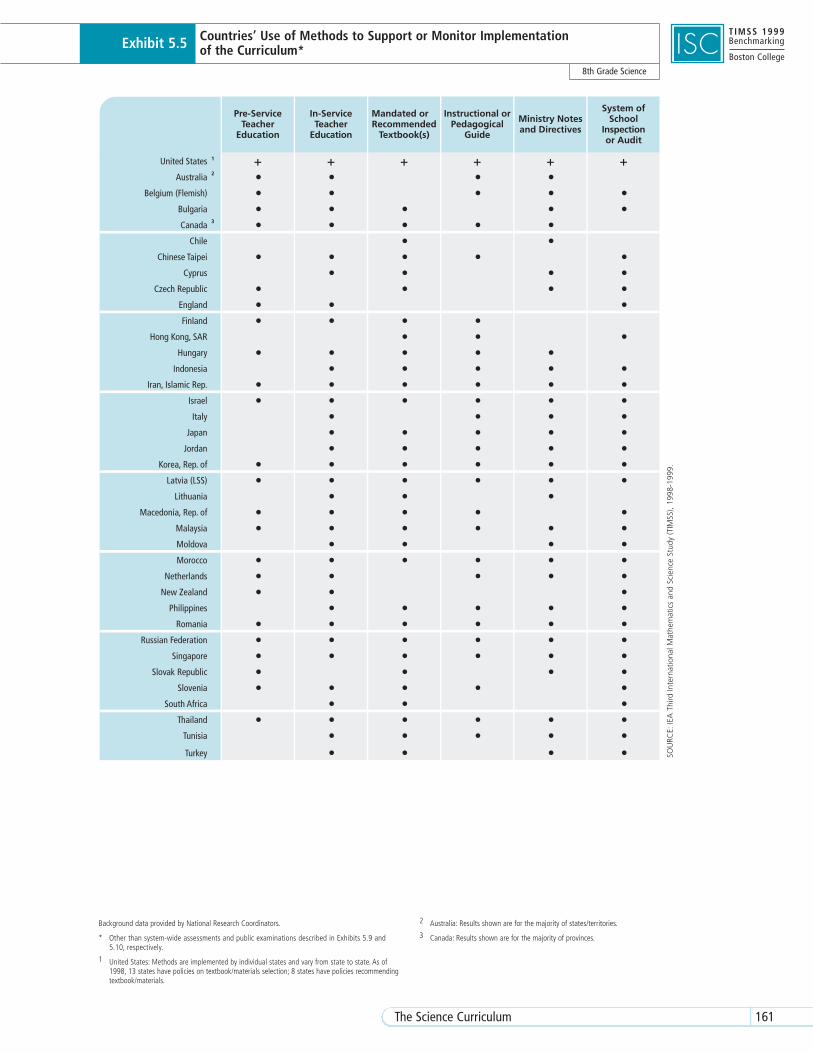
Education systems use different ways to achieve this desired connectionbetween the intended and the implemented curriculum. The methodsused by the timss 1999 countries to monitor curriculum implementa-tion are shown in Exhibit 5.5, and by states, districts, and consortia inExhibits 5.6 through 5.8. For example, teachers can be trained in thecontent and pedagogical approaches specified in the curriculumguides. Another way to help ensure alignment is to develop instruc-tional materials, including textbooks, instructional guides, and ministrynotes, that are tailored to the curriculum. Systems can also monitorimplementation of the intended curriculum by means of school inspec-tion or audit.
Of the methods for supporting and monitoring curriculum implemen-tation shown in Exhibit 5.5, 10 countries reported using all six, and afurther 13 countries used five. Support for the national/regionalscience curriculum as part of pre-service education was reported by 24of the 38 countries. Nearly all countries (33) used in-service teachereducation, and most countries (31) used mandated or recommendedtextbooks. Ministry notes and directives were used in 29 countries, anda system of school inspection or audit was used in 31 countries.
States, districts, and consortia provided data on policies related to text-book selection, pedagogical guides, and accreditation. As shown inExhibit 5.6, seven of the Benchmarking states reported that they do notselect textbooks for use at the local level. The other six states issue a listof books from which districts can choose. Almost all districts andconsortia reported that their state does not select textbooks, whilethree reported state involvement in textbook selection. Ten jurisdic-tions indicated that textbooks were chosen or recommended at thedistrict level, and four that selection occurs at the school level or, in theconsortia, at the school and district level depending on the district.
5 O’Day, J.A. and Smith, M.S. (1993), “Systemic Reform and Educational Opportunity” in S.H. Fuhrman (ed.), Designing CoherentEducation Policy: Improving the System, San Francisco, CA: Jossey-Bass, Inc.

2 3 4 5 6 7160 Chapter 1
As shown in Exhibit 5.7, eight of the 13 Benchmarking states developedmaterials that included pedagogical guidance for instruction and imple-mentation of the curriculum frameworks and standards. Ten districtsand consortia had at least state- or district-level guides to supportcurriculum implementation. Two states and one consortium reportedhaving documents in draft. These materials, developed to supportteachers in implementing the curriculum, span a variety of typesincluding ideas for classroom activities, tool kits for planning instruc-tional units, and sample lessons.
As shown in Exhibit 5.8, six of the participating states had accreditationsystems, four of which included student performance on the state assess-ment in their accreditation review (Indiana, Michigan, Missouri, andOregon). Two states without accreditation systems, Illinois and Texas,made periodic site visits to evaluate schools. Only one consortium, theMichigan Invitational Group, reported having an accreditation system atthe state level. The Academy School District in Colorado reported thatthe state was in the process of implementing a system for 2001.
Background data provided by National Research Coordinators.
* Other than system-wide assessments and public examinations described in Exhibits 5.9 and5.10, respectively.
1 United States: Methods are implemented by individual states and vary from state to state. As of1998, 13 states have policies on textbook/materials selection; 8 states have policies recommendingtextbook/materials.
2 Australia: Results shown are for the majority of states/territories.
3 Canada: Results shown are for the majority of provinces.
Pre-ServiceTeacher
Education
In-ServiceTeacher
Education
Mandated orRecommended
Textbook(s)
Instructional orPedagogical
Guide
Ministry Notesand Directives
System ofSchool
Inspectionor Audit
United States 1 + + + + + +Australia 2 • • • •
Belgium (Flemish) • • • • •Bulgaria • • • • •Canada 3 • • • • •
Chile • •Chinese Taipei • • • • •
Cyprus • • • •Czech Republic • • • •
England • • •Finland • • • •
Hong Kong, SAR • • •Hungary • • • • •
Indonesia • • • • •Iran, Islamic Rep. • • • • • •
Israel • • • • • •Italy • • • •
Japan • • • • •Jordan • • • • •
Korea, Rep. of • • • • • •Latvia (LSS) • • • • • •
Lithuania • • •Macedonia, Rep. of • • • • •
Malaysia • • • • • •Moldova • • • •Morocco • • • • • •
Netherlands • • • • •New Zealand • • •
Philippines • • • • •Romania • • • • • •
Russian Federation • • • • • •Singapore • • • • • •
Slovak Republic • • • •Slovenia • • • • •
South Africa • • •Thailand • • • • • •
Tunisia • • • • •Turkey • • • •
161The Science Curriculum
SOU
RCE:
IEA
Thi
rd In
tern
atio
nal M
athe
mat
ics
and
Scie
nce
Stud
y (T
IMSS
), 19
98-1
999.
T IMSS 1999Benchmarking
Boston CollegeExhibit 5.5
8th Grade Science
Countries’ Use of Methods to Support or Monitor Implementation of the Curriculum*

StatesConnecticut
Idaho
Illinois
Indiana
Maryland
Massachusetts
Michigan
Missouri
North Carolina
Oregon
Pennsylvania
South Carolina
Texas
Policy on Textbooks and Instructional Materials
The state does not select textbooks.
The state does not select textbooks.
The state selects a list of textbooks and materials from which districts can choose. Districts may submit a waiver for an independent adoption toselect textbooks and instructional materials of their own choice. These district-level adoptions must meet the state selection criteria.
The state does not select textbooks.
The state selects a list of textbooks and materials from which districts can choose. The state funds the instructional materials that are selectedfrom the state approved list.
State Textbook Review Committee selects textbooks and instructional materials according to the state curriculum framework. Districts choosetextbooks and/or instructional materials using local criteria. The state funds the purchase of textbooks and/or instructional materials that are onthe selected list. Districts may waiver, at own expense, from selected textbooks or instructional materials.
The state approves a list of textbooks and materials from which districts/schools must choose. The textbooks selection criteria include alignmentwith Idaho Skills-Based Scope and Sequence Guide and Achievement Standards, which specify skills that all students should know at differentlevels. Schools are required to select all their basic instructional materials from the Idaho Adoption Guide produced by the adoption committee.Schools not choosing from the adoption list can lose accreditation points.
The state does not select textbooks.
The state recommends a list of textbooks from which districts/schools must choose; however, waivers are granted. The state texts are notnecessarily based on the state standards. The state intends to align textbook selections with Indiana’s new Academic Standards (2000).
The state does not select textbooks.
The state does not select textbooks.
The state does not select textbooks.
The state recommends textbooks and instructional materials; there is a fee arrangement between the state and the vendor that the districtsare able to use.
SOU
RCE:
IEA
Thi
rd In
tern
atio
nal M
athe
mat
ics
and
Scie
nce
Stud
y (T
IMSS
), 19
98-1
999.
2 3 4 5 6 7162 Chapter 1
T IMSS 1999Benchmarking
Boston CollegeExhibit 5.6
8th Grade Science
States’, Districts’ and Consortia’s Use of Textbooks and Instructional Materials toSupport Implementation of the Curriculum
Background data provided by coordinators from participating jurisdictions.

Districts and ConsortiaAcademy School
Dist. #20, CO
Chicago PublicSchools, IL
Delaware ScienceCoalition, DE
First in the WorldConsort., IL
Fremont/Lincoln/WestSide PS, NE
Guilford County, NC
Jersey City PublicSchools, NJ
Miami-DadeCounty PS, FL
Michigan InvitationalGroup, MI
MontgomeryCounty, MD
Naperville Sch.Dist. #203, IL
Project SMARTConsortium, OH
Rochester City Sch.Dist., NY
SW Math/Sci.Collaborative, PA
STATE: The state does not select textbooks.LOCAL: Each district selects instructional materials. Over forty districts are part of a local initiative which supports use of exemplary modules atthe elementary level. At the middle school level, the Collaborative has engaged over 14 districts in selecting materials through a showcase-pilotadoption process.
Policy on Textbooks and Instructional Materials
STATE: The state does not select textbooks.LOCAL: Schools can select materials based on guidelines with acceptance by the Board of Education.
STATE: The state does not select textbooks.LOCAL: Schools in districts choose instructional materials.
STATE: The state does not select textbooks.LOCAL: Textbook selection is usually made at the school level.
STATE: The state does not select textbooks.LOCAL: Textbooks and materials are selected and recommended at the district level. Consortium is reviewing materials to recommend as well.As of 1999/2000, the Consortium is looking to Project 2061/AAAS and NSF for guidance in textbook selection. Selection includes a committeereviewing materials against AAAS benchmarks, choosing materials, and submitting their recommendation for approval by the school board.
STATE: The state does not select textbooks.LOCAL: Districts select textbooks/textbook series and schools select supplemental materials.
STATE: The state selects a list of textbooks and materials based on the state content standards from which districts can choose.LOCAL: One textbook used throughout county. A system-wide committee reviews the state selected list and one textbook per grade level is selectedto be used system-wide.
STATE: The state does not select textbooks.LOCAL: A committee is formed at the district level to facilitate the selection of science textbooks and materials. There is a “standard operatingprocedure” for the formulation of the committee so as to include all constituent groups. All selected textbooks and materials are aligned withthe district’s science curriculum and the NJ Core Curriculum Content Standards in Science.
STATE: The state does not select textbooks, but approves a liberal textbook list from which districts can choose.LOCAL: A teacher review committee selects several texts and the teacher community involved usually votes or is given an opportunity to expresstheir choice.
STATE: The state does not select textbooks.LOCAL: A committee conformed by parents, teachers, building administrators and staff from central office selects textbooks.
STATE: The state recommends the texts and instructional materials.LOCAL: The district selection committee narrows the selection to two or three texts. The schools pick one of the selected textbooks. The newlegislation makes waivers for using non-adopted texts more difficult, but schools are allotted some money to spend on non-state adopted materialswith review at the district level.
STATE: The state does not select textbooks.LOCAL: Textbook selection is made at the school level. Selection of textbooks is based on curriculum.
STATE: The state does not select textbooks.LOCAL: The district recommends a few textbooks. Evaluation and approval of texts to support specific courses is done by a committee headedby the science supervisor.
STATE: The state does not select textbooks.LOCAL: District uses criteria based on the learning outcomes to select instructional materials. No one textbook selected.
163The Science Curriculum
SOU
RCE:
IEA
Thi
rd In
tern
atio
nal M
athe
mat
ics
and
Scie
nce
Stud
y (T
IMSS
), 19
98-1
999.
T IMSS 1999Benchmarking
Boston College
Exhibit 5.6(Continued)
8th Grade Science
States’, Districts’ and Consortia’s Use of Textbooks and Instructional Materials to SupportImplementation of the Curriculum

StatesConnecticut
Idaho
Illinois
Indiana
Maryland
Massachusetts
Michigan
Missouri
North Carolina
Oregon
Pennsylvania
South Carolina
Texas
An implementation guide (2000) contains sample lesson plans, sample assessments, resources for teachers, and information for administratorson what to look for in exemplary science instruction. Content briefs are being developed to help teachers with implementation of the standards.
Under the direction of the Texas Education Agency, the Texas Science Center for Educator Development has produced different pedagogical guides:“TEXTEAMS” (modules for curriculum and instructional reform), “TEKSplorations Guides” for each grade and high school courses, “TEKS forLeaders” (materials and training for science reform), “Safety Handbook” (supports implementation of TEKS hands-on science in laboratory andfield curriculum), “Curriculum Charts: K-12”; as well as a website and CD ROM: the “Science Teacher Toolkit” that includes support on manyaspects of science teaching.
Pedagogical guides are not available at the state level.
Performance descriptors have been completed (in draft form) to guide educators in implementing the standards. Classroom assessment tasks andstudent work exemplars will be available Summer 2001.
The “Indiana Science Proficiency Guide” (1997) contains grade cluster ideas for activities. New Curriculum Frameworks are being written to supportIndiana's new grade-specific Academic Standards (2000).
Pedagogical guidance is not available at the state level.
The curriculum frameworks provide appropriate teaching activities for each learning standard.
Toolkits are designed to support the implementation of the curriculum frameworks including kits on planning subject area instructional units,curriculum integration, designing classroom assessments, and connecting with the learner. “The Science Education Guidebook” was developedspecifically to assist in teaching the science frameworks.
The Curriculum Frameworks provide appropriate teaching activities by discipline providing examples of how “Show-Me Standards” may be taughtand assessed.
The development of a curriculum enhancement guide is in process.
Pedagogical Guides
Some pedagogical information is included with the state science framework.
Pedagogical guides are not available at the state level.
“Teaching and Learning to Standards” supports the Oregon content standards and provides best practices, example lessons, vignettes, scoredstudent work, teaching resources, and common curriculum goals. A curriculum framework will be complete in January 2001.
SOU
RCE:
IEA
Thi
rd In
tern
atio
nal M
athe
mat
ics
and
Scie
nce
Stud
y (T
IMSS
), 19
98-1
999.
2 3 4 5 6 7164 Chapter 1
T IMSS 1999Benchmarking
Boston CollegeExhibit 5.7
8th Grade Science
States’, Districts’ and Consortia’s Use of Pedagogical Guides to SupportImplementation of the Curriculum
Background data provided by coordinators from participating jurisdictions.

Districts and ConsortiaAcademy School
Dist. #20, CO
Chicago PublicSchools, IL
Delaware ScienceCoalition, DE
First in the WorldConsort., IL
Fremont/Lincoln/WestSide PS, NE
Guilford County, NC
Jersey City PublicSchools, NJ
Miami-DadeCounty PS, FL
Michigan InvitationalGroup, MI
MontgomeryCounty, MD
Naperville Sch.Dist. #203, IL
Project SMARTConsortium, OH
Rochester City Sch.Dist., NY
SW Math/Sci.Collaborative, PA
There are not pedagogical guides at the state level. As soon as the state “Draft Content Science Standards” are approved by the Ohio State Boardof Education (early 2001) plans are underway to provide pedagogical guides to locals. Ohio is a local-control state and thus many locals havedeveloped various types of science guides.
New York State provides core curriculum guides based on the standards at all grade levels. Locally, the district develops K-12 curriculum guidesbased on standards.
The Florida Curriculum Frameworks include the content knowledge and process skills for science that students should acquire, strategies to addressvarious learning needs and styles, guidelines for effective assessment, professional development information, and sample evaluation criteria forschool and district programs. The state recently has developed a CD-ROM entitled “Science Best Practices”. The district produced a “Middle SchoolScience Guide for Teachers” and “Elementary Science Guide for Teachers” that give specific information about the content and effective strategiesthat should be implemented. Most recently, the “Science Department Chairperson Handbook” was distributed that includes important informationabout curriculum, science inquiry, and technology use in the classroom.Toolkits are designed by the state to support the implementation of the curriculum frameworks including kits on planning subject area instructionalunits, curriculum integration, designing classroom assessments, and connecting with the learner. The “Science Education Guidebook” was developedspecifically to assist in teaching the science frameworks.
“Better Science” (1991), produced at the state level, provides pedagogical information and the “Outcomes Clarification Document” (1996) providesconcept and process information. A website has been developed to provide the latest in best practices and exemplars. Local-level guides are adoptedfrom commercial vendors. In addition, high school guides are developed locally.
The state provides goals, standards, and sample test items. Locally, the district develops K-5 detailed lessons and outcomes; grades 6-8 outcomesare connected to resources.
Informal support is available connecting districts to exemplary materials, research findings, and best practices.
Pedagogical Guides
No specific “how-to” instructional manuals are provided. The state has provided grade-appropriate sample assessments as well as released itemsand samples of scored student work which the district has expanded upon.
The optional structured curriculum provides daily lesson plans at all grade levels. For high schools, test blueprints of the “Chicago Academic StandardsExam” (CASE) are provided to teachers for instructional purposes.
The “Delaware Performance Indicators for Curriculum Planning and Development” is a pedagogical guide for teachers. It defines expectedperformance in science but does not specify performance levels. All Performance Indicators are specifically limited to content standards and areincluded in the guide. Some districts have developed their own Performance Indicators, but most have adopted state Performance Indicators.
There is no specific guide developed by the consortium. AAAS/Project 2061 provides professional development on content and instruction andevaluating materials for alignment to the Project 2061 benchmarks of science literacy.
Districts have curriculum-based instructional activities and commercially-developed materials.
There is a locally-written book, Strategies for Instruction, detailing best practices, lessons, assessments, and teaching methods based on the NorthCarolina Course of Study.
The “New Jersey Framework for Teaching in Science” published in May 1996, discusses essential components of a quality K-12 science program.The framework is not a curriculum, but a comprehensive digest of activities, curriculum connections, and instructional strategies related to the NJCore Curriculum Content Standards in Science. In addition to the state standards and the state frameworks, the district's curriculum guides providecontent guidelines based on grade-level competencies. In the district curriculum materials, hands-on learning kits, resources, and learning activitiesare provided at each grade level.
165The Science Curriculum
SOU
RCE:
IEA
Thi
rd In
tern
atio
nal M
athe
mat
ics
and
Scie
nce
Stud
y (T
IMSS
), 19
98-1
999.
T IMSS 1999Benchmarking
Boston College
Exhibit 5.7(Continued)
8th Grade Science
States’, Districts’ and Consortia’s Use of Pedagogical Guides to Support Implementation of the Curriculum

StatesConnecticut
Idaho
Illinois
Indiana
Maryland
Massachusetts
Michigan
Missouri
North Carolina
Oregon
Pennsylvania
South Carolina
Texas
The accreditation system is in revision. Schools must meet a battery of standards in the current accreditation system, but student academicperformance is not included. The new accreditation system will include student academic performance and will go into effect in 2001.
Although not considered an accreditation system, there is an accountability system in place. The state’s accountability system includes a varietyof on-site evaluations designed to provide feedback for improvement.
Accreditation requires that curriculum developed at the local level be aligned with state standards. Schools must establish educational standardsfor all grade levels and develop high school exiting standards for graduation; these standards must be aligned with exiting standards establishedby the State Board of Education. It also requires that schools participate in state testing and adhere to text adoption policies.
Quality Review Teams of the State Board of Education conduct periodic quality-assurance site visits to schools.
The accreditation system requires K-8 schools to self-report alignment of curriculum with state standards (proficiencies); grade 9-12 schools submita master schedule and course descriptions to verify compliance with state standards. Performance on the ISTEP+ is also considered in accreditation.Technical assistance is available to schools that do not meet the accreditation standards.
No accreditation system.
No accreditation system.
Accreditation is based in part on student performance on state assessments. The system is being revised to include successful achievement aswell as continuous improvement.
The Missouri School Improvement Program, designed to accredit districts, assesses districts progress on the Show-Me Standards as measured bythe Missouri Assessment Program. There are “success teams” that help districts improve student achievement in all subject areas.
No accreditation system.
Use of Accreditation
No accreditation system.
No accreditation system.
All schools are state accredited through a system of “standard” assurances, Consolidated District and School Improvement Plans, Annual PerformanceReports and Schools Reviews. State accreditation is based on the Oregon Performance Accountability System (OPAS), that assesses school scienceperformance. Any school falling in the low or unacceptable category receives targeted assistance including alignment with standards, instructionalimprovement and professional development.
SOU
RCE:
IEA
Thi
rd In
tern
atio
nal M
athe
mat
ics
and
Scie
nce
Stud
y (T
IMSS
), 19
98-1
999.
2 3 4 5 6 7166 Chapter 1
T IMSS 1999Benchmarking
Boston CollegeExhibit 5.8
8th Grade Science
States’, Districts’ and Consortia’s Use of Accreditation to Support Implementationof the Curriculum
Background data provided by coordinators from participating jurisdictions.

Districts and ConsortiaAcademy School
Dist. #20, CO
Chicago PublicSchools, IL
Delaware ScienceCoalition, DE
First in the WorldConsort., IL
Fremont/Lincoln/WestSide PS, NE
Guilford County, NC
Jersey City PublicSchools, NJ
Miami-DadeCounty PS, FL
Michigan InvitationalGroup, MI
MontgomeryCounty, MD
Naperville Sch.Dist. #203, IL
Project SMARTConsortium, OH
Rochester City Sch.Dist., NY
SW Math/Sci.Collaborative, PA
No accreditation system.
No accreditation system.
No accreditation system.
State-level accreditation is based in part on student performance on state assessments. The system is being revised to include successful achievementas well as continuous improvement.
No accreditation system.
No accreditation system.
No accreditation system.
Use of Accreditation
The state will be implementing an accreditation system beginning in Fall 2001 based primarily on the success and/or progress on the standards-referenced state assessment (CSAP).
No accreditation system.
No accreditation system.
No accreditation system.
No accreditation system.
No accreditation system.
No accreditation system.
167The Science Curriculum
SOU
RCE:
IEA
Thi
rd In
tern
atio
nal M
athe
mat
ics
and
Scie
nce
Stud
y (T
IMSS
), 19
98-1
999.
T IMSS 1999Benchmarking
Boston College
Exhibit 5.8(Continued)
8th Grade Science
States’, Districts’ and Consortia’s Use of Accreditation to Support Implementation of the Curriculum
2 3 4 5 6 7168 Chapter 1
What TIMSS 1999 Countries Have Assessments And Exams in Science?
Assessments and exams that are aligned with the intended curriculumprovide a means for evaluating system- and student-level achievement.System-wide assessments are designed primarily to inform policy makersabout matters such as national standards of achievement of the intendedcurriculum objectives, strengths and weaknesses in the curriculum or howit is being implemented, and whether educational achievement isimproving or deteriorating. The primary purpose of national publicexaminations, while providing information of interest to national andregional policy makers, is to provide information for making decisionsabout individual students.
Exhibit 5.9 shows that almost two-thirds of the participating countries hadnational assessments in science, with almost half of those assessing allstudents and just over half sampling students. The number of gradestested ranged from two in England and the Philippines to six in Korea.Generally, the purpose of system-wide assessments was to provide feedbackto government policy makers and the public, although some countriesprovided feedback to individual schools. For example, in England andHungary information about individual students was used for course place-ment or guidance.
Using public examinations as a way to select students for university oracademic tracks in secondary school can be an important motivatingfactor for student achievement (see Exhibit 5.10). Thirty-six countriesreported having public examinations or awards, at one or more grades,that included testing achievement in science. Most countries held theirexaminations in the final year of schooling for certification and selectionto higher education (often, university education). In about one-third ofthe countries, public examinations were also used for selection or courseassignment (tracking) within secondary schools.

Background data provided by National Research Coordinators.
1 Public examinations are also used for system-wide assessment purposes in these countries:Malaysia, Morocco, Netherlands, Philippines, Singapore, Tunisia, and Turkey.
2 Australia: System-wide assessments are administered in 3 of 8 states/territories.
3 Canada: System-wide assessments are administered in 5 of 10 provinces.
Entire GradeLevel
Sample fromGrade Level
System-WideAssessments1 Purpose/Consequences
Grades
2
Yes
Yes
Yes
Yes
Yes
Yes
Yes
Yes
Yes
Yes
Yes
Yes
Yes
Yes
Yes
Yes
Yes
Yes
Yes
Yes
3
United States
Australia
Belgium (Flemish)
Bulgaria
Canada
Chile
Chinese Taipei
Cyprus
Czech Republic
England
Finland
Hong Kong, SAR
Hungary
Israel
Italy
Japan
Korea, Rep. of
Latvia (LSS)
Lithuania
Macedonia, Rep. of
Malaysia
Moldova
Morocco
Netherlands
New Zealand
Philippines
Romania
Russian Federation
Singapore
Slovak Republic
Slovenia
South Africa
Thailand
Tunisia
Turkey
Jordan
Indonesia
Iran, Islamic Rep.
4, 8, 12 National and state-level feedback
4, 8, 9
4, 6, 8, 10, 12
6
6, 8, 10, 13
5, 6, 7, 8, 9
5, 6, 7, 8
6
3, 7
various grades
5, 8, 11
ages 13 and 16nationally
(most provinces)
4, 5, 8, 10
3, 7, 10 (1 state)10 (1 state)
various grades
4, 8, 10
5, 8
4, 5, 6, 7, 8, 10
6, 9, 11, 13
6, 9, 10, 11, 12
10, 11, 12
6, 10
6, 10, 12
4, 6, 9, 13
10 (1 state)
4, 7, 10(1 province)
No
No
No
No
No
No
No
No
No
No
No
No
No
No
No
System- and school-level feedback, usually one grade level assessed each year
System-, school- and student-level feedback
System-level feedback
System-level, school-level, and individual-level feedback
System-level feedback
System-level feedback
System-level feedback
System-level feedback and research purposes (projects and curriculum development)
System- and school-level feedback; “good schools” publicized
System- and school-level feedback
System-level feedback
System-level feedback
System- and school-level feedback (the assessment was sample-based up until 1999)
Irregularly for research purposes
System- and school- level feedback
System- and school-level feedback
System-level feedback; monitoring reform impact; curricular revisions
System-level feedback, assessments given irregularly at different primary grades
System-level feedback
System-level feedback; first administered in 1999 with a grade 4 assessment institutedin 2000.
System- and school-level feedback; may lead to redistribution of teachers in the regions;assessments at grades 4 and 6 developed regionally
System- and school-level feedback; selection into courses, certification and entryto university
Yes
Yes
Yes
169The Science Curriculum
SOU
RCE:
IEA
Thi
rd In
tern
atio
nal M
athe
mat
ics
and
Scie
nce
Stud
y (T
IMSS
), 19
98-1
999.
T IMSS 1999Benchmarking
Boston CollegeExhibit 5.9
8th Grade Science
Countries’ System-Wide Assessments in Science

2 3 4 5 6 7170 Chapter 1

Background data provided by National Research Coordinators.
1 United States: As of 1997-1998, public examinations are administered in 36 of 50 states at grades7-8 or 9-12.
2 Canada: Public examinations are administered in 3 of 10 provinces.
Public Exams/Awards Grade(s) Purpose/Consequences
United States 1
Australia Yes 12 Certification and selection for tertiary education
Belgium (Flemish)
Yes
2 Yes
Chile Yes 12 Entry to university
Chinese Taipei
Cyprus Yes 9, 12 Certification (grade 9); certification and entry to university (grade 12)
Czech Republic Yes 13 Certification (science can be chosen as one of four subjects for leaving examination)
England Yes 10, 12
Finland Yes 12
Certification (grade 10); certification and entry to university (grade 12); feedback to systemand schools
Bulgaria 7/8, 12
Canada Certification (grade 12); feedback to system and schools
Certification and selection for tertiary education; in the matriculation exam, the General StudiesTest section includes questions related to physics, chemistry, and biology in addition to seven othertopic areas. Students can choose to take either the General Studies Test or the Mathematics Test
Primarily feedback to system and schools; in 8 states grade promotion is dependent on results;in 18 states graduation is dependent on results of grade 12 exams
varies
Candidates for profile schools (grade 7 or 8); certification and entrance to university–not taken by all students (grade 12)
12 (2 provinces);6, 9, 12 (1 province)
Yes
No
No
Yes
Hungary Yes 12 Certification and entry to university (science is not a compulsory subject)
Indonesia Yes
Yes
Israel Yes 11 or 12 Matriculation certification for those choosing entry to specific areas in the university
Italy Yes 13 Certification and entry to university
Japan Yes 9, 12
Jordan Yes 12 Certification and entry to tertiary education
Korea, Rep. of Yes 12 College entrance exam for selection of students
Latvia (LSS) Yes 12 Certification
Lithuania Yes 12 Leaving examination
Macedonia, Rep. of Yes
Yes
Yes
Morocco Yes 6, 9, 10, 11, 12
Netherlands Yes 10, 11, 12 End-of-track examinations; exams recommended at grades 6 and 8
Yes
Philippines Yes 6, 10 Feedback to system and schools; entry to university set by each institution
Romania Yes 12 Certification (science can be chosen as one of 7 subjects)
Russian Federation Yes 9, 11 Certification (not state compulsory, may be administered at the regional or school level)
Singapore Yes 6, 10, 12 Feedback to system and schools; selection into courses; certification and entry to university
Slovak Republic Yes 12 Certification (science can be chosen as one of four subjects for leaving exam)
Slovenia Yes 12 Certification and entry to tertiary education
South Africa Yes 12 Certification and selection for tertiary education
Thailand Yes 12 Entry to university
Tunisia Yes 6, 9, 13
Turkey Yes 8, 11 Placement in specialized schools for some students (grade 8); entry to university (grade 11)
10, 12
12
6, 9, 11, 13
Moldova
New Zealand
Certification, selection for high school (grade 9); graduation (grade 11 or 12 dependingon school)
Feedback to system and schools, achievement test (grade 6); entry to course tracks (grade 9);certification and end of secondary (grade 11); certification and entry to university (grade 13)
Malaysia
Certification, course selection (grade 10); entry to tertiary education (grade 12); feedback tosystem and schools; informal between-school comparisons
6, 9, 12 Leaving exam, selection for junior secondary school (grade 6); selection for senior secondaryschool (grade 9); leaving exam (grade 12); system-level feedback, in some cases school- andclassroom-level feedback
Iran, Islamic Rep.
Hong Kong, SAR
Certification (grade 11); entry to tertiary education (grade 12); in addition, provincial examsare administered at grade 8
11, 12
Feedback to system and schools; regional exam for promotion (grade 6); selection forschools/courses; promotion (grade 9)
Certification and entry to university; the exam constitutes 40% of the required points for entryto university with the remaining points based on university entry exams
Entry to prefectural and municipal upper secondary schools (grade 9); entry to national,prefectural and municipal universities (grade 12)
9, 11/12
Remedial test for retention purposes (grade 6); certification, selection to secondary, and selectionto courses (grade 9); certification and entry to tertiary (grade 12); feedback to systemand schools
6, 11, 13 School placement (grade 6); certification and placement for 12th grade (grade 11); placementin tertiary institutions (grade 13)
171The Science Curriculum
SOU
RCE:
IEA
Thi
rd In
tern
atio
nal M
athe
mat
ics
and
Scie
nce
Stud
y (T
IMSS
), 19
98-1
999.
T IMSS 1999Benchmarking
Boston CollegeExhibit 5.10
8th Grade Science
Countries’ Public Examinations in Science

2 3 4 5 6 7172 Chapter 1
6 Orlofsky, G.F. and Olson, L. (2001), “The State of the States” in Quality Counts 2001, A Better Balance: Standards, Tests, and the Toolsto Succeed, Education Week, 20(17).
7 Mullis, I.V.S., Martin, M.O., Gonzalez, E.J., O’Connor, K.M., Chrostowski, S.J., Gregory, K.D., Garden, R.A., and Smith, T.A. (2001),Mathematics Benchmarking Report, TIMSS 1999 – Eighth Grade: Achievement for U.S. States and Districts in an International Context,Chestnut Hill, MA: Boston College.
What Benchmarking Jurisdictions Have Assessments in Science?
Across the United States, many states are conducting assessments basedon their own content standards and are assessing whether students intheir schools are meeting these standards for academic achievement.Twenty-nine states have some type of criterion-referenced science assess-ment aligned to state standards.6
While all Benchmarking states had developed or are developing state-levelassessments aligned with their state curriculum in mathematics,7 only 7 ofthe 13 states – Illinois, Maryland, Massachusetts, Michigan, Missouri,Oregon, and Texas – had such statewide assessments in science at themiddle school grades (see Exhibits 5.11 and 5.12). Assessments of statescience standards were reported to be in development in Indiana,Pennsylvania, and South Carolina, each of which developed science stan-dards in 2000. Science assessments in Idaho were under discussion.Connecticut and North Carolina had no statewide science assessments atthe middle school grades.
All the Benchmarking states except Pennsylvania have participated inrecent state science assessments as part of the National Assessment ofEducational Progress (naep). Eleven of the 13 states participated in both1996 and 2000, and Idaho in 2000.
Although none of the Benchmarking states reported using studentperformance on a science assessment as a requirement for high-schoolgraduation, Maryland and South Carolina reported developing assess-ments including science that students must pass in order to graduatefrom high school (see Exhibit 5.13). Benchmarking states reported arange of other consequences of their science assessments for students,apart from their use as a graduation requirement. For example,Connecticut, Illinois, and Oregon reported that they affix a certificate orseal to students’ diplomas to show that they have met the performancegoal on the state high school science assessment; Illinois and Oregonreported a policy of using assessment results to assist in making promo-tion decisions; and South Carolina planned to institute a promotionpolicy in 2002. As an incentive, students meeting the standards inMichigan and Missouri could receive state funds to support theiracademic careers through scholarship money and funds for advancedcourse work, respectively.

173The Science Curriculum
Benchmarking states also reported a range of consequences at thedistrict or school level. For example, Massachusetts reported that addi-tional funding was made available to low-performing schools anddistricts to support remediation. In Oregon and South Carolina,districts were required to provide remediation to students with lowscores on the state assessments. States had the right to take over schoolsor districts in Maryland and Massachusetts. While consequences ofassessments for schools or districts usually involved remediation activi-ties or sanctions, Maryland also provided monetary rewards to schoolsthat showed improvement. In Massachusetts, schools receiving recogni-tion were eligible for an Exemplary Schools Program.
As shown in Exhibit 5.14, 10 of the 14 Benchmarking districts andconsortia participated in the science assessments administered by theirstate. Of these, the Michigan Invitational Group and MontgomeryCounty were in states that were revising their science assessments toalign more closely with their current standards. Ohio’s Project smartConsortium was in a state administering proficiency tests that were notstandards-based assessments. Miami-Dade, Rochester, and theSouthwest Pennsylvania Math and Science Collaborative were devel-oping science assessments for 2003, 2001, and 2001, respectively. TheFremont/Lincoln/Westside Public Schools and Guilford Countyreported having no statewide science assessments at the eighth grade.

2 3 4 5 6 7174 Chapter 1
T IMSS 1999Benchmarking
Boston College
8th Grade Science
1996 2000
Connecticut Connecticut Academic Performance Test (CAPT):In revision - Grade 10
None Yes Yes
Idaho In discussion ITBS: Grades 3-8TAP: Grades 9-11
No Yes
Illinois Illinois Goal Assessment Program (IGAP):Grades 4, 7, 11 (1988-99)Illinois Standard Achievement Test (ISAT):Grades 4, 7 (2000)Prairie State Achievement Examination (PSAE):Grade 11 (2001)
None Yes2 Yes
Indiana In development for 2002 None Yes Yes
Maryland Maryland School Performance AssessmentProgram (MSPAP): Designed to assess the1990 Learning Outcomes - Grades 3, 5, 8
None Yes Yes
Massachusetts Massachusetts Comprehensive AssessmentSystem (MCAS): Grades 4, 8, 10
None Yes Yes
Michigan Michigan Educational Assessment Program (MEAP):Grades 5, 8, 11
None Yes Yes
Missouri Missouri Assessment Program (MAP):In revision - Grades 3, 7, 10
MAP includes the Terra Nova Yes Yes
North Carolina No state assessment for grades K-8;End-of-course tests: physical science, biology,chemistry, physics - Grades 9-12
None Yes Yes
Oregon Oregon Statewide Assessment System:Grades 5, 8, 10; Grade 6 (Fall 2001).
None Yes Yes
Pennsylvania In development - Grades 4, 7, 10 None No No
South Carolina Palmetto Achievement Challenge Test (PACT):In development Grades 3-8 (2002) and 10 (2004)
None Yes Yes
Texas Texas Assessment of Academic Skills (TAAS):Grade 8
None Yes Yes
Participated inNAEPOther Science
Assessments
State-DevelopedCriterion-ReferencedScience Assessment1
SOU
RCE:
IEA
Thi
rd In
tern
atio
nal M
athe
mat
ics
and
Scie
nce
Stud
y (T
IMSS
), 19
98-1
999.
Exhibit 5.11 States’ Science Assessments
Background data provided by coordinators from participating jurisdictions.
1 Specifically developed to be aligned with the curriculum framework/content standards indicated inExhibit 5.3.
2 Illinois participated in NAEP in 1996 but results were not reported due to low participation rates.

175The Science Curriculum
T IMSS 1999Benchmarking
Boston College
8th Grade Science
Background data provided by coordinators from participating jurisdictions.
Connecticut
Idaho
Illinois
Indiana
Maryland
Massachusetts
Michigan
Missouri
North Carolina
Oregon
Pennsylvania
South Carolina
Texas The Texas Assessment of Academic Skills (TAAS) was recently revised to more specifically assess the current standards for the 2000 administration.TAAS is administered in science at grade 8 and the TAAS end-of-course biology exam is administered in high school. As a prerequisite to receivinga high school diploma, students must demonstrate satisfactory performance on either the biology or the U.S. History end-of-course examination.Beginning in 2003, science will be tested at grades 5, 10, and 11. Students will be required to pass the grade 11 examination for graduation.
The Connecticut Academic Performance Test (CAPT), first administered in 1995, was developed to be aligned with the 1987 Common Coreof Learning. It is now being revised for 2000-01 based on Connecticut's 1998 K-12 Science Curriculum Framework.
The development of state-wide science assessments is in discussion.
The Michigan Educational Assessment Program (MEAP) will introduce revised science tests at grades 5, 8, and 11 in 2002. Each of these testsare based on the Michigan Curriculum Frameworks science standards.
The Missouri Assessment Program (MAP) has been developed for science in grades 3, 7, and 10. This assessment is currently in revision.Each test includes multiple-choice, short constructed-response, and performance-event items. The test consist of three sessions. The first twosessions include items designed to assess the Show-Me Standards (1996) which are directly related to the curriculum frameworks. Items thatmatch the Show-Me Standards from the norm-referenced Terra Nova are administered in the third session.
There are no state-level science assessments in grades K-8. The four end-of-course science assessments (physical science, biology, chemistryand physics) are being revised in accordance with the new curriculum for the 2001-2002 administration.
The Oregon Statewide Assessment System includes a multiple-choice state test in science at grades 5, 8, and 10. Classroom work samples arerequired as local assessment in science for grades 3-12. All assessments are based on the content standards and are revised annually.
Starting in 2000, the Illinois Standard Achievement Test (ISAT), administered at grades 4 and 7, replaced the Illinois Goal AssessmentProgram (IGAP) which was administered from 1988-1999 at grades 4, 7, and 11. Beginning in 2001, the state will give new high schooltests, the Prairie State Achievement Examination (PSAE), based on the 1997 Illinois Learning Standards.
A state science assessment is in development for implementation in 2002. Currently, there is no mandatory state science assessment. Voluntarystate science assessments of high schools courses (Core 40 assessments) are available.
The Maryland School Performance Assessment Program (MSPAP) assesses students at grades 3, 5, and 8. Currently, the MSPAP is based onthe 1990 Learning Outcomes. By 2003, the MSPAP will be revised to assess the 2000 standards. The High School Assessment, in development,is proposed as an end-of-course test which will be part of the graduation requirement. Unlike the Maryland Functional Assessment that iscurrently required for high school graduation, the new High School Assessment will have a science component.
Status of State-Developed Science Assessment
Science assessments are in development with field testing scheduled for Spring 2001.
The Palmetto Achievement Challenge Test (PACT) is being developed to be aligned with the 2000 science standards. The grades 3-8 assessmentswill be implemented in 2002 and the grade 10 exit-level assessment will be implemented in 2004. The PACT will replace the Basic Skills AssessmentProgram (BSAP) given at grades 3, 6, and 8. Additionally, a biology end-of-course assessment will be implemented in 2004.
Massachusetts Comprehensive Assessment System (MCAS) was first administered in 1998 to grades 4, 8, and 10. Integrated science assessmentsfor grades 5 and 8 and discipline-specific assessments for secondary grades are in development and will be included from 2002. The Science& Technology MCAS was developed to assess the 1996 Curriculum Frameworks which are currently in revision.
SOU
RCE:
IEA
Thi
rd In
tern
atio
nal M
athe
mat
ics
and
Scie
nce
Stud
y (T
IMSS
), 19
98-1
999.
Exhibit 5.12 Status of State-Developed Science Assessments

2 3 4 5 6 7176 Chapter 1
T IMSS 1999Benchmarking
Boston College
8th Grade Science
Assessment GraduationRequirement Other Consequences
Connecticut Connecticut AcademicPerformance Test(CAPT)
No STUDENT: Students meeting the state performance goal on the 10th grade CAPT assessment receive acertificate of mastery. This certificate is affixed to students’ official transcripts. Students who do not meetthe state goal may retake the test in grades 11 and 12. Results are reported publicly (e.g., newspapers)but there are no direct consequences.
Idaho In discussion – –
Illinois Illinois StandardsAchievement Tests(ISAT)Prairie StateAchievementExamination (PSAE)
No STUDENT: Test results may be used, in conjunction with other data, to make decisions about students’promotion/retention, summer school requirements, and remediation. Students receiving high scores on thePSAE will receive honors designations.
DISTRICT/SCHOOL: Test results are considered at both the district and school levels as part of the stateaccountability system.
Indiana In development No –
Maryland Maryland SchoolPerformanceAssessment Program(MSPAP); High SchoolAssessment (HSA)
The HSA is beingdeveloped as agraduation requirement.
STUDENT: There are no student-level consequences based on the MSPAP since each student is given onlya portion of the assessment.
DISTRICT/SCHOOL: The MSPAP is a school accountability assessment. Part of schools’ performance ratingis based on MSPAP assessment scores. Schools that improve significantly over a two-year period receivemonetary rewards. Schools are required to develop school improvement plans for areas in which standardswere not met. The State Board of Education has the right to reconstitute schools based on low MSPAP testscores and lack of improvement. Thus far, three schools in Maryland have been reconstituted.
Massachusetts MassachusettsComprehensiveAssessment System(MCAS)
No STUDENT: There are no student-level consequences.
DISTRICT/SCHOOL: Results are being used as a high-stakes accountability measure to evaluate performanceand improvement for schools and districts. Schools will be rated based on performance and progress.Recognized schools may be eligible for an Exemplary Schools Program. Low performance and inadequateprogress may result in the removal of principals and/or state-takeover of districts. Targeted resources andfunding will be provided to low-performing schools and districts.
Michigan Michigan EducationalAssessment Program(MEAP)
No STUDENT: Students who meet the standards on the MEAP High School Tests are eligible for graduationcertificate endorsement and scholarship awards.
Missouri Missouri AssessmentProgram (MAP)
No STUDENT: Students scoring at the lowest performance level must retake a shortened version of the examthe following year. Students performing at proficient or above on the 10th grade test receive state fundsfor college-level courses or Advanced Placement exams.
DISTRICT/SCHOOL: Test results will be a part of district-level accreditation.
SOU
RCE:
IEA
Thi
rd In
tern
atio
nal M
athe
mat
ics
and
Scie
nce
Stud
y (T
IMSS
), 19
98-1
999.
Exhibit 5.13 States’ Use of Science Assessments with Consequences
Background data provided by coordinators from participating jurisdictions. A dash (–) indicates data are not available.

177The Science Curriculum
T IMSS 1999Benchmarking
Boston College
8th Grade Science
Assessment GraduationRequirement Other Consequences
North Carolina NC Testing Program STUDENT: For biology, the student’s score on the biology test must be included as 25% of student’sfinal grade for the course.
Oregon Oregon State-wideAssessment System
STUDENT: Students who meet the performance standard on the state-level and local standards-based assessments receive Certificates of Initial Mastery in each area in which the standard is met.Students who do not meet the 10th grade science performance standard have an opportunity to takethe test again. Low-performing students receive additional support and individual instruction to helpthem meet the standards. These students can change schools if instruction at one school is not meetingtheir needs. Districts may use the results of the tests to determine student promotion.
DISTRICT/SCHOOL: Test results are part of the accountability system. Districts must meet set goals forthe assessments to avoid possible sanctions.
Pennsylvania In development –
South Carolina Palmetto AchievementChallenge Tests (PACT)
STUDENT: Promotion policy considers students’ performances on the state assessments as of 2002.
DISTRICT/SCHOOL: Schools will be rated based on student performance and improvement. Accreditationof schools will take into account student performance. Districts are required to provide remediation tolow-performing students.
Texas Texas Assessment ofAcademic Skills(TAAS)
STUDENT: No consequences.
DISTRICT/SCHOOL: No consequences.
No
No
–
Beginning in 2004,students will have to passa standards-based examto graduate.
No
SOU
RCE:
IEA
Thi
rd In
tern
atio
nal M
athe
mat
ics
and
Scie
nce
Stud
y (T
IMSS
), 19
98-1
999.
Exhibit 5.13(Continued) States’ Use of Science Assessments with Consequences

2 3 4 5 6 7178 Chapter 1
T IMSS 1999Benchmarking
Boston College
8th Grade Science
Local
Academy SchoolDist. #20, CO
Colorado State Assessment Program (CSAP) administered in science atgrade 8.
In addition to the CSAP, students take ITBS (grade 7), and ITED(grade 10). District-developed performance assessment unitsare optional.
Chicago PublicSchools, IL
Starting in 2000, the Illinois Standard Achievement Test (ISAT), administeredat grades 4 and 7, replaced the Illinois Goal Assessment Program (IGAP)which was administered from 1988-1999 at grades 4, 7, and 11. Beginningin 2001, the state will give new high school tests, the Prairie StateAchievement Examination (PSAE), based on the Illinois Learning Standards.
Chicago Academic Standards Exam was developed to assess thedistrict framework and is being piloted 1999-2000. Students areassessed in science in grades 9 and 10 with end-of-course exams(Biology, Physics, Chemistry, Earth and Space Science, EnvironmentalScience). Chicago uses the norm-referenced TAP (9-11). Also, ACT’sPLAN nationally-normed tests are administered at grade 11.
Delaware ScienceCoalition, DE
The Delaware Student Testing Program (DSTP) first administered inscience at grades 8 and 11 (Spring 2000) and at grades 4 and 6(Fall 2000).
There are no district-wide assessments based on the standards.Some districts administer the SAT-9 or the Terra Nova. The DelawareScience Coalition has developed some curriculum-based summativeperformance-based assessments complete with rubrics, anchorpapers and instructions for administering in Grades 1-5. MiddleSchool Assessments are planned. There are also plans to developannual assessments and formative assessments based onthe curriculum.
First in the WorldConsort., IL
Starting in 2000, the Illinois Standard Achievement Test (ISAT),administered at grades 4 and 7, replaced the Illinois Goal AssessmentProgram (IGAP) which was administered from 1988-1999 at grades 4, 7,and 11. Beginning in 2001, the state will give new high school tests,the Prairie State Achievement Examination (PSAE), based on the IllinoisLearning Standards. Consortium schools receive a measure ofimprovement based on the percentage of students in eachperformance level.
The consortium administered TIMSS in 1996 and is developingassessments for districts’ use. There are no assessments at thistime but will begin review of the curriculum against Project2061 Benchmarks (2000-2001). Consortium districts administerthe Terra Nova CTBS Battery which includes science. School-improvement goals/plans include professional development andinstructional initiatives based on students’ performance on theCTBS Battery.
Fremont/Lincoln/WestSide PS, NE
There are no assessments at the state level. Assessing students islocal responsibility.
Districts administer the ITBS.
Guilford County, NC There are no state-level science assessments in grades K-8. The NorthCarolina Testing Program includes high school end-of-course exams inbiology, physical science, chemistry, and physics. These end-of-courseexams are used to rate individual schools. State assistance teams maybe sent to low-performing schools.
Assessments were created by the state and given as a local optionin grades 3, 5, 6, 7, and 8 through 1998-99. They were continuedin grades 5 and 7 in 1999-2000. There are no plans for K-8 scienceassessments after 1999-2000.
Jersey City PublicSchools, NJ
Starting in May 1999, the New Jersey Elementary School ProficiencyAssessment (ESPA) was administered at grade 4. The ESPA containsa science component. Similarly, beginning in March 1999, the NJ GradeEight Proficiency Assessment (GEPA) was administered at grade 8. Thistest replaced the Early Warning Test which had been previouslyadministered to eighth graders. The science component of the GEPAwas administered for the first time in March 2000. Both the ESPA andthe GEPA are tests of excellence and measure student performance inrelation to the NJ Core Content Curriculum Standards in Science. TheHigh School Proficiency Assessment (HSPA) is presently in developmentat the state level and will be used beginning in the spring 2001 forfirst time juniors (Class of 2002) as the mandated test for graduation.Presently, the High School Proficiency Test (HSPT) has been administeredstatewide since the early 1990s as the mandated test for high schoolgraduation. The HSPT does not contain a science component.
In addition to the state assessments, at the elementary level,the district has developed district-wide midterms in science ingrades 3-8.
Science Assessments
State
SOU
RCE:
IEA
Thi
rd In
tern
atio
nal M
athe
mat
ics
and
Scie
nce
Stud
y (T
IMSS
), 19
98-1
999.
Exhibit 5.14 Districts’ and Consortia’s State and Local Science Assessments
Background data provided by coordinators from participating jurisdictions.

179The Science Curriculum
T IMSS 1999Benchmarking
Boston College
8th Grade Science
Local
Miami-Dade County PS, FL The state criterion-referenced science assessment is in development(2003 administration).
The SAT-9 Science test is administered to students in grades 5, 7,and 9. The EXPLORE, which has mathematics and scienceassessments, is administered to all grade 8 students. District-levelcurriculum-based science assessments will be developed andimplemented by 2001-02.
Michigan InvitationalGroup, MI
The Michigan Educational Assessment Program (MEAP) will introducerevised science tests at grades 5, 8, and 11 in 2002. Each of these testsare based on the Michigan Curriculum Frameworks science standards.
A variety of tests are used by local districts.
MontgomeryCounty, MD
The Maryland School Performance Assessment Program (MSPAP) assessesstudents at grades 3, 5, and 8. Currently, the MSPAP is based on the 1990Learning Outcomes. By 2003, the MSPAP will be revised to assess the2000 standards. The High School Assessment is in development. It isproposed as an end-of-course test which will be part of thegraduation requirement.
No formal local-level assessments for elementary or middle schoolin science. There are county-wide high school exams required foreach high school science course.
Naperville Sch.Dist. #203, IL
Starting in 2000, the Illinois Standard Achievement Test (ISAT), administeredat grades 4 and 7, replaced the Illinois Goal Assessment Program (IGAP)which was administered from 1988-1999 at grades 4, 7, and 11. Beginningin 2001, the state will give new high school tests, the Prairie StateAchievement Examination (PSAE), based on the Illinois Learning Standards.Schools could be placed on academic warning based on state test results.State NAEP is also administered at the 4th grade.
There are force choice and performance local science assessmentsat grades 2, 5, 6, 7, and 8. The science assessments are currentlyunder revision.
Project SMARTConsortium, OH
Proficiency assessments in science are administered at grades 4, 6, 9, and12. As of 2000/01, students must pass the 9th grade assessment tograduate. A high school graduation exam is in development and will berequired for the Class of 2005.
Districts have their own assessments in addition to state assessments.District assessments are given at grades 1-3, 5, and 7 to assessstudent progress. These are both standardized anddistrict-developed assessments.
Rochester City Sch.Dist., NY
The state science test for grade 4 has been in place since 1989. The statescience test for grade 8 starts in Spring 2001. The class entering grade9 in 2001 will be the first class required to pass Regents exams (with agrade of 65% or higher) in all subject areas, including science. Beginningin June 2001, New York will assess students using new state-developedfinal exams for biology and earth science. Chemistry and physics willfollow in later years. Exams are based on new state standards. New Yorkis currently phasing out high school competency exams; instead, studentswill be required to pass at least one Regents exam. New York State hasdeveloped a school accountability system that will be phased in by 2003.School districts must provide academic intervention services to studentswho score below the state designated performance level on stateassessments and/or students at risk of not achieving the statelearning standards.
There are district-wide mid-terms and final exams for courses notending in a Regents exam for grades 6 through 12.
SW Math/Sci.Collaborative, PA
The science assessment is in development with field testing scheduled forSpring 2001.
Each of the 118 districts has its own assessment system in additionto the state assessments. Forty of the districts have worked togetherto develop classroom-based assessment tools for the STC modulesat the elementary level.
Science Assessments
State
SOU
RCE:
IEA
Thi
rd In
tern
atio
nal M
athe
mat
ics
and
Scie
nce
Stud
y (T
IMSS
), 19
98-1
999.
Exhibit 5.14(Continued) Districts’ and Consortia’s State and Local Science Assessments

2 3 4 5 6 7180 Chapter 1
How Do Education Systems Deal with Individual Differences?
The challenge of maximizing opportunity to learn for students withwidely differing abilities and interests is met differently in different educa-tion systems. Exhibit 5.15 summarizes questionnaire and interview dataon how selected comparison countries, as well as states, districts, andconsortia, organized their curricula to deal with this issue.
Some participants indicated using more than one method of dealing withindividual differences among students, and in these cases the categorydescribing the main method was reported. In the United States, and inCanada, Chinese Taipei, the Czech Republic, Hong Kong, and theRussian Federation among the comparison countries, the samecurriculum was intended for all students, but it was recommended thatteachers adapt the level and scope of their teaching to the abilities andinterests of their students. In the Czech Republic and England, thescience curriculum was taught at different levels to different groups, twoin the Czech Republic and nine in England – so many because inEngland the levels are defined in terms of progressively more complexperformance to be demonstrated. Another approach to differentiatedprovision was followed in Belgium (Flemish), the Netherlands, andSingapore, which assign different curricula to students of different levelsof ability and interest. Three of the comparison countries, Italy, Japan,and Korea, reported that their official science curricula did not addressthe issue of differentiating instruction for eighth-grade students withdifferent abilities or interests.
All of the Benchmarking states and most of the districts and consortiagenerally resembled the United States in that they provided the samecurriculum for all, but expected teachers to adapt the level and scope oftheir teaching to their students’ needs. The First in the WorldConsortium, Miami-Dade, and Montgomery County provided the samecurriculum to all, but at different levels for different groups – three levelsin First in the World and two levels in each of the other two.
Schools’ reports on how they organize to accommodate students withdifferent abilities or interests are shown in Exhibit R2.1 in the referencesection. Substantial percentages of students in many countries were inschools that offered remedial science (53 percent, on average internation-ally) and enrichment science (50 percent). While high-performingSingapore and Chinese Taipei reported that 97 and 78 percent of theirstudents, respectively, were in schools that offered remedial science, allBenchmarking jurisdictions reported that less than 30 percent of theirstudents were in such schools. Six Benchmarking jurisdictions reportedhigher percentages of students in schools that offer enrichment sciencethan internationally, with Miami-Dade and Rochester reporting that 100percent of their students were in such schools.

Background data provided by coordinators from participating jurisdictions.
1 United States: Most state standards are designed for all students.
2 Czech Republic: There is the same curriculum with different levels for different groups in physics andchemistry (2 levels); there is one curriculum for all students, and teachers adapt to students’ needs,in life science and earth science.
3 England: While there is one “programme of study” for grades 6-8, the document identifies nine per-formance-levels describing the types and range of performance that pupils working at a particularlevel should demonstrate.
4 Due to the variation across the state/collaborative, a representative response cannot be provided forthese questions.
A dash (–) indicates data are not available.
Same Curriculum forAll Students, andTeachers Adapt toStudents’ Needs
Same Curriculumwith Different Levelsfor Different Groups
Different Curriculafor Different Groups
Number ofCurriculum Levels
Countries
United States 1 Yes Yes No No 1
Belgium (Flemish) Yes No No Yes
Canada Yes Yes No No
Chinese Taipei Yes Yes No No
Czech Republic 2 Yes Yes No
England 3 Yes No Yes No
Hong Kong, SAR Yes Yes No No
Italy No
Japan No
Korea, Rep. of
Netherlands Yes No No Yes
Russian Federation Yes No No
Singapore No No YesStates
Connecticut Yes Yes No No
Idaho Yes Yes No No
Illinois Yes Yes No No
Indiana Yes Yes No No
Maryland Yes No No
Massachusetts Yes Yes No No
Michigan Yes Yes No No
Missouri Yes Yes No No
North Carolina Yes Yes No No
Oregon Yes No No
Pennsylvania 4 –
South Carolina Yes No No
Texas Yes No NoDistricts and Consortia
Academy School Dist. #20, CO Yes Yes No No
Chicago Public Schools, IL Yes Yes No No
Delaware Science Coalition, DE Yes Yes No No
First in the World Consort., IL Yes No Yes No
Fremont/Lincoln/WestSide PS, NE Yes No No
Guilford County, NC Yes Yes No No
Jersey City Public Schools, NJ Yes Yes No No
Miami-Dade County PS, FL Yes No Yes No
Michigan Invitational Group, MI Yes Yes No No
Montgomery County, MD No Yes No
Naperville Sch. Dist. #203, IL Yes Yes No No
Project SMART Consortium, OH Yes No No
Rochester City Sch. Dist., NY Yes No No
SW Math/Sci. Collaborative, PA 4
CurriculumAddresses
Differentiation
Approaches to Addressing Students withDifferent Abilities or Interests at Grade 8
2
1
1
Yes 2
9
1
No
4
Yes 1
Yes 3
1
1
1
1
Yes 1
1
1
1
1
Yes 1
– – – –
Yes 1
Yes 1
1
1
1
3
Yes 1
1
1
2
1
Yes 2
1
Yes 1
Yes 1
– – – – –
181The Science Curriculum
SOU
RCE:
IEA
Thi
rd In
tern
atio
nal M
athe
mat
ics
and
Scie
nce
Stud
y (T
IMSS
), 19
98-1
999.
T IMSS 1999Benchmarking
Boston CollegeExhibit 5.15
8th Grade Science
Differentiation of Curriculum for Students with Different Abilities or Interests

2 3 4 5 6 7182 Chapter 1
What Are the Major Characteristics of the Intended Curriculum?
Exhibit 5.16 indicates the relative emphasis given to various aspects ofscience instruction in the intended curriculum. Knowing basic sciencefacts and understanding science concepts received major emphasis in thecurriculum of most participating countries, and at least moderateemphasis was placed on application of science concepts in almost allnational curricula. In addition to these three areas, the United Statesreported placing major emphasis on using laboratory equipment,performing experiments, and designing and conducting scientific experi-ments, as did top-performing Singapore, Korea, and Japan. The CzechRepublic’s intended curriculum had minor or no emphasis on any aspectof practical work.
The Benchmarking jurisdictions were similar to the United States overallin the curricular areas that they reported placing major emphasis on. AllBenchmarking jurisdictions reported placing major emphasis on under-standing science concepts and on applying science concepts, and alljurisdictions except Pennsylvania and the Fremont/Lincoln/WestsidePublic Schools on designing and conducting scientific experiments.There were also areas of different emphasis. Although the pattern variedquite a lot, relatively less emphasis was reported by Benchmarking stateson knowing basic science facts (particularly in Massachusetts andMichigan), on using laboratory equipment, and on performing experi-ments, and relatively more emphasis on assessment. The Benchmarkingdistricts and consortia resembled the United States overall rather moreclosely, although again there was relatively more emphasis on assessment,as well as on communicating scientific procedures and explanations,reported in almost all of these jurisdictions.
It is possible that in some entities some of the approaches and processesreported as being given minor or no emphasis in the intendedcurriculum may receive more emphasis in the implemented curriculum.Conversely, it is also possible that some of the approaches and processesreported as being given major or moderate emphasis in the intendedcurriculum may receive less emphasis in the implemented curriculum.

183The Science Curriculum
T IMSS 1999Benchmarking
Boston College
8th Grade Science
Background data provided by coordinators from participating jurisdictions.
1 Belgium (Flemish) and Russian Federation: The single codes are derived from a combination of codesfor individual sciences.
2 Canada: Results shown are for the majority of provinces.
3 SW Math/Sci. Collaborative: Covering a workforce region of 118 autonomous districts, theCollaborative cannot provide a representative response for these questions.
CountriesUnited States
Belgium (Flemish) 1
Canada 2
Chinese Taipei
Czech Republic
England
Hong Kong, SAR
Italy
Japan
Korea, Rep. of
Netherlands
Russian Federation
Singapore
StatesConnecticut
Idaho
Illinois
Indiana
Maryland
Massachusetts
Michigan
Missouri
North Carolina
Oregon
Pennsylvania
South Carolina
Texas
Districts and ConsortiaAcademy School Dist. #20, CO – – – – – – – – – – – – –
Chicago Public Schools, IL
Delaware Science Coalition, DE
First in the World Consort., IL
Fremont/Lincoln/WestSide PS, NE
Guilford County, NC
Jersey City Public Schools, NJ
Miami-Dade County PS, FL
Michigan Invitational Group, MI
Montgomery County, MD
Naperville Sch. Dist. #203, IL
Project SMART Consortium, OH
Rochester City Sch. Dist., NY
SW Math/Sci. Collaborative, PA 3 – – – – – – – – – – – – –
Kno
win
g Ba
sic
Scie
nce
Fact
s
Und
erst
andi
ng S
cien
ce C
once
pts
App
lyin
g Sc
ienc
e C
once
pts
to S
olve
Prob
lem
s an
d D
evel
op E
xpla
natio
ns
Usi
ng L
abor
ator
y Eq
uipm
ent
Perf
orm
ing
Expe
rimen
ts
Des
igni
ng a
nd C
ondu
ctin
g Sc
ient
ific
Inve
stig
atio
ns
Com
mun
icat
ing
Scie
ntifi
cPr
oced
ures
and
Exp
lana
tions
inW
ritte
n an
d O
ral F
orm
Inte
grat
ion
of S
cien
ce w
ithM
athe
mat
ics
Scie
nce,
Tec
hnol
ogy
and
Soci
ety
Cro
ss-D
isci
plin
ary
App
roac
h(In
tegr
atio
n of
the
Sci
ence
san
d O
ther
Sch
ool S
ubje
cts)
Them
atic
App
roac
h
Mul
ticul
tura
l App
roac
h
Ass
essi
ng S
tude
nt L
earn
ing
ModerateEmphasis
Minor/NoEmphasis
NotAvailable–
MajorEmphasis
1
SOU
RCE:
IEA
Thi
rd In
tern
atio
nal M
athe
mat
ics
and
Scie
nce
Stud
y (T
IMSS
), 19
98-1
999.
Exhibit 5.16 Emphasis on Approaches and Processes

2 3 4 5 6 7184 Chapter 1

185The Science Curriculum
What Science Content Do Teachers Emphasize at the Eighth Grade?
Teachers from the Benchmarking jurisdictions and the countries whereeighth-grade science was taught as a general or integrated course wereasked what subject matter they emphasized most in their classes(general science, earth science, biology, etc.). Their responses, shownin Exhibit 5.17, reveal that on average across all the timss 1999single-science countries, more than half the eighth-grade students(58 percent) were in classes where the emphasis was on general or inte-grated science. Next most common was biology with 14 percent, andphysical science (physics and chemistry combined) with 11 percent.
In the United States, 41 percent of students were in classes empha-sizing general science, 28 percent earth science, and 21 percentphysical science. Just five percent of U.S. students were in scienceclasses emphasizing biology, three percent chemistry, and two percentphysics. The United States was unusual in its emphasis on earthscience. Among the 21 single-science countries in timss, only Canada,Italy, and the U.S. had more than 10 percent of their students in classesemphasizing earth science. It was more common for single-sciencecountries to place emphasis on physical science.
There was considerable variation across the Benchmarking jurisdictionsin the reported subject matter emphasis in science classes. Amongstates, the percentage of students in classes emphasizing generalscience ranged from four percent in Idaho to 72 percent in NorthCarolina. The only Benchmarking states besides Idaho with percent-ages lower than the U.S. average were Connecticut, Missouri, Oregon,Pennsylvania, and Texas. Earth science received least emphasis inMichigan (nine percent of students) and greatest in Texas(52 percent). Benchmarking states with more than one-fifth of thestudents in classes emphasizing earth science, in addition to Texas,were Connecticut, Idaho, Missouri, Oregon, Pennsylvania, and SouthCarolina. Physical science received least emphasis in Texas and NorthCarolina (five and six percent, respectively), and most in Idaho(50 percent). Eight of the states had more than one-fifth of theirstudents in classes emphasizing physical science.
Among the districts and consortia, the greatest emphasis on generalscience was reported in Chicago, the Fremont/Lincoln/Westside PublicSchools, Guilford County, Miami-Dade, and Naperville, all of which hadtwo-thirds or more of their students in classes emphasizing generalscience. In contrast, the First in the World Consortium, Jersey City, the

2 3 4 5 6 7186 Chapter 1
Project smart Consortium, and Rochester each had less than one-quarterof their students in such classes. There was less variation among districtsand consortia in the emphasis given earth science. While 68 percent ofthe students in the Delaware Science Coalition were in classes empha-sizing earth science, nine of the districts and consortia had less than 10percent of their students in such classes, and seven of them had onepercent or less. There was substantial variation among districts andconsortia in the emphasis given physical science. The Academy SchoolDistrict, Jersey City and Rochester each had more than half their studentsin classes emphasizing physical science, while Chicago, the DelawareScience Coalition, the Fremont/Lincoln/Westside Public Schools,Guilford County, the Michigan Invitational Group, and Naperville hadless than one-fifth of the students in such classes.

Background data provided by teachers.
States in italics did not fully satisfy guidelines for sample participation rates (see Appendix A for details).
( ) Standard errors appear in parentheses. Because results are rounded to the nearest whole number,some totals may appear inconsistent.
A dash (–) indicates data are not available.
An “r” indicates teacher response data available for 70-84% of students. An “s” indicates teacherresponse data available for 50-69% of students. An “x” indicates teacher response data availablefor <50% of students.
Countries
United States r 41 (4.7) 28 (4.8) 5 (1.5) 2 (0.8) 3 (1.0) 21 (3.1) 1 (0.4)
Canada r 55 (3.5) 14 (2.3) 6 (1.7) 1 (0.7) 1 (0.6) 19 (2.7) 3 (1.2)
England – – – – – – – – – – – – – –
Hong Kong, SAR 92 (2.6) 0 (0.0) 3 (1.5) 0 (0.0) 1 (0.0) 4 (1.9) 0 (0.0)Italy 0 (0.0) 20 (3.2) 49 (3.9) 13 (2.6) 3 (1.2) 11 (2.6) 3 (1.4)
Japan 64 (4.6) 1 (1.0) 7 (2.4) 6 (2.1) 11 (2.7) 6 (2.1) 5 (1.9)
Korea, Rep. of 49 (4.0) 2 (1.0) 10 (2.0) 5 (1.6) 5 (1.7) 26 (3.2) 4 (1.6)
Singapore 69 (4.1) 0 (0.0) 5 (2.0) 4 (1.8) 7 (2.3) 11 (2.5) 4 (1.6)States
Connecticut s 30 (7.8) 22 (6.2) 5 (4.1) 4 (2.4) 5 (2.4) 32 (7.7) 3 (2.1)
Idaho r 4 (2.8) 32 (6.6) 8 (4.6) 3 (1.2) 0 (0.0) 50 (7.3) 3 (2.7)
Illinois r 46 (7.1) 14 (4.7) 8 (3.4) 0 (0.0) 6 (2.0) 24 (6.7) 1 (0.6)
Indiana r 52 (8.1) 16 (4.8) 3 (1.5) 0 (0.0) 3 (2.2) 23 (8.0) 4 (1.7)Maryland s 41 (6.9) 18 (4.7) 1 (1.4) 0 (0.0) 5 (2.3) 32 (6.7) 2 (2.0)
Massachusetts r 42 (5.9) 17 (5.3) 0 (0.1) 0 (0.0) 0 (0.0) 41 (7.0) 1 (0.0)
Michigan r 54 (5.7) 9 (3.9) 3 (2.5) 2 (2.1) 0 (0.3) 32 (5.0) 0 (0.4)
Missouri r 38 (7.2) 37 (7.2) 6 (3.8) 0 (0.0) 0 (0.1) 16 (4.6) 2 (0.2)
North Carolina 72 (5.7) 10 (3.4) 1 (1.3) 1 (0.1) 8 (4.0) 6 (2.7) 2 (0.1)Oregon r 36 (6.2) 41 (7.7) 5 (2.6) 0 (0.0) 4 (2.7) 12 (5.1) 2 (1.0)
Pennsylvania r 16 (3.2) 40 (5.5) 6 (2.5) 0 (0.0) 2 (0.9) 35 (6.1) 1 (0.9)
South Carolina 41 (6.6) 48 (7.1) 0 (0.0) 0 (0.0) 0 (0.0) 11 (4.1) 1 (0.3)
Texas s 40 (5.6) 52 (6.7) 1 (0.7) 0 (0.0) 1 (1.0) 5 (3.2) 0 (0.0)Districts and Consortia
Academy School Dist. #20, CO 28 (0.4) 0 (0.0) 0 (0.0) 15 (0.4) 0 (0.0) 57 (0.6) 0 (0.0)
Chicago Public Schools, IL r 66 (8.5) 6 (4.0) 7 (4.7) 0 (0.0) 0 (0.0) 19 (8.1) 3 (0.3)
Delaware Science Coalition, DE r 31 (4.1) 68 (4.2) 0 (0.0) 0 (0.0) 0 (0.0) 0 (0.0) 1 (0.0)
First in the World Consort., IL 20 (9.3) 0 (0.0) 15 (1.5) 0 (0.0) 7 (1.0) 47 (8.1) 11 (4.7)87 (3.9) 0 (0.3) 1 (0.1) 4 (2.6) 0 (0.0) 8 (2.9) 1 (0.5)
Guilford County, NC 86 (4.5) 8 (3.6) 0 (0.0) 0 (0.0) 0 (0.0) 6 (3.9) 0 (0.0)
Jersey City Public Schools, NJ r 0 (0.0) 0 (0.0) 8 (4.1) 14 (1.4) 0 (0.0) 68 (4.1) 9 (0.9)
Miami-Dade County PS, FL s 70 (5.9) 1 (0.8) 1 (0.5) 0 (0.0) 6 (3.5) 20 (6.2) 3 (2.7)
Michigan Invitational Group, MI 47 (4.3) 32 (3.3) 4 (0.2) 0 (0.0) 3 (0.7) 14 (2.6) 0 (0.0)Montgomery County, MD x x x x x x x x x x x x x x
Naperville Sch. Dist. #203, IL 68 (3.4) 0 (0.0) 0 (0.0) 13 (0.7) 0 (0.0) 18 (3.5) 0 (0.0)
Project SMART Consortium, OH r 22 (4.2) 33 (3.3) 11 (3.0) 0 (0.0) 7 (3.1) 22 (3.4) 4 (1.7)
Rochester City Sch. Dist., NY 17 (5.3) 0 (0.0) 22 (6.2) 0 (0.0) 0 (0.0) 61 (6.5) 0 (0.0)
SW Math/Sci. Collaborative, PA 31 (7.8) 18 (6.6) 10 (5.8) 2 (2.1) 7 (3.8) 31 (5.9) 0 (0.0)
58 (0.8) 5 (0.4) 14 (0.5) 6 (0.4) 4 (0.4) 11 (0.6) 2 (0.3)
PhysicalScience
(chemistry/physics)
Other
International Average(All General Science Countries)
Percentage of Students Whose Teachers Report the Subject MatterEmphasized Most in Their Grade 8 Science Class
General/Integrated
ScienceEarth Science Biology Physics Chemistry
Fremont/Lincoln/WestSide PS, NE
187The Science Curriculum
SOU
RCE:
IEA
Thi
rd In
tern
atio
nal M
athe
mat
ics
and
Scie
nce
Stud
y (T
IMSS
), 19
98-1
999.
T IMSS 1999Benchmarking
Boston CollegeExhibit 5.17
8th Grade Science
Subject Matter Emphasized Most in General/Integrated Science Class

2 3 4 5 6 7188 Chapter 1
What Science Topics Are Included in the Intended Curriculum?
In the course of their meetings on planning and implementation of timss1999, the National Research Coordinators developed a list of sciencetopics that they agreed covered most of the content in the intendedscience curriculum in their respective countries. These topics, presentedin Exhibit 5.18, built on the topics covered in the timss 1995 science testand included in the teacher questionnaire. They represent all topics likelyto have been included in the curricula of the 38 participating countriesup to and including eighth grade. From the following choices, the coordi-nators from the participating entities indicated the percentages ofstudents in their own countries or jurisdictions expected to have beentaught each topic up to and including eighth grade:
• All or almost all students (at least 90 percent)
• About half of the students
• Only the more able students (top track – about 25 percent)
• Only the most advanced students (10 percent or less).
Exhibit 5.19 summarizes the data according to the percentage of topicsintended to be taught to all or almost all students (at least 90 percent) ineach entity, across the entire list of topics and for each content area.Information on specific topics in the intended curricula for each contentarea is presented in Exhibits R2.2 through R2.7 in the reference sectionof this report.
Internationally on average, curricular guidelines up to and includingeighth grade called for nearly all students to have been taught about two-thirds of the topics overall. There was, however, marked variation betweencountries and between content areas in intended curricular coverage. Thegreatest percentages of topics intended to be taught to 90 percent ormore of the students were in biology (77 percent, on average across coun-tries), earth science (72 percent), and environmental and resource issues(69 percent). Next came physics (64 percent) and scientific inquiry andthe nature of science (60 percent), with chemistry having the lowestpercentage (52 percent). In six of the comparison countries, it wasintended that all or nearly all students be taught all of the earth sciencetopics. All environmental and resource issues topics were intended to betaught to practically all students in seven comparison countries, while inHong Kong, Japan, and Korea, none of these topics were in the intendedcurriculum for most students.

189The Science Curriculum
In the United States overall, 86 percent of the science topics – comparedwith the international average of 63 percent – were intended to be taughtto 90 percent or more of the students. This relatively high level ofcoverage resulted from the inclusion of 100 percent of the topics in eachof the content areas except chemistry.
Benchmarking participants generally resembled the United States in topiccoverage in the intended curriculum, although there were differences,particularly among the districts and consortia. Earth science, biology, envi-ronmental and resource issues, and scientific inquiry and the nature ofscience were included in the curriculum for almost all students in almostall Benchmarking jurisdictions, but the coverage of physics and particularlychemistry was more variable. Among states the percentage of physics topicsintended for almost all students ranged from 60 percent in Idaho andOregon to 100 percent in Illinois, Massachusetts, and North Carolina, andamong districts and consortia from 50 percent in the Delaware ScienceCoalition to 100 percent in the First in the World Consortium, GuilfordCounty, Jersey City, and Montgomery County. The percentage of chemistrytopics ranged from just eight percent in Oregon to 100 percent in Texas,and from zero in the Michigan Invitational Group to 100 percent in Firstin the World, Jersey City, and Montgomery County.
It should be noted that some countries reported having differentcurricula or different levels of curriculum for different groups of students,as detailed in Exhibit 5.15. Not surprisingly, then, these countries oftenreported that about half, only the more able (25 percent), or the top 10percent of students were expected to have been taught substantialpercentages of the topics. Surprisingly, the Benchmarking jurisdictionsthat reported having different levels of curriculum for different groups,First in the World, Miami-Dade, and Montgomery County, indicated thatat least 90 percent of the topics in each content area were intended to betaught to 90 percent or more of the students. It should also be noted thatif content within a topic area required different responses, coordinatorsfrom participating entities chose the response that best represented theentire topic area and noted the discrepancy (see Exhibits A.8 and A.9 inthe appendix for details).

2 3 4 5 6 7190 Chapter 1
T IMSS 1999Benchmarking
Boston College
8th Grade Science
■
■
■
■
Biology
■
■
■
■
◆
■
■
■
■
■
■
◆
■
■
■
■
◆
Earth processes and history (weather and climate, physical cycles, plate tectonics, fossils)
Physical properties and physical changes of matter (weight, mass, states of matter, boiling, freezing)
Subatomic particles (protons, electrons, neutrons)
Energy types, sources, and conversions (chemical, kinetic, electric, light energy; work and efficiency)
Buoyancy
Physics
Earth in the solar system and the universe (interactions between Earth, sun, and moon;relationship to planets and stars)
Photosynthesis
Light (reflection, refraction, light and color)
Electricity and magnetism (circuits, conductivity, magnets)
Gas laws (relationship between temperature/pressure/volume)
Earth's physical features (layers, landforms, bodies of water, rocks, soil)
Earth Science
Earth's atmosphere (layers, composition, temperature, pressure)
Human body – structure and function of organs and systems
Human bodily processes (metabolism, respiration, digestion)
Reproduction, genetics, evolution, and speciation
Human nutrition, health, and disease
Biology of plant and animal life (diversity, structure, life processes, life cycles)
Interactions of living things (biomes and ecosystems, interdependence)
Forces and motion (types of forces, balanced/unbalanced forces, fluid behavior, speed, acceleration)
Heat and temperature
Wave phenomena, sound, and vibration
■
◆ Topics also included in the curriculum questionnaire (intended curriculum).
Topics included in the curriculum and teacher questionnaires (intended and implemented curriculum).
SOU
RCE:
IEA
Thi
rd In
tern
atio
nal M
athe
mat
ics
and
Scie
nce
Stud
y (T
IMSS
), 19
98-1
999.
Exhibit 5.18 Science Topics Included in the TIMSS Questionnaires

191The Science Curriculum
T IMSS 1999Benchmarking
Boston College
8th Grade Science
■
◆ Topics also included in the curriculum questionnaire (intended curriculum).
Topics included in the curriculum and teacher questionnaires (intended and implemented curriculum).
Chemistry
■
■
◆
◆
■
■
◆
◆
◆
◆
◆
◆
■
■
■
■
■
■
■
■
■
Valency
Gathering, organizing, and representing data (units, tables, charts, graphs)
Describing and interpreting data
Experimental design (experimental control, materials, and procedures)
Scientific measurements (reliability, replication, experimental error, accuracy, scales)
Using scientific apparatus and conducting routine experimental operations
Food supply and production, population, and environmental effects of natural and man-made events
Formation of solutions (solvents, solutes, soluble/insoluble substances)
Acids, bases, and salts
Periodic table
Chemical bonding and compound formation (ionic, covalent)
Chemical equations
Atomic structure
Atomic number and atomic mass
Environmental and Resource Issues
Pollution (acid rain, global warming, ozone layer, water pollution)
Classification of matter (elements, compounds, solutions, mixtures)
Structure of matter (atoms, ions, molecules, crystals)
Chemical reactivity and transformations (definition of chemical change, oxidation, combustion)
Energy and chemical change (exothermic and endothermic reactions, reaction rates)
Scientific Inquiry and the Nature of Science
Scientific method (formulating hypotheses, making observations, drawing conclusions, generalizing)
Conservation of natural resources (land, water, forests, energy resources)
SOU
RCE:
IEA
Thi
rd In
tern
atio
nal M
athe
mat
ics
and
Scie
nce
Stud
y (T
IMSS
), 19
98-1
999.
Exhibit 5.18(Continued) Science Topics Included in the TIMSS Questionnaires

2 3 4 5 6 7192 Chapter 1
T IMSS 1999Benchmarking
Boston College
8th Grade Science
Overall Earth Science Biology Physics ChemistryEnvironmentaland Resource
Issues
ScientificInquiry andthe Natureof Science
Countries
United States
Belgium (Flemish)
Canada
Chinese TaipeiCzech Republic
England
Hong Kong, SAR
Italy
JapanKorea, Rep. of
Netherlands
Russian Federation
SingaporeStates
Connecticut
Idaho
Illinois
IndianaMaryland
Massachusetts
Michigan
Missouri
North CarolinaOregon
Pennsylvania 1
South Carolina
TexasDistricts and Consortia
Academy School Dist. #20, CO 2
Chicago Public Schools, IL
Delaware Science Coalition, DE
First in the World Consort., ILFremont/Lincoln/WestSide PS, NE
Guilford County, NC
Jersey City Public Schools, NJ
Miami-Dade County PS, FL
Michigan Invitational Group, MIMontgomery County, MD
Naperville Sch. Dist. #203, IL
Project SMART Consortium, OH
Rochester City Sch. Dist., NY
SW Math/Sci. Collaborative, PA 1
International Avg.(All Countries)
Percentage of Topics Intended to Be Taught toAll or Almost All (at least 90%) Students
–
–
–
86
38
48
69
79
71
50
67
62
60
24
71
79
86
74
95
79
71
76
71
62
93
52
76
98
64
60
100
74
95
100
95
62
100
95
79
67
63
–
–
–
100
0
75
25
100
75
25
75
100
100
0
100
100
100
100
100
75
100
100
100
100
100
75
100
100
100
100
100
100
100
100
100
100
100
100
100
100
72
–
–
–
100
71
86
86
86
71
100
100
57
71
43
29
100
100
100
100
100
100
57
100
57
100
71
71
100
100
86
100
100
100
100
100
100
100
100
100
71
77
–
–
–
50
0
17
58
83
42
42
25
50
50
0
100
58
67
42
83
50
17
42
25
25
75
8
50
100
42
17
100
33
83
100
92
0
100
92
42
42
52
–
–
–
100
67
100
67
33
100
0
100
0
0
100
100
100
100
100
100
100
100
100
100
100
100
33
100
100
67
67
100
100
100
100
100
100
100
100
100
33
69
–
–
–
100
83
67
83
50
100
33
83
83
50
33
33
83
100
100
100
100
100
100
100
67
100
100
83
100
50
100
100
83
100
100
100
83
100
100
100
83
60
–
–
–
100
40
20
80
90
80
60
70
70
70
20
70
70
80
60
100
80
80
100
70
80
100
60
90
90
60
50
100
80
100
100
90
70
100
90
80
80
64
SOU
RCE:
IEA
Thi
rd In
tern
atio
nal M
athe
mat
ics
and
Scie
nce
Stud
y (T
IMSS
), 19
98-1
999.
Exhibit 5.19 Science Topics in the Intended Curriculum for At Least 90% of Students, Up toand Including Eighth Grade
Background data provided by coordinators from participating jurisdictions according to the official curriculum. Coordinators indicated the percentage of students who should have been taught each of the topics listed in Exhibit 5.18. The response categories were: all or almost all of the students (at least 90%); about half of the students; only the more able students (top track – about 25%);only the most advanced students (10% or less); not included in curriculum through grade 8.(See Reference Exhibits R2.2-R2.7 for detail by topic.)
1 Due to the variation across the state/collaborative, a representative response cannot be provided forthese questions.
2 Academy School Dist. #20: As a district that has site-based curriculum development, the district cannot provide a representative response for these questions.
A dash (–) indicates data are not available.

193The Science Curriculum
Have Students Been Taught the Topics Tested by TIMSS?
In interpreting the achievement results, it is important to consider howextensively the topics tested are taught in the participating entities. Asshown in Exhibits 5.20 through 5.25, the six major science contentareas assessed in timss 1999 were represented by 31 topic areas. Foreach area, teachers indicated whether their students had been taughtthe topics before this year (i.e., the eighth grade), one to five periodsthis year, more than five periods this year; whether the topics had notyet been taught; or whether the teacher did not know. Exhibits 5.20through 5.25 show the percentages of students in each entity reportedto have been taught each topic before or during the year of testing.
According to their teachers, more than two-thirds of students onaverage across all timss 1999 countries had been taught the topics inearth science, as shown in Exhibit 5.20. The international average foreach topic exceeded 70 percent of students. Nearly all students in theCzech Republic were taught each of the earth science topics, while lessthan half the students in Belgium (Flemish), Hong Kong, and Japanwere taught two or more of the four topics in this content area.Teachers in the United States overall as well as in the Benchmarkingjurisdictions reported greater percentages than did teachers interna-tionally, with more than 80 percent of students in most jurisdictionsbeing taught each topic. The major exceptions were Idaho, whereabout half the students were taught the earth science topics, andRochester, where one-third or less of the students had been taughtthese topics. In contrast, all students in Jersey City and Naperville weretaught three or more of the topics.
Exhibit R2.8 in the reference section indicates that many students in theU.S. as a whole and in the Benchmarking jurisdictions had instructionin the earth science topics both before and during the eighth grade.While 31 percent of students on average across countries had not yetbeen taught half or more of these topics, only 11 percent of the studentsin the United States overall had not been taught them. Thirty-twopercent of U.S. students were taught more than half the earth sciencetopics before the eighth grade and not again during the eighth grade,and a further 46 percent were taught more than half these topics duringthe eighth grade. Although many students in most Benchmarking juris-dictions were taught the earth science topics before and during theeighth grade, the percentage of students who had not yet been taughtthem ranged from three percent in South Carolina to 50 percent inIdaho among states, and from zero in Jersey City and Naperville to 87percent in Rochester among districts and consortia.
2 3 4 5 6 7194 Chapter 1
With the exception of “reproduction, genetics, evolution, and speciation”(61 percent of students), instructional coverage was high for the biologytopics presented in Exhibit 5.21. At least 77 percent of students, onaverage internationally, were taught each of the other six topics. Teachersin Belgium (Flemish), England, Italy, the Netherlands, as well as theUnited States reported that 80 percent or more of their students weretaught all of the biology topics. Like the United States overall, theBenchmarking participants reported percentages above the internationalaverage for almost all of the topics, although there was some variation.More than 90 percent of the students in Massachusetts, Oregon, theAcademy School District, the First in the World Consortium, and JerseyCity were taught each of the biology topics, while less than 80 percent ofthe students in the Michigan Invitational Group were taught five of the sixtopics in this content area.
As indicated by Exhibit R2.9 in the reference section, biology topicsreceived considerable emphasis before the eighth grade in the UnitedStates, more than in any of the comparison countries except Italy, and inthe Benchmarking jurisdictions. Fifty-five percent of U.S. studentsreceived instruction in more than half the biology topics before theeighth grade only, compared with 16 percent on average across countries.In contrast, 44 percent of students internationally were taught more thanhalf these topics during the eighth grade, compared with 26 percent inthe U.S., and 21 percent of students internationally had not yet beentaught half or more of the topics, compared with only 10 percent in theU.S. With some exceptions, results for the Benchmarking jurisdictionsgenerally were similar to those of the United States.
Of the physics topics (see Exhibit 5.22), “physical properties and the phys-ical changes of matter” had the greatest coverage internationally, with 91percent of students, on average, having been taught this topic. “Energytypes, sources, and conversions” and “subatomic particles” received lessemphasis, with 75 and 71 percent of students, respectively, having beentaught them. “Light,” “electricity and magnetism,” and “forces andmotion” also had lower percentages of students, between 65 and68 percent, compared with other physics topics. Least emphasis was givento “wave phenomena, sound, and vibration,” with an international averageof 52 percent. All students in the Netherlands were taught each of thephysics topics. The United States overall and the Benchmarking jurisdic-tions reported percentages of students taught the physics topics that weregenerally greater than the international averages.

195The Science Curriculum
However, as indicated by Exhibit R2.10 in the reference section, physicstopics received very little emphasis before the eighth grade in the UnitedStates and in the Benchmarking jurisdictions. This was true internation-ally as well. Only 12 percent of the students in the U.S., and nine percenton average across countries, were taught more than half the physics topicsbefore the eighth grade and not again during the eighth grade. Fifty-eightpercent of U.S. students, compared with 44 percent internationally, weretaught more than half these topics during the eighth grade. More thanhalf the topics were taught before or during the eighth grade to three-fourths or more of the students in Michigan, South Carolina, Texas, theAcademy School District, Jersey City, and Miami-Dade. However, half ormore of the topics had not yet been taught to one-third or more of thestudents in Connecticut, Idaho, Pennsylvania, and Rochester.
Instructional coverage was high for three of the four chemistry topics,“classification of matter” (90 percent of students taught), “structure ofmatter” (84 percent), and “chemical reactivity and transformations”(76 percent), but less for “energy and chemical change,” which just58 percent of students, internationally on average, had been taught (seeExhibit 5.23). As with physics, nearly all students (99 percent) in theNetherlands were taught each of the chemistry topics. The United Statesas a whole and the Benchmarking participants had similar or even higherpercentages of students taught these topics than internationally. Highestpercentages across all topics were reported in Naperville and the First inthe World Consortium.
Exhibit R2.11 in the reference section shows that, like physics, topics inchemistry received very little emphasis before the eighth grade interna-tionally, in the United States, and in the Benchmarking jurisdictions. Only13 percent of the students on average across countries, and 10 percent inthe U.S., had been taught the chemistry topics before the eighth gradeonly. Sixty-three percent of U.S. students, compared with 54 percent ofstudents internationally, were taught more than half these topics duringthe eighth grade. Results for the Benchmarking jurisdictions generallyresembled those of the United States.
Most students in most countries, with the notable exception of Japanamong the comparison countries, were taught the topics in environ-mental and resource issues (see Exhibit 5.24), especially those dealingwith “pollution” and “conservation of natural resources.” Four-fifths ormore of the students in the United States had been taught each of thetopics in this content area, which was above the international average ineach case. Among Benchmarking entities the lowest percentages were in

2 3 4 5 6 7196 Chapter 1
Idaho, Chicago, and Rochester, where two-thirds of the students or lesswere taught these topics. Ninety-five percent or more of the students inthe Academy School District and the First in the World Consortiumwere taught all three topics in this content area.
As may be seen in Exhibit R2.12 in the reference section, topics inenvironmental and resource issues received considerable emphasisbefore the eighth grade in the United States and in mostBenchmarking jurisdictions, more than in most of the comparisoncountries. More than half the students were taught more than half thetopics in this content area before the eighth grade only in Connecticut,Massachusetts, the Academy School District, the First in the WorldConsortium, and the Michigan Invitational Group. However, 43percent or more of the students in Idaho, Chicago, and Rochester hadnot yet been taught half or more of these topics.
Instructional coverage of the six scientific inquiry and the nature ofscience topics was high in most countries, with between 75 and88 percent of students, on average internationally, having been taughtthese topics (see Exhibit 5.25). Coverage was particularly high in theUnited States overall and in all of the Benchmarking jurisdictions. In20 Benchmarking jurisdictions, ninety percent or more of the studentswere taught all six topics. Teachers in all jurisdictions and comparisoncountries except Belgium (Flemish) reported that each topic had beentaught to more than 60 percent of their students.
Exhibit R2.13 reveals that while relatively little emphasis was placedon scientific inquiry and the nature of science topics before theeighth grade, considerable attention was paid to them during thatyear. Ninety-two percent of students in the United States, and two-thirds of the students internationally, were taught more than halfthese topics during the eighth grade. Benchmarking participantsreported percentages similar to those of the U.S., as 90 percent ormore of the students in all Benchmarking entities except Missouri,North Carolina, and Pennsylvania were taught more than half thetopics during the eighth grade.

197The Science Curriculum
T IMSS 1999Benchmarking
Boston College
8th Grade Science
Background data provided by teachers.
* Taught before or during this school year.
1 Chinese Taipei: Data for grade 9 earth science teachers not available.
States in italics did not fully satisfy guidelines for sample participation rates (see Appendix A for details).
( ) Standard errors appear in parentheses. Because results are rounded to the nearest whole number,some totals may appear inconsistent.
A dash (–) indicates data are not available.
An “r” indicates teacher response data available for 70-84% of students. An “s” indicates teacherresponse data available for 50-69% of students. An “x” indicates teacher response data availablefor <50% of students.
Countries
United States r 87 (2.5) r 84 (2.7) r 92 (2.0) r 84 (2.3)
Belgium (Flemish) r 93 (3.0) r 45 (4.3) r 64 (5.2) r 16 (3.4)
Canada s 91 (1.9) s 83 (2.1) s 86 (2.3) s 80 (3.1)
Chinese Taipei 1 – – – – – – – –Czech Republic 99 (0.4) 98 (1.2) 97 (1.7) 98 (1.2)
England s 86 (4.0) s 64 (3.9) s 71 (3.5) s 90 (3.6)
Hong Kong, SAR s 17 (3.2) r 61 (5.0) s 17 (4.0) s 15 (3.8)
Italy 82 (2.9) 95 (1.5) 81 (3.2) 70 (3.6)
Japan 6 (2.2) 74 (3.7) 39 (4.1) 99 (0.7)Korea, Rep. of 91 (2.4) 98 (1.2) 95 (1.5) 52 (4.0)
Netherlands 76 (5.6) 91 (2.7) 92 (4.1) r 82 (4.8)
Russian Federation – – – – – – – –
Singapore x x x x x x x x
StatesConnecticut s 84 (6.0) s 83 (5.9) s 81 (5.7) s 85 (5.8)
Idaho s 53 (6.8) s 50 (7.3) s 52 (7.2) s 48 (6.6)
Illinois r 84 (6.6) r 83 (7.0) r 81 (6.9) r 75 (7.3)
Indiana r 93 (3.0) r 92 (3.7) r 89 (3.8) r 91 (4.0)Maryland s 83 (4.3) s 81 (5.1) s 82 (4.1) s 79 (6.4)
Massachusetts r 83 (4.6) r 80 (4.5) r 84 (4.6) r 79 (4.5)
Michigan r 89 (4.3) r 86 (4.9) r 93 (3.0) r 88 (4.1)
Missouri r 93 (3.1) r 95 (1.6) r 93 (3.8) r 77 (4.4)
North Carolina 93 (1.5) 91 (2.2) r 90 (3.0) 88 (3.6)Oregon 94 (3.2) 83 (4.6) 90 (4.0) 85 (5.0)
Pennsylvania r 83 (4.2) r 80 (4.8) r 83 (4.0) r 75 (4.4)
South Carolina r 98 (1.5) r 91 (3.6) 98 (1.0) 90 (3.6)
Texas r 94 (3.3) r 89 (3.8) r 93 (3.6) r 85 (4.2)
Districts and ConsortiaAcademy School Dist. #20, CO 91 (0.2) 90 (0.2) 90 (0.2) 90 (0.2)
Chicago Public Schools, IL r 92 (4.9) r 94 (4.2) r 82 (4.9) r 80 (7.9)
Delaware Science Coalition, DE s 85 (5.4) s 83 (4.6) s 84 (5.4) s 83 (4.8)
First in the World Consort., IL 86 (7.8) 86 (7.8) 100 (0.0) 82 (7.5)Fremont/Lincoln/WestSide PS, NE r 97 (2.4) r 96 (2.5) r 97 (2.4) 68 (6.6)
Guilford County, NC 95 (2.8) 96 (2.5) 92 (2.7) 88 (3.6)
Jersey City Public Schools, NJ r 100 (0.0) r 100 (0.0) r 100 (0.0) s 100 (0.0)
Miami-Dade County PS, FL s 98 (1.2) s 93 (5.1) s 97 (2.6) s 82 (6.6)
Michigan Invitational Group, MI r 83 (2.3) r 94 (1.8) r 90 (1.4) r 96 (1.5)Montgomery County, MD x x x x x x x x
Naperville Sch. Dist. #203, IL 100 (0.0) 90 (2.9) 100 (0.0) 100 (0.0)
Project SMART Consortium, OH r 84 (1.8) r 81 (3.7) r 94 (0.9) r 85 (3.3)
Rochester City Sch. Dist., NY s 22 (3.5) s 25 (4.0) s 22 (3.5) s 35 (5.9)
SW Math/Sci. Collaborative, PA 79 (5.0) 79 (4.9) 80 (6.4) r 72 (7.4)
International Avg.(All Countries) 77 (0.6) 73 (0.6) 71 (0.6) 71 (0.6)
Earth’s physicalfeatures (layers,
landforms,bodies of water,
rocks, soil)
Earth in thesolar system
and the universe(interactions
between earth,sun, and moon;relationship to
planets and stars)
Earth processesand history
(weather andclimate, physical
cycles, platetectonics, fossils)
Earth’satmosphere
(layers,composition,temperature,
pressure)
SOU
RCE:
IEA
Thi
rd In
tern
atio
nal M
athe
mat
ics
and
Scie
nce
Stud
y (T
IMSS
), 19
98-1
999.
Exhibit 5.20 Percentages of Students Taught Earth Science Topics*

2 3 4 5 6 7198 Chapter 1
T IMSS 1999Benchmarking
Boston College
8th Grade Science
Countries
United States r 90 (2.6) r 90 (2.1) r 91 (2.2) r 92 (1.9) r 90 (2.0) r 83 (2.8)
Belgium (Flemish) 98 (1.0) 100 (0.0) 100 (0.0) r 91 (2.6) r 85 (3.7) 94 (2.2)
Canada s 54 (3.0) s 49 (3.6) s 54 (3.8) s 70 (3.2) s 77 (2.7) s 45 (3.7)
Chinese Taipei 1 – – – – – – – – – – – –Czech Republic 99 (0.4) 99 (0.5) 98 (1.1) 96 (2.1) 73 (4.4) 57 (5.4)
England s 96 (1.9) s 99 (0.8) s 95 (2.5) s 91 (3.2) s 84 (4.2) s 80 (3.6)
Hong Kong, SAR 79 (3.8) 76 (3.6) r 30 (4.7) r 69 (4.6) r 57 (4.9) r 61 (4.6)
Italy 99 (0.9) 99 (0.9) 97 (0.9) 100 (0.0) 89 (2.4) 87 (2.9)
Japan 97 (1.7) 96 (1.8) 82 (3.3) 86 (3.0) 15 (3.2) 8 (2.5)Korea, Rep. of 91 (2.2) 92 (2.2) 87 (2.8) 76 (3.7) 57 (4.3) 54 (4.3)
Netherlands r 100 (0.0) r 100 (0.0) r 100 (0.0) r 100 (0.0) r 100 (0.0) r 99 (0.9)
Russian Federation – – – – – – – – – – – –
Singapore 97 (1.5) 97 (1.6) 97 (1.8) r 86 (3.8) r 69 (4.4) 92 (2.7)States
Connecticut s 91 (4.7) s 95 (2.2) s 97 (1.2) s 93 (2.8) s 96 (2.6) s 78 (5.9)
Idaho s 76 (7.7) s 77 (7.7) s 80 (7.0) s 87 (4.4) s 83 (5.6) s 76 (5.8)
Illinois r 84 (5.3) r 89 (4.6) r 88 (3.6) r 95 (2.5) r 91 (3.3) r 84 (4.0)
Indiana r 91 (3.5) r 91 (3.6) r 94 (2.7) r 93 (3.1) r 93 (2.9) r 84 (5.5)Maryland s 99 (1.0) s 99 (1.0) s 97 (1.9) s 96 (2.5) s 89 (4.3) s 83 (5.8)
Massachusetts r 96 (2.8) r 93 (3.3) s 97 (2.2) r 96 (1.9) r 92 (1.8) r 91 (3.3)
Michigan r 87 (4.1) r 85 (4.7) r 86 (4.5) r 98 (1.2) r 97 (1.4) r 81 (5.1)
Missouri r 83 (4.1) r 86 (4.9) r 83 (5.6) r 89 (4.4) r 89 (4.1) r 83 (5.7)
North Carolina r 92 (3.4) r 89 (4.1) r 91 (3.6) r 90 (3.0) r 84 (3.9) r 85 (4.5)Oregon r 92 (3.6) r 92 (3.2) r 93 (3.4) r 93 (3.2) r 94 (3.4) r 92 (3.7)
Pennsylvania r 78 (3.5) r 77 (3.7) r 86 (3.2) r 91 (3.3) r 90 (3.6) r 74 (3.6)
South Carolina 96 (2.6) r 97 (2.0) r 96 (2.2) r 89 (4.3) r 90 (3.6) r 95 (2.8)
Texas r 94 (2.8) r 91 (4.1) r 91 (3.5) r 94 (3.0) r 95 (2.8) s 89 (4.6)Districts and Consortia
Academy School Dist. #20, CO 100 (0.0) 100 (0.0) 100 (0.0) r 100 (0.0) r 100 (0.0) 100 (0.0)
Chicago Public Schools, IL r 75 (12.5) r 75 (12.5) r 86 (8.3) r 89 (7.7) r 79 (8.0) r 77 (10.6)
Delaware Science Coalition, DE s 81 (6.9) s 82 (6.3) s 86 (5.7) s 89 (5.3) s 85 (6.3) s 86 (6.0)
First in the World Consort., IL 95 (1.7) 95 (1.7) 100 (0.0) 96 (1.5) 96 (1.5) 96 (1.5)Fremont/Lincoln/WestSide PS, NE s 96 (1.4) x x s 96 (3.2) r 87 (0.8) 90 (3.3) r 82 (7.5)
Guilford County, NC r 94 (2.8) r 94 (2.9) r 94 (2.9) 94 (2.7) r 79 (4.5) r 87 (3.0)
Jersey City Public Schools, NJ r 93 (4.2) r 91 (4.3) r 92 (4.0) r 98 (0.2) r 96 (0.4) r 96 (0.4)
Miami-Dade County PS, FL s 98 (0.8) s 94 (4.0) s 86 (5.0) s 96 (2.9) s 91 (5.5) s 83 (4.6)
Michigan Invitational Group, MI r 76 (2.8) r 74 (3.5) r 79 (4.0) r 73 (2.4) r 85 (3.5) r 65 (1.5)Montgomery County, MD x x x x x x x x x x x x
Naperville Sch. Dist. #203, IL 86 (4.2) 100 (0.0) r 100 (0.0) 100 (0.0) 100 (0.0) 83 (1.7)
Project SMART Consortium, OH r 87 (3.5) r 84 (3.8) r 97 (1.5) r 94 (2.9) r 87 (3.9) r 86 (3.2)
Rochester City Sch. Dist., NY r 86 (3.0) r 90 (3.4) r 88 (3.9) r 90 (3.4) r 81 (4.9) r 83 (3.7)
SW Math/Sci. Collaborative, PA r 76 (8.4) r 74 (7.0) r 82 (7.3) 82 (5.0) r 85 (3.8) r 64 (8.2)
International Avg.(All Countries) 84 (0.5) 83 (0.5) 79 (0.6) 87 (0.5) 77 (0.6) 61 (0.7)
Human body –structure andfunction oforgans and
systems
Interactions ofliving things
(biomes,ecosystems, and
interdependence)
Reproduction,genetics,
evolution, andspeciation
Human bodilyprocesses
(metabolism,respiration,digestion)
Humannutrition, health,
and disease
Biology ofplant and animal
life (diversity,structure, life
processes,life cycles)
SOU
RCE:
IEA
Thi
rd In
tern
atio
nal M
athe
mat
ics
and
Scie
nce
Stud
y (T
IMSS
), 19
98-1
999.
Exhibit 5.21 Percentages of Students Taught Biology Topics*
Background data provided by teachers.
* Taught before or during this school year.
1 Chinese Taipei: Data for grade 7 biology teachers not available.
States in italics did not fully satisfy guidelines for sample participation rates (see Appendix A for details).
( ) Standard errors appear in parentheses. Because results are rounded to the nearest whole number,some totals may appear inconsistent.
A dash (–) indicates data are not available.
An “r” indicates teacher response data available for 70-84% of students. An “s” indicates teacherresponse data available for 50-69% of students. An “x” indicates teacher response data availablefor <50% of students.

199The Science Curriculum
T IMSS 1999Benchmarking
Boston College
8th Grade Science
Background data provided by teachers.
* Taught before or during this school year.
States in italics did not fully satisfy guidelines for sample participation rates (see Appendix A for details).
( ) Standard errors appear in parentheses. Because results are rounded to the nearest whole number,some totals may appear inconsistent.
A dash (–) indicates data are not available.
An “r” indicates teacher response data available for 70-84% of students. An “s” indicates teacherresponse data available for 50-69% of students. An “x” indicates teacher response data availablefor <50% of students.
CountriesUnited States r 93 (1.7) r 86 (2.6) r 76 (3.4) r 82 (3.0) r 65 (3.8) r 67 (3.3) r 70 (3.2) 75 (3.4)
Belgium (Flemish) s 58 (5.3) s 8 (2.9) s 35 (4.7) s 54 (5.4) s 5 (2.1) s 31 (4.0) s 38 (4.3) 33 (4.5)
Canada r 97 (1.3) s 44 (3.4) r 82 (2.6) r 91 (2.1) s 35 (3.8) s 50 (4.0) s 48 (3.3) 56 (3.1)
Chinese Taipei 98 (1.0) 98 (1.0) 47 (4.3) 93 (2.3) 79 (3.1) 89 (2.6) 20 (3.2) 29 (3.5)Czech Republic 96 (2.1) 96 (2.0) 94 (2.4) 98 (1.3) 10 (3.1) 81 (4.1) 71 (4.8) 100 (0.2)
England s 97 (1.4) s 66 (4.1) s 96 (1.7) s 92 (2.8) s 82 (3.6) s 98 (1.1) s 97 (1.8) 98 (1.1)
Hong Kong, SAR r 87 (3.4) r 34 (4.9) 87 (3.4) 84 (3.2) r 58 (4.6) r 50 (5.2) 83 (3.5) 41 (4.9)
Italy 98 (1.2) 89 (2.6) 77 (3.1) 95 (1.5) 44 (4.0) 38 (4.0) 55 (3.9) 85 (2.9)
Japan 100 (0.0) 43 (4.1) 15 (3.5) 99 (0.9) 99 (1.3) 99 (1.3) 90 (2.6) 20 (3.1)Korea, Rep. of 95 (1.9) 66 (4.1) 63 (4.3) 85 (3.1) 33 (3.9) 41 (4.0) 96 (1.7) 87 (2.6)
Netherlands 100 (0.0) r 100 (0.0) 100 (0.0) 100 (0.0) 100 (0.0) 100 (0.0) 100 (0.0) 100 (0.0)
Russian Federation – – – – – – – – – – – – – – – –
Singapore 96 (1.8) s 80 (4.5) 97 (1.6) 99 (0.9) 85 (3.4) 99 (0.8) 92 (2.6) 82 (4.2)
StatesConnecticut s 92 (4.2) s 79 (7.4) s 74 (6.2) s 87 (5.3) s 58 (7.7) s 67 (7.6) s 68 (7.6) 65 (7.5)
Idaho s 87 (6.4) s 87 (6.6) s 67 (6.6) s 69 (7.1) s 56 (7.9) s 53 (7.3) s 46 (7.6) 65 (7.1)
Illinois 91 (2.4) 89 (4.7) r 79 (6.7) r 70 (6.9) s 50 (6.2) r 54 (6.9) r 70 (5.8) 87 (4.9)
Indiana r 97 (1.7) r 94 (3.0) r 77 (7.8) r 78 (8.0) s 56 (9.1) r 62 (9.2) r 69 (9.0) 91 (3.6)Maryland s 98 (1.4) s 88 (3.3) s 85 (4.0) s 79 (5.3) s 69 (4.7) s 71 (4.6) s 80 (5.6) 89 (4.4)
Massachusetts r 97 (2.0) r 91 (3.8) r 78 (5.6) r 82 (5.7) s 58 (7.5) r 62 (7.6) r 70 (7.1) 81 (5.5)
Michigan r 97 (2.6) r 91 (4.1) r 95 (2.8) r 94 (3.1) r 79 (5.1) r 77 (5.2) r 74 (5.5) 87 (4.7)
Missouri r 97 (1.6) r 94 (3.3) r 81 (5.6) r 85 (5.5) r 69 (5.1) r 70 (6.7) r 78 (4.9) 83 (4.4)
North Carolina r 97 (3.2) 97 (3.1) r 82 (6.1) r 88 (5.5) r 77 (6.8) r 76 (6.7) 73 (6.1) 78 (6.4)Oregon 98 (1.3) 96 (2.7) r 81 (5.1) r 86 (4.9) r 57 (5.9) r 63 (6.0) r 74 (6.2) 80 (5.9)
Pennsylvania r 85 (3.4) r 85 (3.9) r 74 (6.4) r 73 (6.4) s 49 (8.1) s 56 (7.8) s 67 (6.6) 61 (5.9)
South Carolina 97 (1.8) 98 (1.1) r 87 (3.4) r 93 (2.7) r 79 (4.6) r 82 (4.6) r 85 (4.5) 76 (6.0)
Texas r 96 (2.4) r 98 (1.3) s 82 (4.8) s 87 (5.5) s 78 (7.1) s 77 (5.5) s 77 (4.8) 79 (5.5)
Districts and ConsortiaAcademy School Dist. #20, CO 100 (0.0) 86 (0.2) 100 (0.0) 91 (0.1) 41 (0.4) 38 (0.4) r 47 (0.4) 69 (0.4)
Chicago Public Schools, IL r 86 (7.3) r 86 (7.3) r 87 (7.4) r 83 (8.5) r 66 (10.8) r 69 (10.4) r 73 (10.0) 84 (8.1)
Delaware Science Coalition, DE s 99 (0.4) s 91 (4.8) s 77 (7.3) s 94 (3.2) s 55 (7.2) s 89 (5.0) s 68 (6.7) 83 (2.6)
First in the World Consort., IL 100 (0.0) 98 (2.2) 94 (1.9) 86 (7.8) 69 (3.1) 69 (3.1) 92 (0.8) 87 (1.5)Fremont/Lincoln/WestSide PS, NE r 99 (0.6) r 100 (0.3) r 73 (3.2) r 78 (8.1) s 65 (10.1) r 61 (6.0) r 86 (3.7) 91 (1.4)
Guilford County, NC r 97 (1.1) 95 (2.3) r 94 (2.2) r 97 (2.2) s 89 (4.9) r 95 (3.6) 95 (2.3) 87 (4.6)
Jersey City Public Schools, NJ r 98 (0.3) r 93 (0.7) r 100 (0.0) r 100 (0.0) s 48 (5.0) r 55 (4.5) r 69 (4.2) 100 (0.0)
Miami-Dade County PS, FL s 99 (1.2) s 96 (2.5) s 92 (2.6) s 90 (4.0) s 76 (6.4) s 67 (7.9) s 78 (6.7) 82 (4.3)
Michigan Invitational Group, MI r 97 (0.4) r 96 (0.4) r 79 (1.6) r 86 (3.4) r 69 (2.4) r 56 (6.6) r 80 (2.6) 89 (1.9)Montgomery County, MD x x x x x x x x x x x x x x x x
Naperville Sch. Dist. #203, IL 100 (0.0) 100 (0.0) 100 (0.0) 89 (0.4) 36 (4.3) 19 (3.5) 44 (3.3) 90 (2.9)
Project SMART Consortium, OH r 95 (2.6) r 82 (3.7) r 93 (1.5) r 84 (2.3) r 75 (3.5) r 78 (3.1) r 76 (3.0) 81 (2.8)
Rochester City Sch. Dist., NY r 86 (4.7) r 100 (0.4) r 83 (5.4) r 60 (4.8) r 22 (3.8) r 28 (5.6) r 57 (6.8) 74 (7.4)
SW Math/Sci. Collaborative, PA 96 (2.6) 93 (3.0) r 79 (7.3) 80 (6.9) r 44 (8.7) r 53 (6.9) r 62 (6.3) 72 (9.0)
International Avg.(All Countries) 91 (0.4) 71 (0.6) 75 (0.5) 83 (0.5) 52 (0.6) 68 (0.6) 67 (0.6) 65 (0.6)
Wavephenomena,sound, andvibration
Heat andtemperature
Energy types,sources, andconversions(chemical,
kinetic, electric,light energy;
work andefficiency)
Subatomicparticles(protons,electrons,neutrons)
Physicalproperties and
physical changesof matter
(weight, mass,states of matter,
boiling,freezing)
Forces andmotion (types
of forces,balanced/
unbalancedforces, fluid
behavior, speed,acceleration)
Electricity andmagnetismLight
SOU
RCE:
IEA
Thi
rd In
tern
atio
nal M
athe
mat
ics
and
Scie
nce
Stud
y (T
IMSS
), 19
98-1
999.
Exhibit 5.22 Percentages of Students Taught Physics Topics*

2 3 4 5 6 7200 Chapter 1
T IMSS 1999Benchmarking
Boston College
8th Grade Science
CountriesUnited States r 88 (2.2) r 88 (2.6) r 76 (3.4) r 66 (3.9)
Belgium (Flemish) s 13 (2.9) s 8 (2.6) s 8 (3.0) s 4 (1.9)
Canada r 80 (2.3) s 63 (3.1) s 54 (4.2) s 36 (3.6)
Chinese Taipei 100 (0.0) 97 (1.4) 100 (0.0) 84 (2.9)Czech Republic 100 (0.0) 100 (0.0) 92 (3.0) 53 (5.3)
England s 98 (1.7) s 84 (4.1) s 94 (2.1) s 73 (4.7)
Hong Kong, SAR 90 (2.7) r 66 (4.6) r 57 (5.0) r 71 (4.8)
Italy 95 (1.8) 91 (2.0) 78 (3.6) 58 (4.0)
Japan 99 (1.2) 75 (3.6) 96 (1.7) 46 (4.2)Korea, Rep. of 99 (0.8) 97 (1.4) 91 (2.3) 51 (3.8)
Netherlands r 99 (1.0) r 99 (0.9) r 99 (0.9) r 99 (0.8)
Russian Federation – – – – – – – –
Singapore 98 (1.3) 93 (2.5) r 89 (2.9) x x
StatesConnecticut s 80 (6.4) s 81 (6.2) s 70 (7.6) s 67 (6.8)
Idaho s 85 (6.7) s 85 (6.7) s 73 (6.9) s 64 (7.5)
Illinois r 90 (4.2) r 91 (3.9) r 78 (5.2) r 71 (4.6)
Indiana r 91 (4.2) r 88 (4.7) r 84 (5.1) r 71 (6.6)Maryland r 92 (3.4) r 91 (3.2) s 85 (4.5) s 73 (4.7)
Massachusetts r 94 (2.7) r 86 (3.4) r 76 (5.4) r 61 (6.8)
Michigan r 90 (5.1) r 89 (5.2) r 78 (6.3) r 78 (6.5)
Missouri r 92 (3.0) r 87 (4.8) r 69 (7.0) r 56 (7.6)
North Carolina r 87 (4.6) 91 (4.1) 84 (5.0) r 73 (5.3)Oregon 95 (2.5) 92 (3.3) r 88 (3.6) r 81 (4.6)
Pennsylvania r 91 (3.3) r 91 (3.3) s 69 (6.2) r 58 (7.0)
South Carolina 97 (1.5) 96 (1.7) r 83 (4.4) r 70 (5.2)
Texas r 92 (3.0) r 93 (3.3) s 81 (5.3) s 72 (6.0)Districts and Consortia
Academy School Dist. #20, CO 86 (0.2) 86 (0.2) 86 (0.2) 86 (0.2)
Chicago Public Schools, IL r 81 (9.3) r 79 (9.7) r 76 (9.4) r 66 (11.4)
Delaware Science Coalition, DE x x s 97 (2.7) x x x x
First in the World Consort., IL 100 (0.0) 100 (0.0) 93 (0.7) 91 (1.8)Fremont/Lincoln/WestSide PS, NE r 86 (8.3) r 94 (2.8) s 61 (7.8) s 46 (7.1)
Guilford County, NC 94 (2.8) 94 (2.8) 79 (4.7) 83 (5.1)
Jersey City Public Schools, NJ r 98 (0.2) r 97 (0.3) r 75 (2.5) s 57 (4.1)
Miami-Dade County PS, FL s 97 (1.0) s 97 (1.7) s 93 (2.8) s 95 (3.0)
Michigan Invitational Group, MI r 95 (0.7) r 95 (0.7) r 83 (2.5) r 73 (4.2)Montgomery County, MD x x x x x x x x
Naperville Sch. Dist. #203, IL 100 (0.0) 100 (0.0) 100 (0.0) 79 (3.6)
Project SMART Consortium, OH r 82 (3.5) r 86 (3.5) r 75 (4.2) r 58 (4.5)
Rochester City Sch. Dist., NY r 100 (0.4) r 100 (0.4) r 72 (6.1) r 68 (6.6)
SW Math/Sci. Collaborative, PA r 94 (3.5) 92 (3.8) r 65 (7.0) r 64 (5.5)
International Avg.(All Countries) 90 (0.3) 84 (0.4) 76 (0.6) 58 (0.7)
Classificationof matter(elements,
compounds,solutions,mixtures)
Energy andchemical change(exothermic and
endothermicreactions,
reaction rates)
Chemicalreactivity
andtransformations
(definition ofchemical change,
oxidation,combustion)
Structure ofmatter
(atoms, ions,molecules,crystals)
SOU
RCE:
IEA
Thi
rd In
tern
atio
nal M
athe
mat
ics
and
Scie
nce
Stud
y (T
IMSS
), 19
98-1
999.
Exhibit 5.23 Percentages of Students Taught Chemistry Topics*
Background data provided by teachers.
* Taught before or during this school year.
States in italics did not fully satisfy guidelines for sample participation rates (see Appendix A for details).
( ) Standard errors appear in parentheses. Because results are rounded to the nearest whole number,some totals may appear inconsistent.
A dash (–) indicates data are not available.
An “r” indicates teacher response data available for 70-84% of students. An “s” indicates teacherresponse data available for 50-69% of students. An “x” indicates teacher response data availablefor <50% of students.

201The Science Curriculum
T IMSS 1999Benchmarking
Boston College
8th Grade Science
Background data provided by teachers.
* Taught before or during this school year.
States in italics did not fully satisfy guidelines for sample participation rates (see Appendix A for details).
( ) Standard errors appear in parentheses. Because results are rounded to the nearest whole number,some totals may appear inconsistent.
A dash (–) indicates data are not available.
An “r” indicates teacher response data available for 70-84% of students. An “s” indicates teacherresponse data available for 50-69% of students. An “x” indicates teacher response data availablefor <50% of students.
CountriesUnited States r 83 (2.4) r 79 (2.5) s 81 (2.9)
Belgium (Flemish) r 89 (3.3) r 82 (3.7) r 63 (4.3)
Canada s 92 (1.4) s 90 (2.2) s 83 (2.9)
Chinese Taipei r 73 (3.5) r 48 (4.4) r 41 (4.7)Czech Republic 92 (2.6) 92 (2.5) 82 (4.1)
England s 79 (4.5) s 71 (5.1) s 71 (4.6)
Hong Kong, SAR 74 (4.3) r 54 (5.3) r 30 (4.7)
Italy 84 (2.6) 80 (2.8) 70 (3.4)
Japan 26 (3.4) 7 (2.4) 7 (2.4)Korea, Rep. of 75 (3.8) 58 (4.5) 49 (4.4)
Netherlands 99 (1.0) 98 (1.0) r 98 (1.1)
Russian Federation – – – – – –
Singapore 93 (2.4) r 86 (3.5) s 64 (5.0)
StatesConnecticut s 91 (4.4) s 87 (5.5) x x
Idaho s 65 (7.5) s 64 (6.6) s 55 (8.3)
Illinois r 86 (3.7) r 81 (4.7) r 88 (3.6)
Indiana s 87 (4.3) s 82 (5.1) s 76 (5.5)Maryland s 84 (5.7) s 82 (4.8) s 82 (5.4)
Massachusetts r 93 (2.2) r 88 (3.2) s 87 (3.9)
Michigan r 92 (3.2) r 84 (4.8) s 90 (4.2)
Missouri r 90 (3.3) r 91 (3.0) r 90 (3.6)
North Carolina r 76 (5.8) r 78 (5.8) r 77 (5.2)Oregon r 84 (5.7) r 84 (5.3) r 84 (5.9)
Pennsylvania r 77 (5.9) r 74 (6.3) r 75 (6.1)
South Carolina r 93 (2.7) r 94 (2.1) r 90 (3.4)
Texas r 90 (2.9) r 88 (3.2) s 85 (4.7)
Districts and ConsortiaAcademy School Dist. #20, CO s 100 (0.0) s 100 (0.0) s 100 (0.0)
Chicago Public Schools, IL r 65 (11.2) r 53 (12.5) r 63 (11.7)
Delaware Science Coalition, DE s 79 (6.0) s 66 (5.2) s 56 (5.6)
First in the World Consort., IL 95 (2.5) 100 (0.0) 100 (0.0)Fremont/Lincoln/WestSide PS, NE s 81 (6.5) s 76 (6.2) r 73 (5.4)
Guilford County, NC r 66 (4.1) r 90 (2.7) r 74 (4.5)
Jersey City Public Schools, NJ r 100 (0.0) r 98 (0.2) r 90 (0.9)
Miami-Dade County PS, FL s 82 (6.7) s 83 (7.0) s 81 (6.6)
Michigan Invitational Group, MI s 80 (4.0) s 84 (3.9) r 83 (3.5)Montgomery County, MD x x x x x x
Naperville Sch. Dist. #203, IL 100 (0.0) 89 (3.9) r 77 (3.4)
Project SMART Consortium, OH r 89 (2.1) r 90 (1.7) r 91 (1.6)
Rochester City Sch. Dist., NY r 46 (4.5) s 33 (6.3) s 36 (7.1)
SW Math/Sci. Collaborative, PA r 85 (6.8) r 93 (4.3) s 87 (5.4)
International Avg.(All Countries) 78 (0.6) 76 (0.6) 66 (0.7)
Pollution (acid rain,global warming,
ozone layer,water pollution)
Food supplyand production,population, and
environmental effectsof natural and
man-made events
Conservation ofnatural resources
(land, water forests,energy sources)
SOU
RCE:
IEA
Thi
rd In
tern
atio
nal M
athe
mat
ics
and
Scie
nce
Stud
y (T
IMSS
), 19
98-1
999.
Exhibit 5.24 Percentages of Students Taught Environmental and Resource Issues Topics*

2 3 4 5 6 7202 Chapter 1
T IMSS 1999Benchmarking
Boston College
8th Grade Science
United States r 99 (0.6) r 97 (1.2) r 89 (2.5) r 95 (1.4) r 97 (1.4) r 98 (1.1)
Belgium (Flemish) r 86 (3.8) r 46 (4.6) r 64 (4.6) r 66 (4.9) r 91 (2.8) r 90 (3.2)
Canada r 99 (0.5) r 97 (1.7) s 84 (2.8) r 99 (0.8) r 100 (0.2) r 99 (0.7)
Chinese Taipei 85 (3.2) 71 (4.0) 83 (3.3) 90 (2.7) 68 (4.0) 69 (3.9)Czech Republic r 79 (4.4) r 73 (4.9) r 81 (4.4) r 80 (4.8) r 86 (3.7) r 81 (4.8)
England s 96 (1.6) s 95 (1.9) s 92 (2.2) s 98 (0.9) s 98 (0.8) s 98 (0.9)
Hong Kong, SAR 85 (3.4) 68 (4.5) 63 (4.8) 88 (3.1) 81 (3.4) r 80 (3.3)
Italy 100 (0.0) 94 (1.8) 84 (3.1) 84 (3.2) 95 (1.7) 94 (1.8)
Japan 90 (2.6) 96 (1.8) 77 (3.4) 99 (1.0) 97 (1.6) 95 (1.9)Korea, Rep. of 93 (2.1) 89 (2.6) 84 (3.1) 99 (0.7) 92 (2.1) 86 (2.9)
Netherlands 92 (3.7) 96 (3.0) 99 (0.7) 100 (0.0) 100 (0.0) 100 (0.0)
Russian Federation – – – – – – – – – – – –
Singapore 94 (2.2) r 93 (2.6) r 91 (3.0) 97 (1.7) 95 (2.1) 96 (1.9)
Connecticut s 99 (0.8) s 100 (0.0) s 89 (5.8) s 100 (0.0) s 100 (0.0) s 100 (0.0)
Idaho s 99 (0.6) s 96 (2.3) s 94 (3.2) s 97 (1.6) s 99 (0.6) s 100 (0.2)
Illinois 98 (2.1) r 98 (1.0) r 92 (1.8) 94 (3.4) 97 (2.0) 98 (1.9)
Indiana 100 (0.0) r 97 (1.5) r 96 (2.6) r 100 (0.0) r 98 (2.0) r 98 (2.0)Maryland r 100 (0.1) r 100 (0.1) r 98 (1.4) r 98 (1.4) r 99 (0.8) r 100 (0.1)
Massachusetts r 100 (0.2) r 97 (1.7) r 94 (2.6) r 99 (0.6) r 98 (1.7) r 100 (0.0)
Michigan r 100 (0.5) r 99 (0.5) r 94 (3.3) r 94 (3.8) r 100 (0.0) r 100 (0.0)
Missouri r 99 (0.8) r 97 (2.7) r 88 (4.2) r 93 (3.7) r 100 (0.1) r 100 (0.1)
North Carolina 96 (3.2) 91 (3.7) r 88 (4.3) r 93 (3.3) 96 (3.2) 96 (3.2)Oregon 100 (0.0) 97 (1.9) 93 (2.9) 100 (0.4) 98 (1.4) 99 (1.3)
Pennsylvania 100 (0.0) 97 (1.9) r 91 (2.0) r 94 (1.5) 100 (0.2) 100 (0.2)
South Carolina 99 (0.4) r 98 (1.4) r 93 (2.5) 97 (1.9) r 100 (0.0) 100 (0.0)
Texas r 100 (0.2) r 97 (2.5) r 96 (2.8) r 100 (0.3) r 100 (0.2) r 100 (0.2)
Academy School Dist. #20, CO 100 (0.0) 100 (0.0) 100 (0.0) 100 (0.0) 100 (0.0) 100 (0.0)
Chicago Public Schools, IL r 100 (0.0) r 94 (5.7) r 89 (7.9) r 94 (5.7) r 96 (4.0) r 100 (0.0)
Delaware Science Coalition, DE s 100 (0.0) s 100 (0.0) s 91 (4.4) s 98 (0.4) r 100 (0.0) r 100 (0.0)
First in the World Consort., IL 99 (0.8) 99 (0.8) 99 (0.8) 99 (0.8) 99 (0.8) 99 (0.8)Fremont/Lincoln/WestSide PS, NE r 100 (0.0) r 99 (0.6) r 94 (5.9) r 98 (0.6) 100 (0.0) 100 (0.0)
Guilford County, NC r 99 (0.0) r 94 (0.9) r 94 (0.9) r 97 (2.7) r 100 (0.0) r 100 (0.0)
Jersey City Public Schools, NJ r 100 (0.0) r 100 (0.0) r 80 (4.1) r 96 (0.4) r 100 (0.0) r 100 (0.0)
Miami-Dade County PS, FL s 100 (0.0) s 99 (0.7) s 100 (0.2) s 99 (0.7) s 100 (0.0) s 100 (0.0)
Michigan Invitational Group, MI r 100 (0.0) r 98 (0.1) r 97 (0.1) r 100 (0.0) r 100 (0.0) r 100 (0.0)Montgomery County, MD x x x x x x x x x x x x
Naperville Sch. Dist. #203, IL 100 (0.0) 100 (0.0) 100 (0.0) 100 (0.0) 100 (0.0) 100 (0.0)
Project SMART Consortium, OH r 100 (0.0) r 95 (2.6) r 99 (0.1) r 98 (2.2) r 100 (0.0) r 100 (0.0)
Rochester City Sch. Dist., NY r 100 (0.0) r 100 (0.0) r 72 (5.0) s 100 (0.0) r 98 (2.4) r 98 (2.4)
SW Math/Sci. Collaborative, PA 100 (0.0) 95 (4.3) r 92 (6.1) 99 (0.9) 100 (0.0) 100 (0.0)
International Avg.(All Countries) 88 (0.5) 84 (0.6) 75 (0.7) 87 (0.5) 87 (0.5) 87 (0.5)
Countries
States
Districts and Consortia
Scientific method(formulatinghypotheses,
makingobservations,
drawingconclusions,generalizing)
Describing andinterpreting
data
Gathering,organizing, and
representingdata (units,
tables, charts,graphs)
Using scientificapparatus and
conductingroutine
experimentaloperations
Scientificmeasurements
(reliability,replication,
experimentalerror, accuracy,
scales)
Experimentaldesign
(experimentalcontrol,
materials, andprocedures)
SOU
RCE:
IEA
Thi
rd In
tern
atio
nal M
athe
mat
ics
and
Scie
nce
Stud
y (T
IMSS
), 19
98-1
999.
Exhibit 5.25 Percentages of Students Taught Scientific Inquiry and the Nature of Science Topics*
Background data provided by teachers.
* Taught before or during this school year.
States in italics did not fully satisfy guidelines for sample participation rates (see Appendix A for details).
( ) Standard errors appear in parentheses. Because results are rounded to the nearest whole number,some totals may appear inconsistent.
A dash (–) indicates data are not available.
An “r” indicates teacher response data available for 70-84% of students. An “s” indicates teacherresponse data available for 50-69% of students. An “x” indicates teacher response data availablefor <50% of students.
203The Science Curriculum
What Can Be Learned About the Science Curriculum?
In contrast to the United States, most countries around the world havewell-established, centrally-mandated national curricula. Recently,however, states and districts in the U.S. have been making great stridesin establishing content standards and curriculum frameworks to guidecurriculum implementation in schools. Furthermore, many educationsystems in the U.S. have begun to assess whether the intendedcurriculum in science is being attained or learned by their students.Thoroughly examining the Benchmarking jurisdictions’ results in aninternational context can provide insights into what students areexpected to learn in science, what is taught in classrooms, and whatpolicies and practices provide the best match between the intendedand the implemented curriculum to improve student achievement.

204