benchmarking service sample report - qs · benchmarking service - sample report 5 to acquire a...
TRANSCRIPT

BENCHMARKING SERVICE
SAMPLE REPORT

Copyright © 2014 QS Intelligence Unit2
SAMPLE REPORT This is an abbreviated sample of the full Benchmarking Report. A full Benchmarking Report is tipically between 50-100 pages, depending on the number of selected peer institutions. The Modules in this sample report are condensed to provide a preview of the information covered in the full report, which is more substantial.
Please contact Jason Newman at [email protected] for more information, or visit us at www.iu.qs.com

Benchmarking Service - Sample Report 3
Executive Summary ..................................................................................................................................4
MODULE 1: Institution Reports ................................................................................................................6
Client Institution ...............................................................................................................................8
Athena Institute of Technology ........................................................................................................10
Atlantis University ......................................................................................................... Not included
Apollo University .......................................................................................................... Not included
University of Delphos .................................................................................................... Not included
Demeter University ....................................................................................................... Not included
Hermes University ......................................................................................................... Not included
Poseidon University ...................................................................................................... Not included
Zeus University of Sciences ........................................................................................... Not included
MODULE 2: Comparative Analysis ........................................................................................................ 12
MODULE 3: Rankings Performance ........................................................................................................16
MODULE 4: Research Performance ........................................................................................................20
MODULE 5: Academic Reputation .........................................................................................................24
Appendix I: Trends in Higher Education ................................................................................. Not included
Appendix II: Refinement Chronology ..................................................................................... Not included
Appendix III: Survey Results .................................................................................................. Not included
Appendix IV: Data Definitions ............................................................................................... Not included
2013 QSWUR Country Report: Country A ............................................................................. Not included
CONTENTS
Copyright © 2014 QS Intelligence Unit4
Executive Summary
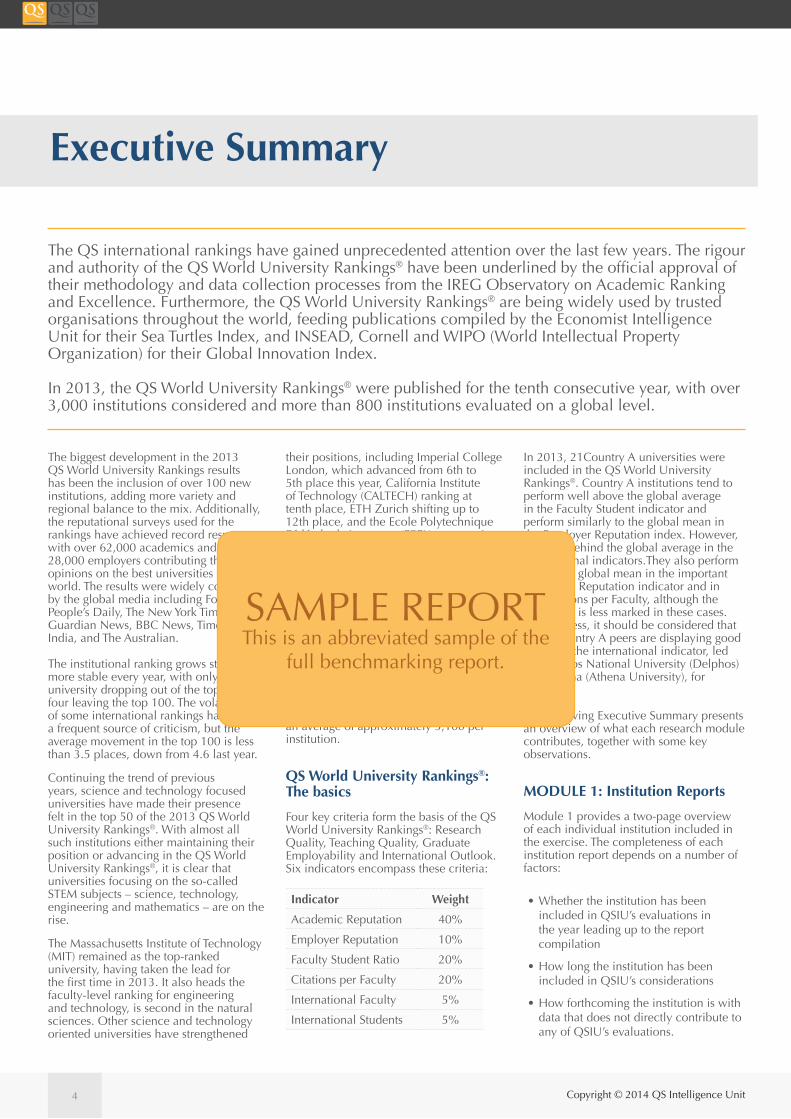
The QS international rankings have gained unprecedented attention over the last few years. The rigour and authority of the QS World University Rankings® have been underlined by the official approval of their methodology and data collection processes from the IREG Observatory on Academic Ranking and Excellence. Furthermore, the QS World University Rankings® are being widely used by trusted organisations throughout the world, feeding publications compiled by the Economist Intelligence Unit for their Sea Turtles Index, and INSEAD, Cornell and WIPO (World Intellectual Property Organization) for their Global Innovation Index. In 2013, the QS World University Rankings® were published for the tenth consecutive year, with over 3,000 institutions considered and more than 800 institutions evaluated on a global level.
The biggest development in the 2013 QS World University Rankings results has been the inclusion of over 100 new institutions, adding more variety and regional balance to the mix. Additionally, the reputational surveys used for the rankings have achieved record response, with over 62,000 academics and almost 28,000 employers contributing their expert opinions on the best universities in the world. The results were widely covered by the global media including Forbes, People’s Daily, The New York Times, Guardian News, BBC News, Times of India, and The Australian. The institutional ranking grows steadily more stable every year, with only one university dropping out of the top 50 and four leaving the top 100. The volatility of some international rankings has been a frequent source of criticism, but the average movement in the top 100 is less than 3.5 places, down from 4.6 last year.
Continuing the trend of previous years, science and technology focused universities have made their presence felt in the top 50 of the 2013 QS World University Rankings®. With almost all such institutions either maintaining their position or advancing in the QS World University Rankings®, it is clear that universities focusing on the so-called STEM subjects – science, technology, engineering and mathematics – are on the rise.
The Massachusetts Institute of Technology (MIT) remained as the top-ranked university, having taken the lead for the first time in 2013. It also heads the faculty-level ranking for engineering and technology, is second in the natural sciences. Other science and technology oriented universities have strengthened
their positions, including Imperial College London, which advanced from 6th to 5th place this year, California Institute of Technology (CALTECH) ranking at tenth place, ETH Zurich shifting up to 12th place, and the Ecole Polytechnique Fédérale de Lausanne (EPFL), progressing an impressive 10 places to 19th position.
Another important development in 2013 is the dramatic increase in terms of student mobility. International enrolments at the top 400 universities in the QS World University Rankings grew by 80,000 this year to a total of 1.37 million. This represents an average of approximately 3,400 international students per institution, up from 3,225 in 2013–an annual growth of 6.5%. The trend is even more evident among the top 100 institutions, where international enrolments grew by 9% to an average of approximately 5,100 per institution.
QS World University Rankings®: The basics
Four key criteria form the basis of the QS World University Rankings®: Research Quality, Teaching Quality, Graduate Employability and International Outlook. Six indicators encompass these criteria:
Indicator Weight
Academic Reputation 40%
Employer Reputation 10%
Faculty Student Ratio 20%
Citations per Faculty 20%
International Faculty 5%
International Students 5%
In 2013, 21Country A universities were included in the QS World University Rankings®. Country A institutions tend to perform well above the global average in the Faculty Student indicator and perform similarly to the global mean in the Employer Reputation index. However, they lag behind the global average in the international indicators.They also perform below the global mean in the important Academic Reputation indicator and in the Citations per Faculty, although the difference is less marked in these cases. Nonetheless, it should be considered that some Country A peers are displaying good results in the international indicator, led by Delphos National University (Delphos) and Athena (Athena University), for instance. The following Executive Summary presents an overview of what each research module contributes, together with some key observations.
MODULE 1: Institution Reports
Module 1 provides a two-page overview of each individual institution included in the exercise. The completeness of each institution report depends on a number of factors:
• Whether the institution has been included in QSIU’s evaluations in the year leading up to the report compilation
• How long the institution has been included in QSIU’s considerations
• How forthcoming the institution is with data that does not directly contribute to any of QSIU’s evaluations.
SAMPLE REPORT This is an abbreviated sample of the
full benchmarking report.

Benchmarking Service - Sample Report 5
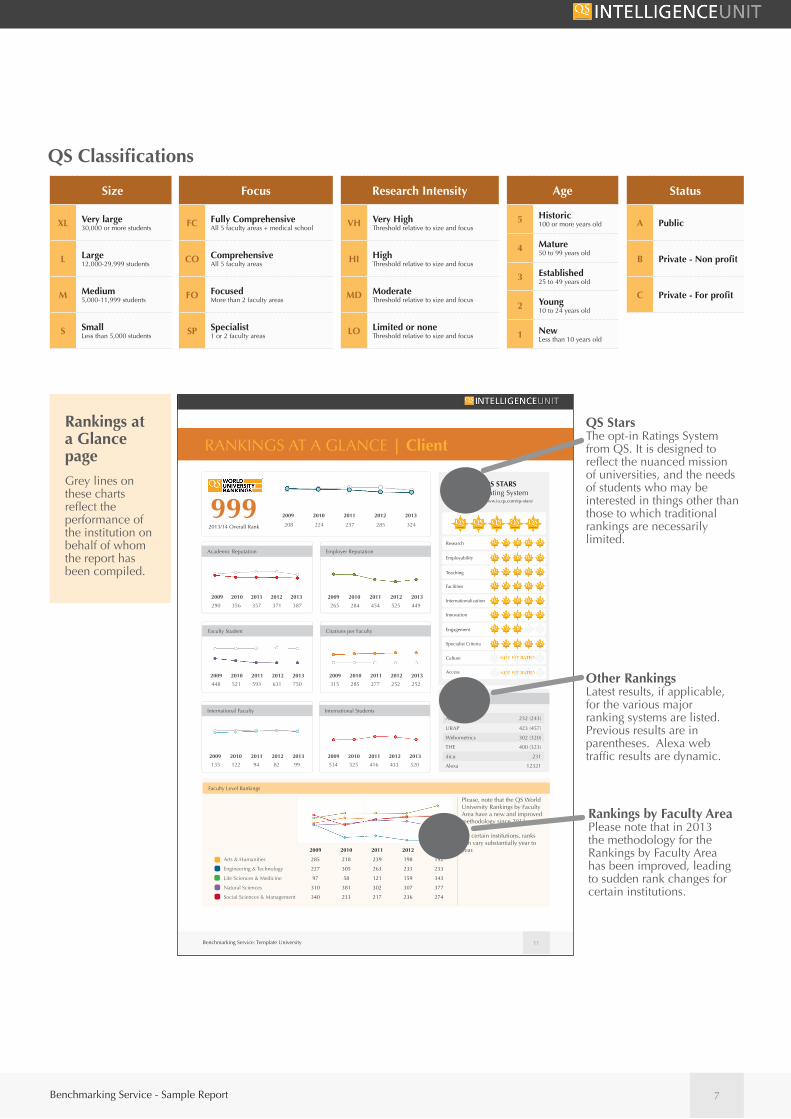
To acquire a quick feel for an institution, reviewing this module is the easiest way to obtain a visual read of its key strengths and performance over time. A more detailed schematic of how these reports are structured can be found at the start of the module.
Of key interest is the large amount of ranking data that is not available in the public domain, and which is protected under the terms of the Non-Disclosure Agreement referenced on the inside front cover of this report. This includes rankings by indicator and faculty area outside the top 300, which are not generally published, and overall rankings outside the top 400, where the results are generally published in ranges.
In addition, included in Module 1 is information on other rankings for each institution. The latest results, if applicable, from the following exercises are included:
• ARWU (Shanghai Jiao Tong)
• University Ranking by Academic Performance (URAP)
• Ranking Web of World Universities (Webometrics)
• Times Higher Education Rankings
• 4icu University Web Ranking
• Alexa Web Rankings.
QSIU has endeavoured to present the most current institutional data; however, this may not always be possible. In the interests of providing the most up-to-date figures available, data in the sections self-reported by institutions such as the Personnel, Exchanges, Financial, and Additional Information may not have been validated at the point at which this report was compiled.
Each institution report includes a dated snapshot of the university website and its current logo, providing a quick, if basic, impression of the university’s brand position. MODULE 2: Comparative Analysis
Module 2 provides a detailed summary of the current position of each selected institution in comparison with Client across all indicators used in the 2013 QS World University Rankings®. It is important to note that the charts in this module are not adjusted for the weightings used in the rankings.
Key observations from this module include:
• A common pattern for the majority of the selected peers is a strong performance in the Faculty Student and Employer Reputation indicators, counterbalanced by weaker results in the international indicators and in the Citations per Faculty index. This trend can be seen in the shapes of Hermes, Poseidon, Atlantis, Apollo and even Demeter.
• Client’ shape has shown some significant changes from the previous results, particularly in the Academic Reputation (AR) indicator, which witnessed a drop from 281 in 2012 to 420 in 2013. Conversely, the International Students (IS) index has seen an improvement of 39 places. Currently, this is the institution’s second strongest indicator at 291.
• It is worth noting that the peer group is very competitive in the Faculty Student indicator. Therefore, despite Client’ relatively strong rank in this indicator (227), it is outperformed by all peers. Inversely, the selected Country A institutions are not strong performers in the International Faculty indicator. With a rank of 407, Client manages to outperform six of the eight chosen peers.
• Delphos, ranked 35 overall, is visibly showing the strongest profile, with a remarkable performance in the two reputational indicators, both included in the top 50. Its lowest indicator ranks at 269 for International Faculty.
• Client outperforms Zeus in all indicators but the Faculty Student index, where Zeus is ranked at 193.
• Athena displays a relatively similar shape to Client; however, Athena outperforms Client in all indicators but Citations per Faculty where the latter institution leads by 18 places.
• Atlantis’ strongest features are undoubtedly the two reputational indicators and the Faculty Student index, in which it achieved a top 150 rank. Atlantis’ weaknesses lie in the International indicators. Client outperforms this peer in International Faculty (407 versus 445) and in International Students (291 versus 386).
• Demeter’s shape is quite similar to that of Client. However, Demeter is
outperformed by Client in all indicators but the Employer Reputation and Faculty Student indexes.
• When it comes to the international indicators, Apollo’s performance is very similar to that of Client. Following the latter institution’s fall in the Academic Reputation index, Apollo took the lead in this indicator. However, Client is ranked ahead of Apollo in the Citations per Faculty indicator (521 versus 585).
• Despite top 200 ranks in the reputational indicators, Hermes underperforms Client in both international indicators.
• Client is performing slightly better than Poseidon in the international indicators, but it displays much lower results in all the remaining areas.
MODULE 3: Rankings Performance
If Module 2 provides an institution-by-institution snapshot, Module 3 provides a deeper analysis on an indicator-by-indicator basis. For each indicator, a chart reveals the performance of each institution over the last five years (2009-2013). This not only indicates fluctuations in performance over time, but also highlights when enhancements to QS Rankings methodology took effect, such as the switch from Essential Science Indicators (Thomson) to Scopus™ (Elsevier). Therefore, it is important to refer to the accompanying text in Appendix II prior to drawing conclusions.
Key observations from this module include:
• Overall, the selected peer group can be divided into several performance tiers. Delphos is clearly the leader amongst the selected peers, with a stellar rank of 35. The second tier consists of Poseidon, Atlantis and Hermes, which are placed in the 100-200 range. Athena and Apollo both hover around the 250 rank. Client is placed at 362, while Demeter ranks at 405 and Zeus at 507.
• It is worth noting that the selected peer group has demonstrated a relatively high stability since 2012, aside from Zeus, which has moved up 50 places. This stability is particularly true for the highest-ranked institutions.
SAMPLE REPORT This is an abbreviated sample of the
full benchmarking report.

Copyright © 2014 QS Intelligence Unit6
Institution Reports
Copyright © 2013 QS Intelligence Unit10
Client University
Institution Name: Client University
Abbreviation:
Location: Country
Foundation year 1942
Personnel Data Headcount FTE
Faculty 5,705 5,594
International Faculty 2,187 2,187
Students 77,017 38,508
International Students 2,465 2,465
Undergraduates 35,853 35,853
International Undergraduates 2,197 2,197
Postgraduates 5,311 2,655
International Postgraduates 269 269
Exchange Data Headcount FTE
Undergraduates Inbound 281 281
Undergraduates Outbound 113 113
Postgraduates Inbound 2,336 1,752
Postgraduates Outbound 3,170 2,378
SizeXL
FocusFO
ResearchHI
Age3
StatusA
Financial Data FTE
Domestic Undergraduate Fees 1,910
International Undergraduate Fees 1,910
Domestic Postgraduate Fees 2,359
International Postgraduate Fees 2,359
Annual Library Spending 11,496,825
Total Research Funding 136,558,822
Government 100,529,613
Industrial 35,415,939
Facilities Investment 42,571,695
Community Investment 14,058,837
Alumni Donations -
Scopus Data (2008-2012) Papers Citations Impact
Overall 20,300 43,000 2.1
Arts & Humanities 0.20% 0.20% 1.5
Engineering & Technology 28.70% 20.10% 1.2
Life Sciences & Medicine 43.20% 54.90% 2.2
Natural Sciences 23.80% 22.10% 1.6
Social Sciences & Mgmt 2.70% 2.20% 1.4
Add-itional Information
Staff with PhD 11,882
Patents 214
Overall Student Satisfaction Rate 196%
Teaching Student Satisfaction Rate 198%
PhDs Awarded 997
Graduate Employment Rate 57%
Students Pursuing Further Study 88%
Average Entry Requirements 4
QS Indicators Client World
Overall 61.0 37.3
Academic Reputation 98.0 37.9
Employer Reputation 76.0 42.2
Faculty Student 19.0 44.7
Citations per Faculty 43.0 33.8
International Faculty 8.0 38.1
International Students 22.0 37.9
QS Faculty Area Score Client World
Arts & Humanities 79.0 53.9
Engineering & Technology 76.0 57.6
Life Sciences & Medicine 78.0 56.4
Natural Sciences 82.0 59.7
Social Sciences & Mgmt 77.0 55.9
Date taken: 07/10/2013
The data presented in this profi le are the most up-to-date fi gures held by the QS Intelligence Unit. In some cases, the information provided could be more recent than the one utilised for rankings calculations.
Website: www.iu.qs.com
Client
Scopus Data Scopus results for Papers, Citations, and Impact appear in this section with overall results as well as in five faculty areas: Arts & Humanities, Engineering & Technology, Life Sciences & Medicine, Natural Sciences, and Social Sciences & Management.
The following section contains an individual report for each of the institutions. This page shows an annotated schematic of an institution report with some guidance notes to assist in their interpretation.
QSIU has endeavoured to present the most current institutional data, however, this may not always be possible. In the interests of providing the most up-to-date figures possible, data in the sections self-reported by institutions such as the Personnel, Exchanges, Financial, and Additional Information may not have been validated at the point at which this report was compiled.
Additional Information If available, additional information, including patents, staff with PhDs, teaching and student satisfaction, student graduation rate, students pursuing further study, and average entry requirements are included.
Web Capture A screen capture of the home page of each institution’s website reveals a quick insight into its branding and priorities.
Personnel Data Full Time Equivalent data (or extrapolated alternative data) is used for the QS World University Rankings ®. Here, only data accurately verified is shown resulting in some blanks most commonly in the FTE column.
Exchanges Exchanges are a potential future addition as a rankings indicator but the data completion levels are not yet sufficiently high. There will be some blanks here.
Financial Financial data are not the most universally completed so more blanks will appear here than in other areas. There may also be exchange rate related anomalies. The amounts appear in US dollars.
Indicator and Faculty Area Scores Institutional performance in each Indicator and Faculty Area is presented here along with global averages. The figures presented here have been through a rigorous validation process.
Module 1
Benchmarking Service - Sample Report 7
Benchmarking Service: Template University 11
Faculty Student Citations per Faculty
International Faculty International Students
Employer Reputation
208 224 237 285 324
2009 2010 2011 2012 2013
2009 2010 2011 2012 2013 2009 2010 2011 2012 2013
2009 2010 2011 2012 2013 2009 2010 2011 2012 2013
2009 2010 2011 2012 2013 2009 2010 2011 2012 2013
Academic Reputation
2013/14 Overall Rank
999Research
Employability
Teaching
Facilities
Internationalization
Access
Culture
Specialist Criteria
Engagement
Innovation
ARWU 232 (243)
URAP 423 (457)
Webometrics 302 (320)
THE 400 (323)
4icu 231
Alexa 12321
QS STARSRating Systemwww.iu.qs.com/qs-stars/
RANKINGS AT A GLANCE | Client
Faculty Level Rankings
2009 2010 2011 2012 2013
Arts & Humanities 285 218 239 198 192
Engineering & Technology 227 305 263 233 233
Life Sciences & Medicine 97 58 121 159 343
Natural Sciences 310 381 302 307 377
Social Sciences & Management 340 233 217 236 274
Please, note that the QS World University Rankings by Faculty Area have a new and improved methodology since 2013.
For certain institutions, ranks can vary substantially year to year.
Other Rankings
290 356 357 371 387 265 284 454 525 449
448 521 593 631 750 315 285 277 252 252
135 122 94 82 99 534 525 416 433 520
Other Rankings Latest results, if applicable, for the various major ranking systems are listed. Previous results are in parentheses. Alexa web traffic results are dynamic.
QS Stars The opt-in Ratings System from QS. It is designed to reflect the nuanced mission of universities, and the needs of students who may be interested in things other than those to which traditional rankings are necessarily limited.
Rankings at a Glance pageGrey lines on these charts reflect the performance of the institution on behalf of whom the report has been compiled.
Size
XL Very large 30,00 0 or more students
L Large 12,000-29,999 students
M Medium 5,000-11,999 students
S Small Less than 5,000 students
Focus
FC Fully Comprehensive All 5 faculty areas + medical school
CO Comprehensive All 5 faculty areas
FO Focused More than 2 faculty areas
SP Specialist 1 or 2 faculty areas
Research Intensity
VH Very High Threshold relative to size and focus
HI High Threshold relative to size and focus
MD Moderate Threshold relative to size and focus
LO Limited or none Threshold relative to size and focus
Age
5 Historic 100 or more years old
4 Mature 50 to 99 years old
3 Established 25 to 49 years old
2 Young 10 to 24 years old
1 New Less than 10 years old
Status
A Public
B Private - Non profit
C Private - For profit
QS Classifications
Rankings by Faculty Area Please note that in 2013 the methodology for the Rankings by Faculty Area has been improved, leading to sudden rank changes for certain institutions.

Copyright © 2013 QS Intelligence Unit8
Commissioning University
Institution Name: Commissioning University
Abbreviation: Client
Location: Country A
Foundation year 1902
Personnel Data Headcount FTE
Faculty 3,069 2,180
International Faculty 231 190
Students 21,913 17,998
International Students 2,750 2726
Undergraduates 15,452 12,823
International Undergraduates 2,469 2,463
Postgraduates 6,461 5,175
International Postgraduates 281 263
Exchange Data Headcount FTE
Undergraduates Inbound 614 514
Undergraduates Outbound 625 625
Postgraduates Inbound 191 191
Postgraduates Outbound 23 23
Size L
FocusFC
Research HI
Age 5
Status B
Financial Data USD
Domestic Undergraduate Fees 9,300
International Undergraduate Fees 9,300
Domestic Postgraduate Fees 9,300
International Postgraduate Fees 9,300
Annual Library Spending 9,010,200
Total Research Funding 100,000,000
Government 60,000,000
Industrial 40,000,000
Facilities Investment -
Community Investment -
Alumni Donations -
Scopus Data (2008-2012) Papers Citations Impact
Overall 5,875 24,297 4.1
Arts & Humanities 2.8% 1.6% 2.7
Engineering & Technology 26.6% 31.6% 5.7
Life Sciences & Medicine - - -
Natural Sciences 52.6% 47.9% 4.4
Social Sciences & Mgmt 0.2% 0.0% 1.5
Additional Information
Staff with PhD 1,045
Patents 23
Overall Student Satisfaction Rate 92%
Teaching Student Satisfaction Rate 84%
PhDs Awarded 130
Graduate Employment Rate 82%
Students Pursuing Further Study 34%
Average Entry Requirements -
QS Indicators Client World
Overall 43.7 37.3
Academic Reputation 35.6 37.9
Employer Reputation 30.9 42.2
Faculty Student 23.2 44.7
Citations per Faculty 45.7 33.8
International Faculty 16.9 38.1
International Students 59.5 37.9
QS Faculty Area Score Client World
Arts & Humanities 54.0 53.9
Engineering & Technology 58.9 57.6
Life Sciences & Medicine 50.8 56.4
Natural Sciences 54.0 59.7
Social Sciences & Mgmt - 55.9
Date taken: 5/1/2014
The data presented in this profile are the most up-to-date figures held by the QS Intelligence Unit. In some cases, the information provided could be more recent than the one utilised for rankings calculations.
Website: iu.qs.com
SAMPLE REPORT This is an abbreviated sample of the
full benchmarking report.

Benchmarking Service - Sample Report 9
Faculty Student Citations per Faculty
International Faculty International Students
Employer Reputation
442 444 402 361 352
2009 2010 2011 2012 2013
2009 2010 2011 2012 2013 2009 2010 2011 2012 2013
2009 2010 2011 2012 2013 2009 2010 2011 2012 2013
2009 2010 2011 2012 2013 2009 2010 2011 2012 2013
Academic Reputation
2013/14 Overall Rank
352Research
Employability
Teaching
Facilities
Internationalization
Access
Culture
Specialist Criteria
Engagement
Innovation
ARWU 430 (413)
URAP 483 (496)
Webometrics 1002 (1050)
THE 550 (551)
4icu 1479
Alexa 10823
QS STARS Rating System www.iu.qs.com/qs-stars/
RANKINGS AT A GLANCE | Client
Faculty Level Rankings
2009 2010 2011 2012 2013
Arts & Humanities 251 303 247 251 378
Engineering & Technology 466 442 439 291 366
Life Sciences & Medicine 521 562 673 772 560
Natural Sciences 465 585 399 338 367
Social Sciences & Management 171 140 150 170 -
Please, note that the QS World University Rankings by Faculty Area have a new and improved methodology since 2013. For certain institutions, ranks can vary substantially year to year.
Other Rankings
397 348 344 341 362 351 313 287 281 420
468 396 371 380 407 288 251 339 330 291
475 470 494 493 521 231 191 187 250 227
SAMPLE REPORT This is an abbreviated sample of the
full benchmarking report.

Copyright © 2013 QS Intelligence Unit10
Athena Institute of Technology
Institution Name: Athena Institute of Technology
Abbreviation: Athena
Location: Country B
Foundation year 1945
Personnel Data Headcount FTE
Faculty 3,376 2,398
International Faculty 255 209
Students 24,106 18,516
International Students 3,026 3,000
Undergraduates 16,998 12,823
International Undergraduates 2,716 2,710
Postgraduates 7,108 5,693
International Postgraduates 310 290
Exchange Data Headcount FTE
Undergraduates Inbound 907 893
Undergraduates Outbound 1,409 1,392
Postgraduates Inbound 52 52
Postgraduates Outbound 305 305
Size L
FocusFC
Research VH
Age 4
Status B
Financial Data USD
Domestic Undergraduate Fees 11,500
International Undergraduate Fees 15,500
Domestic Postgraduate Fees 12,500
International Postgraduate Fees 17,500
Annual Library Spending 10,000,000
Total Research Funding 150,000,000
Government 50,000,000
Industrial 100,000,000
Facilities Investment 30,214,800
Community Investment 6,320,100
Alumni Donations 10,422,000
Scopus Data (2008-2012) Papers Citations Impact
Overall 14,980 37,016 2.5
Arts & Humanities 2.1% 1.7% 2.4
Engineering & Technology 33.6% 35.3% 3.2
Life Sciences & Medicine - - -
Natural Sciences 21.1% 27.8% 4.0
Social Sciences & Mgmt 0.1% 0.1% 1.8
Additional Information
Staff with PhD 1,580
Patents -
Overall Student Satisfaction Rate 85%
Teaching Student Satisfaction Rate 88%
PhDs Awarded -
Graduate Employment Rate -
Students Pursuing Further Study -
Average Entry Requirements -
QS Indicators Athena World
Overall 50.2 37.3
Academic Reputation 45.3 37.9
Employer Reputation 32.4 42.2
Faculty Student 27.3 44.7
Citations per Faculty 69.0 33.8
International Faculty 15.6 38.1
International Students 96.0 37.9
QS Faculty Area Score Athena World
Arts & Humanities 51.6 53.9
Engineering & Technology 58.4 57.6
Life Sciences & Medicine 62.1 56.4
Natural Sciences 52.9 59.7
Social Sciences & Mgmt 45.1 55.9
Date taken: 5/1/2014
The data presented in this profile are the most up-to-date figures held by the QS Intelligence Unit. In some cases, the information provided could be more recent than the one utilised for rankings calculations.
Website: iu.qs.com
SAMPLE REPORT This is an abbreviated sample of the
full benchmarking report.

Benchmarking Service - Sample Report 11
Faculty Student Citations per Faculty
International Faculty International Students
Employer Reputation
435 435 372 337 290
2009 2010 2011 2012 2013
2009 2010 2011 2012 2013 2009 2010 2011 2012 2013
2009 2010 2011 2012 2013 2009 2010 2011 2012 2013
2009 2010 2011 2012 2013 2009 2010 2011 2012 2013
Academic Reputation
2013/14 Overall Rank
290Research
Employability
Teaching
Facilities
Internationalization
Access
Culture
Specialist Criteria
Engagement
Innovation
ARWU 301-400 (82)
URAP 250 (243)
Webometrics 480 (504)
THE 302 (333)
4icu 586
Alexa 11,892
QS STARS Rating System www.iu.qs.com/qs-stars/
RANKINGS AT A GLANCE | Athena
Faculty Level Rankings
2009 2010 2011 2012 2013
Arts & Humanities 348 506 318 311 426
Engineering & Technology 349 430 437 387 381
Life Sciences & Medicine 243 302 242 186 261
Natural Sciences 227 537 552 539 384
Social Sciences & Management 298 316 348 359 402
Please, note that the QS World University Rankings by Faculty Area have a new and improved methodology since 2013. For certain institutions, ranks can vary substantially year to year.
Other Rankings
339 354 314 249 249 307 372 340 314 405
361 352 358 357 382 345 348 258 243 177
465 453 479 497 539 191 137 122 80 53
SAMPLE REPORT This is an abbreviated sample of the
full benchmarking report.

Copyright © 2014 QS Intelligence Unit12
Comparative analysis
This section analyses Client’ performance in relation to the selected peer group across all the indicators in the 2013 QS World University Rankings®.
The scatter charts on this page show the results for all the ranked institutions in the Rankings, highlighting Client’ and the selected peers’ positions. Each chart combines two indicators, providing a quick snapshot of the performance in terms of reputation, teaching commitment, research quality and internationalisation.
The following conclusions can be extracted:
• Chart 2.1 combines the results for both reputational indicators (Academic and Employer Reputation) used for the Rankings calculations. The Academic Reputation score is represented in the horizontal axis and the Employer Reputation in the vertical axis. The chart demonstrates that [SAMPLE CONTENT].
• Although Client is placed in the lower left area, which contains those institutions with a relatively low score in both reputational indexes, it is near the [SAMPLE CONTENT] mark line for Employer Reputation. It performs better than Zeus in both indicators, and better than Demeter in the Academic Reputation index.
• Chart 2.2 combines Faculty Student/Teaching Commitment (horizontal axis) and Citations per Faculty/Research Influence (vertical axis). In this case, [SAMPLE CONTENT].
• Chart 2.3 connects the International Faculty (horizontal axis) and International Students (vertical axis) indicators. In this case, the global results depict a clear polarisation,
with a group of institutions performing at a high level in both indexes (top-right), and another tight knit group demonstrating poorer results (bottom-left). This trend is reflected in the selected peer group, as most institutions can be found in the lower-left area, displaying low performances in both indicators. However, a few institutions present interesting results in the International Students indicator. In this indicator, Client is placed very close to the score median.
Module 2
Chart 2.1 - Reputational performance - Client and selected peers - Year 2013
SAMPLE REPORT This is an abbreviated sample of the
full benchmarking report.

Benchmarking Service - Sample Report 13
Chart 2.2 - Teaching Commitment & Research Influence Performance - Client and selected peers - Year 2013
Chart 2.3 - Internationalisation performance - Client and selected peers - Year 2013SAMPLE REPORT This is an abbreviated sample of the
full benchmarking report.

Copyright © 2014 QS Intelligence Unit14
The radar charts in this module represent a snapshot of performance. In each case, the area inside the line represents the all-round strength of the institution across the six principal ranking indicators and would correlate perfectly with the overall ranking performance were it not for the influence of weightings; essentially this display approach implies that each indicator carries the same weight. Each of the selected peer institutions’ results are presented in contrast to Client’ performance.
Some insights can be drawn from analysing the results of the peer institutions:
• Typically, the more hexagonal the ‘shape’ of the institution, the better the performance. In this particular selection of peers, Delphos (Chart 2.7) is visibly showing the strongest profile, with its lowest indicator rank at [SAMPLE CONTENT].
• A common pattern for the majority of the selected peers is a strong performance in the International Student indicator, counterbalanced by weaker results in the International Faculty index indicators and the Interindex. This trend can be seen in the shapes of [SAMPLE CONTENT].
• Client’ shape has shown some significant changes from the previous results, particularly in the Academic Reputation (AR) indicator, which witnessed a drop from 281 in 2012 to 420 in 2013. Conversely, the International Students (IS) index has seen an improvement of 39 places. Currently, this is the institution’s second strongest indicator at 291.
• It is worth noting that the peer group is very competitive in the Faculty Student indicator. Therefore, despite Client’ relatively strong rank in this indicator (227), it is outperformed by all peers. Conversely, the selected Country A institutions are not strong performers in the International Faculty indicator. With a rank of 407, Client manages to outperform six of the eight chosen peers.
• Client outperforms Zeus (Chart 2.11) in all indicators but the International
Students index, where Zeus is ranked at 193 (in 2012, Client outperformed Zeus by 7 places in this indicator). However, in 2013 Client managed to outperform Zeus in the International Students indicator (291 versus 365).
• Athena (Chart 2.5) displays a relatively similar shape to Client; however, Athena outperforms Client in all indicators but Citations per Faculty where the latter institution leads by 18 places. Athena clearly outperforms Client in Faculty Student (53 versus 227) and International Students (177 versus 291).
• Atlantis’ (Chart 2.6) strongest features are undoubtedly the two reputational indicators and the Faculty Student index, in which it achieved a top 150 rank (116 for Employer Reputation,136 for Academic Reputation, 116 for Faculty Student). Atlantis’ weaknesses lie in the International indicators and the Citations per Faculty index. Client outperforms this peer in International Faculty (407 versus 445) and in International Students (291 versus 386).
• When it comes to the international indicators, Apollo’s (Chart 2.4) performance is very similar to that of Client. Following the latter institution’s fall in the Academic Reputation indicator, Apollo took the lead in this indicator. However, Client is ranked ahead of Apollo in the Citations per Faculty indicator (521 versus 585).
• Delphos (Chart 2.7) displays a remarkable performance in the two reputational indicators, both included in the top 50. It achieved a top 200 rank for Faculty Student and Citations
per Faculty. Delphos’s International Faculty and International Students indicators perform at 269 and 206 respectively, which are quite strong results in the Country A context. Client performs only 85 positions below Delphos in the International Students index.
• In 2013, Hermes (Chart 2.9) was the second best selected peer in Employer Reputation and in Faculty Student. Hermes underperforms Client in both international indicators (440 versus 407 in International Students and 345 versus 291 in International Faculty).
• Demeter’s shape (Chart 2.10) is quite similar to that of Client. The only areas where Demeter is performing better than Client are the Faculty Student and Employer Reputation indicators; however, both institutions remain close to each other. In contrast, the difference is more visible for the International Students indicator, in which Client outperforms Demeter by 139 positions.
• Poseidon (Chart 2.11) presents an interesting pattern, with three indicators performing between the rank 90 and the rank 120 (Academic Reputation, Employer Reputation and Faculty Student) and three indicators performing outside the top 300 (Citations per Faculty, International Students and International Faculty). Once again, Client is performing slightly better than this institution in the international indicators, but it displays much lower results in all the remaining areas.
SAMPLE REPORT This is an abbreviated sample of the
full benchmarking report.

Benchmarking Service - Sample Report 15
Chart 2.7 Chart 2.8 Chart 2.9
Chart 2.11
Chart 2.4 Chart 2.5 Chart 2.6
AR Academic Reputation
ER Employer Reputation
FS Faculty Student
CF Citations per Faculty
IF International Faculty
IS International Students
Chart 2.10
Caption
SAMPLE REPORT This is an abbreviated sample of the
full benchmarking report.

Copyright © 2014 QS Intelligence Unit16
This module delves deeper into the peer institutions’ overall performance and analyses each indicator used for the QS World University Rankings® from 2009 to 2013. The charts depict the trends for each selected peer, highlighting areas of growth and losses and dissecting their trajectory over time.
Overall Rankings PerformanceChart 3.1a displays the overall rank position for the selected peers for the past five years. Key findings include:
• Overall, the selected peer group can be divided into several performance tiers. Delphos is clearly the leader amongst the selected peers, with a stellar rank of SAMPLE. The second tier consists of Poseidon, Atlantis and Hermes, which are placed in the 100-200 range. Athena and Apollo both hover around the 250 rank. Client is placed at [SAMPLE], while Demeter ranks at [SAMPLE] and Zeus at [SAMPLE].
• It is worth noting that the selected peer group has demonstrated a relatively high stability since 2012, aside from Zeus, which has moved up 50 places. This stability is particularly true for the highest-ranked institutions.
• Client’ evolution has been remarkable overall. The institution managed to gain 49 places in 2010, which propelled it to the rank of [SAMPLE]. It moved up a further 4 positions in 2011 and 3 more
places in 2012, reaching the rank of [SAMPLE]. However, it could not sustain the positive trend in 2013 and fell back 21 places to rank [SAMPLE]. This position is still higher by 35 places than the one it held in 2009.
• Client is not the only institution to experience a decline in rank in 2013. Demeter, for instance, witnessed a decrease of 14 ranks in 2013 and is now placed outside the top 400. The institution had already experienced a 18-place drop in 2010 but had managed to remain stable around the top 400
line in 2011 and 2012. As a result, Demeter is the only institution amongst the selected peers to display a negative trajectory (-26 places) over the analysed period.
• Atlantis also slipped down a few positions in 2013. Between 2010 and 2012, the institution managed to climb 74 places to rank [SAMPLE], but, in 2013, it moved down 8 positions to [SMAPLE].
• Poseidon has displayed a positive trajectory from 2009 to 2012, climbing up 39 places to 112. In 2013 Poseidon remained stable by slipping only 2 positions to rank [SAMPLE].
• Zeus, the lowest-performing peer, is displaying the highest increase in rank in 2013 (+50 places). Despite a decrease of 7 places in 2012, the institution has managed to climb 83 positions over the five-year period. However, it is still ranked outside the top 500.
Rankings Performance
Chart 3.1a - Overall performance / 2009-2013
Client’ evolution has been overall remarkable. In
2013, it was ranked 362. This position is higher by 35 places than the one it
held in 2009 (397).
Module 3
SAMPLE REPORT This is an abbreviated sample of the
full benchmarking report.

Benchmarking Service - Sample Report 17
Academic Reputation
The Academic Reputation index is worth 40% of the overall Rankings score. In 2013, QSIU received [SAMPLE] responses from academics, an increase of more than [SAMPLE] over the previous year. Of the respondents, [SAMPLE]% have more than ten year experience in academia. Furthermore, some [SAMPLE]% indicated their job title to be Professor/Associate Professor, Head of Department, or more senior positions such as President and Vice-Chancellor.
Chart 3.2a reveals the following:
• 2013 was rather a negative year for the considered institutions, as all peers but two (Apollo and Zeus) lost places in the Academic Reputation indicator.
• However, Hermes’s performance is to be noted, as the institution managed to climb an impressive [SAMPLE] places over the five-year period.
• Delphos remains the highest-performing peer in this indicator, with a stellar rank of 32. However, the institution has been losing ground since 2009 where it ranked 25. In 2010 and 2011 it ranked 33, before climbing 4 places to 29. In 2013 it slipped back to rank 32.
• Poseidon was ranked 101 in 2009. For two years in a row (2010 and 2011)it remained at the same position (110). Poseidon peaked at [SAMPLE] in 2012 before falling back 29 places in 2013. The institution is now placed at [SAMPLE].
• Atlantis’ highest rank was [SAMPLE] in 2012. However, the institution noticed a 35-position drop in 2013 and is now placed at [SAMPLE].
• Hermes’s performance over the five-year period is impressive. Between 2010 and 2012, the institution climbed 295 places to rank [SAMPLE] (its biggest performance being in 2011 with a 151-place increase). However, the institution dropped 7 places in 2013. Hermes was the second-lowest performing peer in 2009 at 476 but is now the fourth best-performing peer in 2013 at 188.
• Apollo’s performance over the analysed period has been volatile yet quite remarkable. In 2011, the institution made an impressive 185-place jump to rank 231, before suffering a 130-position fall in 2012. The institution managed to partially recover in 2013 with an improvement of 15 positions to rank 346.
• Athena’s trajectory is also relatively volatile. The institution was ranked at
[SAMPLE] in 2009 but fell 65 places to rank 372 in 2010. It partially recovered from this fall in 2011 and 2012, with a combined improvement of 58 places. However, in 2013 it dropped 91 positions to rank outside the top 400 at [SAMPLE].
• Client is displaying the most worrying trend. The institution showed a positive steady trajectory from 2010 to 2012 with a combined improvement of 70 places. This performance helped the institution reaching the rank of [SAMP;E]. However, the institution suffered a 139-place fall in 2013 (the highest drop amongst all the peers) and is ranked at [SAMPLE].
• As with Client, Demeter is displaying a negative trend. In 2009 the institution was ranked [SAMPLE] but lost 67 places in just one year. It recovered partially in 2011 (+11 places) and 2012 (+17 places) although in 2013 saw a new setback of 122 positions, which placed it at [SAMPLE]. Over the analysed period this is the biggest declining trend amongst the analysed peers.
SAMPLE REPORT This is an abbreviated sample of the
full benchmarking report.
Chart 3.2a - Academic Reputation performance / 2009-2013

Copyright © 2014 QS Intelligence Unit18
Employer Reputation
QS is the only major international ranking compiler that takes into account the views of graduate employers. Over the last three years, the total number of responses to the Employer Reputation survey has increased dramatically from [SAMPLE] in 2011 to [SAMPLE] in 2013. The top five countries which continue to provide the greatest number of responses to the Employer Reputation survey are: Country A, Country B and Country C. Together, these countries account for almost a third of all respondents. Responses are closely scrutinised and weighted to eliminate any bias that may result from disproportionate response levels. However, as response rates grow, so can fluctuations in performance.
Chart 3.3a reveals the following:
• In contrast with the Academic Reputation indicator, the Employer Reputation displays a very positive trend over the analysed period for the majority of selected peers.
• Three institutions can be found in the top 100 (Delphos, Hermes and Poseidon), while two other peers perform in the 100-150 range. Athena and Demeter perform just below the 300 mark, while Client is ranked around the 350 mark. Zeus lags behind outside the top 400.
• In 2013, the peer group was led by Delphos, which achieved an excellent Employer Reputation rank of [SAMPLE]. This institution has been displaying a striking performance in this area over the five-year period, climbing {SAMPLE] positions to rank [SAMPLE].
• Delphos’s performance is somewhat overshadowed by Hermes’s impressive trajectory over the analysed period. The
institution managed to gain 387 places between 2010 and 2013, climbing by over 100 places each year until 2013. In 2010 it was ranked [SAMPLE] and reached the rank of 71 in 2013. Hermes’s performance in this indicator echoes its trajectory in the Academic Reputation index.
• Poseidon is the third and last peer that made it into the top 100 (97). In 2013 Atlantis is placed at 116. Both institutions show a steady positive trajectory, combining an overall increase of 195 places for Poseidon and 202 places for Atlantis.
• Apollo shows an overall positive trend, with a visible growth of 289 places in 2011, placing it at [SAMPLE]. This was confirmed by an additional increase of 81 places in 2012 and a further 27-place improvement in 2013 to rank [SAMPLE].
• In 2013, Athena and Demeter are ranked at [SAMPLE] and [SAMPLE] respectively. However, their trajectories have been very different. Demeter is the
only institution amongst the selected peers to have lost ground over the analysed period (-67 places), while Athena shows a combined gain of 145 places.
• Client’ trajectory is mostly positive. The institution improves its ranking by 94 places in total, from a rank of 442 in 2009 to a rank of [SAMPLE] in 2013. This performance is very encouraging for years to come.
• Zeus has seen peaks and troughs over the analysed period, even dropping 51 positions to rank [SAMPLE] in 2012. However, after a 91-place improvement in 2013, the institution has managed to reach the rank of [SAMPLE], its highest rank to date.
• Chart 3.3b demonstrates that the distance between Client and the top performing university in the selected group was the same in 2011 and 2013 (-302 places).
SAMPLE REPORT This is an abbreviated sample of the
full benchmarking report.
Chart 3.3a - Employer Reputation performance / 2009-2013

Benchmarking Service - Sample Report 19
Chart 3.8 - Client’ Scores by Indicator - 2009-2013
Chart 3.9 - Client’ Scores Against the Global Mean (difference) - 2009-2013
ConclusionChart 3.8 shows the current status of Client...
By contrast, Chart 3.9 accounts for all [...] This chart shows that Client’ Faculty Student indicator [...]
On the negative side, the Citations per Faculty and the Employer Reputation indexes require [...]
It is worth noting that Client’ Academic Reputation relationship to the global average [...]
Although Client’ Faculty Student ratio is [...]
The analysis hints that it would be advisable for the institution to focus on [...]
SAMPLE REPORT This is an abbreviated sample of the
full benchmarking report.

Copyright © 2014 QS Intelligence Unit20
This module sets out to provide an overview of the research performance for each selected peer, breaking down the results by broad faculty level. The analysis digs deeper into the Citations per Faculty indicator, highlighting areas of relative weaknesses and strengths. [Sample content]
Papers and Citations: Overall Results
Since 2007, the QS World University Rankings® have utilised information extracted from Scopus™ (www.scopus.com) by Elsevier, the world’s largest abstract and citation database of peer-reviewed literature, including:
• Over 21,000 titles from 5,000 publishers worldwide
• 50 million records, 84% with abstracts
• 5.3 million conference papers
The QS Intelligence Unit (QSIU) research team works continuously to enhance the accuracy of this indicator by instituting annual mapping exercises which look for institutional name variants, double counting, and validation of affiliate institutes. Identifying name variants is an issue in any database of this size, but is particularly challenging when an institution has affiliated components (such as hospitals or research institutes) that have their own distinct identity. For example, at one point, the SAMPLE INSTITUTION had 1,741 identified name variants in Scopus™, illustrating the complexity of this ongoing work. It is therefore advisable for institutions to notify the QSIU team of any name variants and affiliations.
The Citations per Faculty indicator looks at the total number of papers in the last complete five-year period, which was 2008-2012 for the 2013 results.
Research Performance
Chart 4.1 - Paper and Citations / 2008-2012 / Client and Selected Peers
Module 4
SAMPLE REPORT This is an abbreviated sample of the full benchmarking report.

Benchmarking Service - Sample Report 21
Research Output Evolution: 2008-2012Chart 4.2 depicts the development in productivity (total number of papers published) over time.
• Collectively, the selected peer group is dramatically improving its research productivity or, at least, the majority of the selected institutions are doing a better job in getting indexed by Scopus. In 2008, all of the chosen institutions combined generated around [SAMPLE] papers, while this number soared to [SAMPLE] in 2012.
• Apollo showed a remarkable average annual growth of almost 20% over the five-year period in terms of research output. In 2008 it published 1,388 papers, but this amount more than doubled by 2012 to 2,804 papers.
• Zeus’s performance is also positive. In 2008 the institution published 791 papers (37 papers less than Client), but by 2012, this number had reached [SAMPLE] papers, outperforming Client ([SAMPLE]papers in 2012). However, although impressive, its trajectory, with an average annual growth of 15.5%, has been more moderate than Apollo’s.
• Client’ research output evolution is represented by an average annual growth of 13.1%. In 2008 the institution had 828 papers indexed by Scopus, but
managed to produce [SAMPLE] in 2012, an increase of [SAMPLE] papers from 2008.
• Hermes’s performance improved steadily from 2010 to 2012. In 2009 it grew a timid 5.5% in terms of research production, but accelerated its publication activities by 12.5% in 2011 and 12.2% in 2012. Hermes is slowly narrowing the gap to Atlantis, with [SAMPLE] papers published in 2012 against [SAMPLE] for Atlantis.
• Poseidon presents a similar pattern to that of Atlantis, displaying a steady and positive evolution over the five-year period. However, although Atlantis produces less research ([SAMPLE] papers against [SAMPLE] for Poseidon), it has grown at a quicker pace (9.1% of annual average growth against 7.2% for Poseidon).
• Despite a relatively volatile performance, Demeter displays an annual average growth of 11.3%. However, the institution is still lagging behind the other peers with only 754 papers indexed by Scopus in 2012.
• Unsurprisingly, the biggest research producers are displaying weaker annual average growths, like Delphos with 9.9%. The institution published 9,561 papers in 2012, 4,610 more than its closest follower, Poseidon.
• Chart 4.3 presents Client’ paper output in contrast with the peer group taken as a whole from 2008 to 2012. In 2008, Client was clearly one of the lowest producers, with fewer than 1,000 ([SAMPLE]) publications and below the group average (around 2,500 papers). However, there has been a positive evolution in this area, which can be seen in the chart. Client has witnessed a growth of approximately 67% between 2008 and 2012, more than the growth average for the peer group (41%). Its overall output represented 15.2% of the top producer, which is a slight improvement considering that this figure was 11.9% in 2008.
• Chart 4.4 present a similar chart, but for citations. As citation rates for older papers tend to be naturally higher, the results have been standardised to 100 in order to provide meaningful information and a clearer visualisation. Client made good progress from 2008 until 2012, narrowing the gap to the group average citation rate year after year. It should be considered, as expected, that 2012 included the lowest citation rate for all the peers. As the 2012 papers are still relatively ‘immature’, no conclusive remarks can be made from them. It is encouraging, however, that the overall trend has been positive for Client over the analysed period.
Chart 4.2 - Papers Output / 2008-2012 / Client and Selected Peers
SAMPLE REPORT This is an abbreviated sample of the
full benchmarking report.

Copyright © 2014 QS Intelligence Unit22
Papers and Citations by Faculty Area
Charts 4.5 and 4.6 display the distribution of total papers and citations by broad faculty area. They depict the dominance of the Natural Sciences faculty for this peer group.
Key findings include:
• Chart 4.5 demonstrates that [SAMPLE] is Client’ most productive field, accounting for 54.6% of the institution’s research output indexed by Scopus. Natural Sciences is the second best, at 24.2%.
• As shown in Chart 4.6, when citations are considered the Life Sciences & Medicine field slightly decreases its relevance for Client, accounting for almost 47.1% of the institution’s overall results. Inversely, the Natural Sciences demonstrates a slightly higher proportion at 34.1%. The Engineering & Technology faculty area, which represents 17.8% of the institution’s papers, accounts for 14.2% of its citations.
• As is the case for Client, several peers in this group rely mainly on the Life Sciences & Medicine faculty in terms
of paper production. This is particularly true for Delphos, Apollo, Zeus, Hermes and Poseidon. In all these cases, this faculty area contributed over 40% of the entire research output. Delphos is the most extreme case, with 48.7% of its papers relating to this field.
• Interestingly, for all institutions with the exception of Client, the Life Sciences & Medicine field increases its citation relevance. This field is attracting the highest proportion of citations for Client, Apollo, Hermes, Zeus, Atlantis, Delphos and Poseidon.
• Inversely, the Engineering & Technology decreases its citation relevance in most cases when citations are considered. For example, this faculty area represents 28.7% of Zeus’s papers, and 20.2% of its citations.
• Engineering & Technology is the dominant faculty area for Athena (43.0%) and Demeter (41.5%) in terms of papers output. However, these two institutions display a mostly balanced profile when citations are considered.
• Natural Sciences is also a standout area for both Athena and Demeter, representing 32.1% and 35.4% of their papers, and around 33.2% and 37.4% of their citation bases.
• Atlantis presents a more balanced profile in its research output but Engineering & Technology is still the prevalent area, accounting for 32.1% of papers. However, Life Sciences & Medicine is the dominant faculty when it comes to citations.
• Social Sciences & Management is not a significant area for any of the selected peers, although this field represents 3.5% of Demeter’s research output and 2.8% of Client’ and Apollo’s. This field represents only 1.9% of Client’ citations bases.
• Arts & Humanities provides only a marginal contribution for all the selected peers.
Chart 4.5 - Papers by Faculty Area (proportion) / 2008-2012 / Client and Selected Peers
SAMPLE REPORT This is an abbreviated sample of the
full benchmarking report.

Benchmarking Service - Sample Report 23
Research Impact (Citations per Paper)
The charts on this page break down the Citations per Paper indicator into five broad subject areas (those used for the rankings). This ratio provides an average impact of the research efforts conducted by the institutions. It is also a proxy for research quality.
Key findings include:
• Overall (Chart 4.7a), Client displays the highest impact at 4.4 citations per paper. Delphos and Hermes follow closely at 4.1 and 4.2, while Poseidon comes fourth with 4.0 citations per paper produced. Atlantis is fifth with 3.2 citations.
• The remaining peers (Apollo, Athena, Demeter and Zeus) achieved between .3 and 2.5 citations per paper, a relatively low ratio from a global perspective. Zeus
and Demeter are clearly the institutions requiring the most improvement in this area.
• Conversely, Client’s performance is remarkable, outperforming big research producers such as Delphos and Poseidon. It demonstrates that institutions do not need to be big research producers to attract citations, when paper quality takes precedence over quantity.
• Arts & Humanities (Chart 4.7b) shows a very low citation impact for the peer group. Interestingly, Athena shows the highest research impact at 2.1, while Poseidon and Client follow at 1.5 and 1.5 respectively. All the other peers display less than one citation per paper in this area.
• The Engineering & Technology field (Chart 4.7c) is clearly led by Client with 5.1 citations per paper. It is worth noting Ewha is producing the lowest number of papers ([SAMPLE]). Its closest follower, Delphos, only achieved a ratio of 3.5. Hermes, Poseidon and Atlantis show comparable performances, averaging around 3 citations per paper (indexed by Scopus from 2008 to 2012).
• Life Sciences & Medicine (Chart 4.7d) delivers a higher average citations count per paper for the selected group. In general, papers in a medical field reach their citation peak much earlier than those in social sciences. Delphos is the stand-out institution in this field, with a rate of 4.7 citations per publication.
Chart 4.7a - Overall Chart 4.7b - Arts & Humanities
Charts 4.7a to 4.7f - Research Impact (Citations per Paper) - Client and Selected Peers
Chart 4.7c - Engineering & Technology Chart 4.7d - Life Sciences & Medicine
SAMPLE REPORT This is an abbreviated sample of the
full benchmarking report.

Copyright © 2014 QS Intelligence Unit24
This module seeks to shed light on the Academic Reputation indicator, which draws on responses from the global academic community in order to evaluate institutions. The Academic Reputation Index is the centrepiece of the QS World University Rankings®, carrying a weighting of 40%. It is an approach to international university evaluation that QS pioneered in 2004 and is the component that attracts the greatest interest and scrutiny. Together with the Employer Reputation Index, it sets the QS Ranking most clearly apart from any other.
Arguably, QS carries out the most extensive annual academic survey in the world. In 2013, [SAMPLE] academics contributed their opinion on the top institutions globally, an increase of more than [SAMPLE] over the previous year. Of these respondents, [SAMPLE]% have more than ten years of experience in academia. Furthermore, some [SAMPLE]% indicated their job title to be Professor/Associate Professor, Head of Department, or a more senior position such as President and Vice-Chancellor. Those that considered themselves experts in Country A represented [SAMPLE]% of the total responses received. For a full breakdown of survey respondents, please review Appendix III: Survey Results.
The survey has evolved since 2004 but largely follows the same general principles. It asks each respondent to specify their knowledge at the outset and then adapts the survey format based on their responses. Academics are asked to identify the leading universities for research within their field and region of expertise. After drawing up this basic profile, respondents can make entries, selecting from a comprehensive interactive list. They are asked to identify up to ten domestic and 30 international institutions. Their own institution, if it would otherwise be included, is excluded from the presented list.
To boost the size and stability of the sample, QS combines responses from the last three years; where any respondent has replied more than once in the three-year period, previous responses are discarded in favour of the latest numbers.
Since 2006, institutions have been invited to submit lists of employers for the QS Intelligence Unit (QSIU) to invite to
participate in the Employer Survey. In 2010, that invitation was also extended to lists of academics. Since they are not allowed to submit in favour of their own institution, the risk of bias is minimal. Nonetheless, submissions are screened and sampling applied where any institution submits more than 400 records.
Wherever sampling is required, respondents are selected randomly with a focus on delivering a balanced sample by discipline and geography. Naturally, all databases carry a certain amount of ‘noise’ and email invitations do get passed on. Prior to analysis, responses are screened to remove any deemed inappropriate.
It is important to consider that institutions are not allowed to independently promote participation in QS surveys, nor to solicit
or coach specific responses from expected respondents to any survey contributing to any QS ranking.
The QSIU research continues to expand and diversify its response levels, not only across disciplines but also across countries that have, hitherto, been underrepresented. As response levels grow, so will the playing field for competition.
Academic performance by faculty areaChart 5.1 shows the percentage of responses received from each faculty area for the 2013 results. It should be considered that respondents can identify multiple faculty areas as an area of specification.
Academic ReputationModule 5
Chart 5.1 - Academic Reputation response rate by faculty area - Year 2013
SAMPLE REPORT This is an abbreviated sample of the
full benchmarking report.

Benchmarking Service - Sample Report 25
Domestic and International PerformanceIn 2008, the two survey components of the Rankings evolved slightly with the intention of distinguishing international from domestic responses. The first step was to run analyses of previous years’ responses to understand at what weighting domestic and international responses ought to be recombined. Based on the results of this analysis, combined with some expert input, these weightings have been set at 85/15 for the Academic Reputation review and 70/30 for the Employer Reputation survey—each in favour of the international response levels. This, after all, is a world ranking.
Chart 5.2 shows Client’ total number of nominations broken down by domestic and international peers. These results indicate that Client is very focused on domestic reputation and needs to improve its international reputation.
As shown in Chart 5.3, the top country nominating Client are [SAMPLE].
The charts on the following pages show the results of the nominations. The “a” horizontal bar charts indicate the proportion of the overall faculty score that is attributed to international and domestic responses; the maximum score an institution can receive is 100. These charts reflect the weighting which has been applied to domestic responses. The “b” vertical bar charts highlight performance in the domestic sphere and indicate the percentage of the overall possible domestic response rate achieved in each country.
Chart 5.3 - Client’ Academic Reputation: Top Nominating Countries - Year 2013
Chart 5.2 - Client’ Academic Nominations by Origin - Year 2013
SAMPLE REPORT This is an abbreviated sample of the full benchmarking report.

Copyright © 2014 QS Intelligence Unit26
Arts & Humanities• Chart 5.4a shows the score in the
Academic Reputation indicator broken down by the domestic and international component. Delphos is clearly the leading institution among the selected peers with a strong international profile (almost 70% of its overall score is explained by international nominations). Delphos achieved a score of [SAMPLE] out of a possible 100, 42% more than its closest peer, Atlantis. In 2013, Delphos was ranked [SAMPLE] in the Academic Reputation rankings for Arts & Humanities.
• Atlantis and Poseidon achieved similar international scores (approximately 16.7). However, Atlantis reached a slightly higher domestic score, which enabled the institution to reach a world rank of [SAMPLE] in this field, while Poseidon is placed at [SAMPLE].
• Hermes’s profile is relatively balanced, with 46% of its overall score explained by domestic responses. The institution is ranked [SAMPLE], its best result for all five faculty areas.
• Client is the fifth best performing peer, ranked at [SAMPLE]. Interestingly, this is the best result for Client in all five faculty areas, whereas this is a rather weak area in terms of research output. Also notable is the strong international performance achieved by Client: almost 68% of its score is achieved by international nominations.
• Apollo and Demeter are ranked [SAMPLE] and [SAMPLE] respectively. Apollo’s international score is slightly higher than Demeter’s (8.4 against 8.1).
• The two remaining institutions perform outside the top 400.
Chart 5.4a - Academic Reputation - International & Domestic Scores Arts & Humanities
Chart 5.4b - Academic Nominations - Proportion of Domestic Responses Arts & Humanities
SAMPLE REPORT This is an abbreviated sample of the full benchmarking report.

Benchmarking Service - Sample Report 27
Engineering & Technology • Engineering & Technology is not an
area of academic reputation strength for Client. The institution achieved a score of just 4.6/100, the lowest among the selected peers.
• As shown in Chart 5.5a, Delphos easily leads the peer group with a strong international performance which represents over 75% of its overall score. The rest of the peers is clearly lagging behind Delphos’s remarkable overall score. In 2013 it achieved a world rank of [SAMPLE] in Academic Reputation for Engineering & Technology, a rank similar to its overall rank.
• Poseidon, Delphos’s closest follower, achieved an overall score of 17.2/100, over 20 points behind Delphos. Poseidon is ranked [SAMPLE], nine places above Atlantis ([SAMPLE]).
• Hermes and Athena are both ranked in the 200-300 range. Both institutions display a similar international component at approximately 56%.
• All the remaining peers perform outside the top [SAMPLE].
• Apollo achieved a higher international score than Demeter, but the latter institution has a better domestic reputation, leading to a higher overall score. Apollo is placed at [SAMPLE], ten places below Demeter.
• Zeus is ranked [SAMPLE], with a score of 6.3/100. Client displays the lowest rank at 1218, by far its weakest performance in all five faculty areas. This is in contrast with the relatively high research impact Client achieved in this faculty area (the best ratio amongst the selected peers).
Chart 5.5a - Academic Reputation - International & Domestic Scores Engineering & Technology
Chart 5.5b - Academic Nominations - Proportion of Domestic Responses Engineering & Technology
SAMPLE REPORT This is an abbreviated sample of the full benchmarking report.
Copyright © 2014 QS Intelligence Unit28
OUR MISSION
To enable motivated people around the world to fulfil their potential by fostering
international mobility, educational achievement and career development.
www.qs.com
QS with offices in: London, Paris, Singapore, Stuttgart, Boston, Johannesburg, Shanghai, Sydney, Washington DC, New York