benchmarking quality-dependent and cost-sensitive score ...salah/poh09benchmarking.pdf · towards...
TRANSCRIPT

1
Benchmarking Quality-dependent and Cost-sensitive
Score-level Multimodal Biometric Fusion
AlgorithmsNorman Poh, Thirimachos Bourlai, Josef Kittler, Lorene Allano, Fernando Alonso-Fernandez, Onkar Ambekar,
John Baker, Bernadette Dorizzi, Omolara Fatukasi, Julian Fierrez, Harald Ganster, Javier Ortega-Garcia, Donald
Maurer, Albert Ali Salah, Tobias Scheidat and Claus Vielhauer
Abstract— Automatically verifying the identity of a person bymeans of biometrics (e.g., face and fingerprint) is an importantapplication in our day-to-day activities such as accessing bankingservices and security control in airports. To increase the systemreliability, several biometric devices are often used. Such acombined system is known as a multimodal biometric system.This paper reports a benchmarking study carried out withinthe framework the Biosecure DS2 (Access Control) evaluationcampaign organized by the University of Surrey, involvingface, fingerprint and iris biometrics for person authentication,targeting the application of physical access control in a medium-size establishment with some 500 persons. While multimodalbiometrics is a well investigated subject in the literature, thereexists no benchmark for a fusion algorithm comparison. Workingtowards this goal, we designed two sets of experiments: quality-dependent and cost-sensitive evaluation. The quality-dependentevaluation aims at assessing how well fusion algorithms can per-form under changing quality of raw biometric images principallydue to change of devices. The cost-sensitive evaluation, on theother hand, investigates how well a fusion algorithm can performgiven restricted computation and in the presence of softwareand hardware failures, resulting in errors such as failure toacquire and failure to match. Since multiple capturing devicesare available, a fusion algorithm should be able to handle thisnon-ideal but nevertheless realistic scenario. In both evaluations,each fusion algorithm is provided with scores from each biometriccomparison subsystem as well as the quality measures of boththe template and the query data. The response to the callof the evaluation campaign proved very encouraging, with thesubmission of 22 fusion systems. To the best of our knowledge,this campaign is the first attempt to benchmark quality-basedmultimodal fusion algorithms. In the presence of changing imagequality which may be due to a change of acquisition devicesand/or device capturing configurations, we observe that the topperforming fusion algorithms are those that exploit automaticallyderived quality measurements. Our evaluation also suggests thatwhile using all the available biometric sensors can definitelyincrease the fusion performance, this comes at the expense ofincreased cost in terms of acquisition time, computation time,the physical cost of hardware and its maintenance cost. Asdemonstrated in our experiments, a promising solution whichminimizes the composite cost is sequential fusion, where afusion algorithm sequentially uses match scores until a desiredconfidence is reached, or until all the match scores are exhausted,before outputting the final combined score.
Index Terms— multimodal biometric authentication, biometricdatabase, quality-based fusion, cost-sensitive fusion
The organizers of the evaluation are with CVSSP, FEPS, University ofSurrey, Guildford, Surrey, GU2 7XH, U.K. E-mail: [email protected],[email protected], [email protected]
I. INTRODUCTION
A. Multimodal Biometric Systems
In order to improve confidence in verifying the identity of
individuals seeking access to physical or virtual locations, both
government and commercial organizations are implementing
more secure personal identification (ID) systems. Designing
a highly secure and accurate personal identification system
has always been a central goal in the security business. This
challenge can be met by resorting to multimodal biometric
systems [1], [2], [3] with the aim of increasing the security as
well as identification performance. The multimodal biometrics
aproach can be extended by explicitly considering the sample
quality of the input biometric signals and weighting the various
pieces of evidence based on objective measures of quality
of the biometric traits. This formulation of the multimodal
biometrics fusion problem is called quality-based fusion. It is
a research topic of increasing importance.
B. State-of-the-Art in Quality-based Fusion
The first known work on quality-based multimodal biomet-
rics is [4], which presented the problem under a framework
of Bayesian statistics. The result was an Expert Conciliation
scheme including weighting factors not only for the relative
accuracy of the experts but also for the confidence of the
experts regarding the scores for particular input samples. The
idea of relating sample confidence values to actual quality
measures of the input biometric signals was also introduced in
that work, but nevertheless not experimentally studied, under
the same framework, until [5]. The first experimental study
on quality-based fusion was limited to the use of a chimeric
bimodal database (where biometric traits of different persons
are combined to form a virtual identity), with the use of quality
measures manually generated by a human expert. A follow-
up work by the same researchers overcame the experimental
limitation and provided a more realistic experimental setup to
show the benefits of incorporating quality-based information
in standard fusion approaches based on discriminative [6], and
generative learning [7].
The concept of confidence of matching scores was consid-
ered in [8]. In that work the authors demonstrated the merit
of using measures of confidence in fusion. This research line
was further developed in [9], where confidence measures based

2
on the margin between impostor and client score distributions
were developed.
Another research direction in quality-based fusion reported
in the literature is based on clustering [10]. In this work, qual-
ity measures obtained directly from the input biometric signals
were used to fuzzify the scores provided by the different
component biometric systems. The authors demonstrated that
fuzzy versions of k-means and Vector Quantization including
the quality measures tended to outperform the standard non-
fuzzy clustering methods. This work, to the best of our
knowledge, is the first one reporting experimental results of
quality-based fusion.
A more recent effort in quality-based fusion was reported
in [11] where the authors developed a scheme based on
polynomial functions. Quality measures were introduced in the
optimization problem for training the polynomials as weights
in the regularization term.
Other recent advances in quality-based fusion for multi-
modal biometrics are based on the following concepts: logistic
regression with quality measures as features [12], Bayesian
credence [13], Bayesian belief networks with quality measures
as inputs [14], and joint score and quality classifiers using the
likelihood ratio test [15], [16].
C. Motivation
The motivation for carrying out this study is as follows:
• The need for benchmarking quality-based fusion: While
there there are quite a few papers on quality-based fusion,
e.g.,[4], [5], [6], [12], [13], [16], to the best of our
knowledge, there exists no benchmark database on which
these algorithms can be compared and on which real
progress can be measured. Note that although the ex-
istence of multimodal corpora is a necessary prerequisite
of benchmarking multimodal and multi-algorithmic (i.e
employing different algorithms on the same biometric
data) fusion algorithms, it is not sufficient. For instance, it
is not straight forward to compare two fusion algorithms
in the case where each algorithm relies on its own set
of biometric subsystems. This is because an observed
improvement of a particular fusion algorithm may be due
to the superior performance of its biometric subsystems
rather than the merits of the fusion process itself. There
is therefore a need for benchmarking fusion algorithms
on a common ground, e.g., using the same biometric
match scores for the score-level fusion, or some common
features for the feature-level fusion.
• The cost implications: While using more biometric de-
vices and/or samples can increase the system perfor-
mance, as demonstrated in [17], [18], [1] (and references
therein) and elsewhere in the literature, such improvement
often comes at the expense of acquiring more data, and,
therefore, incurring more processing time, and, adding the
cost of hardware and its maintenance. All these aspects
add up to much higher global operating costs. In this
study, the abstract concept of cost is formally defined
and is used to assess multimodal biometric fusion against
such cost.
• System robustness: We expect that using more biometric
systems/devices can increase the robustness of the com-
bined system against spurious verification errors (false
acceptance and false rejection) of any single subsys-
tem/device, e.g., [1] and references therein. In addition
such a combined multimodal system can also robustly
handle software or operational failures such as failure-
to-extract or failure-to-match, or even hardware failure
(complete breakdown), resulting in invalid or missing
match scores. The latter property has not been thoroughly
investigated.
D. Cost Sensitive and Quality-based Fusion Evaluation Cam-
paign
The above aspirations have been addressed by designing
a benchmark database and organizing an evaluation campaign
using the database. Seven teams participated in our evaluation,
and altogether, they submitted 22 fusion algorithms.
The campaign was divided into two parts: quality-dependent
evaluation and cost-sensitive evaluation. The first challenge
was to evaluate quality-dependent fusion algorithms whereas
the second involved evaluating conventional fusion algorithms.
In both cases, we considered also the possibility of investigat-
ing two further sub-problems. The first one involved client-
specific or user-dependent fusion where one can train a fusion
classifier that is tailored to each identity claim, see e.g., [19]
and [20] for a more comprehensive survey. The second was
concerned with handling missing information. For instance,
when one or more biometric subsystems are not operational
due to failure to acquire or failure to match a biometric sample,
we require the fusion system to be able to output a combined
score. This is feasible because the sub-system match scores
contain redundant information (i.e., each can be seen as a
support for the same hypothesis although their actual values
may be in different ranges).
An obvious disadvantage of score-level fusion is that, by
using only scores, a lot of precious non-class discrimina-
tory information is lost, e.g., the quality of raw biometric
signal. Here are two examples: a person’s face can change
drastically with illness, diet, or age, as well as with the
application of cosmetics, a change in hair color or style,
or a sun tan; and a person’s voice can differ significantly
with congestion caused by a cold. This information is non-
class discriminatory because it cannot be used to distinguish
different individuals. Quality measures are expected to provide
measurements designed to capture these changes in ways that
could usefully be exploited in the fusion process. In this sense,
quality measures should in theory compensate for the loss of
information without sacrificing the practical advantage offered
by score-level fusion. In practice, however, tapping the quality
information, which is non-class discriminatory in nature, in
order to improve the classification performance, is not a trivial
problem.
In a cost-sensitive evaluation scheme, one considers a fusion
task as an optimization problem whose goal is to achieve
the highest performance (as a function of false acceptance
and false rejection decisions) at a desired minimum cost. We

3
refer to “cost” as the price paid for acquiring and processing
information, e.g., requesting samples from the same device or
using more biometric devices (which entails longer processing
time). In this situation, a decision can be made even if
not all the subsystem match scores are observed. Therefore,
the proposed cost-based evaluation effectively considers the
redundancy of multimodal or multi-algorithmic information.
This subject has not been adequately addressed in the literature
on multimodal biometrics such as [18], [17], [1] because in
the work, it is assumed that all the match scores are available.
E. Contributions
The contribution of this paper is multi-fold:
• Benchmark for multimodal biometric quality-based fu-
sion: Thanks to the participation of seven teams, the
Biosecure multimodal biometric evaluation campaign re-
ceived 22 fusion systems for comparison. To the best of
our knowledge, this is the first time such a comparison
has been carried out.
• Cost-sensitive and robustness evaluation: We formally
introduce the problem of cost-sensitive evaluation of
multimodal fusion algorithms. Normally, the common
assumption behind multimodal biometric fusion is that all
match scores are observed. However, in reality, as match
scores and quality measurements are generated, failures to
extract or to match can occur. Such failures are common
especially when biometric templates and query samples
are acquired using different devices.
• Sequential fusion: This novel approach takes match scores
into account sequentially until a desired level of con-
fidence is reached, or until all the match scores are
exhausted. The algorithm is ideally suited to minimize the
cost of multimodal biometrics by dynamically controlling
the number of matching performed.
• A benchmark database of multimodal biometric score
and quality measures: The data sets used to benchmark
fusion algorithms has been made publicly available at
“http://face.ee.surrey.ac.uk/fusion”. The most similar ef-
fort to our attempt is the XM2VTS score-level fusion
benchmark data set [21]. However, the latter does not
contain any quality measures for each biometric modality.
F. Paper Organization
The paper is organized as follows: Section II categorizes and
summarizes the submitted classifiers. The Biosecure DS2 data
set (with score and quality measures) is detailed in Section III.
Section IV explains the two evaluation protocols. The results
of the evaluation can be found in Section V. This is followed
by conclusions in Section VI.
II. BRIEF DESCRIPTION OF SUBMITTED SYSTEMS
This evaluation involves 22 submissions of fusion systems
from seven sites. We will begin by introducing a common
notation and then describing the submitted fusion algorithms
using this notation. A complete list of the systems is shown
in Table I.
A. Classifier Categorization and Notation
Let yi ∈ R be the output of the i-th biometric subsystem
and let there be N biometric subsystem outputs, i.e., i ∈{1, . . . , N}. For simplicity, we denote y = [yi, . . . , yN ]′,where the symbol“′” is the matrix transpose operator. The
most commonly used fusion classifier in the literature takes
the following form:
f : y → ycom (1)
where ycom ∈ R is a combined score. We shall refer to
this classifier throughout this report as conventional fusion
classifier.
If the function f takes into consideration the signal quality,
then f is considered a quality-dependent fusion classifier.
Let the signal quality of the i-th biometric subsystem be
represented by a vector of Li measurements, qi ∈ RLi . Note
that different biometric subsystems may have different number
of quality measures Li. For simplicity, we denote q as a
concatenation of all qi’s, i.e., q = [q′1, . . . ,q′
N ]′. The function
f in this case takes the following form:
f : y,q → ycom (2)
Any fusion classifier can be categorized into one of the two
forms just mentioned.
The function f can be a generative or a discriminative
classifier. In the former case, class-dependent densities are first
estimated and decisions are taken using the Bayes rule or the
Dempster-Shafer theory. In the latter, the decision boundary is
directly estimated. A common characteristic of both types of
classifiers is that the dependency among observations (scores
or quality measures) is considered.
There exists also another approach that we will refer to
as the transformation-based approach [22] which constructs
a fusion classifier in two stages. In the first stage, the match
scores of each biometric subsystem are independently trans-
formed into a comparable range, e.g., in the range [0, 1]. In the
second stage, the resulting normalized scores of all biometric
subsystems are combined using a fixed rule such as sum or
product [23]. The transformation-based fusion classifier based
on the sum rule, for instance, has the following form:
ycom =∑
i
fnormi (yi) (3)
where fnormi is the transformation function of the i-th bio-
metric subsystem output. The one using the product rule
can be realized by replacing the sum (∑
i) in (3) with a
product (∏
i). For product fusion, the normalised scores have
to satisfy certain properties (i.e., being non-negative and in
a given range). The same applies to the minimum (mini),the maximum (maxi) and the median rules, i.e., taking the
minimum, the maximum and the median of the transformed
values, respectively. These approaches have been investigated
in [22]. Among the fixed rules, the sum rule is commonly
found to be the most effective in many applications. By
interpretting the classifier outputs as probabilities, Kittler et
al. [23] showed that the sum rule is resilient to errors affecting
the individual classifier outputs. An intuitive explanation is that

4
by summing two variables (regardless of whether the output
is probability or not), the resultant summed variable will have
smaller variance than the average variance of the individual
variables. The extent of the reduction of variance of the
combined variable (fusion output) depends on the dependency
(correlation) among the variables (classifier outputs) contribut-
ing to the sum. Using the average rule (which defers from sum
by a negligible constant factor), the relationship between the
correlation among the constituent classifier outputs and the
fusion classifier performance was clarified by Poh and Bengio
in [24].
In each of the above three cases, the following decision
function can be used:
decision(y) =
{
accept if ycom > ∆reject otherwise,
(4)
where ∆ is a global decision threshold. We replace ∆ with
∆j for the j-th user if the decision threshold is client-specific.
In some of our discussions, it will be convenient not to
distinguish between the conventional and quality dependent
fusion classifiers. This will be achieved by using common
notation. In particular, for the conventional classifier, this can
be further described by the feature vector xi, which is defined
as xi ≡ yi where yi is a vector of biometric subsystem outputs
dependent on the i-th biometric modality. The feature vector
of a quality-dependent fusion classifier, on the other hand,
will take the input xi ≡ [y′i,q
′i]′ instead. Following the same
convention as before, we will write x as a concatenation of
all xi’s, i.e., x = [x′1, . . . ,x′
N ]′.In the discussion that follows, we will elaborate several
forms of f used in our evaluation. We will, however, not
discuss the algorithms in great detail but instead we shall
attempt to capture the key intuitive ideas behind the methods.
For details, the interested reader should refer to the relevant
citations.
B. Submitted Systems
1) Generative classifier estimating the posterior probabil-
ity: For the generative classifier, one can infer the probability
(or posterior probability) of being a client using the following
Bayes rule:
ycom = P (C|x) =p(x|C)P (C)
p(x|C)P (C) + p(x|I)P (I), (5)
where p(x|k) is the density of x, or a likelihood function
conditioned on the class label k which is either client or
impostor, i.e., k ∈ {C, I}, and P (k) is the prior class
probability. Being a probability, ycom is in the range [0, 1].This classifier is also known as a Bayes classifier. The Bayes
optimal decision threshold as defined in (4) is ∆ = 0.5.
Referring to Table I, the fusion classifier GET-1 and CWI-
IMOFA are of this form. In GET-1, the likelihood function
p(x|k) was estimated using a mixture of Gaussian compo-
nents, or a Gaussian Mixture Model (GMM) [25], i.e.,
p(x|k) =
Nkcmp
∑
c=1
wkcN (x|µk
c ,Σkc ), (6)
where the c-th component class-conditional (denoted by k)
mean vector is µkc and its covariance matrix is Σk
c . There are
Nkcmp components for each k = {C, I}.
In CWI-IMOFA, a mixture of factor analyzers [26] was used
instead. While the density estimated can also be written as in
(6), the number of parameters needed is effectively smaller.
This is because a factor analyzer assumes that a small num-
ber of low-dimensional latent variables (factors) z cause the
correlation that is gauged by the c-th component conditioned
on class k. Dropping the superscript k for notational economy
(since each term is conditioned on the class k), each factor
analyzer component can be described by:
x − µc = Λcz + ǫc (7)
Λc is called the factor loading matrix (for component c). This
matrix characterizes the dependency of data points on each
factor. ǫc is the Gaussian noise and is assumed to be distributed
N (0, Ψ), where Ψ is a diagonal matrix, interpreted as sensor
noise common to all components. When x is d-dimensional,
Σc is d × d, whereas with p < d factors, Λc is d × p.
If there are missing observations in x, one can still cal-
culate the marginal distribution of the observed features by
marginalizing away the missing features. For a Gaussian
mixture distribution, calculating its marginal distribution can
be achieved efficiently by manipulating the Gaussian mean and
covariance matrices [27], thereby, dispensing with the need for
explicit integration. Such an approach is implemented by the
organizer (UniS), referred to as the GMM-Bayes classifier.
In contrast to UniS’s GMM-Bayes classifier, the GET-1,
2 and 3 submissions did not deal with the missing obser-
vation using Gaussian marginals. Instead, whenever there is
a missing observation, GET’s GMM-bayes systems compute
the fused score using a transformation-based strategy. First,
each system output is normalized to the range of [0, 1] using
the empirically observed minimum and maximum value (Min-
Max normalization) [22]. Then, the average rule is used to
combine the normalized scores. Such a strategy works because
the outputs of the transformation-based fusion approach and
that of the GMM-bayes classifier are in the same range, i.e.,
[0, 1], although only the latter case can be interpretted as
probability.
The CWI-IMOFA submission dealt with the missing values
by replacing them with their corresponding median values. The
authors found experimentally (on the development set) that this
did not affect the generalization performance significantly.
2) Generative classifier using the log-likelihood ratio test:
An alternative generative approach based on the log-likelihood
ratio test, which relies on the Neyman-Pearson lemma [28],
takes the following form:
ycom = logp(x|C)
p(x|I). (8)
Its associated decision threshold (as in (4)) is optimal when
∆ = − logP (C)
P (I).
In practice, the output ycom is a real (positive or negative)
number in the range of hundreds or thousands.

5
Adopting the Naive Bayes strategy, (8) can be computed as:
ycom = log
∏
i p(xi|C)∏
i p(xi|I)=
∑
i
logp(xi|C)
p(xi|I)=
∑
i
yllri ,(9)
where we defined:
yllri ≡ log
p(xi|C)
p(xi|I).
We shall now deal with two cases: conventional fusion
where xi = yi, and quality-based fusion where xi = [q′i, yi]
′.
In the first case, the function is yi → yllri . This is a one-to-
one mapping function (for each modality), therefore, a possible
function for fnormi : yi → yllr
i (see (3)). This can be seen as a
transformation-based approach with the fusion operator being
the sum rule. Such a naive Bayes classifier was provided by
UniS.
The second (quality-dependent) case has been reported in
the literature [29]. Note that the observation vector xi =[q′
i, yi]′ has 1+ Li dimensions. This increased dimensionality,
especially in the case Li ≫ 1 (due to qi), can possibly pose
a potential estimation problem, i.e., modeling the increased
number of dimensions may be less effective as it is usually not
supported by the required exponential increase in the number
of training samples (in the worst case). In fact, there is only a
fixed number of training samples to design a fusion classifier.
Apart from the baseline naive Bayes fusion, the UniS
submission also includes a version that considers the quality
measures in its density estimation but does not suffer from
the above mentioned increased dimensionality of the [q′i, yi]
′
space. The model used here assumes that the biometric subsys-
tem outputs and the quality measures are conditionally inde-
pendent given the quality state, represented by Q. The authors
defined a quality state to be a cluster of quality measures that
are “similar” to each other [16]. The rationale of this model
is that data belonging to the same cluster of quality measures
will share the same characteristic. Therefore, it is sensible to
construct a fusion strategy for each cluster of data (of similar
quality). The consequence of this is that the complexity of the
fusion classifier now is no longer directly dependent on the
dimension of the quality measures qi, but is dependent on the
number of clusters. In their submitted implementation, these
clusters are found using a GMM model (6), but constrained
to be between one and three (as a means to control the model
complexity). The GMM parameters are estimated using the
Expectation Maximization (EM) algorithm. For each of the
biometric subsystem outputs yi, the following quality-based
normalization output is computed:
yllri = log
∑
Q p(yi|C, Q)p(Q|qi)∑
Q p(yi|I, Q)p(Q|qi), (10)
where Q denotes a cluster of quality measures. The sum over
all the quality states of Q is necessary since the quality state is
a hidden variable; only yi and qi are observed. Note that the
dimensionality involved in estimating p(yi|k, Q) is effectively
one since yi is one-dimensional and Q is a discrete variable.
The partitioning function P (Q|qi) : Li → R refers to the
posterior probability that qi belongs to the cluster Q. This term
is also known as responsibility in the GMM literature [25].
There are at least three possible ways of clustering the
quality measures:
• In the first approach, one divides the quality measures
according to the device which was used to collect the
biometric samples (from which the quality measures have
been derived). If there are Nd devices, there will be Nd
clusters of quality measures. In this case, we say that the
clusters Q are device-dependent. This approach was first
reported in [30].
• The second approach can be considered a further refine-
ment of the first approach. Since there is no guarantee
that the quality is consistent over all devices, it may be
desirable to further find the natural clustering that exists
for each device-dependent cluster of quality measures.
For the case of a single device, such a study was reported
in [16] where in order to combine several face experts
(hence intramodal fusion), a separate fusion strategy was
devised for each cluster of quality measures.
• The third approach would consider finding a natural
clustering of quality measures in a device independent
manner.
The UniS submission in Table I is based on the first approach.
Since the device is known during training (but not during
testing), instead of using EM to infer the quality state, the
quality state is probabilistically estimated, i.e., P (Q|qi) is
estimated using a supervised approach. In the implementation
of (10), the following Bayesian classifier (with equal class
priors) was used:
P (Q|qi) =p(qi|Q)
∑
Q∗
p(qi|Q∗). (11)
where the device-specific density of quality measures, p(q|Q∗)(for a given Q∗), was modeled using a GMM.
Note that the three procedures mentioned above, i.e., (9)
(including both the conventional and quality-based fusion) and
(10), output yllri for i = 1, . . . , N that are directly combined
using the sum rule (9). Hence, if a particular subsystem fails
to output any score observation, the corresponding terms in
the sum will be missing, hence not contributing to the final
output.
The submission by JHUAPL can be interpreted as a realiza-
tion of (9) (except that log was not used) and is very similar to
(10) which involves estimating the density p(yi|k, Q). Instead
of clustering Q using EM, the authors binned the data to
compute a histogram. The binning process can only work
for scalar quality measures but not for a vector of quality
measures. In order to generalize to the latter case, one must
resort to the clustering approach.
3) Generative classifier using the Dempster-Shafer Theory:
The Dempster-Shafer theory of evidence [31] attempts to
reflect uncertainty of information sources by degrees of belief.
The information sources, or frames of discernment, in our
case, refer to the class labels k = {C, I}. While in the Bayesian
theory, these two events are disjoint, in the Dempster-Shafer
theory, one considers all possible combinations, i.e., 2|k| =Ψ = {{C, I}, {C}, {I}, φ}, noting that information sources,
unlike events in the usual probability interpretation, are not

6
necessarily disjoint. However, similar to probability, only one
unit of mass is distributed among all the possible information
sources. Let m : Ai → R be the function that assigns a mass
to the information source Ai. The function m is subject to the
following constraints:
0 ≤ m(Ai) ≤ 1, Ai ∈ 2Ψ (12)
m(φ) = 0∑
Ai∈2Ψ
m(Ai) = 1
A new mass assignment, m, is then combined with the mass
distribution, mprev, derived from all previous information
sources using Dempster’s Rule of Combination , i.e., (13). The
result of this task is a new distribution, m∗, that incorporates
the joint information provided by the sources selected up to
this moment.
m∗(Ai) = (m ⊕ mprev)(Ai) =
=1
1 − Conflict
∑
Ap∩Aq=Ai
m(Ap)mprev(Aq)(13)
where
Conflict =∑
Ap∩Aq=φ
m(Ap)mprev(Aq). (14)
Note that the sum in (13) iterates over all the information
sources containing Ai. The conflict term is a normalizing
factor and displays the conflict between the new evidence and
the actual knowledge.
After selecting one information source (i.e. one biometric
score value), the mass distribution is derived in the following
way. The score value is interpreted as a percentage of certainty
that the claimed identity is true, and thus assigned to the set C
(client or genuine user). Another portion of mass is assigned
to the set containing the whole frame of discernment (15).
m({C}) = ynormi
m(Ψ) = 1 − ynormi , (15)
noting that yi are normalized into the range [0, 1]. The
combined scores can be expressed by:
ycom = mcom({C}) with mcom =⊕
i
mi (16)
where mi is the mass distribution defined according to (15),
and⊕
i denotes the application of Dempster’s rule of combi-
nation (13) for all selected biometric subsystem outputs. Note
that mi with missing observation will not participate in the
Dempster’s rule of combination. This operation is analogous
to the sum rule in probability, i.e., (9).
This submission was provided by JR (see Table I).
4) Discriminative classifier using Linear Logistic Regres-
sion: LR is defined as:
ycom ≡ P (C|x) =1
1 + exp(−g(x)), (17)
where
g(x) =
M∑
j=1
βjxj + β0, (18)
where xj ’s are elements in x. The weight parameters βj are
optimized using gradient ascent to maximize the likelihood of
the training data given the LR model [32]. It can be shown
that the following relationship is true:
g(x) = logP (C|x)
P (I|x). (19)
We shall introduce the Naive Bayes version of logistic
regression. This can be done by replacing x in (18) with xi,
recalling that xi represents the modality-dependent observa-
tion (which can be score alone, or score augmented with the
quality measures derived from the same modality). By using
the Naive Bayes assumption, one can combine gi(xi) for xi
of different modality i in the following way:
ycom =∑
i
yllri =
∑
i
gi(xi) =∑
i
logP (C|xi)
P (I|xi). (20)
The submission from UPM used a version of LR in a way
that incorporates the quality measures [33]. The fundamental
idea is to design a device-dependent score-normalization strat-
egy via LR for each device. During inference, the acquisition
device is inferred so that the score is normalized according
to the inferred device. The resulting normalized match scores
are combined using (20). In this context, the term xi in (20)
contains only the score yi and the quality measurment qi is
not used.
The device-dependent normalization procedure is defined
by:
yllri = gQ∗
(yi) (21)
where gQ is the function shown in (18) except that one such
function is created for each cluster of device-dependent quality
Q. Among all the possible states of Q (one such Q being
associated with a device), the chosen Q∗ is selected so as to
maximize P (Q|qi), the posterior probability of Q given the
quality vector qi:
Q∗ = argmaxQ
P (Q|qi)
The “Unis qfuse” submission [12] is based on the logistic
regression shown in (17) except that the vector x is a reduced
second-order polynomial expansion between the score vector
y and the quality measures q, i.e., xi ≡ [yi,q′i, (yi ⊗ qi)
′]′
where ⊗ is known as a tensor product whose output is a single
column vector. According to this operator, each element in yi
is multiplied with each element in qi. Note that the proposed
method does not take into consideration [yi×yi]′ nor [qi⊗qi]
′
in order to keep the number of parameters to be estimated
small, while at the same time allowing the model to gauge
the interaction between scores and quality measures. The final
input to the logistic regression is x = [x′1, . . . ,x′
N ]′. In so
doing, one also avoids the need to model the unnecessary
interaction among elements in yi and qj , i.e., [yi⊗qj ]′ where
i 6= j are indices of different subsystem outputs.
5) Error-based fusion classifier: The submission by
AMSL-BIO InvLW attempts to combine subsystem outputs
based on their authentication performance on the development

7
set. The fusion score is constructed as a linear combination of
matching scores, i.e.,
fcom =∑
i
fnormi (yi)wi
where fnormi : →[0, 1] is known as a score normalization
procedure and wi is the weight associated to the i-th subsystem
subject to the constraint∑
i wi = 1.
The following linear weight is used for each i-th subsys-
tem [34]:
wi =
{
eeriP
Nj=1
eerjif eeri
P
Nj=1
eerj≥ 0.5
N
0 otherwise(22)
where eeri is the equal error rate (EER) of the i-th subsystem
measured on the development score set. The first condition
ensures the subsystem whose weight is smaller than 0.5/N(recalling that N is the number of subsystems) will not
contribute to the final score because its output is considered
insufficiently useful. In order to deal with missing matching
scores, mean values of impostor and genuine score distri-
butions are calculated. A missed score is replaced with the
average of these two values.
6) UniS: Fixed Rule Quality Dependent Fusion Classifier:
The subsystem outputs y are divided into two groups: those of
higher quality and those of lower quality. Let us denote these
two groups by {yhighp } and {ylow
q }, where p ∈ {1, . . . , P}and q ∈ {1, . . . , Q} are indices of the subsystem outputs.
The idea is that one combines the groups of similar quality
(high or low) using the sum rule whereas among the groups of
different scores using the product rule. The justification is that
scores of different quality tend to disagree, implying higher
independence and so the product rule may be more effective
in this case. Similarly, scores of similar quality (high or low)
tend to agree with each other, implying higher dependence and
so the sum rule may be more effective. The resulting combined
scores can be written as:
ycom =
1
P
∑
m yhighp × 1
Q
∑
n ylowq if P > 0 and Q > 0
1
P
∑
m yhighp if Q = 0
1
Q
∑
n ylowq if P = 0
(23)
The last two cases take care of the situation where one group or
the other is not observed. A score is considered of high quality
if its corresponding quality measure is higher than qi − σqi
where qi ∈ R is a quality measure, qi is the average of qi and
σqiis its standard deviation.
In case of an array of quality measures, the quality measures
are normalized using the Min-Max normalization, and the
average is computed to represent the quality measure for a
sample.
7) Other Classifiers: The list of classifiers covered here is
not meant to be exhaustive, but considers only the submitted
systems. Another submitted fusion classifier is CWI-SVM’s
Support Vector Machine (SVM), a discussion of which can
be found in [35]. SVM has also been used elsewhere in the
literature for biometric fusion, e.g., [36]. Finally, a general
survey of fusion classifiers can be found in [1].
C. Sequential Fusion
Sequential fusion is a fusion strategy where the match scores
to be combined are considered sequentially, until a certain
level of confidence is reached, or all the match scores are
exhausted. The motivation is that for most access attempts
(samples), a very few match scores are needed to reach a high
level of confidence. In contrast, samples that are classified
with low confidence are those that are found near the decision
boundary and are necessarily sparse. Since significantly fewer
number of match scores are needed, on average, for each
access attempt, the overall cost is expected to be lower.
Among the submitted systems, only CWI-IMOFA and
GET2 (cost) adopt sequential fusion strategies. In both sys-
tems, the training of the system remains the same. However,
during testing, different strategies are used. Both rely on an
upper and a lower threshold, corresponding to the desired
levels of confidence to accept a client and to reject an impostor,
respectively.
For the CWI-IMOFA method, the modalities are considered
in the following order: face, iris, fingerprint. The following
decision strategies are adopted:
• If the face or the iris is present, do not take the finger-
prints into account at all.
• If the posterior probability of observing a genuine user is
higher than the upper threshold, at any time, output that
probability and do not consider the rest of the modalities.
• If the posterior probability of observing a genuine user
is lower than a percentage of the threshold (5 per cent
in the submitted version), output that probability and do
not consider the rest of the modalities.
For the GET2 systems, the following strategy was adopted.
The face modality is used first. If a decision cannot be made,
iris or fingerprint is then used depending on the face score and
quality measures. Then, if a decision is not possible with the
two match scores (and their associated quality measures), a
third score is used and so on until the eight scores (and their
associated quality measures) are exhausted [37].
III. THE BIOSECURE DS2 DATA SET AND REFERENCE
SYSTEMS
A. The BioSecure Database as a Test Bed
In order to realize the cost sensitive and quality-based
fusion evaluations mentioned in Section I-D, we constructed
a database with scores as well as quality measures for each
access using the BioSecure multimodal biometric database1.
Since the input to all fusion algorithms is the same, they can
be compared on equal grounds. To date, there exists no similar
test bed suitable for quality-dependent fusion algorithms nor
cost-sensitive evaluation. A similar work in this direction
is [21]. However, the match scores were not supplemented
by quality measures.
The Biosecure database was collected with the aim to
integrate multi-disciplinary research efforts in biometric-based
identity authentication. Application examples of such an in-
vestigation are to meet the trust and security requirements for
1http://biometrics.it-sudparis.eu/BMEC2007

8
TABLE I
A LIST OF SUBMITTED SYSTEMS
System name Q C Characteristics
AMSL-BIO InvLW (Ref.Sec II-B.5)
× √transformation based, weighted sum rule is used with weights being inversely proportional to Equal ErrorRate empirically calculated from the development set. See [34].
AMSL-BIO QW (Ref.Sec II-B.5)
√ × transformation based, weighted sum rule is used with weights being inversely proportional to the quadraticterm of Equal Error Rate empirically calculated from the development set. See [34].
CWI SVM (Ref. [35])√ √
discriminative classifier, quality-independent, train with high quality data only
CWI IMOFA (Ref. Sec II-B.1)
√ √Bayesian classifier (generative) whose class-conditional densities are each independently estimated usingan Incremental Mixture of Factor Analyzers [26]. The classifier estimates the posterior probability of clientgiven the observed scores. It is quality-independent and uses sequential strategy with double thresholds(for cost-sensitive evaluation).
JHUAPL (Ref. Sec II-B.1)√ × Bayesian belief network (generative classifier), quality-dependent, use all available scores. See [14]
JR (Ref. Sec II-B.3)√ √
Dempster-Shafer theory of evidence. A biometric subsystem is chosen to participate in the fusion if itmaximizes the following criterion:
benefit = yi ∗ (2 − cost). (24)
where cost takes on a value of one for a different device or 0.3 for reusing the same device. Moreexplanation about the cost assignment can be found in Section IV-A.
GET 1 (Ref. Sec II-B.1)√ √
Bayesian classifier with equal class priors was used, i.e., (5) with P (C) = P (I) = 0.5. The densityp(y|k) is estimated using a mixture of Gaussian components [25]. In case of missing values, scoresare independently normalized into [0, 1] using the empirically observed minimum and maximum value,known as the Min-Max normalization [22]. The average rule is used to combine the normalized scores.See [37]
GET 2 (cost) (Ref. Sec II-B.1)
× √Similar to GET 1 (cost) except that scores are taken into account sequentially until all channels of dataare exhausted or the combined score is smaller than lower threshold or greater than a higher threshold.See [38].
GET 2 (quality)√ × Similar to GET 1 except that each fusion classifier is designed specifically for each of the four cases as
mentioned in Section IV-B.
GET 3 (quality) (Ref.Sec II-B.1)
√ × This is an enhanced version of GET 2 (quality) which also employs sequential selection of channels (asin the GET 2 cost-based system).
UniS qfixed (Ref. Sec II-B.6)
√ √transformation-based, quality-dependent, selectively switches between sum and product rule dependingon the quality measures. See [39].
UniS qfused (Ref. Sec II-B.4)
√ √logistic regression (discriminative) modeling the posterior probability of being a client given scores andquality measures as observation, i.e., P (C|y, q). See [12].
UniS Naive Bayes (Ref.Sec II-B.4)
× √Discriminative classifier, modeling
Q
iP (C|yi) where P (C|yi) is estimated using logistic regression.
See [28] for Naive Bayes and [40] for logistic regression.
UniS BNQ (Ref. Sec II-B.2)
× √Generative classifier that estimates the device identity directly (see (10)). The sum rule is used to combineall ynorm
i’s that are observed. See [30].
UPM (cost) (Ref. Sec II-B.4)
× √transformation based, with each transformation function (one for each channel of data) being a logisticregression, mapping scores into log-likelihood ratios. The max rule is used to combine the scores. See [33].
UPM (quality) (Ref.Sec II-B.4)
√ × Similar to its cost-based counterpart, except that the transformation function is device-specific for theface and device-independent for the fingerprint. The max rule is used to combine the scores. See [33].
Legend: Q = Quality-based evaluation; C = cost-sensitive evaluation√means used in quality-based and/or cost-sensitive evaluation; × means not used
AMSL-BIO is a submission from University of Magdeburg; GET from Telecom and Management SudParis (formerly GET - Institut National desTelecommunications); UPM from Universidad Politecnica de Madrid; UniS from University of Surrey; JR from Joanneum Research; CWI from Centrumvoor Wiskunde en Informatica; and JHUAPL from Johns Hopkins University Applied Physics Laboratory.
building access systems using a desktop-based or a mobile-
based platform, as well as applications over the Internet such
as tele-working and Web or remote-banking services. As long
as data collection is concerned, three scenarios have been
identified, each simulating the use of biometrics in remote-
access authentication via the Internet (termed the “Internet”
scenario), physical access control (the “desktop” scenario),
and authentication via mobile devices (the “mobile” scenario).
While the desktop scenario is used here, the proposed two
evaluation schemes can equally be applied to the remaining
two data sets.
The desktop scenario data set contains the following bio-
metric modalities: signature, face, audio-video (PINs, digits,
phrases), still face, iris, hand and fingerprint. However, only
still face, iris and fingerprint are used for the evaluation
schemes proposed here. This data set is collected from six
European sites (only four are being used at the writing of this
report). Although the data acquisition process is supervised,
the level of supervision is extremely different from site to
site.
This database contains two sessions of data separated by
about one month interval. In each session, for each subject,
two biometric samples are acquired per modality per device,
hence resulting in 4 samples per modality per device (and
per person) over the two sessions. There are several devices
for the same biometric modality. The forgery data collected
simulate PIN-reply attacks and imitation of dynamic signature
(with several minutes of practice and with the knowledge of
the signature dynamics). The volunteers are selected to have
both genders in somewhat equal proportions of ages with the
following distribution: 2/3 in the range 18–40 of age and 1/3
above 40.
Table II presents the 24 channels of data available. A
channel of data is composed of the following quadruples:
9
TABLE III
REFERENCE SYSTEMS AND QUALITY MEASURES ASSOCIATED WITH EACH
TO BIOMETRIC MODALITY
Modality Referencesystems
Quality measures
Still Face Omniperception’sAffinity SDK2
face detector;LDA-based faceverifier
face detection reliability, bright-ness, contrast, focus, bits per pixel,spatial resolution (between eyes),illumination, background unifor-mity, background brightness, spec-ular reflection, glasses, rotation inplane, rotation in depth and devia-tion from the frontal pose (all avail-able from Omniperception’s Affin-ity SDK)
Fingerprint NIST Fingerprintsystem
texture richness [41] (based on lo-cal gradient)
Iris A variant of Li-bor Masek’s irissystem
texture richness [42], difference be-tween iris and pupil diameters andproportion of iris used for matching
(biometric trait, the acquisition device of a template, the
acquisition device of a query sample, matching algorithm).
When the acquisition device used to prepare a template (during
enrollment) is different from the one used to acquire a query
sample, the matching is called cross-device matching, and
the opposite is called same-device matching. There are 17
channels of data available under the same-device matching.
For example, a left index fingerprint acquired using an optical
fingerprint sensor is considered a channel of data. Using the
notation presented in Table II, this channel of data is referred
to as “fo5”. The 17 channels of data, presented in order are
fa1, fnf1, fwf1, ir1, ir2, fo1, fo2, fo3, fo4, fo5, fo6, ft1, ft2,
ft3, ft4, ft5 and ft6. These 17 channels of data are all that
is available to perform matching of data acquired using the
same biometric device. The cross-device matching can only
be performed on the face biometric and the six fingerprints
(hence seven channels of data) because for each of these
channels of data, two devices were available. These channels
of data are prefixed with “x” (for “cross-device”). We only
considered the scenario where the template data is acquired
with high quality device whereas the query data is acquired
with one of a lower quality (post-determined by judging from
the verification performance of the devices).
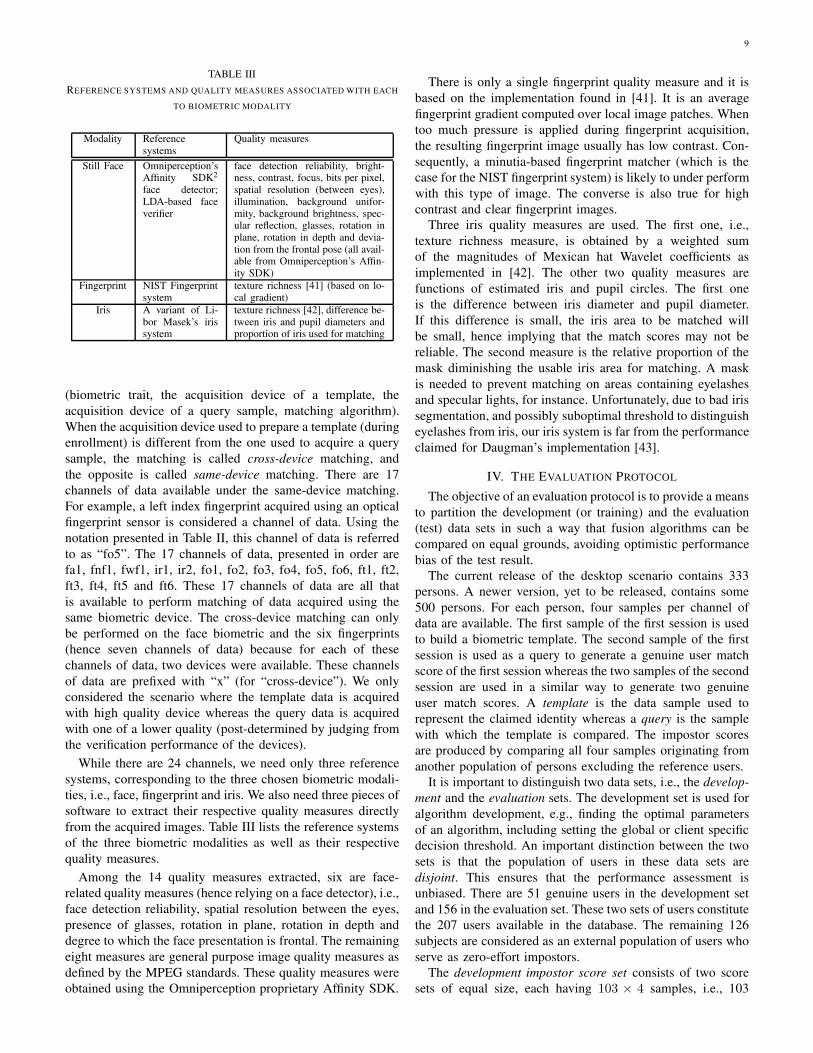
While there are 24 channels, we need only three reference
systems, corresponding to the three chosen biometric modali-
ties, i.e., face, fingerprint and iris. We also need three pieces of
software to extract their respective quality measures directly
from the acquired images. Table III lists the reference systems
of the three biometric modalities as well as their respective
quality measures.
Among the 14 quality measures extracted, six are face-
related quality measures (hence relying on a face detector), i.e.,
face detection reliability, spatial resolution between the eyes,
presence of glasses, rotation in plane, rotation in depth and
degree to which the face presentation is frontal. The remaining
eight measures are general purpose image quality measures as
defined by the MPEG standards. These quality measures were
obtained using the Omniperception proprietary Affinity SDK.
There is only a single fingerprint quality measure and it is
based on the implementation found in [41]. It is an average
fingerprint gradient computed over local image patches. When
too much pressure is applied during fingerprint acquisition,
the resulting fingerprint image usually has low contrast. Con-
sequently, a minutia-based fingerprint matcher (which is the
case for the NIST fingerprint system) is likely to under perform
with this type of image. The converse is also true for high
contrast and clear fingerprint images.
Three iris quality measures are used. The first one, i.e.,
texture richness measure, is obtained by a weighted sum
of the magnitudes of Mexican hat Wavelet coefficients as
implemented in [42]. The other two quality measures are
functions of estimated iris and pupil circles. The first one
is the difference between iris diameter and pupil diameter.
If this difference is small, the iris area to be matched will
be small, hence implying that the match scores may not be
reliable. The second measure is the relative proportion of the
mask diminishing the usable iris area for matching. A mask
is needed to prevent matching on areas containing eyelashes
and specular lights, for instance. Unfortunately, due to bad iris
segmentation, and possibly suboptimal threshold to distinguish
eyelashes from iris, our iris system is far from the performance
claimed for Daugman’s implementation [43].
IV. THE EVALUATION PROTOCOL
The objective of an evaluation protocol is to provide a means
to partition the development (or training) and the evaluation
(test) data sets in such a way that fusion algorithms can be
compared on equal grounds, avoiding optimistic performance
bias of the test result.
The current release of the desktop scenario contains 333
persons. A newer version, yet to be released, contains some
500 persons. For each person, four samples per channel of
data are available. The first sample of the first session is used
to build a biometric template. The second sample of the first
session is used as a query to generate a genuine user match
score of the first session whereas the two samples of the second
session are used in a similar way to generate two genuine
user match scores. A template is the data sample used to
represent the claimed identity whereas a query is the sample
with which the template is compared. The impostor scores
are produced by comparing all four samples originating from
another population of persons excluding the reference users.
It is important to distinguish two data sets, i.e., the develop-
ment and the evaluation sets. The development set is used for
algorithm development, e.g., finding the optimal parameters
of an algorithm, including setting the global or client specific
decision threshold. An important distinction between the two
sets is that the population of users in these data sets are
disjoint. This ensures that the performance assessment is
unbiased. There are 51 genuine users in the development set
and 156 in the evaluation set. These two sets of users constitute
the 207 users available in the database. The remaining 126
subjects are considered as an external population of users who
serve as zero-effort impostors.
The development impostor score set consists of two score
sets of equal size, each having 103 × 4 samples, i.e., 103

10
TABLE II
A LIST OF 24 CHANNELS OF MATCH SCORES) GENERATED FROM THE BIOSECURE DS2 DATABASE
Label template ID {n} Modality Template Sensor Query Sensor Remarks
fa 1 Still Face web cam web cam Frontal face images (low resolution)fnf 1 Still Face CANON CANON Frontal face images without flash (high resolution)fwf 1 Still Face CANON CANON Frontal face images with flash (high resolution)ir 1–2 Iris image LG LG 1 is left eye; 2 is right eyefo 1–6 Fingerprint Optical Optical 1/4 is right/left thumb; 2/5 is right/left index; 3/6 is right/left
middle fingerft 1–6 Fingerprint Thermal Thermal 1/4 is right/left thumb; 2/5 is right/left index; 3/6 is right/left
middle finger
xfa 1 Still Face CANON web cam Cross-device matchingxft 1–6 Fingerprint Optical Thermal Cross-device matching. 1/4 is right/left thumb; 2/5 is right/left
index; 3/6 is right/left middle finger
For example, fo2 refers to the channel of data obtained by acquiring right index fingerprints using an optical fingerprint sensor. The web cam model isPhillips SPC 900. The model of CANON digital camera is EOS 30D. The iris capturing device is LG3000. The thermal sensor acquires a fingerprint as asubject sweeps his/her finger over it. The optical sensor acquires a fingerprint impression by direct contact (no movement required). The first seven rows showsame-device matching and the last two show cross-device matching.
persons and each contributes 4 samples. These two score sets
were used in conjunction with the first- and second-session
genuine match scores, respectively. This design ensures that
the impostors used in Sessions 1 and 2 are not the same. For
instance, when training a fusion algorithm, Session 1 data can
be used to learn the parameters of the fusion classifier and
Session 2 data can be used as a validation data set. Such a
characteristic is important for algorithm development.
The evaluation impostor score set also further consists of
two data sets, each having 51 and 126 subjects set apart
as zero-effort impostors, used for Session 1 and Session 2
data, respectively. Note that the 51 “impostor subjects” of
the Session 1 evaluation set are actually genuine users in the
development data set. This does not contribute any systematic
bias when measuring the performance because the genuine
users are disjoint in both the development and evaluation data
set. The motivation for using two different impostor popula-
tions in the evaluation data sets for Sessions 1 and 2 again
is to avoid systematic and optimistic bias in assessing client-
specific fusion classifiers trained on the Session 1 data. Unlike
the common fusion classifiers reported in the literature [1]
(and references therein), client-specific fusion classifiers adapt
themselves to each genuine user or claimed identity. Under
our experimental design, these classifiers can further use the
Session 1 evaluation data for training but must use the Session
2 evaluation data for assessing the performance. Having two
different sets of impostors will thus avoid the situation where
a fusion classifier is tested on impostor data on which it has
already been trained to distinguish the impostors.
Table IV shows the partitioning of the genuine user and
impostor score sets of the development and evaluation data.
The exact number of accesses differs from that listed in this
table because of missing observations caused by the failure
of the segmentation process or other stages of the biometric
authentication system. The experimental protocol involves
minimal manual intervention. In the event of any failure, a
default score of “-999” is outputted. Similarly, a failure to
extract quality measures will result in a vector containing a
series of “-999”.
Although the desktop scenario involves supervised data
TABLE IV
THE EXPERIMENTAL PROTOCOL FOLLOWED IN ORDER TO GENERATE
MATCH SCORES FROM THE BIOSECURE DS2 DATABASE. S1/S2=SESSION
1 AND 2.
Data sets No. of match scores per persondev. set (51 persons) eva. set (156 persons)
S1 Gen 1 1Imp 103 × 4 51 × 4
S2 Gen 2 2Imp 103 × 4 126 × 4
· × · denotes persons × samples. This number should be multiplied by thenumber of persons in the above set (e.g., 51 for development set) in order toobtain the total number of accesses for the genuine or the impostor classes.
acquisition, the level of supervision differs from one collection
site to another. As a result, there exists a site-dependent bias
in terms of performance and this bias is readily observable
from the captured images for face and fingerprint biometrics.
In the following sub-sections, we shall explain the two
evaluation schemes.
A. Cost-Sensitive Evaluation
The cost-sensitive evaluation was designed with two goals:
1) to assess the robustness of a fusion algorithm when some
match scores and/or quality measures are not present;
this is typically due to failure to acquire and/or failure
to match.
2) to test how well a fusion algorithm can perform with
minimal computation and hardware cost.
Note that a “cost” can also be associated with the time
to acquire/process a biometric sample. Hence, longer time
implies higher cost, and vice versa.
Assigning a cost to a channel of data is a very subjective
issue. In this study, we adopt the following rules of thumb:
• If a device is used at least once, a fusion algorithm will be
charged a unit cost, although we are aware that in reality,
different devices may have different cost. This choice is
clearly device and task dependent.

11
• The subsequent use of the same device will be charged
0.3 of a unit in view of the fact that the same hardware
is being reused.
• A device is considered used if a fusion algorithm acquires
a sample for subsequent processing, i.e., to extract quality
measures and/or to obtain a match score. This is regard-
less of whether the resulting match score will actually
contribute to the final combined score.
Through the cost-sensitive evaluation, the design of a fusion
algorithm becomes more challenging because the task now is
to maximize the recognition performance while minimizing the
cost associated to the device usage. In this respect, there exists
two strategies to solve this problem, which can be termed as
a fixed parallel and a sequential approach. A fixed parallel
solution pre-selects a set of channels and use them for all
access requests. A sequential solution, on the other hand,
may use different channels for different access requests. The
sequence of systems used is determined dynamically.
B. Cross-device Quality-dependent Evaluation
The goal of this evaluation experiment is to assess the ability
of a fusion algorithm to select the more reliable channels of
data, given quality measures derived from biometric data. The
task is made more challenging with cross-device matching, i.e.,
a matching can occur between a biometric template acquired
using one device and a query biometric data acquired using
another device. In our case, the template data is always
acquired using a high quality device (giving better verification
performance) and the query data may be acquired using a
high or a low quality device. Note that cross device matching
occurs only in the latter case. The channels of data considered
are face and the three right fingerprints, denoted as fnf, fo1,
fo2 and fo3. In case of cross device matching, these channels
are denoted as xfa, xft1, xft2 and xft3. The development
set consisting of scores and quality measures corresponding
to all 8 channels were distributed to the participants. The
(sequestered) evaluation set, on the other hand, contains only
four channels of data as a result of mixing fnf/xfa (face
taken with a digital camera/webcam) and fo{n}/xft{n} for
all n ∈ {1, 2, 3} (optical/thermal fingerprint sensor for three
fingers; see description in Table II). These four channels of
data can be any of the following combinations:
(a) [fnf, fo1, fo2, fo3] – no device mismatch
(b) [fnf, xft1, xft2, xft3] – device mismatch for the fingerprint
sensor
(c) [xfa, fo1, fo2, fo3] – device mismatch for the face sensor
(d) [xfa, xft1, xft2, xft3] – device mismatch for both the face
and fingerprint sensors
A fusion algorithm does not know from which device a
biometric sample was acquired since the identity of the device
is unknown. This is a realistic scenario because as a biometric
technology is deployed, it may be replaced by a newer device.
Furthermore, its configuration may change, resulting in its
acquired query biometric data being significantly different
from the previously stored template data. This fusion problem
is challenging because each of the four combinations require a
different fusion strategy in order to achieve the optimal result.
C. Simulation of Failure-to-acquire and Failure-to-match Sce-
narios
For each of the above mentioned two evaluation schemes,
we also introduce a variation of the problem in order to
simulate failure-to-acquire and failure-to-match scenarios. The
motivation is to evaluate the robustness of a multimodal
biometric system with respect to both types of failures. In
principal, a multimodal system contains redundant subsystems,
each of which produces a hypothesis regarding the authenticity
of an identity claim. However, to our knowledge, such redun-
dancy has never been formally evaluated.
In order to simulate the failures, one can assume that
they are device- and subject-dependent; device- and subject-
independent; device-dependent but subject-independent; and,
device-independent but subject-dependent. Among these four
cases, we opted for the one that are both device- and subject-
independent, i.e., the failures can happen randomly and spon-
taneously. This is actually a more difficult scenario among the
four, as the failures are completely unpredictable. If they were,
one could devise the following solutions: replace a particular
device that is mulfunctioning in the device-dependent case, or
recommend a user to use a different biometric modality in the
subject-dependent case. If a fusion algorithm can withstand our
chosen scenario, the remaining three scenarios can therefore
be solved easily. Based on this rationale, we shall focus on
the device- and subject-independent case.
We shall introduce missing values only on the evaluation
data set, and not the development data set. The reason is that
the development data set is often better controlled. The missing
values are introduced for each of the genuine or impostor
match scores separately as follows: Let M be a matrix of
scores of N samples by d dimensions (corresponding to all the
d columns of match scores from d devices: face, 6 fingers and
1 iris). The total number of elements in M is d×N . Missing
values were gradually introduced by replacing T observed
values with “-999” (the dummy value denoting missing value)
in such a way that all the elements in the matrix M have equal
probability of being deleted. We varied T such that the ratio of
T/(dN) was 10%, 20%, 30% and 40% and that the subsequent
subset always contained missing values of its precedent subset.
V. EXPERIMENTAL RESULTS
Two types of errors can occur in biometric authentication:
false acceptance and false rejection. Both errors are quantified
by their respective error rates: false acceptance rate (FAR)
and false rejection rate (FRR). These rates are obtained by
counting the respective event (false acceptance or rejection) for
a given threshold. We use two derived indicators from these
two measures, namely, Equal Error Rate (EER) and Half Total
Error Rate (HTER). EER is defined as the operating point
where FAR is equal to FRR, and there is only one unique
threshold (by means of interpolating the FAR and FRR curves,
if necessary) satisfying this condition. FAR (resp. FRR) refers
to false acceptance rate (resp. false rejection rate). This rate is
calculated by counting the number of false acceptance (resp.
false rejection) instances when the claimant is an impostor
(resp. a genuine user/client/enrollee) normalized by the total

12
number of impostor (resp. client) accesses. HTER, on the other
hand, is the average of FAR and FRR. In all the evaluations,
the particular threshold leading to the reported HTER is
supplied by the participants. This threshold was determined
by satisfying the EER constraint (FAR equals FRR) on the
development data set. Hence, although a fusion system may
have a very low EER, due to badly estimated threshold, its
HTER value can still be relatively very high.
The following sections present the results of the two eval-
uation schemes.
A. Cost-Sensitive Evaluation
In the cost-sensitive evaluation, the submitted fusion sys-
tems can be divided into three types: fixed static fusion,
exhaustive fusion and sequential fusion. Fixed static fusion
uses only a subset of fixed biometric systems identified using
the development data set provided. Exhaustive fusion is a
special case of fixed static fusion that uses all the available
subsystems (eight in our case). Sequential fusion, on the
other hand, uses a variable number of systems. The order in
which the subsystems are evaluated as well as the upper and
lower thresholds (used to assess the level of confidence of a
decision) are determined on the development data set (Refer
Section II-C). Figure 1(a) shows the performance (assessed
on the evaluation set) of the baseline (unimodal) systems
(in blue), sequential fusion (green), fixed static Naive Bayes
fusion with two sensors (red) and three sensors (magenta), and
exhaustive fusion (black).
1) Baseline systems: The performance of the baseline (uni-
modal) systems exhibit somewhat higher error rates than those
recently reported in the literature. This is because first of all,
no effort has been made to fine tune the baseline systems.
For instance, contrary to what is commonly reported in the
literature, our iris baseline system has much higher error rate,
due to the sub-optimal iris segmentation algorithm as well as
relatively uncontrolled iris acquisition procedure (e.g., blurred
images were found). The second reason is that no data is
discarded. As a result, failure-to-acquire and failure-to-match
errors have already been considered when calculcating the
error. Recall that the match scores as a result of using the
errorneous samples are assigned a dummy value of “-999” –
a value low enough to cause a rejection decision in all cases.
2) Fixed static fusion systems: The performance of the
fixed static fusion systems, shown in red and magenta in
Figure 1, is that of the Naive Bayes classifiers (assuming
independence) using biometric subsystem outputs. The first
group in red consists of face and fingerprint systems (with
two fingers), resulting in a cost of 1 + 1 + 0.3 = 2.3. The
second group in magenta has a cost of 3.3, as a result of the
additional iris subsystem. The generalization error measured in
terms of HTER (for a fixed decision threshold) of the second
group is certainly not significantly better than that of the first
group.
3) Exhaustive fusion systems: On the bottom right of Fig-
ure 1 are the exhaustive fusion systems (with the maximal cost
of 4.5 unit). While the best system within this group (plotted
in black colour) did indeed achieve the lowest generalization
0.5 1 1.5 2 2.5 3 3.5 4 4.50
2
4
6
8
10
12
14
16
18
fa1
ft1
ft2
ft3
ft4
ft5
ft6ir1
cost
HT
ER
(%
)
CWI
GET 1
GET 2
JR
UniS fixed v3
UniS qfuse v3
UPM
Baseline NB01
Baseline NB02
Baseline NB03
Baseline NB04
(a) Results of cost-sensitive evaluation
Fig. 1. Performance of all submitted fusion systems participating in thecost-sensitive evaluation (each bar showing the upper and lower confidenceinterval in terms of HTER, assessed on the evaluation set). The performanceof each fusion system is plotted along with their confidence interval calculatedaccording to [44].
1 1.5 2 2.5 3 3.5 4 4.50
2
4
6
8
10
12
14
16
18
cost
EE
R (
%)
(a) Optimization with GMM-bayesclassifier
1 1.5 2 2.5 3 3.5 4 4.50
1
2
3
4
5
6
7
8
9
10
average cost per access
EE
R,
HT
ER
(%
)
cross−valid. EER (dev)
apriori HTER (eva)
aposteriori HTER (eva)
aposteriori EER (eva)
(b) Rank-one cost-performance curve
Fig. 2. (a) Optimization of UNIS GMM-bayes fusion classifier by a two-foldcross validation on the development set. (b) Rank-one performance vs averageaccess cost. This GMM-bayes system was provided by the organizer.
error, most of the systems are only marginally better than the
two fixed static fusion systems.
The task of designing a fusion classifier transforms to the
one of choosing the best fusion candidate for a given cost
on the development set in the hope that the chosen fusion
candidate can generalize on the (sequestered) evaluation set.
Since there is a mismatch between the development and
evaluation set in terms of population of enrolled (genuine)
users as well as impostors, and their respective sizes (hence a
change in class priors), the design of a fusion classifier was
fairly challenging.
In order to optimise the performance for a given cost, one
typically has to consider all possible combinations of fusion
candidates. Doing so requires one to perform 28 − 1 = 255combinations of fusion candidates (minus one for the empty
set), and the the 255 combinations can have only 18 unique
costs, ranging from 1 (considering only one channel of data)
to 4.5 (all eight channels). In the reported evaluation exercise,
the participants had the right to submit as many fusion
systems/candidates as possible. However, no explicit request
was made to the participants to provide a solution for each
of the possible costs. Doing so would end up in 18 solutions
for each participanting team – an impractical proposition from

13
0.1 0.2 0.5 1 2 5 10 20 40 60
0.1
0.2
0.5
1
2
5
10
20
40
60
FAR [%]
FR
R [%
]
DET
GET 1
JR
UniS fixed v3
AMSL−BIO InvLW
UPM
Fig. 3. Performance of exhaustive fusion systems
the organizer’s view point. It turned out that each participating
team in the end provided only one fusion system optimizing
the most expensive cost, i.e., the exhaustive fusion system
(with 4.5 unit of cost).
Although the UPM and JR submissions contain some chan-
nel selection, the selection process makes use of the quality
information. Even if the acquired sample is not subsequently
used for matching (due to its low quality), both methods are
considered exhaustive fusion.
In order to obtain HTER, each participant had to provide a
decision threshold. As can be observed, some of the submitted
decision thresholds were not optimal. For instance, the thresh-
old of the AMSL-BIO InvLW system was so sub-optimal that
it resulted in 50% HTER.
Given correctly estimated decision thresholds, the remaining
exhaustive fusion algorithms can now be compared on equal
grounds. The top three solutions are GET1, UPM, Unis qfuse.
These three systems share a common characteristic: they are
trainable fusion classifiers. GET1 is a GMM-bayes classifier,
hence generative in nature. UPM and Unis qfuse are discrim-
initive classifiers, both based on their own implementation of
logistic regression. In theory, both generative and discrimina-
tive approaches are equally powerful, given correctly estimated
parameters. In practice, however, their performance may differ
due to different implementation, resulting in different estimates
of model parameters. The analysis of the DET curves of the
exhaustive systems show that for this data set, GET 1 is the
best fusion classifier, as shown in Figure 33.
4) Post-experimental Analysis: The exhaustive fusion, in
general, has the best performance (lowest HTER) among the
three different types of fusion strategies. However, it also
3The DET curve of AMSL-BIO InvLW is included for comparison.Although its HTER was evaluted to be 50% due to bad threshold setting, theactual EER would be around 4.5%. Also the DET curve of UNIS-qfuse couldnot be plotted because its genuine match scores contain only 3 values lessthan 0.0002, nine values more than 0.9101, and in between these two valuesfound {0.0937, 0.3637}. Such discontinuity makes it virtually impossible tovisualize the DET curve.
entails a higher average cost per access. Such a trend is not
readily observable in Figure 1. As the organizer (UniS) of the
competition, we shall introduce a post-experimental analysis,
analyzing performance spanning all possible fusion candidates.
The GMM-Bayes fusion classifier was trained on the entire
score feature space (a total of 8 dimensions). It was then tested
on all the 255 combinations of the score feature space by
means of Gaussian marginalization (as discussed in Section II-
B.1). Missing values were handled in the same way. For
instance, if features 1, 2, and 4 are chosen, and 4 is missing,
then the UNIS GMM-bayes will calculate the final combined
score using only features 1 and 24.
The GMM-Bayes classifier was preferred over the Naive
Bayes classifier for the post-experimental analysis (as reported
in Section V-A.2) because there is a strong correlation among
the genuine match scores of different fingers of the same sub-
ject (as high as 0.6), whereas the correlation among different
biometric modalities (e.g., face versus iris) is close to zero. In
all cases, no correlation is observed for the impostor match
scores. The GMM-Bayes fusion classifier is thus better suited
for these 255 fusion tasks.
In order to estimate the fusion performance using only the
development set (recalling that the evaluation scores were
sequestered), we employed a two-fold cross-validation. The
resultant performance, measured in terms of averaged EER
of the two folds, across all 255 combinations, is shown in
Figure 2(a). Plotted in this figure are the median (red), the
upper and lower quantiles (cyan and green lines resp.), and,
the upper and lower range (in purple and blue lines) of
performance in HTER for a given cost. Note that there is only
one possible way to obtain a cost of 2.5, i.e., by combining all
6 fingers, hence explaining the convergence of performance to
a single point. Among these curve, the lowest one (in blue) is
the most important one because the goal here is find a fusion
candidate that has the lowest error at a given cost.
The performance versus cost curves presented in Figure 2(b)
are called “rank-one” cost-performance curve. This means
that only the performance of the best fusion candidate (using
the GMM-Bayes classifier) is reported. In a rank-two curve,
one would choose the minimum of the top two performing
candidates to plot the curve, and etc. Three of the four curves
were computed on the evaluation set and only one on the
development set. The latter is plotted here (in blue) in order
to show the actual performance optimized on the development
set via the two-fold cross validation. The reported error is the
average EER of the two folds. The EER measure (rather than
HTER) is more suitable in this context so that the performance
is independent of the choice of the decision threshold. The
remaining three curves are explained below:
1) a priori HTER: This rank-one curve (plotted in red)
shows the achievable generalization performance if one
were to use the fusion candidates minimizing a given
cost, based on the development set, via cross-validation.
2) a posteriori HTER: This rank-one curve (plotted in
green) shows the actual performance in terms of HTER
4Due to the way the missing values are handled, this classifier is differentfrom the GET system.

14
of the fusion candidate on the evaluation set. The
assumption here is that the evaluation set is available
but the optimial decision threshold is unknown.
3) a posteriori EER: Finally, this rank-one curve (plotted
in black) is similar to the previous one, reporting the
performance of the fusion candidate optimizing a given
cost on the evaluation set, except that it also assumes
that the optimal threshold is known. This curve is hence
reported in EER.
When optimizing a fusion classifier without any knowledge
of the evaluation set (in the sequested scenario), the best
performance one can obtain is the first (a priori) curve. This
curve is directly comparable with the performance submitted
by the participants (shown in Figure 1).
The second and third (rank-one) curves are not achievable;
they are shown here in order to show the oracle cases, where
the evaluation set is available for the second curve; and on top
of that, the optimal decision threshold is known for the third
curve. As can be observed, by injecting more information, the
error actually decreases from the first to the second curve; and,
from the second to the third curve.
These curves show that the actual achievable fusion per-
formance is dependent on two factors: the fusion candidate
and the (correct) decision threshold. Choosing the correct
candidate given only the development set requires a criterion
yielding a solution that can generalize well across populations.
In [45], the authors demonstrated that such a criterion can
be effectively realised using parametric error bounds such
as the Chernoff and Bhattacharya bounds [28], rather than
computing the EER of the fusion performance empirically, as
commonly practised. Error bounds, however, do assume that
the underlying scores are normally distributed and therefore,
pre-processing is recommended to ensure the conformity of the
data to this assumption. In practice, it was observed in [45]
that even if the underlying multivariate distribution is not
strictly Gaussian (as measured by the standard Gaussianity
tests), the estimated bound is still better (in terms of rank-
one performance-cost curve) than the empirical estimates of
error (via cross-validation on the development set) for fusion
candidate selection.
5) Further Analysis of Dynamic Fusion: This section anal-
yses the robustness of the dynamic fusion systems. According
to Figure 1, the two sequential fusion classifiers (in green), i.e.,
CWI and GET 2, are only slightly better than the unimodal
subsystems. However, taking the cost into consideration, as
these two systems rely, most of the time, on a single modality
(hence giving a cost of slightly more than one unit), the
solution they offer is preferrable.
The real advantage of the two sequential fusion classifiers
can be more readily appreciated under failure-to-acquire and
failure-to-match, which are simulated by deleting entries, as
described in Section IV-C. Figure 4 shows the performance
of different fusion systems on data sets with 0%-40% missing
values given in terms of standard deviation of HTER5. In order
to measure the variation in performance, we also measured
5The data set with “0%” missing value is the original data set, which itselfactually contains some missing values.
0 1 2 3 4 5 6 7
CWI
GET 2
Baseline NB01
Baseline NB03
Baseline NB02
Baseline NB04
GET 1
JR
UniS fixed v3
UniS qfuse v3
UniS qfuse v3
UPM
std. dev. of HTER (%)
Fig. 4. Performance variation, in terms of standard deviation of HTER, forto 0% to 40% missing observations, simulating failure-to-acquire and failure-to-match scenarios.
the variance of performance of each system on the five data
sets (with missing values). The result is shown in Figure 4(b).
As can be observed, despite the missing information, the
performance of CWI and GET 2 remains very stable, with
only ±1% of HTER. Comparatively, the unimodal systems
vary by ±6% of HTER under the same scenario.
With missing values, systems with low number of sub-
systems, such as the fixed static systems (the baseline naive
bayes systems), fluctuate in performance, i.e., with at least
±4% of HTER. In comparison, most of the exhaustive fusion
algorithms have performance fluctuation of around ±1.5% of
HTER, with the exception of the JR system, which has ±3.8%of HTER.
B. Cross-device Quality-dependent Evaluation
For the cross-device quality dependent evaluation, we first
assessed the baseline performance of the four channels of data,
i.e., fnf1/xfa1, fo1/xft1, fo2/xft2 and fo3/xft3, where fnf1/xfa1
means that in this channel of data, the query face images are
captured by the digital camera (fnf1) or a web-cam (xfa1). The
fnf1 channel has a higher image quality than the xfa1 channel.
The template images were captured using the digital camera.
Matching the template with the xfa{n} is considered a cross-
device matching. Recall that fo{n} means fingerprint images
captured using an optical sensor whereas xft{n} means the
same subjects, but the data acquired using a thermal sensor by
sliding a finger over the sensor. An ideal fusion system should
consider from which device the query images are captured
and use the right fusion strategy given only scores and quality
measures.
Figure 5 shows the baseline performance of the biometric
subsystems (prior to fusion). Similar to the cost-sensitive
evaluation, here, an increasing number of entries of the data
are deleted, resulting in the proportion of missing data between
0% to up to 40%. The access requests with missing observa-
tions of scores/quality measures are automatically rejected by
the system. As a result, as the proportion of missing data is
increased, more and more false rejections of genuine accesses
occur, resulting in increased EER.

15
0 2 4 6 8 105
10
15
20
25
30
35
Proportion of missing data [%]
EE
R [
%]
fnf1/xfa1fo1/xft1
fo2/xft2fo3/xft3
Fig. 5. Performance of biometric subsystems
The fusion performance of the submitted systems is shown
in Figure 6(a). In this assessment, all the observable channels
of data are used, contrary to the cost-sensitive evaluation.
Our focus here is to assess how well a fusion system can
perform with changing image quality and in the presence
of increasing number of missing observations. As can be
observed, the top two systems are UniS BNq and UPM. These
systems are device-specific, meaning that they first estimate
how probable the channel of data is from the observed quality
measures and then use the corresponding device-dependent
fusion function. The next best system is GET 1, which is
a Bayesian classifier whose class-conditional densities are
estimated using a mixture of Gaussian components. This
system does not use the quality measures provided and so does
not change its fusion strategy under cross-device matching.
Some of the systems that actually use the quality measures
are not among the best systems because they did not use the
right threshold. Such is the case for JHUAPL. To assess the
performance independently of decision threshold, we plotted
the DET curves of all the systems with the original data
set (prior to introducing any missing data) in Figure 6(b).
Here, the JHUAPL fusion system performs very well for
low FRRs whereas UniS-BNq dominates for low FARs. The
winning systems are those that exploit the quality information.
This experiment shows that quality measures can be used to
mitigate the effect of cross-device mismatch in the context of
multimodal biometrics.
C. Future Research Issues
The following are some important future research issues to
be considered:
• Quality-based fusion within a single device: The cur-
rent benchmarking effort is limited to the context of
varying levels of biometric quality due to cross-device
matching. Other factors that can affect the quality of bio-
metric samples are the user interaction and the acquisition
environment, as exemplified by Alonso et al.’s study for
the fingerprint modality [46]. A recent work [47] demon-
strated that, indeed, exploiting the quality variation within
a single device, as well as the variation between devices
0 5 10 15 20 25 30 35
7
8
9
10
11
12
13
14
15
proportion of missing data [%]
HT
ER
(%
)
CWI SVM
CWI IMOFA high thrd
CWI IMOFA
JHUAPL
JR
UniS fixed
UniS qfuse
AMSL−BIO QW
UniS BNq
GET 1
GET 2
GET 3
UPM
(a) Fusion system performance versus proportion of missingdata
0.1 0.2 0.5 1 2 5 10 20 40 60
0.1
0.2
0.5
1
2
5
10
20
40
60
FAR [%]
FR
R [
%]
DET
CWI SVM
CWI IMOFA high thrd
CWI IMOFA
JHUAPL
JR
UniS fixed
UniS qfuse
AMSL−BIO QW
UniS BNq
GET 1
GET 2
GET 3
UPM
(b) Fusion system performance in DET
Fig. 6. While (a) shows the performance of fusion system in HTER (witha priori chosen threshold on the provided development set) when some datais missing, (b) shows only the DET curves when no data is deleted.
can improve the generalization performance under cross
device matching much more significantly
• More quality measures: The current data set is limited
in the number of quality measures available. A direct ex-
tension is to introduce more quality measures, especially
the fingerprint ones, e.g., [46]
• Sequential fusion: The potential of sequential fusion has
not been fully explored. The current strategy to select the
next most informative fusion candidate is very heuristic.
Furthermore, a principled method for the selection of the
upper and lower thresholds (determined by the level of
desired confidence) is also needed.
VI. CONCLUSIONS
The BioSecure DS2 multimodal evaluation campaign aimed
at assessing fusion algorithms under restricted computational
resources, possible hardware failures and changing image
quality. For the purpose of evaluation, a data set consisting
of match scores and quality measures was carefully designed
in order to benchmark multimodal fusion algorithms. This

16
data set was constructed for the application of physical access
control of a medium-sized establishment (from some 300 to
500 users). This campaign gathered 22 fusion algorithms, all
evaluated using the same generated data set. The evaluated
fusion algorithms are very diverse, including generative clas-
sifiers, e.g., Bayesian belief network, Bayesian classifiers and
Dempster-Shafer theory of evidence; discriminative classifiers,
e.g., support vector machines and logistic regression; and
transformation-based classifier combiners (where biometric
subsystem outputs are normalized individually and then com-
bined using fixed fusion rules such as sum or product).
Our findings suggest that, while using all the available
biometric sensors can definitely increase the fusion perfor-
mance, such benefit comes at the expense of acquisition time,
computation time and the cost associated with installing the
physical hardware and its maintenance cost. A promising
solution which does not increase this compounded cost is
sequential fusion, as demonstrated in our experiments. A
sequential fusion strategy only outputs the final combined
match score as soon as sufficient confidence is attained, or
when all the match scores available are exhausted. It saves
computational cost because for most access requests, only
a few biometric subsystems are needed. In the presence of
changing image quality, which may be due to change of
acquisition devices and/or device capturing configurations, we
observe that the top performing fusion algorithms are those
that exploit the automatically extracted biometric trait quality
measures in order to identify the most probable biometric
device from which the query biometric data was derived.
ACKNOWLEDGMENTS
This evaluation was made possible thanks to the EU funding
from the following projects: BioSecure (www.biosecure.info)
and Mobio (www.mobioproject.org). The participating teams
are supported by their respective national fund bodies:
the Dutch BSIK/BRICKS project and the Spanish project
TEC2006-13141-C03-03. Author NP is supported by Ad-
vanced Researcher Fellowship PA0022 121477 of the Swiss
National Science Foundation. Author F. A.-F. thanks Conse-
jeria de Educacion de la Comunidad de Madrid and Fondo
Social Europeo for supporting his PhD studies. Author J. F.
is supported by a Marie Curie fellowship from the European
Commission.
REFERENCES
[1] A. Ross, K. Nandakumar, and A.K. Jain, Handbook of Multibiometrics,Springer Verlag, 2006.
[2] C. Sanderson, Automatic Person Verification Using Speech and FaceInformation, Ph.D. thesis, Griffith University, Queensland, Australia,2002.
[3] K. Nandakumar, Integration of M]ultiple Cues in Biometric Systems,Ph.D. thesis, Michigan State University, 2005.
[4] E. S. Bigun, J. Bigun, B. DUC, and S. Fischer, “Expert conciliation formultimodal person authentication systems using bayesian statistics,” in1st Int’l. Conf. Audio- and Video-Based Biometric Person Authentication
(AVBPA 1997), Crans-Montana, 1997, pp. 291–300.
[5] J. Bigun, J. Fierrez-Aguilar, J. Ortega-Garcia, and J. Gonzalez-Rodriguez, “Multimodal Biometric Authentication using Quality Signalsin Mobile Communnications,” in 12th Int’l Conf. on Image Analysis and
Processing, Mantova, 2003, pp. 2–13.
[6] J. Fierrez-Aguilar, J. Ortega-Garcia, J. Gonzalez-Rodriguez, and J. Bi-gun, “Discriminative multimodal biometric authentication based onquality measures,” Pattern Recognition, vol. 38, no. 5, pp. 777–779,2005.
[7] H. Fronthaler, K. Kollreider, J. Bigun, J. Fierrez, F. Alonso-Fernandez,J. Ortega-Garcia, and J. Gonzalez-Rodriguez, “Fingerprint image-qualityestimation and its application to multialgorithm verification,” IEEE
Trans. on Information Forensics and Security, vol. 3, pp. 331–338, 2008.
[8] S. Bengio, C. Marcel, S. Marcel, and J. Marithoz, “Confidence Measuresfor Multimodal Identity Verification,” Information Fusion, vol. 3, no.4, pp. 267–276, 2002.
[9] N. Poh and S. Bengio, “Improving Fusion with Margin-DerivedConfidence in Biometric Authentication Tasks,” in LNCS 3546, 5thInt’l. Conf. Audio- and Video-Based Biometric Person Authentication
(AVBPA 2005), New York, 2005, pp. 474–483.
[10] V. Chatzis, A. G. Bors, and I. Pitas, “Multimodal decision-levelfusion for person authentication,” IEEE Trans. on System, Man, and
Cybernetics, part A, vol. 29, no. 6, pp. 674–680, 1999.
[11] K-A. Toh, W-Y. Yau, E. Lim, L. Chen, and C-H. Ng., “Fusion ofAuxiliary Information for Multimodal Biometric Authentication,” inLNCS 3072, Int’l Conf. on Biometric Authentication (ICBA), Hong Kong,2004, pp. 678–685.
[12] J. Kittler, N. Poh, O. Fatukasi, K. Messer, K. Kryszczuk, J. Richiardi,and A. Drygajlo, “Quality Dependent Fusion of Intramodal andMultimodal Biometric Experts,” in Proc. of SPIE Defense and Security
Symposium, Workshop on Biometric Technology for Human Identifica-
tion, 2007, vol. 6539.
[13] K. Kryszczuk and A. Drygajlo, “Credence estimation and error predic-tion in biometric identity verification,” Signal Processing, vol. 88, pp.916–925, 2008.
[14] D. E. Maurer and J. P. Baker, “Fusing multimodal biometrics withquality estimates via a bayesian belief network,” Pattern Recognition,vol. 41, no. 3, pp. 821–832, 2007.
[15] K. Nandakumar, Y. Chen, S. C. Dass, and A. K. Jain, “Likelihood ratiobased biometric score fusion,” IEEE Trans. on Pattern Analysis and
Machine Intelligence, vol. 30, pp. 342–347, 2008.
[16] N. Poh, G. Heusch, and J. Kittler, “On Combination of Face Authenti-cation Experts by a Mixture of Quality Dependent Fusion Classifiers,”in LNCS 4472, Multiple Classifiers System (MCS), Prague, 2007, pp.344–356.
[17] N. Poh and S. Bengio, “Non-Linear Variance Reduction Techniques inBiometric Authentication,” in Workshop on Multimodal User Authenti-
cation (MMUA 2003), Santa Barbara, 2003, pp. 123–130.
[18] R. Snelick, U. Uludag, A. Mink, M. Indovina, and A. Jain, “Large ScaleEvaluation of Multimodal Biometric Authentication Using State-of-the-Art Systems,” IEEE Trans. Pattern Analysis and Machine Intelligence,vol. 27, no. 3, pp. 450–455, 2005.
[19] A. Jain and A. Ross, “Learning User-Specific Parameters in Multibio-metric System,” in Proc. Int’l Conf. of Image Processing (ICIP 2002),New York, 2002, pp. 57–70.
[20] N. Poh and J. Kittler, “Incorporating Variation of Model-specific ScoreDistribution in Speaker Verification Systems,” IEEE Transactions on
Audio, Speech and Language Processing, vol. 16, no. 3, pp. 594–606,2008.
[21] N. Poh and S. Bengio, “Database, Protocol and Tools for EvaluatingScore-Level Fusion Algorithms in Biometric Authentication,” Pattern
Recognition, vol. 39, no. 2, pp. 223–233, February 2005.
[22] A. Jain, K. Nandakumar, and A. Ross, “Score Normalisation inMultimodal Biometric Systems,” Pattern Recognition, vol. 38, no. 12,pp. 2270–2285, 2005.
[23] J. Kittler, M. Hatef, R. P.W. Duin, and J. Matas, “On CombiningClassifiers,” IEEE Trans. Pattern Analysis and Machine Intelligence,vol. 20, no. 3, pp. 226–239, 1998.
[24] N. Poh and S. Bengio, “How Do Correlation and Variance of BaseClassifiers Affect Fusion in Biometric Authentication Tasks?,” IEEETrans. Signal Processing, vol. 53, no. 11, pp. 4384–4396, 2005.
[25] C. Bishop, Neural Networks for Pattern Recognition, Oxford UniversityPress, 1999.
[26] A.A. Salah and E. Alpaydın, “Incremental Mixtures of Factor Anal-ysers,” Proceedings of the Pattern Recognition, 17th International
Conference on (ICPR’04) Volume 1-Volume 01, pp. 276–279, 2004.
[27] A. C. Morris, M. P. Cooke, and P. D. Green, “Some Solutions to theMissing Features Problem in Data Classification with Application toNoise Robust Automatic Speech Recognition,” in IEEE Int’l Conf.Acoustics, Speech, and Signal Processing (ICASSP), Seattle, 1998, pp.737–740.

17
[28] R. O. Duda, P. E. Hart, and D. G. Stork, Pattern Classification and
Scene Analysis, John Wiley and Sons, New York, 2001.
[29] S. Dass, K. Nandakumar, and A. Jain, “A Principled Approach to ScoreLevel Fusion in Multimodal Biometric Systems,” in 5th Int’l. Conf.Audio- and Video-Based Biometric Person Authentication (AVBPA 2005),New York, 2005, pp. 1049–1058.
[30] N. Poh, T. Bourlai, and J. Kittler, “Improving Biometric DeviceInteroperability by Likelihood Ratio-based Quality Dependent ScoreNormalization,” in accepted for publication in IEEE Conference on
Biometrics: Theory, Applications and Systems, Washington, D.C., 2007,pp. 1–5.
[31] A.P. Dempster, “A generalization of Bayesian inference,” J. Royal
Statist. Soc., ser. B, vol. 30, pp. 205–247, 1968.
[32] A. J. Dobson, An Introduction to Generalized Linear Models, CRCPress, 1990.
[33] F Alonso-Fernandez, J. Fierrez, D. Ramos, and J. Ortega-Garcia, “Deal-ing with sensor interoperability in multi-biometrics: The upm experienceat the biosecure multimodal evaluation 2007,” in Proc. of SPIE Defense
and Security Symposium, Workshop on Biometric Technology for Human
Identification, 2008.
[34] T. Scheidat, C. Vielhauer, and J. Dittmann, “Distance-level fusionstrategies for online signature verification,” in Proceedings of the IEEE
International Conference on Multimedia and Expo (ICME), 2005.
[35] V. N. Vapnik, Statistical Learning Theory, Springer, 1998.
[36] M. Vatsa, R. Singh, A. Ross, and A. Noore, “Likelihood ratio in a svmframework: Fusing linear and non-linear face classifiers,” Computer
Vision and Pattern Recognition Workshops, 2008. CVPRW ’08. IEEEComputer Society Conference on, pp. 1–6, June 2008.
[37] L. Allano, A. C. Morris, H. Sellahewa, S. Garcia-Salicetti, J. Koreman,S. Jassim, B. Ly-Van, D. Wu, and B. Dorizzi, “Non intrusive multi-biometrics on a mobile device: a comparison of fusion techniques,” inProc. of SPIE: Biometric Techniques for Human Identification III, 2006.
[38] L. Allano, S. Garcia-Salicetti, and B. Dorizzi, “An adaptive multi-biometric incremental fusion strategy in the context of bmec 2007,”in ICARCV, 2008, pp. 1144–1149.
[39] O. Fatukasi, J. Kittler, and N. Poh, “Quality Controlled MultimodalFusion of Biometric Experts,” in 12th Iberoamerican Congress on
Pattern Recognition CIARP, Via del Mar-Valparaiso, Chile, 2007, pp.881–890.
[40] T. Hastie, R. Tibshirani, and J. Friedman, The Elements of StatisticalLearning, Springer-Verlag, 2001.
[41] Y. Chen, S.C. Dass, and A.K. Jain, “Fingerprint Quality Indices forPredicting Authentication Performance,” in LNCS 3546, 5th Int’l. Conf.Audio- and Video-Based Biometric Person Authentication (AVBPA 2005),New York, 2005, pp. 160–170.
[42] Y. Chen, S. Dass, and A. Jain, “Localized iris image quality using 2-dwavelets,” in Proc. Int’l Conf. on Biometrics (ICB), Hong Kong, 2006,pp. 373–381.
[43] J. Daugman, How Iris Recognition Works, chapter 6, Kluwer Publishers,1999.
[44] S. Bengio and J. Marithoz, “The Expected Performance Curve: a NewAssessment Measure for Person Authentication,” in The Speaker and
Language Recognition Workshop (Odyssey), Toledo, 2004, pp. 279–284.
[45] N. Poh and J. Kittler, “On Using Error Bounds to Optimize Cost-sensitive Multimodal Biometric Authentication,” in Proc. 17th Int’l
Conf. Pattern Recognition (ICPR), 2008.
[46] F. Alonso-Fernandez, J. Fierrez, J. Ortega-Garcia, J. Gonzalez-Rodriguez, H. Fronthaler, K. Kollreider, and J. Bigun, “A comparativestudy of fingerprint image-quality estimation methods,” IEEE Trans. onInformation Forensics and Security, vol. 2, no. 4, pp. 734–743, 2007.
[47] N. Poh and J. Kittler, “A Family of Methods for Quality-basedMultimodal Biometric Fusion using Generative Classifiers,” in IEEE
10th International Conference on Control, Automation, Robotics andVision (ICARCV), Hanoi, 2008, pp. 1162–1167.
Norman Poh received a PhD (2006) in Computer Science
from the Swiss Federal Institute of technology in Lausanne
(EPFL), Switzerland. He then worked with Prof. Josef Kittler
as a post-doctoral researcher at CVSSP, University of Surrey
(UniS). Since 2009, he is a research fellow, leading the
EU-funded Mobile biometry project at UniS. His areas of
expertise are multiple classifier systems, pattern recognition
and biometrics.
Thirimachos Bourlai received a Ph.D. (2006) in Electr. &
Computer Engineering from the University of Surrey, U.K.
There he continued working with Prof. Josef Kittler as a Post-
Doc until (Aug. 2007). He then worked as a Research Fellow
in a joint project between the University of Houston and the
Methodist Hospital, Texas, U.S.A. Since Feb. 2009 he is a
Visiting Research Assistant Professor at the biometrics center
of West Virginia University, U.S.A. His areas of expertise are
image processing, pattern recognition and biometrics.
Josef Kittler graduated from the University of Cambridge in
Electrical Engineering in 1971 where he also obtained his
Ph.D. in Pattern Recognition in 1974 and the Sc.D. degree
in 1991. Since 1986 he is a Professor in charge of the Centre
for Vision Speech and Signal Processing, University of Surrey,
U.K. He published more than 200 papers, co-authored a book,
and he is a member of the Editorial Boards of various IEEE
Transactions. His current research interests include Pattern
Recognition, Neural Networks, Image Processing and Com-
puter Vision.
Lorene Allano received a PhD (2009) in Computer Science
from the Institut National des Tlcommunications (France),
for her work on multi-biometrics. She then moved to CEA
(Commissariat L’nergie Atomique, France) within the LIMA
laboratory (Laboratoire Intelligence Multi-capteurs et Appren-
tissage). Her areas of expertise are multiple classifier systems,
pattern recognition, data mining and biometrics.
Fernando Alonso-Fernandez received the PhD degree
(Hons.) in Electrical Engineering from the Universidad Po-
litecnica de Madrid, Spain, in 2008. Since 2004, he is with
Universidad Autonoma de Madrid in Spain, where he currently
holds a Juan de la Cierva Postdoctoral Fellowship of the
Spanish MCINN. http://atvs.ii.uam.es
Onkar Ambekar received his BE in Instrumentation from
B.A.M. University,India, in 2000, and his MS in Sensor
System Technology from University of Applied Sciences in
Karlsruhe, Germany in 2004. He has worked in Germany and
Austria on object detection and tracking for vehicle guidance,
and holds a patent in this area. He is currently a PhD student
at the CWI institute in Amsterdam.
John Baker received a MSEE from Johns Hopkins University
(1994). He is a member of the Johns Hopkins University
Applied Physics Laboratory, where he is engaged in research
and development of biometric sensing and fusion methods.
Bernadette Dorizzi got her PhD (These d’etat) in Theoretical
Physics at the University of Orsay (Paris XI-France) in 1983.
She is Professor at TELECOM & Management SudParis
(Institut TELECOM) since September 1989, at the head of
the Electronics and Physics department since 1995 where she
is in charge of the Intermedia (Interaction for Multimedia)
research team. She is coordinator of the BioSecure Association
(http://biosecure.info). http://biometrics.it-sudparis.eu
Omolara Fatukasi received her PhD degree in Electr. &
Computer Engineering from the University of Surrey, U.K.
Her areas of expertise are in multimodal biometric fusion and
pattern recognition.
Julian Fierrez received the PhD degree in telecommunica-
tions engineering from the Universidad Politecnica de Madrid,
Spain, in 2006. Since 2002 he is affiliated with Universidad

18
Autonoma de Madrid in Spain, where he currently holds a
Marie Curie Postdoctoral Fellowship, part of which has been
spent as a visiting researcher at Michigan State University in
USA. http://atvs.ii.uam.es
Harald Ganster received his PhD degree with distinction
in Technical Mathematics in 1999 from the University of
Technology Graz, Austria. He is currently with the Institute of
Digital Image Processing at Joanneum Research in Graz and is
responsible for the field of biometrics. http://www.joanneum.at
Javier Ortega-Garcia received the Ph.D. degree “cum laude”
in electrical engineering in 1996 from Universidad Politecnica
de Madrid, Spain. Dr. Ortega-Garcia is founder and co-director
of the Biometric Recognition Group - ATVS. He is currently a
Full Professor at the Escuela Politecnica Superior, Universidad
Autonoma de Madrid. http://atvs.ii.uam.es
Donald Maurer received his PhD in Mathematics from
California Institute of Technology (1969). He is a member
of the Johns Hopkins University Applied Physics Laboratory,
where he develops algorithms for sensor data fusion and target
discrimination.
Albert Ali Salah received his PhD at the Perceptual Intel-
ligence Laboratory of Bogazici University, and joined the
Signals and Images research group at the Centre for Math-
ematics and Computer Science (CWI) in Amsterdam. His
research interests are biologically inspired models of learning
and vision, with applications to pattern recognition, biometrics
and ambient intelligence. With his work on facial feature lo-
calization, he received the inaugural EBF European Biometrics
Research Award in 2006.
Tobias Scheidat received his M.Sc. degree in Computer Sci-
ence in 2005 from the Otto-von-Guericke-University Magde-
burg, Germany. Since 2003 he works in the biometric re-
search group of the Advanced Multimedia and Security Lab
(AMSL) at Otto-von-Guericke University Magdeburg. Besides
the online handwriting his research interests is focused on
multi-biometric fusion, biometric hashing, the evaluation of
biometric systems and meta data in context of biometrics.
Claus Vielhauer is a full professor (2007) for IT Security at
Brandenburg University of Applied Sciences and the leader
of the biometric research group at the Advanced Multimedia
and Security Lab at Otto-von-Guericke University Magdeburg
(2003). Formerly, he received both M.Sc. And Ph.D. degrees
from Technical University Darmstadt, where he had been a
member of the Multimedia Communications Lab research
group of Prof. Ralf Steinmetz. His main research interests
cover the areas of IT and media security and forensics,
biometrics and human-computer interaction and he has been
performing research and management in numerous EU- and
non-EU funded research projects such as BioSecure.