benchmarking of irrigation projects in...
TRANSCRIPT
Report onBENCHMARKING OF IRRIGATION PROJECTS
IN MAHARASHTRA 2003-04
WATER RESOURCES DEPARTMENTGOVERNMENT OF MAHARASHTRA,INDIA
MARCH 2005

REPORT ON BENCHMARKING OF IRRIGATION
PROJECTS IN MAHARASHTRA 2003-04
***
WATER RESOURCES DEPARTMENT GOVERNMENT OF MAHARASHTRA,
MARCH 2005

C O N T E N T S
Sr.No.
Description Page No.
1 Chapter – 1 : Preface 1
2 Chapter – 2 : Benchmarking of Irrigation Projects 14
3 Chapter – 3 : Performance Indicators 18
4 Chapter – 4 : Observations & Conclusions. 22
5 Appendix I - Annual Irrigation Water supply per unit irrigated area for Major, Medium & Minor Projects.
34
6 Appendix II - Potential created and utilised for Major, Medium & Minor Projects.
37
7 Appendix III - Output per unit irrigated area for Major, Medium & Minor projects
40
8 Appendix IV - Output per unit irrigation water supply for Major, Medium & Minor projects
43
9 Appendix V - Cost Recovery Ratio for Major, Medium & Minor projects
46
10 Appendix VI - Total O & M Cost per unit Area for Major, Medium & Minor projects
49
11 Appendix VII - Total O & M Cost per unit of Water Supplied for Major, Medium & Minor projects
52
12 Appendix VIII - Revenue per unit of Water Supplied for Major, Medium & Minor Projects
55
13 Appendix IX - Mandays for O & M per unit Area for Major, Medium & Minor projects
58
14 Appendix X - Land Damage Index for Major & Medium projects 61
15 Appendix XI - Equity performance for Major, Medium & Minor projects
63
16 Appendix XII-A (Irr.) - Assessment Recovery ratio (Irrigation) for Major, Medium & Minor projects
69
17 Appendix XII-B (Non Irr.) - Assessment Recovery ratio (Non Irrigation) for Major, Medium & Minor projects
72
18 Appendix XIII – Overview of projects selected for benchmarking. 75
19 Appendix XIV - Physiography & Agro Climatic zones of Maharashtra 89
20 Appendix XV - Abstract of Water rates for irrigation, domestic & industrial use.
93
21 Appendix XVI - Data for benchmarking report 2003-04 for Major Projects.
94
22 Appendix XVII - State target values for indicators. 107
23 Appendix XVIII - Abstract of guide lines issued by GOM for benchmarking of Irrigation Projects – 2003-04
110
24 Benchmarking of WALMI, Aurangabad 111

FOREW0RD
Benchmarking of irrigation projects is widely accepted world over now. IPTRID, ICID, IWMI, World Bank & FAO advocate use of benchmarking for improving performance of irrigation projects. Evaluation of performance of Irrigation Projects in Australia, China, Egypt, Malaysia, Srilanka and India is being done using benchmarking as a management tool for last few years. Benchmarking is not merely performance assessment but it helps in identifying levels of performance & undertaking corrective measures.
Benchmarking in the public sector in general & the irrigation sector in particular is a more complex task as it is subject to site-specific characteristics. Benchmarking is found beneficial in following respects.
a) From management point of view
i) Better knowledge of system ii) Better management of resources (water, manpower & finances) iii) Policy making in Water Resources Development & Management
b) Service provision point of view
i) Efficiency, transparency & accountability to users ii) Commitment to excellence in service provision
c) User point of view
i) Develop confidence about the service ii) Enhance agricultural production
iii) Effective participation in management of irrigation projects
This is the third consecutive report on Benchmarking of Irrigation projects in the State. Comments received on previous reports are considered while preparing this report.
In addition to performance evaluation, the report provides data of 49 major projects in respect of twelve indicators.
Benchmarking has further disseminated to middle & lower levels of administration & evaluation of performance is being carried out at respective levels.
Benchmarking is considered as an on going process and it has now become the part of strategic management of the department. The department through its experience of last two years could identify best performing circles & healthy competition is taking place between irrigation management circles for improvement in their performance.
It would be worthwhile to mention the efforts taken by Dr. S. M. Belsare, Under Secretary WRD, GOM, G. V. Vyawahare & P. V. Mannikar Executive Engineers, MWIC and their colleagues who have taken whole hearted efforts in preparing this report.
I would like to express thanks to Director General, WALMI, Aurangabad for getting this report printed at Aurangabad.
Comments & suggestions on this report would be highly appreciated.


ABBREVIATIONS
Avg Per Average performance
BCM Billion Cubic Metre
CAD Command Area Development
CBIP Central Board of Irrigation & Power
CCA Culturable Command Area
CRT Converted Regular Temporary
DIRD Directorate of Irrigation Research & Development
FAO Food & Ariculture Organisation
FY Avg Five years average
GCA Gross Command Area
GOI Government of India
GOM Government of Maharashtra
ha Hectare
ICID International Commission on Irrigation & Drainage
IMD Indian Meteorological Department
INCID Indian National Committee on Irrigation & Drainage
IPTRID International Programme for Technology and Research in Irrigation and Drainage
IWMI International Water Management Institute
m Metre
M Cum Million Cubic metre
Mha Million Hectare
mm Millimetre
Mm3 Million Cubic Metre
MWIC Maharashtra Water & Irrigation Commission
O & M Operation & Maintenance
Past Max Maximum value observed in Past
Past Min Minimum value observed in Past
PIM Participatory Irrigation Management
PLBC Paithan Left Bank Canal
PRBC Paithan Right Bank Canal
PWD Public Works Department
Sq km Square Kilometre
State Tar State target
WALMI Water And Land Management Institute, Aurangabad
WRD Water Resources Department
WUA Water Users’ Association
AIC Akola Akola Irrigation Circle, Akola
AIC Aurangabad Aurangabad Irrigation Circle, Aurangabad
BIPC Buldhana Buldhana Irrigation Project Circle, Buldhana
BIPC Parli Beed Irrigation Project Circle, Parli Vaijanath
CADA A’bad Command Area Development Authority, Aurangabad
CIPC Chandrapur Chandrapur Irrigation Project Circle, Chandrapur
KIC Kolhapur Kolhapur Irrigation Circle, Kolhapur
KIC Ratnagiri Konkan Irrigation Circle, Ratnagiri
NIC Nagpur Nagpur Irrigation Circle, Nagpur
NIC Nanded Nanded Irrigation Circle, Nanded
NIPC Dhule Nashik Irrigation Project Circle, Dhule
NKIPC Thane North Konkan Irrigation Project Circle, Thane
OIC Osmanabad Osmanabad Irrigation Circle, Osmanabad
PIC Pune Pune Irrigation Circle, Pune
SIC Sangli Sangli Irrigation Circle, Sangli
TIC Thane Thane Irrigation Circle, Thane
UWPC Amravati Upper Wardha Project Circle, Amravati
YIC Yavatmal Yavatmal Irrigation Circle, Yavatmal

Chapter-1 Preface
1.1 Introduction
Maharashtra occupies main portion of the Indian Sub-continent. The geographical location of Maharashtra is bounded between latitude 16.4o to 22.1o N and longitude 72.6o to 80.9o E and has an area of 307.71 thousand sq km, which is about 9.4 percent of the total geographical area of India. Maharashtra stands first amongst the major states in India in income & growth rate. The State has 720 km long coastline along Arabian Sea. The western hill ranges are almost parallel to this coastline. The State is divided into two physiographic regions of Konkan and rest of the State (Deccan Plateau). The Deccan Plateau spread over on the east side of ghat has west-east slope. In general, the altitude of the plateau varies between 300 to 600 m. Maharashtra has Gujarat on north-west, Madhya Pradesh in north, Chhattisgadh on east and Andhra Pradesh, Karnataka and Goa in south.
1.2 River Basins
The State is mainly covered by the basins of Krishna, Godavari and Tapi except the west-flowing rivers of Konkan strip. A small portion on north comes under Narmada basin. There are in all 380 rivers in the State and their total length is 19269 km. Most of the land is undulating and hilly. Comparatively, continuously hilly plateau lands are very few. Because of this, flow canal systems in Maharashtra are very expensive, though there are large number of suitable sites for building water storage reservoirs.
Number of rivers originate from Sahyadri at about 500 to 700 m elevation and flow westward to Arabian Sea through the Konkan strip. Damanganga, Surya, Vaitarna, Ulhas, Karla, Kundalika, Kal, Savitri, Vashishthi, Shastri, Gad, Karli, Tillari and Terekhol are the prominent rivers. These rivers are of shorter length holding fair amount of water during monsoon but run totally dry during summer. The natural calamities such as land erosion, salt water intrusion, land subsistence etc. are often inflicted upon Konkan.
Tapi and Narmada are the two west-flowing rivers coming from Madhya Pradesh and flowing down to Gujarat State through Maharashtra. Narmada forms 54 km long common boundary of the State along northern border. Total length of Tapi in Maharashtra is 208 km. These rivers and tributaries have rendered the land of Khandesh1 fertile.
Wainganga flows in north-south direction. The length of Waiganga in Maharashtra is 476 km. Godavari is the principal east-flowing and longest river in Maharashtra (968 km).
1 Khandesh includes Dhule, Nandurbar and Jalgaon districts.
1

South-east flowing Bhima and mainly north-south flowing Krishna are the major rivers of South Maharashtra. The length of Bhima in Maharashtra is 451 km. It joins Krishna on the Karnataka-Andhra Pradesh boundary near Raichur.
Krishna rises near Mahabaleshwar. Krishna is 282 km long in the State. Basin-wise water availability – (Maharashtra – India)
Sr.No
Basin Geographical Area (Mha)
Culturable Area (Mha)
Average Annual
Availability (BCM)
75%Dependable Yield (BCM)
Permissible Use As Per
Tribunal Award (BCM)
1 Godavari 15.430 11.256 50.880 37.300 34.185
2 Tapi 5.120 3.731 9.118 6.977 5.415
3 Narmada 0.160 0.064 0.580 0.315 0.308
4 Krishna 7.010 5.627 34.032 28.371 16.818
5 West flowing Rivers
3.160 1.864 69.210 58.599 69.210
Total: 30.88 22.542 163.820 131.562 125.936
1.2.1 Sub-basinwise planning
As per the recommendations laid down in the National Water Policy – 2002 and Maharashtra Water and Irrigation Commission’s Report, the State Water Policy has been adopted by GOM in 2003.
The objectives of the Maharashtra State Water Policy are to ensure the sustainable development and optimal use and management of the State’s water resources, to provide the greatest economic and social benefit for the people of the State of Maharashtra and to maintain important ecological values within rivers and adjoining lands.
The Maharashtra State Water Policy mentions that -
‘To adopt an integrated and multi-sectoral approach to the water resources planning, development and management on a sustainable basis taking river basin/sub basin as a unit.’
The water resources of the State shall be planned, developed, managed with a river basin/ sub basin as a unit, adopting multisectoral approach and treating surface and sub-surface water with unitary approach.
The geographical area of the State is 308 lakh ha and cultivable area is 225 lakh ha. This geographical area is divided mainly into five major river basins of Godavari, Krishna, Tapi, Narmada and basin groups in Konkan. There are 22 narrow basins of west flowing rivers in Konkan.
The Maharashtra Water and Irrigation Commisison has proposed delineation of five river basins basically into 25 distinct sub basins for planning of water resources development in the State. The categorisation of sub basins proposed is solely on the basis of natural availability of water. The basic characteristics of sub basins are dictated by the hydrological regime, which in turn, is a function of climate, rainfall distribution and the draining area.
2

14
13 A
13 A
12
13 B
11
3
13 A
10
13 B
1A
20 21
1B
17
22
23
15A
18A
16A
18B
19A
2 4
5
6
24B
25
15B
16B
19B
7
8
9A
9C
9B
TH
AN
E
NA
DU
RB
RN
A
ED
HU
L
AL
GO
JA
N
BU
DH
AN
AL
AK
LA
O
AM
RV
AI
AT
LN
JA
A
UN
AD
AR
AG
BA
BE
ED
LU
AT
R
OS
NA
BA
MA
D
HA
AA
ME
DN
GR
NA
SH
IK NP
UE
RA
GA
DI
MB
MU
AI
SA
AR
TA
RA
TN
AG
IRI
OP
KL
HA
UR
NL
SA
GI
SO
AU
RL
P
SIN
DH
UD
UR
G
GO
A
PA
BH
NI
RA
NA
DE
DN
WA
IS
HM
YA
VA
TM
AL
WA
RD
HA
NA
PU
GR
BH
ND
RA
AA
GD
CI
OI
AH
RL
CH
AN
DR
AP
UR
MA
DH
YA
PR
AD
ES
H
G
U
JA
R
A
T
ARABIN
SA
A
E
A
N
A
A
A
K
R
T
K
A
A
ND
HR
A
PR
DE
SH
C H HT I
A D
A T S GH
Note
: H
ighly
Def
icie
nt,
Def
icie
nt
and
Ver
y m
uch
Surp
lus
are
resp
ecti
vel
y e
quiv
alen
t to
Hig
hly
Def
icit
, D
efic
it a
nd A
bundan
t.H
ow
ever
, th
e la
tter
ter
min
olo
gy i
spre
ferr
ed.
1.
Sta
te B
ou
nd
ary
3.
Cap
ital
4.
Dis
tric
t H
ead
qu
art
er
5.
Su
b-B
asin
Bo
un
dary
6.
Un
it A
rea B
ou
nd
ary
7.
Riv
er,
Nall
a
8.
Hig
hly
Defi
cie
nt
9.
Defi
cie
nt
10.
No
rmal
11.
Su
rplu
s
12.
Very
mu
ch
Su
rplu
sIND
EX
N
SC
AL
E
30
Km
03
06
0 K
m
MA
HA
RA
SH
TR
A W
AT
ER
& I
RR
IGA
TIO
N C
OM
MIS
SIO
N>
Su
b B
as
in
1.U
pper
God
avar
i (U
pto
Pai
than
Dam
)
a) G
odav
ari (
Exc
ept M
ula
and
Pra
vara
)
b) M
ula
and
Pra
vara
2.Lo
wer
God
avar
i
(D/s
of P
aith
an D
am)
3.P
urna
(In
clud
ing
Dud
hana
)
4.M
anjra
5.G
odav
ari -
Sud
ha -
Sw
ama
6.P
aing
anga
7.W
ardh
a
8.M
iddl
e W
aing
anga
9.Lo
wer
Wai
ngan
ga
a) W
aing
anga
- P
ranh
ita
b) In
cham
palli
c) In
drav
ati
10.
Pur
na (
Tapi
)
11.
Girn
a
12.
Pan
zra
13.
Mid
dle
Tapi
a) T
api (
Sat
puda
)
b) T
api (
Sou
th)
14.
Nar
mad
a
15.
Upp
er K
rishn
a (W
est)
a) N
orth
- W
est
b) S
outh
- W
est
16.
Upp
er K
rishn
a (E
ast)
a) Y
eral
a
b) A
gran
i
17.
Upp
er B
him
a (U
pto
Ujja
ni)
18R
emai
ning
Bhi
ma
a) N
eera
b) D
/s o
f Ujja
ni In
clud
ing
Man
.
19.
Sin
a -
Bor
i - B
enet
ura
a) S
ina
b) B
ori -
Ben
etur
a
20.
Dam
anga
nga
- P
ar
21.
Nor
th K
onka
n
22.
Mid
dle
Kon
kan
23V
ashi
shth
i
24.
Sou
th K
onka
n
a) R
atna
giri
b) S
indh
udur
g.
25.
Tere
khol
Till
ari
kW
ai
Gom
ai
iTa
p
Nagan
ai
Rangv
tr
Bu
ai
Narm
aa
d
Pan
zra
nAer
Mosam
rB
oi
ra
Gi
n
Titu
r
Girna
Sui k
Pan
zan
Tapi
aS
ipn
Wag
hur
Pu
rna
Man
Morana
ad
aa
a
Chn
rh
g
PuranPendhi
Par
Nr
a
g
Dam
anga
na
Ro
sh
an
i
Ala din
i
Godav
ar
Pra
vara
Ma
ul
nja
lP
i
itr
na
Va
aa
Surya
Tansa
ha
Bat
s Kalu
lhasU
Gho
d
hima
B
Amba
Ku
nd
alika
ula
M
Muth
a
Neera
Savit
ri
Kris
hna
sV
asi
hth
i
Ka
oyan
Sh
tras
hi
Kaia
wi
Wara
na
Kris
hna
ch
d
Mu
ku
ni
Pan
ch
ag
an
ga
Wg
ho
aa
tn
an
Dudhagga
aG
dh
Trekol
eh
Till
ari
Gh
ata
pra
bh
a
Vedgn
aa
g
Purn
a
Du
dh
an
a
Go
davari
Sin
dh
an
aap
Man
jara
inSa
hi
aB
m
aM
n
orB i
Yeal
ar
Ag nira
Pai
nag
anga
ay
hu
Kad G
odav
ari
Dharani
Tera
na
e
u
Bne
tre
Aru
avat
in
Adan
ghWa un
unKh
i
Vadhrb
ha
i
Pain
ag
an
ga
ebl
Bm
aA
soda W
a
ardh
ham
D
Nan
d
iEra
ar
ha
Wd
Jam
Ko
lar
ana
K
hn
Pnh ec
Ka
annh
Nag
mA
a
Cnd
hu
ah
v
Gd
ai
Sa
it
nWai aganga
Kh
or
gd
ba
ai
Kath
ian
Moo
l
ndhai
A
r
Pr
nt
ahi
a
nda
Baiy
Nib
ra
Indravati
v
Goda
ari
Bw
an
hd
at
ai
inag
ag
Wa
na
24A
SU
B -
BE
SIN
S IN
MA
HA
RA
SH
TR
AA
S P
RO
PO
SE
D B
Y T
HE
CO
MM
ISS
ION
& C
AT
EG
OR
IZA
TIO
N T
HE
RE
OF
IN
PL
AN
NIN
G G
RO
UP
S


The sub basins are as follows:
Sr.
No.
River Basin
Names of Sub basins Abbreviated name
Categorisation for planning
on the basis of availability of natural water
I Godavari 1) Upper Godavari (Upto Paithan Dam)
Upper Godavari Normal
2) Lower Godavari (D/S of Paithan Dam)
Lower Godavari Deficit
3) Purna (including Dudhana) Purna Dudhana Deficit
4) Manjra Manjra Deficit
5) Godavari-Sudha-Swarna Remaining Godavari
Normal
6) Painganga Painganga Normal
7) Wardha Wardha Normal
8) Middle Wainganga Middle Wainganga
Surplus
9) Lower Wainganga Lower Wainganga
Abundant
II Tapi 10) Purna (Tapi) Purna Tapi Deficit
11) Girna Girna Deficit
12) Panzara Panzara Normal
13) Middle Tapi Middle Tapi Deficit
III Narmada 14) Narmada Narmada Surplus
IV Krishna 15) Upper Krishna (West) Upper Krishna (W)
Abundant
16) Upper Krishna (East) Upper Krishna (E)
Highly Deficit
17) Upper Bhima (Upto Ujjani) Upper Bhima Normal
18) Remaining Bhima Remaining Bhima
Normal
19) Sina-Bori-Benetura Sina-Bori-Benetura
Highly Deficit
V West Flowing
20) Damanganga-Par Damanganga-Par
Abundant
Rivers in 21) North Konkan North Konkan Abundant
Konkan 22) Middle Konkan Middle Konkan Abundant
23) Vashisthi Vashisthi Abundant
24) South Konkan South Konkan Abundant
25) Terekhol – Tillari Terekhol – Tillari Abundant
3

Categorisation of sub basins for planning, on basis of naturally available quantum of water, is given below :
Sr. No. Plan Group Per ha availability (m3)
Percent of cultivable
area of State
i) Highly Deficit Area Below 1500 13
ii) Deficit area 1501-3000 32
iii) Normal area 3001-8000 34
iv) Surplus area 8001-12000 06
v) Abundant area Above 12000 15
A graph showing basinwise availability of water is appended herewith.
The performance of a circle (herein called service provider) very much depends upon the availability of water, which in turn is governed by the type of sub-basin in which the project is located. Some circles are having projects located in more than one category of plan group of sub-basins. Therefore, these circles will appear more than once, in graphical representation of indicators.
1.3 Climate
Maharashtra is having mostly a seasonal climate. Four distinct seasons are noticeable in a year viz. (1) Monsoon: The rains start with the south - west winds. Mainly it rains during the four months from June to September, but it often extends up to October. (2) Post-monsoon season: October to mid December is a fair weather season with meagre rains. These are the initial months of the post-monsoon, Rabicrops and the condition of later depends upon the weather during these months. (3) Winter: It is generally a period of two or two-and-a-half months, from mid-December until end of February. Most of the Rabi crops are harvested during these months. (4) Summer: It lasts for at least three months - March to May.
There is considerable variation in weather and rainfall among the five different geographical regions of Maharashtra.
1 The coastal districts of Konkan experience heavy rains but mild winter. The weather, however, is mostly humid throughout the year.
The maximum and minimum temperatures here range between 270C and 400C and 140C to 270C respectively. The relative humidity is 81% to 95% during June to August while 30% to 65% during January - February.
2 The western parts of Nashik, Pune, Satara and Kolhapur districts show a steep reduction in rainfall from the mountainous regions towards the East. The maximum temperature ranges between 260C to 390C and the minimum temperature between 80C to 230C. The relative humidity is 81% to 99 % in August and only 20%
to 39% in March.
3 The eastern part of the above four districts together with Ahmednagar, Sangli, Solapur, Aurangabad, Jalna, Beed and Osmanabad districts fall under the rain shadow of Sahyadri Mountains and therefore the beginning and end of the rainy season is quite uncertain in these parts. The rainfall is also meagre. The climate is extreme. The summer temperature is high (maximum temperature 360C to 410C) but winter temperature is low (minimum temperature. 100C to 160C). The relative humidity in August is between 82% to 84% but only 19% to 26% in April. The rainfall
4

Wa
ter
Av
ail
ab
ilit
y p
er
ha
of
Cu
ltu
rab
le A
rea
8335
2957
2820
4644
3218
3595
8293
3112
9063
5809
6768
2131
1811
2122
1197
2374
6332
0
2000
4000
6000
8000
10000
12000
14000
16000
Upper Godavari
Lower Godavari
Purna Dudhana
Manjra
Remaining Godavari
Painganga
Wardha
Middle Wainganga
Lower Wainganga
Purna Tapi
Girna
Panjra
Middle Tapi
Narmada
Upper Krishna (W)
Upper Krishna (E)
Upper Bhima
Remaining Bhima
Sina-Bori-Benitura
Damanganga-par
North Konkan
Middle Konkan
Vashisthi
South Konkan
Terekhol-Tillari
Su
bb
asin
cum
Availa
bili
ty p
er
ha.o
f C
CA
Avail
1500
Avail
3000
Avail
8000
Avail
12000
Valu
es E
xceedin
g 1
6000
5

increases as we go towards east viz. Parbhani, Nanded and Yavatmal. Many a times the eastern winds during the end of monsoon cause precipitation here.
4 Likewise the Tapi basin, the southern parts of Satpuda ranges and Dhule-Jalgaon districts towards west is low rainfall part like that of rain shadow region. But towards east Buldhana, Akola and Amravati districts experience a heavy rainfall. Summer temperature in this region is quite high (390C to 430C) and minimum winter temperature is found to be 120C to 150C. Relative humidity between May to August is 82% to 87% whereas in March-April it is 12% to 31%.
5 The Wainganga basin on east of Maharashtra and the hilly region still farther east is, on the whole, a zone having good rainfall, but as it is some what low lying area, the climate is even more extreme. The summer temperature is very high (390Cto 450C) while it is cooler in winter as compared to other regions (120C to140C).
1.4 Rainfall
Maharashtra gets rain both from the south-west and the north-east monsoon winds. The proportion of the rainfall derived from the north-east monsoon increases towards east.
The average rainfall of the State is approximately 1360 mm. Nearly 88% of the total average rainfall occurs between June to September, while nearly 8% occurs between October to December and 4% after December. There is a considerable variation in the reliability of the rains in different parts of the State.
The steep decline in the rainfall to east of Sahyadri is strikingly noticeable. In the 30 to 50 km wide belt the average rainfall is observed to be less than 650 mm (as low as only 500 mm at some places). Thereafter, the rainfall increases steadily towards east and the average rainfall in the easternmost districts is observed to be 1400 mm.
The pre-monsoon rain during March to May is maximum in Western Maharashtra (5%) while in Marathwada it is 4%, in Vidarbha it is 3% and the minimum is in Konkan (1%).
The number of average annual rainy days is maximum 95 in Konkan, 55 in Vidarbha, 51 in Western Maharashtra and the minimum 46 in Marathwada.
Out of the total cultivable land in Maharashtra about 53% is under Kharif and about 30% is under Rabi crops. These mostly comprise of food grains and oilseeds. The rainfall during June to September affects both the Kharif and the Rabi crops. That is why the regularity of rainfall during this period is of importance. But it is seen that there is considerable fluctuation in the number of rainy days as well as the amount of rainfall from year to year. The fluctuation in rainfall is observed to be 25%, 40% and between 20% to 30% in Konkan, Central Maharashtra and Vidarbha respectively. Crop management on fields during this period thereby becomes quite difficult. Some more information about physiography and Agro-climatic zones is given in Appendix XIV.
1.4.1 Rainfall during 2003-04
The State received rains from South West monsoon from 16th June 2003, late by 9 days. The proportion of rainfall received during the period from 16th June to 31st
October 2003 was as low as 90.3% of State’s normal rainfall. As per IMD standards; in 8 districts, it was deficient (41 to 80%) out of 33 districts in the State (excluding
6

Mumbai city & Mumbai suburb). In 18 districts it was 81 to 100%, whereas in 7 districts it was above 100% of the normal. As per the standards specified by IMD, out of 353 talukas in the State, in 16 talukas the rainfall received was scanty (upto 40% of normal), in 127 talukas it was deficient (between 41% to 80%) whereas in 45 talukas it was excess - (i.e.20% or more above normal). The regionwise breakup of 143 talukas which received rainfall upto 80% of normal, was as follows:-
Region No. of talukas
Central Maharashtra (Nashik & Pune Divisions)
68
Vidarbha 36
Marathwada 29
Konkan 10
The steep downfall in the rainfall of State since last three years, consequently affected the groundwater as well as surface water potential of the projects.
Thus, the overall picture of the rainfall received during this monsoon (2003-04) in the State was not at all satisfactory.
1.5 Irrigation Development during Post-independence Period
Maharashtra State as of today came into existence in 1960. The increasing population was facing shortage of food grains. This has led to the need of increasing agricultural production. By giving priority to agricultural development, attempt has been made to achieve irrigation development in a planned manner.
Hardly, 0.274 Mha, Irrigation potential was created in the State during pre-plan period i.e. before 1950. Agriculture has been the prominent occupation to provide food and fiber to the growing population of the State. Adequate, timely and guaranteed water supply is of paramount importance in agriculture production and irrigation development plays a key role in alleviating rural poverty. The State has created 3.863 Mha irrigation potential using surface water resources by 2003 through 52 major, 206 medium and 2445 state sector minor irrigation projects. Besides 53 major, 212 medium, 885 State Sector minor projects and 22 lift irrigation projects are under construction in the State. The total investment in the irrigation sector up to March 2003 is around Rs. 300 billion. The ultimate irrigation potential, through surface water and ground water resources, has been estimated as 12.6 Mha.
1.6 Irrigation Development Corporations
The Government of Maharashtra has established 5 Irrigation Development Corporations during 1996-98 with a view to complete the irrigation projects in a time bound manner and not to allow them to linger on for want of funds. These corporations have also been entrusted with the responsibility of giving impetus and commissioning command area development projects, hydroelectric schemes, flood control measures and other associated works. The corporations of the State have been entrusted with the responsibility through five different basin-specific acts. Following are these corporations:
Maharashtra Krishna Valley Development Corporation
Vidarbha Irrigation Development Corporation
Tapi Irrigation Development Corporation
7

Konkan Irrigation Development Corporation
Godavari Marathwada Irrigation Development Corporation
The corporations are headed by Executive Director of the rank of Secretary of the Department and are authorised to raise funds from public investment for construction / completion of the projects. In order to meet the O & M expenditure the corporations are delegated with powers of fixing the water rates.
1.7 Present Organisational Set up
The organisational set up for irrigation management comprises of section office at the lowest level looking for an area of about 3000 to 4000 ha. The section office is headed by a sectional officer having staff for O & M of the area. The subdivision dealing with four to five sections, is headed by sub divisional officer/engineer and works under the control of division. Thus the division is looking after four to five subdivisions with sixteen to twenty five sections and headed by the Executive Engineer in charge of the irrigation projects. The management circle headed by the Superintending Engineer controls three to four divisions. The regional head of the Superintending Engineers (four to five circles) is either Chief Engineer or the Chief Administrator in case of CAD projects.
All the regional Chief Engineers & Chief Administrator are under the control of Irrigation Development Corporations or directly under control of GOM. Though the Irrigation Development corporations are autonomous bodies, they are bound to observe the policy decisions of the Government in public interest. The Superintending Engineers in-charge of irrigation circles are responsible for full utilisation of the water stored in reservoir and maintenance of public utilisation system, as well as recovery of water charges through their subordinate offices. The organisation chart of department is enclosed herewith.
8

Org
an
isa
tio
n C
ha
rt o
f Ir
rig
ati
on
Ma
na
ge
me
nt
S
ec
reta
ry (
CA
D)
Chie
f E
ngin
eer
Konkan
Chie
f E
ngin
eer
(SP
) P
une
Chie
f E
ng
ine
er
P
une
Chie
f E
ngin
eer
Nash
ik
Chie
f E
ngin
eer
&
Chie
f A
dm
inis
trato
r C
AD
Aura
ng
aba
d
Chie
f E
ngin
eer
Am
ravati
Chie
f E
ngin
eer
(I)
Nag
pur
1)
SE
TIC
Thane
1)
Adm
n C
AD
A
Pune
1)
SE
PIC
P
une
1)
Ad
mn C
AD
A
Nash
ik
1)
Adm
n C
AD
A
Aura
ng
abad
1)
SE
UW
PC
A
mra
vati
1)
Adm
n C
AD
A
Nagpu
r
2)
SE
KIC
R
atn
agir
i 2)
Adm
n C
AD
A
Sola
pur
2)
SE
SIC
S
angli
2)
Ad
mn C
AD
A
Jalg
aon
2)
Adm
n C
AD
A
Beed
2
) S
E A
IC A
ko
la
2)
SE
CIP
C
Chand
rapur
3)
SE
NIC
Nanded
3)
SE
BIP
C
Buld
ha
na
3)
SE
NIC
N
agpu
r
4)
SE
YIC
Y
avatm
al
9

1.8 Performance Evaluation of Irrigation Projects
The PWD Handbook Chapter 25 on Irrigation & Irrigation Management gives comprehensive procedures for data collection, analysis, evaluation & monitoring the performance of Irrigation Projects. Evaluation and monitoring the performance of irrigation projects is mainly based on six main parameters:
1. Irrigation potential created and utilised
2. Season-wise and total annual irrigated area
3. Water use efficiency
4. Recovery of irrigation water charges
5. Crop yields
6. Socio-Economic Survey – Once in five years.
1.9 Recovery Of Water Charges
For efficient performance of irrigation system, it is necessary that the system should be self-sustainable. The water rates for irrigation and non-irrigation should be such that annual water charges accrued should meet the yearly O & M expenditure fully. In addition, capital costs should be partly covered. Accordingly GOM has revised the water rates (w.e.f. September 2001) in such a way that they meet 100% O&M cost and some portion of interest on capital borrowed for water sector infrastructure. In addition, there is an in-built provision of 15% increase in the water rates every year. But the water rates for Irrigation and Non-Irrigation effective for the year 2002-03 are continued from 01/07/2004 for 2003-04 i.e. there is no increase in the water rates this year. The water rates for three different seasons are included as Appendix XV.
The expenditure on irrigation management including establishment charges for the year 2002-03 and 2003-04 was Rs. 3700 million and Rs. 3330 million respectively. Whereas the total recovery of the water charges pertaining to irrigation and non irrigation water use was Rs. 3775 million and Rs. 3776 million respectively. Thus, it can very well be concluded that the expenditure on irrigation management is 100% met through recovery of water charges. It will be very clear from the graph drawn below :
Status of Irrigation O & M Cost & Recovery
0
1
2
3
4
5
6
1998-1999 1999-2000 2000-2001 2001-2002 2002-2003 2003-2004
Year
Rs. in
bill
ion
O & M cost Water charges recovery
10

Potential Creation & Utilisation
0.0
0.5
1.0
1.5
2.0
2.5
3.0
3.5
4.0
Year
Are
a (
Mh
a)
Potential Created Mha 3.420 3.500 3.706 3.769 3.812 3.863
Area irrigated by canals Mha 1.225 1.286 1.298 1.250 1.315 1.235
Area irrigated by wells in
command
0.471 0.584 0.466 0.458 0.524 0.441
1998-99 1999-00 2000-01 2001-02 2002-03 2003-04
1.10 Water Use Efficiency
It is of utmost importance to use water more efficiently to cater to the needs of a large population. Water use efficiency is a key parameter to be monitored and evaluated. Water use efficiency is a function of agro-climatic conditions, status of irrigation system, soil type, cropping pattern, participation of farmers, irrigation practices etc. Thus efforts are to be made to improve water use efficiency, to achieve more irrigation and crop yield per unit of water.
The useful storage achieved in all Major, Medium and Minor (State sector) reservoirs in the State as on 15th October 2003, was 16941 Mcum. Out of the total, water used for irrigation was 10569 Mcum. On account of water use for irrigation, 1.235 Mha area on canals was irrigated whereas irrigation on wells was 0.441 Mha. The total area irrigated by these two
W a te r u s e E f f ic ie n c y
0
2 0
4 0
6 0
8 0
1 0 0
1 2 0
1 9 9 9 -2 0 0 0 2 0 0 0 -2 0 0 1 2 0 0 1 -2 0 0 2 2 0 0 2 -2 0 0 3 2 0 0 3 -2 0 0 4
Y e a r
Eff
icie
ncy (
ha/M
cu
m)
sources together was 1.676 Mha. The water use efficiency comes to 117 ha/ Mm3 for the canal irrigation, which is significantly higher than that for the year 2002-03. It can definitely be said that this value is a satisfactory and target achieving one.
1.11 Present Status of Irrigation Utilisation:
In spite of various measures taken so far, there is a gap between potential created and utilised.
11

The overall reasons for less utilisation are as follows:
i) Low water yield in the reservoirs ii) Diversion of irrigation water to non-irrigation uses iii) Taking more percentage of crops that require more water like paddy and sugarcane iv) Thin & scattered irrigation resulting in low efficiency v) Low utilisation during kharif (Rainy) season vi) Reduction in storage capacity due to silting vii) Poor/approximate assessment of the irrigated area in the command viii) Non accounting of irrigated area outside the command (influence area) ix) Poor maintenance of the infrastructure due to financial constraints x) Non participation of beneficiaries.
Year wise potential created and corresponding season-wise irrigated area during last 5 years are shown in the above figures.
1.12 Water Users’ Associations
Maharashtra is pioneer in implementing Participatory Irrigation Management (PIM) through Water Users’ Associations. PIM will not only result in effective and efficient operation and management of irrigation systems but also result in cost saving. State Government is keen to expand farmers’ participation in irrigation management.
The GOM has taken a policy decision on 23rd July, 2001 on formation of Water Users’ Associations and handing over the management of the entire irrigation potential created to the WUAs. In case of projects under construction, no work on construction of minors will be taken up unless WUA is formed. By the end of 2001-02 in all 283 WUA were in full operation with operational area of 101.00 thousand hectares. In addition to this, 281 WUAs have come into operation, by the end of 2003-04. As a result, at the end of 2003-04, total 564 WUAs were in operation, which covered an area of 165.00 thousand hectares. Besides this, the number of WUAs, which have been registered and entered into agreement, was 158, covering an area
Seasonwise Irrigated Area
0.0
0.2
0.4
0.6
0.8
1.0
1.2
1.4
Year
Are
a (
Mh
a)
1998-99 0.336 0.425 0.182 0.052 0.230 1.225
1999-00 0.343 0.493 0.155 0.047 0.248 1.286
2000-01 0.423 0.478 0.075 0.050 0.272 1.298
2001-02 0.365 0.478 0.122 0.041 0.244 1.250
2002-03 0.373 0.540 0.104 0.058 0.240 1.315
2003-04 0.407 0.506 0.081 0.051 0.19 1.235
Kharif Rabbi Hot Weather Two Seasonals Perennial Total
12

of about 56.15 thousand hectares. By the end of 2001-02, the number of registered WUAs was 414, which increased to 1009 by end of 2003-04. It is proposed to cover an area of 359.4 thousand hectares by these 1009 WUAs.
It is observed that ,
1. An appreciable increase in irrigated area has taken place in the area under water users' associations.
2. They use water economically; irrigate more area with unit quantum.
3. They gain concession by paying water charges in time.
4. Majority of the organisations accrue profit by systematically accomplishing water management.
5. They use water during hot weather season by achieving saving in water distribution in Rabi season.
13

Chapter-2
Benchmarking of Irrigation Projects
Benchmarking can be defined as a systematic process for securing continual improvement through comparison with relevant and achievable internal or external norms and standards.
2.1 Background
Based on experience it was decided to carry out benchmarking of almost all major & medium and few minor irrigation projects in the State for the year 2002-03. Total 254 projects from 25 circles were selected for benchmarking exercise. There were 11 performance indicators considered in the analysis. This year (2003-04) 261 projects are selected for benchmarking with 12 performance indicators. A new indicator “Assessment Recovery Ratio” for Irrigation and Non Irrigation uses separately is introduced this year.
A State level workshop was held at WALMI, Aurangabad on 28-29 December 2004, wherein draft of benchmarking report 2003-04 was presented and discussed with field officers before finalising the same. It has brought forward important observations and suggestions which has helped in finalising this report. An international forum on this subject was held on 19th & 20th January 05 at WALMI Aurangabad.
This is the third consecutive report of benchmarking of irrigation projects in the State with 261 projects and 12 indicators. The region wise number of projects selected for benchmarking during 2003-04 is as follows.
Number of Irrigation Projects Sr.No
Region
Major Medium Minor
Total number
ofprojects
1 Konkan 4 2 9 15
2 Vidarbha 13 47 23 83
3 Marathwada 9 37 16 62
4 North Maharashtra 11 23 10 44
5 Western Maharashtra 12 34 11 57
Total 49 143 69 261
2.2 Experience in Benchmarking of Irrigation Projects
The projects selected are of major, medium and minor category and from various regions of State representing various agro-climatic zones. The benchmarking exercise has provided a systematic approach for understanding how the projects from similar sub basins are performing relative to others. The best performing practices are identified and reasons for lower performance are found out. The remedial measures are also planned and will be implemented accordingly.
2.3 About this report
Following 12 indicators are selected for benchmarking in 2003-04 grouped in different key activity areas.
14

A
AN
DH
RP
RA
DE
SH
CHHA G DHTTIS A
MD
HA
HY
A
PR
AD
ES
ARABIANSEA
NK
IPC
Thane
TIC
Thane
K
O N
K
A
N
GUJARAT
NO
RT
HM
AH
AR
AS
HT
RA
CA
DA
Ah
me
dn
ag
ar
CA
DA
Na
sik
NIP
CD
hu
le
CA
DA
Ja
lga
on
AIC
Au
ran
ga
ba
d
CA
DA
Au
ran
ga
ba
d
NIC
Na
nd
ed
OIC
Osm
an
ab
ad
MA
RT
HW
AA
DA
BIP
CB
uld
ha
na
AIC
Akola
UW
PC
Am
ravati
YIC
Yavatm
alN
ICN
ag
pu
rC
AD
AN
ag
pu
r
CIP
CC
ha
nd
rap
ur
N
MA
HA
RA
SH
TR
A S
TA
TE
CIR
CL
E H
EA
D Q
UA
RT
ER
DIS
TR
ICT
BO
UN
DA
RY
VI
DA
BA
RH
MA
P S
HO
WIN
G L
OC
AT
ION
OF
IR
RIG
AT
ION
CIR
CL
ES
KN
AK
AR
TAA
KIC
Ratn
agiriP
ICP
une C
AD
AP
un
e
CA
DA
So
lap
ur
SIC
Sa
ng
li
KIC
Kolh
apur
WE
ST
ER
NM
AH
AR
AS
HT
RA
CA
DA
Be
ed
BIP
CP
arli


System Performance
1 Annual Irrigation Water Supply Per Unit Irrigated Area
2 Potential Created And Utilised
Agricultural Productivity
3 Output (Agricultural Production) Per Unit Irrigated Area
4 Output (Agricultural Production) Per Unit Irrigation Water Supply
Financial Aspects
5 Cost Recovery Ratio
6 Total O&M Cost Per Unit Area
7 Total O&M Cost Per Unit Volume Of Water Supplied
8 Revenue Per Unit Volume Of Water Supplied
9 Mandays For O&M Per Unit Area
Environmental Aspects
10 Land Damage Index
Social Aspects
11 Equity Performance
Additional Indicator
12 Assessment Recovery Ratio
A. Irrigation
B. Non Irrigation
2.3.1 Methodology
The data presented in this report is based on information collected from each of the circle in-charge of the project.
The following process was used in development of this report.
Irrigation Projects are selected, representing the main geographical regions of State and of categories viz Major (CCA more than 10000 ha), Medium (CCA more than 2000 ha and below 10000 ha) and Minor (CCA less than 2000 ha).
Data is collected in spread sheet and analysed in MWIC office.
Drafts of report and indicator wise performance were sent to project in-charge for comments.
Final report was discussed in a State level workshop.
The report was reviewed before publication.
For better monitoring and looking to the number of projects the analysis is carried out considering irrigation circle as a unit and projects therein with similar plan groups of sub basins. There are 25 irrigation circles in the State, locations of which are shown in enclosed map. Performance of projects in a circle against each indicator is collective performance as given in the Appendices. Data of 49 Major projects is enclosed as Appendix-XVI and that of medium and minor
15

projects under these circles is available with GOM. If somebody desires to know the details, those can be made available.
Ranking of circles in different plan groups is done by arranging the performance for 2003-04 in ascending order.
Collective performance of projects under a circle is found out for each indicator.
Based on performance for 2003-04, indicatorwise average performance is foundout for the circles under consideration, setting aside the exceptionally high/low values.
State targets for each indicator as decided during 2002-03 are reviewed and revised wherever necessary. These are based on studies and past performance and shown on the graphs. It is obvious that climate, geographical, social conditions etc. are different for different regions. Therefore there will be difference in performance of irrigation projects but to improve overall State performance and for simplicity, single target for each indicator for the State is defined. However each circle will be defining its own targets considering peculiarity of its area. For financial indicator of output per unit irrigated area and output per unit irrigation water supply, fixed prices of 1998-99 are considered to obviate effect of price rise.
Good as well as fair achievements & reasons for the same for each indicator comparing with State target are noted. Efforts will have to be directed towards improving the performance.
Some circles are not having either major, medium or minor projects, therefore, only relevant circles are shown in graphs of each indicator. Thus total of circles may not tally to 25 in each graph, for example for major projects category, there are only 18 circles.
At a glance evaluation of performance of all circles with respect to each indicator is also given.
There are 2445 completed minor irrigation projects in the State. Therefore, it has been decided to carryout benchmarking and monitoring of minor projects at circle level itself. To get an idea about performance of minor projects, some sample schemes which were considered in last year’s report are analysed and included in this report.
16

2.4 Overview Of Irrigation Projects
For getting an idea about major and medium projects selected for benchmarking, an overview showing details such as sub basin, storage, command area, crops grown etc. is enclosed as Appendix XIII.
2.4.1 Supply System
Generally supply of water for irrigation is through distribution network of canals off-taking either from dam or from pick-up-weir. The distribution network consists of main canal, branch canal, distributary, minor and field channels. The open canals are either lined or unlined, but mostly the systems are unlined.
Water is supplied to irrigators via distribution network through outlets. In addition, there are individual, co-operative, Govt. owned lifts on reservoirs, rivers and canals. Normally there is major area under gravity irrigation and small part under lift irrigation in most of the projects. Some projects are specially lift irrigation projects with storage reservoir or storage reservoir with series of Kolhapur type weirs downstream of reservoir. In most of the major & medium irrigation projects, water reserved for non irrigation (domestic and industrial) use varies between 15 % to 25 %. While in deficit years the non irrigation use in projects goes even up to 50%.
The supply of water for domestic and industrial purpose is mostly made through pipeline either from reservoir or from river.
The projects selected for benchmarking are having major area under flow irrigation with small percent under lift irrigation. The lifts are on main canals as well as reservoirs. Most of the projects selected supply irrigation water for eight months i.e. monsoon Kharif and Rabi and very small proportion for Hot Weather or for perennial crops. There is a practice to use water saved in Kharif and Rabi season for Hot weather or Perennial crops.
2.4.2 Crops Irrigated
The crops grown vary significantly between projects. The main crops grown in project command are sorghum, wheat, gram, sunflower, maize, L. S. cotton, vegetables, groundnut, sugarcane, banana, paddy etc.
2.4.3 Management of Systems
The irrigation systems are constructed and mostly managed by government. Operation and maintenance of irrigation projects is looked after by irrigation divisions which are administratively controlled by circle office. GOM has taken policy decision to supply water for irrigation through Water Users’ Associations only. Accordingly the bill is prepared by the Government for the same. Water Users’ Associations are formed in command areas of irrigation projects and irrigation management of area under their jurisdiction is transfered to them. Recently, a major project Waghad in North Maharashtra region is handed over to Federation of WUAs for management.
17

Chapter 3
Performance Indicators
3.0 As stated earlier, Chapter 2 of this report provides an idea about the five key activities, mentioned below.
a. System Performance
b. Agricultural Productivity
c. Financial Aspects
d. Environmental Aspects
e. Social Aspects
3.1 System Performance
Delivery of water, to meet user requirement for irrigation and other purposes, is the primary focus of the project authorities. The water delivery process is strongly influenced by physical, climatic, economic and other factors and the project authority has limited control over some of these factors. In particular, the prevailing climatic conditions largely determine both, the available water resources and the crop water requirements in any season. The main task of the project in-charge is to manage the system so as to optimise the use of available resources in order to meet agreed user needs in an effective and efficient manner.
3.1.1 Annual Irrigation Water Supply Per Unit Irrigated Area
Annual irrigation water supply per unit irrigated area is total quantity of water supplied for irrigation in all the seasons of an year divided by the irrigated area in that year.
Annual irrigation water supply per unit irrigated area varies with water availability, cropping pattern, climate, soil type, system conditions, system management etc.
As a measure of efficiency of irrigation system, a target of 7692 m3/ha in case of major and medium projects and 6667 m3/ha is set for minor projects.
Results of the study are given in Appendix-I.
3.1.2 Potential Utilised & Created
This is the ratio of potential utilised (area irrigated) to created irrigation potential of the project.
The irrigation potential created through large investments should be fully utilised. However the utilisation is governed by the availability of water in the reservoirs.
The results are given in Appendix-II.
3.2 Agricultural Productivity
In Maharashtra, 70% population depends on agriculture, thus production per unit area as well as per unit water is vital for State economy.
The indicators chosen for benchmarking are
1) Output per unit irrigated area.
2) Output per unit irrigation water supply.
3.2.1 Output Per Unit Irrigated Area
Output per unit irrigated area is the output in rupees of agricultural production from irrigated area divided by total irrigated area.
As the population grows, the land holding per capita is going to be reduced. Secondly there is limitation on land to be brought under irrigation. Thus it is important
18

that the output per unit area has to be increased with efficient water and land management, improved seeds and adoption of latest technology.
The efforts have to be made to increase output by diversification of cropping pattern, better farm practices and judging the market needs. However, water is the only output in agriculture on which service provider has control. Therefore to have an idea about trend of production in the command, this indicator has been adopted. The yield data of various crops is collected through agriculture department. The market prices are obtained from Agricultural Produce Market Committees located in each taluka. In respect of sugarcane, prices are obtained from sugar factories in the area and for cotton, from Cotton Federation. The prices of 1998-99 are considered as base price for all the remaining years & output is worked out accordingly. State target is set as Rs. 30000/ha in case of major & medium projects and Rs. 25000/ha in case of minor projects.
Results are shown in Appendix-III.
3.2.2 Output Per Unit Irrigation Water Supply
Output per unit irrigation water supply is value in rupees of agricultural production from irrigated area divided by total quantity of water supplied for irrigation.
The output per unit irrigation water supply is a crucial measure of optimal use of water. The indicator shows how efficiently water is used to get maximum output (agricultural produce).
Results are given in Appendix-IV.
3.3 Financial Performance
It is vital for any system to be self-sustainable that at least O & M expenditure is met from its own revenue.
In Maharashtra, it is proposed to levy the water charges to all users, including irrigation & non-irrigation use on volumetric basis to encourage efficient use. Presently the practice of volumetric supply is in use for WUAs and other uses such as domestic and industrial use. Now it is made mandatory to supply water for irrigation through WUAs only.
The indicators chosen for financial performance are given below.
1) Cost Recovery Ratio.
2) Total O & M Cost per unit area
3) Revenue per unit water supplied.
4) Total O & M Cost per unit Volume of Water Supplied.
5) Mandays for O & M per unit area.
3.3.1 Cost Recovery Ratio
It is the ratio of recovery of water charges to the cost of providing the service. It is imperative to devise water rates and mechanism for recovery of water charges for irrigation use in such a manner to meet, at least, annual cost of management, O & M of system and recovery of some portion of capital investment on the projects in order to make the system self sustainable. Theoretically the cost recovery ratio should be at least equal to one.
Due to the efforts taken at all levels the recovery of water charges has improved and the O & M cost has come down. This resulted in enhancing the cost recovery ratio more than one.
Results of analysis are shown in Appendix-V
19

3.3.2 Total O & M Cost Per Unit Area
Total O & M cost per unit area is the ratio of total O & M cost incurred for management of the system and area irrigated during the year.
Generally, the O & M cost per unit area should be as minimum as possible. More the O & M cost, lesser will be the cost recovery ratio.
The Govt. of Maharashtra has prescribed yearly O & M norms of Rs. 250/-ha., excluding establishment cost. The staff engaged in management of irrigation system is CRT staff and it is permanent. The expenditure on them is chargeable to the project, irrespective of whether there is less or more irrigation. The total O & M cost is increased in projects where there is less irrigation. The total O & M cost with establishment cost per unit area works out to Rs.700/ha and it is considered as State target.
The results are given in Appendix-VI.
3.3.3 Total O & M Cost Per Unit Water Supplied
Total O & M cost per unit water supplied is obtained by dividing total O & M cost by total quantity of water supplied for irrigation and non irrigation use during the year.
Total O & M cost per unit volume of water supplied should be as minimum as possible to achieve economy in supply. The results of study are given in Appendix-VII.
3.3.4 Revenue Per Unit Water Supplied
It is the ratio of total revenue and quantity of water supplied for irrigation & non irrigation use during the year.
Revenue per unit volume of water supplied is very important measure as every drop of water is to be used efficiently and economically.
The comparative analysis given in Appendix-VIII shows that where non-irrigation supply is prominent as well as hot weather or perennial irrigation is more, the revenue per unit volume of water supplied is more owing to higher rates.
3.3.5 Mandays For O & M Per Unit Area
Mandays for O & M per unit area means number of CRT, Work-charged and daily rated staff engaged in management of the system divided by area irrigated. It is always advisable to have optimum number of mandays for O & M. But with fixed establishment of CRT, there is less scope for improvement. The reduction in irrigation area due to less availability of water for irrigation and more reservation for non-irrigation uses results in abnormal increase in the ratio. Considering the sanctioned staffing pattern for management section, the target of three mandays/ha is considered to be ideal one.
The comparative analysis given in Appendix-IX shows mandays for O & M per unit area.
3.4 Environmental Aspects
3.4.1 Land Damage Index
Land damage index is expressed as percentage of land damaged to irrigation potential created.
The lands under irrigation become saline or waterlogged due to excessive use of water resulting in low productivity. This problem is faced in areas where high water intensive crops are grown year after year with unscientific methods of irrigation like flooding. Water logging and salinity occur in soils with poor drainability. In
20

Maharashtra, black cotton soil, which is highly impervious is found on extensive area.
The results are given in Appendix-X.
3.5 Social Aspects
3.5.1 Equity Performance
Most of the schemes are gravity systems with canals and distribution system. The canal system is divided in to head, middle & tail reach equally with reference to length of canal. Equity performance means ratio of area irrigated to projected irrigable area in head, middle and tail reach expressed as percentage. This indicator gives clear picture as to whether the irrigation facility is provided equitably to head, middle & tail reach farmers or otherwise.
The benefit of irrigation should be given to the beneficiaries in head, middle & tail reach equitably. Ideally for equity, this ratio should be equal to one for head, middle as well as tail reach. The results are shown in Appendix-XI.
3.6 New Indicator
3.6.1 Assessment Recovery Ratio
This indicator is split up into two components viz
a) Irrigation
b) Non Irrigation
In case of irrigation use, there are arrears of water charges in many projects due to some or other reason. One of the reasons being postponement of recovery during draught years.
It is the ratio of recovery of water charges during 2003-04 and assessment in 2002-03 for irrigation as well as non irrigation uses.
The purpose of introducing this indicator is to check whether the water charges assessed during a year are totally recovered or not. For this indicator, arrears are not considered.
The results are shown in Appendix XII (A) and XII (B).
Note : State targets for each indicator are decided based on studies and past experience. The details are given in Appendix-XVII.
21

Chapter 4
Observations & Conclusions
4.1 Observations
I) Annual Irrigation Water Supply per unit Irrigated Area
Major Projects
Water use per unit area in TIC Thane (abundant plan group) is more owing to paddy crop, field to field irrigation & light soils.
Annual irrigation water supply per unit irrigated area is reduced in almost all circles except projects in CADA Jalgaon (deficit plan group), UWPC Amravati (normal plan group) and KIC Kolhapur (abundant plan group). In case of NIC Nanded (deficit) the annual irrigation water supply per unit irrigated area is less than State Target. This is attributable to Vishnupuri Project-a major lift irrigation scheme on Godavari. In CADA Aurangabad, the water supply is substantially reduced both in deficit & normal plan group, owing to reduction in perennial crops.
The performance of AIC Akola (deficit) during 2003-04 was very good.
Medium Projects
Water use per unit irrigated area increased in AIC Akola, CADA Nagpur (deficit), CADA Ahmednagar, NIC Nanded, AIC Akola, NIPC Dhule & CADA Nagpur (Normal).
Water use per unit area in CADA Nagpur was 10256 m3/ha, which is more than past maximum.
Projects in CADA Solapur (highly deficit), CADA Ahmednagar, CADA Aurangabad and OIC Osmanabad (deficit), AIC Aurangabad, CADA Solapur, OIC Osmanabad (normal) and TIC Thane (abundant) had no water available for irrigation.
The performance of AIC Aurangabad, BIPC Parali, NIC Nanded (Deficit) and PIC Pune (Normal) during 2003-04 was very good.
Minor Projects
Values of annual water supply per unit area in case of BIPC Parli (deficit) and KIC Ratnagiri, KIC Kolhapur & NKIPC Thane (abundant) are found to be increased over FY average.
CADA Pune & YIC Yavatmal (Normal) have considerably reduced the water use as compared to FY average.
The performance of CADA Nashik & CADA Pune (Normal) during 2003-04 was good.
Water use values of zero and below State target indicate lesser availability of water.
22

II) Potential Created and Utilised
Major Projects
The projects under CADA Jalgaon (normal) & those under CIPC Chandrapur (normal as well as abundant) could utilise the created irrigation potential fully. However, three circles from deficit, six from normal and one each from surplus & abundant plan groups have improved their performance compared to last FY average.
The performance of AIC Akola, CADA A’nagar, CADA Jalgaon, CIPC Chandrapur, PIC Pune (All normal), CADA Nagpur (surplus) and CADA Pune & CIPC Chandrapur (abundant) during 2003-04 was very good.
Only 494 ha. in one project could be irrigated out of 120520 ha in four projects in CADA Beed (deficit) resulting the value as negligible.
Average performance of all the projects in abundant plan group have crossed the State target.
Medium Projects
CADA Jalgaon (deficit & normal), CIPC Chandrapur (normal, surplus & abundant) CADA Nagpur (surplus) could achieve the State target.
The performance of CADA Jalgaon, CIPC Chandrapur (normal), CADA Nagpur, CIPC Chandrapur (surplus) and CIPC Chandrapur (abundant) during 2003-04 was very good.
Minor Projects
Improvement in performance is observed in most cases of all plan groups over FY average except CADA Jalgaon (deficit) and KIC Kolhapur (abundant).
The performance of seven circles in different plan groups during 2003-04 was very good as they could achieve the State target.
III) Output per unit Irrigated Area
Major Projects
Five circles each in deficit & normal plan group, one from surplus and two from abundant plan group have improved their performance over FY average. CADA Jalgaon (deficit & normal) & UWPC Amravati (normal) have improved remarkably over FY average.
The performance of NIPC Dhule (deficit), CADA Aurangabad, CADA Jalgaon, CADA Nashik, CADA Solapur UWPC Amravati circles from normal and KIC Kolhapur & TIC Thane circles from abundant plan group was very good as they have crossed the State target during 2003-04.
Medium Projects
The output per unit area for AIC Akola & CADA Jalgaon (deficit) and CADA Jalgaon (normal) is remarkably increased over FY average. CADA Nagpur, CADA Jalgaon (deficit) and YIC Yavatmal (normal) had output more than their respective past maximum values.
The performance of OIC Osmanabad (highly deficit), AIC Akola, CADA Jalgaon & NIPC Dhule (deficit), CADA Jalgaon, CADA Nashik & PIC Pune (normal),
23

CIPC chandrapur (surplus), CIPC Chandrapur, KIC Kolhapur, KIC Ratnagiri (abundant) during 2003-04 was very good.
Minor Projects
It is interesting to note that six circles in deficit plan group show increase over FY average whereas five circles in normal, one circle in surplus and three circles in abundant plan group had decreasing trend over FY average.
Seven circles from different plan groups could cross the State target.
The performance of AIC Akola, BIPC Buldhana, BIPC Parali, CADA Aurangabad (Deficit), CADA Nashik (Normal), KIC Ratnagiri & NKIPC Thane during 2003-04 was very good.
IV) Output per unit Irrigation Water Supply
Major Projects
Excepting UWPC Amravati (deficit) CIPC Chandrapur & CADA Pune (normal) and CADA Pune & KIC Kolhapur (abundant) all circles have shown improvement over FY average.
The performance of NIC Nanded, NIPC Dhule (deficit), CADA Aurangabad, CADA Jalgaon, CADA Pune (normal), CIPC Chandrapur, KIC Kolhapur (abundant) during 2003-04 was very good.
Medium Projects
OIC Osmanabad (highly deficit), AIC Akola, NIPC Dhule & CADA Jalgaon (deficit), YIC Yavatmal, CADA Nashik, PIC Pune & CADA Jalgaon (normal), CADA Nagpur & CIPC Chandrapur (surplus) and CIPC Chandrapur (abundant) have achieved the State target surpassing the FY average. Their performance during 2003-04 was very good.
YIC Yavatmal (normal) and CIPC Chandrapur (surplus) have crossed their past maximum value.
Average performance of circles in deficit, normal and surplus planning groups was above the State target.
Minor Projects
Six circles each from deficit & normal and two from abundant plan group show increasing trend over FY average.
The performance of AIC Akola, BIPC Buldhana, BIPC Parli & CADA Aurangabad (deficit), CADA Nagpur, CADA Nashik, NIC Nanded, (normal), and KIC Ratnagiri (abundant) during 2003-04 was very good as these circles have crossed the State target.
V) Cost Recovery Ratio
Major Projects
The performance of four circles in deficit, seven in normal, one in surplus and three in abundant plan group during 2003-04 was very good as these circles are having cost recovery ratio more than one. This is because of special drive taken for recovery of water charges, especially the arrears thereof.
Performance of TIC Thane (abundant) is remarkably high.
24

Medium Projects
BIPC Parli, AIC Akola, OIC Osmanabad and BIPC Buldhana (deficit), NIC Nanded, PIC Pune and CIPC Chandrapur (normal) could achieve the State target. Therefore, the performance of these circles during 2003-04 is very good. CADA Jalgaon, CADA Aurangabad, CADA Nagpur (deficit), YIC Yavatmal, CADA Nashik (normal) though could not achieve the State target have set highest-ever achievement.
Minor Projects
Six circles each from deficit & normal, one from surplus and three from abundant plan group show rising trend over FY average.
The performance of AIC Akola (deficit) and CIPC Chandrapur (normal) during 2003-04 was very good.
VI) Total O & M Cost per unit Area
Major Projects
All circles in surplus and abundant plan groups have improved over FY average except CADA Aurangabad, AIC Akola, CADA Jalgaon & CADA Beed (deficit) and CADA Solapur, YIC Yavatmal, CIPC Chandrapur all the remaining circles in normal.
Total O&M cost per unit area in case of projects in CADA Beed (deficit) is exceptionally high due to non availability of water in three out of four projects and nominal irrigation in four projects.
Similarly the performance of NIPC Dhule (deficit), NIC Nagpur (normal), KIC Kolhapur (abundant) during 2003-04 was very good.
Medium Projects
CADA Jalgaon, CADA Nagpur, AIC Aurangabad, NIPC Dhule, NIC Nanded (deficit), CADA Jalgaon, CIPC Chandrapur, NIC Nanded, CADA Nashik (normal), CIPC Chandrapur (surplus) and KIC Ratnagiri, CIPC Chandrapur (abundant) have brought down the O&M cost sizably. The performance of AIC Aurangabad, BIPC Buldhana, CADA Jalgaon, CADA Nagpur (deficit), CADA Jalgaon, CIPC Chandrapur (normal), CADA Nagpur (Surplus) during 2003-04 was very good.
O&M cost per unit area appears to be zero against some circles, the as the ratio is less than one.
Values for OIC Osmanabad and PIC Pune (highly deficit) are very high owing to lesser area under irrigation due to non availability of water.
Minor Projects
CADA Aurangabad and AIC Akola (deficit) and CADA Nashik (normal) have considerably reduced the O&M cost over FY average.
In case of KIC Kolhapur (abundant) the O&M cost has increased by more than 8 times the FY average due to very less area under irrigation (21 Ha) & increased O&M cost.
The average performance of circles in deficit & normal plan groups was near to State target.
25

The performance of CADA Solapur (Highly deficit), BIPC Buldhana, CADA Ahmednagar, CADA Jalgaon (Deficit), NIC Nanded, NIPC Dhule, OIC Osmanaba, AIC Akola, CADA Nashik, CIPC Chandrapur , PIC Pune, YIC Yavatmal (Normal), CADA Nagpur (Surplus) and CIPC Chandrapur (Abundant) during 2003-04 was very good.
VII) Total O & M Cost per unit of Water Supplied
Major projects
Three circles in deficit, four circles in normal, one in surplus and three in abundant plan group have improved their performance over FY average. However, the performance of CADA Jalgaon, NIPC Dhule, UWPC Amravati (deficit), AIC Akola, CADA Ahmednaar, CADA Aurangabad, CADA Jalgaon, CADA Nashik, CADA Pune, CADA Solapur, NIC Nagpur, PIC Pune, UWPC Amravati (normal), CADA Nagpur (surplus), CADA Pune, CIPC Chandrapur, KIC Kolhapur, TIC Thane during 2003-04 was very good.
CADA Beed (deficit) has shown exceptionally high rise in value over FY average, owing to non availability of water.
Medium projects
The values for projects in CADA Solapur and PIC Pune (highly deficit) are exceptionally high owing to lesser availability of water for irrigation. Except CADA Solapur, OIC Osmanabad and PIC Pune (highly deficit), AIC Akola, BIPC Parli, OIC Osmanabad (deficit), CADA Nagpur, CADA Nashik, CIPC Chandrapur, NIPC Dhule, YIC Yavatmal (normal), CADA Nagpur, CIPC Chandrapur (surplus), CIPC Chandrapur (abundant) all other circles in different plan groups performed very good in 2003-04.
Minor Projects
Total O&M cost per unit of water supplied is increased in case of CADA Nagpur (normal) and KIC Kolhapur (abundant). The performance of all the remaining circles except AIC Akola (Deficit), CADA Nagpur, CADA Pune, NIC Nanded (Normal), KIC Kolhapur & KIC Ratnagiri (Abundant) during 2003-04 was very good.
VIII) Revenue per unit of Water Supplied
Major Projects
All the circles have improved their performance over FY average except CIPC Chandrapur and UWPC Amravati (normal).
The performance of CADA Beed (deficit), CADA Nashik, CADA Jalgaon (normal) and TIC Thane (abundant) during 2003-04 was very good, as they have crossed the State target.
Medium Projects
Revenue per unit of water supplied in OIC Osmanabad, PIC Pune and CADA Solapur (highly deficit) and OIC Osmanabad (deficit) is more than the State target. Therefore, these circles full under “Very good” criteria during the year 2003-04.
26

No circle in normal, surplus, abundant plan group could achieve the State target in spite of more availability of water than that of deficit and highly deficit plan groups.
It is observed that the State target can be achieved where the non irrigation use is predominant.
Minor Projects
In case of AIC Akola (deficit), it is observed that the performance is “Very good” value of revenue per unit of water supplied for 2003-04 has substantially increased and crossed the State target.
IX) Mandays for O & M per unit Area
Major Projects
Eight circles from different plan groups could achieve the State target. The performance of UWPC Amravati (deficit), CIPC Chandrapur (normal), NIC Nagpur, PIC Pune, CADA Nagpur (surplus), CADA Pune. CIPC Chandrapur & KIC Kolhapur (abundant) during 2003-04 was very good.
The values for NIPC Dhule, TIC Thane & CADA Jalgaon circles being less than 1, have appeared as zero.
The value of CADA Beed is exceptionally high owing to non availability of water.
Medium projects
The values for PIC Pune & OIC Osmanabad (highly deficit) are exceptionally high owing to lesser availability of water for irrigation.
AIC Aurangabad & NIC Nanded (deficit), CADA Ahmednagar, CADA Nashik, NIC Nanded & NIPC Dhule (Normal) have improved their performance over FY average. The per formance of CADA Solapr (Highly deficit), BIPC Buldhana, CADA Ahemadnagar, CADA Aurangabad, CADA Nagpur, NIPC Dhule, OIC Osmanabad (Deificit), AIC Akola, AIC Aurangabad, CADA Jalgaon, CADA Solapur, CIPC Chandrapur, OIC Osmanabad (Normal), CADA Nagpur, CIPC Chandrapur (Surplus) & KIC Kolhapur, TIC Thane (Abundant) during 2003-04 was very good.
Some circles are having zero values owing to non availability of water for irrigation.
Minor Projects
NIC Nanded & CADA Aurangabad (deficit) have successfully brought down mandays per unit of area from twelve to four & five respectively. Except BIPC Parali, CADA Aurangabad, NIC Nanded (Deficit), CADA Nashik, NIC Nanded, PIC Pune, YIC Yavatmal (Normal) KIC Kolhapur, KIC Ratnagiri, NKIPC Thane (Abundant) the performance of all the remaining circles was very good during 2003-04.
In case of KIC Kolhapur the value has risen from seven to seventeen due to lesser area under irrigation.
27

X) Land Damage Index
Major Projects
There is an improvement in the performance of AIC Akola (deficit), CIPC Chandrapur, CADA Nashik & PIC Pune of normal plan group, CADA Nagpur of surplus plan group over FY average.
Land damage is observed for the first time in CADA Aurangabad (normal) and KIC Kolhapur (abundant) plan group this year.
Medium Projects
Except AIC Aurangabad (Deficit) & AIC Akola (Normal) the performance of all the circles in various plan groups during 2003-04 was very good.
OIC Osmanabad and AIC Aurangabad (deficit) have improved over FY average, whereas an increase in land damage is observed in projects in AIC Akola (normal)
Minor Projects
No land damage is found in any minor project.
XI) Equity Performance
Major Projects
The performance of CADA Ahmednagar (normal) was good, as this circle could distribute available water for irrigation in head, middle and tail reaches quite equitably and have shown improvement in their performance over FY average.
Medium Projects
No circle could supply the irrigation water equitably to head, middle and tail reach farmers. The peformance of circles in all the plan groups fall under the catagory fair.
Minor Projects
XII A) Assessment Recovery Ratio (Irrigation)
Major Projects
Only circles AIC Akola & NIPC Dhule (deficit) and AIC Akola (normal) could achieve the State target of 1. In case of other circles the water charges for irrigation use could not be recovered fully, due to scarcity conditions in the State.
Medium Projects
The performance of AIC Akola, NIPC Dhule (deficit) and AIC Akola (normal) during 2003-04 was very good as they could achieve the State target.
Minor Projects
The water charges could not be recovered fully due to scarcity conditions in the year 2002-03. Therefore, no substantial rise has been observed during 2003-04 in the values for this indicator.
28

XII B) Assessment Recovery Ratio (Non Irrigation)
Major Projects
The performance of six circles (UWPC Amravati, AIC Akola & CADA Aurangabad from deficit, YIC Yavatmal & AIC Akola from normal & TIC Thane from abundant plan group) during 2003-04 was very good as they could achieve the State target & four circles (NIPC Dhule from deficit, PIC Pune & UWPC Amravati from normal & CADA Nagpur from surplus plan group) were near to State target.
Medium Projects
The performance of only one circle Viz. CADA Nagpur (deficit, normal, surplus) during 2003-04 was very good as it could recover the charges for non-irrigation use fully. AIC Akola (deficit), PIC Pune & CIPC Chandrapur (normal) were near to State target.
Minor Projects
YIC Yavatmal & TIC Thane have improved their performance over FY average & achieved the State target.
CADA Jalgaon, AIC Akola & PIC Pune will have to take special drive to improve their performance.
4.2 Conclusions:
This is third successive report on benchmarking of irrigation projects in Maharashtra. With consistent efforts at Government as well as field level, the benchmarking initiative has now become an integral part of performance evalution process of irrigation projects. As State has varied agro-climatic conditions, for comparison of circles on equal footing, grouping of circles is made on basis of plan group of sub-basins which has similar characteristics of rainfall, climate etc.
The following conclusions can be made from the experience gained so far.
1) Irrigation projects under each circle from similar sub-basins are grouped together for comparing their performance which is found to be more appropriate.
2) The benchmarking has helped in identifying the performance gap between different circles in the specified plan groups, which has helped in locating areas for improvement.
3) The circles have initiated actions in order to minimise the gap in comparison with better performing circles and State targets.
4) This initiative has helped in developing healthy competition amongst irrigation circles.
5) Training and capacity building of officers and staff involved in the process has helped in consolidating the Benchmarking process.
6) Benchmarking coupled with water auditing has helped in validation of data and improving the quality of the data base.
7) Benchmarking as a management tool has contributed in improving performance of irrigation projects in the State.
29

Fair
Mo
dera
teG
oo
dV
ery
Go
od
Majo
r &
Mediu
m7692
< 5
384 o
r >
10000
5384 to 6
538 o
r
8846 to 1
0000
6538 to 7
307 o
r
8077 to 8
846
7307 to 8
077
Min
or
6667
< 4
667 o
r >
8667
4667 to 5
667 o
r
7667 to 8
667
5667 to 6
333 o
r
7000 to 7
667
6333 to 7
000
II-P
ote
ntial U
tilis
ed a
nd
Cre
ate
d
All
Pro
jects
0.6
< 0
.42
0.4
2 to 0
.51
0.5
1 to 0
.6>
0.6
Majo
r &
Mediu
m30000
< 2
1000
21000 to 2
5000
25000 to 3
0000
> 3
0000
Min
or
25000
<17500
17500 to 2
1250
21250 to 2
5000
> 2
5000
Majo
r &
Mediu
m3.9
< 2
.73
2.7
3 to 3
.32
3.3
2 to 3
.9>
3.9
0
Min
or
3.7
5<
2.6
32.6
3 to 3
.19
3.1
9 to 3
.75
> 3
.75
V-
Cost R
ecovery
ratio
All
Pro
jects
1<
0.7
0.7
to 0
.85
0.8
5 to 1
> 1
VI-
Tota
l O
& M
cost per
unit
are
a
All
Pro
jects
700
> 9
10 o
r <
500
805 to 9
10
700 to 8
05
500 to 7
00
VII-
Tota
l O
& M
cost per
unit
wate
r supplie
d
All
Pro
jects
0.2
2>
0.2
20.1
9 to 0
.22
0.1
5 to 0
.19
< 0
.15
VIII-
Revenue p
er
unit o
f
wate
r supplie
d
All
Pro
jects
0.2
5<
0.1
80.1
8 to 0
.21
0.2
1 to 0
.25
> 0
.25
IX-
Mandays for
O &
M p
er
unit a
rea
All
Pro
jects
3>
3.9
or
= 0
3.4
5 to 3
.93 to 3
.45
> 0
& <
3
X-
Land D
am
age Index
All
Pro
jects
0>
21 to 2
0 to 1
< 0
XII-A
Assessm
ent of re
covery
(Irr
igation)
All
Pro
jects
1<
0.7
0.7
to 0
.85
0.8
5 to 1
= 1
XII-B
Assessm
ent of re
covery
(Non Irr
igation)
All
Pro
jects
1<
0.7
0.7
to 0
.85
0.8
5 to 1
= 1
i) P
lease s
ee A
ppendix
-XV
II for
deta
ils o
f S
tate
targ
et valu
es.
ii) In c
ase o
f equity, th
e p
erf
orm
ance c
an b
e judged o
n the b
asis
of dis
trib
ution o
f availa
ble
wate
r in
Head,M
iddle
& T
ail
reach e
quitably
.
T
he e
valu
ation for
indic
ato
r N
o. X
I E
quity p
erf
orm
ance h
ave b
een g
iven in A
ppendix
XV
II
I- A
nnual Ir
rigation W
ate
r
Supply
per
unit irr
igate
d a
rea
III-
Outp
ut per
unit irr
igate
d
are
a
IV-
Outp
ut per
unit irr
igation
wate
r supply
Evalu
ati
on
of
perf
orm
an
ce o
f Ir
rig
ati
on
Cir
cle
s (
Serv
ice P
rovid
ers
)
Perf
orm
an
ce f
or
2003-0
4In
dic
ato
rC
ata
go
ryS
tate
Targ
et
30

III
III
IVV
VI
VII
VIII
IXX
XII Irr
XII N
I
AIC
Akola
VG
FG
GF
FM
FF
VG
VG
VG
CA
DA
Aura
ngabad
MF
FF
VG
FG
GF
FF
VG
CA
DA
Beed
FF
FF
VG
FF
VG
FF
FF
CA
DA
Jalg
aon
FF
FF
VG
FV
GF
FV
GF
F
NIC
Nanded
MG
GV
GF
FM
FF
MF
F
NIP
C D
hule
FM
VG
VG
VG
VG
VG
MF
VG
VG
G
UW
PC
Am
ravati
GG
FF
MF
VG
FV
GV
GF
VG
AIC
Akola
MV
GF
FV
GM
VG
FF
VG
VG
VG
CA
DA
Ahm
ednagar
GV
GF
FM
GV
GF
FM
FF
CA
DA
Aura
ngabad
MG
VG
VG
FF
VG
FF
GF
F
CA
DA
Jalg
aon
FV
GV
GV
GV
GF
VG
VG
FV
GF
F
CA
DA
Nashik
FG
VG
FV
GF
VG
VG
FF
MM
CA
DA
Pune
MG
GV
GF
GV
GF
FV
GF
F
CA
DA
Sola
pur
FF
VG
GV
GF
FV
GF
FF
FM
CIP
C C
handra
pur
FV
GF
FF
FF
FV
GF
FF
NIC
Nagpur
FF
FF
VG
VG
VG
GV
GF
FF
PIC
Pune
FV
GM
FV
GG
VG
GV
GF
FG
UW
PC
Am
ravati
FF
VG
FV
GG
VG
FF
VG
FG
YIC
Yavatm
al
MF
FF
FF
GF
FV
GF
VG
Surp
lus
CA
DA
Nagpur
G
VG
MM
VG
MV
GF
VG
FF
G
CA
DA
Pune
FV
GF
GV
GF
VG
FV
GF
FF
CIP
C C
handra
pur
FV
GG
VG
FF
VG
FV
GV
GF
F
KIC
Kolh
apur
FG
VG
VG
VG
VG
VG
FV
GF
FF
TIC
Thane
FF
VG
FV
GF
VG
VG
FV
GF
VG
VG
= V
ER
Y G
OO
D, G
= G
OO
D, M
= M
OD
ER
AT
E, F
= F
AIR
NO
TE
;T
he p
erf
orm
ance is v
ery
much a
ffecte
d b
y a
vaila
bili
ty o
f w
ate
r in
the r
eserv
oirs, w
hic
h is d
ependent on r
ain
fall
in the y
ear.
Abundant
Deficit
Norm
al
Ma
jor
Pro
jec
tA
t a g
lan
ce e
valu
ati
on
of
perf
orm
an
ce o
f Ir
rig
ati
on
Cir
cle
s (
Serv
ice p
rovid
ers
) fo
r 2003-0
4
Ind
icato
r N
um
ber
Pla
n G
roup
Circle
31
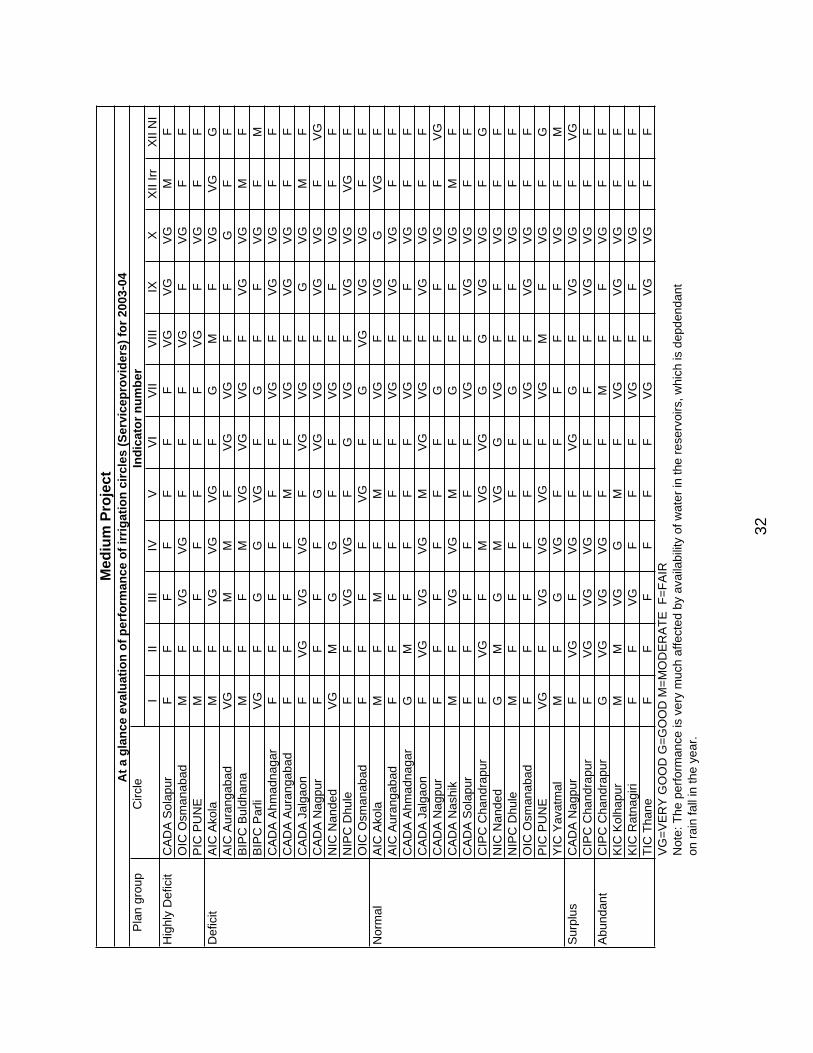
III
III
IVV
VI
VII
VIII
IXX
XII Irr
XII N
I
CA
DA
Sola
pur
FF
FF
FF
FV
GV
GV
GM
F
OIC
Osm
anabad
MF
VG
VG
FF
FV
GF
VG
FF
PIC
PU
NE
M
FF
FF
FF
VG
FV
GF
F
AIC
Akola
M
FV
GV
GV
GF
GM
FV
GV
GG
AIC
Aura
ngabad
VG
FM
MF
VG
VG
FF
GF
F
BIP
C B
uld
hana
MF
FM
VG
VG
VG
FV
GV
GM
F
BIP
C P
arli
VG
FG
GV
GF
GF
FV
GF
M
CA
DA
Ahm
adnagar
FF
FF
FF
VG
FV
GV
GF
F
CA
DA
Aura
ngabad
FF
FF
MF
VG
FV
GV
GF
F
CA
DA
Jalg
aon
FV
GV
GV
GF
VG
VG
FG
VG
MF
CA
DA
Nagpur
FF
FF
GV
GV
GF
VG
VG
FV
G
NIC
Nanded
VG
MG
GF
FV
GF
FV
GF
F
NIP
C D
hule
FF
VG
VG
FG
VG
FV
GV
GV
GF
OIC
Osm
anabad
FF
FF
VG
FG
VG
VG
VG
FF
AIC
Akola
M
FM
FM
FV
GF
VG
GV
GF
AIC
Aura
ngabad
FF
FF
FF
VG
FV
GV
GF
F
CA
DA
Ahm
adnagar
GM
FF
FF
VG
FF
VG
FF
CA
DA
Jalg
aon
FV
GV
GV
GM
VG
VG
FV
GV
GF
F
CA
DA
Nagpur
FF
FF
FF
GF
FV
GF
VG
CA
DA
Nashik
MF
VG
VG
MF
GF
FV
GM
F
CA
DA
Sola
pur
FF
FF
FF
VG
FV
GV
GF
F
CIP
C C
handra
pur
FV
GF
MV
GV
GG
GV
GV
GF
G
NIC
Nanded
GM
GM
VG
GV
GF
FV
GF
F
NIP
C D
hule
MF
FF
FF
GF
FV
GF
F
OIC
Osm
anabad
FF
FF
FF
VG
FV
GV
GF
F
PIC
PU
NE
V
GF
VG
VG
VG
FV
GM
FV
GF
G
YIC
Yavatm
al
MF
GV
GF
FF
FF
VG
FM
CA
DA
Nagpur
FV
GF
VG
FV
GG
FV
GV
GF
VG
CIP
C C
handra
pur
FV
GV
GV
GF
FF
FV
GV
GF
F
CIP
C C
handra
pur
GV
GV
GV
GF
FM
FF
VG
FF
KIC
Kolh
apur
MM
VG
GM
FV
GF
VG
VG
FF
KIC
Ratn
agiri
FF
VG
FF
FV
GF
FV
GF
F
TIC
Thane
FF
FF
FF
VG
FV
GV
GF
F
VG
=V
ER
Y G
OO
D G
=G
OO
D M
=M
OD
ER
AT
E F
=F
AIR
Note
: T
he p
erf
orm
ance is v
ery
much a
ffecte
d b
y a
vaila
bili
ty o
f w
ate
r in
the r
eserv
oirs, w
hic
h is d
epdendant
on r
ain
fall
in the y
ear.
Me
diu
m P
roje
ct
At
a g
lan
ce e
valu
ati
on
of
perf
orm
an
ce o
f ir
rig
ati
on
cir
cle
s (
Serv
icep
rovid
ers
) fo
r 2003-0
4
Ind
icato
r n
um
ber
Pla
n g
roup
Circle
Abundant
Hig
hly
Deficit
Deficit
Norm
al
Surp
lus
32

III
III
IVV
VI
VII
VIII
IXX
XII Irr
XII N
I
Hig
hly
Deficit
CA
DA
Sola
pur
FF
FF
FV
GV
GF
VG
VG
FV
G
AIC
Akola
G
FV
GV
GV
GF
FV
GV
GV
GF
F
BIP
C B
uld
hana
MM
VG
VG
GV
GV
GF
VG
VG
FF
BIP
C P
arli
FF
VG
VG
FM
VG
FF
VG
FF
CA
DA
Ahm
adnagar
FF
FF
FV
GV
GF
VG
VG
FF
CA
DA
Aura
ngabad
FF
VG
VG
FG
VG
FF
VG
FF
CA
DA
Jalg
aon
FV
GF
FF
VG
VG
FV
GV
GF
F
NIC
Nanded
FF
GF
FV
GV
GF
FV
GF
F
NIP
C D
hule
VG
VG
MM
GV
GV
GF
VG
VG
FF
OIC
Osm
anabad
FF
FF
FV
GV
GF
VG
VG
FF
AIC
Akola
F
FF
FF
VG
VG
FV
GV
GF
F
CA
DA
Nagpur
FV
GM
VG
FF
FF
VG
VG
GF
CA
DA
Nashik
GF
VG
VG
FV
GV
GF
FV
GF
F
CA
DA
Pune
GF
FV
GF
VG
VG
FF
VG
FF
CIP
C C
handra
pur
FV
GF
FV
GV
GV
GF
VG
VG
FF
NIC
Nanded
MM
GV
GF
FG
FF
VG
FF
PIC
Pune
MV
GF
FF
VG
VG
FG
VG
FF
YIC
Yavatm
al
MF
FF
FV
GV
GF
FV
GF
VG
Surp
lus
CA
DA
Nagpur
FG
FM
GV
GV
GF
VG
VG
FF
CIP
C C
handra
pur
GV
GF
FF
VG
VG
FV
GV
GF
F
KIC
Kolh
apur
FF
MF
FF
FF
FV
GF
F
KIC
Ratn
agiri
FM
VG
VG
FF
GF
FV
GF
F
NK
IPC
Thane
FF
VG
FF
FV
GF
FV
GM
F
TIC
Thane
FV
GG
FF
FV
GF
VG
VG
FV
G
VG
=V
ER
Y G
OO
D, G
=G
OO
D, M
=M
OD
ER
AT
E, F
=F
AIR
Note
: T
he p
erf
orm
ance is v
ery
much a
ffecte
d b
y a
vaila
bili
ty o
f w
ate
r in
the r
eserv
oirs, w
hic
h is d
epdendant
on r
ain
fall
in the y
ear.
Deficit
Norm
al
Abundant
Min
or
Pro
jec
tA
t a g
lan
ce e
valu
ati
on
of
perf
orm
an
ce o
f ir
rig
ati
on
cir
cle
s (
Serv
icep
rovid
ers
) fo
r 2003-0
4
Ind
icato
r n
um
ber
Pla
n g
roup
Circle
33


Appendices

PlanGroup Subbasin Circle FY Avg 2003-04 PastMax Past Min Avg Per
Deficit Girna NIPC Dhule 4486 3586 6037 3205
Lower Godavari & Manjra CADA Beed 12859 5324 18612 0
Lower Godavari & Manjra NIC Nanded 10323 6387 16100 6277
Purna Tapi UWPC Amravati 10962 7064 25712 4339
Purna Tapi AIC Akola 8535 7528 11048 7205
Lower Godavri & Purna
Dudhana CADA Abad 16339 9939 23153 7013
Purna Tapi & Girna CADA Jalgaon 12229 13137 13320 7588
Normal Middle Tapi CADA Jalgaon 4104 1716 6733 1389
Wardha CIPC Chandrapur 4047 4141 5832 796
Upper Bhima CADA Pune 6637 6128 7629 5532
Painganga YIC Yavatmal 16814 6438 22087 12300
Upper Godavari CADA Anagar 11289 8103 17999 8173
Painganga AIC Akola 13942 9402 16581 11141
Painganga CADA Abad 24962 9731 28105 23449
Upper Bhima & Remaining
Bhima PIC Pune 11273 10095 18875 6838
Remaining Bhima CADA Solapur 11919 11397 16504 6228
Wardha NIC Nagpur 21015 13302 25356 15410
Upper Godvari CADA Nashik 16479 13909 36327 5300
Wardha UWPC Amravati 18132 19848 21005 11682
Surplus Middle Wainganga CADA Nagpur 9515 8232 13142 4842 8232
Abundant Lower Wainganga CIPC Chandrapur 5244 4769 8092 3118
Upper Krishna (W) CADA Pune 7146 5298 8895 5894
Upper Krishna (W) KIC Kolhapur 10078 10307 13871 7121
North Konkan & Middle
Konkan TIC Thane 39175 24859 96380 9518
Notes: 1) Figures in red indicate values exceeding range of graph.
2) Average performance does not include figures in blue.
Appendix-I
6638
9265
6791
Major Projects
Annual Irrigation Water Supply per unit Irrigated Area
0
5000
10000
15000
20000
25000N
IPC
Dh
ule
CA
DA
Be
ed
NIC
Na
nd
ed
UW
PC
Am
rava
ti
AIC
Ako
la
CA
DA
Ab
ad
CA
DA
Ja
lga
on
CA
DA
Ja
lga
on
CIP
C C
ha
nd
rap
ur
CA
DA
Pu
ne
YIC
Ya
va
tma
l
CA
DA
An
ag
ar
AIC
Ako
la
CA
DA
Ab
ad
PIC
Pu
ne
CA
DA
So
lap
ur
NIC
Na
gp
ur
CA
DA
Na
sh
ik
UW
PC
Am
rava
ti
CA
DA
Na
gp
ur
CIP
C C
ha
nd
rap
ur
CA
DA
Pu
ne
KIC
Ko
lha
pu
r
TIC
Th
an
e
Deficit Normal Surplus Abundant
cu
m/h
a
FY Avg 2003-04 Avg Per State Tar 7692 PastMax Past Min
35

PlanGroup Subbasin Circle FY Avg 2003-04 PastMax Past Min Avg Per
Highly Deficit Remaining Bhina CADA Solapur 7263 0 41379 0
Remaining Bhina OIC Osmanabad 9719 5630 14985 0
Upper Krishna (E) & Remaining
BhimaPIC Pune 7077 6500 13746 0
Deficit Manjra CADA A'nagar 4579 0 5503 0
Lower Godavari CADA A'bad 11723 0 22671 5636
Manjra OIC Osmanabad 6816 0 10433 4394
Girna CADA Jalgaon 5032 3681 11967 0
Girna NIPC Dhule 4088 3792 6752 0
Purna (Tapi) BIPC Buldhana 15084 5740 35548 6758
Lower Godavari, Purna
Dudhana, GirnaAIC A'bad 9964 7687 21667 0
Lower Godavari & Manjra NIC Nanded 10579 7948 18571 6941
Lower Godavari & Manjra BIPC Parli 8749 7991 14782 0
Purna (Tapi) AIC Akola 8236 9811 17692 3761
Purna (Tapi) CADA Nagpur 12127 11090 19549 9196
Normal Upper Godavari AIC A'bad 7203 0 8000 0
Remaining Bhina CADA Solapur 3451 0 6264 500
Remaining Bhina OIC Osmanabad 4946 0 6252 0
Panzara & Middle Tapi CADA Jalgaon 3985 3469 13814 103
Wardha CIPC Chandrapur 3957 3926 7104 2274
Upper Godavari CADA Nashik 7395 5634 8474 0
Painganga & Wainganga YIC Yavatmal 14166 6530 20719 0
Upper Bhima & Remaining
BhimaPIC Pune 7837 7651 13162 0
Upper Godavari CADA A'nagar 7169 8232 9607 6195
Painganga NIC Nanded 9887 8383 19164 5377
Painganga AIC Akola 9422 8986 15963 3621
Middle Tapi NIPC Dhule 9435 9758 26500 0
Wardha & Middle Wainganga CADA Nagpur 4329 10256 7128 0
Surplus Middle Wainganga CADA Nagpur 5173 4179 59960 0
Middle Wainganga CIPC Chandrapur 8680 5218 11810 5530
Abundant North Konkan TIC Thane 53113 0 108879 44028
Lower Winganga CIPC Chandrapur 8239 7222 10118 6558
Upper Krishna (W) KIC Kolhapur 10420 9483 22738 0
Vashisthi KIC Ratnagiri 71899 51625 96115 45759
Notes: 1) Figures in red indicate values exceeding range of graph.
2) Average performance doesnot include figures in blue.
4698
8352
Appendix-I
6065
6664
7283
Medium Projects
Annual Irrigation Water Supply per unit Irrigated Area
0
5000
10000
15000
20000
25000
CA
DA
So
lap
ur
OIC
Osm
an
ab
ad
PIC
Pu
ne
CA
DA
A'n
ag
ar
CA
DA
A'b
ad
OIC
Osm
an
ab
ad
CA
DA
Ja
lga
on
NIP
C D
hu
le
BIP
C B
uld
ha
na
AIC
A'b
ad
NIC
Na
nd
ed
BIP
C P
arl
i
AIC
Ako
la
CA
DA
Na
gp
ur
AIC
A'b
ad
CA
DA
So
lap
ur
OIC
Osm
an
ab
ad
CA
DA
Ja
lga
on
CIP
C C
ha
nd
rap
ur
CA
DA
Na
sh
ik
YIC
Ya
va
tma
l
PIC
Pu
ne
CA
DA
A'n
ag
ar
NIC
Na
nd
ed
AIC
Ako
la
NIP
C D
hu
le
CA
DA
Na
gp
ur
CA
DA
Na
gp
ur
CIP
C C
ha
nd
rap
ur
TIC
Th
an
e
CIP
C C
ha
nd
rap
ur
KIC
Ko
lha
pu
r
KIC
Ra
tna
gir
i
Highly
Deficit
Deficit Normal Surplus Abundant
cu
m/h
a
FY Avg 2003-04 Avg Per State Tar 7692 PastMax Past Min
36

PlanGroup Subbasin Circle FY Avg 2003-04 PastMax Past Min Avg Per
Highly Deficit Sina-Bori-Benetura CADA Solapur 4257 0 14210 0 0
Deficit Manjra CADA Ahmednagar 6250 0 9149 4540
Manjra OIC Osmanabad 5556 0 5556 5556
Girna CADA Jalgaon 1667 3969 5383 0
Purna Dudhana & Purna
Tapi
BIPC Buldhana 7328 4693 46400 0
Purna Dudhana & Purna
Tapi
AIC Akola 8451 6128 13426 0
Girna NIPC Dhule 10075 6982 18718 0
Manjra BIPC Parli 7537 8694 9355 0
Lower Godavari CADA Aurangabad 11279 8792 14900 8529
Lower Godavari, Purna
Dudhana & Manjra
NIC Nanded 9920 9350 26194 4898
Normal Painganga AIC Akola 6141 0 8000 5096
Wardha CADA Nagpur 5381 2692 27368 2251
Wardha CIPC Chandrapur 3901 3039 4571 3325
Remaining Godavari &
Painganga
NIC Nanded 6793 5339 12072 4259
Upper Bhima & Remaining
Bhima
PIC Pune 5712 5600 6982 0
Upper Godavari CADA Nashik 8630 7429 12308 0
Upper Bhima CADA Pune 13298 7451 16897 7143
Painganga YIC Yavatmal 11081 8190 25222 7618
Surplus Middle Wainganga CADA Nagpur 4257 3101 6621 2156 3101
Abundant Lower Wainganga CIPC Chandrapur 3687 5856 6641 440
Vaishisthi KIC Ratnagiri 17046 18172 18526 15111
Uppwer Krishna (W) KIC Kolhapur 12846 19476 19333 0
North Konkan & Middle
Konkan
TIC Thane 27700 24866 82857 0
North Konkan & Middle
Konkan
NKIPC Thane 23681 29688 32122 16621
Notes: 1) Figures in red indicate values exceeding range of graph.
2) Average performance doesnot include figures in blue.
Appendix-I
6944
5677
19612
Minor Projects
Annual Irrigation Water Supply per unit Irrigated Area
0
5000
10000
15000
20000
25000
CA
DA
Sol
apur
CA
DA
Ahm
edna
gar
OIC
Osm
anab
ad
CA
DA
Jal
gaon
BIP
C B
uldh
ana
AIC
Ako
la
NIP
C D
hule
BIP
C P
arli
CA
DA
Aur
anga
bad
NIC
Nan
ded
AIC
Ako
la
CA
DA
Nag
pur
CIP
C C
hand
rapu
r
NIC
Nan
ded
PIC
Pun
e
CA
DA
Nas
hik
CA
DA
Pun
e
YIC
Yav
atm
al
CA
DA
Nag
pur
CIP
C C
hand
rapu
r
KIC
Rat
nagi
ri
KIC
Kol
hapu
r
TIC
Tha
ne
NK
IPC
Tha
ne
Highly
Deficit
Deficit Normal Surplus Abundant
cum
/ha
FY Avg 2003-04 Avg Per State Tar 6667 PastMax Past Min
37

PlanGroup Subbasin Circle FY Avg 2003-04 Past Max Past Min Avg Per
Deficit
Lower Godavari &
Manjra CADA Beed 0.22 0.00 0.56 0.00
Purna Tapi & Girna CADA Jalgaon 0.15 0.06 0.34 0.00
Purna Tapi AIC Akola 0.38 0.20 0.71 0.17
Lower Godaari &
Purna Dudhana CADA Aurangabad 0.33 0.25 0.82 0.08
Girna NIPC Dhule 0.38 0.42 0.63 0.17
Purna Tapi UWPC Amravati 0.15 0.51 0.26 0.09
Lower Godavari &
Manjra NIC Nanded 0.40 0.52 0.63 0.30
Normal Painganga YIC Yavatmal 0.17 0.11 0.24 0.11
Remaining Bhima CADA Solapur 0.43 0.15 0.49 0.36
Wardha UWPC Amravati 0.13 0.21 0.16 0.06
Wardha NIC Nagpur 0.28 0.27 0.36 0.19
Upper Godavari CADA Nashik 0.39 0.46 0.88 0.07
Painganga CADA Aurangabad 0.28 0.51 0.34 0.22
Uppper Bhima CADA Pune 0.56 0.54 0.64 0.44
Painganga AIC Akola 0.52 0.61 0.63 0.41
Upper Godavari CADA Ahmednagar 0.67 0.68 1.00 0.33
Upper Bhima &
Remaining Bhima PIC Pune 0.67 0.70 1.00 0.30
Middle Tapi CADA Jalgaon 1.00 1.00 1.00 1.00
Wardha CIPC Chandrapur 1.00 1.00 1.00 1.00
Surplus Middle Wainganga CADA Nagpur 0.69 0.81 1.00 0.46 0.81
Abundant
North Konkan &
Middle Konkan TIC Thane 0.33 0.33 0.91 0.09
Upper Krishna (W) KIC Kolhapur 0.52 0.58 0.79 0.36
Upper Krishna (W) CADA Pune 0.79 0.71 0.90 0.62
Lower Wainganga CIPC Chandrapur 1.00 1.00 1.00 1.00
Note: Average performance doesnot include figures in blue.
Appendix-II
0.38
0.52
0.66
Major Projects
Potential Created and Utilised
0.00
0.10
0.20
0.30
0.40
0.50
0.60
0.70
0.80
0.90
1.00
CA
DA
Beed
CA
DA
Jalg
aon
AIC
Akola
CA
DA
Aura
ngabad
NIP
C D
hule
UW
PC
Am
ravati
NIC
Nanded
YIC
Yavatm
al
CA
DA
Sola
pur
UW
PC
Am
ravati
NIC
Nagpur
CA
DA
Nashik
CA
DA
Aura
ngabad
CA
DA
Pune
AIC
Akola
CA
DA
Ahm
ednagar
PIC
Pune
CA
DA
Jalg
aon
CIP
C C
handra
pur
CA
DA
Nagpur
TIC
Thane
KIC
Kolh
apur
CA
DA
Pune
CIP
C C
handra
pur
Deficit Normal Surplus Abundant
Ratio
FY Avg 2003-04 Avg Per State Tar: 0.60 Past Max Past Min
38

PlanGroup Subbasin Circle FY Avg 2003-04 Past Max Past Min Avg Per
Highly Deficit Sina-Bori-Benetura CADA Solapur 0.19 0.00 0.93 0.00
Sina-Bori-Benetura OIC Osmanabad 0.26 0.00 0.66 0.00
Upper Krishna (E) Sina-
Bori-Benetura
PIC Pune 0.26 0.00 0.59 0.00
Deficit Manjra CADA Ahmednagar 1.00 0.00 0.89 0.00
Manjra OIC Osmanabad 0.42 0.00 0.88 0.06
Lower Godavari CADA Aurangabad 0.19 0.00 0.24 0.05
Lower Godavari &
Manjra
BIPC Parli 0.26 0.14 0.51 0.00
Purna (Tapi) BIPC Buldhana 0.18 0.17 0.36 0.13
Purna (Tapi) AIC Akola 0.30 0.17 0.80 0.06
Lower Godavari ,
Purna Dudhana &
AIC Aurangabad 0.17 0.24 1.00 0.00
Purna (Tapi) CADA Nagpur 0.22 0.29 0.34 0.08
Girna NIPC Dhule 0.27 0.31 0.70 0.04
Lower Godavari &
Manjra
NIC Nanded 0.30 0.44 0.86 0.09
Girna CADA Jalgaon 0.70 0.60 1.00 0.11
Normal Remaining Bhima CADA Solapur 0.27 0.00 0.33 0.20
Remaining Bhima OIC Osmanabad 0.31 0.00 0.48 0.00
Upper Godavari AIC Aurangabad 0.08 0.00 0.25 0.00
Middle Tapi NIPC Dhule 0.12 0.12 0.95 0.00
Painganga & Wardha YIC Yavatmal 0.32 0.17 0.47 0.00
Wardha & Middle
Wainganga
CADA Nagpur 0.24 0.19 0.39 0.11
Painganga AIC Akola 0.45 0.32 0.84 0.17
Upper Bhima &
Remaining Bhima
PIC Pune 0.37 0.32 0.74 0.00
Upper Godavari CADA Nashik 0.25 0.41 0.35 0.00
Upper Godavari CADA Ahmednagar 0.51 0.43 0.86 0.07
Painganga NIC Nanded 0.31 0.50 0.51 0.16
Panzra & Middle Tapi CADA Jalgaon 0.69 0.79 1.00 0.12
Wardha CIPC Chandrapur 0.94 1.00 1.00 0.64
Surplus Middle Wainganga CADA Nagpur 0.65 0.72 1.00 0.02
Middle Wainganga CIPC Chandrapur 1.00 1.00 1.00 1.00
Abundant North Konkan TIC Thane 0.33 0.00 0.38 0.16
Vashisthi KIC Ratnagiri 0.08 0.08 0.12 0.07
Upper Krishna (W) KIC Kolhapur 0.37 0.44 0.65 0.00
Lower Wainganga CIPC Chandrapur 1.00 1.00 1.00 1.00
Notes: 1) Figures in red indicate values exceeding range of graph.
2) Average performance doesnot include figures in blue.
0.86
0.51
Appendix-II
0.00
0.29
0.42
Medium Projects
Potential Created and Utilised
0.00
0.10
0.20
0.30
0.40
0.50
0.60
0.70
0.80
0.90
1.00
CA
DA
Sola
pur
OIC
Osm
anabad
PIC
Pune
CA
DA
Ahm
ednagar
OIC
Osm
anabad
CA
DA
Aura
ngabad
BIP
C P
arli
BIP
C
Buld
hana
AIC
Akola
AIC
Aura
ngabad
CA
DA
Nagpur
NIP
C D
hule
NIC
Nanded
CA
DA
Jalg
aon
CA
DA
Sola
pur
OIC
Osm
anabad
AIC
Aura
ngabad
NIP
C D
hule
YIC
Yavatm
al
CA
DA
Nagpur
AIC
Akola
PIC
Pune
CA
DA
Nashik
CA
DA
Ahm
ednagar
NIC
Nanded
CA
DA
Jalg
aon
CIP
C
Chandra
pur
CA
DA
Nagpur
CIP
C
Chandra
pur
TIC
Thane
KIC
Ratn
agiri
KIC
Kolh
apur
CIP
C
Chandra
pur
Highly
Deficit
Deficit Normal Surplus Abundant
Ratio
FY Avg 2003-04 Avg Per State Tar: 0.60 Past Max Past Min
39

PlanGroup Subbasin Circle FY Avg 2003-04 Past Max Past Min Avg Per
Highly Deficit Sina-Bori-Benetura CADA Solapur 0.51 0.00 0.91 0.00 0.00
Deficit Manjra OIC Osmanabad 0.38 0.00 0.50 0.07
Manjra CADA A'nagar 0.53 0.00 0.89 0.24
Manjra BIPC Parli 0.29 0.25 0.59 0.00
Lower Godavari CADA A'bad 0.28 0.31 0.36 0.21
Lower Godavari, Purna
Dudhana & Manjra
NIC Nanded 0.25 0.36 0.58 0.10
Purna Dudhana & Purna
Tapi
AIC Akola 0.24 0.41 0.73 0.00
Purna Dudhana & Purna
Tapi
BIPC Buldhana 0.36 0.47 2.39 0.00
Girna CADA Jalgaon 1.00 0.77 1.26 0.59
Girna NIPC Dhule 0.55 0.81 1.00 0.00
Normal Painganga AIC Akola 0.56 0.00 0.65 0.45
Painganga YIC Yavatmal 0.19 0.18 0.33 0.07
Upper Bhima CADA Pune 0.14 0.19 0.20 0.08
Upper Godavari CADA Nashik 0.29 0.36 0.55 0.00
Remaining Godavari &
Painganga
NIC Nanded 0.33 0.42 0.61 0.12
Wardha CADA Nagpur 0.61 0.84 0.78 0.14
Uppper Bhima &
Remaining Bhima
PIC Pune 0.72 0.84 1.00 0.00
Wardha CIPC Chandrapur 1.00 1.00 1.00 1.00
Surplus Middle Wainganga CADA Nagpur 0.53 0.51 0.89 0.21 0.51
Abundant Upper Krishna (W) KIC Kolhapur 0.27 0.11 0.51 0.00
North Konkan & Middle
Konkan
NKIPC Thane 0.28 0.28 0.36 0.10
Vashisthi KIC Ratnagiri 0.47 0.47 0.50 0.45
North Konkan & Middle
Konkan
TIC Thane 0.64 0.64 1.03 0.00
Lower Wainganga CIPC Chandrapur 1.00 1.00 1.00 1.00
Notes: 1) Figures in red indicate values exceeding range of graph.
2) Average performance doesnot include figures in blue.
Appendix-II
0.48
0.55
0.50
Minor Projects
Potential Created and Utilised
0.00
0.10
0.20
0.30
0.40
0.50
0.60
0.70
0.80
0.90
1.00
CA
DA
So
lap
ur
OIC
Osm
an
ab
ad
CA
DA
A'n
ag
ar
BIP
C P
arl
i
CA
DA
A'b
ad
NIC
Na
nd
ed
AIC
Ako
la
BIP
C B
uld
ha
na
CA
DA
Ja
lga
on
NIP
C D
hu
le
AIC
Ako
la
YIC
Ya
va
tma
l
CA
DA
Pu
ne
CA
DA
Na
sh
ik
NIC
Na
nd
ed
CA
DA
Na
gp
ur
PIC
Pu
ne
CIP
C C
ha
nd
rap
ur
CA
DA
Na
gp
ur
KIC
Ko
lha
pu
r
NK
IPC
Th
an
e
KIC
Ra
tna
gir
i
TIC
Th
an
e
CIP
C C
ha
nd
rap
ur
Highly
Deficit
Deficit Normal Surplus Abundant
Ra
tio
FY Avg 2003-04 Avg Per State Tar: 0.60 Past Max Past Min
40

PlanGroup Subbasin Circle FY Avg 2003-04 Past Max Past Min Avg Per
Deficit Purna Tapi UWPC Amravati 15771 6979 20029 14203
Lower Godavari &
Manjra
CADA Beed 29472 11706 53030 0
Purna Tapi & Girna CADA Jalgaon 13460 18059 22616 10806
Lower Godavari &
Purna Dudhana
CADA Aurangabad 17629 19257 21146 11186
Purna Tapi AIC Akola 22567 27290 25886 16412
Lower Godavari &
Manjra
NIC Nanded 27201 27376 33023 22466
Girna NIPC Dhule 50820 54857 58043 40726
Normal Wardha CIPC Chandrapur 8769 7150 11739 5650
Wardha NIC Nagpur 10865 10417 16053 9013
Upper Godavari CADA Ahmednagar 15853 12259 19534 13704
Painganga AIC Akola 22588 16068 25524 18484
Painganga YIC Yavatmal 16568 17392 17552 15916
Upper Bhima &
Remaining Bhima
PIC Pune 25747 23205 46757 10297
Upper Bhima CADA Pune 38233 25947 50853 27910
Wardha UWPC Amravati 13304 30871 19391 7536
Upper Godavari CADA Nashik 39928 36640 126149 21002
Painganga CADA Aurangabad 32965 39808 36253 29246
Remaining Bhima CADA Solapur 39497 41367 47432 29203
Middle Tapi CADA Jalgaon 14665 42859 26506 3811
Surplus Middle Wainganga CADA Nagpur 22944 23796 25463 15463 23796
Abundant Upper Krishna (W) CADA Pune 27240 19599 30159 25200
Lower Wainganga CIPC Chandrapur 25518 25904 29413 22187
Upper Krishna (W) TIC Thane 34147 37295 43940 14311
North Konkan &
Middle Konkan
KIC Kolhapur 54657 40936 71116 41788
Notes: 1) Figures in red indicate values exceeding graph.
2) Average Performance doesnot include figures in blue.
Appendix-III
20738
26985
30933
Major Projects
Output per unit Irrigated Area
0
5000
10000
15000
20000
25000
30000
35000
40000
45000
50000
UW
PC
Am
ravati
CA
DA
Beed
CA
DA
Jalg
aon
CA
DA
Aura
ngabad
AIC
Akola
NIC
Nanded
NIP
C D
hule
CIP
C
Chandra
pur
NIC
Nagpur
CA
DA
Ahm
ednagar
AIC
Akola
YIC
Yavatm
al
PIC
Pune
CA
DA
Pune
UW
PC
Am
ravati
CA
DA
Nashik
CA
DA
Aura
ngabad
CA
DA
Sola
pur
CA
DA
Jalg
aon
CA
DA
Nagpur
CA
DA
Pune
CIP
C
Chandra
pur
TIC
Thane
KIC
Kolh
apur
Deficit Normal Surplus Abundant
Rs. / ha
FY Avg 2003-04 Avg Per State Tar: 30000 Past Max Past Min
41

PlanGroup Subbasin Circle FY Avg 2003-04 Past Max Past Min Avg Per
Sina-Bori-Benetura CADA Solapur 18894 0 35727 0
Upper Krishna(E) & Sina-Bori-Benetura PIC Pune 12482 9425 16578 0
Sina-Bori-Benetura OIC Osmanabad 32111 32000 53948 0
Manjra CADA Ahmednagar 9792 0 10567 0
Manjra OIC Osmanabad 18701 0 41844 12455
Lower Godavari CADA Aurangabad 28569 0 31700 17338
Purna Tapi CADA Nagpur 5756 7305 6385 3939
Purna Tapi BIPC Buldhana 15436 17603 30665 10830
Lower Godavari , Purna Dudhana & Girna AIC Aurangabad 21606 23223 42387 0
Lower Godavari, Manjra NIC Nanded 34521 27665 89183 14589
Lower Godavari & Manjra BIPC Parli 33975 28366 83588 0
Girna NIPC Dhule 39424 42867 47060 30832
Purna Tapi AIC Akola 35961 61290 133264 11177
Girna CADA Jalgaon 9488 64024 19048 23
Upper Godavari AIC Aurangabad 24140 0 30142 0
Remaining Bhima OIC Osmanabad 46126 0 54788 0
Remaining Bhima CADA Solapur 7311 0 11928 4469
Wardha CIPC Chandrapur 12316 11235 29270 5285
Upper Godavari CADA Ahmednagar 18362 13794 23776 9855
Wardha & Middle Wainganga CADA Nagpur 8911 14570 15253 0
Middle Tapi NIPC Dhule 16290 19693 35476 0
Painganga AIC Akola 21230 21200 33357 2929
Painganga & Wardha YIC Yavatmal 17632 26784 21706 0
Painganga NIC Nanded 26268 27121 30774 19113
Upper Godavari CADA Nashik 36478 30530 48026 0
Upper Bhima & Remaining Bhima PIC Pune 34975 47900 57324 0
Panzara & Middle Tapi CADA Jalgaon 22534 53882 135919 397
Middle Wainganga CADA Nagpur 19191 19777 51780 0
Middle Wainganga CIPC Chandrapur 37701 38100 41386 35647
North Konkan TIC Thane 15120 0 17842 12263
Upper Krishna (W) KIC Kolhapur 45627 32024 51088 0
Vashishthi KIC Ratnagiri 36520 40313 45225 28466
Lower Wainganga CIPC Chandrapur 42030 41569 43282 40538
Notes: 1) Figures in red indicate values exceeding range of graph.
2) Average performance doesnot include figures in blue.
Surplus
Abundant
20713
34047
26671
28938
37968
Appendix-III
Highly
Deficit
Deficit
Normal
Medium Projects
Output per unit Irrigated Area
0
5000
10000
15000
20000
25000
30000
35000
40000
45000
50000
CA
DA
Sola
pur
PIC
Pune
OIC
Osm
anabad
CA
DA
Ahm
ednagar
OIC
Osm
anabad
CA
DA
Aura
ngabad
CA
DA
Nagpur
BIP
C B
uld
hana
AIC
Aura
ngabad
NIC
Nanded
BIP
C P
arli
NIP
C D
hule
AIC
Akola
CA
DA
Jalg
aon
AIC
Aura
ngabad
OIC
Osm
anabad
CA
DA
Sola
pur
CIP
C C
handra
pur
CA
DA
Ahm
ednagar
CA
DA
Nagpur
NIP
C D
hule
AIC
Akola
YIC
Yavatm
al
NIC
Nanded
CA
DA
Nashik
PIC
Pune
CA
DA
Jalg
aon
CA
DA
Nagpur
CIP
C C
handra
pur
TIC
Thane
KIC
Kolh
apur
KIC
Ratn
agiri
CIP
C C
handra
pur
Highly Deficit Deficit Normal Surplus Abundant
Rs.
/ ha
FY Avg 2003-04 Avg Per State Tar: 30000 Past Max Past Min
42

PlanGroup Subbasin Circle FY Avg 2003-04 Past Max Past Min Avg Per
Highly Deficit Sina-Bori-Benetura CADA Solapur 14168 0 28529 0 0
Deficit Manjra OIC Osmanabad 18541 0 24342 17064
Manjra CADA A'nagar 8338 0 11117 6500
Girna CADA Jalgaon 8731 7018 22385 0
Girna NIPC Dhule 19074 20901 30169 0
Lower Godavari, Purna
Dudhana & Manjra
NIC Nanded 20572 24055 32521 10672
Purna Dudhana &
Purna Tapi
BIPC Buldhana 24860 29187 44974 0
Manjra BIPC Parli 29011 37216 76912 0
Lower Godavari CADA A'bad 22583 39074 23929 20622
Purna Dudhana &
Purna Tapi
AIC Akola 91407 190889 301710 0
Normal Painganga AIC Akola 15898 0 17878 14634
Wardha CIPC Chandrapur 6954 6291 8239 5969
Upper Bhima &
Remaining Bhima
PIC Pune 18671 13117 31824 0
Upper Bhima CADA Pune 15314 15373 18724 11313
Painganga YIC Yavatmal 17606 16905 20000 6789
Wardha CADA Nagpur 21070 21006 21160 20930
Remaining Godavari &
Painganga
NIC Nanded 25617 22125 46660 14186
Upper Godavari CADA Nashik 28802 31700 32724 0
Surplus Middle Wainganga CADA Nagpur 24611 8531 42131 21368 8531
Abundant Lower Wainganga CIPC Chandrapur 13032 11584 22246 758
Upper Krishna (W) KIC Kolhapur 33313 18571 36450 0
North Konkan & Middle
Konkan
TIC Thane 21039 22849 31022 0
North Konkan & Middle
Konkan
NKIPC Thane 61719 57604 151984 43285
Vashisthi KIC Ratnagiri 95500 102312 101659 90200Notes: 1) Figures in red indicate values exceeding graph.
2) Average Performance doesnot include figures in blue.
Appendix-III
26242
18074
27652
Minor Projects
Output per unit Irrigated Area
0
5000
10000
15000
20000
25000
30000
35000
40000
45000
50000
CA
DA
Sola
pur
OIC
Osm
anabad
CA
DA
A'n
agar
CA
DA
Jalg
aon
NIP
C D
hule
NIC
Nanded
BIP
C B
uld
hana
BIP
C P
arli
CA
DA
A'b
ad
AIC
Akola
AIC
Akola
CIP
C
Chandra
pur
PIC
Pune
CA
DA
Pune
YIC
Yavatm
al
CA
DA
Nagpur
NIC
Nanded
CA
DA
Nashik
CA
DA
Nagpur
CIP
C
Chandra
pur
KIC
Kolh
apur
TIC
Thane
NK
IPC
Thane
KIC
Ratn
agiri
Highly
Deficit
Deficit Normal Surplus Abundant
Rs. / ha
FY Avg 2003-04 Avg Per State Tar: 25000 Past Max Past Min
43

PlanGroup Subbasin Circle FY Avg 2003-04 Past Max Past Min Avg Per
Deficit Purna Tapi UWPC Amravati 1.44 0.99 4.62 0.66
Purna Tapi & Girna CADA Jalgaon 1.10 1.37 2.69 0.98
Lower Godavari & Purna
Dhudhana
CADA Aurangabad 1.08 1.94 1.81 0.68
Lower Godavari & Manjra CADA Beed 2.29 2.20 6.27 0.00
Purna Tapi AIC Akola 2.64 3.62 3.59 1.96
Lower Godavari I Manjra NIC Nanded 2.63 4.29 5.26 1.72
Girna NIPC Dhule 11.33 15.30 16.53 6.75
Normal Wardha NIC Nagpur 0.52 0.78 0.63 0.43
Upper Godavari CADA Ahmednagar 1.40 1.51 2.13 0.88
Wardha UWPC Amravati 0.73 1.56 1.10 0.47
Painganga AIC Akola 1.62 1.71 2.13 1.27
Wardha CIPC Chandrapur 2.17 1.73 7.10 1.48
Upper Bhima & Remaining
Bhima
PIC Pune 2.28 2.30 5.65 0.55
Upper Godavari CADA Nashik 2.42 2.63 11.91 0.63
Painganga YIC Yavatmal 0.99 2.70 1.29 0.72
Remaining Bhima CADA Solapur 3.31 3.63 4.77 2.52
Painganga CADA Aurangabad 1.32 4.09 1.47 1.15
Upper Bhima CADA Pune 5.76 4.23 6.67 4.29
Middle Tapi CADA Jalgaon 3.57 24.98 19.09 1.24
Surplus Middle Wainganga CADA Nagpur 2.41 2.89 5.05 1.43 2.89
Abundant North Konkan & Middle
Konkan
TIC Thane 0.87 1.50 4.11 0.15
Upper Krishna (W) CADA Pune 3.81 3.70 5.12 3.02
Upper Krishna (W) KIC Kolhapur 5.42 3.97 7.44 3.01
Lower Wainganga CIPC Chandrapur 4.87 5.43 7.27 3.63
Notes: 1) Figures in red indicate values exceeding range of graph.
2) Average performance doesnot include figures in blue.
Appendix-IV
2.40
2.61
4.37
Major Projects
Output per unit Irrigation Water Supply
0.00
1.00
2.00
3.00
4.00
5.00
6.00
7.00
8.00
9.00
10.00
UW
PC
Am
rava
ti
CA
DA
Ja
lga
on
CA
DA
Au
ran
ga
ba
d
CA
DA
Be
ed
AIC
Ako
la
NIC
Na
nd
ed
NIP
C D
hu
le
NIC
Na
gp
ur
CA
DA
Ah
me
dn
ag
ar
UW
PC
Am
rava
ti
AIC
Ako
la
CIP
C C
ha
nd
rap
ur
PIC
Pu
ne
CA
DA
Na
sh
ik
YIC
Ya
va
tma
l
CA
DA
So
lap
ur
CA
DA
Au
ran
ga
ba
d
CA
DA
Pu
ne
CA
DA
Ja
lga
on
CA
DA
Na
gp
ur
TIC
Th
an
e
CA
DA
Pu
ne
KIC
Ko
lha
pu
r
CIP
C C
ha
nd
rap
ur
Deficit Normal Surplus Abundant
Rs./
cu
m
FY Avg 2003-04 Avg Per State Tar:3.90 Past Max Past Min
44

PlanGroup Subbasin OldCircle FY Avg 2003-04 Past Max Past Min Avg Per
Sina-Bori-Benetura CADA Solapur 2.60 0.00 57.16 0.00
Upper Krishna (E) & Sina-Bori-Benetura PIC Pune 1.76 1.45 5.96 0.00
Sina-Bori-Benetura OIC Osmanabad 3.30 5.68 11.13 0.00
Manjra CADA A'nagar 2.14 0.00 3.00 0.00
Lower Godavari CADA A'bad 2.44 0.00 5.04 0.76
Manjra OIC Osmanabad 2.74 0.00 9.15 1.57
Purna Tapi CADA Nagpur 0.47 0.66 0.65 0.20
Lower Godavari, Purna Dudhana& Girna AIC Aurangabad 2.17 3.02 5.89 0.00
Purna Tapi BIPC Buldhana 1.02 3.07 2.31 0.50
Lower Godavari & Manjra NIC Nanded 3.26 3.48 7.76 1.06
Lower Godavari & Manjra BIPC Parli 3.88 3.55 16.03 0.00
Purna Tapi AIC Akola 4.37 6.25 22.56 0.91
Girna NIPC Dhule 9.64 11.31 70.58 0.00
Girna CADA Jalgaon 1.89 17.39 549.90 0.00
Upper Godavari AIC Aurangabad 3.35 0.00 5.48 0.00
Remaining Bhima CADA Solapur 2.12 0.00 10.24 0.97
Remaining Bhima OIC Osmanabad 9.33 0.00 13.44 0.00
Wardha & Middle Wainganga CADA Nagpur 2.06 1.42 2.14 0.00
Upper Godavari CADA A'nagar 2.56 1.68 3.84 1.09
Middle Tapi NIPC Dhule 1.73 2.02 7.42 0.00
Painganga AIC Akola 2.25 2.36 5.94 0.24
Wardha CIPC Chandrapur 3.11 2.86 6.89 1.72
Painganga NIC Nanded 2.66 3.24 5.72 1.04
Painganga & Wardha YIC Yavatmal 1.24 4.10 3.03 0.00
Upper Godavari CADA Nashik 4.93 5.42 6.52 0.00
Upper Bhima & Remaining Bhima PIC Pune 4.46 6.26 10.16 0.00
Panzara & Middle Tapi CADA Jalgaon 5.66 15.53 58.47 0.64
Middle Wainganga CADA Nagpur 3.71 4.73 18.60 0.00
Middle Wainganga CIPC Chandrapur 4.34 7.30 6.45 3.14
North Konkan TIC Thane 0.28 0.00 0.41 0.11
Vashishthi KIC Ratnagiri 0.51 0.78 0.76 0.30
Upper Krishna(W) KIC Kolhapur 4.38 3.38 13.45 0.00
Lower Wainganga CIPC Chandrapur 5.10 5.76 6.60 4.14
2) Average performance doesnot include figures in blue.
Highly
Deficit
Deficit
Normal
Surplus
Abundant
3.57
6.09
4.49
6.02
3.3
Appendix-IV
Notes: 1) Figures in red indicate values exceeding range of graph.
Medium Projects
Output per unit Irrigation Water Supply
0.00
1.00
2.00
3.00
4.00
5.00
6.00
7.00
8.00
9.00
10.00C
AD
A S
ola
pu
r
PIC
Pu
ne
OIC
Osm
an
ab
ad
CA
DA
A'n
ag
ar
CA
DA
A'b
ad
OIC
Osm
an
ab
ad
CA
DA
Na
gp
ur
AIC
Au
ran
ga
ba
d
BIP
C B
uld
ha
na
NIC
Na
nd
ed
BIP
C P
arli
AIC
Ako
la
NIP
C D
hu
le
CA
DA
Ja
lga
on
AIC
Au
ran
ga
ba
d
CA
DA
So
lap
ur
OIC
Osm
an
ab
ad
CA
DA
Na
gp
ur
CA
DA
A'n
ag
ar
NIP
C D
hu
le
AIC
Ako
la
CIP
C C
ha
nd
rap
ur
NIC
Na
nd
ed
YIC
Ya
va
tma
l
CA
DA
Na
sh
ik
PIC
Pu
ne
CA
DA
Ja
lga
on
CA
DA
Na
gp
ur
CIP
C C
ha
nd
rap
ur
TIC
Th
an
e
KIC
Ra
tna
gir
i
KIC
Ko
lha
pu
r
CIP
C C
ha
nd
rap
ur
Highly Deficit Deficit Normal Surplus Abundant
Rs
./c
um
FY Avg 2003-04 Avg Per State Tar:3.90 Past Max Past Min
45

PlanGroup Subbasin Circle FY Avg 2003-04 Past Max Past Min Avg Per
Highly Deficit Sina-Bori-Benetura CADA Solapur 3.33 0.00 6.66 0.00 0
Deficit Manjra OIC Osmanabad 3.34 0.00 4.38 3.07
Manjra CADA A'nagar 1.33 0.00 1.89 0.94
Girna CADA Jalgaon 5.24 1.77 51.55 0.00
Lower Godavari, Purna
Dudhana & Manjra
NIC Nanded 2.07 2.57 4.58 0.80
Girna NIPC Dhule 1.89 2.99 5.38 0.00
Manjra BIPC Parli 3.85 4.28 16.01 0.00
Lower Godavari CADA A'bad 2.00 4.44 2.50 1.49
Purna Dudhana &
Purna Tapi
BIPC Buldhana 3.39 6.22 7.78 0.00
Purna Dudhana &
Purna Tapi
AIC Akola 10.82 31.15 75.12 0.00
Normal Painganga AIC Akola 2.59 0.00 3.32 2.04
Upper Bhima CADA Pune 1.15 2.06 1.87 0.74
Painganga YIC Yavatmal 1.59 2.06 2.59 0.27
Wardha CIPC Chandrapur 1.78 2.07 1.97 1.64
Upper Bhima &
Remaining
PIC Pune 3.27 2.34 4.81 0.00
Remaining Godavari &
Painganga
NIC Nanded 3.77 4.14 10.34 1.55
Upper Godavari CADA Nashik 3.34 4.27 4.15 0.00
Wardha CADA Nagpur 3.92 7.80 9.34 0.77
Surplus Middle Wainganga CADA Nagpur 5.78 2.75 12.02 4.35 2.75
Abundant North Konkan & Middle
Konkan
TIC Thane 0.76 0.92 2.29 0.00
Upper Krishna (W) KIC Kolhapur 2.59 0.95 19.77 0.00
North Konkan & Middle
Konkan
NKIPC Thane 2.61 1.94 5.90 1.35
Lower Wainganga CIPC Chandrapur 3.53 1.98 7.04 1.73
Vashisthi KIC Ratnagiri 5.60 5.63 5.97 5.17Notes: 1) Figures in red indicate values exceeding range of graph.
2) Average performance doesnot include figures in blue.
Appendix-IV
3.71
3.54
2.28
Minor Projects
Output per unit Irrigation Water Supply
0.00
1.00
2.00
3.00
4.00
5.00
6.00
7.00
8.00
9.00
10.00C
AD
A
So
lap
ur
OIC
Osm
an
ab
ad
CA
DA
A'n
ag
ar
CA
DA
Ja
lga
on
NIC
Na
nd
ed
NIP
C D
hule
BIP
C P
arl
i
CA
DA
A'b
ad
BIP
C
Bu
ldh
an
a
AIC
Ako
la
AIC
Ako
la
CA
DA
Pu
ne
YIC
Ya
va
tma
l
CIP
C
Ch
an
dra
pu
r
PIC
Pu
ne
NIC
Na
nd
ed
CA
DA
Na
sh
ik
CA
DA
Na
gp
ur
CA
DA
Na
gp
ur
TIC
Th
an
e
KIC
Ko
lha
pu
r
NK
IPC
Th
an
e
CIP
C
Ch
an
dra
pu
r
KIC
Ra
tna
gir
i
Highly
Deficit
Deficit Normal Surplus Abundant
Rs./
cu
m
FY Avg 2003-04 Avg Per State Tar:3.90 Past Max Past Min
46

PlanGroup Subbasin Circle FY Avg 2003-04 Past Max Past Min Avg Per
Deficit Purna Tapi AIC Akola 0.69 0.50 1.61 0.28
Lower Godavari &
Purna Dhudhana
NIC Nanded 0.15 0.53 0.46 0.03
Girna UWPC Amravati 0.17 0.74 0.42 0.00
Purna Tapi & Girna CADA Jalgaon 0.41 1.02 0.77 0.23
Lower Godavari &
Manjra
CADA Aurangabad 0.31 1.43 0.58 0.13
Purna Tapi CADA Beed 1.37 1.81 12.00 0.05
Lower Godavari &
Manjra
NIPC Dhule 1.59 3.06 2.20 1.11
Normal Wardha CIPC Chandrapur 0.10 0.02 0.43 0.02
Painganga YIC Yavatmal 0.16 0.24 0.33 0.01
Painganga CADA Aurangabad 0.23 0.33 0.47 0.07
Upper Bhima CADA Pune 0.31 0.62 0.63 0.18
Upper Godavari CADA Ahmednaga 0.50 0.83 8.23 0.14
Wardha UWPC Amravati 1.76 1.05 2.45 0.96
Remaining Bhima CADA Solapur 1.44 1.15 2.18 1.06
Painganga AIC Akola 0.30 1.72 0.38 0.19
Upper Bhima &
Remaining Bhima
PIC Pune 2.40 4.27 12.23 0.73
Wardha NIC Nagpur 2.52 4.74 3.45 1.60
Upper Godavari CADA Nashik 2.77 5.07 57.57 0.09
Middle Tapi CADA Jalgaon 4.45 9.62 10.87 2.45
Surplus Middle Wainganga CADA Nagpur 0.74 1.90 3.00 0.03 1.90
Abundant Lower Wainganga CIPC Chandrapur 0.27 0.46 0.92 0.13
Upper Krishna (W) CADA Pune 0.95 1.66 1.05 0.73
Upper Krishna (W) KIC Kolhapur 1.87 2.75 6.00 0.24
North Konkan &
Middle Konkan
TIC Thane 11.70 48.77 213.59 0.01
Notes: 1) Figures in red indicate values exceeding range of graph.
2) Average performance doesnot include figures in blue.
Appendix-V
1.00
0.85
1.06
Major Projects
Cost Recovery Ratio
0.00
0.50
1.00
1.50
2.00
AIC
Ako
la
NIC
Na
nd
ed
UW
PC
Am
rava
ti
CA
DA
Ja
lga
on
CA
DA
Au
ran
ga
ba
d
CA
DA
Be
ed
NIP
C D
hu
le
CIP
C C
ha
nd
rap
ur
YIC
Ya
va
tma
l
CA
DA
Au
ran
ga
ba
d
CA
DA
Pu
ne
CA
DA
Ah
me
dn
ag
ar
UW
PC
Am
rava
ti
CA
DA
So
lap
ur
AIC
Ako
la
PIC
Pu
ne
NIC
Na
gp
ur
CA
DA
Na
sh
ik
CA
DA
Ja
lga
on
CA
DA
Na
gp
ur
CIP
C C
ha
nd
rap
ur
CA
DA
Pu
ne
KIC
Ko
lha
pu
r
TIC
Th
an
e
Deficit Normal Surplus Abundant
Ra
tio
FY Avg 2003-04 Avg Per State Tar: 1.0 Past Max Past Min
47

Plan Group Subbasin Circle FY Avg 2003-04 Past Max Past Min Avg Per
Upper Krishna (E) & Sina-Bori-Benetura PIC Pune 0.09 0.02 0.74 0.01
Sina-Bori-Benetura CADA Solapur 0.27 0.04 1.17 0.00
Sina-Bori-Benetura OIC Osmanabad 0.99 0.62 4.94 0.00
Manjra CADA A'nagar 0.05 0.00 0.29 0.00
Girna NIPC Dhule 0.15 0.36 0.47 0.00
Girna CADA Jalgaon 0.13 0.48 0.41 0.00
Lower Godavari & Manjra NIC Nanded 0.19 0.56 1.44 0.02
Lower Godavari Purna Dudhana& Girna AIC Aurangabad 0.08 0.61 2.01 0.00
Lower Godavari CADA A'bad 0.27 0.78 0.35 0.15
Purna Tapi CADA Nagpur 0.21 0.93 0.30 0.14
Lower Godavari & Manjra BIPC Parli 0.45 1.06 1.96 0.06
Purna Tapi AIC Akola 0.45 1.09 4.66 0.02
Manjra OIC Osmanabad 1.86 2.17 17.92 0.03
Purna Tapi BIPC Buldhana 0.92 4.19 5.65 0.00
Upper Godavari CADA A'nagar 0.18 0.00 2.05 0.03
Upper Godavari AIC A'bad 0.70 0.00 1.96 0.00
Remaining Bhima CADA Solapur 0.05 0.00 0.10 0.00
Remaining Bhima OIC Osmanabad 0.52 0.00 1.17 0.27
Wardha & Middle Wainganga CADA Nagpur 0.18 0.07 0.23 0.13
Middle Tapi NIPC Dhule 0.30 0.25 0.99 0.00
Painganga & Wardha YIC Yavatmal 0.07 0.36 0.14 0.00
Painganga AIC Akola 0.16 0.75 3.50 0.03
Upper Godavari CADA Nashik 0.15 0.77 0.60 0.02
Panzara & Middle Tapi CADA Jalgaon 0.16 0.79 1.07 0.01
Painganga NIC Nanded 0.11 1.07 0.32 0.01
Upper Bhima & Remaining Bhima PIC Pune 1.19 1.39 2.70 0.00
Wardha CIPC Chandrapur 0.63 1.45 8.65 0.04
Middle Wainganga CIPC Chandrapur 0.14 0.34 0.61 0.10
Middle Wainganga CADA Nagpur 0.17 0.41 0.69 0.00
North Konkan TIC Thane 0.02 0.00 0.48 0.01
Vashishthi KIC Ratnagiri 0.04 0.12 0.17 0.01
Lower Wainganga CIPC Chandrapur 0.17 0.23 0.54 0.10
Upper Krishna (W) KIC Kolhapur 0.64 0.70 1.97 0.00
0.35
Appendix-V
Notes: 1) Figures in red indicate values exceeding range of graph.
2) Average performance doesnot include figures in blue.
Highly Deficit
Deficit
Normal
Surplus
Abundant
0.23
1.22
0.76
0.38
Medium Projects
Cost Recovery Ratio
0.00
0.50
1.00
1.50
2.00
PIC
Pu
ne
CA
DA
So
lap
ur
OIC
Osm
an
ab
ad
CA
DA
A'n
ag
ar
NIP
C D
hu
le
CA
DA
Ja
lga
on
NIC
Na
nd
ed
AIC
Au
ran
ga
ba
d
CA
DA
A'b
ad
CA
DA
Na
gp
ur
BIP
C P
arl
i
AIC
Ako
la
OIC
Osm
an
ab
ad
BIP
C B
uld
ha
na
CA
DA
A'n
ag
ar
AIC
A'b
ad
CA
DA
So
lap
ur
OIC
Osm
an
ab
ad
CA
DA
Na
gp
ur
NIP
C D
hu
le
YIC
Ya
va
tma
l
AIC
Ako
la
CA
DA
Na
sh
ik
CA
DA
Ja
lga
on
NIC
Na
nd
ed
PIC
Pu
ne
CIP
C C
ha
nd
rap
ur
CIP
C C
ha
nd
rap
ur
CA
DA
Na
gp
ur
TIC
Th
an
e
KIC
Ra
tna
gir
i
CIP
C C
ha
nd
rap
ur
KIC
Ko
lha
pu
r
Highly
Deficit
Deficit Normal Surplus Abundant
Ra
tio
FY Avg 2003-04 Avg Per State Tar: 1.0 Past Max Past Min
48

PlanGroup Subbasin Circle FY Avg 2003-04 Past Max Past Min Avg Per
Highly Deficit Sina-Bori-Benetura CADA Solapur 0.40 0.10 3.09 0.00 0.10
Deficit Manjra OIC Osmanabad 0.11 0.00 0.14 0.01
Manjra CADA A'nagar 0.11 0.00 1.65 0.03
Manjra BIPC Parli 0.16 0.11 0.40 0.04
Lower Godavari CADA A'bad 0.03 0.17 0.05 0.01
Girna CADA Jalgaon 0.17 0.37 2.78 0.00
Lower Godavari, Purna
Dudhana, Manjra NIC Nanded 0.12 0.60 0.64 0.01
Purna Dudhna & Purna
Tapi BIPC Buldhana 0.51 0.88 13.00 0.00
Girna NIPC Dhule 0.22 0.91 1.71 0.00
Purna Dudhna & Purna
Tapi AIC Akola 0.42 1.00 1.54 0.03
Normal Painganga AIC Akola 0.47 0.00 0.53 0.37
Upper Godavari CADA Nashik 0.02 0.08 0.08 0.00
Wardha CADA Nagpur 0.16 0.21 0.47 0.09
Remaining Godavari &
Painganga NIC Nanded 0.14 0.27 2.54 0.02
Painganga YIC Yavatmal 0.14 0.37 0.31 0.06
Upper Bhima CADA Pune 0.09 0.54 0.19 0.03
Upper Bhima & Remaining
Bhima PIC Pune 0.87 0.59 1.64 0.00
Wardha CIPC Chandrapur 0.10 1.93 0.70 0.02
Surplus Middle Wainganga CADA Nagpur 0.24 0.90 1.06 0.01 0.90
Abundant Upper Krishna (W) KIC Kolhapur 1.19 0.00 6.08 0.00
Vashisthi KIC Ratnagiri 1.22 0.20 6.11 0.29
Lower Wainganga CIPC Chandrapur 0.13 0.22 0.92 0.04
North Konkan & Middle
Konkan NKIPC Thane 0.20 0.33 0.37 0.00
North Konkan & Middle
Konkan TIC Thane 0.13 0.44 9.00 0.00
Notes: 1) Figures in red indicate values exceeding range of graph.
2) Average performance doesnot include figures in blue.
Appendix-V
0.58
0.57
0.30
Minor Projects
Cost Recovery Ratio
0.00
0.50
1.00
1.50
2.00
CA
DA
So
lap
ur
OIC
Osm
an
ab
ad
CA
DA
A'n
ag
ar
BIP
C P
arli
CA
DA
A'b
ad
CA
DA
Ja
lga
on
NIC
Na
nd
ed
BIP
C
Bu
ldh
an
a
NIP
C D
hu
le
AIC
Ako
la
AIC
Ako
la
CA
DA
Na
sh
ikC
AD
A
Na
gp
ur
NIC
Na
nd
ed
YIC
Ya
va
tma
l
CA
DA
Pu
ne
PIC
Pu
ne
CIP
C
Ch
an
dra
pu
rC
AD
A
Na
gp
ur
KIC
Ko
lha
pu
rK
IC
Ra
tna
giri
CIP
C
Ch
an
dra
pu
rN
KIP
C
Th
an
e
TIC
Th
an
e
Highly
Deficit
Deficit Normal Surplus Abundant
Ra
tio
FY Avg 2003-04 Avg Per State Tar: 1.0 Past Max Past Min
49
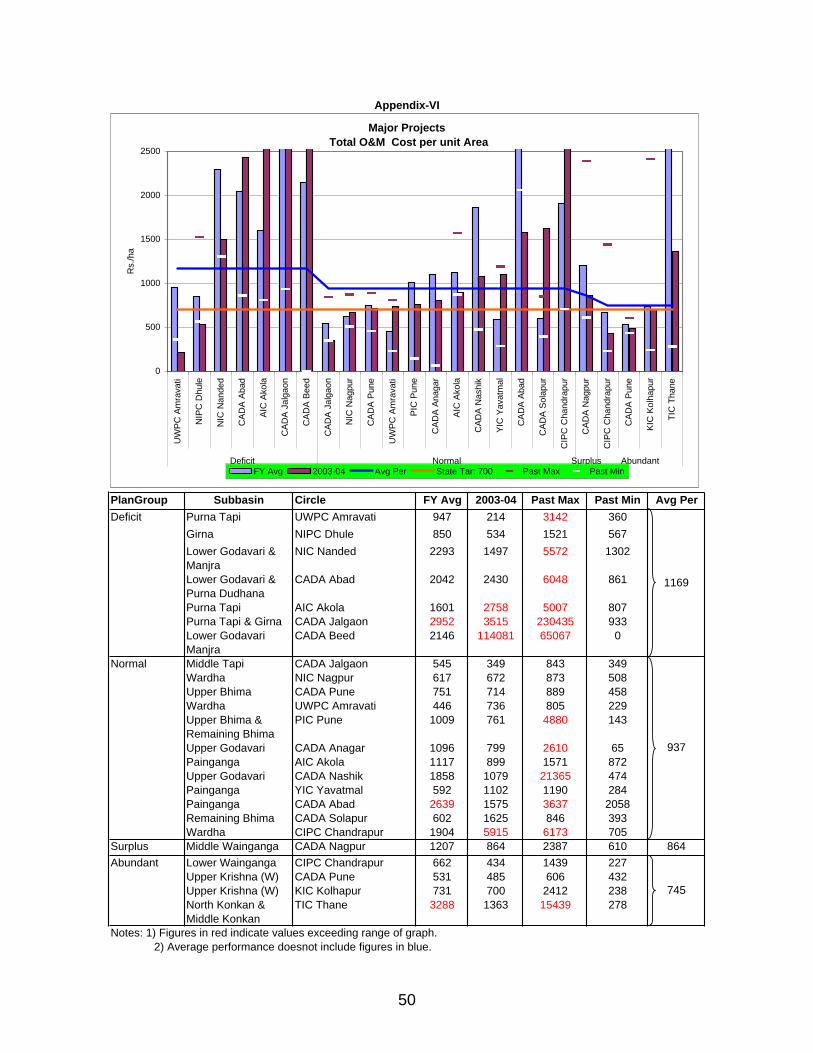
PlanGroup Subbasin Circle FY Avg 2003-04 Past Max Past Min Avg Per
Deficit Purna Tapi UWPC Amravati 947 214 3142 360
Girna NIPC Dhule 850 534 1521 567
Lower Godavari &
Manjra
NIC Nanded 2293 1497 5572 1302
Lower Godavari &
Purna Dudhana
CADA Abad 2042 2430 6048 861
Purna Tapi AIC Akola 1601 2758 5007 807
Purna Tapi & Girna CADA Jalgaon 2952 3515 230435 933
Lower Godavari
Manjra
CADA Beed 2146 114081 65067 0
Normal Middle Tapi CADA Jalgaon 545 349 843 349
Wardha NIC Nagpur 617 672 873 508
Upper Bhima CADA Pune 751 714 889 458
Wardha UWPC Amravati 446 736 805 229
Upper Bhima &
Remaining Bhima
PIC Pune 1009 761 4880 143
Upper Godavari CADA Anagar 1096 799 2610 65
Painganga AIC Akola 1117 899 1571 872
Upper Godavari CADA Nashik 1858 1079 21365 474
Painganga YIC Yavatmal 592 1102 1190 284
Painganga CADA Abad 2639 1575 3637 2058
Remaining Bhima CADA Solapur 602 1625 846 393
Wardha CIPC Chandrapur 1904 5915 6173 705
Surplus Middle Wainganga CADA Nagpur 1207 864 2387 610 864
Abundant Lower Wainganga CIPC Chandrapur 662 434 1439 227
Upper Krishna (W) CADA Pune 531 485 606 432
Upper Krishna (W) KIC Kolhapur 731 700 2412 238
North Konkan &
Middle Konkan
TIC Thane 3288 1363 15439 278
Notes: 1) Figures in red indicate values exceeding range of graph.
2) Average performance doesnot include figures in blue.
Appendix-VI
1169
937
745
Major Projects
Total O&M Cost per unit Area
0
500
1000
1500
2000
2500
UW
PC
Am
ravati
NIP
C D
hule
NIC
Nanded
CA
DA
Abad
AIC
Akola
CA
DA
Jalg
aon
CA
DA
Beed
CA
DA
Jalg
aon
NIC
Nagpur
CA
DA
Pune
UW
PC
Am
ravati
PIC
Pune
CA
DA
Anagar
AIC
Akola
CA
DA
Nashik
YIC
Yavatm
al
CA
DA
Abad
CA
DA
Sola
pur
CIP
C C
handra
pur
CA
DA
Nagpur
CIP
C C
handra
pur
CA
DA
Pune
KIC
Kolh
apur
TIC
Thane
Deficit Normal Surplus Abundant
Rs./
ha
FY Avg 2003-04 Avg Per State Tar: 700 Past Max Past Min
50

Plan Group Subbasin Circle FY Avg 2003-04 Past Max Past Min Avg Per
Sina-Bori-Benetura CADA Solapur 2280 0 15172 0
Sina-Bori-Benetura OIC Osmanabad 621 48519 1688 0
Upper Krishna (E) & Sina-Bori=Benetura PIC Pune 2956 197100 6721 0
Manjra OIC Osmanabad 1106 0 13744 97
Lower Godavari CADA A'bad 2478 0 3772 2031
Manjra CADA A'nagar 2208 0 4933 0
Purna (Tapi) BIPC Buldhana 415 186 3135 0
Girna CADA Jalgaon 1084 509 8458 364
Purna (Tapi) CADA Nagpur 1775 574 3949 1213
Lower Godavari, Purna & Girna AIC A'bad 2730 615 18566 0
Girna NIPC Dhule 1207 732 6462 524
Lower Godavari & Manjra NIC Nanded 1938 1035 7804 367
Lower Godavari & Manjra BIPC Parli 1760 1530 9823 0
Purna (Tapi) AIC Akola 1912 2063 22202 653
Upper Godavari CADA Anagar 1545 0 10571 240
Upper Godavari AIC A'bad 471 0 748 0
Remaining Bhima CADA Solapur 4191 0 9582 1710
Remaining Bhima OIC Osmanabad 693 0 733 0
Panzara CADA Jalgaon 1126 295 10282 448
Wardha CIPC Chandrapur 1017 632 5741 50
Painganga NIC Nanded 1948 733 4170 668
Upper Godavari CADA Nashik 3541 1008 7840 0
Painganga AIC Akola 1292 1076 5196 98
Upper Bhima & Remaining Bhima PIC Pune 711 1091 2586 0
Wardha & Middle Wainganga CADA Nagpur 1595 1769 3010 1050
Middle Tapi NIPC Dhule 2244 2051 41620 0
Painganga & Wardha YIC Yavatmal 1408 2696 2924 0
Middle Wainganga CADA Nagpur 818 615 49525 84
Middle Wainganga CIPC Chandrapur 2118 1328 3437 518
North Konkan TIC Thane 7138 0 13606 1200
Upper Krishna (W) KIC Kolhapur 912 953 3074 0
Lower Wainganga CIPC Chandrapur 1723 1536 3465 606
Vashisthi KIC Ratnagiri 5517 3381 12237 2285
Notes:1) Figures in red indicate values exceeding range of graph.
2) Average performance doesnot include figures in blue.
122809
905
1261
971
1957
Appendix-VI
Abundant
Surplus
Highly Deficit
Deficit
Normal
Medium Projects
Total O&M Cost per unit Area
0
500
1000
1500
2000
2500
CA
DA
Sola
pur
OIC
Osm
anabad
PIC
Pune
OIC
Osm
anabad
CA
DA
A'b
ad
CA
DA
A'n
agar
BIP
C B
uld
hana
CA
DA
Jalg
aon
CA
DA
Nagpur
AIC
A'b
ad
NIP
C D
hule
NIC
Nanded
BIP
C P
arli
AIC
Akola
CA
DA
Anagar
AIC
A'b
ad
CA
DA
Sola
pur
OIC
Osm
anabad
CA
DA
Jalg
aon
CIP
C C
handra
pur
NIC
Nanded
CA
DA
Nashik
AIC
Akola
PIC
Pune
CA
DA
Nagpur
NIP
C D
hule
YIC
Yavatm
al
CA
DA
Nagpur
CIP
C C
handra
pur
TIC
Thane
KIC
Kolh
apur
CIP
C C
handra
pur
KIC
Ratn
agiri
Highly Deficit Deficit Normal Surplus Abundant
Rs./
ha
FY Avg 2003-04 Avg Per State Tar: 700 Past Max Past Min
51

PlanGroup Sub basin Circle FY Avg 2003-04 Past Max Past Min Avg Per
Highly Deficit Sina-Bori-Benetura CADA Solapur 613.54 0.00 6235.29 0.00 0
Deficit Manjra CADA Ahmednagar 2801.02 0.00 11063.22 117.42
Manjra OIC Osmanabad 660.34 0.00 2880.00 496.55
Purna Dudhana & Purba
Tapi
BIPC Buldhana 293.19 222.40 1989.36 0.00
Girna NIPC Dhule 1281.76 370.81 5425.53 0.00
Girna CADA Jalgaon 441.61 529.41 5828.57 13.02
Lower Godavari, Purna
Dudhana & Manjra
NIC Nanded 2427.66 686.94 7683.33 666.67
Lower Godaari CADA Aurangabad 4301.04 731.54 7219.30 2889.53
Manjra BIPC Parli 1405.07 891.79 4555.56 0.00
Purna Dudhana & Purna
Tapi
AIC Akola 3637.45 1304.11 12105.26 0.00
Normal Painganga AIC Akola 444.77 0.00 539.13 389.61
Wardha CIPC Chandrapur 957.92 75.32 2742.86 155.84
Upper Bhima & Remaining
Bhima
PIC Pune 588.03 421.69 2985.92 0.00
Painganga YIC Yavatmal 737.32 633.62 2300.00 341.98
Upper Godavari CADA Nashik 2667.06 690.48 2923.57 0.00
Wardha CADA Nagpur 1229.34 1076.92 5017.54 548.17
Upper Bhima CADA Pune 2366.49 1156.86 4812.50 1072.73
Remaining Godavari &
Painganga
NIC Nanded 2085.42 1166.21 5800.00 98.11
Surplus Middle Wainganga CADA Nagpur 788.95 391.03 2914.97 255.81 391
Abundant Lower Wainganga CIPC Chandrapur 746.26 590.91 2497.25 85.16
North Konkan & Middle
Konkan
TIC Thane 3079.92 2457.42 16163.93 0.00
North Konkan & Middle
Konkan
NKIPC Thane 1968.06 2619.03 15313.23 500.00
Vashisthi KIC Ratnagiri 512.66 2784.95 1373.63 100.00
Upper Krishna (W) KIC Kolhapur 1808.94 15571.43 4027.78 0.00
Notes: 1) Figures in red indicate values exceeding range of graph.
2) Average performance doesnot include figures in blue.
Appendix-VI
677
746
2113
Minor Projects
Total O&M Cost per unit Area
0
500
1000
1500
2000
2500
CA
DA
Sola
pur
CA
DA
Ahm
ednagar
OIC
Osm
anabad
BIP
C
Buld
hana
NIP
C D
hule
CA
DA
Jalg
aon
NIC
Nanded
CA
DA
Aura
ngabad
BIP
C P
arli
AIC
Akola
AIC
Akola
CIP
C
Chandra
pur
PIC
Pune
YIC
Yavatm
al
CA
DA
Nashik
CA
DA
Nagpur
CA
DA
Pune
NIC
Nanded
CA
DA
Nagpur
CIP
C
Chandra
pur
TIC
Thane
NK
IPC
Thane
KIC
Ratn
agiri
KIC
Kolh
apur
Highly
Deficit
Deficit Normal Surplus Abundant
Rs./
ha
FY Avg 2003-04 Avg Per State Tar: 700 Past Max Past Min
52

PlanGroup Subbasin Circle FY Avg 2003-04 Past Max Past Min Avg Per
Deficit Purna Tapi UWPC Amravati 0.09 0.03 0.17 0.03
Girna NIPC Dhule 0.10 0.07 0.44 0.09
Purna Tapi & Girna CADA Jalgaon 0.16 0.10 30.37 0.07
Lower Godavari & Purna
Dudhana
CADA Aurangabad 0.12 0.15 0.86 0.05
Purna Tapi AIC Akola 0.13 0.20 0.51 0.09
Lower Godavari & Manjra NIC Nanded 0.20 0.20 0.36 0.14
Lower Godavari & Manjra CADA Beed 0.14 1.67 6.59 0.00
Normal Wardha UWPC Amravati 0.02 0.03 0.05 0.01
Wardha NIC Nagpur 0.03 0.05 0.04 0.02
Upper Bhima & Remaining
Bhima
PIC Pune 0.07 0.05 0.43 0.01
Remaining Bhima CADA Solapur 0.03 0.06 0.07 0.03
Upper Bhima CADA Pune 0.11 0.08 0.15 0.07
Upper Godavari CADA Nashik 0.11 0.08 0.89 0.03
Middle Tapi CADA Jalgaon 0.08 0.08 0.25 0.06
Painganga AIC Akola 0.10 0.09 0.12 0.06
Upper Godavari CADA Ahmednagar 0.10 0.10 0.26 0.01
Painganga CADA Aurangabad 0.10 0.14 0.13 0.08
Painganga YIC Yavatmal 0.04 0.17 0.08 0.02
Wardha CIPC Chandrapur 0.46 1.43 1.68 0.14
Surplus Middle Wainganga CADA Nagpur 0.11 0.09 0.30 0.06 0.09
Abundant North Konkan & Middle
Konkan
TIC Thane 0.06 0.02 0.24 0.03
Upper Krishna (W) KIC Kolhapur 0.06 0.05 0.23 0.02
Upper Krishna (W) CADA Pune 0.07 0.09 0.09 0.06
Lower Wainganga CIPC Chandrapur 0.13 0.09 0.27 0.05
Notes: 1) Figures in red indicate values exceeding range of graph.
2) Average performance doesnot include figures in blue.
Appendix-VII
0.13
0.09
0.08
Major Projects
Total O&M Cost per unit of Water Supplied
0.00
0.05
0.10
0.15
0.20
0.25U
WP
C A
mra
vati
NIP
C D
hule
CA
DA
Jalg
aon
CA
DA
Aura
ngabad
AIC
Akola
NIC
Nanded
CA
DA
Beed
UW
PC
Am
ravati
NIC
Nagpur
PIC
Pune
CA
DA
Sola
pur
CA
DA
Pune
CA
DA
Nashik
CA
DA
Jalg
aon
AIC
Akola
CA
DA
Ahm
ednagar
CA
DA
Aura
ngabad
YIC
Yavatm
al
CIP
C C
handra
pur
CA
DA
Nagpur
TIC
Thane
KIC
Kolh
apur
CA
DA
Pune
CIP
C C
handra
pur
Deficit Normal Surplus Abundant
Rs./
cum
FY Avg 2003-04 Avg Per State Tar: 0.22 Past Max Past Min
53

PlanGroup Subbasin Circle FY Avg 2003-04 Past Max Past Min Avg Per
Highly Deficit Sina-Bori-Benetura OIC Osmanabad 0.05 0.40 0.25 0.00
Sina-Bori-Benetura CADA Solapur 0.27 17.96 26.16 0.00
Upper Krishna (E) Sina-Bori-Benetura PIC Pune 0.42 30.32 1.04 0.00
Deficit Lower Godavari CADA A'bad 0.18 0.00 0.36 0.15
Manjara CADA A'nagar 0.48 0.00 0.90 0.00
Purna Tapi BIPC Buldhana 0.03 0.03 0.09 0.00
Purna Tapi CADA Nagpur 0.15 0.05 0.22 0.10
Lower Godavari, Purna Dudhana & Girna AIC A'bad 0.25 0.07 2.82 0.00
Girna CADA Jalgaon 0.18 0.12 96.23 0.00
Girna NIPC Dhule 0.16 0.12 5.15 0.00
Lower Godavari & Manjara NIC Nanded 0.17 0.12 0.67 0.04
Lower Godavari & Manjara BIPC Parli 0.18 0.15 1.43 0.00
Manjara OIC Osmanabad 0.11 0.15 2.47 0.02
Purna Tapi AIC Akola 0.21 0.18 5.41 0.09
Normal Upper Godavari AIC A'bad 0.04 0.00 0.14 0.00
Remaining Bhima CADA Solapur 1.21 0.00 3.42 0.75
Upper Godavari CADA A'nagar 0.22 0.00 1.46 0.04
Remaining Bhima OIC Osmanabad 0.14 0.00 0.24 0.00
Panzara & Middle Tapi CADA Jalgaon 0.24 0.07 14.71 0.11
Painganga NIC Nanded 0.19 0.08 0.39 0.08
Painganga AIC Akola 0.13 0.11 0.71 0.01
Upper Bhima & Remaining Bhima PIC Pune 0.09 0.14 1.70 0.00
Wardha CIPC Chandrapur 0.25 0.15 0.83 0.02
Wardha & Middle Wainganga CADA Nagpur 0.37 0.17 0.85 0.00
Upper Godavari CADA Nashik 0.48 0.18 0.93 0.00
Middle Tapi NIPC Dhule 0.17 0.18 4.84 0.00
Painganga & Wardha YIC Yavatmal 0.10 0.41 0.30 0.00
Surplus Middle Wainganga CADA Nagpur 0.16 0.15 1.29 0.00
Middle Wainganga CIPC Chandrapur 0.24 0.25 0.38 0.06
Abundant North Konkan TIC Thane 0.00 0.00 0.28 0.01
Vashisthi KIC Ratnagiri 0.08 0.07 0.13 0.04
Upper Krishna (W) KIC Kolhapur 0.08 0.09 0.37 0.00
Lower Wainganga CIPC Chandrapur 0.21 0.20 0.37 0.09
Notes: 1) Figures in red indicate values exceeding range of graph.
2) Average performance doesnot include figures in blue.
0.2
0.12
Appendix-VII
16.23
0.11
0.17
Medium Projects
Total O&M Cost per unit of Water Supplied
0.00
0.05
0.10
0.15
0.20
0.25O
IC O
sm
an
ab
ad
CA
DA
So
lap
ur
PIC
Pu
ne
CA
DA
A'b
ad
CA
DA
A'n
ag
ar
BIP
C B
uld
ha
na
CA
DA
Na
gp
ur
AIC
A'b
ad
CA
DA
Ja
lga
on
NIP
C D
hu
le
NIC
Na
nd
ed
BIP
C P
arli
OIC
Osm
an
ab
ad
AIC
Ako
la
AIC
A'b
ad
CA
DA
So
lap
ur
CA
DA
A'n
ag
ar
OIC
Osm
an
ab
ad
CA
DA
Ja
lga
on
NIC
Na
nd
ed
AIC
Ako
la
PIC
Pu
ne
CIP
C C
ha
nd
rap
ur
CA
DA
Na
gp
ur
CA
DA
Na
sh
ik
NIP
C D
hu
le
YIC
Ya
va
tma
l
CA
DA
Na
gp
ur
CIP
C C
ha
nd
rap
ur
TIC
Th
an
e
KIC
Ra
tna
gir
i
KIC
Ko
lha
pu
r
CIP
C C
ha
nd
rap
ur
Highly Deficit Deficit Normal Surplus Abundant
Rs
./c
um
FY Avg 2003-04 Avg Per State Tar: 0.22 Past Max Past Min
54

PlanGroup Subbasin Circle FY Avg 2003-04 Past Max Past Min Avg Per
Highly Deficit Sina-Bori-Benetura CADA Solapur 0.13 0.00 1.09 0.00 0.00
Deficit Manjra OIC Osmanabad 0.11 0.00 0.52 0.09
Manjra CADA A'nagar 0.45 0.00 2.44 0.02
Purna Dudhana & Purna
Tapi
BIPC Buldhana 0.04 0.05 0.16 0.00
Girna NIPC Dhule 0.13 0.05 0.59 0.00
Lower Godavari, Purna
Dudhana & Purna Tapi
NIC Nanded 0.24 0.07 1.10 0.05
Lower Godavari CADA A'bad 0.38 0.08 0.57 0.20
Manjra BIPC Parli 0.19 0.10 0.55 0.00
Girna CADA Jalgaon 0.22 0.13 3.22 0.00
Purna Dudhana & Purna
Tapi
AIC Akola 0.38 0.40 1.69 0.00
Normal Painganga AIC Akola 0.07 0.00 0.08 0.06
Wardha CIPC Chandrapur 0.25 0.02 0.75 0.04
Upper Bhima & Remaining
Bhima
PIC Pune 0.10 0.08 0.45 0.00
Painganga YIC Yavatmal 0.07 0.08 0.09 0.04
Upper Godavari CADA Nashik 0.31 0.09 0.42 0.00
Upper Bhima & Remaining
Bhima
CADA Pune 0.18 0.16 0.31 0.09
Remaining Godavari &
Painganga
NIC Nanded 0.31 0.22 0.83 0.01
Wardha CADA Nagpur 0.23 0.40 0.55 0.11
Surplus Middle Wainganga CADA Nagpur 0.19 0.13 0.51 0.07 0.13
Abundant North Konkan & Middle
Konkan
TIC Thane 0.00 0.00 0.80 0.00
North Konkan & Middle
Konkan
NKIPC Thane 0.08 0.09 0.61 0.02
Lower Wainganga CIPC Chandrapur 0.20 0.10 1.89 0.02
Vashisthi KIC Ratnagiri 0.03 0.15 0.08 0.01
Upper Krishna (W) KIC Kolhapur 0.14 0.80 0.79 0.01
Notes: 1) Figures in red indicate values exceeding range of graph.
2) Average performance doesnot include figures in blue.
Appendix-VII
0.15
0.29
0.08
Minor Projects
Total O&M Cost per unit of Water Supplied
0.00
0.05
0.10
0.15
0.20
0.25
CA
DA
Sola
pur
OIC
Osm
anabad
CA
DA
A'n
agar
BIP
C
Buld
hana
NIP
C D
hule
NIC
Nanded
CA
DA
A'b
ad
BIP
C P
arli
CA
DA
Jalg
aon
AIC
Akola
AIC
Akola
CIP
C
Chandra
pur
PIC
Pune
YIC
Yavatm
al
CA
DA
Nashik
CA
DA
Pune
NIC
Nanded
CA
DA
Nagpur
CA
DA
Nagpur
TIC
Thane
NK
IPC
Thane
CIP
C
Chandra
pur
KIC
Ratn
agiri
KIC
Kolh
apur
Highly
Deficit
Deficit Normal Surplus Abundant
Rs./
cum
FY Avg 2003-04 Avg Per State Tar: 0.22 Past Max Past Min
55

PlanGroup Subbasin Circle FY Avg 2003-04 Past Max Past Min Avg Per
Deficit Purna Tapi UWPC Amravati 0.01 0.02 0.05 0.00
Purna Tapi AIC Akola 0.09 0.10 0.25 0.03
Purna Tapi & Girna CADA Jalgaon 0.07 0.11 11.18 0.04
Lower Godavari &
Manzra
NIC Nanded 0.03 0.11 0.10 0.01
Girna NIPC Dhule 0.16 0.20 0.78 0.12
Lower Godavari &
Purna Dudhana
CADA Abad 0.04 0.22 0.50 0.02
Lower Godavari &
Manzra
CADA Beed 0.19 3.02 49.08 0.00
Normal Wardha CIPC Chandrapur 0.04 0.03 0.38 0.03
Wardha UWPC Amravati 0.04 0.03 0.06 0.03
Painganga YIC Yavatmal 0.01 0.04 0.01 0.00
Painganga CADA Abad 0.02 0.05 0.04 0.01
Upper Bhima CADA Pune 0.03 0.05 0.04 0.03
Remaining Bhima CADA Solapur 0.05 0.06 0.14 0.04
Upper Godavari CADA Anagar 0.05 0.08 0.12 0.02
Painganga AIC Akola 0.03 0.15 0.04 0.02
Wardha NIC Nagpur 0.07 0.22 0.11 0.05
Upper Bhima &
Remaining Bhima
PIC Pune 0.16 0.23 4.81 0.05
Upper Godavari CADA Nashik 0.31 0.39 9.01 0.01
Middle Tapi CADA Jalgaon 0.34 0.75 2.73 0.17
Surplus Middle Wainganga CADA Nagpur 0.08 0.17 0.69 0.01 0.17
Abundant Lower Wainganga CIPC Chandrapur 0.03 0.04 0.07 0.01
Upper Krishna (W) CADA Pune 0.07 0.14 0.10 0.05
Uppper Krishna (W) KIC Kolhapur 0.12 0.15 0.27 0.04
North Konkan &
Middle Konkan
TIC Thane 0.66 1.05 12.23 0.00
Notes: 1) Figures in red indicate values exceeding range of graph.
2) Average performance doesnot include figures in blue.
Appendix-VIII
0.15
0.12
0.11
Major Projects
Revenue per unit of Water Supplied
0.00
0.10
0.20
0.30
0.40
UW
PC
Am
rava
ti
AIC
Ako
la
CA
DA
Ja
lga
on
NIC
Na
nd
ed
NIP
C D
hu
le
CA
DA
Ab
ad
CA
DA
Be
ed
CIP
C C
ha
nd
rap
ur
UW
PC
Am
rava
ti
YIC
Ya
va
tma
l
CA
DA
Ab
ad
CA
DA
Pu
ne
CA
DA
So
lap
ur
CA
DA
An
ag
ar
AIC
Ako
la
NIC
Na
gp
ur
PIC
Pu
ne
CA
DA
Na
sh
ik
CA
DA
Ja
lga
on
CA
DA
Na
gp
ur
CIP
C C
ha
nd
rap
ur
CA
DA
Pu
ne
KIC
Ko
lha
pu
r
TIC
Th
an
e
Deficit Normal Surplus Abundant
Rs./
cu
m
FY Avg 2003-04 Past Min Avg Per State Tar: 0.25 Past Max
56

PlanGroup Subbasin Circle FY Avg 2003-04 Past Max Past Min Avg Per
Highly Deficit Sina-Bori-Benetura OIC Osmanabad 0.05 0.25 0.15 0.00
Upper Krishna (E) Sina-Bori-Benetura PIC Pune 0.04 0.56 0.15 0.00
Sina-Bori-Benetura CADA Solapur 0.07 0.77 1.61 0.00
Deficit Lower Godavari CADA Aurangabad 0.05 0.00 0.08 0.04
Manjra CADA Ahmednagar 0.02 0.00 0.06 0.00
Lower Godavari & Manjra AIC Aurangabad 0.02 0.04 0.19 0.00
Girna NIPC Dhule 0.02 0.04 0.86 0.00
Purna Tapi CADA Nagpur 0.03 0.05 0.05 0.02
Girna CADA Jalgaon 0.02 0.06 1.05 0.00
Lower Godavari & Manjra NIC Nanded 0.03 0.07 0.21 0.01
Purna Tapi BIPC Buldhana 0.03 0.14 0.05 0.01
Lower Godavari & Manjra BIPC Parli 0.08 0.16 0.47 0.00
Purna Tapi AIC Akola 0.09 0.20 1.12 0.02
Manjra OIC Osmanabad 0.21 0.33 7.77 0.00
Normal Upper Godavari AIC Aurangabad 0.03 0.00 0.07 0.00
Remaining Bhima OIC Osmanabad 0.07 0.00 0.13 0.00
Remaining Bhima CADA Solapur 0.06 0.00 0.34 0.01
Wardha & Middle Wainganga CADA Nagpur 0.07 0.01 0.19 0.00
Middle Tapi NIPC Dhule 0.05 0.04 1.06 0.00
Upper Godavari CADA Ahmednagar 0.04 0.05 0.10 0.01
Panzara & Middle Tapi CADA Jalgaon 0.04 0.06 1.36 0.01
Painganga AIC Akola 0.02 0.08 0.08 0.01
Painganga NIC Nanded 0.02 0.09 0.06 0.00
Upper Godavari CADA Nashik 0.07 0.14 0.29 0.00
Painganga & Wardha YIC Yavatmal 0.01 0.15 0.01 0.00
Upper Bhima & Remaining Bhima PIC Pune 0.11 0.20 0.35 0.00
Wardha CIPC Chandrapur 0.15 0.22 1.77 0.01
Surplus Middle Wainganga CADA Nagpur 0.03 0.06 0.10 0.00
Middle Wainganga CIPC Chandrapur 0.03 0.09 0.05 0.02
Abundant North Konkan TIC Thane 0.00 0.00 0.01 0.00
Vaishisthi KIC Ratnagiri 0.00 0.01 0.01 0.00
Lower Wainganga CIPC Chandrapur 0.04 0.05 0.05 0.01
Upper Krishna (W) KIC Kolhapur 0.05 0.06 0.44 0.00
Notes: 1) Figures in red indicate values exceeding range of graph.
2) Average performance doesnot include figures in blue.
0.07
0.04
Appendix-VIII
0.53
0.12
0.10
Medium Projects
Revenue per unit of Water Supplied
0.00
0.10
0.20
0.30
0.40
OIC
PIC
Pu
ne
CA
DA
CA
DA
CA
DA
AIC
NIP
C D
hu
le
CA
DA
CA
DA
NIC
Na
nd
ed
BIP
C
BIP
C P
arl
i
AIC
Ako
la
OIC
AIC
OIC
CA
DA
CA
DA
NIP
C D
hu
le
CA
DA
CA
DA
AIC
Ako
la
NIC
Na
nd
ed
CA
DA
YIC
PIC
Pu
ne
CIP
C
CA
DA
CIP
C
TIC
Th
an
e
KIC
Ra
tna
gir
i
CIP
C
KIC
Ko
lha
pu
r
Highly
Deficit
Deficit Normal Surplus Abundant
Rs
./c
um
FY Avg 2003-04 Past Min Avg Per State Tar: 0.25 Past Max
57

PlanGroup Subbasin Circle FY Avg 2003-04 Past Max Past Min Avg Per
Highly Deficit Sina-Bori-Benetura CADA Solapur 0.05 0.00 0.31 0.00 0.00
Deficit Manjra OIC Osmanabad 0.01 0.00 0.02 0.01
Manjra CADA Ahmednagar 0.05 0.00 0.08 0.03
Manjra BIPC Parli 0.03 0.01 0.14 0.00
Lower Godavari CADA Aurangabad 0.01 0.01 0.02 0.00
Purna Dudhana & Purna
Tapi
BIPC Buldhana 0.02 0.04 0.07 0.00
Lower Godavari, Purna
Dudhana & Manjra
NIC Nanded 0.03 0.04 0.07 0.00
Girna CADA Jalgaon 0.04 0.05 1.38 0.00
Girna NIPC Dhule 0.03 0.05 0.07 0.00
Purna Dudhana & Purna
Tapi
AIC Akola 0.16 0.40 0.35 0.00
Normal Painganga AIC Akola 0.03 0.00 0.04 0.02
Upper Godavari CADA Nashik 0.00 0.01 0.01 0.00
Painganga YIC Yavatmal 0.01 0.03 0.01 0.00
Upper Bhima & Remaining
Bhima
PIC Pune 0.09 0.04 0.16 0.00
Wardha CIPC Chandrapur 0.03 0.05 0.04 0.01
Remaining Godavari &
Painganga
NIC Nanded 0.04 0.06 0.13 0.01
Upper Bhima CADA Pune 0.02 0.08 0.04 0.01
Wardha CADA Nagpur 0.04 0.09 0.05 0.02
Surplus Middle Wainganga CADA Nagpur 0.04 0.11 0.10 0.00 0.11
Abundant North Konkan & Middle
Konkan
TIC Thane 0.00 0.00 0.08 0.00
Upper Krishna (W) KIC Kolhapur 0.17 0.00 1.26 0.00
Lower Wainganga CIPC Chandrapur 0.03 0.02 0.18 0.00
North Konkan & Middle
Konkan
NKIPC Thane 0.02 0.03 0.16 0.00
Vashisthi KIC Ratnagiri 0.04 0.03 0.05 0.02
Notes: 1) Figures in red indicate values exceeding range of graph.
2) Average performance doesnot include figures in blue.
0.03
Appendix-VIII
0.09
0.05
Minor Projects
Revenue per unit of Water Supplied
0.00
0.10
0.20
0.30
0.40
CA
DA
Sola
pur
OIC
Osm
anabad
CA
DA
Ahm
ednagar
BIP
C P
arl
i
CA
DA
Aura
ngabad
BIP
C B
uld
hana
NIC
Nanded
CA
DA
Jalg
aon
NIP
C D
hule
AIC
Akola
AIC
Akola
CA
DA
Nashik
YIC
Yavatm
al
PIC
Pune
CIP
C C
handra
pur
NIC
Nanded
CA
DA
Pune
CA
DA
Nagpur
CA
DA
Nagpur
TIC
Thane
KIC
Kolh
apur
CIP
C C
handra
pur
NK
IPC
Thane
KIC
Ratn
agir
i
Highly
Deficit
Deficit Normal Surplus Abundant
Rs./cum
FY Avg 2003-04 Past Min Avg Per State Tar: 0.25 Past Max
58

PlanGroup Subbasin Circle FY Avg 2003-04 Past Max Past Min Avg Per
Deficit Purna Tapi & Girna NIPC Dhule 0 0 0 0
Lower Godavari &
Manjra
UWPC Amravati 6 2 10 4
Girna AIC Akola 2 4 4 1
Lower Godavari &
Purna Dudhana
NIC Nanded 10 8 15 4
Purna Tapi CADA Abad 8 11 36 4
Lower Godavari &
Manjra
CADA Jalgaon 9 20 499 4
Purna Tapi CADA Beed 9 489 168 0
Normal Wardha CADA Jalgaon 0 0 0 0
Middle Tapi NIC Nagpur 2 2 2 1
Wardha CIPC Chandrapur 2 2 3 2
Upper Bhima &
Remaining Bhima
PIC Pune 4 3 14 1
Upper Bhima CADA Pune 3 4 4 3
Wardha UWPC Amravati 7 4 12 6
Painganga AIC Akola 6 5 7 5
Upper Godavari CADA Anagar 6 6 10 4
Remaining Bhima CADA Solapur 3 8 3 2
Upper Godavari CADA Nashik 9 8 33 4
Painganga CADA Abad 13 8 17 11
Painganga YIC Yavatmal 12 22 24 6
Surplus Middle Wainganga CADA Nagpur 3 3 5 2 3
Abundant North Konkan &
Middle Konkan
TIC Thane 0 0 1 0
Lower Wainganga CIPC Chandrapur 2 2 2 1
Upper Krishna (W) CADA Pune 2 2 2 1
Upper Krishna (W) KIC Kolhapur 3 3 10 1
Notes: 1) Figures in red indicate values exceeding range of graph.
2) Average performance doesnot include figures in blue.
Appendix-IX
5
5
2
Major Projects
Mandays for O&M per unit Area
0.00
2.00
4.00
6.00
8.00
10.00
NIP
C D
hu
le
UW
PC
Am
rava
ti
AIC
Ako
la
NIC
Na
nd
ed
CA
DA
Ab
ad
CA
DA
Ja
lga
on
CA
DA
Be
ed
CA
DA
Ja
lga
on
NIC
Na
gp
ur
CIP
C C
ha
nd
rap
ur
PIC
Pu
ne
CA
DA
Pu
ne
UW
PC
Am
rava
ti
AIC
Ako
la
CA
DA
An
ag
ar
CA
DA
So
lap
ur
CA
DA
Nash
ik
CA
DA
Ab
ad
YIC
Ya
va
tma
l
CA
DA
Na
gp
ur
TIC
Th
an
e
CIP
C C
ha
nd
rap
ur
CA
DA
Pu
ne
Deficit Normal Surplus Abundant
Ma
nd
ays/h
a
FY Avg 2003-04 Avg Per State Tar: 3 Past Max Past Min
59

PlanGroup Subbasin Circle FY Avg 2003-04 Past Max Past Min Avg Per
Highly Deficit Sina-Bori-Benetura CADA Solapur 9 0 50 0
Upper Krishna (E) & Sina-Bori-Benetura PIC Pune 10 376 63 0
Sina-Bori-Benetura OIC Osmanabad 3 390 6 0
Deficit Manjra OIC Osmanabad 1 0 7 1
Lower Godavari CADA Aurangabad 8 0 29 5
Manjra CADA Ahmednagar 5 0 6 0
Girna NIPC Dhule 0 0 1 0
Purna Tapi CADA Nagpur 4 2 10 2
Purna Tapi BIPC Buldhana 5 2 45 0
Girna CADA Jalgaon 2 3 21 0
Lower Godavari, Purna Dudhana & Manjra AIC Aurangabad 6 4 16 0
Lower Godavari & Manjra NIC Nanded 18 6 81 8
Purna Tapi AIC Akola 4 6 16 2
Lower Godavari & Manjra BIPC Parli 8 9 49 0
Normal Remaining Bhima OIC Osmanabad 3 0 4 0
Remaining Bhima CADA Solapur 15 0 20 12
Upper Godavari AIC Aurangabad 3 0 11 0
Painganga AIC Akola 1 1 6 0
Panzara & Middle Tapi CADA Jalgaon 2 2 38 0
Wardha CIPC Chandrapur 2 2 3 1
Upper Godavari CADA Ahmednagar 9 4 75 2
Upper Godavari CADA Nashik 7 4 13 0
Painganga NIC Nanded 18 4 48 9
Middle Tapi NIPC Dhule 6 5 87 0
Upper Bhima & Remaining Bhima PIC Pune 6 6 17 0
Wardha & Middle Wainganga CADA Nagpur 5 8 14 3
Painganga & Wardha YIC Yavatmal 28 53 58 0
Surplus Middle Wainganga CADA Nagpur 2 2 91 0
Middle Wainganga CIPC Chandrapur 2 2 2 2
Abundant North Konkan TIC Thane 0 0 0 0
Upper Krishna (W) KIC Kolhapur 2 2 5 0
Lower Wainganga CIPC Chandrapur 5 5 5 5
Vashisthi KIC Ratnagiri 23 24 28 16
Notes: 1) Figures in red indicate values exceeding range of graph.
2) Average performance doesnot include figures in blue.
2
10
Appendix_IX
383
4
9
Medium Projects
Mandays for O&M per unit Area
0.00
2.00
4.00
6.00
8.00
10.00
CA
DA
Sola
pur
PIC
Pune
OIC
Osm
anabad
OIC
Osm
anabad
CA
DA
Aura
ngabad
CA
DA
Ahm
ednagar
NIP
C D
hule
CA
DA
Nagpur
BIP
C B
uld
hana
CA
DA
Jalg
aon
AIC
Aura
ngabad
NIC
Nanded
AIC
Akola
BIP
C P
arl
i
OIC
Osm
anabad
CA
DA
Sola
pur
AIC
Aura
ngabad
AIC
Akola
CA
DA
Jalg
aon
CIP
C C
handra
pur
CA
DA
Ahm
ednagar
CA
DA
Nashik
NIC
Nanded
NIP
C D
hule
PIC
Pune
CA
DA
Nagpur
YIC
Yavatm
al
CA
DA
Nagpur
CIP
C C
handra
pur
TIC
Thane
KIC
Kolh
apur
CIP
C C
handra
pur
KIC
Ratn
agir
i
Highly Deficit Deficit Normal Surplus Abundant
Mandays/h
a
FY Avg 2003-04 Avg Per State Tar: 3 Past Max Past Min
60

PlanGroup Subbasin Circle FY Avg 2003-04 Past Max Past Min Avg Per
Highly Deficit Sina-Bori-Benetura CADA Solapur 3 0 14 0 0
Deficit Manjra OIC Osmanabad 2 0 13 2
Manjra CADA A'nagar 43 0 150 1
Girna CADA Jalgaon 1 1 5 0
Purna Dudhana & Purna
Tapi
BIPC Buldhana 2 2 32 0
Girna NIPC Dhule 4 2 17 0
Purna Dudhana & Purna
Tapi
AIC Akola 5 2 11 0
Lower Godavari, Purna
Dudhana & Manjra
NIC Nanded 12 4 28 2
Lower Godavari CADA A'bad 12 5 27 7
Manjra BIPC Parli 5 5 20 0
Normal Painganga AIC Akola 3 0 3 2
Wardha CIPC Chandrapur 1 1 1 1
Wardha CADA Nagpur 5 1 32 1
Upper Bhima CADA Pune 3 3 4 2
Upper Bhima &
Remaining Bhima
PIC Pune 4 3 65 0
Upper Godavari CADA Nashik 6 5 9 0
Remaining Godavari &
Painganga
NIC Nanded 8 6 19 2
Painganga YIC Yavatmal 15 12 46 7
Surplus Middle Wainganga CADA Nagpur 4 2 12 1 2
Abundant North Konkan & Middle
Konkan
TIC Thane 1 1 2 0
Lower Wainganga CIPC Chandrapur 4 3 7 2
Vashisthi KIC Ratnagiri 5 5 5 5
North Konkan & Middle
Konkan
NKIPC Thane 7 7 34 4
Upper Krishna (W) KIC Kolhapur 7 17 10 0
Notes: 1) Figures in red indicate values exceeding range of graph.
2) Average performance doesnot include figures in blue.
Appendix-IX
3
3
4
Minor Projects
Mandays for O&M per unit Area
0.00
2.00
4.00
6.00
8.00
10.00
CA
DA
Sola
pur
OIC
Osm
anabad
CA
DA
A'n
agar
CA
DA
Jalg
aon
BIP
C
Buld
hana
NIP
C D
hule
AIC
Akola
NIC
Nanded
CA
DA
A'b
ad
BIP
C P
arli
AIC
Akola
CIP
C
Chandra
pur
CA
DA
Nagpur
CA
DA
Pune
PIC
Pune
CA
DA
Nashik
NIC
Nanded
YIC
Yavatm
al
CA
DA
Nagpur
TIC
Thane
CIP
C
Chandra
pur
KIC
Ratn
agiri
NK
IPC
Thane
KIC
Kolh
apur
Highly
Deficit
Deficit Normal Surplus Abundant
Manda
ys/h
a
FY Avg 2003-04 Avg Per State Tar: 3 Past Max Past Min
61

PlanGroup Subbasin Circle FY Avg 2003-04 Past Max Past Min
Deficit Girna NIPC Dhule 0.00 0.00 0.00 0.00
Purna Tapi & Girna CADA Jalgaon 0.00 0.00 0.00 0.00
Purna Tapi UWPC Amravati 0.00 0.00 0.00 0.00
Purna Tapi AIC Akola 1.14 0.00 2.40 0.00
Lower Godavari &
Manjra
NIC Nanded 1.46 1.75 3.34 0.00
Lower Godavari &
Purna Dudhana
CADA A'bad 1.65 2.30 7.31 1.02
Lower Godavari &
Manjra
CADA Beed 5.60 345.97 97.00 0.00
Normal Painganga AIC Akola 0.00 0.00 0.00 0.00
Middle Tapi CADA Jalgaon 0.00 0.00 0.00 0.00
Painganga YIC Yavatmal 0.00 0.00 0.00 0.00
Upper Bhima CADA Pune 0.00 0.00 0.00 0.00
Wardha UWPC Amravati 0.00 0.00 0.00 0.00
Painganga CADA A'bad 0.00 0.42 0.00 0.00
Wardha CIPC Chandrapur 0.49 0.45 2.50 0.34
Wardha NIC Nagpur 0.27 0.47 0.46 0.20
Upper Godavari CADA Nashik 0.52 0.49 2.13 0.00
Upper Godavari CADA A'nagar 1.71 2.34 2.73 0.95
Upper Bhima &
Remaining Bhima
PIC Pune 2.64 2.37 4.07 0.00
Remaining Bhima CADA Solapur 4.05 7.93 7.23 2.91
Surplus Mieele Wainganga CADA Nagpur 0.30 0.05 0.93 0.00
Abundant Lower Wainganga CIPC Chandrapur 0.00 0.00 0.00 0.00
North Konkan &
Middle Konkan
TIC Thane 0.00 0.00 0.00 0.00
Upper Krishna (W) KIC Kolhapur 0.00 1.30 0.00 0.00
Upper Krishna (W) CADA Pune 3.09 4.46 4.02 2.57
Notes: 1) Figures in red indicate values exceeding range of graph.
Appendix-X
Major Projects
Land Damage Index
0.00
2.00
4.00
6.00N
IPC
Dh
ule
CA
DA
Ja
lga
on
UW
PC
Am
rava
ti
AIC
Ako
la
NIC
Na
nd
ed
CA
DA
A'b
ad
CA
DA
Be
ed
AIC
Ako
la
CA
DA
Ja
lga
on
YIC
Ya
va
tma
l
CA
DA
Pu
ne
UW
PC
Am
rava
ti
CA
DA
A'b
ad
CIP
C C
ha
nd
rap
ur
NIC
Na
gp
ur
CA
DA
Na
sh
ik
CA
DA
A'n
ag
ar
PIC
Pu
ne
CA
DA
So
lap
ur
CA
DA
Na
gp
ur
CIP
C C
ha
nd
rap
ur
TIC
Th
an
e
KIC
Ko
lha
pu
r
CA
DA
Pu
ne
Deficit Normal Surplus Abundant
Ra
tio
FY Avg 2003-04 Past Max Past Min
62

PlanGroup Subbasin Circle FY Avg 2003-04 Past Max Past Min
Sina-Bori-Benetura OIC Osmanabad 0.00 0.00 0.00 0.00
Upper Krishna (E) & Sina-
Bori-Benetura
PIC Pune 0.00 0.00 0.00 0.00
Sina-Bori-Benetura CADA Solapur 0.00 0.00 0.00 0.00
Manjra OIC Osmanabad 1.29 0.00 86.54 0.00
Girna CADA Jalgaon 0.00 0.00 0.00 0.00
Purna Tapi CADA Nagpur 0.00 0.00 0.00 0.00
Lower Godavari & Manjra NIC Nanded 0.00 0.00 0.00 0.00
Girna NIPC Dhule 0.00 0.00 0.00 0.00
Purna Tapi AIC Akola 0.00 0.00 0.00 0.00
Purna Tapi BIPC Buldhana 0.00 0.00 0.00 0.00
Lower Godavari CADA A'bad 0.00 0.00 0.00 0.00
Lower Godavari & Manjra BIPC Parli 0.00 0.00 0.00 0.00
Manjra CADA A'nagar 0.00 0.00 0.00 0.00
Lower Godavari, Purna
Dudhana & Girna
AIC A'bad 0.38 0.35 1.80 0.00
Wardha & Middle
Wainganga
CADA Nagpur 0.00 0.00 0.00 0.00
Upper Godavari AIC A'bad 0.00 0.00 0.00 0.00
Upper Godavari CADA A'nagar 0.00 0.00 0.00 0.00
Upper Bhima &
Remaining Bhima
PIC Pune 0.00 0.00 0.00 0.00
Painganga & Wardha YIC Yavatmal 0.00 0.00 0.00 0.00
Panzara & Middle Tapi CADA Jalgaon 0.00 0.00 0.00 0.00
Remaining Bhima OIC Osmanabad 0.00 0.00 0.00 0.00
Middle Tapi NIPC Dhule 0.00 0.00 0.00 0.00
Painganga NIC Nanded 0.00 0.00 0.00 0.00
Wardha CIPC Chandrapur 0.00 0.00 0.00 0.00
Remaining Bhima CADA Solapur 0.00 0.00 0.00 0.00
Upper Godavari CADA Nashik 0.00 0.00 0.00 0.00
Painganga AIC Akola 0.06 0.41 1.70 0.00
Middle Wainganga CADA Nagpur 0.00 0.00 0.00 0.00
Middle Wainganga CIPC Chandrapur 0.00 0.00 0.00 0.00
Lower Wainganga CIPC Chandrapur 0.00 0.00 0.00 0.00
Upper Krishna (W) KIC Kolhapur 0.00 0.00 0.00 0.00
Vashisthi KIC Ratnagiri 0.00 0.00 0.00 0.00
North Konkan TIC Thane 0.00 0.00 0.00 0.00
Notes: 1) Figures in red indicate values exceeding range of graph.
Normal
Surplus
Abundant
Appendix-X
Highly Deficit
Deficit
Medium Projects
Land Damage Index
0.00
0.50
1.00
1.50
OIC
Osm
an
ab
ad
PIC
Pu
ne
CA
DA
So
lap
ur
OIC
Osm
an
ab
ad
CA
DA
Ja
lga
on
CA
DA
Na
gp
ur
NIC
Na
nd
ed
NIP
C D
hu
le
AIC
Ako
la
BIP
C
Bu
ldh
an
a
CA
DA
A'b
ad
BIP
C P
arli
CA
DA
A'n
ag
ar
AIC
A'b
ad
CA
DA
Na
gp
ur
AIC
A'b
ad
CA
DA
A'n
ag
ar
PIC
Pu
ne
YIC
Ya
va
tma
lC
AD
A
Ja
lga
on
OIC
Osm
an
ab
ad
NIP
C D
hu
le
NIC
Na
nd
ed
CIP
C
Ch
an
dra
pu
r
Highly Deficit Deficit Normal
Ra
tio
FY Avg 2003-04 Past Max Past Min
63

Ap
pen
dix
-XI
Majo
r p
roje
cts
Eq
uit
y P
erf
orm
an
ce
0.0
0
0.1
0
0.2
0
0.3
0
0.4
0
0.5
0
0.6
0
0.7
0
0.8
0
0.9
0
1.0
0
CADA
Jalgaon
NIC Nanded
CADA Beed
UWPC
Amravati
NIPC Dhule
AIC Akola
CADA A'bad
AIC Akola
CADA
Jalgaon
CADA A'bad
CADA
A'nagar
UWPC
Amravati
PIC Pune
CIPC
Chandrapur
CADA
Solapur
CADA Pune
CADA Nashik
YIC Yavatmal
NIC Nagpur
CADA Nagpur
CADA Pune
CIPC
Chandrapur
KIC Kolhapur
TIC Thane
Deficit
Norm
al
Surp
lus
Abundant
Ratio
FY
Avg. H
FY
Avg. M
FY
Avg. T
2003-0
4 H
2003-0
4 M
2003-0
4 T
64

He
ad
Mid
dle
Ta
ilH
ea
dM
idd
leT
ail
De
ficit
Pu
rna
Ta
pi &
Girn
aC
AD
A J
alg
ao
n0
.17
0.1
50
.12
0.0
70
.05
0.1
5
Lo
we
r G
od
ava
ri &
Ma
njra
NIC
Na
nd
ed
0.5
00
.47
0.1
60
.63
0.1
40
.47
Lo
we
r G
od
ava
ri &
Ma
njra
CA
DA
Be
ed
0.1
90
.13
0.1
20
.01
0.0
00
.13
Pu
rna
Ta
pi
UW
PC
Am
rava
ti0
.40
0.1
60
.05
0.9
00
.27
0.1
6
Girn
aN
IPC
Dh
ule
0.1
90
.28
0.2
70
.14
0.1
60
.28
Pu
rna
Ta
pi
AIC
Ako
la0
.37
0.2
40
.32
0.2
80
.10
0.2
4
Lo
we
r G
od
ava
ri &
Pu
rna
Du
dh
an
a
CA
DA
A'b
ad
0.5
10
.24
0.3
30
.50
0.2
20
.24
No
rma
lP
ain
ga
ng
aA
IC A
ko
la0
.31
0.3
90
.08
0.3
90
.07
0.3
9
Mid
dle
Ta
pi
CA
DA
Ja
lga
on
0.8
80
.24
0.0
81
.00
0.1
00
.24
Pa
ing
an
ga
CA
DA
A'b
ad
0.1
80
.89
0.1
70
.52
0.5
40
.89
Up
pe
r G
od
ava
riC
AD
A A
'na
ga
r0
.88
0.9
10
.87
0.9
61
.00
0.9
1
Wa
rdh
aU
WP
C A
mra
va
ti0
.40
0.2
00
.05
0.5
70
.11
0.2
0
Up
ee
r B
him
a &
Re
ma
inin
g B
him
a
PIC
Pu
ne
0.7
80
.63
0.5
50
.78
0.3
80
.63
Wa
rdh
aC
IPC
Ch
an
dra
pu
r0
.34
0.4
30
.41
0.3
60
.38
0.4
3
Re
ma
inin
g B
him
aC
AD
A S
ola
pu
r0
.70
0.7
70
.53
0.2
80
.06
0.7
7
Up
pe
r B
him
aC
AD
A P
un
e0
.95
0.9
30
.85
0.9
70
.60
0.9
3
Up
pe
r G
od
ava
riC
AD
A N
ash
ik0
.96
0.7
01
.00
1.0
01
.00
0.7
0
Pa
ing
an
ga
YIC
Ya
va
tma
l0
.40
0.2
50
.04
0.3
20
.00
0.2
5
Wa
rdh
aN
IC N
ag
pu
r0
.47
0.3
30
.04
0.5
20
.05
0.3
3
Su
rplu
sM
idd
le W
ain
ga
ng
aC
AD
A N
ag
pu
r0
.79
0.7
00
.61
0.9
50
.67
0.7
0
Ab
un
da
nt
Up
pe
r K
rish
na
(W
)C
AD
A P
un
e0
.73
0.5
50
.28
0.6
10
.26
0.5
5
Lo
we
r W
ain
ga
ng
aC
IPC
Ch
an
dra
pu
r0
.89
1.0
00
.91
0.9
30
.88
1.0
0
Up
pe
r K
rish
na
(W
)K
IC K
olh
ap
ur
0.5
10
.49
0.5
70
.58
0.5
90
.49
No
rth
Ko
nka
n &
Mid
dle
Ko
nka
n
TIC
Th
an
e0
.53
0.4
80
.45
0.2
60
.34
0.4
8
Pla
nG
rou
pS
ub
ba
sin
FY
Av
g2
00
3-0
4C
irc
le
Ma
jor
Pro
jects
Eq
uity P
erf
orm
an
ce
Ap
pe
nd
ix-X
I
65

Ap
pen
dix
-XI
Med
ium
pro
jects
Eq
uit
y P
erf
orm
an
ce
0.0
0
0.1
0
0.2
0
0.3
0
0.4
0
0.5
0
0.6
0
0.7
0
0.8
0
0.9
0
1.0
0
OIC Osmanabad
PIC Pune
CADA Solapur
NIC Nanded
NIPC Dhule
CADA Jalgaon
OIC Osmanabad
AIC A'bad
CADA Nagpur
BIPC Buldhana
CADA A'nagar
CADA A'bad
BIPC Parli
AIC Akola
CADA A'nagar
AIC A'bad
AIC Akola
YIC Yavatmal
CADA Jalgaon
CADA Nagpur
PIC Pune
OIC Osmanabad
NIPC Dhule
NIC Nanded
CIPC Chandrapur
CADA Solapur
CADA Nashik
CADA Nagpur
CIPC Chandrapur
CIPC Chandrapur
KIC Kolhapur
KIC Ratnagiri
TIC Thane
Hig
hly
De
ficit
De
ficit
No
rma
lS
urp
lus
Ab
un
da
nt
Ratio
FY
Avg H
FY
Avg M
FY
Avg T
2003-0
4 H
2003-0
4 M
2003-0
4 T
66

Head
Mid
dle
Tail
Head
Mid
dle
Tail
Sin
a-B
ori-B
enetu
raO
IC O
sm
anabad
0.3
80.2
90.1
40.0
10.0
00.2
9
Upper
Krishna (
E)
& S
ina-B
ori-
Benetu
ra
PIC
Pune
0.3
60.2
30.2
20.0
10.0
00.2
3
Sin
a-B
ori-B
enetu
raC
AD
A S
ola
pur
0.3
20.1
20.0
50.0
00.0
00.1
2
Low
er
Godavari &
Manjra
NIC
Nanded
0.3
70.4
30.1
50.5
50.2
70.4
3
Girna
NIP
C D
hule
0.1
40.2
40.1
10.1
30.0
50.2
4
Girna
CA
DA
Jalg
aon
0.4
70.4
30.3
70.1
80.2
70.4
3
Manjra
OIC
Osm
anabad
0.6
10.3
80.2
50.0
00.5
60.3
8
Low
er
Godavari, P
urn
a
Dudhana &
Girna
AIC
A'b
ad
0.2
80.2
20.1
50.1
90.2
00.2
2
Purn
a T
api
CA
DA
Nagpur
0.2
50.4
30.1
20.4
30.0
80.4
3
Purn
a T
api
BIP
C B
uld
hana
0.2
80.1
50.1
00.3
70.0
20.1
5
Manjra
CA
DA
A'n
agar
1.0
01.0
01.0
00.0
00.0
01.0
0
Low
er
Godavari
CA
DA
A'b
ad
0.1
80.1
90.1
90.0
00.0
00.1
9
Low
er
Godavari &
Manjra
BIP
C P
arli
0.4
20.3
20.0
80.2
90.0
30.3
2
Purn
a T
api
AIC
Akola
0.2
90.2
40.1
30.1
80.0
60.2
4
Upper
Godavari
CA
DA
A'n
agar
0.4
30.6
70.4
30.4
30.2
50.6
7
Upper
Godavari
AIC
A'b
ad
0.1
50.1
60.0
90.0
00.0
00.1
6
Pain
ganga
AIC
Akola
0.4
30.2
70.1
10.3
40.1
20.2
7
Pain
ganga &
Ward
ha
YIC
Yavatm
al
0.8
50.4
60.0
50.5
80.0
00.4
6
Panzara
& M
iddle
Tapi
CA
DA
Jalg
aon
0.4
50.3
70.2
40.6
50.3
30.3
7
Ward
ha &
Mid
dle
Wain
ganga
CA
DA
Nagpur
0.4
00.0
60.0
61.0
00.0
00.0
6
Upper
Bhim
a &
Rem
ain
ing
Bhim
a
PIC
Pune
0.1
90.3
30.4
60.1
20.4
30.3
3
Rem
ain
ing B
him
aO
IC O
sm
anabad
0.5
60.4
40.1
90.0
00.0
00.4
4
Mid
dle
Tapi
NIP
C D
hule
0.3
40.3
40.2
40.4
50.2
80.3
4
Pain
ganga
NIC
Nanded
0.3
60.5
30.1
20.5
00.3
10.5
3
Ward
ha
CIP
C C
handra
pur
0.0
00.0
00.0
00.0
00.0
00.0
0
Rem
ain
ing B
him
aC
AD
A S
ola
pur
0.4
00.1
40.1
40.0
00.0
00.1
4
Upper
Godavari
CA
DA
Nashik
0.1
90.2
80.2
50.2
00.4
60.2
8
Mid
dle
Wain
ganga
CA
DA
Nagpur
0.6
80.6
70.5
00.7
90.5
40.6
7
Mid
dle
Wain
ganga
CIP
C C
handra
pur
1.0
00.0
01.0
01.0
01.0
00.0
0
Low
er
Wain
ganga
CIP
C C
handra
pur
0.0
00.0
00.0
00.0
00.0
00.0
0
Upper
Krishna (
W)
KIC
Kolh
apur
0.2
90.3
00.4
80.3
20.6
20.3
0
Vashis
thi
KIC
Ratn
agiri
0.1
80.0
80.0
20.1
80.0
20.0
8
Nort
h K
onkan
TIC
Thane
0.2
90.3
00.3
50.0
00.0
00.3
0
Note
s: 1)
Fig
ure
s in r
ed indic
ate
valu
es e
xceedin
g r
ange o
f gra
ph.
Deficit
Norm
al
Surp
lus
Abundant
Hig
hly
Deficit
Me
diu
m p
roje
cts
Eq
uit
y P
erf
orm
an
ce
Circle
Ap
pen
dix
-XI
2003-0
4F
Y A
vg
Subbasin
Pla
n G
roup
67

Ap
pe
nd
ix-X
I
Min
or
pro
jec
ts
Eq
uit
y P
erf
orm
an
ce
0.0
0
0.1
0
0.2
0
0.3
0
0.4
0
0.5
0
0.6
0
0.7
0
0.8
0
0.9
0
1.0
0
CADA
Solapur
NIPC Dhule
CADA
Jalgaon
NIC Nanded
OIC
Osmanabad
AIC Akola
CADA
Aurangabad
BIPC
Buldhana
BIPC Parli
CADA
Ahmednagar
CADA
Nagpur
AIC Akola
PIC Pune
YIC
Yavatmal
NIC Nanded
CIPC
Chandrapur
CADA Pune
CADA
Nashik
CADA
Nagpur
TIC Thane
CIPC
Chandrapur
KIC Kolhapur
KIC Ratnagiri
NKIPC
Thane
Hig
hly
De
ficit
De
ficit
No
rma
lS
urp
lus
Ab
un
da
nt
Ratio
FY
Avg
He
ad
FY
Avg
M
idd
leF
Y A
vg
Ta
il2
00
3-0
4 H
ea
d2
00
3-0
4 M
idd
le2
00
3-0
4
Ta
il
68

Head
Mid
dle
Tail
Head
Mid
dle
Tail
Hig
hly
Deficit
Sin
a-B
ori-B
enetu
raC
AD
A S
ola
pur
0.2
70.6
20.2
00.0
00.0
00.6
2
Deficit
Girna
NIP
C D
hule
0.7
10.5
70.4
80.9
00.5
20.5
7
Girna
CA
DA
Jalg
aon
0.5
60.4
60.4
30.3
90.3
50.4
6
Low
er
Godavari, P
urn
a
Dudhana &
Man
jra
NIC
Nanded
0.2
80.2
80.1
60.3
60.2
30.2
8
Manjra
OIC
Osm
anabad
0.6
60.4
10.0
00.0
00.0
00.4
1
Purn
a D
udhana &
Purn
a
Tapi
AIC
Akola
0.4
20.3
10.1
20.5
80.2
50.3
1
Low
er
Godavari
CA
DA
Aura
ngabad
0.3
80.3
30.1
50.4
10.1
90.3
3
Purn
a D
udhana &
Purn
a
Tapi
BIP
C B
uld
hana
0.3
60.3
30.2
40.5
10.2
00.3
3
Manjra
BIP
C P
arli
0.5
80.3
30.1
10.5
60.0
60.3
3
Manjra
CA
DA
Ahm
ednagar
0.6
20.5
90.2
50.0
00.0
00.5
9
Norm
al
Ward
ha
CA
DA
Nagpur
0.5
80.6
40.5
90.7
31.0
00.6
4
Pain
ganga
AIC
Akola
0.4
70.5
50.1
90.0
00.0
00.5
5
Upper
Bhim
a &
Rem
ain
ing B
him
a
PIC
Pune
0.6
10.5
60.1
90.0
00.0
00.5
6
Pain
ganga
YIC
Yavatm
al
0.1
70.1
90.1
90.2
40.1
30.1
9
Rem
ain
ganga G
odavari
& P
ain
ganga
NIC
Nanded
0.3
40.4
10.2
40.4
70.2
80.4
1
Ward
ha
CIP
C C
handra
pur
0.0
00.0
00.0
00.0
00.0
00.0
0
Upper
Bhim
aC
AD
A P
une
0.1
20.1
40.2
50.1
30.5
20.1
4
Upper
Godavari
CA
DA
Nashik
0.2
90.0
00.0
00.3
60.0
00.0
0
Surp
lus
Mid
dle
Wain
ganga
CA
DA
Nagpur
0.5
60.6
50.4
10.5
10.4
00.6
5
Abundant
Nort
h K
onkan &
Mid
dle
Konkan
TIC
Thane
0.8
30.6
20.4
00.5
50.5
90.6
2
Low
er
Wain
ganga
CIP
C C
handra
pur
0.0
00.0
00.0
00.0
00.0
00.0
0
Upper
Krishna (
W)
KIC
Kolh
apur
0.2
70.3
10.2
40.1
40.1
00.3
1
Vashis
thi
KIC
Ratn
agiri
0.7
70.7
30.1
20.7
60.1
20.7
3
Nort
h K
onkan &
Mid
dle
Konkan
NK
IPC
Thane
0.3
00.3
40.0
30.2
90.0
80.3
4
Ap
pen
dix
-XI
FY
Avg
2003-0
4C
ircle
Min
or
Pro
jects
: Equ
ity P
erfo
rman
ce
Pla
nG
roup
Subbasin
69

PlanGroup Subbasin Circle FY Avg 2003-04 Past Max Past Min Avg Per
Deficit Lower Godavari &
Purna Dudhana
CADA A'bad 0.18 0.12 0.38 0.06
Lower Godavari &
Manjra
NIC Nanded 0.06 0.18 0.26 0.01
Lower Godavari &
Manjra
CADA Beed 0.18 0.18 0.99 0.00
Purna Tapi & Girna CADA Jalgaon 0.84 0.38 1.00 0.21
Purna Tapi UWPC Amravati 0.41 0.42 1.00 0.00
Purna Tapi AIC Akola 0.91 1.00 1.00 0.37
Girna NIPC Dhule 0.82 1.00 1.00 0.65
Normal Wardha NIC Nagpur 0.00 0.00 0.00 0.00
Remaining Bhima CADA Solapur 0.85 0.16 1.00 0.50
Middle Tapi CADA Jalgaon 0.40 0.20 0.89 0.22
Painganga YIC Yavatmal 0.19 0.21 0.36 0.02
Upper Godavari CADA A'nagar 0.52 0.35 0.80 0.26
Painganga CADA A'bad 0.21 0.42 0.23 0.17
Wardha CIPC Chandrapur 0.41 0.49 0.62 0.29
Upper Bhima CADA Pune 0.79 0.56 0.99 0.58
Wardha UWPC Amravati 0.57 0.61 0.80 0.41
Upper Bhima &
Remaining Bhima
PIC Pune 0.71 0.66 0.98 0.27
Upper Godavari CADA Nashik 0.82 0.82 1.00 0.00
Painganga AIC Akola 0.26 1.00 0.51 0.13
Surplus Middle Wainganga CADA Nagpur 0.34 0.49 0.71 0.05 0.49
Abundant Upper Krishna (W) CADA Pune 0.00 0.00 0.00 0.00
North Konkan &
Middle Konkan
TIC Thane 0.29 0.23 1.00 0.00
Lower Wainganga CIPC Chandrapur 0.39 0.34 0.59 0.15
Upper Krishna (W) KIC Kolhapur 0.45 0.35 1.00 0.17
Note: Average performance doesnot include figures in blue.
Appendix-XII-A (Irr.)
0.26
0.45
0.31
Major Projects
Assessment Recovery Ratio (Irrigation)
0.00
0.20
0.40
0.60
0.80
1.00C
AD
A A
'bad
NIC
Nanded
CA
DA
Beed
CA
DA
Jalg
aon
UW
PC
Am
ravati
AIC
Akola
NIP
C D
hule
NIC
Nagpur
CA
DA
Sola
pur
CA
DA
Jalg
aon
YIC
Yavatm
al
CA
DA
A'n
agar
CA
DA
A'b
ad
CIP
C C
handra
pur
CA
DA
Pune
UW
PC
Am
ravati
PIC
Pune
CA
DA
Nashik
AIC
Akola
CA
DA
Nagpur
CA
DA
Pune
TIC
Thane
CIP
C C
handra
pur
KIC
Kolh
apur
Deficit Normal Surplus Abundant
FY Avg 2003-04 Avg Per State Avg: 1.0 Past Max Past Min
70

PlanGroup Subbasin Circle FY Avg 2003-04 Past Max Past Min Avg Per
Lower Godavari &
Purna Dudhana
CADA A'bad 0.18 0.12 0.38 0.06
Lower Godavari &
Manjra
NIC Nanded 0.06 0.18 0.26 0.01
Lower Godavari &
Manjra
CADA Beed 0.18 0.18 0.99 0.00
Purna Tapi & Girna CADA Jalgaon 0.84 0.38 1.00 0.21
Purna Tapi UWPC Amravati 0.41 0.42 1.00 0.00
Purna Tapi AIC Akola 0.91 1.00 1.00 0.37
Girna NIPC Dhule 0.82 1.00 1.00 0.65
Wardha NIC Nagpur 0.00 0.00 0.00 0.00
Remaining Bhima CADA Solapur 0.85 0.16 1.00 0.50
Middle Tapi CADA Jalgaon 0.40 0.20 0.89 0.22
Painganga YIC Yavatmal 0.19 0.21 0.36 0.02
Upper Godavari CADA A'nagar 0.52 0.35 0.80 0.26
Painganga CADA A'bad 0.21 0.42 0.23 0.17
Wardha CIPC Chandrapur 0.41 0.49 0.62 0.29
Upper Bhima CADA Pune 0.79 0.56 0.99 0.58
Wardha UWPC Amravati 0.57 0.61 0.80 0.41
Upper Bhima &
Remaining Bhima
PIC Pune 0.71 0.66 0.98 0.27
Upper Godavari CADA Nashik 0.82 0.82 1.00 0.00
Painganga AIC Akola 0.26 1.00 0.51 0.13
Surplus Middle Wainganga CADA Nagpur 0.34 0.49 0.71 0.05 0.49
Upper Krishna (W) CADA Pune 0.00 0.00 0.00 0.00
North Konkan &
Middle Konkan
TIC Thane 0.29 0.23 1.00 0.00
Lower Wainganga CIPC Chandrapur 0.39 0.34 0.59 0.15
Upper Krishna (W) KIC Kolhapur 0.45 0.35 1.00 0.17
Notes: 1) Figures in red indicate values exceeding range of graph.
2) Average performance doesnot include figures in blue.
0.26
0.45
0.31
Appendix-XII-A
Deficit
Normal
Abundant
Medium Projects
Assessment Recovery Ratio (Irrigation)
0.00
0.20
0.40
0.60
0.80
1.00C
AD
A A
'bad
NIC
Nan
ded
CA
DA
Bee
d
CA
DA
Jal
gaon
UW
PC
Am
rava
ti
AIC
Ako
la
NIP
C D
hule
NIC
Nag
pur
CA
DA
Sol
apur
CA
DA
Jal
gaon
YIC
Yav
atm
al
CA
DA
A'n
agar
CA
DA
A'b
ad
CIP
C C
hand
rapu
r
CA
DA
Pun
e
UW
PC
Am
rava
ti
PIC
Pun
e
CA
DA
Nas
hik
AIC
Ako
la
CA
DA
Nag
pur
CA
DA
Pun
e
TIC
Tha
ne
CIP
C C
hand
rapu
r
KIC
Kol
hapu
r
Deficit Normal Surplus Abundant
FY Avg 2003-04 Avg Per State Avg: 1.0 Past Max Past Min
71
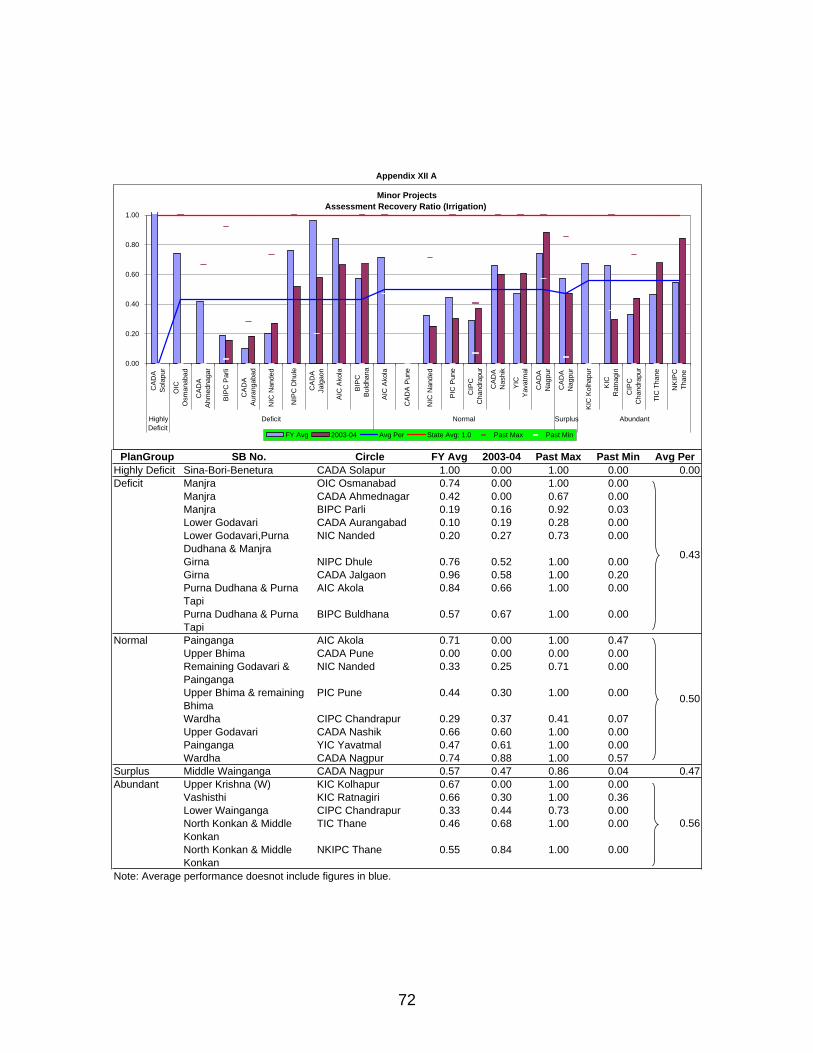
PlanGroup SB No. Circle FY Avg 2003-04 Past Max Past Min Avg Per
Highly Deficit Sina-Bori-Benetura CADA Solapur 1.00 0.00 1.00 0.00 0.00
Deficit Manjra OIC Osmanabad 0.74 0.00 1.00 0.00
Manjra CADA Ahmednagar 0.42 0.00 0.67 0.00
Manjra BIPC Parli 0.19 0.16 0.92 0.03
Lower Godavari CADA Aurangabad 0.10 0.19 0.28 0.00
Lower Godavari,Purna
Dudhana & Manjra
NIC Nanded 0.20 0.27 0.73 0.00
Girna NIPC Dhule 0.76 0.52 1.00 0.00
Girna CADA Jalgaon 0.96 0.58 1.00 0.20
Purna Dudhana & Purna
Tapi
AIC Akola 0.84 0.66 1.00 0.00
Purna Dudhana & Purna
Tapi
BIPC Buldhana 0.57 0.67 1.00 0.00
Normal Painganga AIC Akola 0.71 0.00 1.00 0.47
Upper Bhima CADA Pune 0.00 0.00 0.00 0.00
Remaining Godavari &
Painganga
NIC Nanded 0.33 0.25 0.71 0.00
Upper Bhima & remaining
Bhima
PIC Pune 0.44 0.30 1.00 0.00
Wardha CIPC Chandrapur 0.29 0.37 0.41 0.07
Upper Godavari CADA Nashik 0.66 0.60 1.00 0.00
Painganga YIC Yavatmal 0.47 0.61 1.00 0.00
Wardha CADA Nagpur 0.74 0.88 1.00 0.57
Surplus Middle Wainganga CADA Nagpur 0.57 0.47 0.86 0.04 0.47
Abundant Upper Krishna (W) KIC Kolhapur 0.67 0.00 1.00 0.00
Vashisthi KIC Ratnagiri 0.66 0.30 1.00 0.36
Lower Wainganga CIPC Chandrapur 0.33 0.44 0.73 0.00
North Konkan & Middle
Konkan
TIC Thane 0.46 0.68 1.00 0.00
North Konkan & Middle
Konkan
NKIPC Thane 0.55 0.84 1.00 0.00
Note: Average performance doesnot include figures in blue.
Appendix XII A
0.43
0.50
0.56
Minor Projects
Assessment Recovery Ratio (Irrigation)
0.00
0.20
0.40
0.60
0.80
1.00
CA
DA
Sola
pur
OIC
Osm
anabad
CA
DA
Ahm
ednagar
BIP
C P
arli
CA
DA
Aura
ngabad
NIC
Nanded
NIP
C D
hule
CA
DA
Jalg
aon
AIC
Akola
BIP
C
Buld
hana
AIC
Akola
CA
DA
Pune
NIC
Nanded
PIC
Pune
CIP
C
Chandra
pur
CA
DA
Nashik
YIC
Yavatm
al
CA
DA
Nagpur
CA
DA
Nagpur
KIC
Kolh
apur
KIC
Ratn
agiri
CIP
C
Chandra
pur
TIC
Thane
NK
IPC
Thane
Highly
Deficit
Deficit Normal Surplus Abundant
FY Avg 2003-04 Avg Per State Avg: 1.0 Past Max Past Min
72

PlanGroup Subbasin Circle FY Avg 2003-04 Past Max Past Min Avg Per
Deficit Lower Godavari &
Manjra
NIC Nanded 0.22 0.23 0.59 0.59
Lower Godavari &
Manjra
CADA Beed 0.56 0.49 1.00 1.00
Purna Tapi & Girna CADA Jalgaon 0.57 0.69 1.00 1.00
Girna NIPC Dhule 0.92 0.95 1.00 1.00
Purna Tapi UWPC Amravati 1.00 1.00 1.00 1.00
Purna Tapi AIC Akola 0.69 1.00 1.00 1.00
Lower Godavari &
Purna Dudhana
CADA A'bad 0.50 1.00 1.00 1.00
Normal Waradha CIPC Chandrapur 1.00 0.00 1.00 1.00
Waradha NIC Nagpur 0.00 0.00 0.00 0.00
Painganga CADA A'bad 0.19 0.09 0.59 0.59
Upper Godavari CADA A'nagar 0.20 0.21 0.77 0.77
Middle Tapi CADA Jalgaon 0.72 0.56 1.00 1.00
Upper Bhima &
Remaining Bhima
CADA Pune 0.87 0.58 0.91 0.91
Remaining Bhima CADA Solapur 0.65 0.74 0.97 0.97
Upper Godavari CADA Nashik 0.84 0.76 1.00 1.00
Upper Bhima &
Remaining Bhima
PIC Pune 0.77 0.92 1.00 1.00
Waradha UWPC Amravati 0.74 0.97 1.00 1.00
Painganga YIC Yavatmal 0.46 1.00 1.00 1.00
Painganga AIC Akola 0.44 1.00 0.69 0.69
Surplus Middle Wainganga CADA Nagpur 0.59 0.98 1.00 1.00 0.98
Abundant Upper Krishna (W) CADA Pune 0.00 0.00 0.00 0.00
Lower Wainganga CIPC Chandrapur 0.00 0.00 0.00 0.00
Upper Krishna (W) KIC Kolhapur 0.68 0.67 1.00 1.00
North Konkan & Middle
Konkan
TIC Thane 0.75 1.00 1.00 1.00
Note: Average performance doesnot include figures in blue.
Appendix-XII=B
0.67
0.65
0.67
Major Projects
Assessment Recovery Ratio (Non Irrigation)
0.00
0.20
0.40
0.60
0.80
1.00N
IC N
anded
CA
DA
Beed
CA
DA
Jalg
aon
NIP
C D
hule
UW
PC
Am
ravati
AIC
Akola
CA
DA
A'b
ad
CIP
C
Chandra
pur
NIC
Nagpur
CA
DA
A'b
ad
CA
DA
A'n
agar
CA
DA
Jalg
aon
CA
DA
Pune
CA
DA
Sola
pur
CA
DA
Nashik
PIC
Pune
UW
PC
Am
ravati
YIC
Yavatm
al
AIC
Akola
CA
DA
Nagpur
CA
DA
Pune
CIP
C
Chandra
pur
KIC
Kolh
apur
TIC
Thane
Deficit Normal Surplus Abundant
Ratio
FY Avg 2003-04 Past Min Avg Per State Tar: 1.00 Past Max
73

PlanGroup Subbasin Circle FY Avg 2003-04 Past Max Past Min Avg Per
Highly Deficit Upper Krishna (E) & Sina-Bori-
Benetura
PIC Pune 0.67 0.05 1.00 1.00
Sina-Bori-Benetura CADA Solapur 0.54 0.29 1.00 1.00
Sina-Bori-Benetura OIC Osmanabad 0.53 0.32 1.00 1.00
Deficit Lower Godavari CADA Aurangabad 0.66 0.00 0.83 0.83
Manjra CADA Ahmednagar 0.00 0.00 0.00 0.00
Purna Tapi BIPC Buldhana 1.00 0.00 1.00 1.00
Girna CADA Jalgaon 0.36 0.03 1.00 1.00
Girna NIPC Dhule 0.04 0.07 0.19 0.19
Lower Godavari, Purna Dudhana
& Girna
AIC Aurangabad 0.16 0.22 1.00 1.00
Lower Godavari & Manjra NIC Nanded 0.16 0.42 1.00 1.00
Manjra OIC Osmanabad 0.79 0.58 1.00 1.00
Lower Godavari & Manjra BIPC Parli 0.49 0.78 1.00 1.00
Purna Tapi AIC Akola 0.83 0.96 1.00 1.00
Purna Tapi CADA Nagpur 0.05 1.00 1.00 1.00
Normal Upper Godavari CADA Ahmednagar 0.05 0.00 0.08 0.08
Upper Godavari AIC Aurangabad 0.04 0.00 0.45 0.45
Upper Godavari CADA Nashik 0.11 0.00 1.00 1.00
Remaining Bhima CADA Solapur 0.00 0.00 0.00 0.00
Remaining Bhima OIC Osmanabad 0.00 0.00 0.00 0.00
Middle Tapi NIPC Dhule 0.38 0.18 1.00 1.00
Panzara & Middle Tapi CADA Jalgaon 0.27 0.32 1.00 1.00
Painganga NIC Nanded 0.00 0.35 0.00 0.00
Painganga AIC Akola 0.39 0.61 1.00 1.00
Painganga & Wardha YIC Yavatmal 0.22 0.76 1.00 1.00
Wardha CIPC Chandrapur 1.00 0.96 1.00 1.00
Upper Bhima & Remaining Bhima PIC Pune 1.00 0.99 1.00 1.00
Wardha & Lower Wainganga CADA Nagpur 0.70 1.00 1.00 1.00
Surplus Middle Wainganga CIPC Chandrapur 0.00 0.00 0.00 0.00
Middle Wainganga CADA Nagpur 0.86 1.00 1.00 1.00
Abundant Lower Wainganga CIPC Chandrapur 0.00 0.00 0.00 0.00
Vaishisti KIC Ratnagiri 0.00 0.00 0.00 0.00
North Konkan TIC Thane 0.00 0.00 0.00 0.00
Upper Krishna (E) KIC Kolhapur 0.67 0.57 0.94 0.94
Notes: 1) Figures in red indicate values exceeding range of graph.
2) Average performance doesnot include figures in blue.
1.00
0.57
Appendix-XII-B
0.22
0.51
0.65
Medium Projects
Assessment Recovery Ratio (Non Irrigation)
0.00
0.20
0.40
0.60
0.80
1.00
PIC
Pun
e
CA
DA
Sol
apur
OIC
Osm
anab
adC
AD
A
Aur
anga
bad
CA
DA
Ahm
edna
gar
BIP
C
Bul
dhan
aC
AD
A
Jalg
aon
NIP
C D
hule
AIC
Aur
anga
bad
NIC
Nan
ded
OIC
Osm
anab
ad
BIP
C P
arli
AIC
Ako
la
CA
DA
Nag
pur
CA
DA
Ahm
edna
gar
AIC
Aur
anga
bad
CA
DA
Nas
hik
CA
DA
Sol
apur
OIC
Osm
anab
ad
NIP
C D
hule
CA
DA
Jalg
aon
NIC
Nan
ded
AIC
Ako
la
YIC
Yav
atm
al
Highly Deficit Deficit Normal
Rat
io
FY Avg 2003-04 Past Min Avg Per State Tar: 1.00 Past Max
74

PlanGroup Subbasin Circle FY Avg 2003-04 Past Max Past Min Avg Per
Highly Deficit Sina-Bori-Benetura CADA Solapur 1.00 1.00 1.00 1.00 1.00
Deficit Manjra CADA A'nagar 0.00 0.00 0.00 0.00
Manjra BIPC Parli 0.00 0.00 0.00 0.00
Lower Godavari CADA A'bad 0.00 0.00 0.00 0.00
Girna NIPC Dhule 0.00 0.00 0.00 0.00
Lower Godavari, Purna
Dudhana & Manjra
NIC Nanded 0.00 0.00 0.00 0.00
Manjra OIC Osmanabad 0.00 0.00 0.00 0.00
Girna CADA Jalgaon 0.97 0.10 1.00 1.00
Purna Dudhana & Purna
Tapi
AIC Akola 1.00 0.53 1.00 1.00
Purna Dudhana & Purna
Tapi
BIPC Buldhana 0.43 0.53 1.00 1.00
Normal Upper Godavari CADA Nashik 0.00 0.00 0.00 0.00
Upper Bhima CADA Pune 0.00 0.00 0.00 0.00
Wardha CIPC Chandrapur 0.00 0.00 0.00 0.00
Remaining Godavari &
Painanga
NIC Nanded 0.00 0.00 0.00 0.00
Painganga AIC Akola 0.00 0.00 0.00 0.00
Wardha CADA Nagpur 0.00 0.00 0.00 0.00
Upper Bhima & Remaining
Bhima
PIC Pune 0.38 0.00 0.38 0.38
Painganga YIC Yavatmal 0.41 1.00 1.00 1.00
Surplus Middle Wainganga CADA Nagpur 0.00 0.00 0.00 0.00 0.00
Abundant Lower Wainganga CIPC Chandrapur 0.00 0.00 0.00 0.00
Upper Krishna (W) KIC Kolhapur 0.00 0.00 0.00 0.00
Vashisthi KIC Ratnagiri 0.00 0.00 0.00 0.00
North Konkan & Middle
Konkan
NKIPC Thane 0.00 0.00 0.00 0.00
North Konkan & Middle
Konkan
TIC Thane 0.00 1.00 0.00 0.00
Note: Average performance doesnot include figures in blue.
Appendix-XII B
0.39
1.00
1.00
Minor Projects
Assessment Recovery Ratio (Non Irrigation)
0.00
0.20
0.40
0.60
0.80
1.00
CA
DA
Sola
pur
CA
DA
A'n
agar
BIP
C P
arli
CA
DA
A'b
ad
NIP
C D
hule
NIC
Nanded
OIC
Osm
anabad
CA
DA
Jalg
aon
AIC
Akola
BIP
C
Buld
hana
CA
DA
Nashik
CA
DA
Pune
CIP
C
Chandra
pur
NIC
Nanded
AIC
Akola
CA
DA
Nagpur
PIC
Pune
YIC
Yavatm
al
CA
DA
Nagpur
CIP
C
Chandra
pur
KIC
Kolh
apur
KIC
Ratn
agiri
NK
IPC
Thane
TIC
Thane
Highly
Deficit
Deficit Normal Surplus Abundant
Ra
tio
FY Avg 2003-04 Past Min Avg Per State Tar: 1.00 Past Max
75

SB
No
Nam
e o
f C
ircle
Nam
e o
f P
roje
ct
Pla
nG
roup
Avg
.
An
nu
al
Ra
infa
ll
mm
Liv
e
Sto
rag
e
Mm
3
Wa
ter
for
Irrig
atio
n
use
Mm
3
Wa
ter
for
Non
irrig
atio
n
use
Mm
3
Ma
x.L
ive
Sto
rag
e
ob
se
rve
d
du
rin
g
20
03
-04
Ye
ar
of
Co
mm
en
c
em
en
t o
f
Irrig
atio
n
Cu
ltu
rab
le
Co
mm
an
d
Are
a H
a
Irrig
ab
le
com
mand
are
a H
a
To
tal N
o.
of
farm
ers
No
. o
f
vill
ag
es in
be
ne
fit
zo
ne
Avg. fa
rm
siz
e H
a
Main
cro
ps
Are
a
covere
d
under
WU
A
Rem
ark
s
1C
AD
A N
ashik
Bhandard
ara
Norm
al
31
75
30
4.1
04
19
.00
03
04
.10
19
26
63
74
02
30
77
72
80
51
10
4 to 5
Sorg
hum
, W
heat, G
rass,
Maiz
e, S
unflow
er,
Sugarc
ane
2074
1C
AD
A N
ashik
Mula
Norm
al
50
06
08
.45
54
0.2
78
7.9
02
66
.27
19
72
13
87
92
82
92
08
69
17
16
04 to 5
-do-
26498
1C
AD
A N
ashik
Ozerk
hed
Norm
al
74
66
0.3
23
1.5
92
.19
19
85
14
85
61
04
00
10
19
53
50.8
Wheat, S
org
hum
, G
ram
4228
More
evapora
tion losses
about 50%
.
1C
AD
A N
ashik
Palk
hed
Norm
al
66
11
87
.47
82
.90
46
.85
0.0
01
97
66
07
04
43
15
44
24
25
14
40.8
Gra
m, S
org
hum
27660
1C
AD
A N
ashik
Waghad
Norm
al
96
47
2.2
33
6.5
33
.50
19
81
96
42
67
50
72
25
23
0.6
Paddy, O
nio
n, V
egeta
ble
s,
Gro
undnut, B
ajri, W
heat,
Gra
m, S
org
hum
6519
1C
AD
A N
ashik
Darn
aN
orm
al
55
02
02
.40
13
5.7
36
6.6
71
91
88
88
22
33
17
01
79
58
14
62
Sugarc
ane, S
org
hum
, B
ajri,
Wheat, G
ram
, F
ruits
5064
1C
AD
A N
ashik
Gangapur
Norm
al
50
02
03
.85
86
.78
11
7.0
71
95
42
19
00
15
96
01
16
30
92
1.3
-do-
2367
1C
AD
A N
ashik
Kadw
aN
orm
al
53
35
2.9
06
1.9
68
.46
52
.91
19
97
15
52
31
01
17
21
68
54
20.4
7 -
do-
190
2C
AD
A B
eed
Jayakw
adi (P
RB
C)
Deficit
70
03
31
.39
29
.68
0.0
01
97
6-7
75
39
10
41
68
23
42
72
99
1.5
7C
otton,W
heat,S
org
hum
,
Sugarc
ane
2637
2C
AD
A B
eed
Maja
lgaon
Deficit
84
03
12
.00
68
0.2
84
6.8
81
14
.50
19
89
-90
64
29
55
47
37
13
21 to 2
Wheat, S
org
hum
, C
otton,
Sugarc
ane
4362
2N
IC N
AN
DE
DV
ishnupuri
Deficit
91
08
1.3
72
75
.18
54
.37
19
90
37
78
52
83
40
18
33
54
62.0
6 -
do-
605
3N
IC N
AN
DE
DP
urn
a
Deficit
68
58
09
.77
73
2.3
36
8.6
71
96
8-6
97
84
85
57
98
83
83
00
23
21 to 2
Cottto
n, W
heat, S
org
hum
2891
4C
AD
A B
eed
Manjra
Deficit
68
51
73
.32
18
5.6
48
5.6
70
.00
19
80
-81
23
69
01
82
23
89
54
80
2.0
3 -
do-
1598
4C
AD
A B
eed
Low
er
Tern
aD
eficit
71
01
13
.95
62
.50
21
.05
0.0
01
99
7-9
81
45
13
11
61
01
05
54
63
1 to 1
.5S
org
hum
, W
heat,
Sunflow
er,
Gro
undnut,
Gra
m
ND
4N
IC N
AN
DE
DM
anar
Deficit
85
01
28
.68
19
8.0
65
.94
19
68
27
74
52
33
10
17
84
59
61.5
5W
heat, G
ram
, S
ugarc
ane,
Cotton, G
roundnut,
Sorg
hum
2928
More
post m
onsoon y
ield
is a
vaila
ble
4U
WP
C A
mra
vati
Wan
Deficit
89
18
1.9
67
8.5
72
0.0
88
1.9
61
99
8-9
92
25
25
15
10
09
04
45
41.5
-do-
224
6N
IC N
AN
DE
DU
pper
Penganga
Norm
al
82
59
64
.09
78
2.6
91
5.1
61
98
4-8
51
39
43
81
25
49
54
46
18
35
61 to 2
Cottto
n, W
heat, S
org
hum
,
ND
6Y
IC Y
evatm
al
Aru
naw
ati
Norm
al
91
31
69
.67
12
1.6
51
5.6
23
7.9
21
99
52
41
35
20
51
59
00
07
32 to 3
Cotton, W
heat, S
ugarc
ane
4444
6A
IC A
kola
Pus
Norm
al
94
59
1.2
61
00
.35
19
.06
19
72
13
67
88
21
58
44
24
01.5
to 3
Sugarc
ane, S
org
hum
,
Wheat, G
ram
, C
otton,
1208
7P
IC P
une
Bhatg
har
Dam
N.L
.B.C
. N
orm
al
19
53
66
6.0
03
86
.58
33
.92
63
9.2
51
89
36
87
67
60
65
64
58
40
87
1 to 2
Sorg
hum
, W
heat, B
ajri,
Sugarc
ane
1315
245.5
Mcum
bala
nce
sto
rage
7U
WP
C A
mra
vati
Upper
Ward
ha
Norm
al
84
06
14
.79
30
2.7
89
9.7
26
14
.80
19
94
-95
83
30
07
50
00
45
40
02
79
1.5
Cotton, W
heat, H
y. Jow
ar,
Chill
i, G
roundnut
ND
7C
IPC
Chandra
pur B
or
Norm
al
13
27
12
7.4
21
09
.29
6.3
58
1.6
41
96
72
40
55
13
36
08
17
87
71.5
to 2
Cotton, W
heat
ND
7N
IC N
agpur
Low
er
Wunna
Norm
al
13
30
18
9.1
81
48
.00
29
18
9.1
81
99
12
15
91
19
50
01
70
34
10
92.5
Cotton, W
heat, G
ram
,
Soybean, S
ugarc
ane
412
8C
AD
A N
agpur
Bagh S
irpur
Surp
lus
13
25
0.0
00
26
9.0
01
97
10
00
01 to 2
-do-
ND
Thre
e s
tora
ges n
am
ely
Sirpur
(liv
e s
tora
ge
192.5
5 M
cum
) K
alis
ara
r
8C
AD
A N
agpur
Pench
Surp
lus
11
37
.62
18
0.0
06
89
.00
24
31
30
3.0
01
97
61
26
91
31
01
20
04
60
00
40
71 to 2
Paddy, C
otton, C
hill
y,
Wheat, G
ram
, S
unflow
er,
ND
Upstr
eam
sto
rages a
re
Khin
dsi (1
03 M
cum
) and
9C
IPC
Chandra
pur A
sola
mendha
Abundant
11
46
.55
56
.37
52
.00
04
6.3
41
91
83
79
45
99
19
12
22
16
71.5
to 2
Paddy
ND
9C
IPC
Chandra
pur D
ina
Abundant
13
14
.75
5.9
45
5.9
40
55
.94
19
74
12
49
47
82
69
09
06
61.5
to 2
-do-
ND
10
PIC
Pune
N.R
.B.C
. (V
eer
Dam
)D
eficit
10
67
26
6.4
48
60
.99
08
6.6
41
93
81
81
26
66
55
06
38
50
02
14
1.7
Sugarc
ane, S
org
hum
, B
ajri,
Wheat, O
ther
Pere
nia
ls
323
223%
more
use
Ov
erv
iew
of
Pro
jec
ts s
ele
cte
d f
or
Be
nc
hm
ark
ing
(
Ma
jor
Pro
jec
ts)
Ap
pe
nd
ix-X
III
76

SB
No
Nam
e o
f C
ircle
Nam
e o
f P
roje
ct
Pla
nG
roup
Avg
.
An
nu
al
Ra
infa
ll
mm
Liv
e
Sto
rag
e
Mm
3
Wa
ter
for
Irrig
atio
n
use
Mm
3
Wa
ter
for
Non
irrig
atio
n
use
Mm
3
Ma
x.L
ive
Sto
rag
e
ob
se
rve
d
du
rin
g
20
03
-04
Ye
ar
of
Co
mm
en
c
em
en
t o
f
Irrig
atio
n
Cu
ltu
rab
le
Co
mm
an
d
Are
a H
a
Irrig
ab
le
com
mand
are
a H
a
To
tal N
o.
of
farm
ers
No
. o
f
vill
ag
es in
be
ne
fit
zo
ne
Avg. fa
rm
siz
e H
a
Main
cro
ps
Are
a
covere
d
under
WU
A
Rem
ark
s
Ov
erv
iew
of
Pro
jec
ts s
ele
cte
d f
or
Be
nc
hm
ark
ing
(
Ma
jor
Pro
jec
ts)
Ap
pe
nd
ix-X
III
10
CA
DA
Jalg
aon
Chankapur
Deficit
10
67
76
.85
14
6.5
90
19
73
19
17
31
40
42
14
00
04
80.5
Bajri, T
wo s
easonals
,
Paddy, S
org
hum
,
Gro
undnut, W
heat, G
ram
ND
More
Irr
igation in K
harif
and r
egenera
tion o
f flow
in r
iver
due to
dow
nstr
eem
bandhara
s
10
AIC
Akola
Kate
purn
aD
eficit
95
08
6.3
54
9.4
53
2.6
51
97
21
11
87
83
25
58
08
30
1.5
to 2
Wheat, P
eas, C
otton,
Sunflow
er.
7865
10
AIC
Akola
Nalg
anga
Deficit
73
76
9.3
25
3.2
16
.51
19
63
91
65
86
04
83
67
31
1 to 2
Gra
m, W
heat, C
otton
5692
11
CA
DA
Jalg
aon
Girna
Deficit
74
35
23
.55
54
9.6
60
21
7.0
01
96
2-6
37
92
93
69
35
03
15
00
19
53
Sugarc
ane, B
anana,
Cotton, W
heat, S
org
hum
116
13
CA
DA
Jalg
aon
Hatn
ur
Norm
al
74
32
55
.00
50
0.1
29
0.5
32
55
.00
19
83
47
36
03
78
38
16
12
08
21.2
Sugarc
ane, B
anana,
Gro
undnut
ND
132 %
more
use.
Siz
eable
post m
onsoon
flow
.
15
CA
DA
Pune
Krishna
Abundant
87
26
02
.73
60
2.7
30
19
78
-85
81
40
07
40
00
44
89
91
46
1 to 2
Sugarc
ane, S
org
hum
,
G
24298
15
KIC
Kolh
apur
Radhanagari
Abundant
36
38
21
9.9
72
03
.87
24
.35
21
9.9
71
95
53
54
22
26
56
01
73
50
91
0.5
to 1
.5S
ugerc
ane, P
addy, W
heat,
Vegeta
ble
s
ND
15
KIC
Kolh
apur
Tula
shi
Abundant
18
70
89
.31
63
.43
42
.50
91
.92
19
78
57
11
47
20
25
00
23
0.5
to 2
-do-
ND
15
KIC
Kolh
apur
Warn
aA
bundant
20
92
77
9.3
55
78
.05
6.4
67
79
.35
19
86
-87
12
34
63
96
91
92
59
10
33
20.8
-do-
ND
194.8
4 M
cum
bala
nce
sto
rage
15
KIC
Kolh
apur
Dudhganga
Abundant
26
36
67
9.1
16
22
.11
57
67
5.0
31
99
3-9
44
69
76
38
38
8-
12
51 to 2
Sugarc
ane, P
addy, W
heat
ND
17
CA
DA
Pune
Kukadi
Norm
al
79
08
64
.64
95
1.2
90
61
5.1
61
97
82
24
69
91
56
27
83
90
70
02
69
0.8
to 1
Wheat, S
org
hum
, B
ajri,
Vegeta
ble
s, S
ugarc
ane,
Gro
undnut, G
ram
25558
17
CA
DA
Pune
Ghod
Norm
al
51
51
54
.80
20
2.8
62
.54
68
.22
19
65
41
46
02
05
00
25
23
85
41
Sugarc
ane, S
org
hum
, B
ajri,
Wheat, G
rain
ND
17
PIC
Pune
Khadakw
asla
Norm
al
91
17
12
.00
60
2.5
52
04
64
6.7
41
97
08
33
02
62
14
63
13
00
96
0.5
to 5
Sorg
hum
, B
ajri, M
aiz
e,
Wheat, S
ugarc
ane
336
94.5
5 M
cum
bala
nce
sto
rage
17
PIC
Pune
Paw
ana
Norm
al
22
10
27
4.0
09
6.5
01
68
.32
0.0
01
97
57
46
86
36
52
95
03
00.5
to 2
.5P
addy, S
org
hum
, B
ajri,
Maiz
e, W
heat, S
ugarc
ane
ND
18
CA
DA
Sola
pur
Bhim
aN
orm
al
50
01
51
7.2
01
44
4.7
01
16
.43
19
77
19
80
35
18
26
83
10
15
64
38
41 to 2
.5S
org
hum
, W
heat,
Gro
undnut, S
ugarc
ane
20095
19
CA
DA
Aura
ngab
aJayakw
adi (
PLB
C)
Hig
hly
Deficit
75
52
17
1.0
01
06
4.9
63
29
.04
40
0.0
71
97
5-7
61
83
56
01
41
64
01
10
12
93
55
1.5
to 2
Cottto
n, W
heat, S
org
hum
,
Sunflow
er
10574
19
CA
DA
Nagpur
Itia
doh
Hig
hly
Deficit
13
36
31
8.8
64
12
.04
02
34
.00
19
71
22
75
21
75
00
17
42
91
00
1 to 2
Paddy
ND
Pro
ject desig
ned for
50%
dependabili
ty a
nd a
rea
under
Irrigation in K
harif
(Paddy)
is m
ore
.
21
TIC
, T
ha
ne
Sury
a
Abundant
22
86
17
6.4
81
45
.42
31
.06
17
6.4
81
98
1-8
23
05
47
14
69
66
81
06
40.2
5P
addy
ND
21
TIC
, T
ha
ne
Bhats
a
Abundant
25
89
94
2.1
05
11
.86
38
9.0
37
11
.86
19
85
-86
29
37
82
30
00
59
40
51
49
0.3
9 -
do-
ND
21
TIC
, T
ha
ne
Raja
nala
Abundant
34
61
32
.00
03
2.0
00
.00
19
58
-59
30
50
25
42
33
07
35
0.2
0P
ad
dy
400
22
TIC
, T
ha
ne
Kal
Abundant
30
20
21
1.1
21
56
.41
54
.70
19
73
-74
95
58
79
65
10
12
21
27
0.2
0 -
do-
ND
77

SB
No
Nam
e o
f C
ircle
Nam
e o
f P
roje
ct
Pla
n
Gro
up
Avg.
Annual
Rain
fall
mm
Liv
e
Sto
rag
e
Mm
3
Wate
r fo
r
Irrigation
use M
m3
Wate
r
for
Non
irrigation
use M
m3
Max.L
ive
Sto
rage
observ
ed
during
2003-0
4
Year
of
Com
men
cem
ent
of
Irrigation
Cultura
ble
Com
mand
Are
a H
a
Irrigable
com
mand
are
a H
a
No. of
vill
ages
in
benefit
zone
Avg.
farm
siz
e
Ha
Main
cro
ps
Are
a
covere
d
under
WU
A H
a
1C
AD
A S
ola
pur
Chandani
Norm
al
770
18.2
920.5
93.1
11966
2891
2024
10.0
02 to 3
So
rgh
um
,
Su
nflo
we
r, W
he
at,
Pu
lse
s
344
1C
AD
A S
ola
pur
Sakat
Norm
al
770
13.4
815.1
70.0
01994
3140
2355
9.0
02 to 3
-d
o-
0
1C
AD
A S
ola
pur
Kurn
oor
Norm
al
770
32.2
832.1
84.8
11968
6414
3644
9.0
02 to 3
Gro
un
dn
ut,
Su
ga
rca
ne
,
So
rgh
um
,
Su
nflo
we
r, W
he
at
270
1C
AD
A S
ola
pur
Khandala
Norm
al
770
5.2
45.2
40.0
01974
1328
830
2.0
02 to 3
-d
o-
0
1C
AD
A S
ola
pur
Kada
Norm
al
589
8.5
68.3
80.1
81970
1804
12214
5.0
01 to 1
.5S
og
hu
m,
Wh
ea
t,
Gro
un
dn
ut,
Su
ga
rca
ne
, M
aiz
e,
Su
nflo
we
r
0
1C
AD
A S
ola
pur
Mehakari
Norm
al
589
12.9
812.9
80.0
01966
5007
4048
8.0
01 to 1
.5S
og
hu
m,
Wh
ea
t,
Gro
un
dn
ut,
Su
ga
rca
ne
, M
aiz
e,
Su
nflo
we
r
0
1C
AD
A S
ola
pur
Kam
bli
Norm
al
589
3.1
3.1
00.0
01958
1047
972
5.0
01 to 1
.5S
og
hu
m,
Wh
ea
t,
Gro
un
dn
ut,
Su
ga
rca
ne
, M
aiz
e,
Su
nflo
we
r
0
2K
IC K
olh
apur
Chik
otr
aD
eficit
1074
43.0
843.0
50.0
02001
6833
5630
27
1 to 2
Su
ge
rca
ne
,
Pa
dd
y,
Wh
ea
t,
Ve
ge
tab
les
0
2K
IC K
olh
apur
Patg
aon
Deficit
3486
104.7
778.5
826.1
91996
10000
8100
44
1 to 2
Su
ge
rca
ne
,
Pa
dd
y,
Wh
ea
tN
o D
ata
2P
IC P
une
Vadiw
ale
Deficit
2845
30.3
922.1
80
34.5
11990
5564
5000
26
0.1
5 to
1
Pa
dd
y,
Wh
ea
tN
o D
ata
2P
IC P
une
Khairy
Deficit
682
13.7
417.8
30
0.5
91989
2718
2318
14
2S
org
hu
m,
Ba
jri,
Wh
ea
t, G
rou
nd
nu
t692
2C
AD
A J
alg
aon
Tondapur
Deficit
763
4.6
34.7
70.8
54.6
41998
1597
1060
20.8
-d
o-
No D
ata
3C
AD
A S
ola
pur
Ekru
kh
Deficit
500
61.1
643.2
115.9
51871
6858
2610
11
1 to 1
.5S
org
hu
m,
Wh
ea
t,
Ve
ge
tab
les,
Su
ga
rca
ne
0
3C
AD
A S
ola
pur
Jakapur
Deficit
770
7.4
37.4
30.0
01979
1600
1584
4.0
02 to 3
-d
o-
0
3C
AD
A S
ola
pur
Turo
riD
eficit
770
5.7
35.7
31.7
01984
900
830
8.0
02 to 3
-d
o-
0
3C
AD
A S
ola
pur
Khendeshw
ar
Deficit
685
7.8
511.2
80.0
01981
1710
1471
10.0
01 to 3
Gro
un
dn
ut,
So
rgh
um
,
Su
nflo
we
r, W
he
at
0
3C
AD
A S
ola
pur
Ram
ganga
Deficit
685
5.3
46.5
00.0
01977
1017
963
7.0
01 to 3
Gro
un
dn
ut,
So
rgh
um
,
Su
nflo
we
r, W
he
at
0
3C
AD
A S
ola
pur
Banganga
Deficit
685
4.9
36.3
50.5
91975
964
906
5.0
01 to 3
Gro
un
dn
ut,
So
rgh
um
,
Su
nflo
we
r, W
he
at
0
Overv
iew
of
Pro
jects
sele
cte
d f
or
Ben
ch
mark
ing
(M
ed
ium
Pro
jects
)
78
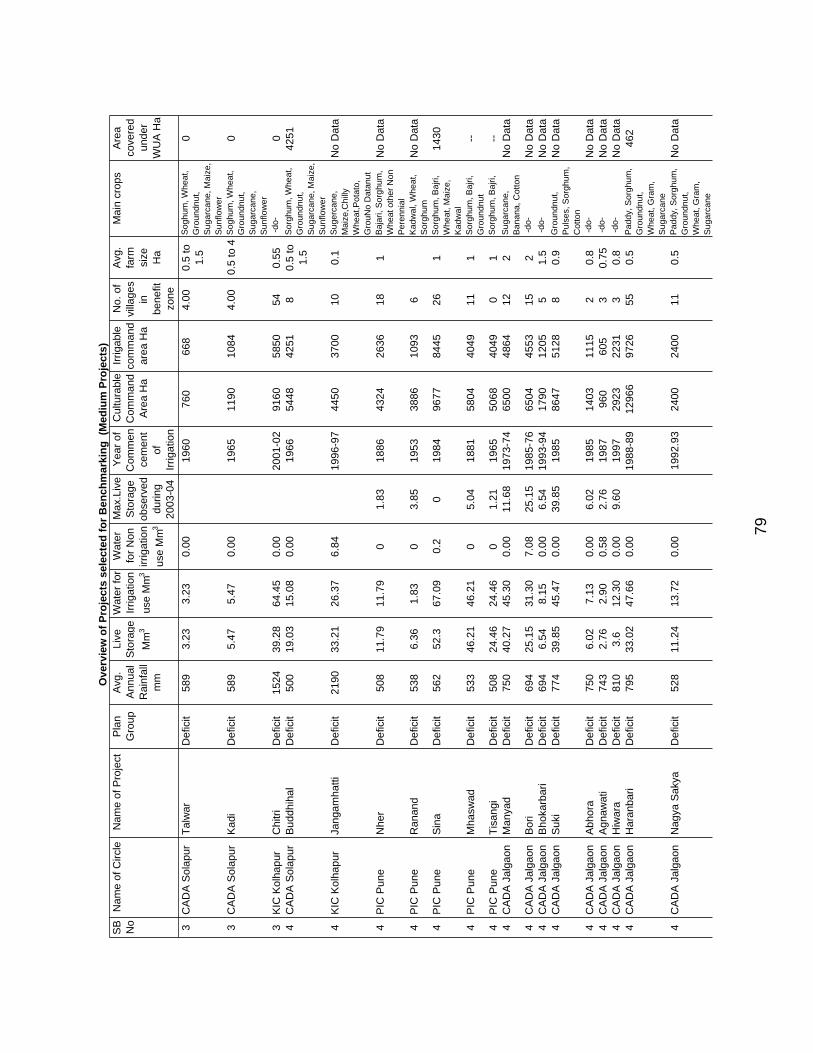
SB
No
Nam
e o
f C
ircle
Nam
e o
f P
roje
ct
Pla
n
Gro
up
Avg.
Annual
Rain
fall
mm
Liv
e
Sto
rag
e
Mm
3
Wate
r fo
r
Irrigation
use M
m3
Wate
r
for
Non
irrigation
use M
m3
Max.L
ive
Sto
rage
observ
ed
during
2003-0
4
Year
of
Com
men
cem
ent
of
Irrigation
Cultura
ble
Com
mand
Are
a H
a
Irrigable
com
mand
are
a H
a
No. of
vill
ages
in
benefit
zone
Avg.
farm
siz
e
Ha
Main
cro
ps
Are
a
covere
d
under
WU
A H
a
Overv
iew
of
Pro
jects
sele
cte
d f
or
Ben
ch
mark
ing
(M
ed
ium
Pro
jects
)
3C
AD
A S
ola
pur
Talw
ar
Deficit
589
3.2
33.2
30.0
01960
760
668
4.0
00.5
to
1.5
So
gh
um
, W
he
at,
Gro
un
dn
ut,
Su
ga
rca
ne
, M
aiz
e,
Su
nflo
we
r
0
3C
AD
A S
ola
pur
Kadi
Deficit
589
5.4
75.4
70.0
01965
1190
1084
4.0
00.5
to 4
So
gh
um
, W
he
at,
Gro
un
dn
ut,
Su
ga
rca
ne
,
Su
nflo
we
r
0
3K
IC K
olh
apur
Chitri
Deficit
1524
39.2
864.4
50.0
02001-0
29160
5850
54
0.5
5 -
do
-0
4C
AD
A S
ola
pur
Buddhih
al
Deficit
500
19.0
315.0
80.0
01966
5448
4251
80.5
to
1.5
So
rgh
um
, W
he
at,
Gro
un
dn
ut,
Su
ga
rca
ne
, M
aiz
e,
Su
nflo
we
r
4251
4K
IC K
olh
apur
Jangam
hatti
Deficit
2190
33.2
126.3
76.8
41996-9
74450
3700
10
0.1
Su
ge
rca
ne
,
Ma
ize
,Ch
illy
Wh
ea
t,P
ota
to,
Gro
uN
o D
ata
nu
t
No D
ata
4P
IC P
une
Nher
Deficit
508
11.7
911.7
90
1.8
31886
4324
2636
18
1B
aja
ri,
So
rgh
um
,
Wh
ea
t o
the
r N
on
Pe
ren
nia
l
No D
ata
4P
IC P
une
Ranand
Deficit
538
6.3
61.8
30
3.8
51953
3886
1093
6K
ad
wa
l, W
he
at,
So
rgh
um
No D
ata
4P
IC P
une
Sin
aD
eficit
562
52.3
67.0
90.2
01984
9677
8445
26
1S
org
hu
m,
Ba
jri,
Wh
ea
t, M
aiz
e,
Ka
dw
al
1430
4P
IC P
une
Mhasw
ad
Deficit
533
46.2
146.2
10
5.0
41881
5804
4049
11
1S
org
hu
m,
Ba
jri,
Gro
un
dn
ut
--
4P
IC P
une
Tis
angi
Deficit
508
24.4
624.4
60
1.2
11965
5068
4049
01
So
rgh
um
, B
ajri,
--
4C
AD
A J
alg
aon
Manyad
Deficit
750
40.2
745.3
00.0
011.6
81973-7
46500
4864
12
2S
ug
arc
an
e,
Ba
na
na
, C
ott
on
No D
ata
4C
AD
A J
alg
aon
Bori
Deficit
694
25.1
531.3
07.0
825.1
51985-7
66504
4553
15
2 -
do
-N
o D
ata
4C
AD
A J
alg
aon
Bhokarb
ari
Deficit
694
6.5
48.1
50.0
06.5
41993-9
41790
1205
51.5
-d
o-
No D
ata
4C
AD
A J
alg
aon
Suki
Deficit
774
39.8
545.4
70.0
039.8
51985
8647
5128
80.9
Gro
un
dn
ut,
Pu
lse
s,
So
rgh
um
,
Co
tto
n
No D
ata
4C
AD
A J
alg
aon
Abhora
Deficit
750
6.0
27.1
30.0
06.0
21985
1403
1115
20.8
-d
o-
No D
ata
4C
AD
A J
alg
aon
Agnaw
ati
Deficit
743
2.7
62.9
00.5
82.7
61987
960
605
30.7
5 -
do
-N
o D
ata
4C
AD
A J
alg
aon
Hiw
ara
Deficit
810
3.6
12.3
00.0
09.6
01997
2923
2231
30.8
-d
o-
No D
ata
4C
AD
A J
alg
aon
Hara
nbari
Deficit
795
33.0
247.6
60.0
01988-8
912966
9726
55
0.5
Pa
dd
y,
So
rgh
um
,
Gro
un
dn
ut,
Wh
ea
t, G
ram
,
Su
ga
rca
ne
462
4C
AD
A J
alg
aon
Nagya S
akya
Deficit
528
11.2
413.7
20.0
01992.9
32400
2400
11
0.5
Pa
dd
y,
So
rgh
um
,
Gro
un
dn
ut,
Wh
ea
t, G
ram
,
Su
ga
rca
ne
No D
ata
79

SB
No
Nam
e o
f C
ircle
Nam
e o
f P
roje
ct
Pla
n
Gro
up
Avg.
Annual
Rain
fall
mm
Liv
e
Sto
rag
e
Mm
3
Wate
r fo
r
Irrigation
use M
m3
Wate
r
for
Non
irrigation
use M
m3
Max.L
ive
Sto
rage
observ
ed
during
2003-0
4
Year
of
Com
men
cem
ent
of
Irrigation
Cultura
ble
Com
mand
Are
a H
a
Irrigable
com
mand
are
a H
a
No. of
vill
ages
in
benefit
zone
Avg.
farm
siz
e
Ha
Main
cro
ps
Are
a
covere
d
under
WU
A H
a
Overv
iew
of
Pro
jects
sele
cte
d f
or
Ben
ch
mark
ing
(M
ed
ium
Pro
jects
)
4C
AD
A
Aura
ngabad
Sukhana
Deficit
688
18.4
916.5
61.9
31968
3136
2511
14
2.7
3 -
do
-N
o D
ata
6C
AD
A J
alg
aon
Kelz
ar
Norm
al
687
16.2
16.5
10.0
01988-8
95583
3394
19
0.5
Ba
jri, T
wo
se
aso
na
ls,
Pa
dd
y,
So
rgh
um
,
Gro
un
dn
ut,
Wh
ea
t, G
ram
672
6C
AD
A J
alg
aon
Kanoli
Norm
al
660
8.4
510.5
00.0
01974-7
51620
1363
81 to 2
Wh
ea
t, C
ott
on
,
Gra
m,
Ba
jri,
So
rgh
um
No D
ata
6C
AD
A J
alg
aon
Aner
Norm
al
970
59.2
79*
8.5
01976
9201
7180
10
0.5
Wh
ea
t,
Gro
un
dn
ut,
Co
tto
nN
o D
ata
6C
AD
A N
ashik
Bhoja
pur
Norm
al
393
10.7
8.1
52.5
59.5
41973
4580
4500
24
1.7
Ba
jri, W
he
at,
So
rgh
um
, G
ram
No D
ata
6C
AD
A
Aura
ngabad
Kaly
an G
irija
Norm
al
663
8.4
28.4
20.0
01972
1557
1377
93
Wh
ea
t, S
org
hu
m,
Su
nflo
we
r565
6C
AD
A
Aura
ngabad
Dham
na
Norm
al
677
8.4
98.3
40.1
51973
1682
1280
82.5
-d
o-
No D
ata
6C
AD
A
Aura
ngabad
Jiv
rekha
Norm
al
668
6.1
46.1
40.0
01964
2589
1064
62.5
-d
o-
No D
ata
6C
AD
A
Aura
ngabad
Dheku
Norm
al
600
12.1
56.5
55.6
01961
3564
2712
15
2.0
7 -
do
-N
o D
ata
6C
AD
A
Aura
ngabad
Kolh
iN
orm
al
600
3.2
32.6
30.6
01967
1056
472
43.0
2 -
do
-N
o D
ata
7C
AD
A J
alg
aon
Karv
and
Norm
al
960
21.3
921.3
90.6
21968
7027
4534
14
0.4
-d
o-
No D
ata
7C
AD
A
Aura
ngabad
Lahuki
Norm
al
688
5.3
13.7
21.5
91977
1323
1092
40.9
6 -
do
-N
o D
ata
7C
AD
A
Aura
ngabad
Girija
Norm
al
762
21.2
314.6
66.5
71990
3443
3443
10
0.7
7 -
do
-N
o D
ata
7C
AD
A
Aura
ngabad
Gadadgad
Norm
al
840
4.6
43.9
70.6
71971
1448
1180
41.7
7 -
do
-615
7C
AD
A
Aura
ngabad
Ajin
tha A
ndhari
Norm
al
650
7.6
55.2
72.3
81984
1967
1578
33.9
3 -
do
-N
o D
ata
7C
AD
A
Aura
ngabad
Karp
ara
Norm
al
760
24.9
21.0
32.8
01974
2862
2151
71.5
-d
o-
No D
ata
7C
AD
A B
eed
Devarjan
Norm
al
838
10.6
80
7.1
20.0
01997
2853
1882
72.0
4S
org
hu
m,
Wh
ea
t,
Gra
m,
Su
nflo
we
rN
o D
ata
80

SB
No
Nam
e o
f C
ircle
Nam
e o
f P
roje
ct
Pla
n
Gro
up
Avg.
Annual
Rain
fall
mm
Liv
e
Sto
rag
e
Mm
3
Wate
r fo
r
Irrigation
use M
m3
Wate
r
for
Non
irrigation
use M
m3
Max.L
ive
Sto
rage
observ
ed
during
2003-0
4
Year
of
Com
men
cem
ent
of
Irrigation
Cultura
ble
Com
mand
Are
a H
a
Irrigable
com
mand
are
a H
a
No. of
vill
ages
in
benefit
zone
Avg.
farm
siz
e
Ha
Main
cro
ps
Are
a
covere
d
under
WU
A H
a
Overv
iew
of
Pro
jects
sele
cte
d f
or
Ben
ch
mark
ing
(M
ed
ium
Pro
jects
)
8C
AD
A S
ola
pur
Rooty
Surp
lus
589
6.5
76.0
90.4
81938
1943
1862
5.0
01 to 1
.5S
org
hu
m,
Wh
ea
t,
Ve
ge
tab
les,
Su
ga
rca
ne
0
8K
IC K
olh
apur
Kasari
Surp
lus
4560
77.9
661.5
70.0
01989
9995
5458
61
1 to 1
.5S
ug
erc
an
e,
Pa
dd
y,
Wh
ea
t0
8C
AD
A
Aura
ngabad
Am
badi
Surp
lus
650
9.4
26.9
22.5
01979
2375
2147
10
2.2
6 -
do
-N
o D
ata
8C
AD
A
Aura
ngabad
Masoli
Surp
lus
780
27.3
23.4
43.9
41982
3502
2591
71.5
-d
o-
No D
ata
8C
AD
A B
eed
Kundlik
aS
urp
lus
753
37.8
30.3
31988
3927
2964
13
3.9
1S
ug
arc
an
e,
Gro
un
dn
ut,
So
rgh
um
, B
ajri,
Co
tto
n,
Su
nflo
we
r
200
8C
AD
A B
eed
Gharn
iS
urp
lus
716
22.4
60
23.7
80.0
01969
3542
2834
14
2.1
0S
ug
arc
an
e,
Gro
un
dn
ut,
So
rgh
um
, C
ott
on
,
Ma
ize
, P
ad
dy,
Ve
ge
tab
le,
Wh
ea
t,
Gra
m
2834
8C
AD
A B
eed
Tiru
Surp
lus
684
15.2
90
21.1
90.0
01978
2654
2348
14
1.4
0S
org
hu
m,
Ch
illi,
Gro
un
dn
ut,
Ma
ize
,
Pa
dd
y,
Ve
ge
tab
les,
Wh
ea
t, G
ram
1790
8C
AD
A B
eed
Tavarja
Surp
lus
744
20.3
40
10.9
83.9
21983
4907
3603
19
1.7
2S
org
hu
m,
Su
nflo
we
r, W
he
at
No D
ata
8C
AD
A B
eed
Tern
aS
urp
lus
770
19.6
63
10.8
44.8
11964
1928
1652
91.5
0S
ug
arc
an
e50
8C
AD
A B
eed
Raig
avhvan
Surp
lus
770
11.2
59
8.5
70.2
81992
2267
1700
81.3
0 -
do
-620
8C
AD
A B
eed
Rui
Surp
lus
770
8.6
05
5.8
01.7
21994
1893
1650
71.2
0 -
do
-0
8N
IC N
AN
DE
DK
undra
laS
urp
lus
630
10.4
112.8
14.2
11981
1265
1012
71.6
1W
he
at,
Gra
m,
Su
ga
rca
ne
,
Co
tto
n,
Gro
un
dn
ut,
So
rgh
um
1265
8N
IC N
AN
DE
DK
ara
dkhed
Surp
lus
650
11.0
111.3
46.5
61976
2510
1780
11
1.9
3 -
do
-2509
8N
IC N
AN
DE
DK
udala
Surp
lus
700
4.3
55.5
41.3
81974
676
567
51.2
3 -
do
-N
o D
ata
8N
IC N
AN
DE
DP
eth
wadaj
Surp
lus
850
9.0
413.5
21.3
11977
1970
1478
13
1 -
do
-N
o D
ata
8N
IC N
AN
DE
DN
agzari
Surp
lus
1150
6.5
66.1
82.9
21983
1260
960
64.6
8 -
do
-962
8N
IC N
AN
DE
DLoni
Surp
lus
1150
8.3
89.5
10.9
11981
1835
1377
71.0
2 -
do
-N
o D
ata
9C
AD
A N
ashik
Ala
ndi
Abunda
nt
614
27.5
721.0
05.6
727.4
61985
7408
6296
18
3V
eg
eta
ble
s,
Gra
pe
s,
So
rgh
um
,
Su
ga
rca
ne
,
Wh
ea
t, G
ram
No D
ata
81

SB
No
Nam
e o
f C
ircle
Nam
e o
f P
roje
ct
Pla
n
Gro
up
Avg.
Annual
Rain
fall
mm
Liv
e
Sto
rag
e
Mm
3
Wate
r fo
r
Irrigation
use M
m3
Wate
r
for
Non
irrigation
use M
m3
Max.L
ive
Sto
rage
observ
ed
during
2003-0
4
Year
of
Com
men
cem
ent
of
Irrigation
Cultura
ble
Com
mand
Are
a H
a
Irrigable
com
mand
are
a H
a
No. of
vill
ages
in
benefit
zone
Avg.
farm
siz
e
Ha
Main
cro
ps
Are
a
covere
d
under
WU
A H
a
Overv
iew
of
Pro
jects
sele
cte
d f
or
Ben
ch
mark
ing
(M
ed
ium
Pro
jects
)
9C
AD
A
Aura
ngabad
Kheln
aA
bunda
nt
650
11.0
74.7
46.3
31967
4935
2429
11
4.0
8 -
do
-N
o D
ata
10
CA
DA
Jalg
aon
Panzara
Deficit
780
35.6
372.6
6*
0.7
11976
7328
6868
25
0.8
Ma
ize
, B
ajra
,
Wh
ea
tN
o D
ata
10
CA
DA
Jalg
aon
Mala
ngaon
Deficit
780
11.3
215.0
20.0
01972
2674
1587
15
0.5
-d
o-
No D
ata
10
CA
DA
Jalg
aon
Bura
iD
eficit
500
14.2
119.2
3*
0.8
71984-8
52981
2760
51
Wh
ea
t, C
ott
on
,
Gra
m,
Ba
jri,
So
rgh
um
, O
nio
n,
Ma
ize
147
10
CA
DA
Jalg
aon
Rangavali
Deficit
1054.9
12.8
923.0
5*
0.0
01983-8
45130
3134
21
2 to 2
.5S
org
hu
m,
Wh
ea
t,
Co
tto
n,
Ve
ge
tab
les
801
10
CA
DA
Nashik
Adhala
Deficit
500
27.6
38.7
40.0
01977
6427
3914
16
3 to 4
So
rgh
um
, W
he
at,
Gra
ss,
Ba
jri,
Gro
un
dn
ut,
Ma
ize
919
10
CA
DA
Nashik
Mand O
hol
Deficit
600
8.7
813.1
60.0
01983
2833
2266
15
3 to 4
So
rgh
um
, W
he
at,
Gra
ss,
Ma
ize
,
Su
nflo
we
r,
Su
ga
rca
ne
1941
10
CA
DA
Nashik
G.P
arg
aon
Deficit
685
8.5
12.3
60.0
01984
2142
1660
15
3 to 4
-d
o-
463
10
CA
DA
Aura
ngabad
Kaly
an
Deficit
567
10.4
87.3
53.0
31986
2693
2020
93
-d
o-
572
10
CA
DA
Aura
ngabad
Jui
Deficit
647
8.2
26.2
22.0
01960
2636
2206
14
2.5
-d
o-
No D
ata
10
CA
DA
Aura
ngabad
Galh
ati
Deficit
598
13.8
47.0
84.3
41964
2812
2200
12
1 to 2
So
rgh
um
, W
he
at,
Co
tto
n,
Tu
rN
o D
ata
10
CA
DA
Beed
Sakol
Deficit
850
10.8
40
8.4
00.0
01996
2174
2064
72.1
8S
org
hu
m,
Ch
illi,
Gro
un
dn
ut,
Ma
ize
,
Pa
dd
y,
Ve
ge
tab
les,
Wh
ea
t, G
ram
No D
ata
11
KIC
Kolh
apur
Kadavi
Deficit
3418
70.5
670.5
60.0
02001
9908
9219
52
0.8
-d
o-
0
11
KIC
Kolh
apur
Kum
bhi
Deficit
4985
76.5
74.8
11.6
82001
9170
8711
51
0.1
0 to
1
Su
ge
rca
ne
,
Wh
ea
t,
Gro
un
dn
ut,
Su
nflo
we
r
0
11
CA
DA
Beed
Wan
Deficit
533
19.3
17.6
41967
7125
5262
22
1.5
4S
org
hu
m,
Wh
ea
t,
Su
nflo
we
r, C
ott
on
,
Gro
un
dn
ut
No D
ata
13
TIC
, T
hane
Wandri
Norm
al
2540
35.9
38
35.9
40.0
035.9
41984.8
53066
2044
17
0.2
5 -
do
-0
82

SB
No
Nam
e o
f C
ircle
Nam
e o
f P
roje
ct
Pla
n
Gro
up
Avg.
Annual
Rain
fall
mm
Liv
e
Sto
rag
e
Mm
3
Wate
r fo
r
Irrigation
use M
m3
Wate
r
for
Non
irrigation
use M
m3
Max.L
ive
Sto
rage
observ
ed
during
2003-0
4
Year
of
Com
men
cem
ent
of
Irrigation
Cultura
ble
Com
mand
Are
a H
a
Irrigable
com
mand
are
a H
a
No. of
vill
ages
in
benefit
zone
Avg.
farm
siz
e
Ha
Main
cro
ps
Are
a
covere
d
under
WU
A H
a
Overv
iew
of
Pro
jects
sele
cte
d f
or
Ben
ch
mark
ing
(M
ed
ium
Pro
jects
)
13
KIC
, R
atn
agiri
Natu
wadi
Norm
al
3632
27.2
30
27.2
30.0
01984
2139
2050
18
0.0
2 to
0.0
5
Pa
dd
y,
Gro
un
dn
ut,
Pu
lse
s,
Ma
ng
o2050
13
CA
DA
Sola
pur
Padaw
alk
ar
wadi
Norm
al
500
2.1
22.1
20.0
01973
458
352
21 to 1
.5 -
do
-352
13
CA
DA
Sola
pur
Javalg
on
Norm
al
500
29.1
829.3
76.1
51997
5372
5341
13
1 to 1
.5 -
do
-1200
13
NIC
NA
ND
ED
Mahalin
gi
Norm
al
775
4.7
84.0
61.6
81980
1015
784
61.8
-d
o-
784
18
CA
DA
Sola
pur
Hin
gni (P
)N
orm
al
500
31.9
737.8
31.6
81977
6482
5629
15
1 to 1
.5 -
do
-0
19
CA
DA
Sola
pur
Khasapur
Hig
hly
Deficit
770
13.0
413.3
02.5
51954
3575
2146
15.0
02 to 3
-d
o-
0
19
CA
DA
Beed
Masalg
aH
ighly
Dfi
it
673
13.5
90
11.5
40.0
01996
1678
1364
11
1.7
3S
org
hu
m,
Ba
jri,
Co
tto
nS
un
flo
we
r800
22
CA
DA
Beed
Vhati
Abunda
nt
880
8.2
70
9.9
30.0
01983
1809
1760
72.1
5S
org
hu
m,
Ch
illi,
Gro
un
dn
ut,
Ma
ize
,
Pa
dd
y,
Ve
ge
tab
les,
Wh
ea
t, G
ram
,
Fo
dd
er
1076
NIC
NA
ND
ED
Dongarg
aon
1150
8.3
611.5
50.0
01983
1008
830
51.8
-d
o-
1008
YIC
Yevatm
al
Adan
798
67.2
569.6
711.1
417.7
31979
10067
7804
32
0.5
6C
ott
on
, T
ur,
Su
ga
rca
ne
,
Gro
un
dn
ut
No D
ata
YIC
Yevatm
al
Naw
arg
aon
1067
12.4
713.2
82.7
112.4
71999
2574
2056
15
0.5
6 -
do
-929
BIP
C B
uld
hana
Mun
761
36.8
345.1
00.0
012.8
61992-9
39735
7804
32
2.5
Co
tto
n,
Ch
illy,
Su
nflo
we
r4680
Torn
a711
7.9
7.7
50.1
12.1
11994-9
51725
1465
72.5
-d
o-
354
AIC
Ako
laM
orn
a8
27
41.4
64
6.5
00
.00
19
72
64
64
4633
29
1to
3W
he
at,
Gra
m,
1985
AIC
Akola
Nirguna
812
28.8
534.5
00.0
01979
6377
5836
20
1 to 2
Wh
ea
t, G
ram
,
Co
tto
n,
Hy.J
aw
ar,
Gro
un
dn
ut
2422
AIC
Akola
Um
a818
11.6
810.2
30.9
21982
3007
2241
21
1 to 3
Wh
ea
t, G
ram
,
Co
tto
n,
Hy.J
aw
ar
267
AIC
Akola
Shahanur
1440
46.0
441.1
212.4
51990
9330
7466
47
1.2
7C
ott
on
, S
org
hu
m,
Wh
ea
t, G
ram
,
Ora
ng
e
1391
AIC
Akola
Sonal
860
16.9
217.9
50.0
01981
3496
2447
46
1 to 2
Hy.
Ja
wa
r,
Su
nflo
we
r, C
ott
on
,
Wh
ea
t, G
ram
746
AIC
Akola
Ekburji
986
11.9
79.0
80.7
61964
2625
2429
11
1 to 2
Wh
ea
t, G
ram
134
AIC
Akola
Dnyanganga
732
33.9
333.8
08.6
91971
4494
4249
21
1.5
to 2
Wh
ea
t, G
ram
,
Co
tto
n614
AIC
Akola
Kora
di
660
15.1
215.1
20.0
01981
5067
4061
26
1 to 2
Co
tto
n,
So
rgh
um
,
Wh
ea
t, G
rou
nd
nu
t2729
83

SB
No
Nam
e o
f C
ircle
Nam
e o
f P
roje
ct
Pla
n
Gro
up
Avg.
Annual
Rain
fall
mm
Liv
e
Sto
rag
e
Mm
3
Wate
r fo
r
Irrigation
use M
m3
Wate
r
for
Non
irrigation
use M
m3
Max.L
ive
Sto
rage
observ
ed
during
2003-0
4
Year
of
Com
men
cem
ent
of
Irrigation
Cultura
ble
Com
mand
Are
a H
a
Irrigable
com
mand
are
a H
a
No. of
vill
ages
in
benefit
zone
Avg.
farm
siz
e
Ha
Main
cro
ps
Are
a
covere
d
under
WU
A H
a
Overv
iew
of
Pro
jects
sele
cte
d f
or
Ben
ch
mark
ing
(M
ed
ium
Pro
jects
)
AIC
Akola
Pald
hag
766
7.5
110.4
00.3
71978
3082
1932
14
1 to 2
Wh
ea
t, G
ram
,
Co
tto
n583
AIC
Akola
Mas
696
15.0
421.4
88.0
91982
6107
4415
22
2 to 3
-d
o-
No D
ata
AIC
Akola
Borg
aon
988
6.6
110.8
60.3
51992
3028
2271
16
1.5
to 3
Gro
un
dn
ut,
Co
tto
n,
So
rgh
um
,
Wh
ea
t, G
ram
,
Pu
lse
s
727
AIC
Akola
Saik
heda
1098
27.1
824.7
74.3
81972
3895
3116
18
1.5
to 3
Co
tto
n,
So
rgh
um
,
Wh
ea
t, G
ram
,
Pu
lse
s,
Ve
ge
tab
les
No D
ata
AIC
Akola
Low
er
Pus
852
59.6
370.5
02.4
21990
7606
6600
29
2 to 4
Su
ga
rca
ne
,
Co
tto
n,
So
rgh
um
,
Wh
ea
t, G
ram
,
Pu
lse
s,
Ve
ge
tab
les
No D
ata
CIP
C
Chandra
pur
Panchdhara
1103
8.7
58.4
30.0
06.2
01976
2262
1822
14
1.5
to 2
Co
tto
n,
Wh
ea
tN
o D
ata
CIP
C
Chandra
pur
Poth
ara
1100
34.7
234.7
20.0
034.7
21984
10910
8948
33
1.5
to 2
-d
o-
No D
ata
CIP
C
Chandra
pur
Dongarg
aon
1100
4.4
43.1
70.0
02.9
61974
972
631
91.5
to 2
-d
o-
No D
ata
CIP
C
Chandra
pur
Ghora
zari
1285.2
38
35.0
00.0
033.2
51923
12868
3846
65
1.5
to 2
Pa
dd
yN
o D
ata
CIP
C
Chandra
pur
Nale
shw
ar
1146.6
8.1
84.2
90.0
08.1
81922
5035
1888
23
1.5
to 2
-d
o-
No D
ata
CIP
C
Chandra
pur
Charg
aon
1284.7
19.8
611.9
80.0
019.8
71983
1946
1500
12
1.5
to 2
Pa
dd
y,
Wh
ea
tN
o D
ata
CIP
C
Chandra
pur
Chandai
1205
10.6
99.2
80.0
010.6
91983
2565
2056
14
1.5
to 2
-d
o-
No D
ata
CIP
C
Chandra
pur
Labhansara
d1103
7.3
55.8
70.0
07.3
51987
2024
2024
11
1.5
to 2
Wh
ea
t, C
ott
on
,
So
yb
ea
nN
o D
ata
CIP
C
Chandra
pur
Am
aln
alla
1217.5
21.2
19.5
20.0
021.2
01981
4710
2962
22
1.5
to 2
Wh
ea
t, C
ott
on
,
Gra
mN
o D
ata
CA
DA
Nagpur
Kanholib
ara
1004
19.8
222.0
34.7
318.1
51976
4815
3371
22
3H
W G
rou
nd
nu
t,
Co
tto
n,
So
yb
ea
n,
Wh
ea
t, G
ram
,
Ve
ge
tab
les
No D
ata
CA
DA
Nagpur
Chandra
bhaga
1016
8.2
62
8.2
50.0
28.2
61974-7
53181
2604
15
2.1
Ora
ng
e,
Wh
ea
t,
Gra
m,
Ve
ge
tab
le,
Co
tto
n
No D
ata
CA
DA
Nagpur
Kesam
ala
979
3.9
34.2
80.0
02.2
01976
937
780
71.6
-d
o-
No D
ata
84

SB
No
Nam
e o
f C
ircle
Nam
e o
f P
roje
ct
Pla
n
Gro
up
Avg.
Annual
Rain
fall
mm
Liv
e
Sto
rag
e
Mm
3
Wate
r fo
r
Irrigation
use M
m3
Wate
r
for
Non
irrigation
use M
m3
Max.L
ive
Sto
rage
observ
ed
during
2003-0
4
Year
of
Com
men
cem
ent
of
Irrigation
Cultura
ble
Com
mand
Are
a H
a
Irrigable
com
mand
are
a H
a
No. of
vill
ages
in
benefit
zone
Avg.
farm
siz
e
Ha
Main
cro
ps
Are
a
covere
d
under
WU
A H
a
Overv
iew
of
Pro
jects
sele
cte
d f
or
Ben
ch
mark
ing
(M
ed
ium
Pro
jects
)
CA
DA
Nagpur
Khekra
nala
963
23.8
129.5
40.0
019.6
41987
3810
2610
14
1.5
Co
tto
n,
Wh
ea
t,
Gra
m,
Ora
ng
e,
Su
ga
rca
ne
, H
W
Gro
un
dn
ut,
So
yb
ea
n,
Ve
ge
tab
les.
No D
ata
CA
DA
Nagpur
Kola
r978
31.3
241.2
31.2
124.4
51984
8088
5940
43
2.1
-d
o-
No D
ata
CA
DA
Nagpur
Makard
hokda
963
26.9
127.3
71.4
519.0
51980-8
15835
5477
29
1.3
3P
ad
dy,
Co
tto
n,
Ch
illie
s,
Wh
ea
t,
So
rgh
um
, G
ram
,
So
yb
ea
n,
Ve
ge
tab
les
No D
ata
CA
DA
Nagpur
Mord
ham
1016
4.9
54.9
10.0
54.9
5N
o d
ata
1423
1315
82.1
Ora
ng
e,
Wh
ea
t,
Gra
m,
Ve
ge
tab
les,
Co
tto
n
No D
ata
CA
DA
Nagpur
Pandhara
bodi
1290
13.2
514.5
12.1
513.1
41974-7
51044
862
12
2.1
8P
ad
dy,
Ch
illie
s,
Wh
ea
t, G
ram
,
So
yb
ea
n,
Su
nflo
we
r.
No D
ata
CA
DA
Nagpur
Um
ari
1064
5.1
45.8
50.0
05.1
41971-7
21802
1195
82
Wh
ea
t, C
ott
on
,
Ora
ng
e,
Gra
m,
Ve
ge
tab
les,
Gro
un
dn
ut
No D
ata
CA
DA
Nagpur
Wenna
1100
21.6
69.4
911.5
514.3
91968
2000
1214
10
1.3
3W
he
at,
Co
tto
n,
Ora
ng
e,
Gra
m,
Ve
ge
tab
les
No D
ata
CA
DA
Nagpur
Bageda
1146
4.5
35
4.1
10.0
04.0
41974
1887
1798
10
0.8
5P
ad
dy
No D
ata
CA
DA
Nagpur
Bete
kar
Both
ali
1186
3.6
66
3.6
70.0
03.6
71989
1266
1315
40.7
5 -
do
-N
o D
ata
CA
DA
Nagpur
Chandpur
1200
28.8
728.8
70.0
016.2
21916
10117
6271
40
0.9
-d
o-
No D
ata
CA
DA
Nagpur
Sorn
a1255
5.7
33
5.7
30.0
05.7
31972
1553
933
80.7
5 -
do
-N
o D
ata
CA
DA
Nagpur
Bodalk
asa
1281
19.1
816.4
52.7
316.4
51917
14665
4047
36
0.2
1 -
do
-N
o D
ata
CA
DA
Nagpur
Chork
ham
ara
1267
22.8
20.8
00.0
010.7
11917
13246
4047
25
0.3
5 -
do
-N
o D
ata
CA
DA
Nagpur
Chulb
and
1384
22.2
416.8
20.0
019.9
91976
3378
3167
21
1.1
-d
o-
No D
ata
CA
DA
Nagpur
Khairbanda
870
15.9
53
12.2
20.0
015.3
81915
11271
6109
31
-d
o-
No D
ata
CA
DA
Nagpur
Managad
1609
7.0
81
7.8
30.0
07.0
51970
3390
1700
11
0.3
5 -
do
-N
o D
ata
CA
DA
Nagpur
Rengepar
1138
3.3
38
5.8
60.0
03.5
71977
1305
870
70.7
5 -
do
-N
o D
ata
CA
DA
Nagpur
Sangra
mpur
1281
3.8
68
8.8
70.4
63.6
71969
1536
1094
7 -
do
-N
o D
ata
More
Irr
igation in K
harif and r
egenera
tion o
f flow
in r
iver
due to d
ow
nstr
eem
bandhara
s
85

SB
No
Na
me
of
Circle
Na
me
of
Pro
ject
Pla
n G
rou
pA
vg
.
An
nu
al
Ra
infa
ll
mm
Liv
e
Sto
rag
e
Mm
3
Wa
ter
for
Irrig
atio
n
use
Mm
3
Wa
ter
for
No
n
irrig
atio
n
use
Mm
3
Ma
x.L
ive
Sto
rag
e
ob
se
rve
d
du
rin
g
20
03
-04
Ye
ar
of
Co
mm
en
ce
me
nt
of
Irrig
atio
n
Cu
ltu
rab
le
Co
mm
an
d
Are
a H
a
Irrig
ab
le
co
mm
an
d
are
a H
a
No
. o
f
vill
ag
es
in
be
ne
fit
zo
ne
Avg
.
farm
siz
e
Ha
Ma
in c
rop
sA
rea
co
ve
red
un
de
r
WU
A H
a
2T
an
du
lwa
di
De
ficit
65
31
.99
41
.99
0.0
01
97
25
66
47
43
1.1
5N
o D
ata
2K
osh
tew
ad
iD
eficit
85
00
.76
1.0
50
19
66
19
01
90
11
.05
No
Da
ta
2M
aja
raD
eficit
92
43
.23
2.5
00
3.2
31
99
41
42
51
26
96
2.5
to
35
90
3P
urja
lD
eficit
83
02
.65
62
.66
01
97
56
31
55
84
0.9
No
Da
ta
3A
nch
arw
ad
i-1
De
ficit
73
72
.34
2.6
60
19
85
60
73
70
21
to
2W
he
at,
Gra
m,
Co
tto
nN
o D
ata
3K
ard
iD
eficit
76
64
.89
5.5
20
.00
19
91
-92
11
97
95
88
1.5
Co
tto
n,
Ch
illy,
11
97
3M
asu
ral
De
ficit
77
68
.25
7.8
82
.92
19
90
-91
84
17
34
51
.0C
ott
on
, C
hill
y,
85
4
3V
idru
pa
De
ficit
59
03
.41
0.0
00
.00
19
90
-91
10
20
84
06
1.5
Co
tto
n,
Ch
illy,
0
3M
oh
ag
ava
nD
eficit
80
05
.72
4.1
40
.52
19
98
-99
10
48
70
65
3.0
Co
tto
n,
Ch
illy,
0
4K
utt
arw
ad
iD
eficit
61
81
.46
2.1
20
19
93
37
02
97
22
to
3S
org
hu
m,
Wh
ea
t,
Gra
ss,
Ba
jri,
Gro
un
dn
ut,
Ma
ize
,
No
Da
ta
4M
ah
ira
wa
ni
De
ficit
60
02
.52
2.5
20
2.4
51
97
49
49
57
69
Wh
ea
t,
Gra
m
Kh
.Ve
ge
tab
le
s
No
Da
ta
4H
iwa
rsin
ga
De
ficit
67
5N
o D
ata
1.3
7N
o D
ata
19
89
29
92
57
11
.16
So
rgh
um
,
Ba
jri, C
ott
on
,
Su
nflo
we
r,
Gro
un
dn
ut
No
Da
ta
4B
hu
teka
rwa
di
De
ficit
85
52
.87
03
.37
01
96
91
01
38
09
41
.90
So
rgh
um
,
Ch
illi, M
aiz
e,
Ve
ge
tab
les,
Wh
ea
t,
Co
tto
n
80
9
4D
ha
no
riD
eficit
77
01
.38
91
.41
01
97
44
67
34
31
1.1
0S
ug
arc
an
eN
o D
ata
4W
asu
rD
eficit
83
00
.88
1.1
80
19
71
21
31
71
23
.32
Wh
ea
t,
Gra
m,
Su
ga
rca
ne
,
Co
tto
n,
Gro
un
dn
ut,
So
rgh
um
21
3
4D
ary
ap
ur
De
ficit
87
51
.02
1.5
70
19
73
23
02
22
31
.35
-d
o-
23
0
5C
AD
A B
ee
dA
mth
an
aN
orm
al
75
51
.16
1.4
70
19
66
41
33
44
42
.9 -
do
-N
o D
ata
6N
ich
pu
rN
orm
al
11
50
2.2
2.2
60
.32
19
73
52
53
85
24
.77
Wh
ea
t,
Gra
m,
Su
ga
rca
ne
,
Co
tto
n,
Gro
un
dn
ut,
So
rgh
um
No
Da
ta
CA
DA
Be
ed
Ov
erv
iew
of
Pro
jec
ts s
ele
cte
d f
or
Be
nc
hm
ark
ing
(
Min
or
Pro
jec
ts)
CA
DA
Au
ran
ga
ba
d
YIC
Ye
va
tma
l
CA
DA
Na
sh
ik
Wh
ea
t,
So
rgh
um
,
Co
tto
n,
Gra
m
Gro
un
dn
ut
Co
tto
n,
Tu
r,
Wh
ea
t
86

SB
No
Na
me
of
Circle
Na
me
of
Pro
ject
Pla
n G
rou
pA
vg
.
An
nu
al
Ra
infa
ll
mm
Liv
e
Sto
rag
e
Mm
3
Wa
ter
for
Irrig
atio
n
use
Mm
3
Wa
ter
for
No
n
irrig
atio
n
use
Mm
3
Ma
x.L
ive
Sto
rag
e
ob
se
rve
d
du
rin
g
20
03
-04
Ye
ar
of
Co
mm
en
ce
me
nt
of
Irrig
atio
n
Cu
ltu
rab
le
Co
mm
an
d
Are
a H
a
Irrig
ab
le
co
mm
an
d
are
a H
a
No
. o
f
vill
ag
es
in
be
ne
fit
zo
ne
Avg
.
farm
siz
e
Ha
Ma
in c
rop
sA
rea
co
ve
red
un
de
r
WU
A H
a
Ov
erv
iew
of
Pro
jec
ts s
ele
cte
d f
or
Be
nc
hm
ark
ing
(
Min
or
Pro
jec
ts)
6P
imp
ara
laN
orm
al
75
02
.43
3.3
90
19
68
74
96
72
52
.2 -
do
-7
49
6P
ota
No
rma
l6
50
1.6
72
.13
01
97
27
18
43
24
3.4
3 -
do
-N
o D
ata
6S
aw
an
aN
orm
al
80
42
.15
41
.65
0.5
11
97
94
31
41
03
1 -
do
-N
o D
ata
6H
ird
iN
orm
al
82
1.3
41
.34
01
98
33
53
28
32
0.9
-d
o-
No
Da
ta
6S
ing
do
hN
orm
al
71
41
.22
1.2
20
19
76
24
61
85
31
to
2W
he
at,
Gra
m,
Co
tto
n,
Hy.
Ja
wa
r.
20
9
7P
an
ch
an
ad
iN
orm
al
33
20
1.4
81
1.4
60
19
84
-85
11
49
13
0.2
Be
etle
nu
t,
Co
co
nu
t,
Pa
dd
y
No
Da
ta
7B
ha
tala
No
rma
l1
17
51
.55
1.4
00
1.5
5N
o D
ata
41
53
50
31
.5 t
o 2
Pa
dd
y,
Wh
ea
tN
o D
ata
7L
ag
am
No
rma
l1
28
31
.16
1.2
00
1.3
6N
o D
ata
34
43
15
41
.5 t
o 2
Pa
dd
y,
No
Da
ta
7W
ah
iN
orm
al
12
67
2.0
22
.88
01
99
24
42
40
25
0.8
5 -
do
-N
o D
ata
8N
KIP
C,
Th
an
e
Ba
mb
rud
Su
rplu
s7
43
2.1
81
.97
02
.18
19
75
57
94
61
10
.8 -
do
-N
o D
ata
8P
an
sh
ed
wa
di
Su
rplu
s8
50
1.5
72
.02
01
97
53
20
26
33
1.1
6 -
do
-N
o D
ata
8B
IPC
Bu
ldh
an
a
Sa
wa
kh
ed
Bh
oi
Su
rplu
s6
63
.79
2.6
10
3.4
11
98
8-9
95
89
44
57
3.0
Co
tto
n,
Ch
illy,
Su
nflo
we
r4
45
8U
rku
da
pa
r S
urp
lus
12
14
4.7
54
.75
01
98
01
26
51
01
26
2P
ad
dy,
Ch
illy,
Wh
ea
t, G
ram
No
Da
ta
8W
an
iS
urp
lus
11
90
2.0
21
1.9
80
19
83
52
64
05
55
-d
o-
No
Da
ta
8B
ha
db
ha
dya
Su
rplu
s1
28
42
.85
2.8
50
.19
19
75
80
06
74
31
.11
Pa
dd
yN
o D
ata
9A
tpa
di
Ab
un
da
nt
30
07
.95
6.7
41
.21
3.7
91
96
7-6
81
61
91
12
05
2C
ott
on
,
So
rgh
um
75
5
9B
.Hip
pe
rga
Ab
un
da
nt
85
02
.05
2.9
30
19
73
48
14
81
32
.09
-d
o-
No
Da
ta
9C
IPC
Ch
an
dra
pu
r
Ash
tiA
bu
nd
an
t1
10
01
.64
1.3
60
0.8
61
96
54
55
36
44
1.5
to
2W
he
at,
Co
tto
n,
Gra
mN
o D
ata
10
Mo
za
riD
eficit
69
52
.93
2.3
50
19
77
67
54
75
21
to
2W
he
at,
Gra
m,
Co
tto
n,
92
8
10
Sh
ekd
ari
De
ficit
91
14
.56
4.8
80
19
81
19
75
13
31
71
.2C
ott
on
,
So
rgh
um
,
Wh
ea
t,
Gra
m,
Ora
ng
e.
12
89
10
Ja
mw
ad
iD
eficit
11
96
2.1
62
.16
01
97
85
80
40
64
1 t
o 2
Wh
ea
t,
Gra
m,
Co
tto
n,
So
rgh
um
No
Da
ta
10
Ad
ol
De
ficit
85
09
..3
07
.06
2.4
53
.41
19
91
-92
15
06
15
85
10
3.0
-d
o-
15
85
10
Vis
hw
am
itri
De
ficit
77
21
0.7
51
3.9
11
.25
6.6
61
99
3-9
41
88
21
39
27
3.0
-d
o-
23
3
NK
IPC
,
Th
an
e
SIC
, S
an
gli
AIC
Ako
la
NIC
Na
nd
ed
CA
DA
Na
gp
ur
87

SB
No
Na
me
of
Circle
Na
me
of
Pro
ject
Pla
n G
rou
pA
vg
.
An
nu
al
Ra
infa
ll
mm
Liv
e
Sto
rag
e
Mm
3
Wa
ter
for
Irrig
atio
n
use
Mm
3
Wa
ter
for
No
n
irrig
atio
n
use
Mm
3
Ma
x.L
ive
Sto
rag
e
ob
se
rve
d
du
rin
g
20
03
-04
Ye
ar
of
Co
mm
en
ce
me
nt
of
Irrig
atio
n
Cu
ltu
rab
le
Co
mm
an
d
Are
a H
a
Irrig
ab
le
co
mm
an
d
are
a H
a
No
. o
f
vill
ag
es
in
be
ne
fit
zo
ne
Avg
.
farm
siz
e
Ha
Ma
in c
rop
sA
rea
co
ve
red
un
de
r
WU
A H
a
Ov
erv
iew
of
Pro
jec
ts s
ele
cte
d f
or
Be
nc
hm
ark
ing
(
Min
or
Pro
jec
ts)
10
Vya
gh
raD
eficit
74
77
.14
7.8
61
.35
19
91
-92
19
93
16
15
81
.5C
ott
on
, C
hill
y,
20
4
10
Bra
ha
ma
nw
ad
aD
eficit
75
36
.18
6.0
80
.00
19
95
-96
14
95
11
96
43
.0C
ott
on
, C
hill
y,
13
11
11
Ha
tga
on
-1D
eficit
74
31
.41
.52
00
.97
19
74
-75
44
12
67
11
.5C
ott
on
,
Ve
ge
tab
les
No
Da
ta
11
Ku
nza
r-2
De
ficit
74
31
.01
1.2
10
1.0
11
99
1-9
22
23
17
81
1.5
-d
o-
No
Da
ta
11
Wa
gh
ala
-1D
eficit
74
31
.21
1.2
10
1.2
11
97
6-7
73
13
22
31
1.5
-d
o-
No
Da
ta
11
Ga
lan
dD
eficit
74
31
.87
2.0
10
1.8
71
96
84
25
34
01
0.7
5C
ott
on
,
Gro
un
dn
ut
No
Da
ta
11
Wa
kd
iD
eficit
74
30
.98
0.9
30
0.9
91
97
52
28
18
31
0.8
-d
o-
No
Da
ta
11
Ch
avd
iD
eficit
48
24
.38
4.3
80
19
72
38
83
23
21
to
2W
he
at,
Gra
m,
On
ion
,
Gro
un
dn
ut
32
3
11
Du
dh
kh
ed
aD
eficit
63
50
3.3
66
3.3
70
19
72
48
03
03
40
.4W
he
at,
Co
tto
n,
Gra
mN
o D
ata
15
KIC
Ko
lha
pu
rB
en
ikre
Ab
un
da
nt
14
00
1.7
84
1.7
80
19
90
35
82
86
11
.5 t
o 2
So
rgh
um
,
Gro
un
dn
ut,
Wh
ea
t
No
Da
ta
17
CA
DA
Pu
ne
Th
ose
gh
ar
No
rma
l1
15
81
.84
1.8
40
1.9
11
99
63
06
27
02
0.1
Pa
dd
y,
So
rgh
um
No
Da
ta
17
PIC
Pu
ne
Ra
hu
No
rma
l3
64
9.7
99
.79
08
.21
19
93
23
00
18
87
50
.5 t
o 5
So
rgh
um
,
Ba
jri, W
he
at,
Ma
ize
,
Ve
ge
tab
les,
Pa
dd
y,
Su
ga
rca
ne
No
Da
ta
18
Titra
jN
orm
al
68
51
.14
1.4
70
19
85
36
72
75
31
to
3S
org
hu
m,
Gro
un
dn
ut.
Wh
ea
t
Su
nflo
we
r
0
18
Ta
mb
ve
No
rma
l5
00
4.8
54
.85
04
.59
19
68
13
54
75
07
0.4
Ba
jri,
So
rgh
um
,
Ka
dw
al
No
Da
ta
18
Ch
inch
oli
pa
til
No
rma
l5
00
2.1
72
.17
01
97
75
69
45
53
0.8
3S
org
hu
m,
Gra
in,
Su
nflo
wa
r,
Ma
ze
0
19
Pa
tha
riH
igh
ly
De
ficit
50
01
1.6
21
0.6
30
.99
19
05
10
12
64
77
0.5
to
4S
org
hu
m,
Gro
un
dn
ut.
Su
ga
rca
ne
,
Wh
ea
t,
Su
nflo
we
r
35
2
19
Ma
ng
iH
igh
ly
De
ficit
50
03
2.7
02
7.5
00
19
66
40
00
31
17
21
0.5
to
4S
org
hu
m,
Gro
un
dn
ut.
Su
ga
rca
ne
,
Ma
ize
,
Su
nflo
we
r
93
1
CA
DA
Ja
lga
on
CA
DA
So
lap
ur
88

SB
No
Na
me
of
Circle
Na
me
of
Pro
ject
Pla
n G
rou
pA
vg
.
An
nu
al
Ra
infa
ll
mm
Liv
e
Sto
rag
e
Mm
3
Wa
ter
for
Irrig
atio
n
use
Mm
3
Wa
ter
for
No
n
irrig
atio
n
use
Mm
3
Ma
x.L
ive
Sto
rag
e
ob
se
rve
d
du
rin
g
20
03
-04
Ye
ar
of
Co
mm
en
ce
me
nt
of
Irrig
atio
n
Cu
ltu
rab
le
Co
mm
an
d
Are
a H
a
Irrig
ab
le
co
mm
an
d
are
a H
a
No
. o
f
vill
ag
es
in
be
ne
fit
zo
ne
Avg
.
farm
siz
e
Ha
Ma
in c
rop
sA
rea
co
ve
red
un
de
r
WU
A H
a
Ov
erv
iew
of
Pro
jec
ts s
ele
cte
d f
or
Be
nc
hm
ark
ing
(
Min
or
Pro
jec
ts)
19
Ba
ga
lwa
di
Hig
hly
De
ficit
68
51
.33
1.6
50
19
71
44
13
40
31
to
3S
org
hu
m,
Gro
un
dn
ut.
Wh
ea
t
Su
nflo
we
r
0
19
Inch
arn
aH
igh
ly
De
ficit
58
91
.93
1.9
30
19
71
61
55
55
70
.5 t
o 4
So
rgh
um
,
Gro
un
dn
ut,
Su
ga
rca
ne
,
Ma
ize
Su
nflo
we
r
0
19
Kin
iH
igh
ly
De
ficit
58
91
.24
1.2
40
19
67
38
53
80
30
.5 t
o 4
So
rgh
um
,
Gro
un
dn
ut,
Su
ga
rca
ne
,
Ma
ize
Su
nflo
we
r
0
21
NK
IPC
,
Th
an
e
Dh
asa
iA
bu
nd
an
t2
20
04
.47
84
.20
01
98
4-8
54
57
34
06
0.5
Pa
dd
y,
Ve
ge
tab
les &
fru
its
No
Da
ta
21
Mo
hkn
urd
Ab
un
da
nt
30
70
3.5
90
3.5
90
4.7
41
97
52
13
17
35
0.3
5 -
do
-N
o D
ata
21
Bh
oj
Ab
un
da
nt
24
72
1.6
20
1.6
20
1.5
61
97
42
16
13
53
0.3
5 -
do
-N
o D
ata
21
Kh
an
dp
eA
bu
nd
an
t2
37
72
.00
02
.00
01
.98
19
85
20
21
20
20
.40
-d
o-
12
0
22
Ka
lote
Mo
ka
sh
iA
bu
nd
an
t3
62
34
.19
04
.19
04
.19
19
76
-77
12
61
05
40
.20
Pa
dd
y1
05
22
Ko
nd
ga
on
Ab
un
da
nt
38
72
3.6
41
3.6
40
3.6
41
97
9-8
02
12
18
85
NA
-d
o-
17
8
22
Pa
bh
reA
bu
nd
an
t3
42
91
.78
71
.79
01
.79
19
78
-79
17
41
33
30
.20
-d
o-
13
3
23
Sh
irw
al
Ab
un
da
nt
38
00
3.6
30
2.3
50
19
79
42
12
00
20
.15
to
0.0
5
Co
co
nu
t,
Are
ca
nu
t,
Pe
pp
er,
Sp
ice
s,
Pa
dd
y
20
0
23
Sh
iva
n k
d.
Ab
un
da
nt
79
34
.67
2.5
80
0.6
81
99
5-9
67
12
60
56
2.0
-d
o-
No
Da
ta
TIC
, T
ha
ne
KIC
,
Ra
tna
giri
89

Appendix XIV
Physiography & Agro Climatic zones of Maharashtra
Physiography
The State is divided into five major regions physiographically:
i) Konkan strip on western side (ii) Sahyadri ranges iii) Plateau on eastern side (iv) Hilly ranges of Satpuda and adjacent area on north and (v) Hilly and forest region of north-south Wainganga basin.
1) Konkan Strip
The narrow strip of land extending from Damanganga basin in north to the border of Goa State in south is the Konkan. It has Sahyadri ranges on east and Arabian Sea on west. The Konkan strip is about 53 to 60 km wide and 500 km long along north-south. The widest stretch is about 100 km. Width decreases as one proceeds towards south. The region becomes hilly and altitude increases from the depressed coastline towards east.
2) Sahyadri Ranges
These continuous mountain ranges extend almost parallel to the western coast line. It is known as Western Ghat. The average height of Sahyadri in Maharashtra is 900 m. It is more in the north and diminishes towards south.
3) Eastern Plateau Region (Deccan Plateau)
The height of this plateau goes on diminishing from 600 m on western side to 300 m in the Wainganga basin on east. This region is formed from lava of igneous rocks.
All the districts of Khandesh1, Marathwada2, Western Maharashtra and the western districts of Vidarbha3 fall in this region.
4) Satpuda Ranges and Tapi – Purna basin on North
Satpuda hill ranges lie on the northern boundary of the State. This region is spread over in the districts of Amravati, Akola, Jalgaon and Dhule.
5) Eastern Region Consisting of Wainganga basin
Eastern Region comprises of eastern side of the State and flat paddy field region lies along both the banks of the river at an elevation of about 300 m. On the eastern side of this flat region along the Maharashtra - Chhattisgadh boundary are the hills of different geological formations other than the Deccan Trap. Many eastern tributaries of Wainganga originate from this hill range. The height of this hilly plateau is around 800 m.
Climate
Maharashtra is having mostly a seasonal climate. Four distinct seasons are noticeable in a year viz. (1) Monsoon: The rains start with the south - west winds. Mainly it rains during the four months from June to September, but it often extends up to October. (2) Post-monsoon season: October to mid December is a fair weather season with no rains. These are the initial months of the post-monsoon, rabbi crops and the condition of later depends upon the weather during these months. (3) Winter: It is generally a period of two or two-and-a-half months, from mid-December
1 Khandesh includes Dhule, Nandurbar & Jalgaon districts 2 Marathwada includes Aurangabad, Jalna, Parbhani, Nanded, Osmanabad, Latur, Hingoli & Beed districts 3 Vidarbha includes Akola, Washim, Amravati, Yavatmal, Wardha, Nagpur, Bhandara, Gondia, Chandrapur &
Gadchiroli districts.
90

until end of February. Most of the rabbi crops are harvested during these months. (4) Summer: It lasts for at least three months - March to May.
There is considerable variation in weather and rainfall among the five different geographical regions of Maharashtra.
1 The coastal districts of Konkan experience heavy rains but mild winter. The weather, however, is mostly humid throughout the year.
The maximum and minimum temperatures here range between 270C and 400C and 140C to 270C respectively. The relative humidity is 81% to 95% during June to August while 30% to 65% during January - February.
2 The western parts of Nashik, Pune, Satara and Kolhapur districts show a steep reduction in rainfall from the mountainous regions towards the East. The maximum temperature ranges between 260C to 390C and the minimum temperature between 80C to 230C. The relative humidity is 81% to 99% in August and only 20% to 39% in March.
3 The eastern part of the above four districts together with Ahmednagar, Sangli, Solapur, Aurangabad, Jalna, Beed and Osmanabad districts fall under the rain shadow of Sahyadri Mountains and therefore the beginning and end of the rainy season is quite uncertain in these parts. The rainfall is also meager. The climate is extreme. The summer temperature is high (maximum temperature 360C to 410C) but winter temperature is low (minimum temperature. 100C to 160C). The relative humidity in August is between 82% to 84% but only 19% to 26% in April. The rainfall increases as we go towards east viz. Parbhani, Nanded and Yavatmal. Many a times the eastern winds during the end of monsoon cause precipitation here.
4 Likewise the Tapi basin, the southern parts of Satpuda ranges and Dhule-Jalgaon districts towards west is low rainfall part like that of rain shadow region. But towards east Buldhana, Akola, and Amravati districts experience a heavy rainfall. Summer temperature in this region is quite high (390C to 430C) and minimum winter temperature is found to be 120C to 150C. Relative humidity between May to August is 82% to 87% whereas in March, April It is 12% to 31%.
5 The Wainganga basin on east of Maharashtra and the hilly region still farther east is, on the whole, a zone having good rainfall, but as it is some what low lying area, the climate is even more extreme. The summer temperature is very high (390Cto 450C) while it is cooler in winter as compared to other regions (120Cto140C).
Agro-climatic Zones
The Agriculture Department has divided the State into nine different agro-climatic zones depending upon the climate, foliage, topography, soil and cropping pattern in Maharashtra.
1) Very High Rainfall Zone with Lateritic Soils
This zone having lateritic soils situated between 0 to 500 m above the mean sea level and having very heavy rainfall, encompasses the South Konkan coastal region including Ratnagiri and the far-western parts of Satara and Kolhapur districts. The rainfall period in this zone exceeds 100 to 110 rainy days and the annual rainfall is between 2000 to 3000 mm. The soil is predominantly of lateritic type derived from Basalt. Small belts of saline soils are noticed to have been formed near the river mouths. Paddy is the main crop in the low lying areas while finger millet is cultivated on other areas. Horticulture is also practiced on a large scale.
91
2) Very High Rainfall Zone with Non-lateritic Soils
This is akin to the aforementioned lateritic soils and very high rainfall zone in respect of altitude from the sea level and incident rainfall. It encompasses Thane and northern part of Raigad districts and western-most parts of Nashik, Ahmednagar and Pune districts. Red to gray reddish loamy soils devoid of lateritic rocks occur predominantly in this area. Near the river deltas alluvium and saline soils occur. Paddy, finger millet and pulses are predominantly grown in this region. Similarly this region is also conducive to horticulture and for growing mango, coconut, areca nut, sapota, banana etc. Movements on the Bay of Bengal lead to very intense rains in Konkan. While receding to west these cyclonic storms reach to South Maharashtra, resulting in good rains in winter up to Kolhapur and Sangli.
3) Ghat Zone: Sahyadri ranges and the region with slope 500 to 1500 m on its west extends to the west of Nashik, Ahmednagar, Pune, Sangli and Kolhapur districts. Average annual rainfall in this part is of the order of 2500 to 4000 mm. The soils on slope of hill ranges are shallow, pale gray to dark gray and laden with silty alluvium. Hilly ranges on west of this region exhibit red to red gray lateritic soils. The principal crop of this area is finger millet.
4) Transition Zone–I: The part of 500 to 1000 m altitude on eastern slopes of Western Ghat belonging to Dhule, Nashik, Ahmednagar, Pune and Satara districts falls in Transition Zone - I. The rainfall of this zone ranges from1250 to 2500 mm. The reddish and black soil occurring in this area is derived from basaltic rocks. Heavy rains in winter are conducive to paddy growing. Pearl millet, sorghum and groundnut are the principal crops grown in low lying part.
5) Transition Zone - II:
The undulating terrain of the plains comprises the Transition Zone–II. The central part on west (middle-west part) of Dhule, Nashik, Ahmednagar, Pune, Satara, Sangli districts and north-east part of Kolhapur district fall in this zone. The altitude of this zone from sea level varies from 300 to 1000 m and rainfall variation is of the order of 700 to 1200 mm. The entire terrain is underlain by Deccan Trap. The soils are grayish to dark-grayish and varying in depth. The major Kharif crops are pearl millet, sorghum and groundnut while paddy is cultivated in scattered strips on small scale.
6) Scarcity Zone :
This vast scarcity plains zone is situated at an average altitude of 600 m. The zone encompasses eastern parts of Dhule, Nashik, Ahmednagar, Pune, Satara, Sangli and western parts of Jalgaon, Solapur, Beed and Osmanabad districts. The zone is bounded between isohyets of 500 and 700 mm. Moreover, the rainfall is unevenly distributed. The terrain of this zone too is underlain by Deccan Trap. The soils are calcareous grayish black in colour and are of varying depths and textures. The cropping pattern is of Kharif-cum-Rabbi type.
7) Assured Rainfall Zone:
The terrain is situated at an altitude lesser than 600 m. Major parts of Jalgaon, Aurangabad and Osmanabad and eastern parts of Beed, Parbhani, Nanded, Akola and Amravati are bounded within this zone. Rainfall range is between 700 to 900 mm. The rains necessary for Kharif crops are assured in this zone. The Kharif crops mainly include sorghum, cotton and groundnut. Calcareous clay of dark grayish to black colour formed of Deccan Trap occurs in this zone.
8) Moderate Rainfall Zone:
92

This zone, characterised by moderately assured rains and soft soils, is situated at an altitude the same as that of assured rainfall zone. Wardha, Nagpur, Yavatmal and part of Amravati fall in this zone. The rainfall ranges from 900 to 1250 mm and is evenly distributed in the south- west monsoon period. The depth and texture of soils formed of Deccan Trap vary in different parts of the zone. Alluvium occurs in Tapi, Wardha and Painganga river basins. Kharif crops are extensively grown in the very rich soils of these basins. Along with, Rabbi crops are also harvested. The low-pressure belt developed in the Bay of Bengal causes intense rains in this zone.
9) High Rainfall Zone with Soils from mixed parent material :
This zone of Wainganga basin, soils of which are formed from the composite parent rocks and which is characterised with high rainfall, extends over Chandrapur, Bhandara, Gadchiroli and eastern part of Nagpur with an assured rainfall between 700 to 1250 mm on an average. The soils of this zone are derived from gneisses, granites and other Dharwad and Vindhyan period mountainous rocks. It is formed into red sandy loams or black clayey soils. The predominant crop is paddy in Kharifseason and wheat & sesame are main Rabbi crops.
93

MA
P S
HO
WIN
G A
GR
O-C
LIM
AT
IC
ZO
NE
S
MA
DH
YA
PR
AD
ES
H
GU
JAR
AT
AN
DH
RA
PR
AD
ES
HR
A
A
KA
NAT
K
CHHATISGADH T
MA
HA
RA
SH
TR
A
ST
AT
E
700
600
1000
1250
2500
2500
2500
2500 2
500
3000
3500
4000 4000
3500
3000 3
000
3000
2500
2500
3000
3000
2500
1250
1000
700
700600
600
600
800
900
10001
2001
250
1250
1200
1100
1200
1250
1300
1400
1600 1
500
1700
1700
1600
1500
1400
1300
1250
1200
1100
1000
900
800
NA
ND
UR
BA
R
DH
UL
EJA
LG
AL
ON
BU
LD
HA
NA
AK
OL
A
WA
SH
IM
JA
LN
A
AU
RA
NG
AB
AD
NA
SH
IK
AH
ME
DN
AG
AR
BE
ED
TH
AN
E
MU
MB
AI
PU
NE
RA
IG
AD
SA
TA
RA
SA
NG
LI
RA
TN
AG
IR
I
SIN
DH
UD
UR
G
KO
LH
AP
UR
OS
MA
NA
BA
D
LA
TU
R
PA
RB
HA
NI
NA
ND
ED
HIN
GO
LI
YA
VA
TM
AL
AM
RA
VA
TI
NA
GP
UR
WA
RD
HA
GO
ND
IA
BH
AN
DA
RA
CH
AN
DR
AP
UR
GA
DC
HIR
OL
I
1.
VR
L-V
ER
Y H
IG
H R
AIN
FA
LL
ZO
NE
WIT
H L
AT
ER
IT
IC
SO
IL
S -
----
----
--
2.
VR
N-V
ER
Y H
IG
H R
AIN
FA
LL
ZO
NE
WIT
H N
ON
LA
TE
RIT
IC
SO
IL
S--
-
3.
GH
-G
HA
T Z
ON
E -
----
----
----
----
----
----
----
----
----
----
----
----
----
----
----
----
----
----
--
4.
TR
I-T
RA
NS
IT
IO
N Z
ON
E I
---
----
----
----
----
----
----
----
----
----
----
----
----
----
----
---
5.
TR
2-T
RA
NS
IT
IO
N Z
ON
E I
I -
----
----
----
----
----
----
----
----
----
----
----
----
----
----
---
6.
SC
-SC
AR
CIT
Y Z
ON
E -
----
----
----
----
----
----
----
----
----
----
----
----
----
----
----
----
---
7.
AR
-AS
SU
RE
D R
AIN
FA
LL
ZO
NE
---
----
----
----
----
----
----
----
----
----
----
----
----
--
8.
MR
-MO
DE
RA
TE
RA
IN
FA
LL
ZO
NE
---
----
----
----
----
----
----
----
----
----
----
----
--
9.
HR
M-H
IG
H R
AIN
FA
LL
ZO
NE
WIT
H S
OIL
S--
----
----
----
----
----
----
----
----
--
FR
OM
MIX
ED
PA
RE
NT
MA
TE
RIA
L
SO
LA
PU
R


Appendix XV
Abstract of water rates of selected crops for different seasons (w. e. f. 1.7.2003)
A) Irrigation Use: Rupees per ha
Sr.No.
Name of Crop Water Rate
Flow Irrigation
1 Rabi wheat 476
2 Rabi Gr. nut, Hot Weather Paddy 724
3 Hot weather Gr. Nut, LS cotton 1438
4 Sugarcane, banana 6297
Drip/sprinkler irrigation
5 Sugarcane, banana 4205
Lift Irrigation
1 Sugarcane, banana (canal flow) 1810
2 Sugarcane, banana (drip irrigation) 1205
Water rates of canal water supplied of volumetric basis
Rs. per thousand m3
Sr.No.
Location & Season Rates from
1.7.2003
From Canal @ Minor Head Kharif 47.60
Rabi 71.40 1
Hot weather 144.80
B) Non Irrigation Use:
Water rates for water supplied by Irrigation Department for Industries using water as raw material for soft drink manufacturing and domestic use
Category Water rates in Rs. per 10,000 litres.Sr. No For Industries
manufacturing soft drinks using water
or raw material
ForIndustrial
use
For Domestic
use
1 From Reservoir of dam on a river 145.00 29.00 1.30
2 From canals (by flow or lift)
a) If storage is as per norms 290.00 60.00 3.25
b) If storage is not as per norms 360.00 71.50 5.00
3 From River down stream of dam
a) If storage is as per norms 220.00 47.00 2.50
b) If storage is not as per norms 360.00 71.50 5.00
4. In case capital investment is done by user/contributed in proportion of water use.
50.00 10.00 1.15
95

Water: Mcum, Area : Ha
Water
Utilised for
Irrigation
Area
Irrigated
Water per
unit area
(cum/ha)
Water
Utilised for
Irrigation*
Area
Irrigated
Water per
unit area
(cum/ha)
1 Arunavati 60.18 3579 16814 15.11 2347 6438
2 Asola Mendha 57.74 9919 5821 49.12 9919 4952
3 Bagh 167.35 27722 6037 150.04 30738 4881
4 Bhandardara 321.67 34330 9370 322.13 34732 9275
5 Bhatsa 46.53 986 47202 18.18 962 18898
6 Bhima 1080.54 90658 11919 374.98 32901 11397
7 Bor 65.54 16194 4047 67.06 16194 4141
8 Chanakapur 31.84 7098 4486 27.67 7716 3586
9 Darna 499.96 22912 21821 509.47 26150 19483
10 Dina 53.82 11356 4739 52.35 11356 4610
11 Dudhganga 168.54 14831 11365 147.40 14338 10280
12 Gangapur 30.67 1805 16991 341.01 2710 125834
13 Ghod 132.03 16206 8147 108.10 18891 5722
14 Girna 128.86 10537 12229 58.25 4434 13137
15 Hatnur 155.31 37838 4104 64.93 37838 1716
16 Itiahdoh 277.50 25445 10906 222.00 25240 8796
17 Jayakwadi (PLBC) 537.86 26983 19933 137.22 10595 12951
18 Jayakwadi PRBC 96.12 6416 14982 0.00 0 0
19 Kadva 41.08 1470 27948 52.34 2455 21320
20 Kal 180.34 4368 41284 115.40 4085 28250
21 Katepurna 33.66 3943 8535 0.00 0 0
22 Khadakwasla 329.77 19704 16736 345.27 16213 21296
23 Krishna 392.86 54974 7146 269.09 49396 5448
24 Kukadi 389.26 58649 6637 377.97 61683 6128
25 Lower Terna 28.41 2476 11475 0.00 0 0
26 Lower Wunna 115.02 5473 21015 78.84 5927 13302
27 Majalgaon 132.30 8963 14760 2.63 494 5324
28 Manar 92.12 9207 10005 83.13 11166 7445
29 Manjra 67.04 7596 8825 0.00 0 0
30 Mula 482.56 36910 13074 261.80 37329 7013
31 Nalganga 21.37 2504 8534 25.13 3338 7528
32 NLBC 407.09 39111 10409 365.87 34199 10698
33 NRBC 711.29 64931 10955 668.97 77539 8628
34 Ozerkhed 33.59 3037 11060 155.73 3182 48941
35 Palkhed 90.91 11596 7840 74.91 15851 4726
36 Pawana 31.21 2994 10425 25.31 3083 8210
37 Pench 682.40 65305 10449 791.00 85134 9291
38 Purna 549.01 39538 13885 353.30 38757 9116
39 Pus 66.15 4745 13942 52.85 5621 9402
40 Radhanagari 210.87 23947 8806 328.38 26274 12498
41 Rajanala 24.41 2143 11390 31.28 2087 14988
42 Surya 110.56 1739 63567 70.48 2333 30210
43 Tulashi 29.16 2632 11082 34.35 2560 13418
44 Upper Penganga 439.49 17607 24962 330.00 33913 9731
45 Upper Wardha 137.47 7582 18132 262.65 13233 19848
46 Vishnupuri 75.21 7002 10742 51.27 9876 5191
47 Waghad 32.66 3410 9579 34.49 2264 15234
48 Wan 20.60 1879 10962 66.97 9481 7064
49 Warna 288.46 27757 10392 306.65 29151 10519
Appendix XVI
Data for Benchmarking report for Major Projects
Annual Irrigation Water Supply per unit Irrigated Area
Indicator I
* Includes water used by lift
2003-04Five year Average
ProjectSr. No
96

Irrigation Potential: ha
Utilised
Irrigation
Potential
Created
Irrigation
Potential
Ratio
Utilised
Irrigation
Potential
Created
Irrigation
Potential
Ratio
1 Arunavati 3579 20788 0.17 2347 21441 0.11
2 Asola Mendha 9919 9919 1.00 9919 9919 1.00
3 Bagh 27722 38471 0.72 30738 38471 0.80
4 Bhandardara 34330 23077 1.49 34732 23077 1.51
5 Bhatsa 986 5142 0.19 962 5982 0.16
6 Bhima 90658 209494 0.43 32901 214485 0.15
7 Bor 16194 16194 1.00 16194 16194 1.00
8 Chanakapur 7098 18460 0.38 7716 18460 0.42
9 Darna 22912 33170 0.69 26150 33170 0.79
10 Dina 11356 11356 1.00 11356 11356 1.00
11 Dudhganga 14831 38388 0.39 14338 38388 0.37
12 Gangapur 1805 12190 0.15 2710 12190 0.22
13 Ghod 16206 20500 0.79 18891 20500 0.92
14 Girna 10537 69350 0.15 4434 69350 0.06
15 Hatnur 37838 37838 1.00 37838 37838 1.00
16 Itiahdoh 25445 29192 0.87 25240 31730 0.80
17 Jayakwadi (PLBC) 26983 141640 0.19 10595 141640 0.07
18 Jayakwadi PRBC 6416 41682 0.15 0 41682 0.00
19 Kadva 1470 8473 0.17 2455 8811 0.28
20 Kal 4368 7964 0.55 4085 7964 0.51
21 Katepurna 3943 8325 0.47 0 8325 0.00
22 Khadakwasla 19704 60660 0.32 16213 62146 0.26
23 Krishna 54974 69269 0.79 49396 69269 0.71
24 Kukadi 58649 104391 0.56 61683 114271 0.54
25 Lower Terna 2476 7991 0.31 0 8775 0.00
26 Lower Wunna 5473 19427 0.28 5927 22146 0.27
27 Majalgaon 8963 47442 0.19 494 51840 0.01
28 Manar 9207 24475 0.38 11166 24475 0.46
29 Manjra 7596 18223 0.42 0 18223 0.00
30 Mula 36910 82920 0.45 37329 82920 0.45
31 Nalganga 2504 8741 0.29 3338 8741 0.38
32 NLBC 39111 60656 0.64 34199 60656 0.56
33 NRBC 64931 65506 0.99 77539 65506 1.18
34 Ozerkhed 3037 10400 0.29 3182 10400 0.31
35 Palkhed 11596 41580 0.28 15851 43154 0.37
36 Pawana 2994 6365 0.47 3083 6365 0.48
37 Pench 65305 104476 0.63 85134 104476 0.81
38 Purna 39538 57988 0.68 38757 57988 0.67
39 Pus 4745 9183 0.52 5621 9183 0.61
40 Radhanagari 23947 35422 0.68 26274 26274 1.00
41 Rajanala 2143 2542 0.84 2087 2542 0.82
42 Surya 1739 12188 0.14 2333 12188 0.19
43 Tulashi 2632 4720 0.56 2560 4720 0.54
44 Upper Penganga 17607 63205 0.28 33913 66935 0.51
45 Upper Wardha 7582 60300 0.13 13233 62848 0.21
46 Vishnupuri 7002 15630 0.45 9876 15630 0.63
47 Waghad 3410 6750 0.51 2264 6750 0.34
48 Wan 1879 12524 0.15 9481 18735 0.51
49 Warna 27757 54610 0.51 29151 54610 0.53
Potential Utilised and Created
Indicator II
Sr. No. Project
Five Year Average 2003-04
97

Annual Output: Rs. Lakh, Irrigation Potential: ha
Annual
Output
Utilised
Irigation
Potential
Output per
unit area
Rs./ha
Annual
Output
Utilised
Irigation
Potential
Output per
unit area
Rs./ha
1 Arunavati 592.97 3579 16568 408.20 2347 17392
2 Asola Mendha 2804.61 9919 28275 2899.33 9919 29230
3 Bagh 6305.29 27722 22745 6046.33 30738 19671
4 Bhandardara 5476.35 34330 15952 5112.71 34732 14720
5 Bhatsa 204.80 986 20775 201.01 962 20895
6 Bhima 35807.00 90658 39497 13610.00 32901 41367
7 Bor 1420.03 16194 8769 1157.87 16194 7150
8 Chanakapur 3607.44 7098 50820 4232.74 7716 54857
9 Darna 9444.78 22912 41221 8729.30 26150 33382
10 Dina 2624.37 11356 23110 2611.79 11356 22999
11 Dudhganga 6726.00 14831 45352 5856.00 14338 40843
12 Gangapur 1130.33 1805 62615 2357.20 2710 86982
13 Ghod 5514.80 16206 34030 5370.00 18891 28426
14 Girna 1418.33 10537 13460 800.72 4434 18059
15 Hatnur 5548.94 37838 14665 16216.90 37838 42859
16 Itiahdoh 5262.34 25445 20681 6426.74 25240 25463
17 Jayakwadi (PLBC) 3965.27 26983 14695 1390.75 10595 13126
18 Jayakwadi PRBC 1242.24 6416 19362 0.00 0 0
19 Kadva 371.23 1470 25254 647.70 2455 26383
20 Kal 1858.48 4368 42544 1927.30 4085 47180
21 Katepurna 936.33 3943 23746 0.00 0 0
22 Khadakwasla 2072.05 19704 10516 1566.14 16213 9660
23 Krishna 14974.80 54974 27240 9681.00 49396 19599
24 Kukadi 22423.40 58649 38233 16005.00 61683 25947
25 Lower Terna 880.22 2476 35550 0.00 0 0
26 Lower Wunna 594.67 5473 10865 617.41 5927 10417
27 Majalgaon 1542.02 8963 17204 57.83 494 11706
28 Manar 2269.48 9207 24649 2698.38 11166 24166
29 Manjra 3998.73 7596 52641 0.00 0 0
30 Mula 5817.42 36910 15761 3721.28 37329 9969
31 Nalganga 518.55 2504 20710 910.94 3338 27290
32 NLBC 11845.85 39111 30288 10334.00 34199 30217
33 NRBC 17045.81 64931 26252 17131.03 77539 22093
34 Ozerkhed 872.14 3037 28717 1613.30 3182 50701
35 Palkhed 3470.24 11596 29927 4062.93 15851 25632
36 Pawana 325.87 2994 10885 388.83 3083 12612
37 Pench 15614.60 65305 23910 21105.60 85134 24791
38 Purna 7761.61 39538 19631 8113.03 38757 20933
39 Pus 1071.76 4745 22588 903.21 5621 16068
40 Radhanagari 12437.20 23947 51937 9081.00 26274 34563
41 Rajanala 783.83 2143 36573 669.30 2087 32070
42 Surya 306.88 1739 17645 733.13 2333 31424
43 Tulashi 1376.40 2632 52303 716.00 2560 27969
44 Upper Penganga 5804.00 17607 32965 13500.00 33913 39808
45 Upper Wardha 1008.65 7582 13304 4085.21 13233 30871
46 Vishnupuri 2139.60 7002 30557 3062.10 9876 31005
47 Waghad 2371.53 3410 69555 1866.64 2264 82449
48 Wan 296.40 1879 15771 661.68 9481 6979
49 Warna 17264.80 27757 62199 13953.00 29151 47865
Indicator III
Output per unit Irrigated Area
Sr. No. Project
Five Year Average 2003-04
98

Annual Output: Rs.Lakh, Water: Mcum
Annual
Output
Water
Utilised*
Output per
unit water
Rs./cum
Annual
Output
Water
Utilised*
Output per
unit water
Rs./cum
1 Arunavati 592.97 60.18 0.99 408.20 15.11 2.70
2 Asola Mendha 2804.61 57.74 4.86 2899.33 49.12 5.90
3 Bagh 6305.29 167.35 3.77 6046.33 150.04 4.03
4 Bhandardara 5476.35 321.67 1.70 5112.71 322.13 1.59
5 Bhatsa 204.80 46.53 0.44 201.01 18.18 1.11
6 Bhima 35807.00 1080.54 3.31 13610.00 374.98 3.63
7 Bor 1420.03 65.54 2.17 1157.87 67.06 1.73
8 Chanakapur 3607.44 31.84 11.33 4232.74 27.67 15.30
9 Darna 9444.78 499.96 1.89 8729.30 509.47 1.71
10 Dina 2624.37 53.82 4.88 2611.79 52.35 4.99
11 Dudhganga 6726.00 168.54 3.99 5856.00 147.40 3.97
12 Gangapur 1130.33 30.67 3.69 2357.20 341.01 0.69
13 Ghod 5514.80 132.03 4.18 5370.00 108.10 4.97
14 Girna 1418.33 128.86 1.10 800.72 58.25 1.37
15 Hatnur 5548.94 155.31 3.57 16216.90 64.93 24.98
16 Itiahdoh 5262.34 277.50 1.90 6426.74 222.00 2.89
17 Jayakwadi (PLBC) 3965.27 537.86 0.74 1390.75 137.22 1.01
18 Jayakwadi PRBC 1242.24 96.12 1.29 0.00 0.00 0.00
19 Kadva 371.23 41.08 0.90 647.70 52.34 1.24
20 Kal 1858.48 180.34 1.03 1927.30 115.40 1.67
21 Katepurna 936.33 33.66 2.78 0.00 0.00 0.00
22 Khadakwasla 2072.05 329.77 0.63 1566.14 345.27 0.45
23 Krishna 14974.80 392.86 3.81 9681.00 269.09 3.60
24 Kukadi 22423.40 389.26 5.76 16005.00 377.97 4.23
25 Lower Terna 880.22 28.41 3.10 0.00 0.00 0.00
26 Lower Wunna 594.67 115.02 0.52 617.41 78.84 0.78
27 Majalgaon 1542.02 132.30 1.17 57.83 2.63 2.20
28 Manar 2269.48 92.12 2.46 2698.38 83.13 3.25
29 Manjra 3998.73 67.04 5.97 0.00 0.00 0.00
30 Mula 5817.42 482.56 1.21 3721.28 261.80 1.42
31 Nalganga 518.55 21.37 2.43 910.94 25.13 3.62
32 NLBC 11845.85 407.09 2.91 10334.00 365.87 2.82
33 NRBC 17045.81 711.29 2.40 17131.03 668.97 2.56
34 Ozerkhed 872.14 33.59 2.60 1613.30 155.73 1.04
35 Palkhed 3470.24 90.91 3.82 4062.93 74.91 5.42
36 Pawana 325.87 31.21 1.04 388.83 25.31 1.54
37 Pench 15614.60 682.40 2.29 21105.60 791.00 2.67
38 Purna 7761.61 549.01 1.41 8113.03 353.30 2.30
39 Pus 1071.76 66.15 1.62 903.21 52.85 1.71
40 Radhanagari 12437.20 210.87 5.90 9081.00 328.38 2.77
41 Rajanala 783.83 24.41 3.21 669.30 31.28 2.14
42 Surya 306.88 110.56 0.28 733.13 70.48 1.04
43 Tulashi 1376.40 29.16 4.72 716.00 34.35 2.08
44 Upper Penganga 5804.00 439.49 1.32 13500.00 330.00 4.09
45 Upper Wardha 1008.65 137.47 0.73 4085.21 262.65 1.56
46 Vishnupuri 2139.60 75.21 2.84 3062.10 51.27 5.97
47 Waghad 2371.53 32.66 7.26 1866.64 34.49 5.41
48 Wan 296.40 20.60 1.44 661.68 66.97 0.99
49 Warna 17264.80 288.46 5.99 13953.00 306.65 4.55
* Includes water used by lift.
Output per unit Irrigation Water supply
Indicator IV
2003-04Five Year Average
ProjectSr.
No.
99

Revenue, O&M Cost: Rs Lakh
Revenue O&M Cost Ratio Revenue O&M Cost Ratio
1 Arunavati 3.30 21.18 0.16 6.14 25.87 0.24
2 Asola Mendha 20.92 59.81 0.35 16.64 42.54 0.39
3 Bagh 34.08 334.34 0.10 90.76 226.83 0.40
4 Bhandardara 217.78 172.75 1.26 242.88 18.69 13.00
5 Bhatsa 1671.27 49.32 33.89 3154.00 45.11 69.92
6 Bhima 787.81 545.45 1.44 614.38 534.58 1.15
7 Bor 29.73 308.29 0.10 20.72 957.80 0.02
8 Chanakapur 95.97 60.33 1.59 126.18 41.23 3.06
9 Darna 419.71 300.40 1.40 489.36 118.28 4.14
10 Dina 16.84 80.93 0.21 25.61 49.85 0.51
11 Dudhganga 164.10 281.73 0.58 172.65 286.17 0.60
12 Gangapur 1598.24 130.92 12.21 2013.02 29.77 67.62
13 Ghod 90.99 101.36 0.90 81.11 92.33 0.88
14 Girna 127.11 311.07 0.41 159.51 155.87 1.02
15 Hatnur 918.93 206.36 4.45 1268.70 131.93 9.62
16 Itiahdoh 42.51 463.93 0.09 78.41 291.71 0.27
17 Jayakwadi (PLBC) 300.25 828.65 0.36 1434.17 833.25 1.72
18 Jayakwadi PRBC 59.90 192.94 0.31 31.89 208.84 0.15
19 Kadva 77.70 86.70 0.90 62.80 77.57 0.81
20 Kal 1553.51 114.36 13.58 2214.00 32.88 67.34
21 Katepurna 58.97 76.06 0.78 15.98 56.53 0.28
22 Khadakwasla 1371.95 782.92 1.75 1930.92 701.88 2.75
23 Krishna 277.83 291.71 0.95 396.90 239.75 1.66
24 Kukadi 137.52 440.51 0.31 274.57 440.50 0.62
25 Lower Terna 18.43 35.58 0.52 4.25 170.23 0.02
26 Lower Wunna 85.07 33.77 2.52 188.61 39.82 4.74
27 Majalgaon 573.06 137.31 4.17 942.38 66.08 14.26
28 Manar 14.93 195.30 0.08 27.29 221.52 0.12
29 Manjra 128.82 166.64 0.77 43.92 118.41 0.37
30 Mula 173.43 607.71 0.29 237.70 557.23 0.43
31 Nalganga 12.23 27.17 0.45 29.86 35.53 0.84
32 NLBC 384.73 220.57 1.74 432.50 130.71 3.31
33 NRBC 484.23 222.80 2.17 576.44 130.37 4.42
34 Ozerkhed 14.08 54.21 0.26 41.80 62.00 0.67
35 Palkhed 163.58 201.79 0.81 260.93 260.93 1.00
36 Pawana 1127.80 115.10 9.80 1847.90 85.11 21.71
37 Pench 988.37 631.26 1.57 2147.00 700.90 3.06
38 Purna 122.62 529.76 0.23 275.36 366.08 0.75
39 Pus 15.84 52.99 0.30 86.83 50.56 1.72
40 Radhanagari 512.66 95.81 5.35 801.87 94.23 8.51
41 Rajanala 1.41 38.24 0.04 1.91 12.22 0.16
42 Surya 326.57 101.75 3.21 921.43 38.79 23.75
43 Tulashi 17.11 46.22 0.37 18.64 52.12 0.36
44 Upper Penganga 105.65 464.72 0.23 174.73 534.19 0.33
45 Upper Wardha 59.64 33.83 1.76 102.41 97.39 1.05
46 Vishnupuri 41.81 176.34 0.24 138.78 93.41 1.49
47 Waghad 6.64 47.88 0.14 11.92 19.16 0.62
48 Wan 2.96 17.80 0.17 15.00 20.27 0.74
49 Warna 252.82 82.11 3.08 396.76 73.41 5.40
Indicator V
Cost Recovery Ratio
2003-04Five Year Average
ProjectSr.
No.
100

O&Mcost: Rs.Lakhs, Area: ha
O&M CostArea
Irrigated
O&M Cost
per unit
area
Rs./ha
O&M CostArea
Irrigated
O&M Cost
per unit
area
Rs./ha
1 Arunavati 21.18 3579 591.79 25.87 2347 1102.26
2 Asola Mendha 59.81 9919 603.02 42.54 9919 428.87
3 Bagh 334.34 27722 1206.05 226.83 30738 737.95
4 Bhandardara 172.75 34330 503.21 18.69 34732 53.81
5 Bhatsa 49.32 986 5002.84 45.11 962 4689.19
6 Bhima 545.45 90658 601.66 534.58 32901 1624.81
7 Bor 308.29 16194 1903.71 957.80 16194 5914.54
8 Chanakapur 60.33 7098 849.88 41.23 7716 534.34
9 Darna 300.40 22912 1311.09 118.28 26150 452.31
10 Dina 80.93 11356 712.66 49.85 11356 438.97
11 Dudhganga 281.73 14831 1899.65 286.17 14338 1995.89
12 Gangapur 130.92 1805 7252.60 29.77 2710 1098.52
13 Ghod 101.36 16206 625.45 92.33 18891 488.75
14 Girna 311.07 10537 2952.09 155.87 4434 3515.34
15 Hatnur 206.36 37838 545.38 131.93 37838 348.67
16 Itiahdoh 463.93 25445 1823.29 291.71 25240 1155.74
17 Jayakwadi (PLBC) 828.65 26983 3070.97 833.25 10595 7864.60
18 Jayakwadi PRBC 192.94 6416 3007.33 208.84 0 0.00
19 Kadva 86.70 1470 5898.23 77.57 2455 3159.67
20 Kal 114.36 4368 2617.80 32.88 4085 804.90
21 Katepurna 76.06 3943 1928.94 56.53 0 0.00
22 Khadakwasla 782.92 19704 3973.33 701.88 16213 4329.12
23 Krishna 291.71 54974 530.64 239.75 49396 485.36
24 Kukadi 440.51 58649 751.09 440.50 61683 714.14
25 Lower Terna 35.58 2476 1436.79 170.23 0 0.00
26 Lower Wunna 33.77 5473 617.06 39.82 5927 671.84
27 Majalgaon 137.31 8963 1531.96 66.08 494 13376.52
28 Manar 195.30 9207 2121.21 221.52 11166 1983.88
29 Manjra 166.64 7596 2193.68 118.41 0 0.00
30 Mula 607.71 36910 1646.46 557.23 37329 1492.75
31 Nalganga 27.17 2504 1085.07 35.53 3338 1064.41
32 NLBC 220.57 39111 563.97 130.71 34199 382.20
33 NRBC 222.80 64931 343.14 130.37 77539 168.13
34 Ozerkhed 54.21 3037 1784.92 62.00 3182 1948.46
35 Palkhed 201.79 11596 1740.18 260.93 15851 1646.14
36 Pawana 115.10 2994 3844.94 85.11 3083 2760.62
37 Pench 631.26 65305 966.64 700.90 85134 823.29
38 Purna 529.76 39538 1339.87 366.08 38757 944.55
39 Pus 52.99 4745 1116.76 50.56 5621 899.48
40 Radhanagari 95.81 23947 400.11 94.23 26274 358.64
41 Rajanala 38.24 2143 1784.34 12.22 2087 585.53
42 Surya 101.75 1739 5850.39 38.79 2333 1662.67
43 Tulashi 46.22 2632 1756.27 52.12 2560 2035.94
44 Upper Penganga 464.72 17607 2639.49 534.19 33913 1575.18
45 Upper Wardha 33.83 7582 446.16 97.39 13233 735.96
46 Vishnupuri 176.34 7002 2518.39 93.41 9876 945.83
47 Waghad 47.88 3410 1404.39 19.16 2264 846.29
48 Wan 17.80 1879 947.22 20.27 9481 213.80
49 Warna 82.11 27757 295.80 73.41 29151 251.83
Indicator VI
O&M Cost per unit Area
2003-04Five Year Average
ProjectSr.
No.
101

O&M Cost : Rs. Lakhs, Water : Mcum
Total O&M
Cost Rs.
Lakh
Water
Utilised*
Total O&M
per unit
water
Rs./cum
Total O&M
Cost Rs.
Lakh
Water
Utilised*
Total O&M
per unit
water
Rs./cum
1 Arunavati 21.18 60.18 0.04 25.87 28.76 0.09
2 Asola Mendha 59.81 57.74 0.10 42.54 49.12 0.09
3 Bagh 334.34 167.35 0.20 226.83 150.04 0.15
4 Bhandardara 172.75 321.67 0.05 18.69 322.13 0.01
5 Bhatsa 49.32 402.54 0.01 45.11 501.00 0.01
6 Bhima 545.45 1718.25 0.03 534.58 971.65 0.06
7 Bor 308.29 66.77 0.46 957.80 73.41 1.31
8 Chanakapur 60.33 61.79 0.10 41.23 62.19 0.07
9 Darna 300.40 499.96 0.06 118.28 509.47 0.02
10 Dina 80.93 53.82 0.15 49.85 52.34 0.10
11 Dudhganga 281.73 179.04 0.16 286.17 182.40 0.16
12 Gangapur 130.92 30.67 0.43 29.77 343.84 0.01
13 Ghod 101.36 136.98 0.07 92.33 111.54 0.08
14 Girna 311.07 194.30 0.16 155.87 150.63 0.10
15 Hatnur 206.36 273.77 0.08 131.93 169.22 0.08
16 Itiahdoh 463.93 277.50 0.17 291.71 222.00 0.13
17 Jayakwadi (PLBC) 828.65 600.93 0.14 833.25 403.94 0.21
18 Jayakwadi PRBC 192.94 107.03 0.18 208.84 22.14 0.94
19 Kadva 86.70 41.08 0.21 77.57 52.34 0.15
20 Kal 114.36 0.00 0.00 32.88 478.25 0.00
21 Katepurna 76.06 56.44 0.13 56.53 32.65 0.17
22 Khadakwasla 782.92 708.39 0.11 701.88 728.49 0.10
23 Krishna 291.71 413.98 0.07 239.75 280.56 0.09
24 Kukadi 440.51 401.55 0.11 440.50 579.76 0.08
25 Lower Terna 35.58 32.12 0.11 170.23 0.00 0.00
26 Lower Wunna 33.77 119.83 0.03 39.82 90.84 0.05
27 Majalgaon 137.31 145.87 0.09 66.08 5.34 1.24
28 Manar 195.30 97.77 0.20 221.52 87.55 0.25
29 Manjra 166.64 105.45 0.16 118.41 6.36 1.86
30 Mula 607.71 482.56 0.13 557.23 269.09 0.21
31 Nalganga 27.17 25.09 0.11 35.53 30.30 0.12
32 NLBC 220.57 426.65 0.05 130.71 387.75 0.03
33 NRBC 222.80 749.95 0.03 130.37 710.22 0.02
34 Ozerkhed 54.21 33.59 0.16 62.00 155.73 0.04
35 Palkhed 201.79 90.91 0.22 260.93 74.91 0.35
36 Pawana 115.10 195.40 0.06 85.11 188.87 0.05
37 Pench 631.26 873.60 0.07 700.90 1005.00 0.07
38 Purna 529.76 565.15 0.09 366.08 390.21 0.09
39 Pus 52.99 52.25 0.10 50.56 57.97 0.09
40 Radhanagari 95.81 278.39 0.03 94.23 328.38 0.03
41 Rajanala 38.24 0.00 0.00 12.22 0.00 0.00
42 Surya 101.75 138.51 0.07 38.79 98.43 0.04
43 Tulashi 46.22 34.40 0.13 52.12 74.62 0.07
44 Upper Penganga 464.72 458.71 0.10 534.19 384.00 0.14
45 Upper Wardha 33.83 167.99 0.02 97.39 330.56 0.03
46 Vishnupuri 176.34 92.41 0.19 93.41 66.17 0.14
47 Waghad 47.88 32.66 0.15 19.16 34.49 0.06
48 Wan 17.80 20.60 0.09 20.27 66.97 0.03
49 Warna 82.11 317.84 0.03 73.41 396.76 0.02
* Includes water used by lift.
Indicator VII
Total O&M Cost per unit Water
2003-04Five Year's Average
ProjectSr.
No.
102

Revenue: Rs. Lakhs, Water : Mcum
Revenue
Total
Water
Utilised*
Revenue
per unit of
Water
Supplied
Rs./cum
Revenue
Total
Water
Utilised*
Revenue
per unit of
Water
Supplied
Rs./cum
1 Arunavati 3.30 60.18 0.01 6.14 23.76 0.02
2 Asola Mendha 20.92 57.74 0.04 16.64 49.12 0.03
3 Bagh 34.08 167.35 0.02 90.76 150.04 0.06
4 Bhandardara 217.78 321.67 0.07 242.88 322.13 0.08
5 Bhatsa 1671.27 402.54 0.42 3154.00 501.00 0.63
6 Bhima 787.81 1718.25 0.05 614.38 971.65 0.06
7 Bor 29.73 66.77 0.04 20.72 73.41 0.03
8 Chanakapur 95.97 61.79 0.16 126.18 62.19 0.20
9 Darna 419.71 499.96 0.08 489.36 509.47 0.10
10 Dina 16.84 53.82 0.03 25.61 52.34 0.05
11 Dudhganga 164.10 179.04 0.09 172.65 182.40 0.10
12 Gangapur 1598.24 30.67 5.21 2013.02 343.84 0.59
13 Ghod 90.99 136.98 0.07 81.11 111.54 0.07
14 Girna 127.11 194.30 0.07 159.51 150.63 0.11
15 Hatnur 918.93 273.77 0.34 1268.70 169.22 0.75
16 Itiahdoh 42.51 277.50 0.02 78.41 222.00 0.04
17 Jayakwadi (PLBC) 300.25 600.93 0.05 1434.17 403.94 0.36
18 Jayakwadi PRBC 59.90 107.03 0.06 31.89 22.14 0.14
19 Kadva 77.70 41.08 0.19 62.80 52.34 0.12
20 Kal 1553.51 0.00 0.00 2214.00 478.25 0.46
21 Katepurna 58.97 56.44 0.10 15.98 32.65 0.05
22 Khadakwasla 1371.95 708.39 0.19 1930.92 728.49 0.27
23 Krishna 277.83 413.98 0.07 396.90 280.56 0.14
24 Kukadi 137.52 401.55 0.03 274.57 579.76 0.05
25 Lower Terna 18.43 32.12 0.06 4.25 0.00 0.00
26 Lower Wunna 85.07 119.83 0.07 188.61 90.84 0.22
27 Majalgaon 573.06 145.87 0.39 942.38 5.34 17.65
28 Manar 14.93 97.77 0.02 27.29 87.55 0.03
29 Manjra 128.82 105.45 0.12 43.92 6.36 0.69
30 Mula 173.43 482.56 0.04 237.70 269.09 0.09
31 Nalganga 12.23 25.09 0.05 29.86 30.30 0.10
32 NLBC 384.73 426.65 0.09 432.50 387.75 0.11
33 NRBC 484.23 749.95 0.06 576.44 710.22 0.08
34 Ozerkhed 14.08 33.59 0.04 41.80 155.73 0.03
35 Palkhed 163.58 90.91 0.18 260.93 74.91 0.35
36 Pawana 1127.80 195.40 0.58 1847.90 188.87 0.98
37 Pench 988.37 873.60 0.11 2147.00 1005.00 0.21
38 Purna 122.62 565.15 0.02 275.36 390.21 0.07
39 Pus 15.84 52.25 0.03 86.83 57.97 0.15
40 Radhanagari 512.66 278.39 0.18 801.87 328.38 0.24
41 Rajanala 1.41 0.00 0.00 1.91 0.00 0.00
42 Surya 326.57 138.51 0.24 921.43 98.43 0.94
43 Tulashi 17.11 34.40 0.05 18.64 74.62 0.03
44 Upper Penganga 105.65 458.71 0.02 174.73 384.00 0.05
45 Upper Wardha 59.64 167.99 0.04 102.41 330.56 0.03
46 Vishnupuri 41.81 92.41 0.05 138.78 66.17 0.21
47 Waghad 6.64 32.66 0.02 11.92 34.49 0.03
48 Wan 2.96 20.60 0.01 15.00 66.97 0.02
49 Warna 252.82 317.84 0.08 396.76 396.76 0.10
* Includes water used by lift.
Revenue per unit of water supplied
Indicator VIII
2003-04Five Year Average
ProjectSr.
No.
103

Area: ha
MandaysArea
Irrigated
Mandays
per unit
area
MandaysArea
Irrigated
Mandays
per unit
area
1 Arunavati 42671 3579 11.92 51634 2347 22.00
2 Asola Mendha 10889 9919 1.10 10220 9919 1.03
3 Bagh 116746 27722 4.21 109623 30738 3.57
4 Bhandardara 151798 34330 4.42 151430 34732 4.36
5 Bhatsa 47 986 0.05 60 962 0.06
6 Bhima 236228 90658 2.61 249660 32901 7.59
7 Bor 39858 16194 2.46 39420 16194 2.43
8 Chanakapur 637 7098 0.09 617 7716 0.08
9 Darna 131035 22912 5.72 131035 26150 5.01
10 Dina 24455 11356 2.15 22265 11356 1.96
11 Dudhganga 137970 14831 9.30 121545 14338 8.48
12 Gangapur 27375 1805 15.16 27375 2710 10.10
13 Ghod 60623 16206 3.74 60468 18891 3.20
14 Girna 92898 10537 8.82 89667 4434 20.22
15 Hatnur 2397 37838 0.06 3016 37838 0.08
16 Itiahdoh 92927 25445 3.65 94313 25240 3.74
17 Jayakwadi (PLBC) 382155 26983 14.16 393835 10595 37.17
18 Jayakwadi PRBC 88987 6416 13.87 104025 0 0.00
19 Kadva 25187 1470 17.13 31025 2455 12.64
20 Kal 389 4368 0.09 253 4085 0.06
21 Katepurna 7884 3943 2.00 9125 0 0.00
22 Khadakwasla 235430 19704 11.95 224910 16213 13.87
23 Krishna 87970 54974 1.60 122233 49396 2.47
24 Kukadi 202867 58649 3.46 231775 61683 3.76
25 Lower Terna 27740 2476 11.20 49275 0 0.00
26 Lower Wunna 8976 5473 1.64 12240 5927 2.07
27 Majalgaon 46081 8963 5.14 31755 494 64.28
28 Manar 106248 9207 11.54 120100 11166 10.76
29 Manjra 53565 7596 7.05 56575 0 0.00
30 Mula 264632 36910 7.17 257550 37329 6.90
31 Nalganga 5840 2504 2.33 5840 3338 1.75
32 NLBC 57816 39111 1.48 48906 34199 1.43
33 NRBC 113880 64931 1.75 122275 77539 1.58
34 Ozerkhed 41192 3037 13.56 50005 3182 15.71
35 Palkhed 158333 11596 13.65 125925 15851 7.94
36 Pawana 36865 2994 12.31 34675 3083 11.25
37 Pench 182336 65305 2.79 181440 85134 2.13
38 Purna 174178 39538 4.41 172645 38757 4.45
39 Pus 27740 4745 5.85 27740 5621 4.94
40 Radhanagari 20402 23947 0.85 19910 26274 0.76
41 Rajanala 48 2143 0.02 46 2087 0.02
42 Surya 758 1739 0.44 1143 2333 0.49
43 Tulashi 12308 2632 4.68 13870 2560 5.42
44 Upper Penganga 236109 17607 13.41 278892 33913 8.22
45 Upper Wardha 52998 7582 6.99 57195 13233 4.32
46 Vishnupuri 50986 7002 7.28 56825 9876 5.75
47 Waghad 34529 3410 10.13 35770 2264 15.80
48 Wan 11580 1879 6.16 23034 9481 2.43
49 Warna 30879 27757 1.11 31390 29151 1.08
Indicator IX
Mandays for O&M per unit area
2003-04Five Year Average
ProjectSr.
No.
104

Area: ha
Land
Damaged
Area
irrigated
Land
Damage
Index
Land
Damaged
Area
irrigated
Land
Damage
Index
1 Arunavati 0 3579 0.00 0 2347 0.00
2 Asola Mendha 0 9919 0.00 0 9919 0.00
3 Bagh 0 27722 0.00 0 30738 0.00
4 Bhandardara 348 34330 1.51 343 34732 106.48
5 Bhatsa 0 986 0.00 0 962 0.00
6 Bhima 4377 90658 2.09 2974 32901 793.11
7 Bor 32 16194 0.20 30 16194 44.74
8 Chanakapur 0 7098 0.00 0 7716 0.00
9 Darna 219 22912 0.66 222 26150 43.57
10 Dina 0 11356 0.00 0 11356 0.00
11 Dudhganga 0 14831 0.00 0 14338 0.00
12 Gangapur 18 1805 0.15 18 2710 55.69
13 Ghod 0 16206 0.00 0 18891 0.00
14 Girna 0 10537 0.00 0 4434 0.00
15 Hatnur 0 37838 0.00 0 37838 0.00
16 Itiahdoh 0 25445 0.00 0 25240 0.00
17 Jayakwadi (PLBC) 938 26983 0.66 425 10595 309.72
18 Jayakwadi PRBC 698 6416 1.67 387 0 0.00
19 Kadva 0 1470 0.00 0 2455 0.00
20 Kal 0 4368 0.00 0 4085 0.00
21 Katepurna 61 3943 0.74 0 0 0.00
22 Khadakwasla 449 19704 0.74 449 16213 130.04
23 Krishna 1214 54974 1.75 1166 49396 445.58
24 Kukadi 0 58649 0.00 0 61683 0.00
25 Lower Terna 16 2476 0.20 13 0 0.00
26 Lower Wunna 31 5473 0.16 37 5927 46.93
27 Majalgaon 502 8963 1.06 388 494 14752.85
28 Manar 245 9207 1.00 235 11166 283.17
29 Manjra 557 7596 3.05 122 0 0.00
30 Mula 1029 36910 1.24 1021 37329 389.99
31 Nalganga 2 2504 0.02 0 3338 0.00
32 NLBC 1378 39111 2.27 1248 34199 341.10
33 NRBC 2419 64931 3.69 1886 77539 281.93
34 Ozerkhed 29 3037 0.28 30 3182 106.16
35 Palkhed 110 11596 0.26 91 15851 121.48
36 Pawana 0 2994 0.00 0 3083 0.00
37 Pench 334 65305 0.32 60 85134 7.59
38 Purna 851 39538 1.47 703 38757 198.98
39 Pus 0 4745 0.00 0 5621 0.00
40 Radhanagari 194 23947 0.55 972 26274 378.14
41 Rajanala 0 2143 0.00 0 2087 0.00
42 Surya 0 1739 0.00 0 2333 0.00
43 Tulashi 0 2632 0.00 0 2560 0.00
44 Upper Penganga 0 17607 0.00 139 33913 42.21
45 Upper Wardha 0 7582 0.00 0 13233 0.00
46 Vishnupuri 0 7002 0.00 0 9876 0.00
47 Waghad 4 3410 0.06 0 2264 0.00
48 Wan 0 1879 0.00 0 9481 0.00
49 Warna 0 27757 0.00 0 29151 0.00
Indicator X
Land Damage Index
2003-04Five Year Average
ProjectSr.
No.
105

Head Middle Tail Head Middle Tail
1 Arunavati 0.40 0.25 0.04 0.32 0.17 0.00
2 Asola Mendha 0.96 1.09 1.42 1.01 0.95 1.35
3 Bagh 1.18 0.59 0.57 1.34 0.62 0.63
4 Bhandardara 0.96 1.00 1.00 1.00 1.00 1.00
5 Bhatsa 0.28 0.20 0.07 0.00 0.00 0.00
6 Bhima 0.70 0.77 0.53 0.28 0.09 0.06
7 Bor 0.34 0.43 0.41 0.36 0.41 0.38
8 Chanakapur 0.19 0.28 0.27 0.14 0.23 0.16
9 Darna 0.69 0.69 0.66 0.79 0.79 0.76
10 Dina 0.80 1.28 0.69 0.84 1.26 0.69
11 Dudhganga 0.24 0.35 0.51 0.26 0.36 0.45
12 Gangapur 0.09 0.10 0.31 0.13 0.15 0.47
13 Ghod 0.70 0.71 0.96 0.63 0.63 0.68
14 Girna 0.17 0.15 0.12 0.07 0.06 0.05
15 Hatnur 0.88 0.24 0.08 1.06 0.29 0.10
16 Itiahdoh 0.94 0.96 0.77 0.94 0.79 0.74
17 Jayakwadi (PLBC) 0.47 0.09 0.15 0.46 0.00 0.00
18 Jayakwadi PRBC 0.16 0.13 0.17 0.00 0.00 0.00
19 Kadva 0.10 0.17 0.41 0.09 0.11 1.00
20 Kal 0.66 0.51 0.54 0.52 0.49 0.55
21 Katepurna 0.40 0.37 0.39 0.00 0.00 0.00
22 Khadakwasla 0.34 0.37 0.28 0.27 0.33 0.20
23 Krishna 0.73 0.55 0.28 0.61 0.39 0.26
24 Kukadi 0.95 0.93 0.85 0.97 0.96 0.60
25 Lower Terna 0.06 0.05 0.05 0.00 0.00 0.00
26 Lower Wunna 0.47 0.33 0.04 0.52 0.38 0.05
27 Majalgaon 0.26 0.14 0.11 0.02 0.00 0.00
28 Manar 0.58 0.43 0.14 0.77 0.52 0.11
29 Manjra 0.12 0.11 0.07 0.00 0.00 0.00
30 Mula 0.86 0.87 0.84 0.96 0.96 1.00
31 Nalganga 0.34 0.17 0.20 0.63 0.23 0.26
32 NLBC 0.64 0.64 0.64 0.62 0.77 0.33
33 NRBC 0.97 0.82 1.01 1.00 0.98 1.01
34 Ozerkhed 0.00 0.00 0.00 0.00 0.00 0.00
35 Palkhed 0.00 0.00 0.00 0.00 0.00 0.00
36 Pawana 0.00 0.00 0.00 0.00 0.00 0.00
37 Pench 0.63 0.67 0.57 0.84 0.94 0.67
38 Purna 0.78 0.64 0.69 0.76 0.56 0.69
39 Pus 0.31 0.39 0.08 0.39 0.42 0.07
40 Radhanagari 0.63 0.69 0.70 0.67 0.74 0.82
41 Rajanala 1.00 0.70 0.87 0.97 0.70 0.81
42 Surya 0.53 0.54 0.39 0.19 0.19 0.19
43 Tulashi 0.58 0.55 0.55 0.71 0.68 0.23
44 Upper Penganga 0.18 0.89 0.17 0.52 0.50 0.54
45 Upper Wardha 0.40 0.20 0.05 0.57 0.34 0.11
46 Vishnupuri 0.46 0.63 0.21 0.54 1.27 0.24
47 Waghad 0.00 0.00 0.00 0.00 0.00 0.00
48 Wan 0.40 0.16 0.05 0.90 0.80 0.27
49 Warna 0.60 0.47 0.56 0.77 0.46 0.62
Indicator XI
Equity Performance
Ratio of Utilised to Created
Potential 2003-04
Five Years Average Ratio of
Utilised to Created PotentialProjectSr.
No.
106

Recovery & Assessment : Rs Lakhs
Irrigation
Recovery
Assess-
ment
Irrigation
Ratio
Recovery/
assess-
ment
Irrigation
Recovery
Assess-
ment
Irrigation
Ratio
Recovery/
assess-
ment
1 Arunavati 3.24 16.83 0.19 3.78 17.67 0.21
2 Asola Mendha 6.80 20.42 0.33 8.67 34.36 0.25
3 Bagh 8.15 69.46 0.12 18.82 57.78 0.33
4 Bhandardara 35.50 97.46 0.36 14.53 140.40 0.10
5 Bhatsa 2.61 3.78 0.69 3.82 9.88 0.39
6 Bhima 394.74 462.58 0.85 128.77 795.47 0.16
7 Bor 7.92 19.38 0.41 12.68 26.03 0.49
8 Chanakapur 8.85 10.83 0.82 9.67 8.41 1.15
9 Darna 69.21 82.58 0.84 110.06 113.53 0.97
10 Dina 9.51 20.93 0.45 14.66 33.57 0.44
11 Dudhganga 36.23 193.42 0.19 44.81 266.69 0.17
12 Gangapur 45.78 55.06 0.83 39.69 75.69 0.52
13 Ghod 26.84 61.96 0.43 5.46 90.35 0.06
14 Girna 22.12 26.48 0.84 13.28 35.26 0.38
15 Hatnur 26.06 65.83 0.40 15.33 75.05 0.20
16 Itiahdoh 16.34 80.77 0.20 23.63 73.51 0.32
17 Jayakwadi (PLBC) 74.72 499.11 0.15 26.69 537.31 0.05
18 Jayakwadi PRBC 19.32 104.47 0.18 193.20 1044.68 0.18
19 Kadva 2.49 2.37 1.05 3.44 5.02 0.69
20 Kal 0.00 0.00 0.00 0.00 0.00 0.00
21 Katepurna 11.20 12.76 0.88 27.10 18.18 1.49
22 Khadakwasla 87.51 142.94 0.61 94.45 205.32 0.46
23 Krishna 162.64 0.00 0.00 155.20 0.00 0.00
24 Kukadi 92.46 116.67 0.79 153.91 273.60 0.56
25 Lower Terna 4.83 42.29 0.11 0.00 0.00 0.00
26 Lower Wunna 0.00 0.00 0.00 0.00 0.00 0.00
27 Majalgaon 37.41 105.21 0.36 0.00 2.33 0.00
28 Manar 10.04 123.27 0.08 20.39 64.60 0.32
29 Manjra 14.77 162.28 0.09 0.00 0.00 0.00
30 Mula 69.37 105.35 0.66 82.04 135.56 0.61
31 Nalganga 7.95 8.30 0.96 14.26 19.37 0.74
32 NLBC 183.25 233.76 0.78 171.29 220.47 0.78
33 NRBC 230.08 304.98 0.75 208.81 215.61 0.97
34 Ozerkhed 14.06 16.35 0.86 4.75 4.75 1.00
35 Palkhed 25.52 35.91 0.71 26.65 26.65 1.00
36 Pawana 5.86 6.87 0.85 8.57 9.78 0.88
37 Pench 71.28 133.08 0.54 134.50 226.52 0.59
38 Purna 106.17 506.29 0.21 123.76 708.03 0.17
39 Pus 11.85 45.64 0.26 33.13 28.36 1.17
40 Radhanagari 167.32 267.00 0.63 213.97 392.22 0.55
41 Rajanala 1.30 8.24 0.16 1.96 0.00 0.00
42 Surya 1.88 7.94 0.24 3.19 29.62 0.11
43 Tulashi 17.11 37.62 0.45 18.64 40.55 0.46
44 Upper Penganga 81.66 390.25 0.21 144.54 345.53 0.42
45 Upper Wardha 12.69 22.36 0.57 37.11 61.26 0.61
46 Vishnupuri 0.94 50.30 0.02 1.65 58.50 0.03
47 Waghad 5.41 5.58 0.97 7.18 7.18 1.00
48 Wan 2.57 6.21 0.41 14.36 33.96 0.42
49 Warna 114.19 243.61 0.47 147.26 509.00 0.29
Assessment Recovery Ratio (Irrigation)
Indicator XII - A
2003-04Five Year Average
ProjectSr.
No.
107

Recovery & Assessment : Rs Lakhs
Irrigation
Recovery
Assess-
ment
Irrigation
Ratio
Recovery/
assess-
ment
Irrigation
Recovery
Assess-
ment
Irrigation
Ratio
Recovery/
assess-
ment
1 Arunavati 0.64 1.38 0.46 1.08 1.08 1.00
2 Asola Mendha 0.00 0.00 0.00 0.00 0.00 0.00
3 Bagh 0.07 12.13 0.01 10.08 10.55 0.96
4 Bhandardara 22.87 372.13 0.06 5.75 278.06 0.02
5 Bhatsa 1578.68 2133.94 0.74 2966.69 1424.11 2.08
6 Bhima 392.06 599.08 0.65 476.54 642.10 0.74
7 Bor 14.50 14.38 1.01 0.00 31.38 0.00
8 Chanakapur 66.79 72.91 0.92 81.17 85.13 0.95
9 Darna 478.50 561.01 0.85 220.75 691.85 0.32
10 Dina 0.00 0.00 0.00 0.00 0.00 0.00
11 Dudhganga 96.77 106.39 0.91 221.92 320.34 0.69
12 Gangapur 1581.30 1733.01 0.91 1772.33 2079.29 0.85
13 Ghod 31.88 75.83 0.42 53.07 61.09 0.87
14 Girna 99.95 174.32 0.57 145.27 209.57 0.69
15 Hatnur 887.95 1232.02 0.72 1253.37 2227.40 0.56
16 Itiahdoh 0.27 15.78 0.02 5.36 6.46 0.83
17 Jayakwadi (PLBC) 225.07 259.97 0.87 1397.16 192.72 7.25
18 Jayakwadi PRBC 38.26 87.60 0.44 28.26 157.68 0.18
19 Kadva 0.00 0.01 0.00 0.00 0.80 0.00
20 Kal 0.00 0.00 0.00 0.00 0.00 0.00
21 Katepurna 544.84 787.58 0.69 1327.40 1041.90 1.27
22 Khadakwasla 1158.92 1597.04 0.73 1650.02 1917.29 0.86
23 Krishna 94.56 0.00 0.00 237.78 0.00 0.00
24 Kukadi 25.12 28.77 0.87 39.71 68.33 0.58
25 Lower Terna 2.35 12.03 0.20 0.47 7.22 0.07
26 Lower Wunna 0.00 0.00 0.00 0.00 0.00 0.00
27 Majalgaon 293.81 366.92 0.80 697.48 1326.57 0.53
28 Manar 0.96 13.17 0.07 1.83 29.74 0.06
29 Manjra 34.38 191.54 0.18 23.72 30.42 0.78
30 Mula 77.50 124.40 0.62 105.98 259.43 0.41
31 Nalganga 4.28 4.52 0.95 15.60 5.67 2.75
32 NLBC 254.14 327.71 0.78 367.63 363.12 1.01
33 NRBC 242.46 327.71 0.74 363.12 363.12 1.00
34 Ozerkhed 4.07 5.70 0.71 8.59 8.69 0.99
35 Palkhed 207.89 404.66 0.51 464.10 464.10 1.00
36 Pawana 1121.94 1298.05 0.86 1835.70 1920.10 0.96
37 Pench 559.03 919.88 0.61 1642.15 1681.77 0.98
38 Purna 22.78 239.70 0.10 127.32 91.95 1.38
39 Pus 3.99 9.13 0.44 53.70 18.32 2.93
40 Radhanagari 345.34 549.31 0.63 587.90 847.77 0.69
41 Rajanala 0.91 0.91 1.00 6.69 6.69 1.00
42 Surya 437.19 537.59 0.81 916.94 1085.28 0.84
43 Tulashi 0.00 12.80 0.00 0.00 1.32 0.00
44 Upper Penganga 20.03 106.15 0.19 30.19 321.42 0.09
45 Upper Wardha 44.86 60.35 0.74 65.31 67.18 0.97
46 Vishnupuri 12.66 49.58 0.26 26.68 94.51 0.28
47 Waghad 2.32 5.43 0.43 3.98 21.15 0.19
48 Wan 0.39 0.39 1.00 0.65 0.65 1.00
49 Warna 138.63 190.95 0.73 134.64 231.18 0.58
Indicator XII - B
Assessment Recovery Ratio (Non-Irrigation)
2003-04Five Year Average
ProjectSr.
No.
108

Appendix –XVII
State target values for indicators
I) Annual Irrigation Water Supply Per Unit Irrigated Area:
Prescribed water use efficiency in Rabi and Hot weather season is 150 and 110 ha/Mm3 respectively. As there are Rabi and Hot weather crops in most of the major and medium projects, average water use efficiency works out to (150+110)/2=130 ha/Mm3
Thus the water requirement per unit area = 1000000/130 = 7692 m3/ ha.
In case of minor project as there are no crops irrigated in Hot weather the water requirement per unit area = 1000000/150 = 6666.67 m3 / ha. Say 6667 m3 / ha.
Hence in broad sense the water requirement per unit area works out to 7692 m3 per ha in case of major and medium projects and 6667 m3 per ha in case of minor projects.
II) Potential Created And Utilised:
Ideally, the State target should be 1, but practically it depends on availability of water in the reservoirs. Water availability in the reservoir was only sixty percent of gross storage during 2003-04. Therefore, the State target set for this indicator was 0.6 instead of 1.
III) Output Per Unit Irrigated Area:
As per the study conducted by WALMI, Aurangabad, output per ha of irrigated area (for all nine Agroclimatic Zones) comes to Rs. 30000/- per ha with perennial crops on some area.
The income for eight monthly cropping works out to Rs. 25000/- per ha. Therefore, Rs. 30000/- per ha is selected as a target for major and medium projects and Rs. 25000/- per ha for minor projects.
IV) Output Per Unit Irrigation Water Supply:
Considering for Major/Medium projects outpt as Rs. 30000 per ha with water use efficiency as 130 ha/ Mm3 total income from 1 Mm3 = 130x30000 = Rs. 39,00,000/-
From 1 m3, income will be = 3900000/1000000= Rs. 3.90/ m3
And for Minor irrigation projects the income per cum will be
= 150 x 25000 / 1000000 = Rs.3.75/ m3
V) Cost Recovery Ratio:
Ideally this ratio should be equal to 1 so as to meet the annual O&M cost through recovery of water charges. Due to increase in water rates and special drive for recovery of arrears, the recovery has substantially increased. Therefore, the ratio has gone above 1.
VI) Total O&M Cost Per Unit Area:
Government has decided Rs. 250/ha (excluding establishment expenditure) as a norm for O&M of irrigation projects.
As per norms prescribed recently by GOM, for staffing pattern of management section one Sectional Engineer, one Civil Engineering Assistant, 2 Dafter Karkoons,
109

8 Canal inspectors and 10 other staff i.e. totaling 22 persons for managing 3000 to 5000 ha command, the establishment cost works out to Rs. 450/ha. Thus total O&M cost = Rs. 250 + Rs. 450 = Rs. 700/ha.
VII) Total O&M Cost Per Unit Water Supplied:
The O&M cost for 2003-04 was Rs. 3.3 billions The total water use in 2003-04 was to the tune of 15359 Mm3
Therefore, total O&M cost per unit of water = 3.3 x 10⁹ /15359 x 106
= Rs. 0.217 per m3
Say Rs. 0.22 per m3
VIII) Revenue Per Unit of Water Supplied:
During 2003-04 the average water use for various purposes in the State was as under.
A) Irrigation purpose: 10569 Mm3
B) Non Irrigation purpose: Domestic use:3058 Mm3, Industrial use: 445 Mm3 Other use : 1287 Mm3 (Total 4790 Mm3)
Total water use = (A) + (B) = 10569 + 4790 = 15359 Mm3
The revenue from various water uses with prevailing water rates was as under.
A) Irrigation purpose: Rs. 428.90 Millions
B) Non Irrigation Purpose : Rs. 3347.40 Millions
Revenue per unit
water supplied = Total recovery of water charges Total water use = (428.90 + 3347.40) x 106 = 3776.30 = Rs. 0.245/m3
15359 x 106 15359
Say Rs. 0.25 per m3
IX) Mandays For O&M Per Unit Area:
As per prescribed norms, O&M charges = Rs. 250 per ha.
Considering 40% labour component = Rs. 250 x 0.4 = Rs. 100/- Assuming Rs. 50 per manday as labour charges, mandays required will be two mandays + 1 manday from establishment totaling to 3 mandays per ha.
X) Land Damage Index:
It should be minimum for all the projects.
110
XI) Equity Performance (head, middle and tail)
The performance for this indicator can be judged on the basis of distribution of available water in head, middle and tail reach equitably. The performance is considered as “Very good” if the variation in the distribution of water at head, middle & tail reach is equal or within 5%, “Good” if difference is upto 10%, “Moderate” if the difference is up to 15% and “Fair” if the difference is more than 15% of the maximum value in any one of the reaches.
XII-A) Assessment Recovery Ratio (Irrigation):
Ideally this ratio should be equal to 1 so as to meet the annual O & M cost through recovery of water charges.
XII-B) Assessment Recovery Ratio (Non Irrigation):
The State target for this ratio is set as equal to 1.
111
Appendix XVIII
Abstract of guidelines issued by GOM for
Benchmarking of Irrigation Projects – 2003-04
Government of Maharashtra, Irrigation Department vide Letter No. CDA 1004/ (369/2004) CAD (works) dated 08-11-2004 issued guidelines while preparing Benchmarking report for the year 2003-04. The abstract of these guidelines is given below:
i) The five-year average values from 1998-99 to 2002-03 and values for 2003-04 be considered for comparison, for all the indicators. Absurd (nil or very high values) need not be considered while calculating the average.
ii) This year a new indicator viz. ‘Assessment Recovery Ratio’ has been introduced so as to know the performance of a circle in respect of actual assessment & recovery. The assessment & recovery for (a) Irrigation (b) Non irrigation uses be shown separately & arrears of recovery should not be taken into consideration.
iii) In respect of minor projects, project wise detailed benchmarking be done at circle level. Indicatorwise abstract data be submitted to MWI Commission’s office. Indicatorwise information in respect of the best minor projects be given by the concerned circle.
iv) MWIC office will compile the indicator wise data for Major / Medium / Minor projects submitted by all the circles & prepare a report representing the Benchmarking of the projects in the State, so that the performance of all circles can be evaluated at a glance.
While submitting the indicatorwise information to Chief Engineer, MWIC Aurangabad, Superintending Engineers should verify the correctness of the data at their level.
In continuation to above guidelines further clarification in this respect given by GOM vide letter dated 27.12.2004 is as follows:
i. The benchmarking report for 2003-04 will comprise benchmarking of irrigation projects under 25 circles as the management of the Irrigation Projects under the administrative control of Irrigation Development corporations, has been taken over by Government from 1.1.2005.
ii. The prevailing market prices have been considered while calculating the values for output per unit irrigated area. In order to know the exact increase in production using minimum quantity of water cropwise prices of 1998-99 be considered as base year price and made applicable for remaining five years. The yearly increase in market prices need not be considered.
iii In case of minor projects, the projects considered in the benchmarking report of 2002-03 be also considered in year 2003-04 for comparison in successive years.
112

BENCHMARKING OF
WATER AND LAND MANAGEMENT INSTITUTE (WALMI), AURANGABAD
1.0 INTRODUCTION
WALMI, Aurangabad (Maharashtra) is a premier training institute of its kind in India established on 1st October 1980 as an autonomous registered society under Water Resources Department, Government of Maharashtra for imparting the training in IWM.
1.1 Objectives
The main objectives of the institute are:
To provide inservice training of interdisciplinary nature to staff engaged in Irrigation Water Management and Land Development in Water Resources and Agriculture Departments
Action and adaptive research pertaining to Irrigation Project Commands.
Providing consultancy services, production of training materials (in print and electronic media), conducting seminars / workshops and organizing farmers’ training programmes
Training is imparted by highly qualified, experienced and well-trained faculty members. WALMI has five faculties:
Faculty of Irrigation Engineering Faculty of Agriculture Faculty of Science (Computer Applications & Hydraulics) Faculty of Social Sciences Faculty of Integrated Watershed Development & Management
An optimal mix of core faculty and senior field officers on deputation to WALMI constituting the faculty, is one of the vital factors of this institute’s strength and performance.
2.0 BENCHMARKING OF WALMI
2.1 Performance Indicators
The benchmarking technique is recently introduced for the performance evaluation of the irrigation systems in the State of Maharashtra. Benchmarking is a continuous process of measuring one’s own performance and practices against the best competitors and is a sequential exercise of learning from other’s experience. The guidelines are available on the categories of performance indicators for Irrigation Systems. The benchmarking of WALMI, Aurangabad, which is a premier training institute in IWM is carried out by developing the performance indicators based on the
113

activities of the institute. The performance is also compared with the requirement wherever possible.
WALMI, being a training institute, has developed its own performance indicators as below:
1) Institutional performance 2) Qualitative performance 3) Financial indicators 4) Environmental aspects
2.2 Institutional Performance
The institutional performance of the WALMI is assessed based on the following four indicators:
a) Strength of teaching staff
The strength of teaching staff is compared with the potential sanctioned positions and available positions over the period of last five years.
b)Annual training workload (trainee days)
The annual training workload is compared with the planned training workload and achievement for last five years.
c)Annual training workload of longterm courses (Participants)
The number of participants actually participated in long term courses (25/20 week’s duration) are compared with the potential strength of the long term courses for last five years.
d)Annual Farmers’ training workload (Participants)
The number of participants actually participated in different farmer’s training programmes are compared with the expected participants.
2.3 Qualitative Performance The overall quality of institute’s activities are assessed based on the following
indicators: a) End of Course evaluation (i) L.T.C. (ii) S.T.C. b) Research activities c) Revisions & Development of publications d) Papers presented & published (state, national & international level)
2.4 Financial Indicators This is assessed based on the actual expenses of the institute: a) Cost of training per trainee day b) Central Assistance for training programme
114

2.5 Environmental Aspects
Environmental indicators will give information about involvement of participants in the training activities to acquire the knowledge, skills and attitudes for their jobs. It will also indicate the conduciveness of environment in the institute.
a) Referencing WALMI Library b) Visitors in WALMI
3.0 ASSESSMENT OF PERFORMANCE OF WALMI (YEAR 1999 – 2004)
(i) Strength of teaching staff
The strength of teaching staff shows a declining trend in last five years because of the retirement of core faculty and lesser proportions of deputationist. The existence of sizeable core faculty is one of the vital factors of this institute’s strength and performance.
(ii) Annual training workload (trainee days)
Achievement in last five years is more than the planned training workload except for the year 2001 - 2002 where actual training workload was little lower than the planned training workload because of no induction course was conducted though planned. The assessed annual training workload of the institute is about 45000 trainee days whereas the average planning of the last five years is about 31000. This is because of the faculty strength lower than the sanctioned strength.
(iii) Annual training workload of long term courses (participants)
The number of participants actually attended in LTC for the year 2002-03 were less than the potential strength. This is because of poor response from the participants working in irrigation management.
(iv) Annual Farmers’ training workload (participants)
This indicator shows that the number of farmers participated in the courses are much higher than the expected participants. In the year 2002-03, the achievement is comparatively lesser because of no response for sponsoring five courses on demand.
(v) End of course evaluation In the method of end of course evaluation, the trainee officers are asked to
give rating for various questions related to training. The average rating of end course evaluation for long term courses and short term courses (having period more than 4 days) during the year is around four, which indicates that overall quality of training as excellent.
115

(vi) Research activities
This indicator shows a declining trend over the last 3 - 4 years and needs to be improved. There is a some improvement in the year 2003 – 04. Research studies need to be accelerated so that experience gained during these studies will be shared through lectures, presentation of case studies in training courses.
(vii) Revisions & Development of publications
This can not be assessed exactly on yearly basis.
(viii) Papers / Articles presented & published (state, national & international level) The numbers are in increasing order and is highest during the year 2003 – 04
in comparison to other years. The faculties are being motivated in this regard.
(ix) Cost of training per trainee day
The cost of training per trainee day is different in the different years and depends upon the number of trainee days (annual training workload) and the budget allotment. The cost of training is expected to be around Rs.2000 per trainee day.
(x) Central assistance for training programme
Central assistance started from the year 1999- 2000 for CAD activities including training & research. There is a substantial achievement during the year 2003 – 04.
(xi) Referencing WALMI Library
This indicates that use of library is increasing among the faculties , training participants and visitors.
(xii) Visitors in WALMI
The visitors in WALMI are increasing year after year which is a good indicator for the capabilities of the WALMI.
116

Strength of Teaching Staff
0
5
10
15
20
25
30
35
1999-00 2000-01 2001-02 2002-03 2003-04
Year
Num
ber
Core Faculty Deputationists Sanctioned Strength Required Core Faculty Required Deputationists
Annual Trainee-days
0
10000
20000
30000
40000
50000
Tra
inee-d
ays
Planned 30806 26357 31570 27676 26540
Achieved 34428 27432 30464 30016 33464
Target 45000 45000 45000 45000 45000
1999-00 2000-01 2001-02 2002-03 2003-04
117

Annual Training Workload of Long Term Courses
0
40
80
120
160P
art
icip
ants
Planned 120 120 120 120 120
Achieved 149 139 116 100 134
Target 120 120 120 120 120
1999-00 2000-01 2001-02 2002-03 2003-04
Annual Farmers Training Workload
0
400
800
1200
1600
2000
Part
icip
ants
Planned 600 420 780 660 810
Achieved 1021 1299 1977 779 1482
1999-00 2000-01 2001-02 2002-03 2003-04
118

End of Course Evaluation
0.0
0.5
1.0
1.5
2.0
2.5
3.0
3.5
4.0
4.5
Ra
tin
g
Av.Rating for LTC 3.8 3.7 4.1 4.3 4.2
Av.Rating for STC 4.2 4.2 4.2 4.0 4.4
Excellent 4 4 4 4 4
Very poor 0.8 0.8 0.8 0.8 0.8
1999-00 2000-01 2001-02 2002-03 2003-04
Research Activities
0
2
4
6
8
10
12
14
Nu
mb
er
Studies in hand 13 8 7 6 10
Studies Completed 5 1 1 1 3
1999-00 2000-01 2001-02 2002-03 2003-04
119

Revisions & Development of Publications
0
0.5
1
1.5
2
2.5
3
3.5
4
4.5
5
Nu
mb
ers
Revisions 0 0 0 5 2
New Publications 0 1 0 1 2
1999-00 2000-01 2001-02 2002-03 2003-04
Papers/Articles presented (State, National & Interanational level)
0
5
10
15
20
25
Nu
mb
ers
Papers 13 0 4 9 14
Articles 24 20 19 14 24
1999-00 2000-01 2001-02 2002-03 2003-04
120

Cost of Training Per Trainee-day
0
500
1000
1500
2000
2500
Rs
. P
er
Tra
ine
e-d
ay
Rs.Per Trainee-day 1856 1956 2408 1616 2079
1999-00 2000-01 2001-02 2002-03 2003-04
Central Assistance for Training Programme
0
20
40
60
80
Rs. in
Lakh
s
Estimate 8.91 7.87 13.35 70.96 67.57
Expenditure 8.91 12.41 29.08 75.28 77.67
Actual Disdursement 0 6.72 13.35 0 72.905
Target 50 50 50 50 50
1999-00 2000-01 2001-02 2002-03 2003-04
121

Referencing WALMI Library
0
2000
4000
6000
8000
10000
12000
14000
Nu
mb
ers
Reading Material issued 3976 4242 3049 2993 3327
Reading Material consulted 7935 9610 8838 12110 13690
1999-00 2000-01 2001-02 2002-03 2003-04
Visitors in WALMI
0
500
1000
1500
2000
2500
3000
3500
Nu
mb
ers
Officers & VIPs 400 525 612 109 379
Students 1550 995 400 850 1075
Farmers 896 566 2900 3250 1955
1999-00 2000-01 2001-02 2002-03 2003-04
122