benchmarking australian science, technology, engineering ... · viii benchmarking australian...
TRANSCRIPT

NOVEMBER 2014
BENCHMARKING AUSTRALIAN SCIENCE,
TECHNOLOGY, ENGINEERING AND MATHEMATICS
iiiForewordii BENCHMARKING AUSTRALIAN SCIENCE, TECHNOLOGY, ENGINEERING AND MATHEMATICS
FOREWORD
© Commonwealth of Australia 2014 ISBN 978 1 925092 45 5
Ownership of intellectual property rights
Unless otherwise noted, copyright (and any other intellectual property rights, if any) in this publication is owned by the Commonwealth of Australia.
Creative Commons licence
Attribution CC BY NC
All material in this publication is licensed under a Creative Commons Attribution Non-Commercial 3.0 Australia Licence, save for content supplied by third parties, logos, any material protected by trademark or otherwise noted in this publication, and the Commonwealth Coat of Arms.
Creative Commons Attribution NonCommercial 3.0 Australia Licence is a standard form licence agreement that allows you to copy, distribute, transmit and adapt this publication provided you attribute the work. A summary of the licence terms is available from http://creativecommons.org/licenses/by-nc/3.0/au/. The full licence terms are available from http://creativecommons.org/licenses/by-nc/3.0/au/legalcode.
Disclaimer
This report has been prepared by the Office of the Chief Scientist using multiple sources of data. The analysis and findings presented here are subject to the limitations of the data used. The findings in this report do not indicate commitment by the Australian Government or the Office of the Chief Scientist to a particular course of action. The Australian Government and the Office of the Chief Scientist accept no responsibility for the accuracy and completeness of the content. Readers are advised to independently verify the accuracy and completeness of the content for their purposes.
This document is available online at www.chiefscientist.gov.au
Suggested citation
Office of the Chief Scientist 2014, Benchmarking Australian Science, Technology, Engineering and Mathematics. Australian Government, Canberra.
Design and layout for this report was provided by GRi.D Communications, Canberra, Australia.
The cover image was purchased from Shutterstock.
Contributors in alphabetical order
` Joanne Banks
` Krisztian Baranyai
` Jennifer Bowles
` Mick Bunworth
` Roslyn Forecast
` Ryan Herbert
` Ewan Johnston
` Laura Kusa
` Katherine Leigh
` Simon Prasad
` Phillippa Smith
` Sarah White
Science, technology, engineering and mathematics, referred to as STEM, are central to our future because of their role in securing Australia’s competitiveness in a rapidly changing world. The Prime Minister, the Hon. Tony Abbott MP, acknowledged this on 11 June 2014, when he said, ‘… science is at the heart of a country’s competitiveness, and it is important that we do not neglect science as we look at the general educational and training schemes’.
In view of the central importance of STEM, we need to know how we perform. We need to get ‘a fix’ on our performance—not an easy one, against ‘the world’, but a more challenging one, against nations that, like us, are essentially free-market economies with serious science engagement. We often depict Australia as ‘punching above its weight’ in research performance, with about 3 per cent of research outputs from 0.3 per cent of the world’s population. But approximately 90 per cent of all STEM research publications are attributed to roughly 15 per cent of countries and 90 per cent of citations are attributed to approximately 13 per cent of countries. Where we stand relative to ‘the world’ is of marginal value only, serving mainly to direct our attention from where it should be, which is on how to improve.
STEM is a global enterprise. As nations with which we collaborate and compare ourselves take planned, often urgent, action to improve their STEM base, we must be alert to the changes and decide what we ourselves want to do. In order to make wise choices, however, we need to know the baseline from which we start and have a view about where we want to be within a reasonable time.
This report provides insights into where we are and will help us decide what we should do. As an analysis mostly at a high level—signposts in kilometres not metres, let alone centimetres—it is intended to highlight performance and trends that might warrant further investigation, prompt questions for government and contribute to discussion on the future shape and scale of Australian STEM.
The report is about encouraging wise decisions, not about making them. Used well, it will help us improve and help us position Australia in a changing world.
I thank the staff of the Office of the Chief Scientist for their work in developing this report.
Professor Ian Chubb AC Chief Scientist for Australia November 2014

vSummary iv BENCHMARKING AUSTRALIAN SCIENCE, TECHNOLOGY, ENGINEERING AND MATHEMATICS
The summary table on the next page provides the key data for international comparisons in the report. For the range of indicators used in this study, it shows which comparator countries are ahead of Australia and which are behind.
When compared with 11 Western European countries, the United States and Canada, Australia performs well in the share of the world’s top 1 per cent of cited research papers in STEM. Our best compare well with the best in these countries, but our average field-weighted citation rates are below all of them.
Multiple lines of evidence point to Australia’s opportunity to improve performance in STEM. Our international patenting profile is poor, and the level of collaboration between our researchers (approximately 60 per cent of them in universities) and business is one of the lowest in the OECD. Australia sits near the middle of the comparator group for research funding and international collaboration and for primary and secondary students’ performance in science and mathematics literacy.
SUMMARY
Europe Asia
Indicators Aus
tral
ia
Aus
tral
ian
tren
d
Aus
tria
Bel
giu
m
Den
mar
k
Finl
and
Fran
ce
Ger
man
y
Irela
nd
Nor
way
Swed
en
Switz
erla
nd
Uni
ted
Kin
gd
om
Can
ada
New
Zea
land
Uni
ted
Sta
tes
Chi
na
Ind
ia
Ind
ones
ia
Jap
an
Mal
aysi
a
Phili
pp
ines
Sing
apor
e
Sout
h K
orea
Thai
land
Vie
tnam
No.
of c
ount
ries
abov
e A
ustr
alia
No.
of c
ount
ries
bel
ow
Aus
tral
ia
No.
of c
ount
ries
with
no
dat
a
Aus
tral
ia’s
rank
ing
Tota
l cou
ntrie
s
% c
ount
ries
bel
ow
Aus
tral
ia
Research performance Time point
Total STEM publications 2002–2012 429 161 9 15 0 10 25 63
STEM citation rate (field-weighted) 2002–2012 1.12 13 11 0 14 25 46
Highly cited research
Share of top 1% cited publications in natural science and engineering publications 2010–2012 5.5% 6 12 6 7 19 67
Per capita contribution to top 1% cited natural science and engineering publications 2012 10.6 7 9 8 8 17 56
Top cited researchers per million population 2014 2.89 5 19 0 6 25 79
Patents
PCT patent applications (by inventor) 2011 1 640
9 9 6 10 19 50
Triadic patent families 2011 209
14 4 6 15 19 22
Percentage of PCT patent applications with foreign co-inventors 2011 16.7% 15 5 4 16 21 25
Research funding
Contribution to global expenditure on R&D 2010 2.0% 8 10 6 9 19 56
GERD as a share of GDP 2010 2.2% 9 8 7 10 18 47
International collaboration
Percentage of internationally co-authored publications 2002–2012 49.8% 15 7 2 16 23 32
Citation rate (field-weighted) for international collaboration 2002–2012 1.27 13 10 1 14 24 43
Share of internationally co-authored publications in top 1% of natural science and engineering 2010–2012 66.4% 13 5 6 14 19 28
Proportion of internationally co-authored BCH publications 2002–2012 44.9% 14 9 1 15 24 39
Citation rate (field-weighted) for internationally co-authored BCH publications 2002–2012 1.30 13 10 1 14 24 43
The STEM research workforce
FTE researchers 2008 92 649 8 10 6 9 19 56
Researchers per 1000 total employment 2008 8.50 8 8 8 9 17 50
Proportion of researchers employed in business sector 2011 32% 15 0 9 16 16 0
Higher education
Students in tertiary education (first degree/bachelors) per 100 000 population 2010 5 884 2 9 13 3 12 82
Proportion of tertiary students (first degree/bachelors) in STEM 2009 10.6% 11 3 10 12 15 21
Students enrolled in tertiary science degrees per 100 000 population 2010 526 5 6 13 6 12 55
Science and engineering doctorate graduates per 100 000 population 2010 10.2 8 7 9 9 16 47
Schools
PISA mathematical literacy mean score 2012 504
8 10 6 9 19 56
PISA scientific literacy mean score 2012 521 6 12 6 7 19 67
Legislated proportion of time spent teaching science in primary education 2011 5.7% 9 2 13 10 12 18
Legislated proportion of time spent teaching mathematics in primary education 2011 17.4% 3 9 12 4 13 75
Above Australia Below Australia No data available

viiContentS
FOREWORD iii
SUMMARY iv
CHAPTER 1 — INTRODUCTION 1
CHAPTER 2 — RESEARCH PERFORMANCE 5
CHAPTER 3 — HIGHLY CITED RESEARCH 17
CHAPTER 4 — PATENTS 25
CHAPTER 5 — RESEARCH FUNDING 33
CHAPTER 6 — INTERNATIONAL COLLABORATION 51
CHAPTER 7 — THE STEM WORKFORCE 63
CHAPTER 8 — HIGHER EDUCATION 75
CHAPTER 9 — SCHOOLS 89
APPENDIX A 102
APPENDIX B 105
SHORTENED FORMS 115
GLOSSARY 119
REFERENCES 123
CONTENTS

ixviii ContentS BENCHMARKING AUSTRALIAN SCIENCE, TECHNOLOGY, ENGINEERING AND MATHEMATICS
TABLES
Table 1-1 Main data sources and indicators used, by chapter 4
Table 2-1 STEM publications attributed to each country, 2002 to 2012 8
Table 2-2 STEM publications by field, 2002 to 2012 9
Table 2-3 STEM sub-fields for which Australian citation rates are higher than those for the United States and/or the EU15 15
Table 3-1 STEM fields in Australian publications that contribute to the top 1 per cent of global STEM publications, by citation rate, 2002 to 2012 23
Table 4-1 International growth in Patent Cooperation Treaty applications, 2002 to 2011 29
Table 4-2 International PCT applications, 2008 and 2009 30
Table 5-1 Australian research expenditure, by sector 41
Table 6-1 Proportion of total Australian STEM publications with international co-authorship, 2002 to 2012 53
Table 6-2 Percentage difference between field-weighted citation rates of total STEM publications and the internationally co-authored subset, 2002 to 2012 56
Table 6-3 Percentage difference between field-weighted citation rates for all BCH publications and the internationally co-authored subset, 2002 to 2012 61
Table 7-1 Increase in research workforce, 1998 to 2008 66
Table 7-2 Increase in researchers as a share of the workforce, 1998 to 2008 67
Table 7-3 Migration program outcomes for skilled stream, by Australian and New Zealand Standard Classification of Occupations: engineers, 2001 to 2012 72
Table 8-1 International Standard Classification of Education fields and the Australian equivalents 77
Table 8-2 Australian domestic students commencing doctorate by research degrees: all fields, 2002 to 2012 82
Table 9-1 Mean mathematics achievement in TIMSS 2011: year 4 and year 8, selected countries 95
Table 9-2 Mean science achievement in TIMSS 2011: year 4 and year 8, selected countries 96
Table 9-3 Australian teachers teaching in selected fields: level of tertiary study in teaching field and training in subject methodology 98
Table 9-4 Indicative teaching time in Australia: science, mathematics and technology as a percentage of total teaching time in primary education 99
Table A-1 ANZSRC Field of Research classifications for STEM fields 103
FIGURES
Figure 2-1 International STEM research, 2002 to 2012: Australia in context 10
Figure 2-2 Australia’s STEM research compared with that of selected countries in Europe and North America, by two-digit field, 2002 to 2012 11
Figure 2-3 Australia’s STEM research compared with that of New Zealand and selected Asian countries, by two-digit field, 2002 to 2012 12
Figure 2-4 Australian STEM research, by four-digit sub-field, 2002 to 2012 13
Figure 2-5 Citation rates for Australian STEM publications compared with those for the United States and the EU15, 2002 to 2012 14
Figure 3-1 Share of the top 1 per cent of citations in natural science and engineering, 2004 to 2006 and 2010 to 2012 19
Figure 3-2 Per capita contribution to top 1 per cent of citations in natural science and engineering publications 20
Figure 3-3 Top natural science and engineering publications (2010 to 2012) by researchers per 1000 total employment and GERD as share of GDP (2011) 21
Figure 3-4 Annual increase in number of natural science and engineering publications: top 1 per cent of cited publications, by country and citation rate, 2004 to 2012 22
Figure 3-5 Australian publications contributing to the top 1 per cent of global STEM publications, by STEM field and citation rate, 2002 to 2012 22
Figure 3-6 Top cited researchers per million population, selected countries, 2014 24
Figure 4-1 Patent applications with an Australian inventor filed under the Patent Cooperation Treaty, 1981 to 2011 28
Figure 4-2 Triadic patent family applications with an Australian inventor, 1985 to 2011 28
Figure 4-3 Patent applications filed under the Patent Cooperation Treaty, selected countries, 2002 and 2011 28
Figure 4-4 Triadic patent families, by country, 2002 and 2011 29
Figure 4-5 Percentage of patent applications filed under the Patent Cooperation Treaty with foreign co-inventors, selected countries, 2002 and 2011 31
Figure 4-6 Collaboration on innovation with higher education or public research institutions, by firm size, 2008 to 2010 31
Figure 5-1 The contribution of selected countries to global expenditure on R&D, 2002 and 2010 36
Figure 5-2 Australia’s R&D intensity, 1981 to 2010 36
Figure 5-3 International R&D intensity, 2002 and 2010 37
Figure 5-4 HERD and STEM publication output 37
Figure 5-5 Citation rates for Australian and selected European countries’ STEM publications, 2000 to 2012 38
Figure 5-6 Higher education R&D expenditure and publication citation rates, by field 39
Figure 5-7 Cost per publication and citation rate, by field 40
Figure 5-8 HERD and BERD, by socio-economic objective 42
Figure 5-9 Business expenditure on R&D by activity type, 2011–12 43
Figure 5-10 Higher education expenditure on R&D, by activity type, 2012 43

xix ContentS BENCHMARKING AUSTRALIAN SCIENCE, TECHNOLOGY, ENGINEERING AND MATHEMATICS
Figure 8-7 Distribution of student enrolments in first degrees in tertiary education, by field of education, selected countries, 2009 84
Figure 8-8 Students enrolled in first degree in tertiary science per 100 000 population, selected countries, 2010 85
Figure 8-9 Science and engineering doctoral graduates per 100 000 population, selected countries, 2010 85
Figure 8-10 Total Australian Postgraduate Award students: all fields, 2006 to 2014 86
Figure 8-11 New Australian Postgraduate Awards for higher degree by research and commencing award recipients, 2006 to 2012 86
Figure 8-12 Proportion of STEM PhD completions supported by an Australian Postgraduate Award, 2006 to 2012 87
Figure 9-1 PISA mathematical literacy mean country scores relative to Australia, 2003 and 2012 92
Figure 9-2 PISA scientific literacy mean country scores relative to Australia, 2006 and 2012 94
Figure 9-3 Qualifications of teachers teaching mathematics to year 8 students, selected countries, 2011 97
Figure 9-4 Qualifications of teachers teaching science to year 8 students, selected countries, 2011 97
Figure 9-5 Legislated proportion of time spent teaching science in primary education as a proportion of total compulsory education time, 2011 98
Figure 9-6 Legislated proportion of time spent teaching mathematics in primary education as a proportion of total compulsory education time, selected countries, 2011 99
Figure 9-7 Participation rates of Australian year 12 student in science and mathematics subjects, 1992 to 2012 100
Figure B-1 Highest qualification by field and level, 2010–11 106
Figure B-2 STEM graduates (bachelor and above) by industry of employment, 2011 106
Figure B-3 Natural and physical science graduates (bachelor and above) by industry of employment, 2011 107
Figure B-4 STEM graduates (bachelor and above) by occupation, 2011 107
Figure B-5 Natural and physical science graduates (bachelor and above) by occupation, 2011 108
Figure B-6 Information Technology graduates (bachelor and above) by industry of employment, 2011 108
Figure B-7 Information Technology graduates (bachelor and above) by occupation, 2011 109
Figure B-8 Engineering and related technologies graduates (bachelor and above) by industry of employment, 2011 109
Figure B-9 Engineering and related technologies graduates (bachelor and above) by occupation, 2011 110
Figure B-10 Agriculture, environmental and related studies graduates (bachelor and above) by industry of employment, 2011 110
Figure B-11 Agriculture, environmental and related studies graduates (bachelor and above) by occupation, 2011 111
Figure B-12 Salaries of STEM graduates (bachelor and above), 2011 111
Figure B-13 Salaries of STEM and non-STEM graduates by field of qualification (bachelor and above), 2011 112
Figure B-14 STEM doctorate holders by industry of employment, 2011 113
Figure B-15 STEM doctorate holders by occupation, 2011 113
Figure B-16 Salaries of STEM doctorate holders, 2011 113
Figure 5-11 Higher education expenditure on R&D, by expenditure class, 2012 44
Figure 5-12 Business expenditure on R&D, by expenditure type, 2011–12 44
Figure 5-13 Higher education expenditure on R&D, by source of funds, 2012 45
Figure 5-14 Business expenditure on engineering R&D, by industry sector, 2010–11 46
Figure 5-15 Business expenditure on IT R&D, by industry sector, 2010–11 46
Figure 5-16 Business expenditure on fields of research, by industry sector, 2010–11 47
Figure 5-17 Manufacturing sector expenditure on R&D, by field, 2010–11 48
Figure 5-18 Mining sector expenditure on R&D, by field, 2010–11 48
Figure 5-19 Professional, scientific and technical services expenditure on R&D, by field, 2010–11 49
Figure 6-1 Australian STEM publications: total and those with international co-authorship, 2002 to 2012 54
Figure 6-2 Field-weighted citation rate for all Australian STEM publications and those with international co-authorship, 2002 to 2012 55
Figure 6-3 Proportion and number of internationally co-authored STEM publications, 2002 to 2012 56
Figure 6-4 Field-weighted citation rates for STEM publications with or without international co-authorship, 2002 to 2012 57
Figure 6-5 Proportion of internationally co-authored publications in the top 1 per cent of citations in natural science and engineering, 2004 to 2006 and 2010 to 2012 58
Figure 6-6 Proportion of internationally co-authored publications in biomedical and clinical health, 2002 to 2012 59
Figure 6-7 Field-weighted citations: all biomedical and clinical health publications and the internationally co-authored subset, 2002 to 2012 60
Figure 7-1 Research workforce, 1998 and 2008 66
Figure 7-2 Researchers as a share of total workforce, 1998 and 2008 67
Figure 7-3 Employment of researchers, by sector, 2011 68
Figure 7-4 Perceived availability of scientists and engineers, 2006 and 2013 69
Figure 7-5 Temporary Work (Skilled) visas (subclass 457) issued, major STEM-related Australian industries, 2005 to 2012 70
Figure 7-6 Subclass 457 visas issued, selected skill streams, 2001 to 2012 71
Figure 8-1 Commencing enrolments in bachelor-level degrees for STEM fields: Australian domestic students, 2002 to 2012 79
Figure 8-2 Australian domestic student completions of bachelor-level degrees: STEM fields, 2002 to 2012 79
Figure 8-3 Australian domestic students commencing doctorate by research degrees: fields, 2002 to 2012 81
Figure 8-4 Australian domestic student completions of doctorates by research: STEM fields, 2002 to 2012 82
Figure 8-5 Students enrolled in first degree in tertiary education per 100 000 population, selected countries, 2010 83
Figure 8-6 Distribution of student enrolments in first degrees in tertiary education: science and engineering, manufacturing and construction, selected countries, 2009 83

CHAPTER 1
3Chapter 1 2 BENCHMARKING AUSTRALIAN SCIENCE, TECHNOLOGY, ENGINEERING AND MATHEMATICS
1. INTRODUCTION
In March 2014 the Office of the Chief Scientist initiated a benchmarking report on Australian science, technology, engineering and mathematics, or STEM. The results detailed in the report were developed to provide the following:
` a broad evidence base to guide government and public discourse on Australian STEM
` a baseline for monitoring any impacts of future changes in STEM focus or strategy
` a foundation for further analysis and future benchmarking studies of Australian STEM.
What follows is a comprehensive assessment of Australian STEM by benchmarking wherever possible with STEM in countries with similar governance systems and economic characteristics, as well as those with a rapidly rising STEM capability in the Asia–Pacific region.
The report examines the characteristics and outputs of Australian STEM based on indicators that allow international comparability. The main elements considered are research outputs in STEM, funding for STEM research and development, international collaboration in STEM research, Australia’s STEM workforce, and STEM education in schools and higher education institutions.
1.1 WHAT IS STEM?
STEM refers to science, technology, engineering and mathematics. The basic contributors to healthy STEM are research, international engagement and education.
Research supplies a flow of new ideas and knowledge and underpins the development of new and better products and services. International collaboration allows knowledge to be circulated throughout the global community, both
for domestic benefit and in order to position Australia as an important and able partner in a changing world. Education prepares a skilled and dynamic STEM workforce and sets the foundations for lifelong STEM literacy in the community, shaping perceptions of the role of STEM in society.
Australian STEM therefore must contribute people, knowledge, products and services to a world that relies increasingly on the continuous production and application of ideas leading to higher productivity, more and better jobs, and increased competitiveness.
1.2 THE SCOPE OF THE PROJECT
This report builds on a previous report by the Office of the Chief Scientist, the Health of Australian Science report, which provided an assessment of the strengths and vulnerabilities of Australia’s science capability. The present report extends, deepens and updates the analyses in the Health of Australian Science report. It takes guidance from similar international benchmarking reports produced in the United States, Europe and elsewhere that document indicators for the performance of national and international STEM (see, for example National Science Foundation 2014). The data presented here are drawn from a variety of sources.
Two groups of nations were identified for the purpose of benchmarking—countries at stages of development similar to that of Australia and with similar governance systems (the United States, Canada and selected European nations) and selected countries in the Asia–Pacific region. The 11 European nations chosen for comparison are Austria, Belgium, Denmark, Finland, France, Germany, Ireland, Norway, Sweden, Switzerland and the United Kingdom (referred to as the EU11). The comparator countries from
the Asia–Pacific region are China, India, Indonesia, Japan, Malaysia, the Philippines, Singapore, South Korea, Thailand, Vietnam and New Zealand.
National data for all comparator countries were not available for the variety of indicators and from the data sources used. The countries compared in each chapter are therefore listed.
Among the primary indicators used in this report are number, citation rates and international authorship of STEM research publications; funding for STEM research and development; researchers in the workforce; enrolments and completions in STEM in higher education institutions; school students’ performance in standardised international tests in mathematics and science; and rates of high school students’ participation in mathematics and science.
This is a benchmarking study, with all the caveats and potential flaws that come with such a study. Because responsibility for monitoring actions and outcomes across fields of STEM activity is currently split across levels and portfolios of government, our national data sets are imperfect: they were designed for different purposes. The tools we need for tracking our progress should be improved.
The report places emphasis on research publications, which are generated primarily by the higher education sector. This focus reflects higher education’s pivotal role in Australia’s contribution to the global stock of knowledge and as a major source of innovation. Further, more than 60 per cent of Australia’s researchers are employed in the higher education sector; less than 30 per cent are in business (see Chapter 7).
This report does not cover the following:
` STEM training obtained through the vocational education and training system
` collaboration between domestic businesses and researchers in public sector institutions and universities in detail
` measures of innovation other than patents.
1.3 REPORT STRUCTURE AND DATA SOURCES
The report is divided into chapters based on the broad elements of STEM in Australia. Table 1-1 shows the main data sources and indicators used for each chapter.

4 BENCHMARKING AUSTRALIAN SCIENCE, TECHNOLOGY, ENGINEERING AND MATHEMATICS
CHAPTER 2
Table 1-1 Main data sources and indicators used, by chapter
Chapter Data sources Indicators
2 Research performance InCites
Scopus
Citation rate (field-weighted)
Web of Science publications
Share of Web of Science publications
Elsevier publications
3 Highly cited research InCites
Scopus
Citation rate (field-weighted)
Web of Science publications
Share of Web of Science publications
Elsevier publications
4 Patents OECD Patent Database
OECD STI Scoreboard
Patent Cooperation Treaty patent applications filed
Share of PCT patent applications filed with an international co-inventor
Triadic patent families
5 Research funding OECD Main Science and Technology Indicators Database
ABS R&D statistics
InCites
Business expenditure on R&D
Gross expenditure on R&D as a percentage of GDP
Higher education expenditure on R&D
Web of Science publications Citation rate (field-weighted)
6 International collaboration InCites Web of Science publications
Internationally co-authored publications
Citation rate (field-weighted)
Category citations
7 The STEM research workforce OECD Main Science and Technology Indicators Database
Number of researchers (full-time equivalent)
Share of researchers in business, higher education and government
Temporary Work (Skilled) visas (subclass 457) issued in major STEM industries
8 Higher education Department of Education
UNESCO
Higher education enrolments
Higher education completions
International tertiary comparisons
9 Schools OECD
Trends in International Mathematics and Science Study
Australian Council for Educational Research
Mathematics and science literacy
Teaching time allocated to science and mathematics
Teacher qualifications
Rates of Year 12 participation in science and mathematics

7Chapter 2 6 BENCHMARKING AUSTRALIAN SCIENCE, TECHNOLOGY, ENGINEERING AND MATHEMATICS
mathematics) and the sub-fields are those that share the same broad method, techniques and/or perspectives as others in the field (for example, pure mathematics, applied mathematics and statistics).
2.4 FIELD-WEIGHTED CITATION RATES
Different fields (and publication types) have different average citation rates. Simply relying on total citations can bias an analysis towards fields that publish more frequently. Weighting citations over time and for each field takes account of differing behaviours—differing publishing and citing cultures. This is referred to as field-weighted citation—or relative citation impact—and is a measure of the actual citations received compared with the citations expected on the basis of the average of the field. Except where noted, in this report all citations are field-weighted to enhance comparability between fields.
2.5 DATA SOURCES AND TERMINOLOGY
The InCites bibliometric database was used to analyse details of all publications in the Thomson Reuters Web of Science database. The database enables direct comparisons within and between fields and sub-fields. It also allows comparison between points in time so as to track national performance within individual fields. International comparisons are generated from a global data set for publications and citations for selected countries or groups of countries. The data can be analysed at the sub-field level to identify trends and areas of relative strength and weakness between nations and STEM fields.
The analyses in this chapter are based on Thomson Reuters InCites data from 2002 to 2012, with national aggregates calculated as a mean across fields of research. This 11 year window was chosen to capture the trajectory of citations for STEM fields, which typically accrue over time, and stabilise 8–10 years after publication (Office of the Chief Scientist 2012). National average citations for this period may mask citations from rapidly emerging fields and countries during the latter part of the period—a subject for further study.
This report uses fields with the two-digit codes 01 to 10 and 11 to constitute STEM. The latter (11) is limited to the Excellence in Research for Australia field cluster ‘Biomedical and Clinical Health Sciences’. The purpose of this is to exclude sub-fields that are outside the scope of STEM but are included in the broader medical and health sciences field
(which includes biomedical and clinical health sciences). Appendix A provides details.
The InCites database includes articles, editorials, meeting abstracts, proceedings papers and reviews from more than 11 000 scholarly journals. In the present report ‘publication’ means any publication in the database.
2.6 COUNTRIES ANALYSED
As described in Section 1.2, two groups of nations were identified for benchmarking—countries at stages of development similar to that of Australia and with similar governance systems (the United States, Canada and selected European nations), and selected countries in the Asia–Pacific region.
This chapter provides data of comparator nations from our region (New Zealand, China, India, Indonesia, Japan, Malaysia, the Philippines, Singapore, South Korea, Thailand and Vietnam) and 11 European nations (Austria, Belgium, Denmark, Finland, France, Germany, Ireland, Norway, Sweden, Switzerland and the United Kingdom).
Simply using citations includes multiple counts of a collaborative publication and its attribution—as would happen if a Dane publishes with a Swede—the paper and its citations would be attributed to each country. To avoid this artefact we compare countries against a standard based on aggregated citation data from the EU15 nations (Austria, Belgium, Denmark, Finland, France, Germany, Greece, Ireland, Italy, Luxembourg, Netherlands, Portugal, Spain, Sweden, United Kingdom) supplied by the InCites database. Though this group of countries does not match our EU11 comparator nations, and excludes high performing countries (Switzerland and Norway), it provides a robust benchmark by avoiding the double-counting of collaborative European publications and their citations.
2.7 HOW DOES AUSTRALIA’S STEM RESEARCH PUBLICATION OUTPUT COMPARE INTERNATIONALLY?
Australian STEM researchers produced 430 000 publications between 2002 and 2012, including about half with at least one international co-author (see Table 6-1). Publications with an international co-author are attributed to the country of each author. Australia’s total STEM publications represent 2.2 per cent of global STEM
This chapter analyses the publication output of Australia’s science, technology, engineering and mathematics research. The number of publications is an important indicator of STEM research output, while citations provide an indication of the influence of the published research.
2.1 MAIN FINDINGS
` Field-weighted citation rates for Australian STEM publications are higher than the world average in 10 out of the 11 fields of research but are below the average of selected European countries in seven.
` Field-weighted citation rates at a national level for Australian STEM publications are higher than those for our neighbours in Asia, but China, Japan, India and South Korea each produce greater numbers of publications than Australia.
` In terms of articles published, Australia’s largest output is in the field of biomedical and clinical health sciences.
` There are 25 sub-fields for which Australian publications are cited more than US publications, and in 47 out of a total of 91 sub-fields Australian publications are cited more than those for the selected European countries. Of these fields, 20 are cited more highly than those for both the United States and the selected European countries.
2.2 BACKGROUND
Bibliometrics involves the application of quantitative analysis and statistics to publications such as journal articles and their accompanying citation counts (Thomson Reuters 2008). Bibliometric analyses of peer-reviewed publications provide insights into how research findings are shared and credited by other researchers and how they influence the global research effort.
Measuring the quantity and quality of publications implied by citations helps us understand Australian STEM—how Australia focuses its research efforts and how it compares with other countries. Publication measurements can also indicate the research quality and performance of individual fields at the national level.
Comparing research output across fields can provide an indication of whether a country has broad-based strengths or has research capability in niche areas of expertise. This helps us develop an understanding of how Australia’s research capacity is structured and where our capability is concentrated (West 2013).
Citations represent formal acknowledgment by authors that their own research was influenced by the work of others. They can indicate the influence of a specific publication. Measuring citations can thus show which publications, fields and nations are producing the most influential research.
This chapter examines Australia’s STEM research and compares it with that of countries of interest using the following indicators:
` output of STEM publications
` field-weighted citation rates.
2.3 FIELDS OF RESEARCH
Research activity is categorised according to its field. The field of research, or FoR, classification scheme is published by the Australian Bureau of Statistics and funded in part by the Australian Research Council (ABS 2008). In this report the term ‘field’ denotes FoR two-digit codes and ‘sub-field’ denotes FoR four-digit codes (see Appendix A). It is the method used in a research area that determines its field. Fields are based on a broad academic discipline (for example,
2. RESEARCH PERFORMANCE

98 Chapter 2 BENCHMARKING AUSTRALIAN SCIENCE, TECHNOLOGY, ENGINEERING AND MATHEMATICS
Table 2-2 STEM publications by field, 2002 to 2012
FieldAustralia
World totalTotal % world
All STEM publications 429 161 3.07 13 982 435
Biomedical and clinical health sciences 106 949 3.36 3 179 977
Biological sciences 72 213 4.12 1 754 641
Engineering 62 112 2.46 2 521 292
Chemical sciences 36 880 1.98 1 858 227
Physical sciences 34 375 2.26 1 523 329
Agricultural and veterinary sciences 30 553 4.97 614 921
Environmental sciences 20 944 7.49 279 683
Mathematical sciences 20 123 2.15 935 577
Earth sciences 18 917 5.00 378 670
Information and computing technology 17 599 3.13 562 889
Technology 8 496 2.28 373 229
Source: InCites, Thomson Reuters (2012). Global Comparisons Dataset, 2002 to 2012. Report created 12 January 2014; data processed 3 July 2013. Data from Web of Science.
publication attributions, and a ranking of tenth on this measure (see Table 2-1). The United States and China have the two highest shares of publication attributions (20.9 and 9.4 per cent respectively); they are followed by Japan and Germany (at 6 per cent each).
Table 2-2 shows the share of publications, by STEM field, attributed to Australia in the period 2002 to 2012.
Australia’s STEM research has an emphasis on the biomedical and clinical health field, with 106 949 publications in 2002 to 2012 (3.4 per cent of the world’s publications in this field). Biological sciences is the next largest, with 72 213 publications (4.1 per cent); this is followed by engineering, with 62 112 publications (2.5 per cent). The field of environmental science contributes more to the proportion of global publications than any other Australian STEM field, with 7.5 per cent of all environmental science publications in the world.
Table 2-1 STEM publications attributed to each country, 2002 to 2012
Rank Country Total publications
% of world total
attributions
World 13 982 435
World attributions 19 187 672
1 United States 4 016 633 20.9
2 China 1 812 176 9.4
3 Japan 1 142 652 6.0
4 Germany 1 141 690 6.0
5 United Kingdom 1 055 391 5.5
6 France 834 071 4.3
7 Canada 641 110 3.3
8 South Korea 486 059 2.5
9 India 450 616 2.3
10 Australia 429 161 2.2
11 Switzerland 266 500 1.4
12 Sweden 256 940 1.3
13 Belgium 206 480 1.1
14 Denmark 146 323 0.8
15 Austria 142 086 0.7
16 Singapore 127 758 0.7
17 Finland 116 131 0.6
18 Norway 101 200 0.5
19 New Zealand 83 148 0.4
20 Ireland 68 770 0.4
21 Thailand 54 402 0.3
22 Malaysia 45 532 0.2
23 Vietnam 13 228 0.1
24 Indonesia 10 998 0.1
25 Philippines 8 735 0.0
Notes: Total STEM publications are calculated as the sum of publication counts in the ERA 2012 FoR Level 1 categories mathematical sciences, physical sciences, chemical sciences, earth sciences, environmental sciences, biological sciences, agricultural and veterinary sciences, information and computing sciences, engineering and technology, and the biomedical and clinical health sciences subset of medical and health science. The world publication counts were extracted directly from InCites. Publications with international co-authors are attributed to the country of each author. World total attributions (19 187 672) are calculated as the sum of publication attributions for each country.
Source: InCites, Thomson Reuters (2012). Global Comparisons Dataset, 2002–2012. Report created 12 January 2014; data processed 3 July 2013. Data from Web of Science.
2.8 ARE AUSTRALIA’S STEM RESEARCH PUBLICATIONS INFLUENTIAL?
Figure 2-1 shows both the field-weighted citation rate and the total number of STEM publications for each country analysed. This is an average of all the indicated STEM fields for each country. The figure provides a high-level comparison of the STEM influence of each country but masks individual fields and sub-fields. Subsequent figures provide more detailed comparisons of fields for all countries in this analysis (Figure 2-2 and Figure 2-3) and at the level of sub-fields for Australia (Figure 2-4).
Overall, the level of citations for Australian STEM publications is lower than that for all of the European countries assessed and for the United States and Canada. Australian STEM publications do, however, receive more citations than publications from our Asian neighbours, although citations at the national level for STEM publications from many Asian nations are below the world average.

1110 Chapter 2 BENCHMARKING AUSTRALIAN SCIENCE, TECHNOLOGY, ENGINEERING AND MATHEMATICS
Figure 2-1 International STEM research, 2002 to 2012: Australia in context
0.10.5
1.0Publications (million)
World average
EU15 average
Fiel
d−
wei
ght
ed c
itat
ion
rate
0.0
0.2
0.4
0.6
0.8
1.0
1.2
1.4
1.6
1.8
SWIT
ZERL
AND
UNIT
ED S
TATE
SUN
ITED
KIN
GDOM
SWED
ENGER
MAN
YBE
LGIU
MAUST
RIA
FIN
LAN
DFR
ANCE
CANADA
NO
RWAY
IREL
AND
SIN
GAPORE
NEW
ZEA
LAN
DJA
PAN
PHIL
IPPI
NES
SOUTH
KO
REA
CHINA
THAIL
AND
INDIA
INDO
NES
IAVI
ETN
AMM
ALAYS
IA
AUSTRA
LIADEN
MARK
Notes: Publication counts are Web of Science documents classified as article, note or review, by year of publication and assigned to a country based on the institutional address(es) listed in the publication. STEM fields were selected using Australia ERA 2012 FoR Level 1 categories mathematical sciences, physical sciences, chemical sciences, earth sciences, environmental sciences, biological sciences, agricultural and veterinary sciences, information and computing sciences, engineering, technology, and the biomedical and clinical health sciences sub-grouping of medical and health science. The average citation rate (field-weighted) was calculated as a mean of the citation rates of these fields. Countries are ordered by average citation rate (field-weighted). Circle area indicates total number of STEM publications, 2002 to 2012. Green circles show countries above the average of the EU15 countries; yellow circles show countries above the normalised world average (1.0) but below the EU15 countries’ average; red circles show those countries that are below the world average.
Source: InCites, Thomson Reuters (2012). Global Comparisons Dataset, 2002 to 2012. Report created 12 January 2014. Data processed 3 July 2013. Data from Web of Science.
Figure 2-2 Australia’s STEM research compared with that of selected countries in Europe and North America, by two-digit field, 2002 to 2012
0.0
0.5
1.0
1.5
2.0
SWITZERLAND UNITED STATES DENMARK UNITED KINGDOM SWEDEN
0.0
0.5
1.0
1.5
2.0
GERMANY
Fiel
d−
wei
ght
ed c
itat
ion
rate BELGIUM AUSTRIA FINLAND FRANCE
0.0
0.5
1.0
1.5
2.0
CANADA NORWAY IRELAND AUSTRALIA
Notes: Publication counts are Web of Science documents classified as article, note or review, by year of publication and assigned to a country based on the institutional address(es) listed in the publication. Each circle represents a STEM field (selected using Australia ERA 2012 FoR Level 1 categories mathematical sciences, physical sciences, chemical sciences, earth sciences, environmental sciences, biological sciences, agricultural and veterinary sciences, information and computing sciences, engineering, technology, and the biomedical and clinical health sciences sub-grouping of medical and health science) ordered by field-weighted citation rate. Circle area indicates total number of STEM publications, 2002 to 2012. The minimum circle size represents 12 550 publications. Fields with a publication number below this threshold over the period are represented by circles corresponding to this size to aid visualisation. Green circles show fields above the EU15 countries; yellow circles show fields above the world average (1.0) but below the EU15 countries; red circles show those fields that are below the world average.
Source: InCites, Thomson Reuters (2012). Global Comparisons Dataset, 2002 to 2012. Report created 12 January 2014. Data processed 3 July 2013. Data from Web of Science.
2.9 WHERE DOES AUSTRALIA DO WELL?
2.9.1 Australia compared with Europe and North America
There are four fields (for a list of fields see Appendix A) for which the Australian field-weighted citation rate is higher than the EU15 average (green circles)—earth sciences, physical sciences, mathematical sciences and the biomedical and clinical health sciences sub-group. Australia’s performance in six fields is below the EU15 average, but above the world average (yellow circles)—agricultural and veterinary sciences, technology, chemical sciences, engineering, environmental sciences and biological sciences. One field, information and computing sciences, is below the world average (red circle) (see Figure 2-2 and Figure 2-3).
For Switzerland, the United States, Denmark, the United Kingdom, Sweden and Germany, all 11 fields considered have a higher than EU15 average citation rate (green circles) (Figure 2-2). The United States has the largest number of publications in almost all the fields measured. The United Kingdom, Germany and France all have a high number of publications.

1312 Chapter 2 BENCHMARKING AUSTRALIAN SCIENCE, TECHNOLOGY, ENGINEERING AND MATHEMATICS
2.9.3 Australian STEM research in sub-fields
Australia ranks above the EU15 in several sub-fields, particularly in the fields of engineering, physical sciences, chemical sciences, earth sciences, mathematical sciences and agricultural and veterinary sciences (see Figure 2-4).
The largest number of publications comes from the biomedical and clinical health sciences sub-group of clinical sciences; it accounted for 12.4 per cent of total Australian STEM publications in 2002 to 2012.
2.9.2 Australia compared with other countries in our region
At an aggregate, national level, Australian STEM publications have higher citation rates than those from other countries in our region (see Figure 2-3). Singapore has a higher citation rate than the EU15 average in four fields (agriculture, mathematics, engineering and chemical sciences). Both New Zealand and the Philippines have a higher rate than the EU15 average in technology.
In terms of total output, China produces the greatest number of publications; it is followed by Japan, India and South Korea. Japan has one field, chemical sciences, with a citation rate above the world average.
Figure 2-3 Australia’s STEM research compared with that of New Zealand and selected Asian countries: by two-digit field, 2002 to 2012
0.0
0.5
1.0
1.5
2.0
AUSTRALIA SINGAPORE NEW ZEALAND JAPAN
0.0
0.5
1.0
1.5
2.0
PHILIPPINES
Fiel
d−
wei
ght
ed c
itat
ion
rate
SOUTH KOREA CHINA THAILAND
0.0
0.5
1.0
1.5
2.0
INDIA INDONESIA VIETNAM MALAYSIA
Notes: Publication counts are Web of Science documents classified as article, note or review, by year of publication and assigned to a country based on the institutional address(es) listed in the publication. Each circle represents a STEM field (selected using Australia ERA 2012 FoR Level 1 categories mathematical sciences, physical sciences, chemical sciences, earth sciences, environmental sciences, biological sciences, agricultural and veterinary sciences, information and computing sciences, engineering, technology, and the biomedical and clinical health sciences sub-grouping of medical and health science) ordered by citation rate (field-weighted). Circle area indicates total number of STEM publications, 2002 to 2012. The minimum circle size represents 12 550 publications. Fields with publication number below this threshold over the period are represented by circles corresponding to this size to aid visualisation. Green circles show fields above the EU15 countries; yellow circles show fields above the normalised world average (1.0) but below the EU15 countries; red circles show those fields that are below the world average.
Source: InCites, Thomson Reuters (2012). Global Comparisons Dataset, 2002 to 2012. Report created 12 January 2014. Data processed 3 July 2013. Data from Web of Science.
Figure 2-4 Australian STEM research, by four-digit sub-field, 2002 to 2012
0.0
0.5
1.0
1.5
2.0
MATHEMATICAL SCIENCES PHYSICAL SCIENCES CHEMICAL SCIENCES EARTH SCIENCES
0.0
0.5
1.0
1.5
2.0
ENVIRONMENTAL SCIENCES
Fiel
d−
wei
ght
ed c
itat
ion
rate
BIOLOGICAL SCIENCESAGRICULTURAL &
VETERINARY SCIENCESINFORMATION &
COMPUTING SCIENCES
0.0
0.5
1.0
1.5
2.0
ENGINEERING TECHNOLOGYBIOMEDICAL &
CLINICAL HEALTH SCIENCES
Notes: Publication counts are Web of Science documents classified as article, note or review, by year of publication and assigned to a country based on the institutional address(es) listed in the publication. Each circle represents a STEM subject group (selected using Australia ERA 2012 FoR Level 2 categories) ordered by field-weighted citation rate. Circle area indicates total number of STEM publications, 2002 to 2012. Green circles show sub-fields above the EU15 countries; yellow circles show sub-fields above the world average (1.0) but below the EU15 countries; red circles show those sub-fields that are below the world average.
Source: InCites, Thomson Reuters (2012). Global Comparisons Dataset, 2002 to 2012. Report created 30 January 2014. Data processed 3 July 2013. Data from Web of Science.

1514 Chapter 2 BENCHMARKING AUSTRALIAN SCIENCE, TECHNOLOGY, ENGINEERING AND MATHEMATICS
2.10 WORLD-LEADING AUSTRALIAN SUB-FIELDS
Citation rates for Australian STEM publications in 20 sub-fields from a total of 91 are above those for the United States and the EU15 (see Figure 2-5, top right); rates for five sub-fields are above those for the United States but not the EU15 (top left); rates for 27 sub-fields are above
those for the EU15 but below those for the United States (lower right). Table 2-3 shows a breakdown of these sub-fields. In addition, rates for 39 sub-fields are lower than in both the United States and the EU15 (lower left).
Engineering, geology and agriculture are areas in which Australia leads both the EU15 and the United States based on high field-weighted citation rates.
Figure 2-5 Citation rates for Australian STEM publications compared with those for the United States and the EU15, 2002 to 2012
Citation rate (field−weighted) relative to EU15
Cit
atio
n ra
te (fi
eld
−w
eig
hted
) rel
ativ
e to
US
0.4 0.6 0.8 1.0 1.2 1.4 1.6 1.8
0.5
1.0
1.5
2.0
Mathematical SciencesPhysical SciencesChemical SciencesEarth SciencesEnvironmental SciencesBiological SciencesAgricultural and Veterinary SciencesInformation and Computing SciencesEngineeringTechnologyBiomedical and Clinical Health Sciences
Australia leading US and EU15Australia leading US
Australia leading EU15
Notes: Publication counts are Web of Science documents classified as article, note or review, by year of publication and assigned to a country based on the institutional address(es) listed in the publication. Each circle represents a STEM subject group (selected using Australia ERA 2012 FoR Level 2 categories) ordered by citation rate (field-weighted). Circle area indicates total publications, 2002 to 2012. Values greater than one show Australia’s field-weighted citation rate is greater than the corresponding United States or EU15 value. The top left quadrant shows where the Australian citation rate is higher than that for the United States. The bottom right quadrant shows where the Australian citation rate is higher than that for the EU15. The top right quadrant shows where the Australian rate is higher than for both the United States and the EU15. The bottom left shows subfields for which the Australian rate is below those for both the United States and the EU15.
Source: InCites, Thomson Reuters (2012). Global Comparisons Dataset, 2002 to 2012. Report created 30 January 2014. Data processed 3 July 2013. Data from Web of Science.
Table 2-3 STEM sub-fields for which Australian citation rates are higher than those for the United States and/or the EU15
Sub-field Total publications (2002 to 2012)
Australian share of field (%)
Higher than United States and EU15
Geology 6584 5.6
Civil engineering 6190 4.1
Veterinary sciences 4845 4.0
Geochemistry 4247 6.3
Atomic, molecular, nuclear, particle and plasma physics 4078 1.8
Environmental science and management 2652 6.3
Atmospheric sciences 2234 3.5
Statistics 2113 3.6
Medical biochemistry and metabolomics 1999 2.4
Interdisciplinary engineering 1687 2.2
Aerospace engineering 951 2.3
Horticultural production 757 4.0
Agriculture, land and farm management 378 3.5
Agricultural biotechnology 334 3.5
Other agricultural and veterinary sciences 292 6.4
Industrial biotechnology 252 1.6
Data format 221 3.6
Other earth sciences 188 7.3
Other engineering 168 3.7
Environmental biotechnology 85 1.4
Higher than EU15
Clinical sciences 47018 3.7
Electrical and electronic engineering 9975 2.3
Mechanical engineering 9789 2.7
Materials engineering 8091 2.0
Ecology 7378 7.6
Astronomical and space sciences 7322 4.1
Cardiovascular medicine and haematology 6516 2.9
Physical chemistry (incl. Structural) 6508 2.1
Immunology 5261 3.7
Applied mathematics 5197 2.2
Organic chemistry 4698 1.9
Medical microbiology 3761 3.2
Optical physics 3688 2.5
Other chemical sciences 3634 2.3
Inorganic chemistry 3277 1.9
Communications technologies 3082 2.7

16 BENCHMARKING AUSTRALIAN SCIENCE, TECHNOLOGY, ENGINEERING AND MATHEMATICS
CHAPTER 3
2.11 CONCLUDING REMARKS
The findings presented here extend and support those reported in previous analyses of Australia’s research performance (West 2013). On the basis of the field-weighted citation rates for STEM publications, Australia’s overall research performance could be improved when compared with the other countries examined.
This overall performance means we have no room for complacency. Nor can we let STEM drift. We must distribute resources carefully and strategically—just like most other countries.
Sub-field Total publications (2002 to 2012)
Australian share of field (%)
Condensed matter physics 3036 1.6
Physical geography and environmental geoscience 2890 4.8
Ophthalmology and optometry 2827 4.3
Resources engineering and extractive metallurgy 2660 3.1
Geophysics 2519 4.7
Macromolecular and materials chemistry 1781 1.6
Distributed computing 1486 3.2
Computer software 864 3.4
Other information and computing sciences 505 3.4
Maritime engineering 298 4.2
Medical biotechnology 211 2.9
Higher than United States
Crop and pasture production 3684 4.2
Fisheries sciences 2653 5.8
Environmental engineering 2021 4.1
Forestry sciences 1237 4.5
Soil sciences 925 4.1
19Chapter 3 18 BENCHMARKING AUSTRALIAN SCIENCE, TECHNOLOGY, ENGINEERING AND MATHEMATICS
3. HIGHLY CITED RESEARCH
The scale of research endeavour and the productivity of researchers are important factors determining countries’ research performance. To provide further insights into how countries compare in their share of ‘world-leading’ publications, the proportions of top 1 per cent of publications are normalised against the country’s population and then shown relative to each country’s share of researchers in the national workforce and national R&D expenditure.
When top publications are normalised to each country’s population, Australia has fewer publications in the top 1 per cent by citation than Switzerland, Denmark, Sweden, Finland, Norway, Belgium and Austria (see Figure 3-2). It is worth noting that nations have different proportions of researchers in business and higher education and that the number of researchers would vary between fields.
This chapter analyses Australia’s STEM publications that are amongst the top 1 per cent of cited publications globally—an indicator of the most influential Australian STEM publications.
3.1 MAIN FINDINGS
` In the broad group of natural and physical sciences, Australia has a lower proportion of the top 1 per cent of cited publications than Canada, France, China, Germany, the United Kingdom and the United States, but a higher proportion than eight of the European countries assessed.
` Australian research in all STEM fields is represented in the top 1 per cent of cited publications globally, the largest number being in the fields of medicine and engineering.
3.2 DATA SOURCES AND TERMINOLOGY
Data for all fields that are consistent with those used for previous analyses in Chapter 2 are not available, so the top 1 per cent of publications in the area of natural science and engineering are used as a broad indication of STEM. In addition, presented here are data on highly cited STEM fields from the Scopus database.
3.3 COUNTRIES ANALYSED
This chapter provides an analysis of the 11 European nations (Austria, Belgium, Denmark, Finland, France, Germany, Ireland, Norway, Sweden, Switzerland and the United Kingdom) and comparator nations from our region (New Zealand, China, India, Indonesia, Japan, Malaysia, the Philippines, Singapore, South Korea, Thailand and Vietnam).
3.4 AUSTRALIA’S SHARE OF THE MOST CITED STEM PUBLICATIONS GLOBALLY
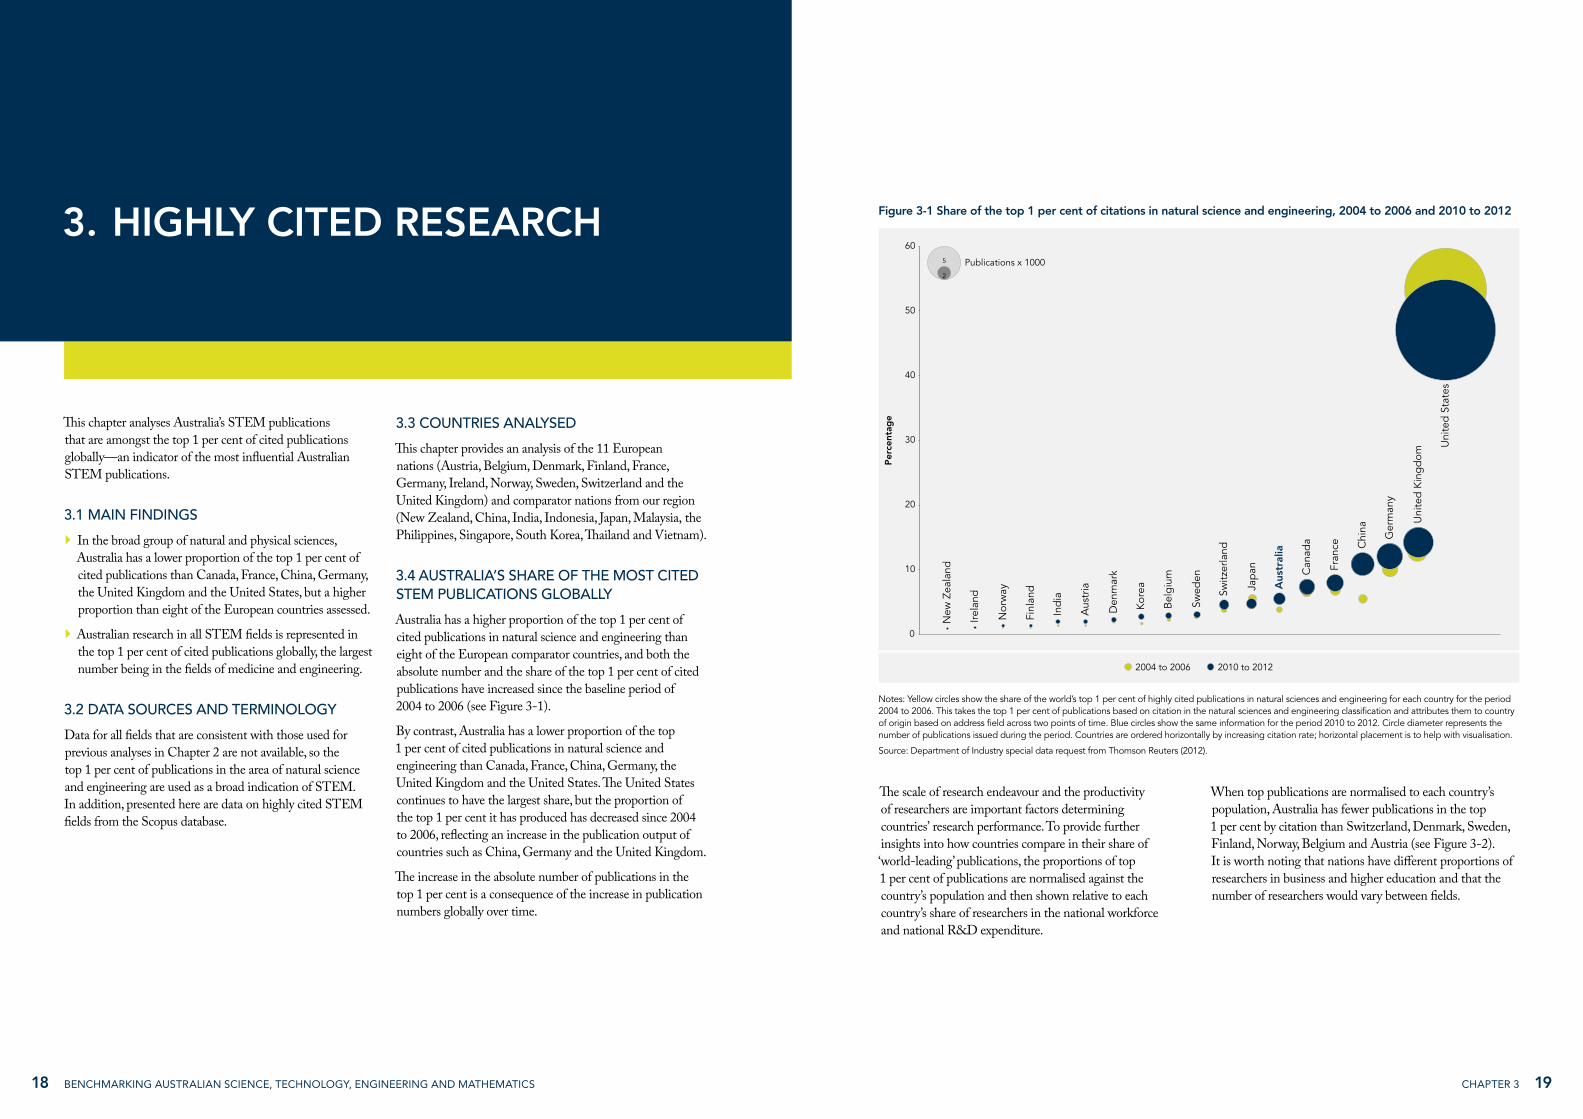
Australia has a higher proportion of the top 1 per cent of cited publications in natural science and engineering than eight of the European comparator countries, and both the absolute number and the share of the top 1 per cent of cited publications have increased since the baseline period of 2004 to 2006 (see Figure 3-1).
By contrast, Australia has a lower proportion of the top 1 per cent of cited publications in natural science and engineering than Canada, France, China, Germany, the United Kingdom and the United States. The United States continues to have the largest share, but the proportion of the top 1 per cent it has produced has decreased since 2004 to 2006, reflecting an increase in the publication output of countries such as China, Germany and the United Kingdom.
The increase in the absolute number of publications in the top 1 per cent is a consequence of the increase in publication numbers globally over time.
Figure 3-1 Share of the top 1 per cent of citations in natural science and engineering, 2004 to 2006 and 2010 to 2012
2004 to 2006 2010 to 2012
0
Per
cent
age
60
50
40
30
20
10
New
Zea
land
Irela
nd
Nor
way
Finl
and
Ind
ia
Aus
tria
Den
mar
k
Kor
ea
Bel
giu
m
Swed
en
Switz
erla
nd
Jap
an
Aus
tral
ia
Can
ada
Fran
ce Chi
na
Ger
man
y
Uni
ted
Kin
gd
om
Uni
ted
Sta
tes
5
2
Publications x 1000
Notes: Yellow circles show the share of the world’s top 1 per cent of highly cited publications in natural sciences and engineering for each country for the period 2004 to 2006. This takes the top 1 per cent of publications based on citation in the natural sciences and engineering classification and attributes them to country of origin based on address field across two points of time. Blue circles show the same information for the period 2010 to 2012. Circle diameter represents the number of publications issued during the period. Countries are ordered horizontally by increasing citation rate; horizontal placement is to help with visualisation.
Source: Department of Industry special data request from Thomson Reuters (2012).

2120 Chapter 3 BENCHMARKING AUSTRALIAN SCIENCE, TECHNOLOGY, ENGINEERING AND MATHEMATICS
The population of a country provides a crude measure of that country’s research capacity. Figure 3-3 shows the number of publications in the top 1 per cent (indicated by circle size) for each comparator country, the number of researchers per 1000 in employment and gross expenditure on R&D, or GERD, as a share of gross domestic product. The caution here is that not all researchers in a country will have the goal of publishing in citable journals; for example, Denmark has approximately 60 per cent of researchers in business, whereas Australia has just over 30 per cent (see Chapter 7). The proportions of researchers in higher education relative to business will have an impact on the nature of the output from research.
Australia is mid-range among the comparator countries both for the number of researchers per 1000 and for GERD as a share of GDP.
There is an increasing number of researchers per year for most of the countries assessed (data not shown). The most recent data for Australia are from 2008, so assessing Australia’s recent position will depend on the availability of new data.
Figure 3-3 Top natural science and engineering publications (2010 to 2012) by researchers per 1000 total employment and GERD as share of GDP (2011)
5.04.54.03.53.02.52.01.51.00.50.00
GERD as percentage of GDP (2011)
Res
earc
hers
per
100
0 to
tal e
mp
loym
ent
FTE
(201
1)
14
12
10
8
6
4
2
16
United StatesUnited Kingdom
Germany
China
France
Canada
Australia
Japan
Switzerland
SwedenBelgium
Korea
Denmark
Austria
Finland
Norway
IrelandNew Zealand
Top publications 2010–12 (x 1000)62
Notes: Circle diameter represents the number of top 1 per cent of highly cited publications in natural sciences and engineering for each country in 2010 to 2012. This takes the top 1 per cent of publications based on citation in the natural sciences and engineering classification and attributes them to country of origin based on address field. The scale shows the volume of publications in thousands for each country. The latest available data on researchers per 1000 total employment and GERD as a share of GDP for Switzerland were both 2008 and for Australia were 2008 and 2010 respectively.
Source: Department of Industry special data request from Thomson Reuters (2012); OECD Main Science and Technology Indicators, January 2014.
Figure 3-2 Per capita contribution to top 1 per cent of citations in natural science and engineering publications
302520151050
Australia
JapanKorea
FranceGermany
United StatesCanada
New ZealandUnited Kingdom
Ireland
AustriaBelgiumFinlandNorwaySweden
DenmarkSwitzerland
Publications per capita
2006 2012
Source: Department of Industry special data request from Thomson Reuters (2012); OECD Main Science and Technology Indicators, January 2014.
2322 Chapter 3 BENCHMARKING AUSTRALIAN SCIENCE, TECHNOLOGY, ENGINEERING AND MATHEMATICS
3.5 THE INCREASE IN THE NUMBER OF HIGHLY CITED PUBLICATIONS EACH YEAR
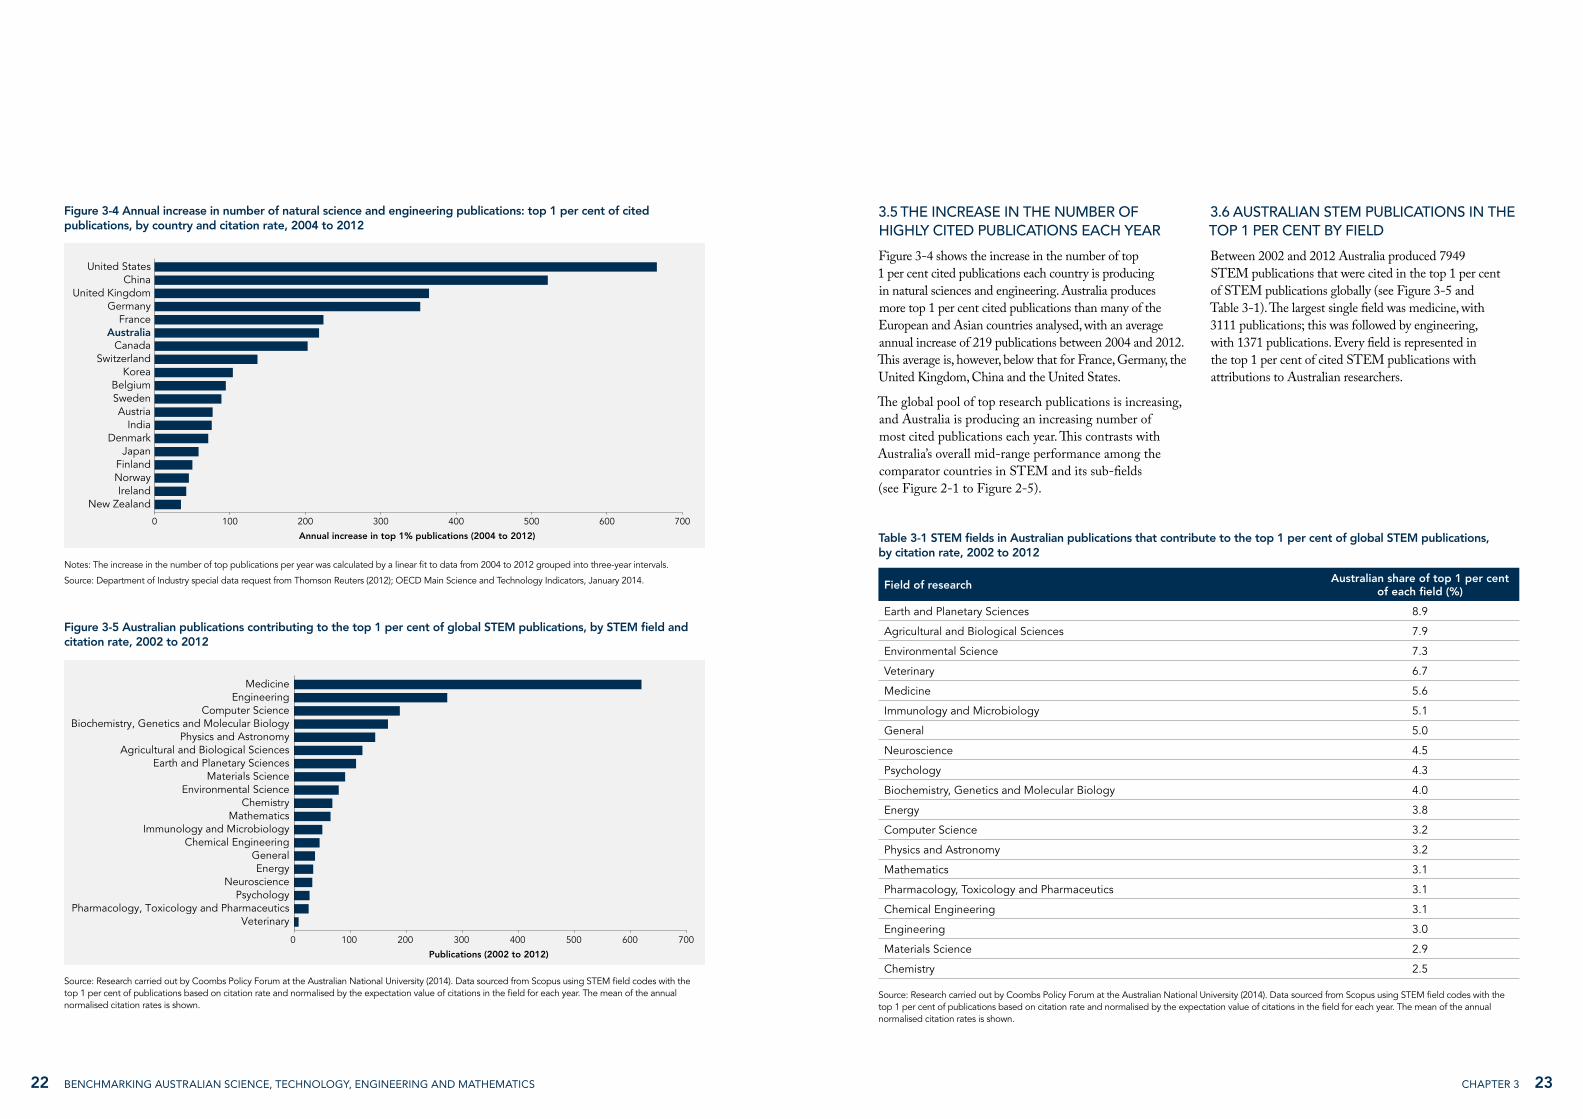
Figure 3-4 shows the increase in the number of top 1 per cent cited publications each country is producing in natural sciences and engineering. Australia produces more top 1 per cent cited publications than many of the European and Asian countries analysed, with an average annual increase of 219 publications between 2004 and 2012. This average is, however, below that for France, Germany, the United Kingdom, China and the United States.
The global pool of top research publications is increasing, and Australia is producing an increasing number of most cited publications each year. This contrasts with Australia’s overall mid-range performance among the comparator countries in STEM and its sub-fields (see Figure 2-1 to Figure 2-5).
3.6 AUSTRALIAN STEM PUBLICATIONS IN THE TOP 1 PER CENT BY FIELD
Between 2002 and 2012 Australia produced 7949 STEM publications that were cited in the top 1 per cent of STEM publications globally (see Figure 3-5 and Table 3-1). The largest single field was medicine, with 3111 publications; this was followed by engineering, with 1371 publications. Every field is represented in the top 1 per cent of cited STEM publications with attributions to Australian researchers.
Table 3-1 STEM fields in Australian publications that contribute to the top 1 per cent of global STEM publications, by citation rate, 2002 to 2012
Field of research Australian share of top 1 per cent of each field (%)
Earth and Planetary Sciences 8.9
Agricultural and Biological Sciences 7.9
Environmental Science 7.3
Veterinary 6.7
Medicine 5.6
Immunology and Microbiology 5.1
General 5.0
Neuroscience 4.5
Psychology 4.3
Biochemistry, Genetics and Molecular Biology 4.0
Energy 3.8
Computer Science 3.2
Physics and Astronomy 3.2
Mathematics 3.1
Pharmacology, Toxicology and Pharmaceutics 3.1
Chemical Engineering 3.1
Engineering 3.0
Materials Science 2.9
Chemistry 2.5
Source: Research carried out by Coombs Policy Forum at the Australian National University (2014). Data sourced from Scopus using STEM field codes with the top 1 per cent of publications based on citation rate and normalised by the expectation value of citations in the field for each year. The mean of the annual normalised citation rates is shown.
Figure 3-5 Australian publications contributing to the top 1 per cent of global STEM publications, by STEM field and citation rate, 2002 to 2012
600 7005004003002000 100
Publications (2002 to 2012)
VeterinaryPharmacology, Toxicology and Pharmaceutics
PsychologyNeuroscience
EnergyGeneral
Chemical EngineeringImmunology and Microbiology
MathematicsChemistry
Environmental ScienceMaterials Science
Earth and Planetary SciencesAgricultural and Biological Sciences
Physics and AstronomyBiochemistry, Genetics and Molecular Biology
Computer ScienceEngineering
Medicine
Source: Research carried out by Coombs Policy Forum at the Australian National University (2014). Data sourced from Scopus using STEM field codes with the top 1 per cent of publications based on citation rate and normalised by the expectation value of citations in the field for each year. The mean of the annual normalised citation rates is shown.
Figure 3-4 Annual increase in number of natural science and engineering publications: top 1 per cent of cited publications, by country and citation rate, 2004 to 2012
600 7005004003002001000
Annual increase in top 1% publications (2004 to 2012)
Australia
New ZealandIreland
NorwayFinland
JapanDenmark
IndiaAustria
SwedenBelgium
KoreaSwitzerland
Canada
FranceGermany
United KingdomChina
United States
Notes: The increase in the number of top publications per year was calculated by a linear fit to data from 2004 to 2012 grouped into three-year intervals.
Source: Department of Industry special data request from Thomson Reuters (2012); OECD Main Science and Technology Indicators, January 2014.

24 BENCHMARKING AUSTRALIAN SCIENCE, TECHNOLOGY, ENGINEERING AND MATHEMATICS
CHAPTER 4
3.7 HIGHLY CITED AUSTRALIAN RESEARCHERS
Australia has 2.9 top cited researchers per million population; this places us below Switzerland, the United States, the United Kingdom, Denmark and Belgium (see Figure 3-6).
3.8 CONCLUDING REMARKS
When our research performance is compared with that of 11 Western European countries, the United States and Canada, it is clear that our best are among the best in the world.
While research in all STEM fields contributes to our share of the world’s top 1 per cent of cited publications, research in medicine and engineering plays a dominant part.
Figure 3-6 Top cited researchers per million population, selected countries, 2014
Australia
PhilippinesThailand
IndiaVietnam
IndonesiaMalaysia
ChinaSouth Korea
JapanNew Zealand
FranceNorway
GermanyAustriaIreland
SingaporeCanadaFinland
Sweden
BelgiumDenmark
United KingdomUnited States
Switzerland
7 9543210 6 8
Number of researchers
Source: Data obtained from Thomson Reuters 2014 Highly Cited Researchers List (Thomson Reuters 2014). To be included in the list a researcher must feature in the top 1 per cent by total citation in their field (by the Thomson Reuters Essential Science Indicators) from 2002 to 2012. The number of researchers included from each field is based on the square root of the number of authors featured in each field. Highly cited researchers by address of primary affiliation: CIA The World Factbook (2014), Country Comparison: population, July 2014.

27Chapter 4 26 BENCHMARKING AUSTRALIAN SCIENCE, TECHNOLOGY, ENGINEERING AND MATHEMATICS
4. PATENTS Both applicants and patent offices in PCT member states benefit from the uniform formality requirements, the international search and preliminary examination reports, and the centralised international publication provided by the PCT system (World Intellectual Property Organization 2010).
4.3.2 Triadic patent families
Another measure of international innovation is the triadic patent family—a set of patents protecting the same invention and filed at the European Patent Office, the Japanese Patent Office and the US Patent and Trademark Office. It has been suggested that triadic patent families provide an improved measure of innovative performance and technological change at the international level (Dernis 2003). This is because triadic patent families cover a single invention and the resultant indicators are less influenced by individual patent offices’ rules and regulations and patenting strategies (Dernis 2007).
4.4 DATA SOURCES
The OECD Patent Database, created by the Directorate for Science, Technology and Industry, covers patents filed under the PCT, and counts are based on data received from the European Patent Office. Only the original application is counted, thus avoiding double-counting of the same invention. The EPO Database provides good coverage for both OECD member and non-OECD member economies from 1981. PCT applications are presented according to the region of the inventor’s residence and the priority year.1
The OECD Patent Database also covers triadic patent families. Data on triadic patent families are mainly derived from the EPO’s Worldwide Statistical Patent Database (PATSTAT).
4.5 COUNTRIES ANALYSED
As in the previous chapter, two groups of benchmarking nations were identified for analysis—countries at stages of development similar to that of Australia and with similar governance systems (the United States, Canada and selected European nations), and selected countries in the Asia–Pacific region.
This chapter compares Australia with the 11 European comparator countries (Austria, Belgium, Denmark, Finland, France, Germany, Ireland, Norway, Sweden, Switzerland and the United Kingdom), North America (Canada and the United States), and countries in our region (China, Japan, New Zealand, South Korea and Singapore).
4.6 PATENT APPLICATIONS IN AUSTRALIA AND ELSEWHERE
4.6.1 Australian patent applications, 1981 to 2011
In 2012, 26 358 ‘standard patents’ were filed in Australia—10 per cent by Australian residents and 90 per cent by foreign applicants (IP Australia 2013). PCT applications accounted for 72 per cent (19 107) of the total. US residents filed the highest number of Australian standard patents (11 376), followed by Japan (1746) and Germany (1594).
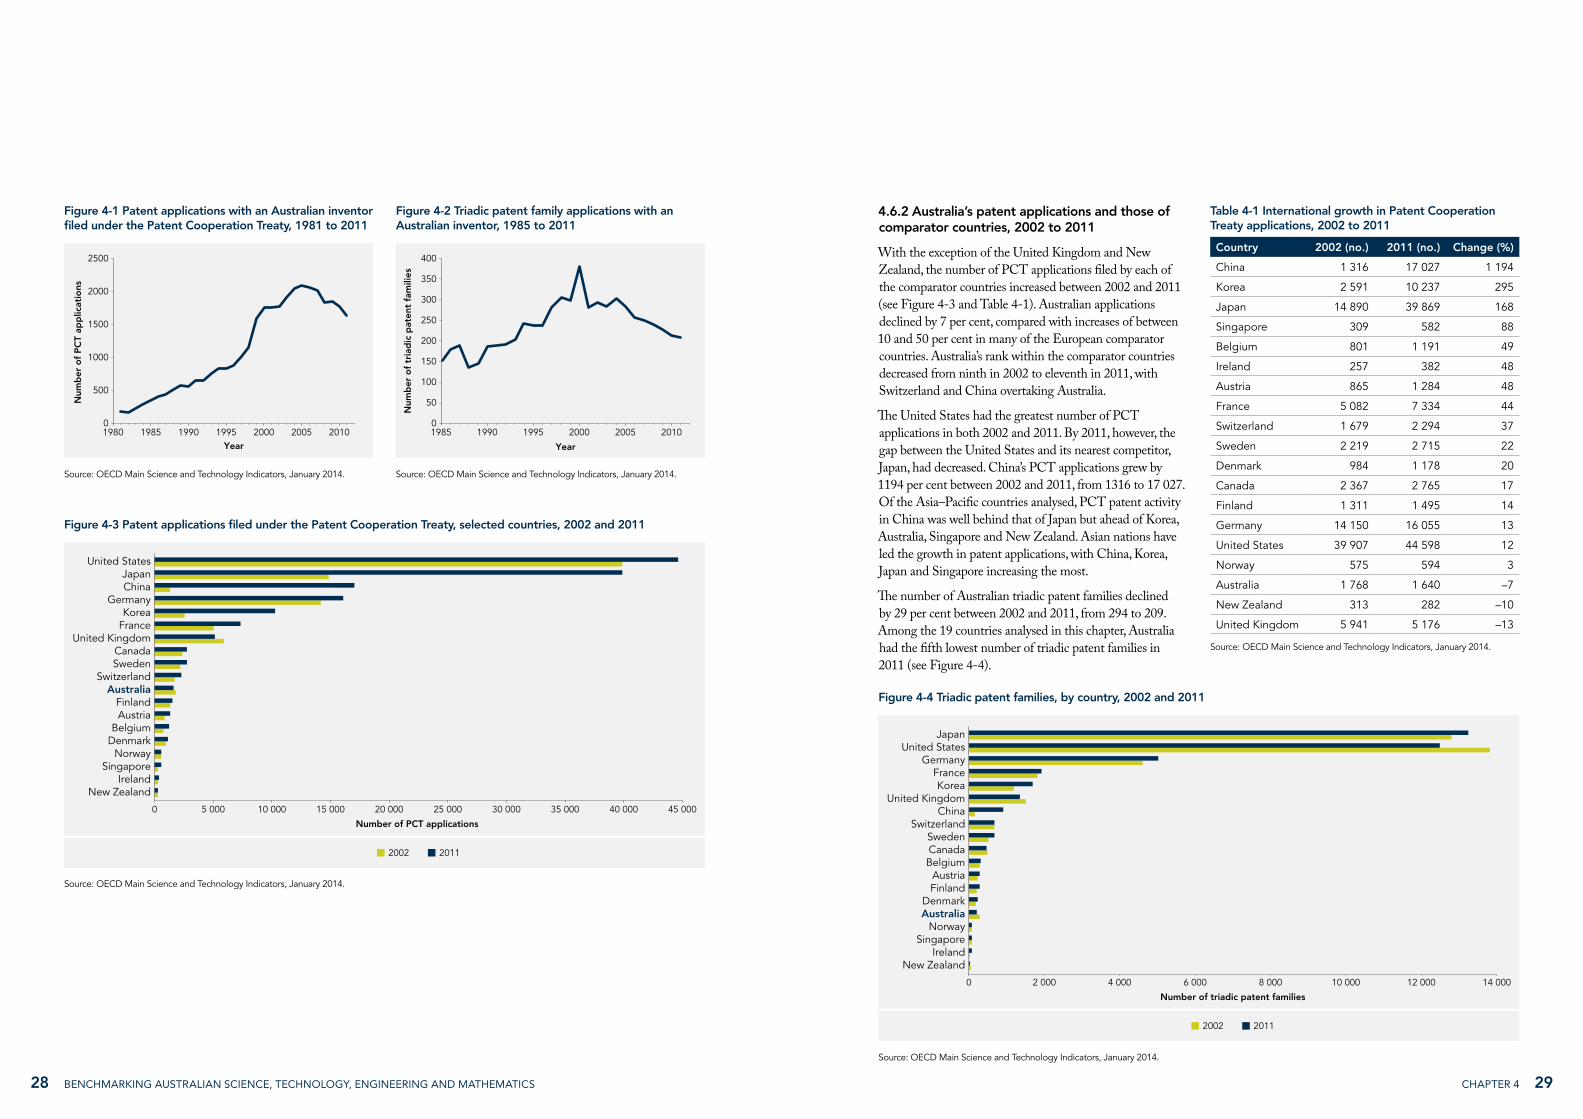
The number of PCT patent applications by an Australian inventor increased from 172 in 1981 to a peak of 2092 in 2005 (see Figure 4-1). The most rapid growth was between 1996 and 2005; this was followed by a 22 per cent decline from 2005 to 2011.
Triadic patent families form a much smaller group than PCT patents (see Figure 4-2). In 1985 there were 153 triadic patents with an Australian inventor, compared with 357 PCT patents. By 2000 the number of triadic patents had increased to 380 (a 148 per cent increase) and PCT patents to 1755 (362 per cent). After 2000 triadic patent families began to decline (by 45 per cent from 2000 to 2011), whereas PCT applications continued to rise until 2005.
The decline in PCT applications after 2007 might in part be a reaction to the global financial crisis. The Department of Industry reported an 11.6 per cent decrease in Australian standard patent applications (that is, applications filed in Australia) from 2007 to 2009. It attributed this to economic disruption caused by the GFC (DIISR 2012). By contrast, the decline in triadic patents started in 2001, six years before the GFC began.
This chapter examines the number of Patent Cooperation Treaty patent applications and triadic patent families filed by Australian inventors compared with inventors from other countries.
4.1 MAIN FINDINGS
` The number of Patent Cooperation Treaty applications and triadic patent families filed by an Australian inventor has fallen steadily in recent years. PCT applications have fallen by 22 per cent from their peak in 2005; triadic applications have fallen by 45 per cent from their peak in 2000.
` The number of PCT applications and triadic patents has increased for all the comparator countries other than the United Kingdom.
` The number of Australian PCT applications with a foreign co-inventor increased between 2002 and 2011. Despite this, the proportion of Australian PCT patents filed with an international co-inventor in 2011 was lower than that for most of the comparator countries, including all the European countries.
4.2 BACKGROUND
Patent systems have an important role in stimulating technological innovation by providing legal protection for intellectual property and disseminating useful technical information (Merrill et al. 2004). This facilitates technology transfer and the commercialisation and diffusion of knowledge. The patent system has clear economic objectives, but it also leads to non-economic benefits by increasing innovation and opening up access to new technologies (Advisory Council on Intellectual Property 2011).
Patents can demonstrate a country’s capacity or willingness to exploit knowledge and translate it into potential economic benefits (European Commission 2012). They have been used to track knowledge diffusion across countries, regions, technologies and companies and to assess the international reach of innovative activities (Dernis 2007). Patent counts have been described as ‘measuring something above and beyond R&D inputs, a creation of an underlying knowledge stock’ (Hall et al. 1986).
4.3 TERMINOLOGY
Like many countries, Australia issues national patents through a national patent office, thereby protecting inventions developed within national boundaries. Local patents represent only a small proportion of total Australian patents, however: a better benchmark for innovation with international ramifications is a comparison of applications under the PCT and triadic patent families.
For the purposes of this report, the nationality of a patent is considered to be the inventor’s country of residence.
4.3.1 The Patent Cooperation Treaty
Australian patents provide protection within Australia. To obtain protection in other countries inventors can either file separately in individual countries or file a single international application under the Patent Cooperation Treaty, which is administered by the World Intellectual Property Organization. A patent registered under the PCT is the closest thing to an international patent and protects inventions in over 180 countries.
1 The priority year, the year of the first international filing of a patent, is used as a reference date.
2928 Chapter 4 BENCHMARKING AUSTRALIAN SCIENCE, TECHNOLOGY, ENGINEERING AND MATHEMATICS
4.6.2 Australia’s patent applications and those of comparator countries, 2002 to 2011
With the exception of the United Kingdom and New Zealand, the number of PCT applications filed by each of the comparator countries increased between 2002 and 2011 (see Figure 4-3 and Table 4-1). Australian applications declined by 7 per cent, compared with increases of between 10 and 50 per cent in many of the European comparator countries. Australia’s rank within the comparator countries decreased from ninth in 2002 to eleventh in 2011, with Switzerland and China overtaking Australia.
The United States had the greatest number of PCT applications in both 2002 and 2011. By 2011, however, the gap between the United States and its nearest competitor, Japan, had decreased. China’s PCT applications grew by 1194 per cent between 2002 and 2011, from 1316 to 17 027. Of the Asia–Pacific countries analysed, PCT patent activity in China was well behind that of Japan but ahead of Korea, Australia, Singapore and New Zealand. Asian nations have led the growth in patent applications, with China, Korea, Japan and Singapore increasing the most.
The number of Australian triadic patent families declined by 29 per cent between 2002 and 2011, from 294 to 209. Among the 19 countries analysed in this chapter, Australia had the fifth lowest number of triadic patent families in 2011 (see Figure 4-4).
Figure 4-1 Patent applications with an Australian inventor filed under the Patent Cooperation Treaty, 1981 to 2011
Num
ber
of
PC
T ap
plic
atio
ns
2500
2000
1500
1000
500
02000 2005 20101980 1985 1990 1995
Year
Source: OECD Main Science and Technology Indicators, January 2014.
Figure 4-2 Triadic patent family applications with an Australian inventor, 1985 to 2011
Num
ber
of
tria
dic
pat
ent
fam
ilies
400
350
300
250
200
150
100
50
02000 2005 20101985 1990 1995
Year
Source: OECD Main Science and Technology Indicators, January 2014.
Figure 4-3 Patent applications filed under the Patent Cooperation Treaty, selected countries, 2002 and 2011
40 00035 00025 00015 00010 0005 0000 45 00030 00020 000
Number of PCT applications
2002 2011
Australia
New ZealandIreland
SingaporeNorway
DenmarkBelgium
AustriaFinland
SwitzerlandSwedenCanada
United KingdomFranceKorea
GermanyChinaJapan
United States
Source: OECD Main Science and Technology Indicators, January 2014.
Table 4-1 International growth in Patent Cooperation Treaty applications, 2002 to 2011
Country 2002 (no.) 2011 (no.) Change (%)
China 1 316 17 027 1 194
Korea 2 591 10 237 295
Japan 14 890 39 869 168
Singapore 309 582 88
Belgium 801 1 191 49
Ireland 257 382 48
Austria 865 1 284 48
France 5 082 7 334 44
Switzerland 1 679 2 294 37
Sweden 2 219 2 715 22
Denmark 984 1 178 20
Canada 2 367 2 765 17
Finland 1 311 1 495 14
Germany 14 150 16 055 13
United States 39 907 44 598 12
Norway 575 594 3
Australia 1 768 1 640 –7
New Zealand 313 282 –10
United Kingdom 5 941 5 176 –13
Source: OECD Main Science and Technology Indicators, January 2014.
Figure 4-4 Triadic patent families, by country, 2002 and 2011
10 0006 0004 0002 0000 14 00012 0008 000
Number of triadic patent families
2002 2011
New Zealand
Australia
IrelandSingapore
Norway
DenmarkFinlandAustria
BelgiumCanadaSweden
SwitzerlandChina
United KingdomKorea
FranceGermany
United StatesJapan
Source: OECD Main Science and Technology Indicators, January 2014.

3130 Chapter 4 BENCHMARKING AUSTRALIAN SCIENCE, TECHNOLOGY, ENGINEERING AND MATHEMATICS
4.6.3 PCT applications in Australia and comparator countries after the global financial crisis
After the global financial crisis global PCT applications fell by 4.5 per cent in 2009 (World Intellectual Property Organization 2010), the first such decrease in three decades (Mara 2010). In some ways the GFC rearranged the international patent landscape, resulting in large decreases in applications in many Western nations but growth in many Asian countries. China, in particular, experienced a large increase in PCT applications between 2008 and 2009, at 29.7 per cent (see Table 4-2).
The countries that experienced the greatest decrease in PCT applications immediately following the GFC were Ireland (–11 per cent), Denmark (–10 per cent), the United Kingdom (–6 per cent), Sweden (–5 per cent) and the United States (–4 per cent). Although Australia’s PCT applications increased by 1 per cent between 2008 and 2009, the number declined again in 2010 and 2011, continuing the fall from the 2005 peak (see Figure 4-1).
Table 4-2 International PCT applications, 2008 and 2009
Country 2008 (no.) 2009 (no.) Change (%)
China 6 913 10 682 55
Korea 7 156 8 690 21
Japan 25 429 28 824 13
Norway 666 749 12
Austria 1 189 1 278 8
Belgium 1 087 1 142 5
Canada 2 614 2 689 3
Germany 17 029 17 287 2
France 6 898 7 009 2
Australia 1 830 1 846 1
Finland 1 502 1 502 0
Switzerland 2 254 2 220 –1
United States 44 546 42 799 –4
New Zealand 337 324 –4
Sweden 3 000 2 847 –5
United Kingdom 6 020 5 680 –6
Singapore 649 606 –7
Denmark 1 252 1 127 –10
Ireland 427 378 –11
Source: OECD Main Science and Technology Indicators, January 2014.
The overall patenting trend for Australia before and after the GFC was one of declining PCT and triadic patent activity. This contrasts with most of the European countries analysed: all but the United Kingdom achieved overall growth in PCT patent applications from 2002 to 2011, despite a general slowdown in the post-GFC years.
4.6.4 International collaboration in PCT patents, 2002 and 2011
Globalisation trends are reflected in the internationalisation of R&D and innovative activities (Guellec & Potterie 2001). Cross-border co-invention represents international collaboration in the inventive process (Dernis 2007).
In 2011 the share of Australian PCT patent applications filed with a co-inventor located abroad was 17 per cent (see Figure 4-5). Cross-border co-invention was lower in Australia than in all the analysed European countries, New Zealand (23 per cent), India (29 per cent), Canada (31 per cent), Singapore (33 per cent) and Indonesia (52 per cent). Australia’s cross-border co-invention did, however, increase from 14 per cent in 2002 to 17 per cent in 2011.
4.7 COLLABORATION BETWEEN BUSINESS AND RESEARCH INSTITUTIONS ON INNOVATION
Australia’s low patenting rates reflects the poor collaboration between business and research in the public sector (Figure 4-6). Australia has the lowest level of business to research collaboration among the comparator countries. In OECD analysis of innovation active businesses, out of a total of 33 countries, Australia ranks 32nd on business to research collaboration for small to medium enterprises (SMEs), and 33rd for large firms (OECD 2011b).
Similar analysis by the ABS, for countries for which data are available but including businesses with 0–9 employees, improves our position to 15th for SMEs and 21st for large firms. Only 13.7 per cent of our large firms collaborated with research organisations: slightly above the level of collaboration—9.6 per cent—by our SMEs (Department of Industry 2013).
Figure 4-5 Percentage of patent applications filed under the Patent Cooperation Treaty with foreign co-inventors, selected countries, 2002 and 2011
503020100 6040
Percentage
2002 2011
Australia
JapanKoreaChina
United StatesGermany
NorwayFranceFinland
SwedenDenmark
New ZealandAustria
United KingdomIndia
CanadaSingapore
IrelandSwitzerland
BelgiumIndonesia
Source: OECD Stat, data extracted from international cooperation in patents data set, 26 March 2014.
Figure 4-6 Collaboration on innovation with higher education or public research institutions, by firm size, 2008 to 2010
804020100 9060 7030 10050
Percentage
SMEs Large firms
AustraliaNew Zealand
IrelandUnited Kingdom
SwitzerlandFranceJapan
South KoreaDenmark
NorwayGermanyBelgiumSwedenAustriaFinland
Notes: By OECD classifications, firms with 10–250 employees are considered SMEs, and firms with more than 250 employees are large firms. Where no data were available for 2008–2010, other years are displayed: Australia 2010–2011, New Zealand 2009–2011, Ireland 2006–2008, Switzerland 2009–2011, Japan 2009–2010 and South Korea 2005–2007.
Source: OECD 2011b.
32 BENCHMARKING AUSTRALIAN SCIENCE, TECHNOLOGY, ENGINEERING AND MATHEMATICS
CHAPTER 5
4.8 CONCLUDING REMARKS
Australian industry is dominated by small to medium business enterprises rather than R&D-intensive multinational enterprises. This industry structure probably influences Australia’s patenting profile. Although business funds large amounts of R&D (see Chapter 5), the outcomes of this R&D have not resulted in large numbers of patentable inventions. The low proportion of researchers in businesses (compared with higher education—see Chapter 8) and the low level of business to research collaboration might further limit Australia’s capacity to produce new intellectual property with commercial potential.
The majority of patents applied for at the Australian Patent Office are from international patent holders: Australia imports more patentable intellectual property than it produces.
These findings complement those in Chapter 2. Australia has a low to mid-range level of performance in patenting compared with European comparator countries and much lower than the larger economies of the United States, Japan and China. Our performance is poor—particularly when viewed against the dynamic patent activity among Asian nations.

35Chapter 5 34 BENCHMARKING AUSTRALIAN SCIENCE, TECHNOLOGY, ENGINEERING AND MATHEMATICS
5. RESEARCH FUNDING 5.2 BACKGROUND
Research funding is crucial to a country’s R&D system. It influences the shape, scale and focus of the research endeavour. This chapter analyses total expenditure on R&D. Additionally, the analysis extends to funding across the STEM fields (where possible). Comparing STEM funding between countries provides insights into how efficiently countries fund, produce and use research outcomes.
The majority of Australian R&D expenditure is in STEM fields. The distribution of R&D expenditure by industry sector illustrates Australia’s STEM effort and how it compares with that of other countries.
5.3 TERMINOLOGY
` Research intensity refers to R&D expenditure as a share of gross domestic product.
` Pure basic research is experimental and theoretical work done in order to acquire new knowledge without looking for long-term benefits other than the advancement of knowledge.
` Strategic basic research is experimental and theoretical work done in order to acquire new knowledge directed at specified broad areas in the expectation of useful discoveries. It provides the broad base of knowledge necessary for the solution of recognised practical problems.
` Applied research is original work done primarily in order to acquire new knowledge with a specific application in view. It is undertaken either to determine possible uses for the findings of basic research or to determine new ways of achieving specific and predetermined objectives.
` Experimental development is systematic work, using existing knowledge gained from research or practical experience, that is directed at producing new materials, products or devices, installing new processes, systems and services, or substantially improving those already produced or installed.
5.4 DATA SOURCES
5.4.1 The OECD Main Science and Technology Indicators database
The funding data used in this chapter were extracted from the OECD’s MSTI database (OECD 2011a). The database contains 151 data series selected from the OECD’s Scientific and Technological Indicators database for 30 OECD member countries and nine nonmember countries. The database provides a set of indicators that reflect the level and structure of the efforts of OECD member and non-member economies in the field of science and technology from 1981 onwards.
5.4.2 Australian Bureau of Statistics R&D statistics
The Australian data set was compiled from data the ABS collected from Australian higher education institutions in the Survey of Research and Experimental Development. For the higher education sector, the survey is conducted biennially and based on a single calendar–year reference period. In compiling its R&D statistics, the ABS asked institutions to provide data on direct staff inputs (staff directly performing R&D), direct expenditure (expenses directly attributable to R&D), and other staff and resources supporting but not directly performing R&D.
5.4.3 InCites, Thomson Reuters
As in Chapter 2, the InCites database was used to analyse author addresses, number of publications, and citations of all publications in the Web of Science database.
5.5 COUNTRIES ANALYSED
As in previous chapters, two groups of benchmarking nations were identified for analysis—countries at stages of development similar to that of Australia and with similar governance systems (the United States, Canada and selected European nations) and selected countries in the Asia–Pacific region.
This chapter compares Australia with the 11 European comparator countries (Austria, Belgium, Denmark, Finland, France, Germany, Ireland, Norway, Sweden, Switzerland and the United Kingdom), North America (Canada and the United States), and countries in our region (China, Japan, South Korea and Singapore).
This chapter analyses trends in national funding of research and development and compares Australia with selected nations. It deals with funding for R&D allocated by the higher education, business and government sectors.
5.1 MAIN FINDINGS
5.1.1 Gross expenditure on R&D
` Australia’s gross expenditure on R&D is higher than that of the smaller European comparator countries but lower than that of the United States, China, Japan, Germany, Korea, France, the United Kingdom and Canada.
` Although Australia’s GERD is higher than that of many of the European nations assessed, many of these nations produce more highly cited research publications (as discussed in Chapters 2 and 3).
5.1.2 Higher education expenditure on R&D
` STEM fields account for 73 per cent of Australia’s higher education expenditure on R&D. Medical and health sciences account for 29 per cent of HERD, engineering 10 per cent, and biological sciences 9 per cent.
` Australia’s HERD increased between 2000 and 2012, as did publication numbers. Despite this, the influence of publications (as measured by field-weighted citation rates) did not improve relative to comparator countries.
` Physics receives a comparatively small amount of investment yet achieves a reasonable output and a high level of field-weighted citations.
` Although medical and health sciences receives the greatest investment and produces the largest number of publications, the field-weighted citation rate for its publications is lower than the rates for the other STEM fields apart from information and computing technology.
` Information and computing technology has the highest cost per publication and a relatively low number of field-weighted citations per publication.
` Applied research accounts for 45 per cent of HERD, pure basic research 23 per cent, and strategic basic research 24 per cent.
5.1.3 Business expenditure on R&D
` STEM fields account for 97 per cent of total business expenditure on R&D. The largest shares are in engineering ($9.3 billion, or 47 per cent of BERD) and information and computer sciences ($5 billion, or 30 per cent).
` Experimental development in the manufacturing and finance sectors accounts for 62 per cent of BERD.
` The manufacturing sector is the largest investor in R&D ($4.8 billion, or 52 per cent of BERD), primarily in engineering ($3.56 billion).
` The mining sector is the second largest investor in R&D ($3.8 billion), also primarily in engineering ($3.6 billion).
` The professional, scientific and technical services sector is the fourth largest investor in R&D ($2.7 billion); ICT tops the investment ($1.1 billion), followed by engineering ($618 million).

3736 Chapter 5 BENCHMARKING AUSTRALIAN SCIENCE, TECHNOLOGY, ENGINEERING AND MATHEMATICS
5.7 RESEARCH INVESTMENT IN THE AUSTRALIAN HIGHER EDUCATION SECTOR
HERD accounts for a quarter of Australia’s total research expenditure (ABS 2010). This does not include the proportion of student-related funding distributed by government that universities use to subsidise research either directly through the employment of research-active staff or indirectly through the provision of infrastructure and facilities.
The higher education sector’s research output is measured in part by the number of STEM research publications (see Figure 5-4). Since the year 2000 Australia’s total HERD and the number of publications in STEM fields have almost doubled.
The average field-weighted citation rate for Australian STEM publications has also increased, but is still at the lower end of the selected European comparator nations (see Figure 5-5).
Taken together, this shows that Australia’s increased investment in research has resulted in more publications. There has also been an increase in the citation rate, although the increase is on par with that of the European comparator nations.
5.6 HOW DOES AUSTRALIA’S R&D INVESTMENT COMPARE?
Research is a global enterprise. Researchers often rely on work done in other countries to generate new knowledge and build on existing knowledge. A nation’s expenditure on R&D can reveal where research efforts are focused, allowing for comparisons of Australia’s focus with the focus of comparator nations.
Australia’s share of global gross expenditure on R&D increased from 1.4 to 2.0 per cent between 2002 and 2010 (see Figure 5-1). This is more than the smaller European comparator countries but less than the United States, China, Japan, Germany, Korea, France, the United Kingdom and Canada. The United States continues to account for the largest proportion of global R&D funding (about 40 per cent), while China’s share of global GERD almost tripled between 2002 (6 per cent) and 2010 (17 per cent).
R&D expenditure as a share of GDP—that is, R&D intensity—is used as an indicator that allows international comparisons to be made. By adjusting R&D investment for economy size, international comparisons can more readily be made. Changes in Australia’s R&D intensity over time show the emphasis Australia has placed on developing new knowledge and stimulating innovation.
Australia’s R&D intensity rose steadily from 0.9 per cent in 1981 to 2.2 per cent in 2010 (see Figure 5-2). The most rapid growth occurred between 1998 and 2008; since then R&D intensity has fallen slightly. The overall growth reflects an increased focus on R&D in the Australian economy.
In 2010 Australia’s R&D intensity ranked below that of many of the European and Asian comparator nations, but it was higher than Belgium, Singapore, Canada, the United Kingdom, China, Ireland and Norway (see Figure 5-3).
Figure 5-1 The contribution of selected countries to global expenditure on R&D, 2002 and 2010
403525151050 453020
Percentage of global GERD
2002 2010
New Zealand
Australia
IrelandNorway
SingaporeDenmark
FinlandBelgium
AustriaSwitzerland
Sweden
CanadaUnited Kingdom
FranceKorea
GermanyJapanChina
United States
Source: OECD Main Science and Technology Indicators, January 2014.
Figure 5-2 Australia’s R&D intensity, 1981 to 2010
GE
RD
as
per
cent
age
of
GD
P
2.5
2.0
1.5
1.0
0.5
0.02000 2005 20101980 1985 1990 1995
Year
Source: OECD Main Science and Technology Indicators, January 2014.
Figure 5-3 International R&D intensity, 2002 and 2010
3.52.51.51.00.50.0 4.03.02.0
GERD as percentage of GDP
2002 2010
Australia
NorwayIrelandChina
United KingdomCanada
SingaporeBelgium
FranceUnited States
AustriaGermany
SwitzerlandDenmark
JapanSweden
KoreaFinland
Notes: No data available for 2002 for Sweden—2004 figure given; no data available for 2002 or 2010 for Switzerland—2000 and 2008 figures given.
Source: OECD Main Science and Technology Indicators, January 2014.
Figure 5-4 HERD and STEM publication output
Rel
ativ
e sc
alin
g t
o y
ear
2000
2.2
1.6
1.4
1.2
1.0
0.8
2.2
2.2
2008 2010 20122000 2002 2004 2006
Year
$4.1b
$9.6b
29 000 publications
56 400 publications
Australian STEM publicationsHERD (2012 dollars)
Notes: HERD and publication data are expressed relative to the year 2000 and are given a value of 1. The blue line represents HERD expenditure (2012 dollars calculated as chain volume, data collected every two years); the yellow line shows the total publications produced in STEM fields (consistent with the Chapter 2 analysis).
Source: ABS (2013); InCites, Thomson Reuters (2012); Global Comparisons Dataset, compare subject areas in institutions (Australia totals), 2000–2012. Report created 10 March 2014; data processed 3 July 2013. Data from Web of Science.

3938 Chapter 5 BENCHMARKING AUSTRALIAN SCIENCE, TECHNOLOGY, ENGINEERING AND MATHEMATICS
As shown in Chapter 3, medicine was the largest field contributing to Australian publications in the global top 1 per cent of STEM publications, although every field of research contributes publications that are cited in the top 1 per cent of STEM publications.
It should be noted that medical research institutes are included in the higher education sector only if they are part of a university. As a result, only part of these institutes’ investment in medical and health sciences is included in this analysis of HERD, despite their publications and citations being included. If the funding associated with private medical research institutes was included, it would increase the total funding for medical and health sciences shown in Figure 5-6.
This analysis can be extended to reflect the indicative cost per publication, on average, during the period.
Information and computer sciences had the highest cost per publication and low average citation rates per publication compared with other fields (see Figure 5-7). The cost per publication in medical and health sciences is also high. This complements the data in Figure 5-6 and shows that the field has high amounts of expenditure resulting in high numbers of publications but also a high cost per publication. By contrast, physics and mathematics have lower costs per publication but higher citation rates.
This comparison is indicative of relative overall costs for research in STEM fields. It does not provide an account of the nature of these costs—for example, the spread between infrastructure, consumables and other costs, which can vary widely between fields.
5.8 THE COST OF AUSTRALIAN STEM R&D PUBLICATIONS
The indicative relationship between funding and research output can be explored by assessing research investment, publication output and citation rates for the various STEM fields.
Figure 5-6 shows HERD data for the STEM fields for 2008, 2010 and 2012 (the years for which the most recent data are available) compared with each field’s average field-weighted citation rate for 2009, 2011 and 2013. The differing periods of analysis for HERD and publication citation rates allow for the lag between when research expenditure and activity occur and when the outcomes of that research are published and begin to be cited. This lag can vary considerably between fields of research as well as within fields, depending on
the complexity and nature of the research. The one-year lag chosen here might be regarded as nominal for simple comparison purposes.
When compared with other fields, physics receives a relatively small investment in the higher education sector, but it achieves a high level of citations. Medical and health sciences receives the greatest investment and produces the largest number of publications, yet it receives fewer average citations than all but one of the STEM fields (information and computing technology), all of which receive a lower level of investment.
If a field (for example, medical and health sciences) has a relatively low average citation rate this might be a reflection of a large publication output, which typically reduces the average citation rate for the field.
Figure 5-5 Citation rates for Australian and selected European countries’ STEM publications, 2000 to 2012
Fiel
d-w
eig
hted
cit
atio
n ra
te 1.5
1.3
1.2
1.1
1.0
0.9
1.4
1.7
1.6
1.8
2008 2010 20122000 2002 2004 2006 2009 20112001 2003 2005 2007Year
United Kingdom
Switzerland
Sweden
NorwayIreland
Germany
France
Finland
Denmark
Belgium
Austria
Australia
Notes: STEM fields are selected using Australia ERA 2012 FoR Level 1 categories mathematical sciences, physical sciences, chemical sciences, earth sciences, environmental sciences, biological sciences, agricultural and veterinary sciences, information and computing sciences, engineering and technology, and medical and health science. Annual STEM citation rates are calculated as the simple average across these fields.
Source: Thomson Reuters (2012); Global Comparisons Dataset, compare subject areas, 2000–2012. Report created 9 October 2014; data processed 31 March 2014. Data from Web of Science.
Figure 5-6 Higher education R&D expenditure and publication citation rates, by field
1.61.51.41.31.21.11.00
Field-weighted citation rate (2009, 2011 and 2013)
HE
RD
$ m
illio
n (2
008,
201
0, 2
012
ag
gre
gat
ed)
7000
6000
5000
4000
3000
2000
1000
9000
8000
Mathematical Sciences
Physical Sciences
Chemical Sciences
Biological Sciences Engineering
EarthSciences
Agricultural and Veterinary Sciences
EnvironmentalSciences
Medical and Health Sciences
Technology
Information andComputing Sciences
Publications (x 10 000)20
10
Notes: Dollars per publication calculated using 2008, 2010 and 2012 HERD and 2009, 2011 and 2013 bibliometric data to account for the lag between funding and publication. Circle size represents the number of publications during the period.
Source: ABS (2013).
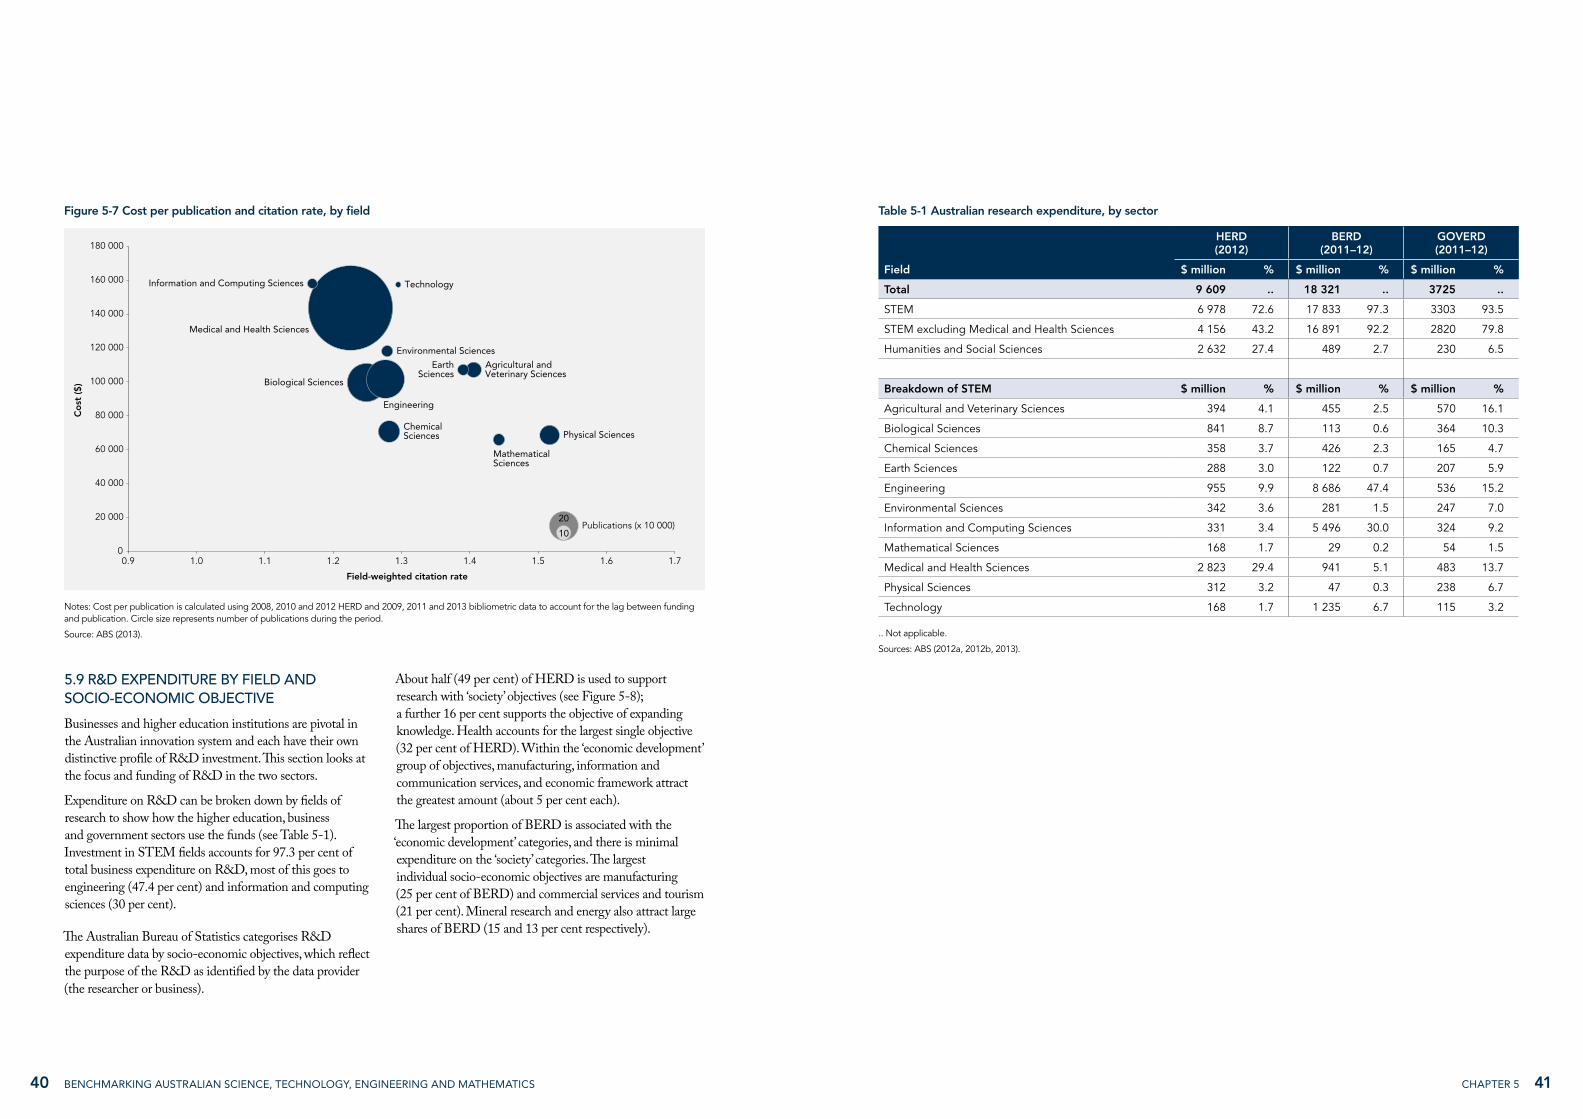
4140 Chapter 5 BENCHMARKING AUSTRALIAN SCIENCE, TECHNOLOGY, ENGINEERING AND MATHEMATICS
Table 5-1 Australian research expenditure, by sector
HERD (2012)
BERD (2011–12)
GOVERD (2011–12)
Field $ million % $ million % $ million %
Total 9 609 .. 18 321 .. 3725 ..
STEM 6 978 72.6 17 833 97.3 3303 93.5
STEM excluding Medical and Health Sciences 4 156 43.2 16 891 92.2 2820 79.8
Humanities and Social Sciences 2 632 27.4 489 2.7 230 6.5
Breakdown of STEM $ million % $ million % $ million %
Agricultural and Veterinary Sciences 394 4.1 455 2.5 570 16.1
Biological Sciences 841 8.7 113 0.6 364 10.3
Chemical Sciences 358 3.7 426 2.3 165 4.7
Earth Sciences 288 3.0 122 0.7 207 5.9
Engineering 955 9.9 8 686 47.4 536 15.2
Environmental Sciences 342 3.6 281 1.5 247 7.0
Information and Computing Sciences 331 3.4 5 496 30.0 324 9.2
Mathematical Sciences 168 1.7 29 0.2 54 1.5
Medical and Health Sciences 2 823 29.4 941 5.1 483 13.7
Physical Sciences 312 3.2 47 0.3 238 6.7
Technology 168 1.7 1 235 6.7 115 3.2
.. Not applicable.
Sources: ABS (2012a, 2012b, 2013).
5.9 R&D EXPENDITURE BY FIELD AND SOCIO-ECONOMIC OBJECTIVE
Businesses and higher education institutions are pivotal in the Australian innovation system and each have their own distinctive profile of R&D investment. This section looks at the focus and funding of R&D in the two sectors.
Expenditure on R&D can be broken down by fields of research to show how the higher education, business and government sectors use the funds (see Table 5-1). Investment in STEM fields accounts for 97.3 per cent of total business expenditure on R&D, most of this goes to engineering (47.4 per cent) and information and computing sciences (30 per cent).
The Australian Bureau of Statistics categorises R&D expenditure data by socio-economic objectives, which reflect the purpose of the R&D as identified by the data provider (the researcher or business).
About half (49 per cent) of HERD is used to support research with ‘society’ objectives (see Figure 5-8); a further 16 per cent supports the objective of expanding knowledge. Health accounts for the largest single objective (32 per cent of HERD). Within the ‘economic development’ group of objectives, manufacturing, information and communication services, and economic framework attract the greatest amount (about 5 per cent each).
The largest proportion of BERD is associated with the ‘economic development’ categories, and there is minimal expenditure on the ‘society’ categories. The largest individual socio-economic objectives are manufacturing (25 per cent of BERD) and commercial services and tourism (21 per cent). Mineral research and energy also attract large shares of BERD (15 and 13 per cent respectively).
Figure 5-7 Cost per publication and citation rate, by field
1.71.51.41.31.21.10.90
1.0 1.6
Field-weighted citation rate
Co
st ($
)
140 000
120 000
100 000
80 000
60 000
40 000
20 000
180 000
160 000
10
20Publications (x 10 000)
MathematicalSciences
Physical SciencesChemicalSciences
Biological Sciences
Engineering
EarthSciences
Agricultural andVeterinary Sciences
Environmental Sciences
Medical and Health Sciences
TechnologyInformation and Computing Sciences
Notes: Cost per publication is calculated using 2008, 2010 and 2012 HERD and 2009, 2011 and 2013 bibliometric data to account for the lag between funding and publication. Circle size represents number of publications during the period.
Source: ABS (2013).

4342 Chapter 5 BENCHMARKING AUSTRALIAN SCIENCE, TECHNOLOGY, ENGINEERING AND MATHEMATICS
5.10 R&D EXPENDITURE BY INDUSTRY SECTOR AND ACTIVITY TYPE
The largest industry sectors for BERD are the manufacturing and finance sectors, followed by the mining and scientific services sectors (see Figure 5-9). Experimental development is the largest type of R&D activity in these industry sectors, accounting for 62 per cent of BERD across all sectors. Applied research is the next most common type of activity, accounting for 32 per cent of total BERD.
HERD can also be classified by type of R&D activity (see Figure 5-10). Applied research dominates at 45 per cent; it is followed by pure basic research (23 per cent) and strategic basic research (24 per cent). In contrast with BERD, only a small amount of HERD (8 per cent) is associated with experimental development.
Both HERD and BERD have a strong focus on applied research. Businesses have the bigger focus on experimental development. Both strategic and pure research are important for higher education institutions, but neither is a focus in the business sector.
Figure 5-8 HERD and BERD, by socio-economic objective
Per
cent
age
60
50
40
30
20
10
0
100
90
80
70
HERD (2012) BERD (2011–12)
Society
Cultural understanding
Law, politics and community service
Education and training
Health
Expanding knowledge
Environment
Defence
Economic development
Economic framework
Commercial services and tourism
Information and comms services
Transport
Construction
Manufacturing
Energy
Mineral res. (excl. energy)
Animal prod. and prim. products
Plant prod. and prim. products
Sources: ABS (2012a, 2013).
Figure 5-9 Business expenditure on R&D by activity type, 2011–12
Education and Training
Public Administration and Safety
Accommodation and Food
Other
Health Care and Social Assistance
Arts and Recreation
Rental, Hiring and Real Estate
Agriculture, Forestry and Fishing
Retail Trade
Transport, Postal and Warehousing
Administrative and Support
Electricity, Gas, Water and Waste
Information Media and Telecommunications
Wholesale Trade
Construction
Professional, Scientific and Technical
Mining
Financial and Insurance
Manufacturing
Strategic basic research Pure basic researchExperimental development Applied research
300025002000150010000 500
$ million
Source: ABS (2012a).
Figure 5-10 Higher education expenditure on R&D, by activity type, 2012
3500 400025002000150010000 500 3000 4500
$ million
Experimental development
Strategic basic research
Pure basic research
Applied research
Source: ABS (2013).

4544 Chapter 5 BENCHMARKING AUSTRALIAN SCIENCE, TECHNOLOGY, ENGINEERING AND MATHEMATICS
5.12 SOURCES OF HERD FUNDING
HERD can be further analysed by looking at the source of funding (see Figure 5-13). The largest source of funds is general university funds, at 48 per cent; this is followed by competitive grants and other Commonwealth funding sources (14 per cent each).
Although business funds only a small proportion of HERD (4 per cent), this still amounted to $398 million in 2012. Business-funded HERD includes R&D grants from industry, payments for R&D projects carried out under contract on behalf of businesses, and funding from incorporated cooperative research centres.
This business funding of R&D activity in the higher education sector is small in comparison with total BERD ($18 billion in 2011–12) and reflects a low level of business–university collaboration (see Chapter 4). The investment of nearly $400 million is, however, by no means insignificant when compared with individual funding sources for the higher education sector. For example, in 2012–13 the Australian Research Council awarded a total of $529 million to 1168 new grants under the Discovery Program (ARC 2013).
5.13 FIELDS OF RESEARCH THAT ARE IMPORTANT TO INDUSTRY
In Australia the STEM fields account for the largest share of business R&D, attracting 96.8 per cent of BERD in 2010–11. Engineering and information technology attracted the largest shares, with $9.3 billion and $5 billion respectively.
So how do different industry sectors invest in engineering and IT, and what are the main research fields that attract R&D investment by different industry sectors?
5.13.1 Industries that use engineering
As the largest individual field of research underpinning Australian industry research, engineering is important to the innovation capacity of Australian business. The industry sectors with the largest investments in engineering R&D are the manufacturing and mining sectors, with $3.56 billion and $3.52 billion of BERD respectively in 2010–11 (see Figure 5-14). These two sectors contribute about 38 per cent of total BERD to engineering R&D. Construction and the professional, scientific and technical services industry sectors spend about $802 million (9 per cent of BERD) and $618 million (7 per cent of BERD) respectively. The utilities sector (electricity, gas, water and waste services) invests $295 million in engineering R&D. This shows that, although the large sectors of the Australian economy, such as manufacturing and mining, are the main players in engineering-based R&D, engineering is also an important field for other industry sectors.
5.11 HERD AND BERD BY EXPENDITURE CLASS
Examination of the allocation of expenditure to capital, labour and other areas offers insights into the R&D profiles of businesses and higher education institutions.
The largest higher education share of expenditure, 42 per cent, is associated with items such as materials, fuel, water, rent and others (other current expenditure, at
$4079 million—see Figure 5-11). Labour accounts for 41 per cent of HERD ($3890 million) and capital accounts for 11 per cent ($1031 million).
Figure 5-12 shows that capital attracts the smallest amount of R&D expenditure for most industry sectors. The mining sector is an exception, investing $563 million in capital in 2011–12. Labour costs represent a large component of BERD in the manufacturing, finance, and professional and scientific services sectors.
Figure 5-11 Higher education expenditure on R&D, by expenditure class, 2012
3500 400025002000150010000 500 3000 4500
2012 HERD $ million
Scholarships
Capital expenditure
Labour costs
Other current expenditure
Source: ABS (2013).
Figure 5-12 Business expenditure on R&D, by expenditure type, 2011–12
Total capital expenditureOther current expenditure Labour costs
300025002000150010000 500
$ million
Accommodation and Food
Public Administration and Safety
Education and Training
Other
Rental, Hiring and Real Estate
Arts and Recreation
Health Care and Social Assistance
Retail Trade
Administrative and Support
Agriculture, Forestry and Fishing
Transport, Postal and Warehousing
Electricity, Gas, Water and Waste
Wholesale Trade
Information Media and Telecomms
Construction
Financial and Insurance
Professional, Scientific and Tech
Manufacturing
Mining
Source: ABS (2012a).
Figure 5-13 Higher education expenditure on R&D, by source of funds, 2012
50004000300020000 1000 6000
$ million
Other AustralianOther schemes
Donations, bequests and foundationsOverseasBusiness
State and local governmentOther Commonwealth government
Commonwealth schemesAustralian competitive grants
General university funds
Source: ABS (2013).

4746 Chapter 5 BENCHMARKING AUSTRALIAN SCIENCE, TECHNOLOGY, ENGINEERING AND MATHEMATICS
large investments. The largest of the other fields of research is technology, with research based on technology done by professional, scientific and technical services ($249 million), information, media and telecommunications ($262 million) and manufacturing ($175 million). Six other industry sectors invest in technology-based R&D, totalling $208 million.
Medical and health sciences is the next largest category, with investment from three main industry sectors—scientific services ($299 million), wholesale trade ($224 million), and manufacturing ($175 million). Manufacturing invests more in agricultural R&D ($164 million) than the agriculture, fisheries and forestry sector ($146 million). Biology, chemistry, environmental sciences and earth sciences attract investment from a range of industry sectors, reflecting the fundamental nature of these fields. There are only small amounts of industry R&D investment in physics and mathematics. This could be a result of the way industry thinks about these fields, rather than an absence of R&D in these areas. For example, engineering and IT build on theoretical frameworks established in mathematics and physics. It is also not surprising that industry invests little in fields such as mathematics and physics, focusing instead on fields with more direct application, such as engineering and IT.
Collectively, these data show that the major industry sectors that perform large amounts of R&D rely on a broad range of fields.
5.14 FIELDS OF RESEARCH THAT ARE IMPORTANT TO MAJOR INDUSTRY SECTORS
Australian industry relies on a range of fields to support its R&D needs. But how does the R&D need of industry vary from sector to sector?
5.14.1 The manufacturing sector
The Australian manufacturing sector is the single largest business investor in R&D, spending $4.8 billion in 2010–11. This constitutes 52 per cent of total BERD. The largest single field for R&D investment by the manufacturing industry is engineering, at $3.56 billion. While this represents 76 per cent of total R&D expenditure by the manufacturing sector, there is a further $1.1 billion spread across multiple fields (see Figure 5-17). The second largest field of research is medical sciences, with $314 million; this is followed by information and computing sciences ($210 million). Technology, chemistry and agricultural sciences each have about $170 million of expenditure.
Information technologies represent the second largest field of research underpinning Australian BERD, attracting a total of $5 billion in 2010–11. The industry sector with the largest investment in IT R&D is financial and insurance services, with approximately $2.6 billion of expenditure in 2010–11 (see Figure 5-15). This sector accounts for 53 per cent of the total BERD directed to IT R&D. The industry sector with the second largest investment in IT R&D is professional, scientific and technical services, with over $1.1 billion of expenditure (22 per cent of total IT BERD). The information, media and telecommunications sector spends about $270 million,
while manufacturing spends $209 million on IT R&D. It is thus evident that, as with engineering, a range of Australian industry sectors invest in IT R&D.
5.13.2 Business use of other fields of research
As demonstrated in previous chapters, Australia has a broad range of research capability. While engineering and IT together account for 80 per cent of BERD, there is nevertheless $3.6 billion of industry research in other fields. Figure 5-16 shows the breakdown of investment in each field of research by industry sector. It excludes the fields of engineering and IT because of the distorting effect of these
Figure 5-14 Business expenditure on engineering R&D, by industry sector, 2010–11
4000300020000 1000
$ million
Retail TradeAgriculture, Forestry and Fishing
Other ServicesAdministrative and Support Services
Rental, Hiring and Real Estate ServicesFinancial and Insurance Services
Transport, Postal and WarehousingWholesale Trade
Electricity, Gas, Water and Waste ServicesProfessional, Scientific and Technical Services
ConstructionMining
Manufacturing
Source: ABS, Business expenditure on R&D [data available on request].
Figure 5-15 Business expenditure on IT R&D, by industry sector, 2010–11
2500200010000 30001500500
$ million
Electricity, Gas, Water and Waste ServicesOther Services
MiningConstruction
Rental, Hiring and Real Estate ServicesRetail Trade
Wholesale TradeTransport, Postal and Warehousing
Administrative and Support ServicesManufacturing
Information, Media and TelecommunicationsProfessional, Scientific and Technical Services
Financial and Insurance Services
Source: ABS, Business expenditure on R&D [data available on request].
Figure 5-16 Business expenditure on fields of research, by industry sector, 2010–11
6004002000 800300 700500 900100
$ million
Mathematical Sciences
Physical Sciences
Biological Sciences
Environmental Sciences
Earth Sciences
Chemical Sciences
Agricultural and Veterinary Sciences
Medical and Health Sciences
Technology
Agriculture, Forestry and Fishing
Mining
Manufacturing
Construction
Electricity, Gas, Water and Waste Services
Wholesale Trade
Transport, Postal and Warehousing
Information Media and Telecommunications
Financial and Insurance Services
Professional, Scientific and Technical Services
Note: Excludes engineering and information and computing sciences, the two dominant sectors, and industry categories with low R&D expenditure.
Source: ABS, Business expenditure on R&D [data available on request].

4948 Chapter 5 BENCHMARKING AUSTRALIAN SCIENCE, TECHNOLOGY, ENGINEERING AND MATHEMATICS
The professional, scientific and technical services sector is the fourth largest investor in R&D, with $2.7 billion in expenditure in 2010–11.2 The fields that attract the largest amounts of investment are again information and computing sciences ($1.1 billion) and engineering ($618 million). There is a wide distribution of the remaining scientific fields, with investment in almost all fields (see Figure 5-19).
5.15 CONCLUDING REMARKS
The business and higher education sectors occupy separate but partially connected parts of our innovation system. This reflects their different roles, priorities and research strengths.
Collaboration between Australian businesses and researchers in public sector institutions and universities is low by OECD standards (see Chapter 4).
The R&D profiles of the business and higher education sectors complement each other and overlap at a very low level and are differentiated at key stages of the innovation pipeline. Links exist because the developmental end of the innovation pipeline (occupied largely by business) depends on a supply of human capital and new knowledge from basic and applied research (the higher education end of the pipeline).
Altogether, this paints a picture of an R&D-intensive manufacturing sector that produces knowledge, goods and services by relying primarily on engineering R&D but also on the medical, agricultural, chemical and technology fields, as well as fundamental fields.
5.14.2 The mining sector
The mining sector is the second largest R&D investor, with over $3.8 billion in expenditure in 2010–11. Again, the field that attracts the largest investment is engineering, accounting for $3.5 billion. A further $313 million in investment is spread across earth sciences ($118 million), environmental sciences ($71 million), built environment and design ($40 million), information and computing sciences ($40 million) and chemical sciences ($26 million) (see Figure 5-18).
This is a similar profile to that for the manufacturing sector, with a large amount of R&D investment directed primarily to engineering and investment in a range of other scientific fields.
5.14.3 The professional, scientific and technical services sector
Businesses in the professional, scientific and technical services sector are typically specialised and sell their expertise. In most cases, equipment and materials are not major inputs (ABS 2006). The activities involved generally require a high level of training and formal (usually tertiary-level) qualifications. These services include scientific research, architecture, engineering, computer systems design, law, accountancy, advertising, market research, management and other consultancy, and veterinary science (ABS 2006).
Figure 5-17 Manufacturing sector expenditure on R&D, by field, 2010–11
3002000 100 400
$ million
Mathematical SciencesEarth Sciences
Physical SciencesBiological Sciences
Environmental SciencesBuilt Environment and Design
Agricultural and Veterinary SciencesChemical Sciences
TechnologyInformation and Computing Sciences
Medical and Health Sciences
Note: Not shown is investment in engineering R&D by the manufacturing sector ($3.56 billion).
Source: ABS, Business expenditure on R&D [data available on request].
Figure 5-18 Mining sector expenditure on R&D, by field, 2010–11
120800 40 1006020 140
$ million
Agricultural and Veterinary SciencesTechnology
Chemical SciencesInformation and Computing Sciences
Built Environment and DesignEnvironmental Sciences
Earth Sciences
Note: Not shown is investment in engineering R&D by the mining sector ($3.5 billion).
Source: ABS, Business expenditure on R&D [data available on request].
Figure 5-19 Professional, scientific and technical services expenditure on R&D, by field, 2010–11
8004000 200 1000600 1200
$ million
Mathematical SciencesPhysical Sciences
Biological SciencesChemical Sciences
Environmental SciencesEarth Sciences
Built Environment and DesignAgricultural and Veterinary Sciences
TechnologyMedical and Health Sciences
EngineeringInformation and Computing Sciences
Source: ABS, Business expenditure on R&D [data available on request].
2 The financial services sector is the third largest investor in business R&D, accounting for $2.77 billion in expenditure, which is almost solely focused on information sciences (over 95 per cent of the sector’s R&D).

50 BENCHMARKING AUSTRALIAN SCIENCE, TECHNOLOGY, ENGINEERING AND MATHEMATICS
CHAPTER 6

53Chapter 6 52 BENCHMARKING AUSTRALIAN SCIENCE, TECHNOLOGY, ENGINEERING AND MATHEMATICS
6. INTERNATIONAL COLLABORATION
In Chapter 2 bibliometric analysis is used to benchmark research performance; this tool can also be applied to measuring the outcome of research collaboration. It is, however, important to recognise that the citation rate is but one element in assessment of the productivity of collaboration (Matthews et al. 2009).
6.3 DATA SOURCES
This chapter uses the same data sets as used for Chapters 2 and 3—InCites, Thomson Reuters 2002 to 2012, and Scopus. The data were extracted from the InCites database between January and March 2014. The biomedical and clinical health sciences field cluster is extracted from the broader medical and health sciences data and analysed separately because of its large size as a field (based on total number of publications), which could skew the overall result. The BCH field cluster was defined and evaluated by the Excellence in Research for Australia initiative in 2010. Appendix A provides details.
6.4 COUNTRIES ANALYSED
As in previous chapters, two groups of benchmarking nations were identified for analysis—countries at stages of development similar to that of Australia and with similar governance systems (the United States, Canada and selected European nations) and selected countries in the Asia–Pacific region.
Australia is compared with the European comparator nations (Austria, Belgium, Denmark, Finland, France, Germany, Ireland, Norway, Sweden, Switzerland and the United Kingdom), North America (Canada and the United States) and countries from the Asia–Pacific region (New Zealand and China, India, Indonesia, Japan, Malaysia, the Philippines, Singapore, South Korea, Thailand and Vietnam).
6.5 DATA ANALYSIS
To investigate whether there is an association between international collaboration and research performance, the number of and field-weighted citation rates for Australian publications with or without international co-authors were compared with those for other countries.
6.5.1 The trend in Australian STEM publications with international co-authorship
From 2002 to 2012 the number of Australian STEM publications written with one or more international co-authors rose from 9395 to 21 907, a 133 per cent increase (see Figure 6-1); this compares with an increase from 21 358 to 38 609 (81 per cent) in the total number of Australian STEM publications.
The proportion of Australia’s total STEM publications with international co-authorship is increasing. Between 2002 and 2012 it rose from 45 to 57 per cent (see Table 6-1), showing that international collaboration is playing an increasingly important role in Australian STEM research.
This chapter explores Australia’s collaboration with international researchers in connection with STEM publications. It uses the number of and citation rates for publications to assess trends in STEM publications co-authored by Australian researchers and their international colleagues.
6.1 MAIN FINDINGS
` On average, co-authorship with international partners produced publications with higher citation rates than the average for STEM publications from Australia, and most of the comparator countries.
` The proportion of all Australian STEM publications with an international co-author increased between 2002 and 2012 but not as much as was the case in most of the comparator countries.
` Each European comparator country has a greater proportion of total STEM publications with an international co-author than Australia.
` With the exception of the United States, India and China, in all the countries considered more than 50 per cent of their top 1 per cent of highly cited publications in natural science and engineering in 2010 to 2012 was with an international co-author.
` In general, international collaboration correlates with higher citation rates for publications in biomedical and clinical health, Australia’s largest research field, compared with the average of all STEM publications for all countries.
6.2 BACKGROUND
Australia has long sought and benefited from access to leading researchers and research facilities overseas. Our size and geography pose challenges that leading research nations in, say, the European Union do not face, but they also offer a greater opportunity to collaborate with countries in our region—for example, through existing bilateral research agreements with China and India (Department of Industry n.d.).
International collaboration in STEM can occur at a number of levels, from collaboration between individuals to joint research projects, sharing research infrastructure, opening access to research data and linking research centres and potentially virtual networks (AUCC 2009). It enables researchers to work with other people in their field and participate in networks focused on cutting-edge activity (Adams et al. 2007). Science has always been international, but the rate of its internationalisation has accelerated in recent decades (Wissenschaftsrat 2010). Suggested reasons for the increase in international collaboration are increased research costs, especially in areas requiring specialised equipment or infrastructure, and the global nature of challenges such as climate change and pandemics.
Among the benefits of international collaboration in research are expanding researchers’ capacity to respond to complex problems by drawing on diverse skills and perspectives (National Science Foundation 2014), reducing unnecessary duplication of research effort, and broadening the scale and scope of research teams (Matthews et al. 2009). An important question then arises: is it possible to measure and benchmark the benefits of international collaboration?
Table 6-1 Proportion of total Australian STEM publications with international co-authorship, 2002 to 2012
Year Per cent
2002 45
2003 44
2004 45
2005 46
2006 46
2007 48
2008 50
2009 51
2010 53
2011 55
2012 57
Notes: Total and internationally collaborative publication counts are Web of Science documents classified as article, note or review, by year of publication and assigned to an Australian institution based on the institutional address(es) listed in the publication.
STEM fields were selected using Australia ERA 2012 ERA FoR Level 1 categories mathematical sciences, physical sciences, chemical sciences, earth sciences, environmental sciences, biological sciences, agricultural and veterinary sciences, information and computing sciences, engineering, and technology. Medical and health science excluded.
Source: InCites, Thomson Reuters (2012). Global Comparisons Dataset, Compare Subject Areas in Institution (Australia Totals), 2002–2012. Report created 26 February 2014; data processed 3 July 2013. Data from Web of Science.

5554 Chapter 6 BENCHMARKING AUSTRALIAN SCIENCE, TECHNOLOGY, ENGINEERING AND MATHEMATICS
6.5.3 International co-authorship in Australia compared with other countries
From 2002 to 2012 an average of 50 per cent of Australia’s STEM publications were produced with an international co-author (see Figure 6-3). The countries placed to the left of Australia in Figure 6-3 produced a greater proportion of their total STEM publications with international co-authors; those to the right had a smaller proportion.
Compared with Australia, all the European comparator countries have a greater proportion of their total STEM publications with an international co-author. This is possibly a result of the countries’ geographical proximity, facilitating cross-border collaboration, and also programs that encourage international, institutional and individual research collaboration such as the EU Framework Programme for Research and Innovation (European Commission 2014). The international shares of total STEM publications for the
United Kingdom, Germany and France are not much higher than that for Australia (53, 54 and 55 per cent respectively), but those countries have a greater number of publications (indicated by larger circles in Figure 6-3).
Indonesia and Vietnam rely on international co-authorship for the bulk of their STEM publications. Their share of total STEM publications with international co-authorship exceeds 80 per cent. Each of these countries has a smaller number of total STEM publications than Australia.
Of the countries analysed here, Malaysia, Canada, the United States, South Korea, Japan, China and India have a lower share of internationally co-authored publications compared with Australia.
The United States and China have the largest total numbers of collaborative publications, but their shares of total STEM publications that are internationally co-authored are lower than that for Australia. One argument for this is that these
6.5.2 International co-authorship and citation rates for Australia’s STEM publications
Relative to the world average, field-weighted citations for all Australian STEM publications have increased from 1.1 in 2002 to 1.4 in 2012 (see Figure 6-2). In this chapter international research collaboration is assessed by analysing the subset of publications that are co-authored by researchers affiliated with an Australian institution and an international institution. The citation rate for Australian STEM publications with international co-authorship has risen from 1.3 in 2002 to 1.6 in 2012 and has been consistently higher than that for total STEM publications.
While the correlation between international collaboration and the citation rate is clear, it is difficult to determine whether this is a causative relationship. It is difficult to distinguish the ‘scale’ effect from the ‘international’ effect: higher citation performance could be largely due to ‘big science’ projects making use of unique cutting-edge research facilities (for example, the CERN Large Hadron Collider) rather than to international collaboration per se (Mark Matthews, ANU, pers. comm., 21 May 2014).
Figure 6-1 Australian STEM publications: total and those with international co-authorship, 2002 to 2012
21 358
Australian publications38 609
9 395
Publications with foreignco-authorship21 907
Num
ber
of
pub
licat
ions
30 000
20 000
15 000
10 000
5 000
0
25 000
35 000
40 000
2008 2010 20122002 2004 2006 2009 20112003 2005 2007Year
Notes: Publication counts are Web of Science documents classified as article, note or review (proceedings papers are excluded unless they are also classified as articles in Web of Science). Documents are classified by year of publication and are assigned to an Australian institution based on the institutional address(es) listed in the publication. STEM fields were selected using Australia ERA 2012 FoR Level 1 categories mathematical sciences, physical sciences, chemical sciences, earth sciences, environmental sciences, biological sciences, agricultural and veterinary sciences, information and computing sciences, engineering, and technology. Medical and health science excluded.
Source: InCites, Thomson Reuters (2012). Global Comparisons Dataset, Compare Subject Areas in Institution (Australia Totals), 2002–2012. Report created 26 February 2014; data processed 3 July 2013. Data from Web of Science.
Figure 6-2 Field-weighted citation rate for all Australian STEM publications and those with international co-authorship, 2002 to 2012
Publications withforeign co-author
World average
All publications
Fiel
d-w
eig
hted
cit
atio
n ra
te 1.4
0.8
0.6
0.4
0.2
0.0
1.0
1.8
1.2
1.6
2.0
2008 2010 20122002 2004 2006 2009 20112003 2005 2007Year
Notes: Citation rates (field-weighted) are based on Web of Science publications classified as article, note or review by year of publication and assigned to an Australian institution based on the institutional address(es) listed in the publication. STEM fields were selected using Australia ERA 2012 ERA FoR Level 1 categories mathematical sciences, physical sciences, chemical sciences, earth sciences, environmental sciences, biological sciences, agricultural and veterinary sciences, information and computing sciences, engineering, and technology. Medical and health science excluded.
Source: InCites, Thomson Reuters (2012). Global Comparisons Dataset, Compare Subject Areas in Institution (Australia Totals), 2002–2012. Report created 26 February 2014; data processed 3 July 2013. Data from Web of Science.

5756 Chapter 6 BENCHMARKING AUSTRALIAN SCIENCE, TECHNOLOGY, ENGINEERING AND MATHEMATICS
countries do not need to collaborate with international partners simply because of the scale of their domestic research capability. The National Science Foundation (2014) has reported that from 2000 to 2012 the share of domestically co-authored United States publications increased from 21 to 41 per cent.
6.5.4 The difference between average citation rates for all STEM publications and the internationally co-authored subset
Co-authorship with international partners is positively associated with an increase in citation rates (averaged for the period 2002 to 2012) for most of the countries examined. Apart from the United States, the subset of internationally co-authored STEM publications was consistently cited
more than the total STEM publications for any country (see Figure 6-4 and Table 6-2). One interpretation of this is that international collaboration is a feature of more frequently cited work. The cause and effect relationship is unclear, but some highly cited research certainly uses a collaborative approach.
The impact of international collaboration on citation rates is not uniform for the countries analysed. Australia’s collaborative publications are cited at a rate 13 per cent higher than the average for all STEM publications. This is around the median increase for all the comparator countries (see Table 6-2). Publications from India, China, Japan, South Korea and Thailand benefit most from international collaboration: their internationally co-authored publications received citation rates over
Figure 6-3 Proportion and number of internationally co-authored STEM publications, 2002 to 2012
0
Per
cent
age
80
70
60
50
40
30
20
10
100
90 Ind
one
sia
Vie
tnam
Swit
zerl
and
Aus
tria
Den
mar
k
Bel
giu
m
No
rway
Swed
en
New
Zea
land
Thai
land
Fran
ce
Ger
man
y
Uni
ted
Kin
gd
om
Sing
apo
re
Finl
and
Irel
and
Aus
tral
ia
Mal
aysi
a
Can
ada
Uni
ted
Sta
tes
Sout
h K
ore
a
Jap
an
Chi
na
Ind
ia
1.00.5
Publications (million)
Notes: Total and internationally collaborative publication counts are Web of Science documents classified as article, note or review by year of publication and assigned to an Australian institution based on the institutional address(es) listed in the publication. STEM fields were selected using Australia ERA 2012 ERA FoR Level 1 categories mathematical sciences, physical sciences, chemical sciences, earth sciences, environmental sciences, biological sciences, agricultural and veterinary sciences, information and computing sciences, engineering, and technology. Medical and health science excluded.
Source: InCites, Thomson Reuters (2012). Global Comparisons Dataset, Compare Subject Areas in Institution (Australia Totals), 2002–2012. Report created 10 March 2014; data processed 3 July 2013. Data from Web of Science.
Figure 6-4 Field-weighted citation rates for STEM publications with or without international co-authorship, 2002 to 2012
0.0
Fiel
d-w
eig
hted
cit
atio
n ra
te
1.6
1.4
1.2
1.0
0.8
0.6
0.4
0.2
2.0
1.8
Swit
zerl
and
Uni
ted
Sta
tes
Den
mar
k
Uni
ted
Kin
gd
om
Swed
en
Ger
man
y
Bel
giu
m
Aus
tria
Finl
and
Fran
ce
No
rway
Can
ada
Irel
and
Aus
tral
ia
Sing
apo
re
New
Zea
land
Jap
an
Sout
h K
ore
a
Chi
na
Thai
land
Ind
ia
Ind
one
sia
Vie
tnam
Mal
aysi
a
1.5
1.00.5
Publications (million)
International co-authorTotal STEM
Notes: Total and internationally collaborative publication counts are Web of Science documents classified as article, note or review by year of publication and assigned to an Australian institution based on the institutional address(es) listed in the publication. STEM fields were selected using Australia ERA 2012 ERA FoR Level 1 categories mathematical sciences, physical sciences, chemical sciences, earth sciences, environmental sciences, biological sciences, agricultural and veterinary sciences, information and computing sciences, engineering, and technology. Medical and health science excluded.
Source: InCites, Thomson Reuters (2012). Global Comparisons Dataset, Compare Subject Areas in Institutions (Australia Totals), 2002–2012. Report created 10 March 2014; data processed 3 July 2013. Data from Web of Science.
Table 6-2 Percentage difference between field-weighted citation rates of total STEM publications and the internationally co-authored subset, 2002 to 2012
Citation rate Citation rate
Country TotalForeign
co-author Diff. (%) Country TotalForeign
co-author Diff. (%)
India 0.64 0.89 39 Malaysia 0.50 0.55 12
China 0.70 0.92 33 Vietnam 0.54 0.59 10
Japan 0.92 1.17 27 France 1.17 1.28 9
South Korea 0.70 0.89 27 Germany 1.27 1.37 8
Thailand 0.66 0.79 20 Austria 1.19 1.29 8
Ireland 1.14 1.32 16 Belgium 1.23 1.31 7
Finland 1.18 1.33 13 Indonesia 0.63 0.67 7
Australia 1.12 1.27 13 Denmark 1.42 1.57 6
Sweden 1.32 1.48 12 United Kingdom 1.36 1.44 6
Canada 1.16 1.30 12 Switzerland 1.60 1.64 2
New Zealand 1.04 1.17 12 Singapore 1.10 1.12 1
Norway 1.16 1.30 12 United States 1.44 1.45 0

5958 Chapter 6 BENCHMARKING AUSTRALIAN SCIENCE, TECHNOLOGY, ENGINEERING AND MATHEMATICS
6.5.6 The proportion of biomedical and clinical health publications with international co-authorship
Biomedical and clinical health is the largest field in Australian STEM. In 2002 to 2012 it contributed an average of 37 per cent of total STEM research publications, and it is useful to examine it separately.
The pattern of international collaboration for each nation in BCH (see Figure 6-6) is similar to that for all STEM fields (as shown in Figure 6-3). Compared with Australia, the relatively less populous European nations have a greater proportion of BCH publications that are internationally co-authored. France, the United Kingdom and Germany have a similar level of international collaboration to Australia but a greater overall number of publications. The United States has the greatest number of internationally co-authored publications in BCH but a small proportion of the total BCH publications that are internationally co-authored.
25 per cent higher than their total STEM publications in 2002 to 2012. By contrast, the United States does not achieve higher citation rates for its subset of internationally collaborative publications.
6.5.5 Proportion of top 1 per cent of citations in natural science and engineering with international co-authorship
As shown in Figure 3-1, from 2010 to 2012 Australia had a greater share of the world’s highly cited publications (top 1 per cent) in natural science and engineering than many of the European comparator countries. This observation raises several questions:
` How important was international collaboration in achieving this?
` Has the influence of international co-authorship on high citation rates remained consistent over time?
` Is international collaboration necessary for top-cited research?
International co-authorship is a feature of highly cited publications for Australia and most of the comparator countries. With the exception of the United States, India and China, for all the countries considered more than 50 per cent of their highly cited publications in natural science and engineering published in 2010 to 2012 were produced through international collaboration (see Figure 6-5).
During 2004 to 2006, 65 per cent of Australia’s highly cited natural science and engineering publications had an international co-author; the proportion was 66 per cent in 2010 to 2012—the smallest increase among the comparator countries. By contrast, the United Kingdom’s share of highly cited natural science and engineering publications with international co-authorship rose from 57 to 69 per cent, that of the United States from 32 to 41 per cent, and that of Japan from 47 to 56 per cent.
The size of the circles in Figure 6-5 shows the number of highly cited publications for each period. A marked trend that is evident between the two periods is the increase in highly cited publications for all countries.
Figure 6-5 Proportion of internationally co-authored publications in the top 1 per cent of citations in natural science and engineering, 2004 to 2006 and 2010 to 2012
0
Per
cent
age
80
70
60
50
40
30
20
10
100
90
2010–20122004–2006
Publications (x 1000)105A
ustr
ia
Finl
and
Swit
zerl
and
Bel
giu
m
Swed
en
No
rway
Irel
and
Den
mar
k
New
Zea
land
Fran
ce
Ger
man
y
Can
ada
Uni
ted
Kin
gd
om
Aus
tral
ia
Jap
an
Ko
rea
Ind
ia Uni
ted
Sta
tes
Chi
na
Notes: Counts refer to natural science and engineering publications with international co-authorship.
Source: Department of Industry special data request from Thomson Reuters (2012).
Figure 6-6 Proportion of internationally co-authored publications in biomedical and clinical health, 2002 to 2012
0
Per
cent
age
80
70
60
50
40
30
20
10
100
90
Vie
tnam
Ind
one
sia
Swit
zerl
and
Bel
giu
m
Thai
land
Aus
tria
Sing
apo
re
Swed
en
New
Zea
land
Den
mar
k
Mal
aysi
a
Finl
and
Can
ada
Aus
tral
ia
Uni
ted
Kin
gd
om
Ger
man
y
Fran
ce
Irel
and
Chi
na
Uni
ted
Sta
tes
Sout
h K
ore
a
Jap
an
Ind
ia
Publications (x 100 000)31
No
rway
Notes: Publication counts are Web of Science documents classified as article, note or review, by year of publication and assigned to an Australian institution based on institutional address(es) listed in the publication. BCH fields were selected using Australia ERA 2012 FoR Level 2 categories medical biochemistry and metabolomics, cardiovascular medicine and haematology, clinical sciences, dentistry, immunology, medical microbiology, neurosciences, oncology and carcinogenesis, ophthalmology and optometry, paediatrics and reproductive medicine, pharmacology and pharmaceutical sciences, and medical physiology.
Source: InCites, Thomson Reuters (2012). Global Comparisons Dataset, Compare Subject Areas in Institutions (Australia Totals), 2002–2012. Report created 10 and 20 March 2014; data processed 3 July 2013. Data from Web of Science.

6160 Chapter 6 BENCHMARKING AUSTRALIAN SCIENCE, TECHNOLOGY, ENGINEERING AND MATHEMATICS
6.6 CONCLUDING REMARKS
Australia derives value from international collaboration in STEM research. This collaboration is an important component of Australia’s highly cited STEM research publications and is linked to considerations of ‘foreign policy, trade, industry competitiveness and international cooperation on key global issues’ (Matthews et al. 2010).
Australia has moderate levels of international collaboration when compared with the other countries analysed in this report. It does, however, produce a higher proportion of internationally co-authored STEM publications than large countries such as the United States and China, which might benefit from the sheer scale of domestic endeavour rather than international collaboration.
Competition for international partners in STEM is increasing throughout the world. The number of internationally co-authored STEM publications produced by other countries is rising at a rate faster than in Australia.
Other countries are recognising the importance of international collaboration, so it will be important for Australia—as a geographically isolated country, but within the dynamic Asia–Pacific region—to continue attracting international partners in STEM research.
Figure 6-7 Field-weighted citation rates: all biomedical and clinical health publications and the internationally co-authored subset, 2002 to 2012
0.0
Fiel
d-w
eig
hted
cit
atio
n ra
te
1.6
1.4
1.2
1.0
0.8
0.6
0.4
0.2
2.0
1.8
BCH publications with international collaborationTotal BCH publications
Publications (x 100 000)31
Swit
zerl
and
Uni
ted
Sta
tes
Bel
giu
m
Swed
en
Ger
man
y
Aus
tria
Irel
and
Finl
and
Irel
and
Uni
ted
Kin
gd
om
Can
ada
Fran
ce
No
rway
Aus
tral
ia
New
Zea
land
Sing
apo
re
Jap
an
Vie
tnam
Thai
land
Sout
h K
ore
a
Chi
na
Ind
one
sia
Ind
ia
Mal
aysi
aNotes: Total and internationally collaborative publication counts are Web of Science documents classified as article, note or review by year of publication and assigned to an Australian institution based on the institutional address(es) listed in the publication. BCH fields were selected using Australia ERA 2012 ERA FoR Level 2 categories medical biochemistry and metabolomics, cardiovascular medicine and haematology, clinical sciences, dentistry, immunology, medical microbiology, neurosciences, oncology and carcinogenesis, ophthalmology and optometry, paediatrics and reproductive medicine, pharmacology and pharmaceutical sciences, and medical physiology.
Source: InCites, Thomson Reuters (2012). Global Comparisons Dataset, Compare Subject Areas in Institutions (Australia Totals), 2002–2012. Report created 20 March 2014; data processed 3 July 2013. Data from Web of Science.
Table 6-3 Percentage difference between field-weighted citation rates for all BCH publications and the internationally co-authored subset, 2002 to 2012
Citation rate Citation rate
Country TotalForeign
co-author Diff. (%) Country TotalForeign
co-author Diff. (%)
South Korea 0.69 1.00 45 United Kingdom 1.15 1.34 16
India 0.49 0.71 44 New Zealand 0.98 1.13 16
Japan 0.89 1.24 40 Finland 1.17 1.35 15
China 0.65 0.89 37 Belgium 1.27 1.45 14
Malaysia 0.48 0.64 33 Sweden 1.21 1.37 13
Thailand 0.71 0.93 32 Austria 1.18 1.33 12
France 1.14 1.40 23 Denmark 1.18 1.33 12
Ireland 1.15 1.37 19 Singapore 0.96 1.05 9
Norway 1.12 1.32 18 Switzerland 1.35 1.44 7
Germany 1.19 1.39 17 United States 1.30 1.38 6
Canada 1.15 1.34 17 Indonesia 0.64 0.67 6
Australia 1.11 1.30 17 Vietnam 0.71 0.73 2
6.5.7 The effect of international co-authorship on citation rates for biomedical and clinical health publications for comparator countries
BCH publications with international co-authorship are consistently more highly cited for all the comparator countries (see Figure 6-7). International collaboration has a more positive influence on BCH publications than on STEM publications in general (compare Table 6-2 and Table 6-3). All the comparator countries have higher average citation rates for internationally co-authored BCH publications. Even the United States, which showed no increase in citation rate associated with international collaboration for all STEM publications, shows a higher rate of citations for internationally co-authored BCH publications.

62 BENCHMARKING AUSTRALIAN SCIENCE, TECHNOLOGY, ENGINEERING AND MATHEMATICS
CHAPTER 7

65Chapter 7 64 BENCHMARKING AUSTRALIAN SCIENCE, TECHNOLOGY, ENGINEERING AND MATHEMATICS
research constitutes the majority of research in Australia and the world, it is valid to analyse all researchers (Thomson Reuters 2013).
A summary of characteristics of the Australian STEM workforce is at Appendix B.
7.3.2 The World Economic Forum global competitiveness report
The World Economic Forum global competitiveness report assesses the productivity and prosperity of 148 economies. Data on the perceived availability of scientists and engineers were collected in the forum’s Executive Opinion Survey, conducted in Australia by the Australian Industry Group. Two editions of the global competitiveness report were consulted, 2006–07 and 2013–14.
7.3.3 The Department of Immigration and Border Protection
The Department of Immigration and Border Protection compiles statistics on holders of Temporary Work (Skilled) visas (subclass 457) from the visa application and grant process. The applicant and their business sponsor provide a range of information to enable the department to assess the eligibility of the sponsor and the applicant for the visa. The data include information such as the location of the nominated position, the nominated occupation, the nominated base salary, and the country of citizenship for applicants.
7.4 COUNTRIES ANALYSED
As in previous chapters, two groups of benchmarking nations were identified for analysis—countries at stages of development similar to that of Australia and with similar governance systems (the United States, Canada and selected European nations) and selected countries in the Asia–Pacific region.
This chapter generally includes analysis of the European comparator nations (Austria, Belgium, Denmark, Finland, France, Germany, Ireland, Norway, Sweden, Switzerland and the United Kingdom) and comparator nations from our region (China, Japan, New Zealand, Singapore and South Korea). Additionally, data on the perceived availability of scientists and engineers are provided for India, Indonesia, Malaysia, the Philippines, Thailand and Vietnam.
7.5 THE RESEARCH WORKFORCE
7.5.1 Characteristics of the Australian research workforce relative to the research workforce in other countries
A productive research workforce is essential for innovative research and development. By comparing the research workforce over time, we can understand how Australia’s research capacity has changed. As an indicator of research capacity, the number of researchers in Australia can be compared with the number in other countries.
Worldwide, 86 per cent of research publications from 2002 to 2012 were in STEM fields. In Australia the figure was 79 per cent. Since there is no standard indicator associated with STEM researchers specifically, all researchers are analysed instead. As noted, in view of the predominance of STEM research in Australia and the world, it is reasonable to assess total researchers as representative of STEM researchers.
Australia’s research workforce grew from 62 865 in 1998 to 92 649 in 2008 (see Figure 7-1), an increase of 47 per cent. This is a higher rate of growth than in the United States (27 per cent), France (46 per cent) and Germany (27 per cent)—see Table 7-1. The Chinese research workforce grew the most during the period, from 485 500 to 1 592 420, or by 228 per cent. In absolute terms China now outstrips the United States, which previously had the largest research workforce.
7.5.2 Links between the research workforce and the number of research publications
The rapid growth in China’s research workforce from 2002 to 2012 corresponds with the growth in China’s STEM publications (see Chapter 2). The citation rates for China’s aggregate publication output were, however, below the world average during the period (Figure 2-3). The United States had the second largest workforce in 2008 and produced the second largest number of STEM publications between 2002 and 2012. All the US research fields received citation rates above the EU15 (Figure 2-2).
This chapter reviews the characteristics of the Australian STEM research workforce and compares them with those of other countries. In particular, it looks at the following:
` the size of Australia’s research workforce—in absolute numbers and as a share of the total workforce
` the perceived supply and availability of STEM-skilled professionals and the extent to which any shortfalls are met temporarily by skilled overseas workers
` Incorporation of STEM-skilled professionals in the workforce—employment of domestic graduates and skilled overseas workers.
7.1 MAIN FINDINGS
` From 1998 to 2008 Australia’s research workforce grew in absolute terms, adding almost 30 000 researchers, and in its share of employment, increasing from 7.3 to 8.5 researchers per 1000 in the workforce.
` At 32 per cent, Australia has the lowest proportion of researchers employed in business relative to the comparator countries.
` In Australia the higher education sector employs the largest share of researchers—60 per cent, second only to the United Kingdom among comparator countries.
` The perceived availability of scientists and engineers declined between 2006 and 2013 in Australia, as it did in all comparator countries other than China.
` The number of skilled overseas workers recruited to Australia through Temporary Work (Skilled) visas (subclass 457) in the professional, scientific and technical field increased from 30 in 2008 to 5690 in 2012.
7.2 BACKGROUND
The capacity of a nation’s research workforce determines the skills, knowledge and capabilities to generate innovation and promote economic activity (OECD 2011b). Workers with STEM expertise not only advance basic scientific knowledge but also use this knowledge to design and manufacture new goods and services. As the pace of social and technological change increases, these skills will become increasingly important. STEM researchers, therefore, are crucial to Australia’s research effort.
7.3 DATA SOURCES
7.3.1 The OECD Main Science and Technology Indicators database
The workforce data used in this chapter were extracted from the OECD’s Main Science and Technology Indicators database, MSTI. The database contains 151 main data series selected from the OECD’s Scientific and Technological Indicators database for 30 OECD member countries and nine non-member countries. It provides a set of indicators that reflect the level and structure of the research effort in the field of science and technology from 1981 onwards.
Research workforce data have not been collected in Australia since 2008. To provide information about the development of the Australian research workforce, data from 1998 to 2008 are compared with data from comparator countries for the same period. These data include all researchers, including those in social science and the humanities. It would be preferable to compare data on the STEM research workforce only, but it is difficult to determine whether researchers are working in STEM fields because of the varying workforce classification schemes used in comparator countries. As a consequence, and since STEM
7. THE STEM WORKFORCE
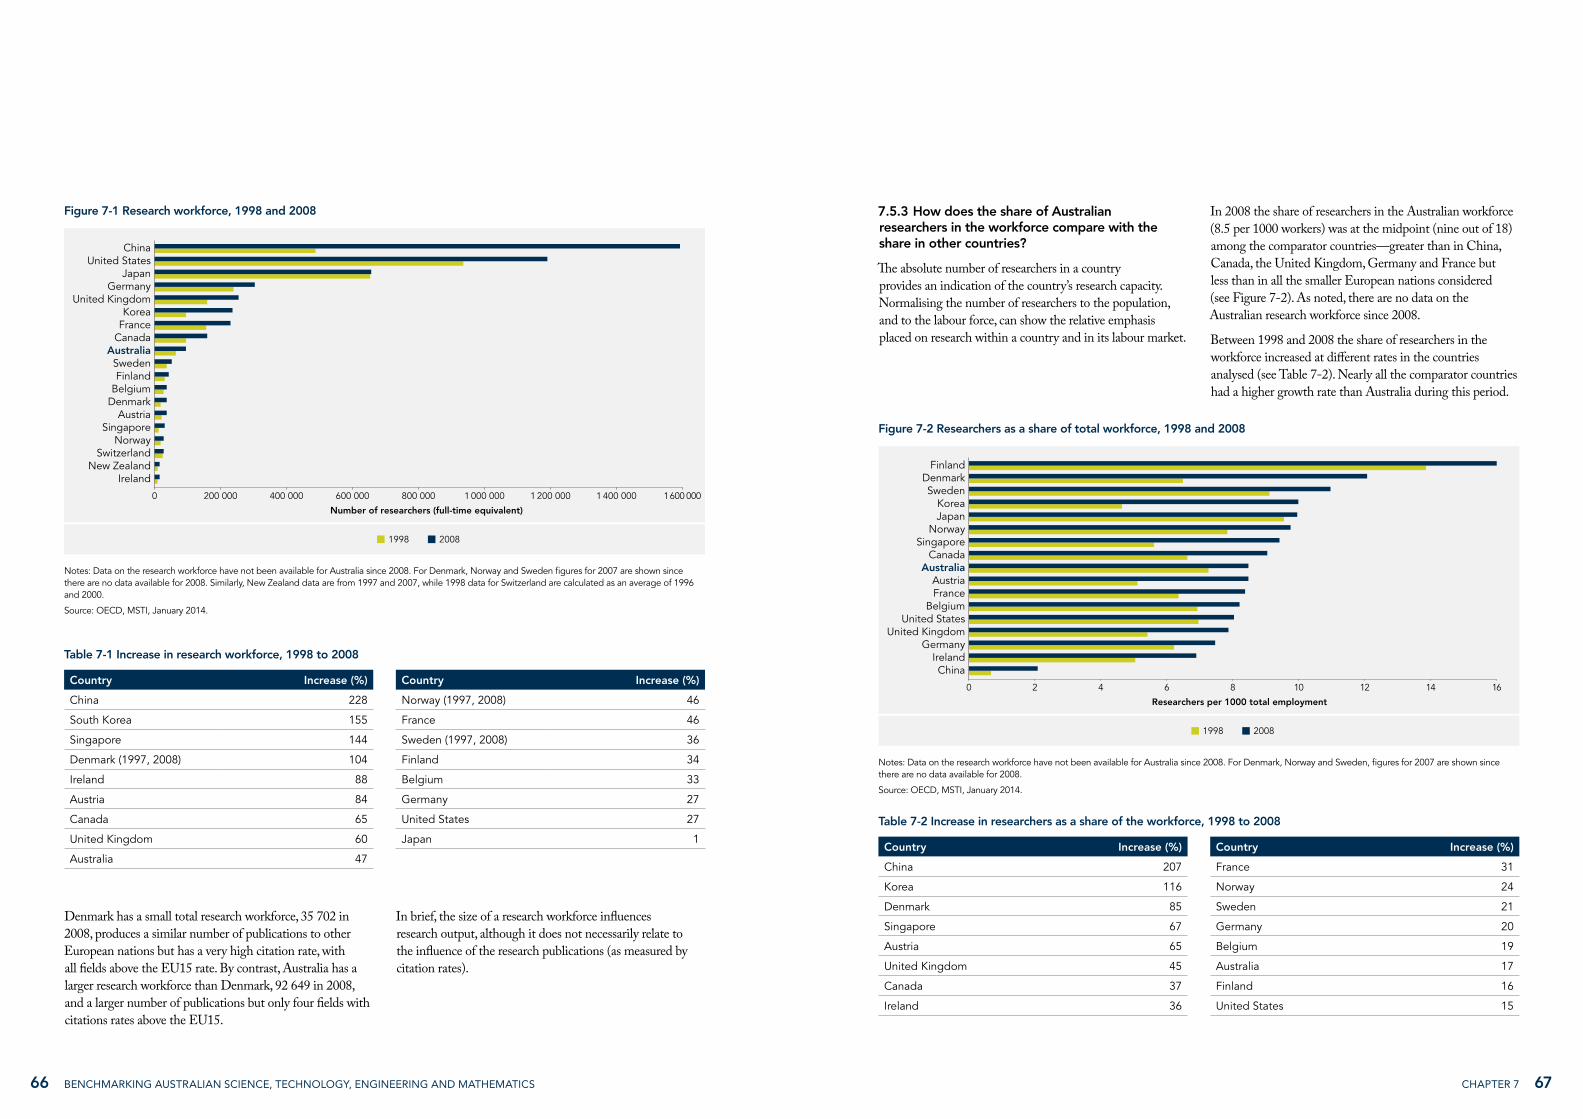
6766 Chapter 7 BENCHMARKING AUSTRALIAN SCIENCE, TECHNOLOGY, ENGINEERING AND MATHEMATICS
7.5.3 How does the share of Australian researchers in the workforce compare with the share in other countries?
The absolute number of researchers in a country provides an indication of the country’s research capacity. Normalising the number of researchers to the population, and to the labour force, can show the relative emphasis placed on research within a country and in its labour market.
In 2008 the share of researchers in the Australian workforce (8.5 per 1000 workers) was at the midpoint (nine out of 18) among the comparator countries—greater than in China, Canada, the United Kingdom, Germany and France but less than in all the smaller European nations considered (see Figure 7-2). As noted, there are no data on the Australian research workforce since 2008.
Between 1998 and 2008 the share of researchers in the workforce increased at different rates in the countries analysed (see Table 7-2). Nearly all the comparator countries had a higher growth rate than Australia during this period.
Denmark has a small total research workforce, 35 702 in 2008, produces a similar number of publications to other European nations but has a very high citation rate, with all fields above the EU15 rate. By contrast, Australia has a larger research workforce than Denmark, 92 649 in 2008, and a larger number of publications but only four fields with citations rates above the EU15.
In brief, the size of a research workforce influences research output, although it does not necessarily relate to the influence of the research publications (as measured by citation rates).
Figure 7-1 Research workforce, 1998 and 2008
1 400 0001 000 000600 000400 000200 0000 1 600 0001 200 000800 000
Number of researchers (full-time equivalent)
1998 2008
Australia
IrelandNew Zealand
SwitzerlandNorway
SingaporeAustria
DenmarkBelgiumFinland
Sweden
CanadaFranceKorea
United KingdomGermany
JapanUnited States
China
Notes: Data on the research workforce have not been available for Australia since 2008. For Denmark, Norway and Sweden figures for 2007 are shown since there are no data available for 2008. Similarly, New Zealand data are from 1997 and 2007, while 1998 data for Switzerland are calculated as an average of 1996 and 2000.
Source: OECD, MSTI, January 2014.
Table 7-1 Increase in research workforce, 1998 to 2008
Country Increase (%) Country Increase (%)
China 228 Norway (1997, 2008) 46
South Korea 155 France 46
Singapore 144 Sweden (1997, 2008) 36
Denmark (1997, 2008) 104 Finland 34
Ireland 88 Belgium 33
Austria 84 Germany 27
Canada 65 United States 27
United Kingdom 60 Japan 1
Australia 47
Figure 7-2 Researchers as a share of total workforce, 1998 and 2008
14106420 16128
Researchers per 1000 total employment
1998 2008
Australia
ChinaIreland
GermanyUnited Kingdom
United StatesBelgium
FranceAustria
CanadaSingapore
NorwayJapanKorea
SwedenDenmark
Finland
Notes: Data on the research workforce have not been available for Australia since 2008. For Denmark, Norway and Sweden, figures for 2007 are shown since there are no data available for 2008.
Source: OECD, MSTI, January 2014.
Table 7-2 Increase in researchers as a share of the workforce, 1998 to 2008
Country Increase (%) Country Increase (%)
China 207 France 31
Korea 116 Norway 24
Denmark 85 Sweden 21
Singapore 67 Germany 20
Austria 65 Belgium 19
United Kingdom 45 Australia 17
Canada 37 Finland 16
Ireland 36 United States 15
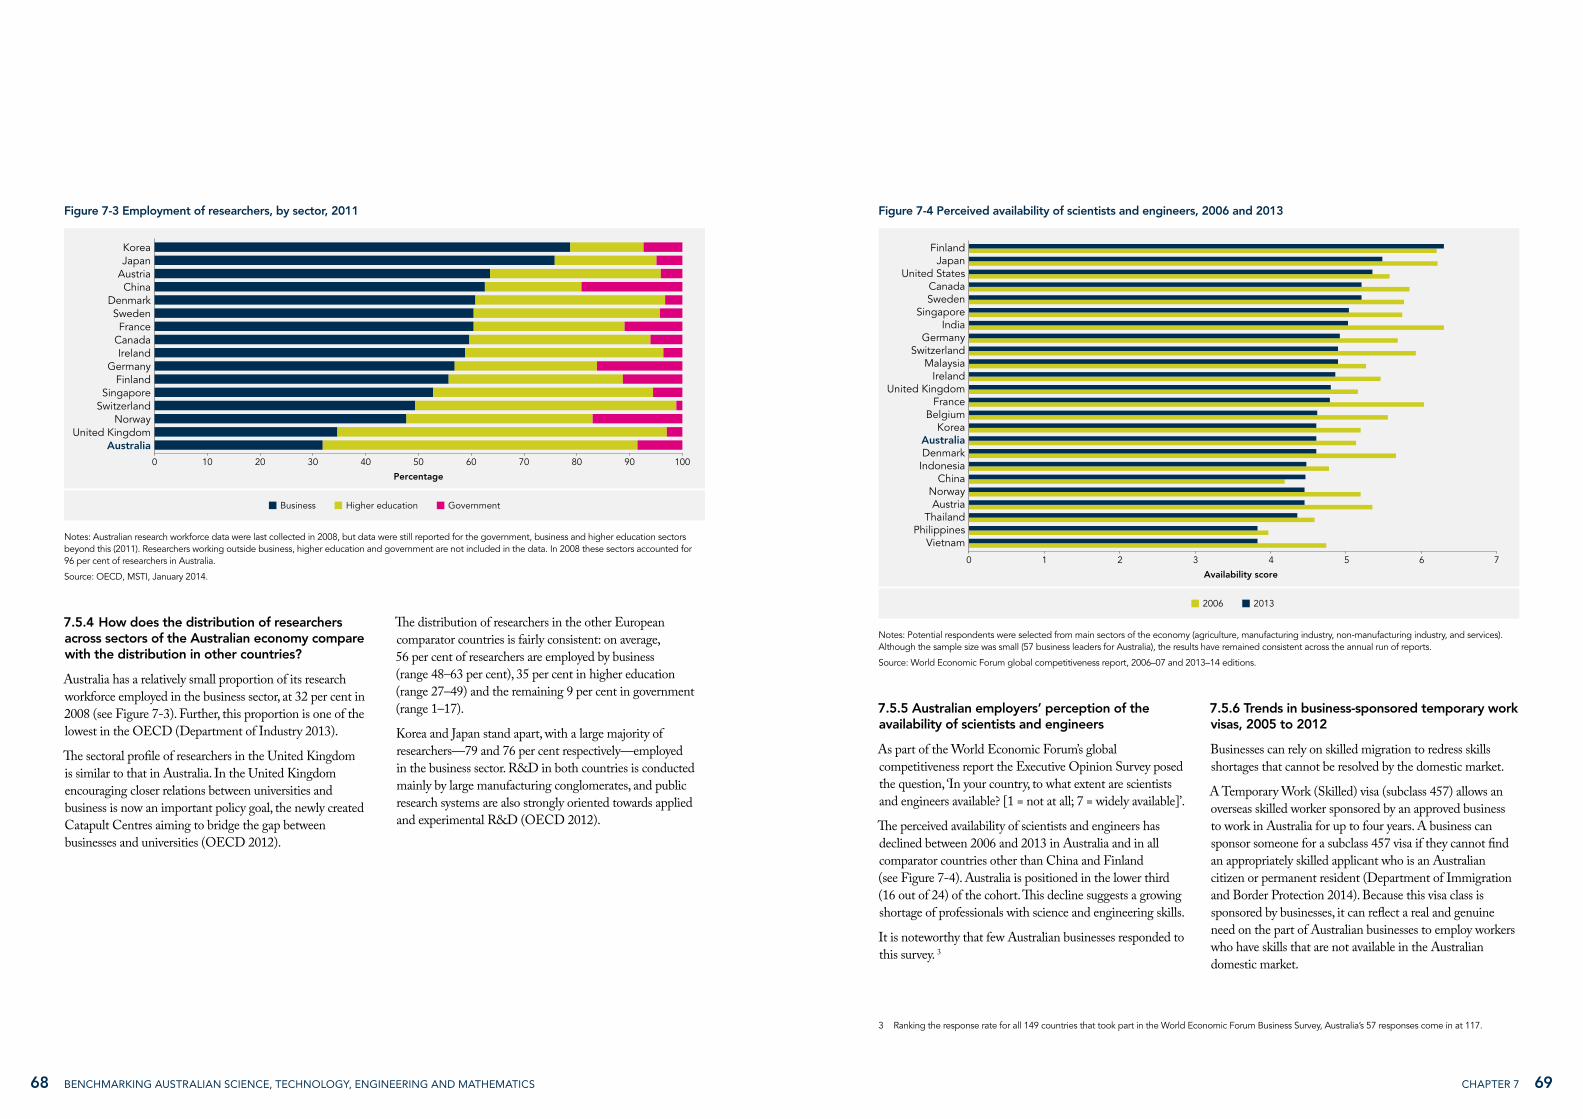
6968 Chapter 7 BENCHMARKING AUSTRALIAN SCIENCE, TECHNOLOGY, ENGINEERING AND MATHEMATICS
7.5.5 Australian employers’ perception of the availability of scientists and engineers
As part of the World Economic Forum’s global competitiveness report the Executive Opinion Survey posed the question, ‘In your country, to what extent are scientists and engineers available? [1 = not at all; 7 = widely available]’.
The perceived availability of scientists and engineers has declined between 2006 and 2013 in Australia and in all comparator countries other than China and Finland (see Figure 7-4). Australia is positioned in the lower third (16 out of 24) of the cohort. This decline suggests a growing shortage of professionals with science and engineering skills.
It is noteworthy that few Australian businesses responded to this survey. 3
7.5.6 Trends in business-sponsored temporary work visas, 2005 to 2012
Businesses can rely on skilled migration to redress skills shortages that cannot be resolved by the domestic market.
A Temporary Work (Skilled) visa (subclass 457) allows an overseas skilled worker sponsored by an approved business to work in Australia for up to four years. A business can sponsor someone for a subclass 457 visa if they cannot find an appropriately skilled applicant who is an Australian citizen or permanent resident (Department of Immigration and Border Protection 2014). Because this visa class is sponsored by businesses, it can reflect a real and genuine need on the part of Australian businesses to employ workers who have skills that are not available in the Australian domestic market.
7.5.4 How does the distribution of researchers across sectors of the Australian economy compare with the distribution in other countries?
Australia has a relatively small proportion of its research workforce employed in the business sector, at 32 per cent in 2008 (see Figure 7-3). Further, this proportion is one of the lowest in the OECD (Department of Industry 2013).
The sectoral profile of researchers in the United Kingdom is similar to that in Australia. In the United Kingdom encouraging closer relations between universities and business is now an important policy goal, the newly created Catapult Centres aiming to bridge the gap between businesses and universities (OECD 2012).
The distribution of researchers in the other European comparator countries is fairly consistent: on average, 56 per cent of researchers are employed by business (range 48–63 per cent), 35 per cent in higher education (range 27–49) and the remaining 9 per cent in government (range 1–17).
Korea and Japan stand apart, with a large majority of researchers—79 and 76 per cent respectively—employed in the business sector. R&D in both countries is conducted mainly by large manufacturing conglomerates, and public research systems are also strongly oriented towards applied and experimental R&D (OECD 2012).
Figure 7-3 Employment of researchers, by sector, 2011
804020100 9060 7030 10050
Percentage
Business Higher education Government
AustraliaUnited Kingdom
NorwaySwitzerlandSingapore
FinlandGermany
IrelandCanadaFrance
SwedenDenmark
ChinaAustriaJapanKorea
Notes: Australian research workforce data were last collected in 2008, but data were still reported for the government, business and higher education sectors beyond this (2011). Researchers working outside business, higher education and government are not included in the data. In 2008 these sectors accounted for 96 per cent of researchers in Australia.
Source: OECD, MSTI, January 2014.
Figure 7-4 Perceived availability of scientists and engineers, 2006 and 2013
53210 764
Availability score
2006 2013
Australia
VietnamPhilippines
ThailandAustria
NorwayChina
IndonesiaDenmark
KoreaBelgium
FranceUnited Kingdom
IrelandMalaysia
SwitzerlandGermany
IndiaSingapore
SwedenCanada
United StatesJapan
Finland
Notes: Potential respondents were selected from main sectors of the economy (agriculture, manufacturing industry, non-manufacturing industry, and services). Although the sample size was small (57 business leaders for Australia), the results have remained consistent across the annual run of reports.
Source: World Economic Forum global competitiveness report, 2006–07 and 2013–14 editions.
3 Ranking the response rate for all 149 countries that took part in the World Economic Forum Business Survey, Australia’s 57 responses come in at 117.

7170 Chapter 7 BENCHMARKING AUSTRALIAN SCIENCE, TECHNOLOGY, ENGINEERING AND MATHEMATICS
From 2001 to 2012 most subclass 457 visas were issued for employment in engineering and information and computing technology (see Figure 7-6).
The growth in the number of temporary visas granted in the engineering stream is due mainly to high rates of employment opportunities for civil and electronics engineers. Shortages of professional engineers in civil, electrical, mining, petroleum and mechanical engineering have been persistent for many years, although recent Department of Employment data show the labour market has eased (Department
of Employment 2014). The Australian Workforce and Productivity Agency’s consultations with employers suggest that, even though labour market conditions have eased (see Table 7-3), ‘employers continue to experience difficulty in filling engineering-related occupations’ (Australian Workforce and Productivity Agency 2014). This may be a result of engineering firms requiring employees with several years’ experience and sector-specific skills.
There was an overall increase in the number of STEM-related temporary visas issued in Australia between 2005 (15 870) and 2012 (39 120). The growth was not consistent, however, with a pronounced dip in numbers after 2008, from 28 450 down to 14 980 in 2009 (see Figure 7-5). The dip in numbers was apparent across all the industry categories analysed. Ten industry categories with businesses that support high levels of R&D were selected for this analysis (see Figure 5-9).
Overall, the two industries that supported the highest number of skilled workers were construction, with 42 640 temporary visas issued between 2005 and 2012, and information, media and telecommunications, with 39 140.
No temporary work visas were issued in the professional, scientific and technical area before 2009, but an annual step-wise increase resulted in 5690 being issued in 2012.
Sponsorship of temporary workers has remained fairly stable in the agriculture, financial and insurance (a mathematics-dependent industry field), wholesale trade, and electricity, gas and water industries, each with about 500 to 1000 temporary visas a year.
Figure 7-5 Temporary Work (Skilled) visas (subclass 457) issued, major STEM-related Australian industries, 2005 to 2012
Agriculture, Forestry and Fishing
Financial and Insurance
Mining
Transport, Postal and Warehousing
Construction
Information Media and Telecommunications
Professional, Scientific and Technical
Wholesale Trade
Electricity, Gas, Water and Waste
Manufacturing
0
Year
Num
ber
of
visa
s
35 000
30 000
25 000
20 000
15 000
10 000
5 000
40 000
2005 2006 2007 2008 2009 2010 2011 2012
Notes: Figures rounded to the nearest 10. The Australian and New Zealand Standard Classification of Occupations (ANZSCO) was introduced by the Department of Immigration and Border Control on 1 July 2010. Applications lodged before that date using the Australian Standard Classification of Occupations (2nd edition) have been converted to an ANZSCO code using standard DIBP mapping approved by the Australian Bureau of Statistics.
Source: Department of Immigration and Citizenship (2013).
Figure 7-6 Subclass 457 visas issued, selected skill streams, 2001 to 2012
Num
ber
of
visa
s
3000
2000
1500
1000
500
0
2500
3500
4000
4500
2008 2010 20122001 2004 2006 2009 20112003 2005 20072002Year
Engineering
Statistics
ICT
Natural and Physical Science (nec)
Biochemist Environmental scienceBiotechnologyAgriculture
Chemistry Mathematics
Notes: Engineering includes aeronautical engineers, aircraft maintenance engineers (avionics), aircraft maintenance engineers (mechanical), aircraft maintenance engineers (structures), biomedical engineers, chemical engineers, civil engineers, civil engineering draftspersons, civil engineering technicians, computer network and systems engineers, electronics engineers, engineering managers, engineering patternmakers, engineering production workers, engineering technologists, environmental engineers, and engineering professionals that are not elsewhere classified.
Agriculture includes agricultural consultants, agricultural engineers, agricultural scientists and agricultural technicians.
ICT includes analyst programmers, database administrators, network administrators, network analysts, ICT business analysts, ICT business development managers, ICT customer support officers, ICT project managers, ICT quality assurance engineers, ICT security specialists, ICT support engineers, ICT systems test engineers, ICT trainer and ICT support technicians, and ICT support, test engineers, and managers that are not elsewhere classified.
Chemistry includes chemists and chemistry technicians.
Environmental science includes environmental research scientists and environmental scientists that are not elsewhere classified.
Natural and physical science includes those natural and physical scientists that are not elsewhere classified.
Source: Department of Immigration and Citizenship (2013).

7372 Chapter 7 BENCHMARKING AUSTRALIAN SCIENCE, TECHNOLOGY, ENGINEERING AND MATHEMATICS
The high numbers of ICT temporary visas from 2001 to 2003 and from 2009 to 2012 are probably a consequence of domestic shortages of ICT-skilled workers in Australia and the global nature of the ICT workforce. The fall in ICT temporary visas issued after 2003 is probably due to the dotcom crash and the resultant contraction of the ICT sector. This was also reflected in the decline in the number of domestic students enrolling in bachelor-level IT degrees in Australian higher education institutions between 2002 and 2008 (see Chapter 8).
7.6 CONCLUDING REMARKS
The number of researchers in Australia has been growing. Despite this, Australia still has the lowest proportion of researchers in business compared with the other countries analysed—about 32 per cent. Compounding this is the fact that Australia has one of the lowest rates of industry–research collaboration in the OECD (see Chapter 4).
Australia had 8.5 researchers per 1000 in total employment in 2008. No new research workforce data were collected after that date. The gap in information might be significant given that some countries recorded a faster rate of growth in their research workforce compared with Australia before 2008. Countries in the Asia–Pacific region—in particular, China and Korea—have more than doubled the size of their research workforce (since 1998). Globally, surveys show there are fewer scientists and engineers available to employers in every country except China.
There are insufficient data to correlate the supply of trained STEM workers and the associated demand and uptake in the workforce in Australia. An understanding of this relationship would be valuable for workforce policy development.
Table 7-3 Migration program outcomes for skilled stream, by Australian and New Zealand Standard Classification of Occupations: engineers, 2001 to 2012
Type of engineer 2001 2002 2003 2004 2005 2006 2007 2008 2009 2010 2011 2012
Aeronautical 18 15 25 50 46 61 34 58 11 76 74 55
Aircraft maintenance (avionics)
13 27 11 44 52 28 21 54 75 34 30 17
Aircraft maintenance (mechanical)
72 40 48 61 61 65 92 122 191 65 82 44
Aircraft maintenance (structures)
15 11 13 45 41 40 16 15 26 15 13 8
Biomedical <5 6 <5 6 17 17 16 18 10 68 54 52
Chemical 89 148 131 229 299 358 289 435 524 357 380 231
Civil 265 333 355 447 695 809 921 1144 1637 1066 1091 1025
Civil (draftsperson) 38 64 60
Civil (technician) 14 17 33 33 58 51 62 92 107 94 88 58
Computer network and systems
35 133 488
Electronics 107 110 188 345 449 505 598 744 1,408 861 849 582
Manager 18 17 28 57 63 38 64 125 123 118 165 160
Patternmaker <5 <5
Production worker <5 <5 <5 <5 <5 <5
Professionals (nec) 333 469 566 909 743 373 281 253 113 174 190 212
Technologist 193 222 320 519 508 357 335 291 177 414 538 407
Environmental 33 60 79
Total 1137 1415 1718 2745 3032 2702 2729 3351 4402 3448 3811 3478
Notes: Data on grants of permanent visas are Migration Program Outcomes, which are the number of visas granted net of Business Skills visas cancelled under s. 134 of the Migration Act 1958 and net of places taken by partner visa holders who do not subsequently obtain permanent visas due to refusal or withdrawal. Small cell sizes with values between 1 and 4 are reported as <5. Occupation detail only available for principals within the skill stream. The Australian and New Zealand Standard Classification of Occupations was introduced by the (now) Department of Immigration and Border Control on 1 July 2010. Applications lodged before that date using the Australian Standard Classification of Occupations (2nd edition) have been converted to an ANZSCO code using a standard DIBP mapping approved by the ABS.
Source: Department of Immigration and Citizenship (2013).

74 BENCHMARKING AUSTRALIAN SCIENCE, TECHNOLOGY, ENGINEERING AND MATHEMATICS
CHAPTER 8
77Chapter 8 76 BENCHMARKING AUSTRALIAN SCIENCE, TECHNOLOGY, ENGINEERING AND MATHEMATICS
Higher education courses, such as a Bachelor of Science or a PhD, are classified into 12 broad fields of education, according to the course’s main subject matter or vocational intent. In this report the STEM fields of interest and their two-digit codes are 01 Natural and Physical Sciences (referred to as science)5, 02 Information Technology (IT), 03 Engineering and Related Technologies (engineering) and 05 Agriculture, Environmental and Related Studies (agriculture and environment).
Students enrolled in Australian universities are classified as either domestic or international students. Domestic students are largely Australian residents; international students are usually residents of other countries who are studying in Australia on a student visa.
Students are further classified as either commencing or continuing. Commencing students are those enrolled at an institution for the first time in a particular course. Commencing status applies for one calendar year only. Commencing enrolments for most course levels provide an indication of how many students are entering the system at that course level. This can, however, be an overestimate since some students could be counted as commencing in two or more years if they start a degree at one university then change or transfer to another university or course at a later date.
The Australian higher education data used in this chapter cover the years 2002 to 2012 because this is a period when consistent counting methodologies and field classifications were used (Dobson 2012).
International higher education statistics are from the UNESCO Institute of Statistics and cover enrolment and completion data in 2010. UNESCO uses the International Standard Classification of Education (see Table 8-1).While the available data are assembled to produce complete and internationally comparable data sets, initiatives to ensure comparability of frameworks in the European Union have meant that there could be double-counting when comparing enrolments and completions.
The international and domestic data presented here come from different databases that might have different approaches to classifying course levels and fields of education. For this reason the two sets of data are not directly comparable.
8.4 THE ‘MELBOURNE MODEL’ AND STEM ENROLMENTS
In 2008 the University of Melbourne made changes to the structure of its undergraduate STEM programs (Dobson 2014). Under the new structure the number of separate bachelor’s degrees offered by the university was reduced and students who wanted to eventually qualify in a specific vocational field such as engineering or medicine would first need to complete a bachelor’s degree in science. Similarly, students who wanted to qualify in architecture would first need to complete a bachelor’s degree in agriculture and environment. This new structure was dubbed the ‘Melbourne model’. A similar system was introduced at the University of Western Australia in 2012. The effect at Melbourne, and later at UWA, was declines in bachelor’s enrolments in engineering, medicine and architecture, with concurrent expansions in science and agriculture and environment.
This chapter benchmarks the supply of Australian higher education students and graduates in STEM fields. The current pipeline of STEM students and graduates is benchmarked against previous years and other countries for which data are available. Bachelor’s degrees (the typical first degree in Australian higher education) in STEM fields are assessed over time in order to discern trends in the Australian system; this is followed by an analysis of the doctoral cohort, then the international context.
The chapter also looks at the distribution of students between all education fields so as to draw conclusions about the relative emphasis on STEM in comparator countries. Finally, it presents an assessment of funding support for Australian doctoral candidates.
8.1 MAIN FINDINGS
` Overall, domestic student commencing enrolments in bachelor’s degrees in STEM fields increased between 2002 and 2012. Science and engineering enrolments grew during the period, while those in information technology and agriculture and environment fell.
` Bachelor’s degree completions for the STEM fields show trends similar to those for enrolments.
` The number of commencing research doctorate student enrolments in the STEM fields remained stable between 2002 and 2012.
` The STEM fields accounted for 35 per cent of commencing doctoral students across all fields of education in 2012.
8.2 BACKGROUND
Higher education plays a crucial role in STEM in Australia. Qualification in a STEM field from a higher education institution is the gateway to crucial workforce roles in STEM—from science and mathematics teachers to engineering professionals, from computer programmers to government science advisers, from agronomists to researchers. Without the training, research and development role of the higher education sector, it would be difficult to develop a workforce capable of STEM-based innovation.
8.3 DATA SOURCES AND TERMINOLOGY
Data on domestic student bachelor’s degree enrolments and completions were provided by the Australian Government’s Department of Education’s Higher Education Statistics Data Cube (uCube)4, which is based on the student and staff data collections. The data could include a small amount of double-counting in the number of undergraduate enrolments and completions in individual STEM fields shown in this report. This is because students can enrol in and then complete more than one STEM degree. Customised data sets on research doctorate degree enrolments and completions were also provided by the Department of Education.
The terminology adopted in this chapter envisages that students enrol in higher education courses that are offered at different levels. Typical course levels are entry-level undergraduate courses such as a bachelor’s degree and higher and research-based degrees such as a PhD. When students satisfy the requirements of their course and graduate they are counted as completions.
8. HIGHER EDUCATION Table 8-1 International Standard Classification of Education fields and the Australian equivalents
ISCED STEM field of education Australian equivalent field of education
05 Natural sciences, mathematics and statistics 01 Natural and physical sciences
06 Information and communication technologies 02 Information technology
07 Engineering, manufacturing and construction 03 Engineering and related technologies
08 Agriculture, forestry, fisheries and veterinary sciences 05 Agriculture, environmental and related studies
4 Available at http://www.highereducationstatistics.education.gov.au.5 Natural and Physical Sciences includes the narrow fields of mathematics, chemistry, physics, biology, earth sciences, medical science, and ‘other’, which
includes forensic science and pharmacology.
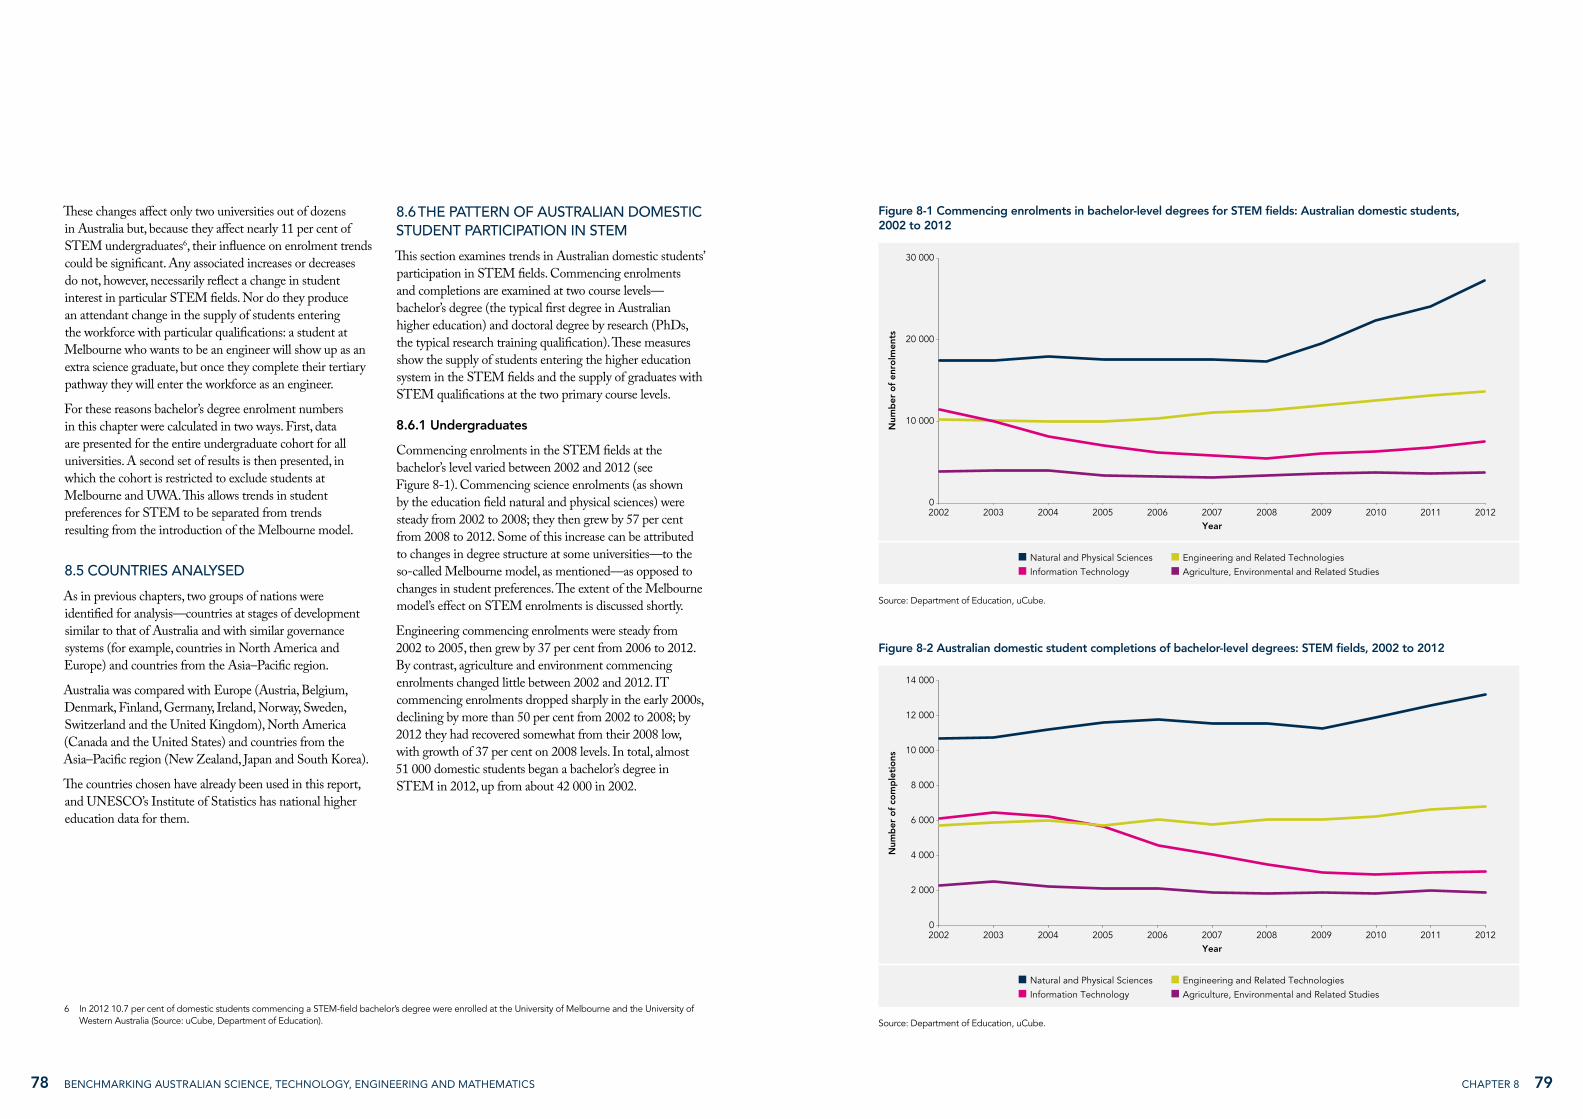
7978 Chapter 8 BENCHMARKING AUSTRALIAN SCIENCE, TECHNOLOGY, ENGINEERING AND MATHEMATICS
These changes affect only two universities out of dozens in Australia but, because they affect nearly 11 per cent of STEM undergraduates6, their influence on enrolment trends could be significant. Any associated increases or decreases do not, however, necessarily reflect a change in student interest in particular STEM fields. Nor do they produce an attendant change in the supply of students entering the workforce with particular qualifications: a student at Melbourne who wants to be an engineer will show up as an extra science graduate, but once they complete their tertiary pathway they will enter the workforce as an engineer.
For these reasons bachelor’s degree enrolment numbers in this chapter were calculated in two ways. First, data are presented for the entire undergraduate cohort for all universities. A second set of results is then presented, in which the cohort is restricted to exclude students at Melbourne and UWA. This allows trends in student preferences for STEM to be separated from trends resulting from the introduction of the Melbourne model.
8.5 COUNTRIES ANALYSED
As in previous chapters, two groups of nations were identified for analysis—countries at stages of development similar to that of Australia and with similar governance systems (for example, countries in North America and Europe) and countries from the Asia–Pacific region.
Australia was compared with Europe (Austria, Belgium, Denmark, Finland, Germany, Ireland, Norway, Sweden, Switzerland and the United Kingdom), North America (Canada and the United States) and countries from the Asia–Pacific region (New Zealand, Japan and South Korea).
The countries chosen have already been used in this report, and UNESCO’s Institute of Statistics has national higher education data for them.
8.6 THE PATTERN OF AUSTRALIAN DOMESTIC STUDENT PARTICIPATION IN STEM
This section examines trends in Australian domestic students’ participation in STEM fields. Commencing enrolments and completions are examined at two course levels—bachelor’s degree (the typical first degree in Australian higher education) and doctoral degree by research (PhDs, the typical research training qualification). These measures show the supply of students entering the higher education system in the STEM fields and the supply of graduates with STEM qualifications at the two primary course levels.
8.6.1 Undergraduates
Commencing enrolments in the STEM fields at the bachelor’s level varied between 2002 and 2012 (see Figure 8-1). Commencing science enrolments (as shown by the education field natural and physical sciences) were steady from 2002 to 2008; they then grew by 57 per cent from 2008 to 2012. Some of this increase can be attributed to changes in degree structure at some universities—to the so-called Melbourne model, as mentioned—as opposed to changes in student preferences. The extent of the Melbourne model’s effect on STEM enrolments is discussed shortly.
Engineering commencing enrolments were steady from 2002 to 2005, then grew by 37 per cent from 2006 to 2012. By contrast, agriculture and environment commencing enrolments changed little between 2002 and 2012. IT commencing enrolments dropped sharply in the early 2000s, declining by more than 50 per cent from 2002 to 2008; by 2012 they had recovered somewhat from their 2008 low, with growth of 37 per cent on 2008 levels. In total, almost 51 000 domestic students began a bachelor’s degree in STEM in 2012, up from about 42 000 in 2002.
Figure 8-1 Commencing enrolments in bachelor-level degrees for STEM fields: Australian domestic students, 2002 to 2012
Num
ber
of
enro
lmen
ts 20 000
0
10 000
30 000
2008 2010 20122002 2004 2006 2009 20112003 2005 2007Year
Natural and Physical Sciences Engineering and Related Technologies
Information Technology Agriculture, Environmental and Related Studies
Source: Department of Education, uCube.
6 In 2012 10.7 per cent of domestic students commencing a STEM-field bachelor’s degree were enrolled at the University of Melbourne and the University of Western Australia (Source: uCube, Department of Education).
Figure 8-2 Australian domestic student completions of bachelor-level degrees: STEM fields, 2002 to 2012
Num
ber
of
com
ple
tio
ns
10 000
0
4 000
8 000
2 000
12 000
6 000
14 000
2008 2010 20122002 2004 2006 2009 20112003 2005 2007Year
Natural and Physical Sciences Engineering and Related Technologies
Information Technology Agriculture, Environmental and Related Studies
Source: Department of Education, uCube.
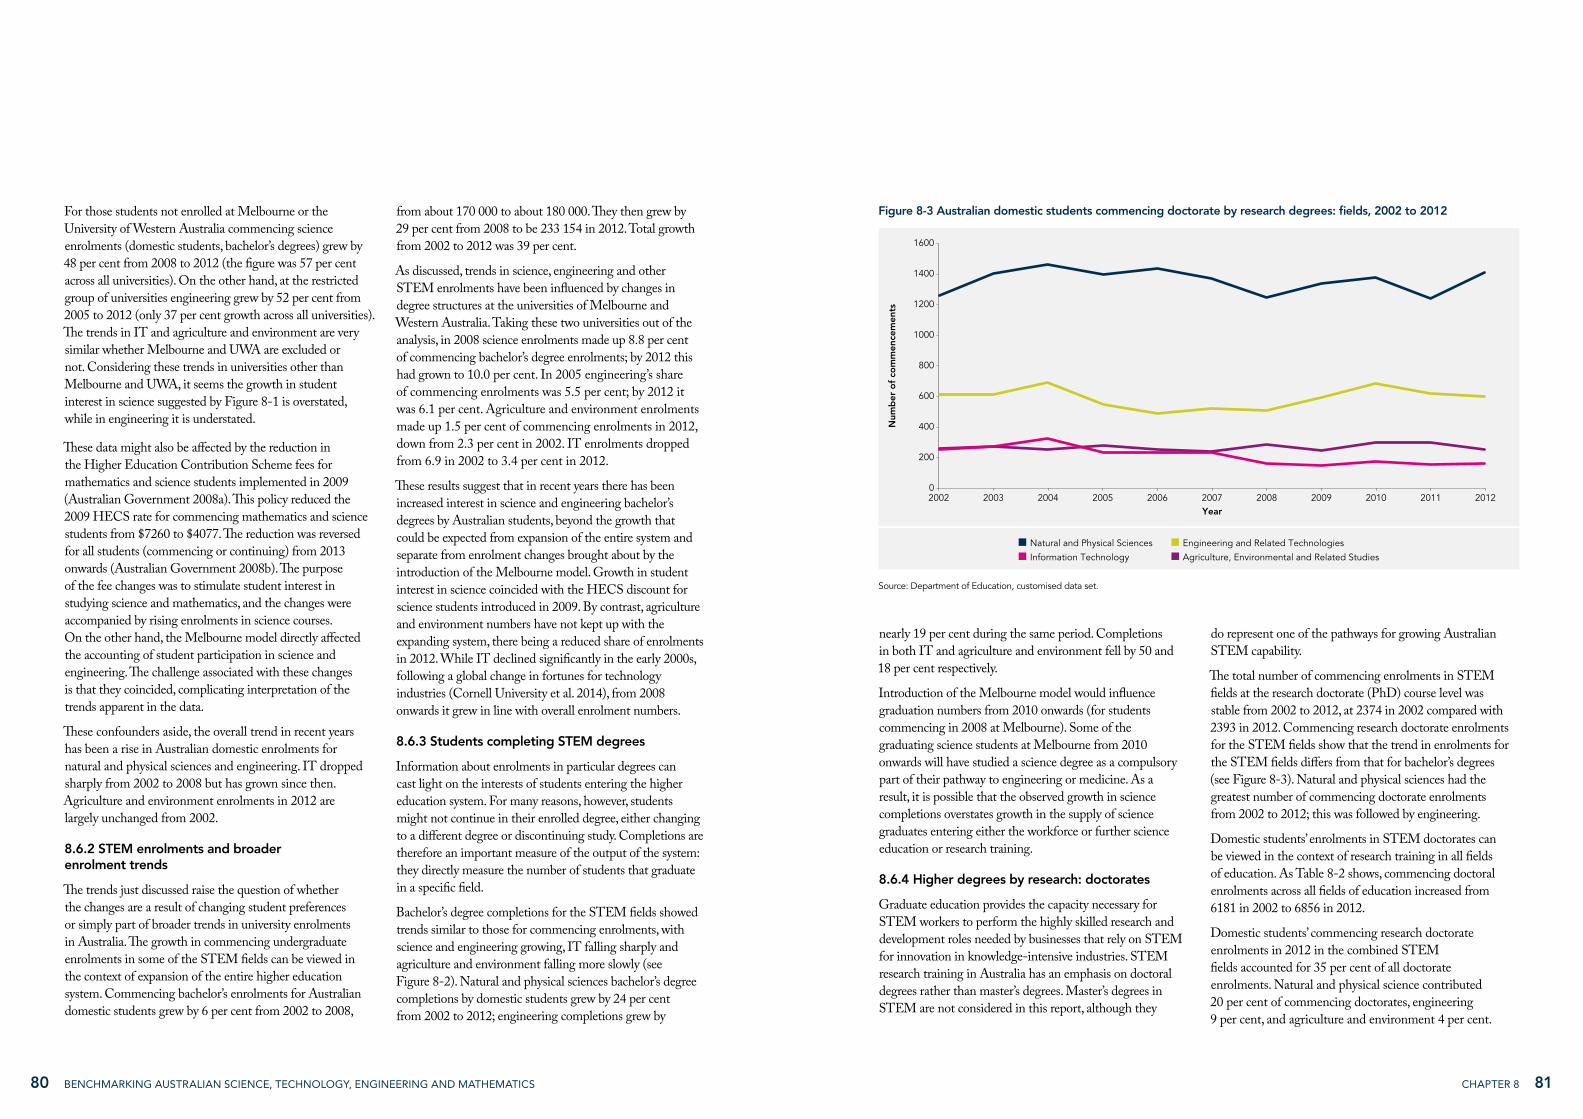
8180 Chapter 8 BENCHMARKING AUSTRALIAN SCIENCE, TECHNOLOGY, ENGINEERING AND MATHEMATICS
For those students not enrolled at Melbourne or the University of Western Australia commencing science enrolments (domestic students, bachelor’s degrees) grew by 48 per cent from 2008 to 2012 (the figure was 57 per cent across all universities). On the other hand, at the restricted group of universities engineering grew by 52 per cent from 2005 to 2012 (only 37 per cent growth across all universities). The trends in IT and agriculture and environment are very similar whether Melbourne and UWA are excluded or not. Considering these trends in universities other than Melbourne and UWA, it seems the growth in student interest in science suggested by Figure 8-1 is overstated, while in engineering it is understated.
These data might also be affected by the reduction in the Higher Education Contribution Scheme fees for mathematics and science students implemented in 2009 (Australian Government 2008a). This policy reduced the 2009 HECS rate for commencing mathematics and science students from $7260 to $4077. The reduction was reversed for all students (commencing or continuing) from 2013 onwards (Australian Government 2008b). The purpose of the fee changes was to stimulate student interest in studying science and mathematics, and the changes were accompanied by rising enrolments in science courses. On the other hand, the Melbourne model directly affected the accounting of student participation in science and engineering. The challenge associated with these changes is that they coincided, complicating interpretation of the trends apparent in the data.
These confounders aside, the overall trend in recent years has been a rise in Australian domestic enrolments for natural and physical sciences and engineering. IT dropped sharply from 2002 to 2008 but has grown since then. Agriculture and environment enrolments in 2012 are largely unchanged from 2002.
8.6.2 STEM enrolments and broader enrolment trends
The trends just discussed raise the question of whether the changes are a result of changing student preferences or simply part of broader trends in university enrolments in Australia. The growth in commencing undergraduate enrolments in some of the STEM fields can be viewed in the context of expansion of the entire higher education system. Commencing bachelor’s enrolments for Australian domestic students grew by 6 per cent from 2002 to 2008,
from about 170 000 to about 180 000. They then grew by 29 per cent from 2008 to be 233 154 in 2012. Total growth from 2002 to 2012 was 39 per cent.
As discussed, trends in science, engineering and other STEM enrolments have been influenced by changes in degree structures at the universities of Melbourne and Western Australia. Taking these two universities out of the analysis, in 2008 science enrolments made up 8.8 per cent of commencing bachelor’s degree enrolments; by 2012 this had grown to 10.0 per cent. In 2005 engineering’s share of commencing enrolments was 5.5 per cent; by 2012 it was 6.1 per cent. Agriculture and environment enrolments made up 1.5 per cent of commencing enrolments in 2012, down from 2.3 per cent in 2002. IT enrolments dropped from 6.9 in 2002 to 3.4 per cent in 2012.
These results suggest that in recent years there has been increased interest in science and engineering bachelor’s degrees by Australian students, beyond the growth that could be expected from expansion of the entire system and separate from enrolment changes brought about by the introduction of the Melbourne model. Growth in student interest in science coincided with the HECS discount for science students introduced in 2009. By contrast, agriculture and environment numbers have not kept up with the expanding system, there being a reduced share of enrolments in 2012. While IT declined significantly in the early 2000s, following a global change in fortunes for technology industries (Cornell University et al. 2014), from 2008 onwards it grew in line with overall enrolment numbers.
8.6.3 Students completing STEM degrees
Information about enrolments in particular degrees can cast light on the interests of students entering the higher education system. For many reasons, however, students might not continue in their enrolled degree, either changing to a different degree or discontinuing study. Completions are therefore an important measure of the output of the system: they directly measure the number of students that graduate in a specific field.
Bachelor’s degree completions for the STEM fields showed trends similar to those for commencing enrolments, with science and engineering growing, IT falling sharply and agriculture and environment falling more slowly (see Figure 8-2). Natural and physical sciences bachelor’s degree completions by domestic students grew by 24 per cent from 2002 to 2012; engineering completions grew by
Figure 8-3 Australian domestic students commencing doctorate by research degrees: fields, 2002 to 2012
Num
ber
of
com
men
cem
ents
1000
0
400
800
200
1200
600
1400
1600
2008 2010 20122002 2004 2006 2009 20112003 2005 2007Year
Natural and Physical Sciences Engineering and Related Technologies
Information Technology Agriculture, Environmental and Related Studies
Source: Department of Education, customised data set.
nearly 19 per cent during the same period. Completions in both IT and agriculture and environment fell by 50 and 18 per cent respectively.
Introduction of the Melbourne model would influence graduation numbers from 2010 onwards (for students commencing in 2008 at Melbourne). Some of the graduating science students at Melbourne from 2010 onwards will have studied a science degree as a compulsory part of their pathway to engineering or medicine. As a result, it is possible that the observed growth in science completions overstates growth in the supply of science graduates entering either the workforce or further science education or research training.
8.6.4 Higher degrees by research: doctorates
Graduate education provides the capacity necessary for STEM workers to perform the highly skilled research and development roles needed by businesses that rely on STEM for innovation in knowledge-intensive industries. STEM research training in Australia has an emphasis on doctoral degrees rather than master’s degrees. Master’s degrees in STEM are not considered in this report, although they
do represent one of the pathways for growing Australian STEM capability.
The total number of commencing enrolments in STEM fields at the research doctorate (PhD) course level was stable from 2002 to 2012, at 2374 in 2002 compared with 2393 in 2012. Commencing research doctorate enrolments for the STEM fields show that the trend in enrolments for the STEM fields differs from that for bachelor’s degrees (see Figure 8-3). Natural and physical sciences had the greatest number of commencing doctorate enrolments from 2002 to 2012; this was followed by engineering.
Domestic students’ enrolments in STEM doctorates can be viewed in the context of research training in all fields of education. As Table 8-2 shows, commencing doctoral enrolments across all fields of education increased from 6181 in 2002 to 6856 in 2012.
Domestic students’ commencing research doctorate enrolments in 2012 in the combined STEM fields accounted for 35 per cent of all doctorate enrolments. Natural and physical science contributed 20 per cent of commencing doctorates, engineering 9 per cent, and agriculture and environment 4 per cent.

8382 Chapter 8 BENCHMARKING AUSTRALIAN SCIENCE, TECHNOLOGY, ENGINEERING AND MATHEMATICS
8.7 AUSTRALIA’S PRODUCTION OF STEM DEGREE HOLDERS IN THE INTERNATIONAL CONTEXT
The size of a nation’s higher education system in part reflects the size of its population. If enrolment numbers are adjusted for population size, the relative emphasis in a country on producing people with tertiary qualifications in particular fields becomes apparent.
In all education fields, the relative number of students enrolled in first degrees in tertiary education in Australia was 5884 per 100 000 population in 2010—lower than in the United States (6748 per 100 000) and New Zealand (6291 per 100 000) but higher than in several European nations (see Figure 8-5).
Commencing doctorate enrolments in IT declined by approximately 35 per cent from 2002 to 2012, making up 2 per cent of commencing doctorates in 2012.
Table 8-2 Australian domestic students commencing doctorate by research degrees: all fields, 2002 to 2012
Year Total commencing doctorates
2002 6181
2003 6506
2004 6582
2005 6322
2006 6422
2007 6448
2008 6104
2009 6304
2010 6737
2011 6874
2012 6856
Source: Department of Education, customised data set.
Research doctorate completions across all the STEM fields increased from 1524 in 2002 to 1888 in 2012 (see Figure 8-4). This represents 41 per cent of all doctorate completions—down from 45 per cent in 2007. Doctorate completions in each individual STEM field grew in absolute terms between 2002 and 2012, but only IT and engineering completion growth rates were higher than the rate of growth for total completions, which was 26 per cent from 2002 to 2012.
Science doctorate completions, which made up 25 per cent of all doctorates awarded in 2002, declined to 23 per cent in 2012.
Overall, this shows a relatively constant number of STEM doctoral candidates in the Australian education system, with an emphasis on the natural and physical sciences over other STEM fields. Although the trends in enrolment and completion provide valuable insights into the Australian education system, it is important to compare these data with international benchmarks in order to understand how Australia sits in the global context.
Figure 8-4 Australian domestic student completions of doctorates by research: STEM fields, 2002 to 2012
Num
ber
of
com
ple
tio
ns
1000
0
400
800
200
600
1200
2008 2010 20122002 2004 2006 2009 20112003 2005 2007Year
Natural and Physical Sciences Engineering and Related Technologies
Information Technology Agriculture, Environmental and Related Studies
Source: Department of Education, customised data set.
Figure 8-5 Students enrolled in first degree in tertiary education per 100 000 population, selected countries, 2010
6000 7000500040003000200010000
Students in tertiary education per 100 000 population
Australia
SwitzerlandUnited Kingdom
BelgiumAustriaIreland
DenmarkNorwaySwedenFinland
New ZealandUnited States
Source: UNESCO, Tertiary Country Comparison, customised data set.
Figure 8-6 Distribution of student enrolments in first degrees in tertiary education: science and engineering, manufacturing and construction, selected countries, 2009
6050403020100
Percentage of enrolments
Australia
BelgiumJapan
Norway
New ZealandAustria
United KingdomCanadaFrance
DenmarkSwitzerland
United StatesGermany
FinlandSweden
Engineering, manufacturing and constructionScience
Source: OECD (2011).

8584 Chapter 8 BENCHMARKING AUSTRALIAN SCIENCE, TECHNOLOGY, ENGINEERING AND MATHEMATICS
Australia awarded 10 science and engineering doctorates per 100 000 population in 2010.
8.8 FUNDING AND SUPPORT FOR HIGHER DEGREE BY RESEARCH STUDENTS
Research is one of the main activities in Australian universities. Universities compete for government funding aimed at covering the direct and indirect costs of research, including research training. The indirect cost of
research is supported by Commonwealth research block grants. Grant amounts under the research block grant schemes are determined entirely by research performance. The performance measures are research income, research publications, higher degree by research student completions, and higher degree by research student load.
Each calendar year the Research Training Scheme provides block grants to eligible Australian higher education providers to support research training for students doing doctorate by research and master’s by research degrees.
8.7.1 How does the field profile of Australian higher education compare internationally?
UNESCO classifies first, or bachelor’s, degrees according to their course content into fields of education (see Table 8-1). In 2010 Australia had a higher proportion (12.1 per cent) of all bachelor’s degree enrolments in the field of natural sciences, mathematics and statistics (science) than Japan, Belgium, Finland, Denmark and Austria (see Figure 8-6). Several other countries had a higher proportion of first degrees in science—Germany (16.4 per cent), France (17 per cent), the United States (17.5 per cent) and New Zealand (18.7 per cent). Countries also varied in the proportion of first degree enrolments in the field of engineering, manufacturing and construction (engineering). Of the 14 countries chosen for comparison, only Norway, Belgium and New Zealand had lower proportions of enrolments in engineering than Australia. The remaining 11 had higher rates of engineering enrolments.
When considering the total cohort of students for science and engineering, manufacturing and construction, 22.7 per cent of Australian student enrolments are in these fields—lower than all countries assessed apart from Norway, Japan and Belgium.
When this analysis is extended to all the fields of education, it is evident that social sciences, business and law have the greatest share of first degree enrolments outside the STEM fields for nearly all the countries compared (see Figure 8-7).
8.7.2 How does Australia’s rate of STEM enrolments compare internationally?
In 2010 Australia had 525 bachelor’s enrolments in science per 100 000 population (see Figure 8-8). This is below the rate of science enrolments in the United Kingdom (552 per 100 000), the United States (577), Finland (596), Ireland (625) and New Zealand (861). Australia is in the middle of the countries analysed, which represents a moderate emphasis in Australia on developing STEM graduates.
8.7.3 How does Australia’s output of science and engineering doctorates compare internationally?
More than 200 000 science and engineering doctorates were awarded worldwide in 2010. A comparison of selected countries reveals that the number of science and engineering doctorates awarded per 100 000 population ranged from 5 to 18 (see Figure 8-9). In contrast with Switzerland’s 18 per 100 000 and Japan’s 5 per 100 000,
Figure 8-7 Distribution of student enrolments in first degrees in tertiary education, by field of education, selected countries, 2009
804020100 9060 7030 10050
Percentage of enrolments
Science Engineering, manufacturing and construction Humanities, arts and education
Social sciences, business and law Agriculture, health, welfare and services Not known or unspecified
Australia
BelgiumJapan
Norway
New ZealandAustria
United KingdomCanadaFrance
DenmarkSwitzerland
United StatesGermany
FinlandSweden
Note: Information for Canada is for 2008.
Source: OECD (2011).
Figure 8-8 Students enrolled in first degree in tertiary science per 100 000 population, selected countries, 2010
600 8005004003002001000 700 900
Enrolments per 100 000 population
Australia
BelgiumSwitzerland
DenmarkNorwaySwedenAustria
United KingdomUnited States
FinlandIreland
New Zealand
Source: UNESCO, Tertiary Country Comparison, customised data set.
Figure 8-9 Science and engineering doctoral graduates per 100 000 population, selected countries, 2010
1816128420 2014106
Doctorates per 100 000 population
Engineering PhD graduatesScience PhD graduates
Australia
JapanKorea
United StatesCanadaNorwayBelgium
New Zealand
DenmarkGermany
AustriaFinland
United KingdomIreland
SwedenSwitzerland
Source: OECD, Main Science and Technology Indicators, January 2014.

8786 Chapter 8 BENCHMARKING AUSTRALIAN SCIENCE, TECHNOLOGY, ENGINEERING AND MATHEMATICS
research students (see Figure 8-11). Each year from 2006 to 2012 there has been a surplus of APA grants available but not awarded to commencing students. In 2006, 85 per cent of available APAs were awarded, leaving 236; in 2012, 82 per cent were awarded, leaving 627. In total, from 2006 to 2012, 17 149 APAs were allocated to universities, but only 13 850 students commenced with an APA.
Despite the growth in the number of new APAs, only a small proportion of PhD completions in Australia have been supported by such an award. Most PhD students are supported through other means—such as Research Training Scheme funding. The proportion of STEM-field PhDs awarded each year that were supported by an APA fluctuated from 2006 to 2012 (see Figure 8-12). In natural and physical sciences, support levels ranged from 11.4 per cent in 2009 to 18.2 per cent in 2011. Engineering and IT PhDs had lower levels of APA support,
ranging from 7.6 to 15.0 per cent. Agriculture saw a decline in APA support, from 16.3 to 13.5 per cent between 2006 and 2012.
8.9 CONCLUDING REMARKS
In comparison with selected developed nations, Australia has a relatively high rate of per capita enrolments in tertiary education, but there is less emphasis on STEM. We sit in the middle of the comparator countries as measured by our relative rate of science undergraduate enrolments and the number of science and engineering doctorate holders per capita.
STEM research skills are recognised as important in knowledge-intensive industries. The availability of funding and support for talented Australian STEM doctoral students (our primary source of research-trained workers) is crucial if Australia is to expand its knowledge economy.
The growth in funding of this scheme in recent years has been based on inflation, so funding has not changed in real terms from year to year.
Another mechanism for funding research training is the Australian Postgraduate Award program. Funding for APA scholarships is provided through the performance-based research block grant scheme. Universities then award the scholarships to students with exceptional potential who are studying for a doctorate or master’s by research. Since 2006 the government has increased funding in this mechanism and the estimated number of domestic higher degree by research students supported by an APA has doubled (see Figure 8-10). This includes both commencing and continuing students.
In recent years there has been growth both in the number of new Australian Postgraduate Awards allocated to universities and in the number of such awards actually awarded and taken up by commencing higher degree by
Figure 8-10 Total Australian Postgraduate Award students: all fields, 2006 to 2014
Num
ber
of
awar
ds
12 000
10 000
8 000
6 000
4 000
0
2 000
20142006 2010Year
Note: Includes both commencing and continuing students.
Source: Department of Education.
Figure 8-11 New Australian Postgraduate Awards for higher degree by research and commencing award recipients, 2006 to 2012
0
Year
Num
ber
of
awar
ds
3500
2500
2000
1500
1000
500
4000
2006 2007 2008 2009 2010 2011 2012
Commencing with an awardNew awards
Source: Department of Education, customised data set.
Figure 8-12 Proportion of STEM PhD completions supported by an Australian Postgraduate Award, 2006 to 2012
Per
cent
age
16
0
4
12
2
8
18
14
10
6
20
2008 2010 20122006 2009 20112007Year
Natural and Physical Sciences Engineering and Related Technologies
Information Technology Agriculture, Environmental and Related Studies
Source: Department of Education, customised data set.

88 BENCHMARKING AUSTRALIAN SCIENCE, TECHNOLOGY, ENGINEERING AND MATHEMATICS
CHAPTER 9

91Chapter 9 90 BENCHMARKING AUSTRALIAN SCIENCE, TECHNOLOGY, ENGINEERING AND MATHEMATICS
9.3 DATA SOURCES AND TERMINOLOGY
The OECD Programme for International Student Assessment is an international survey designed to assess 15-year-old students’ competencies in reading, mathematics and science.
In Australia PISA data are collected by the Australian Council for Educational Research. Students take a two-hour paper-based test containing open-ended and multiple choice items. They and their principals answer 30-minute questionnaires. The student questionnaire seeks information about students’ backgrounds, perceptions and learning experiences; the questionnaire for principals seeks information about school learning environments and the broader school system.
Australian students also participate in the Trends in International Mathematics and Science Study (Thomson et al. 2012b). TIMSS is directed by the International Association for the Evaluation of Educational Achievement, an independent cooperative of national research institutions and government agencies from around the world. In Australia TIMSS is carried out by the Australian Council for Educational Research. It has assessed mathematics and science in 1995, 2003, 2007 and 2011 for students in year 4 (primary school) and in 1995, 1999, 2003, 2007 and 2011 for students in year 8 (secondary school). In addition to the student tests, teachers, principals and students complete questionnaires to provide information about their backgrounds, experiences and the learning environment. TIMSS data on year 8 teachers’ qualifications are presented here.
In addition to TIMSS, ACER collects information about teacher qualifications through its Staff in Australia’s Schools survey, conducted every three years (McKenzie et al. 2011). The latest published data are from the 2010 survey.
The regulated time each country spent in teaching science and mathematics to school students was compiled by the OECD Directorate for Education and Skills and is published in Education at a Glance 2013 (OECD 2013). Australia was not included in this report for these data, so the regulated time spent teaching science and mathematics in Australian schools is derived from the Australian Curriculum Assessment and Reporting Authority’s recommended indicative teaching hours, which were endorsed by Australian state and territory education ministers (ACARA 2013). Recent estimates are not
available to show whether or how widely this target is met. The participation rates for Australian year 12 students in science and mathematics subjects are from ‘The continuing decline of science and mathematics enrolments in Australian high schools’ (Kennedy et al. 2014).
9.4 COUNTRIES ANALYSED
As with previous chapters, two groups of benchmarking nations were identified for analysis—countries at stages of development similar to that of Australia and with similar governance systems (the United States, Canada and selected European nations) and selected countries in the Asia–Pacific region.
In this chapter Australia is compared with Austria, Belgium, Canada, Denmark, Finland, France, Germany, Indonesia, Ireland, Japan, South Korea, New Zealand, Norway, Singapore, Sweden, Switzerland, Thailand, the United Kingdom and the United States where data were available. Where comparisons of test results are made over time or for different student age groups, comparator countries that had participated at both time points or for both age groups were chosen.
9.5 PERFORMANCE OF AUSTRALIAN SECONDARY SCHOOL STUDENTS IN MATHEMATICS AND SCIENCE
9.5.1 PISA mathematical literacy, 2003 to 2012
The OECD Programme for International Student Assessment conducts surveys every three years to assess the competencies of 15-year-olds in reading, mathematics and science. Each cycle has a focus on one of these domains. Once a domain has been the focus of a PISA cycle, results for that year can be compared with results for later cycles. Comparisons depend on common items being used in the successive cycles. Mathematics was the focus of the 2003 PISA, so trends in mathematical literacy can be observed from 2003 onwards.
Figure 9-1 shows mean scores for 2003 and 2012 in mathematical literacy for 17 comparator countries. To allow an assessment of Australia’s relative performance over time, only countries that participated in both years are included. The OECD average is the average of all participating OECD countries’ mean scores. Each country’s mean score is shown in parentheses, and the bars show the difference
This chapter analyses the performance of the Australian school system, with a focus on student performance in international testing, teaching in science and mathematics, and participation rates in senior school mathematics and science.
9.1 MAIN FINDINGS
` In the OECD Programme for International Student Assessment, 15-year-old Australian students (primarily year 10) score higher than the OECD average for both scientific and mathematical literacy.
` The PISA results show that Australian students’ performance in mathematical literacy declined between 2003 and 2012, but there was no significant change in scientific literacy between 2006 and 2012.
` Out of 17 selected comparator countries, seven significantly outperformed Australia in mathematical literacy in 2012; this compares with three in 2003.
` Australia’s relative and absolute performance in science and mathematics (year 4 and year 8), as measured by the Trends in International Mathematics and Science Study, has changed little over a number of assessment cycles.
` The TIMSS data show that about a third of year 8 mathematics teachers had neither a major in mathematics nor training in mathematics teaching methodology as part of their teacher preparation.
` Forty per cent of high school mathematics teachers have not studied mathematics to at least second-year level at university. Of the same group, about 40 per cent have not studied teaching methodology in mathematics.
` The required average teaching time for mathematics in Australian primary schools is the same as the OECD average of 17 per cent of total weekly teaching time; the required average time for teaching science in Australian primary schools is 5.7 per cent of total weekly teaching time, below the OECD average of 7.4 per cent.
` Participation rates in year 12 science and mathematics subjects show that in the past 20 years participation in science subjects and advanced or intermediate-level mathematics has declined, while participation in entry-level mathematics has increased.
9.2 BACKGROUND
Economic growth cannot be sustained in the absence of a community of inquiring and capable people, a steady pipeline of specialist STEM skills in the workforce, and general science and mathematical literacy in the community.
The STEM pipeline begins in schools, which play a crucial role in stimulating and nurturing student interest in STEM disciplines. These fields are perceived as ‘hard’ by some students (ATSE 2013; Goodrum et al. 2011), and early engagement and inspirational teaching are essential to help students see the benefits of learning—and excelling at—STEM. Australia’s STEM teachers at all levels, from primary to tertiary, need to be equipped to deliver inspirational course content and develop all students to their full potential.
Australia also needs school curricula that give priority to inquiry-based learning and the development of problem-solving and higher order thinking skills that will help students learn about STEM and the way STEM is practised. In turn, students of STEM disciplines must be able to see clear pathways from the classroom to a rewarding career.
9. SCHOOLS
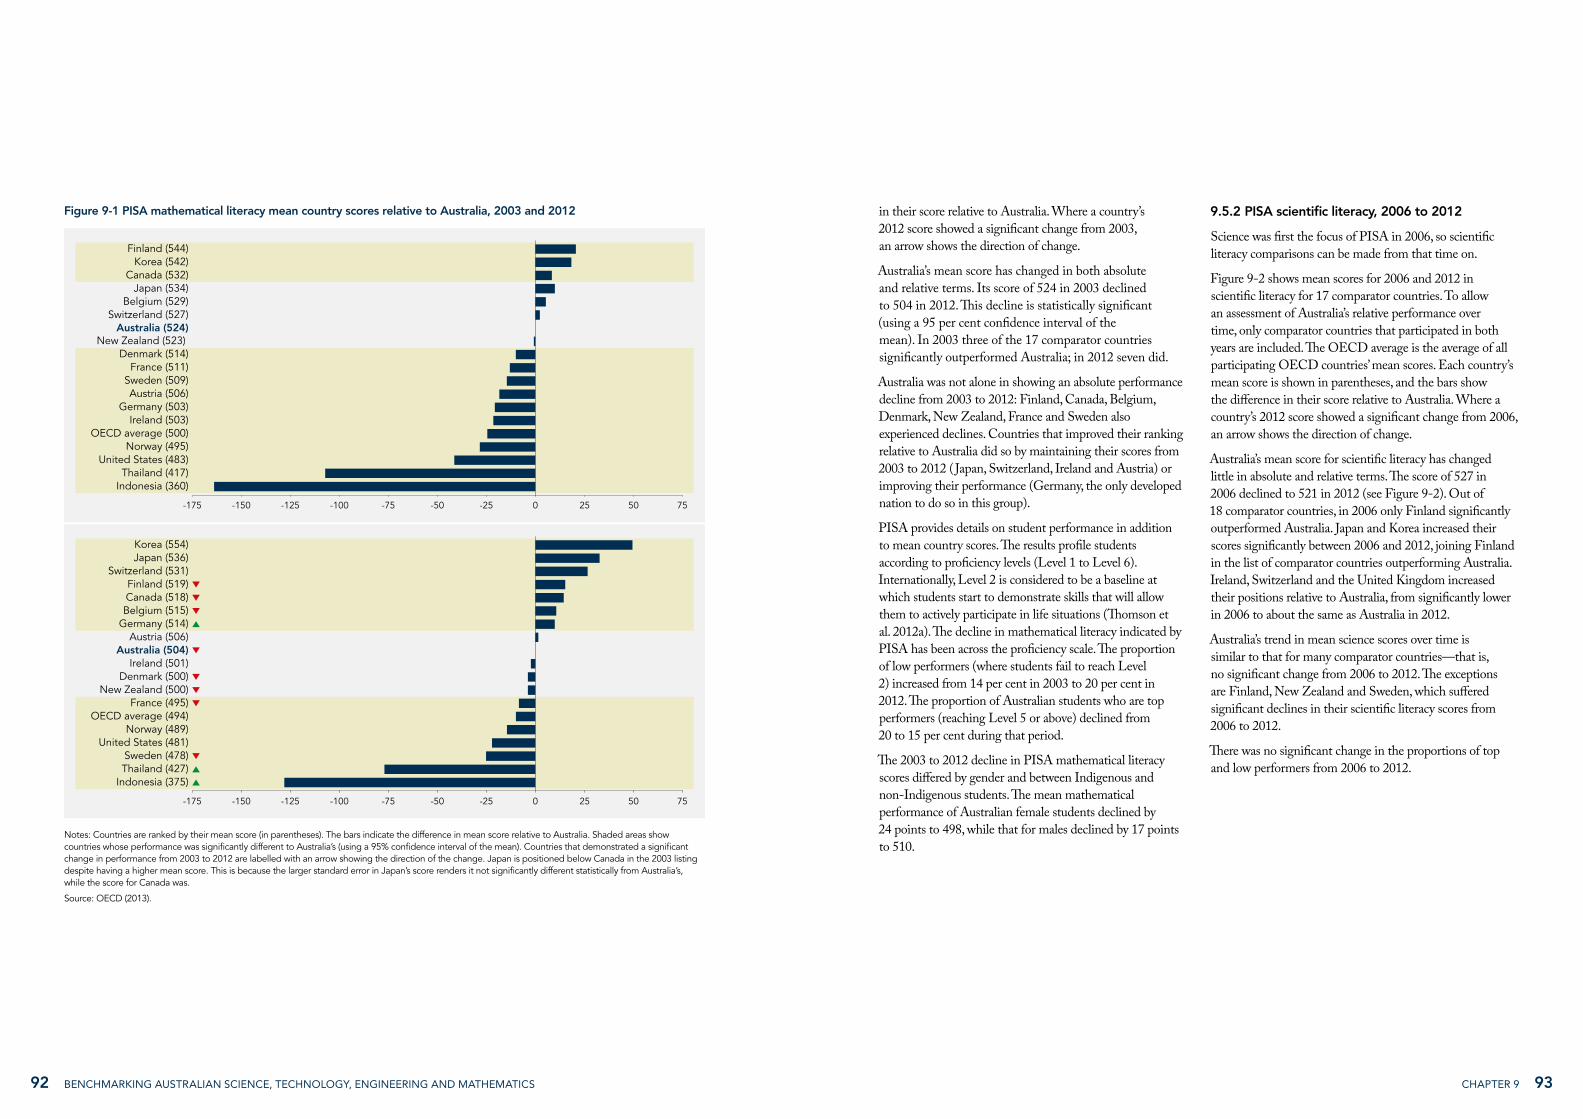
9392 Chapter 9 BENCHMARKING AUSTRALIAN SCIENCE, TECHNOLOGY, ENGINEERING AND MATHEMATICS
in their score relative to Australia. Where a country’s 2012 score showed a significant change from 2003, an arrow shows the direction of change.
Australia’s mean score has changed in both absolute and relative terms. Its score of 524 in 2003 declined to 504 in 2012. This decline is statistically significant (using a 95 per cent confidence interval of the mean). In 2003 three of the 17 comparator countries significantly outperformed Australia; in 2012 seven did.
Australia was not alone in showing an absolute performance decline from 2003 to 2012: Finland, Canada, Belgium, Denmark, New Zealand, France and Sweden also experienced declines. Countries that improved their ranking relative to Australia did so by maintaining their scores from 2003 to 2012 ( Japan, Switzerland, Ireland and Austria) or improving their performance (Germany, the only developed nation to do so in this group).
PISA provides details on student performance in addition to mean country scores. The results profile students according to proficiency levels (Level 1 to Level 6). Internationally, Level 2 is considered to be a baseline at which students start to demonstrate skills that will allow them to actively participate in life situations (Thomson et al. 2012a). The decline in mathematical literacy indicated by PISA has been across the proficiency scale. The proportion of low performers (where students fail to reach Level 2) increased from 14 per cent in 2003 to 20 per cent in 2012. The proportion of Australian students who are top performers (reaching Level 5 or above) declined from 20 to 15 per cent during that period.
The 2003 to 2012 decline in PISA mathematical literacy scores differed by gender and between Indigenous and non-Indigenous students. The mean mathematical performance of Australian female students declined by 24 points to 498, while that for males declined by 17 points to 510.
9.5.2 PISA scientific literacy, 2006 to 2012
Science was first the focus of PISA in 2006, so scientific literacy comparisons can be made from that time on.
Figure 9-2 shows mean scores for 2006 and 2012 in scientific literacy for 17 comparator countries. To allow an assessment of Australia’s relative performance over time, only comparator countries that participated in both years are included. The OECD average is the average of all participating OECD countries’ mean scores. Each country’s mean score is shown in parentheses, and the bars show the difference in their score relative to Australia. Where a country’s 2012 score showed a significant change from 2006, an arrow shows the direction of change.
Australia’s mean score for scientific literacy has changed little in absolute and relative terms. The score of 527 in 2006 declined to 521 in 2012 (see Figure 9-2). Out of 18 comparator countries, in 2006 only Finland significantly outperformed Australia. Japan and Korea increased their scores significantly between 2006 and 2012, joining Finland in the list of comparator countries outperforming Australia. Ireland, Switzerland and the United Kingdom increased their positions relative to Australia, from significantly lower in 2006 to about the same as Australia in 2012.
Australia’s trend in mean science scores over time is similar to that for many comparator countries—that is, no significant change from 2006 to 2012. The exceptions are Finland, New Zealand and Sweden, which suffered significant declines in their scientific literacy scores from 2006 to 2012.
There was no significant change in the proportions of top and low performers from 2006 to 2012.
Figure 9-1 PISA mathematical literacy mean country scores relative to Australia, 2003 and 2012
-175 -150 -125 -100 -75 -50 -25 0 25 50 75
Indonesia (360)Thailand (417)
United States (483)Norway (495)
OECD average (500)Ireland (503)
Germany (503)Austria (506)
Sweden (509)France (511)
Denmark (514)New Zealand (523)
Australia (524)Switzerland (527)
Belgium (529)Japan (534)
Canada (532)Korea (542)
Finland (544)
-175 -150 -125 -100 -75 -50 -25 0 25 50 75
Indonesia (375)Thailand (427)Sweden (478)
United States (481)Norway (489)
OECD average (494)France (495)
New Zealand (500)Denmark (500)
Ireland (501)Australia (504)
Austria (506)Germany (514)Belgium (515)Canada (518)Finland (519)
Switzerland (531)Japan (536)Korea (554)
Notes: Countries are ranked by their mean score (in parentheses). The bars indicate the difference in mean score relative to Australia. Shaded areas show countries whose performance was significantly different to Australia’s (using a 95% confidence interval of the mean). Countries that demonstrated a significant change in performance from 2003 to 2012 are labelled with an arrow showing the direction of the change. Japan is positioned below Canada in the 2003 listing despite having a higher mean score. This is because the larger standard error in Japan’s score renders it not significantly different statistically from Australia’s, while the score for Canada was.
Source: OECD (2013).

9594 Chapter 9 BENCHMARKING AUSTRALIAN SCIENCE, TECHNOLOGY, ENGINEERING AND MATHEMATICS
9.5.3 TIMSS performance: science and mathematics
Not every country has participated in every cycle of TIMSS: some have joined in recent years; others have participated on and off. This makes inter-country comparisons going back through the cycles difficult. As a result, this section focuses on 2011 results.
Table 9-1 presents the mean mathematics achievement results for comparator countries that participated in TIMSS in 2011, for years 4 and 8. Countries are ranked by their mean score. Countries that outperformed Australia (using a 95 per cent confidence interval of the mean) are listed above Australia; those that Australia outperformed are listed below.
Australia’s performance relative to this group of countries is similar for year 4 and year 8 students. The main difference is that year 4 students in Finland, England and the United States performed significantly better than Australian students on average, while year 8 students from those countries performed similarly to Australian students.
In addition to those shown in Table 9-1, a number of other comparator countries outperformed Australia in TIMSS based on year 4 mean mathematical achievement scores. They are not shown in the table because they did not participate in the year 8 mathematical TIMSS. These countries and their 2011 year 4 mathematical achievement scores are Northern Ireland (562), Belgium (549), Denmark (537), Germany (528) and Ireland (527).
Looking back at previous rounds of TIMSS in which the comparator countries participated, Australia’s relative position has changed little. For the most part, countries that outperform us now have done so in the past (Thomson et al. 2012b, 2012c). The same goes for countries that we outperform. Two notable exceptions are England and the United States. In 1995 Australia significantly outperformed England in both year 4 and year 8 mathematical achievement; by 2011, however, England had a higher score for both groups (significantly higher for year 4 students, higher but not significantly so for year 8). The United States also improved its position relative to Australia (year 8 students) between 1995 and 2011.
Table 9-2 presents the mean science achievement results for comparator countries that participated in the 2011 TIMSS in both years 4 and 8. Countries are ranked by their mean score. Countries that outperformed Australia (using a 95 per cent confidence interval of the mean) are listed above Australia; those that Australia outperformed are listed below.
Australia’s performance relative to this group of countries is similar for year 4 and year 8 students. The main difference is that more countries had a significantly higher mean science score than Australia based on year 4 results compared with year 8.
In addition to those shown in Table 9-2, a number of other comparator countries outperformed Australia on year 4
Figure 9-2 PISA scientific literacy mean country scores relative to Australia, 2006 and 2012
-160 -140 -120 -100 -80 -60 -40 -20 0 20 40 60
-160 -140 -120 -100 -80 -60 -40 -20 0 20 40 60
Indonesia (393)Thailand (421)Norway (487)
United States (489)France (495)
Denmark (496)OECD average (498)
Sweden (503)Ireland (508)
Belgium (510)Austria (511)
Switzerland (512)United Kingdom (515)
Germany (516)Korea (522)
Australia (527)New Zealand (530)
Japan (531)Canada (534)Finland (663)
Indonesia (382)Thailand (444)Sweden (485)Norway (495)
United States (497)Denmark (498)
France (499)OECD average (501)
Belgium (505)Austria (506)
New Zealand (516)United Kingdom (514)
Switzerland (515)Australia (521)
Ireland (522)Germany (524)
Canada (525)Korea (538)
Finland (545)Japan (547)
Notes: Countries are ranked by their mean score (in parentheses). The bars indicate the difference in mean score relative to Australia. Shaded areas show countries whose performance was significantly different to Australia’s (using a 95% confidence interval of the mean). Countries that demonstrated a significant change in performance from 2006 to 2012 are labelled with an arrow showing the direction of the change. New Zealand is positioned below Switzerland and the United Kingdom in the 2012 listing despite having a higher mean score. This is because the standard error in New Zealand’s 2012 score rendered it significantly lower statistically than Australia’s, while the smaller standard errors in the scores for Switzerland and the United Kingdom did not.
Source: OECD (2013).
Table 9-1 Mean mathematics achievement in TIMSS 2011: year 4 and year 8, selected countries
Year 4 Year 8
Singapore 605 Korea 613
Korea 605 Singapore 611
Japan 585 Japan 570
Finland 545 Finland 514
England 542 United States 509
United States 541 England 507
Australia 516 Australia 505
Sweden 504 New Zealand 488
Norway 495 Sweden 484
New Zealand 486 Norway 475
Thailand 458 Thailand 427
Notes: The TIMSS achievement scale is normalised, setting 500 points as the mean of overall achievement, with a standard deviation of 100 points. In TIMSS 2011 there were 52 participating countries in the year 4 assessment and 45 in the year 8 assessment. Yellow shading indicates countries with a mean mathematics achievement not significantly different from that of Australia.
Source: TIMSS 2011 international results in mathematics.
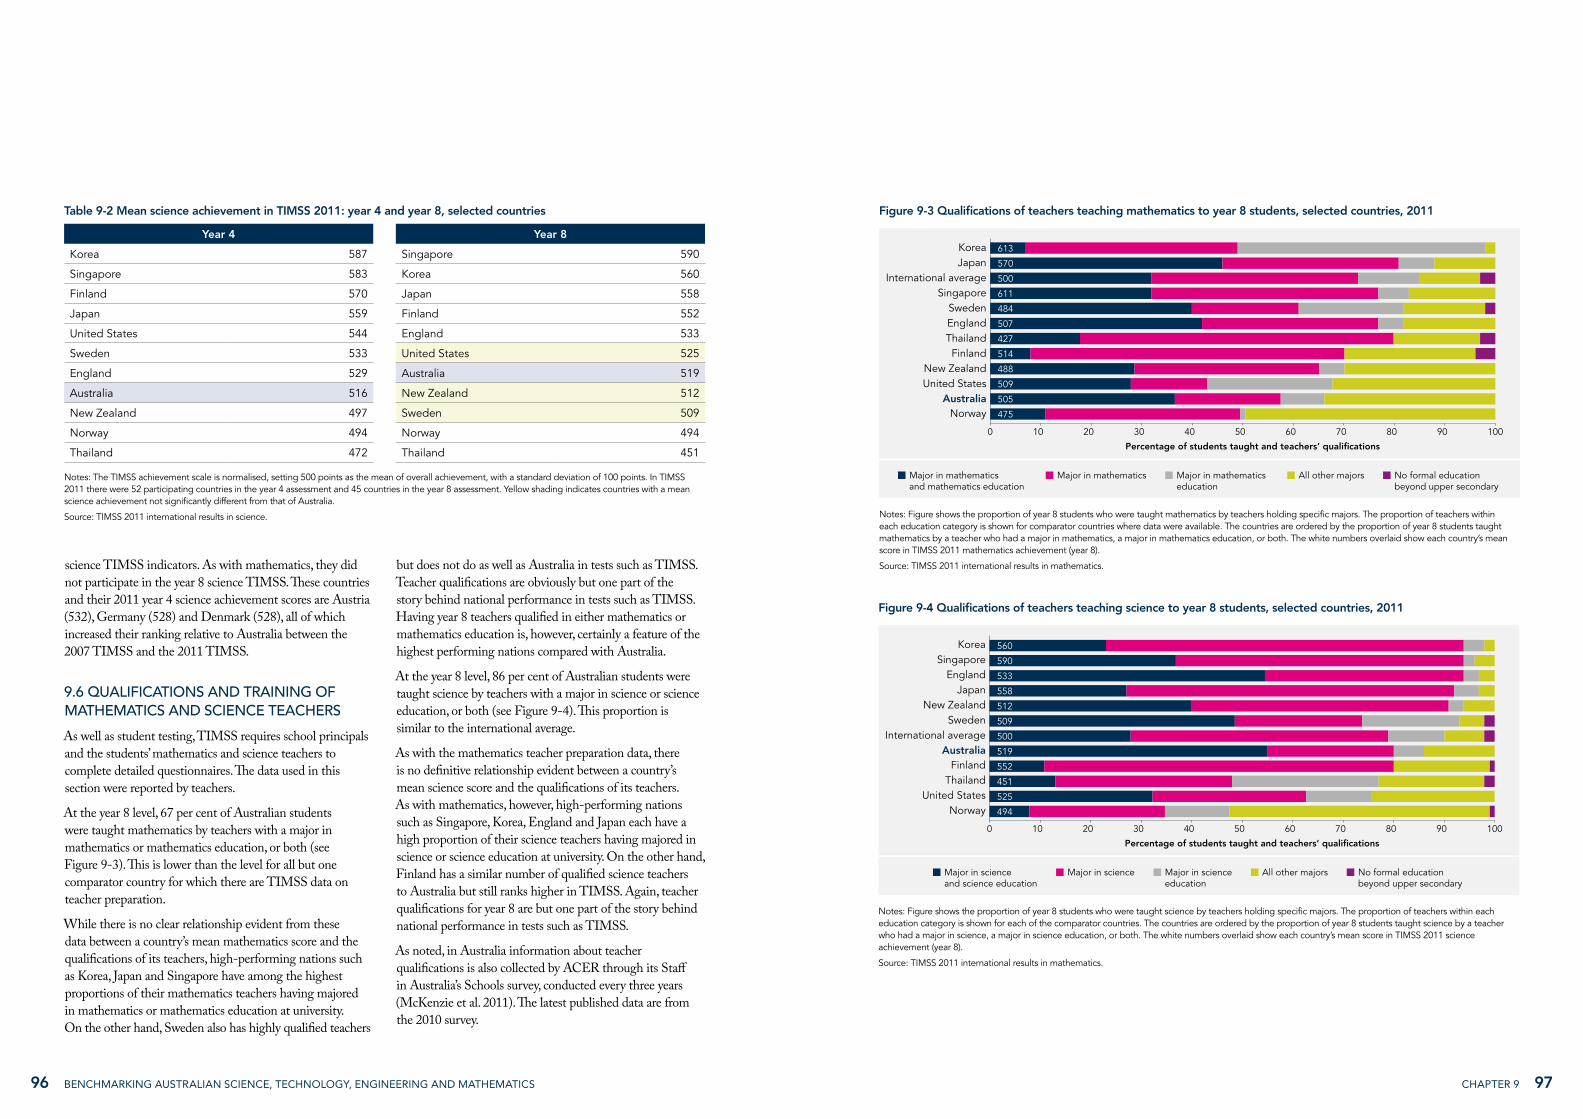
9796 Chapter 9 BENCHMARKING AUSTRALIAN SCIENCE, TECHNOLOGY, ENGINEERING AND MATHEMATICS
science TIMSS indicators. As with mathematics, they did not participate in the year 8 science TIMSS. These countries and their 2011 year 4 science achievement scores are Austria (532), Germany (528) and Denmark (528), all of which increased their ranking relative to Australia between the 2007 TIMSS and the 2011 TIMSS.
9.6 QUALIFICATIONS AND TRAINING OF MATHEMATICS AND SCIENCE TEACHERS
As well as student testing, TIMSS requires school principals and the students’ mathematics and science teachers to complete detailed questionnaires. The data used in this section were reported by teachers.
At the year 8 level, 67 per cent of Australian students were taught mathematics by teachers with a major in mathematics or mathematics education, or both (see Figure 9-3). This is lower than the level for all but one comparator country for which there are TIMSS data on teacher preparation.
While there is no clear relationship evident from these data between a country’s mean mathematics score and the qualifications of its teachers, high-performing nations such as Korea, Japan and Singapore have among the highest proportions of their mathematics teachers having majored in mathematics or mathematics education at university. On the other hand, Sweden also has highly qualified teachers
but does not do as well as Australia in tests such as TIMSS. Teacher qualifications are obviously but one part of the story behind national performance in tests such as TIMSS. Having year 8 teachers qualified in either mathematics or mathematics education is, however, certainly a feature of the highest performing nations compared with Australia.
At the year 8 level, 86 per cent of Australian students were taught science by teachers with a major in science or science education, or both (see Figure 9-4). This proportion is similar to the international average.
As with the mathematics teacher preparation data, there is no definitive relationship evident between a country’s mean science score and the qualifications of its teachers. As with mathematics, however, high-performing nations such as Singapore, Korea, England and Japan each have a high proportion of their science teachers having majored in science or science education at university. On the other hand, Finland has a similar number of qualified science teachers to Australia but still ranks higher in TIMSS. Again, teacher qualifications for year 8 are but one part of the story behind national performance in tests such as TIMSS.
As noted, in Australia information about teacher qualifications is also collected by ACER through its Staff in Australia’s Schools survey, conducted every three years (McKenzie et al. 2011). The latest published data are from the 2010 survey.
Table 9-2 Mean science achievement in TIMSS 2011: year 4 and year 8, selected countries
Year 4 Year 8
Korea 587 Singapore 590
Singapore 583 Korea 560
Finland 570 Japan 558
Japan 559 Finland 552
United States 544 England 533
Sweden 533 United States 525
England 529 Australia 519
Australia 516 New Zealand 512
New Zealand 497 Sweden 509
Norway 494 Norway 494
Thailand 472 Thailand 451
Notes: The TIMSS achievement scale is normalised, setting 500 points as the mean of overall achievement, with a standard deviation of 100 points. In TIMSS 2011 there were 52 participating countries in the year 4 assessment and 45 countries in the year 8 assessment. Yellow shading indicates countries with a mean science achievement not significantly different from that of Australia.
Source: TIMSS 2011 international results in science.
Figure 9-3 Qualifications of teachers teaching mathematics to year 8 students, selected countries, 2011
804020100 9060 7030 10050
Percentage of students taught and teachers’ qualifications
Major in mathematics and mathematics education
Major in mathematics Major in mathematics education
All other majors No formal education beyond upper secondary
AustraliaNorway
United StatesNew Zealand
FinlandThailandEnglandSweden
SingaporeInternational average
JapanKorea
475
505
509
488
514
427
507
484
611
500
570
613
Notes: Figure shows the proportion of year 8 students who were taught mathematics by teachers holding specific majors. The proportion of teachers within each education category is shown for comparator countries where data were available. The countries are ordered by the proportion of year 8 students taught mathematics by a teacher who had a major in mathematics, a major in mathematics education, or both. The white numbers overlaid show each country’s mean score in TIMSS 2011 mathematics achievement (year 8).
Source: TIMSS 2011 international results in mathematics.
Figure 9-4 Qualifications of teachers teaching science to year 8 students, selected countries, 2011
804020100 9060 7030 10050
Percentage of students taught and teachers’ qualifications
Major in scienceand science education
Major in science Major in scienceeducation
All other majors No formal education beyond upper secondary
Norway
Australia
United StatesThailandFinland
International averageSweden
New ZealandJapan
EnglandSingapore
Korea
494
525
451
552
519
500
509
512
558
533
590
560
Notes: Figure shows the proportion of year 8 students who were taught science by teachers holding specific majors. The proportion of teachers within each education category is shown for each of the comparator countries. The countries are ordered by the proportion of year 8 students taught science by a teacher who had a major in science, a major in science education, or both. The white numbers overlaid show each country’s mean score in TIMSS 2011 science achievement (year 8).
Source: TIMSS 2011 international results in mathematics.

9998 Chapter 9 BENCHMARKING AUSTRALIAN SCIENCE, TECHNOLOGY, ENGINEERING AND MATHEMATICS
average of 7.4 per cent and below the level for many other comparator countries for which there are data (see Figure 9-5). Although the data are difficult to compare because of different curriculum policies, they nevertheless provide an indication of how much formal instruction time is considered necessary for students to achieve the desired educational goals.
Table 9-4 shows the recommended indicative teaching hours endorsed by ministers responsible for education in each Australian state and territory.
The proportion of time per week that Australian primary students should be taught mathematics is about 17 per cent, which is the same as the OECD average and similar to or higher than the proportion in most comparator countries (see Figure 9-6).
9.8 AUSTRALIAN STUDENTS’ PARTICIPATION IN SCIENCE AND MATHEMATICS
The final year of secondary school in Australia offers students the flexibility to choose the subjects they wish to study. Neither science nor mathematics is compulsory: these subjects are offered alongside many other competing subjects.
Numerous school-leaving qualifications are available to Australian students. They are administered by the states and territories and the International Baccalaureate. Each has its own offering of subjects and uses different labels for those subjects (Kennedy et al. 2014). To discern national trends in the study of science and mathematics, it is necessary to combine enrolment data from the various jurisdictions.
Table 9-3 shows the estimated proportions of Australian science and mathematics teachers (for selected secondary school year levels) who have been formally trained in the fields in which they are teaching. Of the teachers who teach mathematics to secondary school students (years 7/8 to 10), 61 per cent have studied mathematics at university to at least second-year level. Of this group, 60 per cent have had formal training in mathematics teaching methodology. The data do not show the extent to which these groups overlap.
Senior school mathematics teachers were more highly qualified as a group. About two-thirds (64 per cent) had studied mathematics at third-year level at university and 76 per cent had studied mathematics teaching methodology. Chemistry and physics teachers in senior secondary school
(years 11 and 12) had nearly all studied at least one semester (first-year level) of their teaching subject at university. Only half of senior secondary school physics teachers, however, had studied physics in their third year at university.
9.7 TIME DEVOTED TO TEACHING MATHEMATICS AND SCIENCE
The amount of time spent teaching science and mathematics in schools is another indicator used for benchmarking science and mathematics education in Australian schools.
In 2011 the average time Australian primary students should have been taught science was 5.7 per cent of formal instruction time, which is below the OECD
Table 9-3 Australian teachers teaching in selected fields: level of tertiary study in teaching field and training in subject methodology
Field of teaching (school year)
Teachers with some tertiary study in field of teaching at third-year level (%)
Teachers with some tertiary study in field of teaching at second-year level (%)
Teachers with some tertiary study in field of teaching at first-year level (%)
Teachers with methodology training in field of teaching (%)
Mathematics (7/8–10) 46 61 77 60
Mathematics (11–12) 64 81 90 76
Physics (11–12) 54 71 91 57
Chemistry (11–12) 75 90 96 67
Source: ACER, 2010 Staff in Australia’s Schools survey.
Figure 9-5 Legislated proportion of time spent teaching science in primary education as a proportion of total compulsory education time, 2011
128420 14106
Percentage
Australia
GermanyIreland
NorwayDenmark
FranceKorea
OECD averageCanada
JapanFinland
IndonesiaAustria
Note: Figure shows the minimum proportion of time that is expected to be spent teaching science in primary school, as mandated by each country. Data are calculated based on the intended hours of instruction as a proportion of the total intended teaching hours per week during primary school. Differences may exist across countries between the regulated minimum hours of instruction and the actual hours of instruction received by students. Indonesia data included the last three years of primary education only. Denmark data exclude the first year of primary education.
Source: OECD (2011a), ACARA (2013).
Figure 9-6 Legislated proportion of time spent teaching mathematics in primary education as a proportion of total compulsory education time, selected countries, 2011
1050 2015
Percentage
Australia
IrelandKorea
IndonesiaGermany
FinlandJapan
NorwayAustria
OECD averageDenmark
CanadaBelgium
France
Note: Figure shows the minimum proportion of time that is expected to be spent teaching mathematics in primary school, as mandated by each country. Data are calculated based on the intended hours of instruction as a proportion of the total intended teaching hours per week during primary school. Differences may exist across countries between the regulated minimum hours of instruction and the actual hours of instruction received by students. Indonesia data included the last three years of primary education only. Denmark data exclude the first year of primary education.
Sources: OECD (2013); ACARA.
Table 9-4 Indicative teaching time in Australia: science, mathematics and technology as a percentage of total teaching time in primary education
Year
Subject F 1 2 3 4 5 6
Mathematics 18 18 18 18 18 16 16
Science 4 4 4 7 7 7 7
Technology 2 2 2 4 4 6 6
Note: F indicates foundation, referring to the year before Year 1.
Source: ACARA.

100 BENCHMARKING AUSTRALIAN SCIENCE, TECHNOLOGY, ENGINEERING AND MATHEMATICS
APPENDIXES
For science subjects such as chemistry, physics and biology this is relatively straightforward; for mathematics it is more complex, there being several mathematics levels on offer. In the data presented here, Kennedy et al. (2014) have classified mathematics courses into three groups—entry mathematics, which includes subjects that are not designed to lead to further tertiary study; intermediate mathematics, which includes subjects that provide a knowledge base for tertiary studies involving minimal mathematical understanding; and advanced mathematics for subjects that provide a specialised knowledge base for tertiary studies in engineering and the physical sciences.
Participation rates in physics, chemistry and biology have declined in the past two decades (see Figure 9-7). Participation rates in advanced mathematics and intermediate mathematics have also declined, and this has been accompanied by an increase in the participation rate for entry mathematics. These participation rates can be viewed in the context of growing year 12 enrolments across Australia, which have increased from nearly 170 000 in 1995 to 220 000 in 2012.
9.9 CONCLUDING REMARKS
The OECD PISA scores show that 15-year-old Australian school students’ performance in mathematics is declining in both absolute and relative terms. From 2003 to 2012 mean PISA scores in mathematics declined and the number of countries performing better than Australia increased. PISA also shows Australian students’ proficiency in mathematics is declining, with the proportion of low performers rising and the proportion of top performers falling. In science, Australia’s overall PISA score has remained relatively unchanged, as has the proportion of low and top performers each year.
PISA primarily assesses year 10 Australian students, who are at a crucial stage in their secondary education. This is when students are making or will soon make decisions about the subjects they will study in senior secondary school. Their choices will be determined by a complex interplay of factors, including the influence of teachers in their central role of delivering science and mathematics education, what students are able to achieve, and what they feel they are both confident about and interested in. The decline in mathematical literacy in students at this crucial stage is indicative of a growing cohort of students who might struggle to participate fully in a range of life situations and jobs in a modern economy.
Figure 9-7 Participation rates of Australian year 12 student in science and mathematics subjects, 1992 to 2012
Par
tici
pat
ion
Rat
e (%
)
30
20
10
0
40
50
2004 2008 20121992 1996 2000 2006 20101994 1998 2002Year
Physics
Chemistry
Biology
Earth sciences
Entry mathematics
Advanced mathematics
Multidisciplinary sciences
Intermediate mathematics
Note: Figure shows the number of students taking a course in science or mathematics as a proportion of the total year 12 population (Kennedy et al. 2014). Students can elect to take one or more science subjects and in some jurisdictions one or more mathematics levels and so may be counted more than once.

103appendix 102 BENCHMARKING AUSTRALIAN SCIENCE, TECHNOLOGY, ENGINEERING AND MATHEMATICS
APPENDIX A
Thomson Reuters InCites publication data were obtained from Web of Science. Web of Science has its own publication classification scheme but, since the aim of this report is to benchmark Australian performance, we chose to use the Australian and New Zealand Standard Research Classification, or ANZSRC, using fields of research. A detailed explanation of the mapping of Web of Science classifications to the ANZSRC for Web of Science publications is provided in the InCites help (Thomson Reuters 2012).
The field of research classification scheme is based on a 2008 report developed by the Australian Bureau of Statistics and Statistics New Zealand and funded in part by the Australian Research Council (www.arc.gov.au/pdf/ANZSRC_FOR_codes). The classification detailed in the ANZSRC document was produced in order to classify and assess the research output of Australia and New Zealand. In 2011 an updated journal list was released for a second round of Excellence in Research for Australia and the Global Comparisons scheme has been updated with this revised mapping.
The field of research scheme is one of three classifications published with the 2008 report. By definition, it allows research and development ‘activity to be categorised according to the field of research … it is the method used in the R&D that is being considered’. There are three hierarchy levels in the published FoR classification scheme—division, group and field. Specific classifications in each level are assigned a unique two-digit, four-digit or six-digit code respectively. Using the published codes in the journal title list (www.arc.gov.au/era/era_2012/era_journal_list) in the mapping for Global Comparisons, we mapped two levels—divisions, as FoR Level 1 with two-digit codes, and groups, as FoR Level 2 with four-digit codes (see Table A-1).
The publications, which were classified using the classification contained in the ANZSRC, are not limited to those published in Australia or New Zealand: publication representation is global in scope and is not limited to the English language. In addition, the journal title list includes ISSNs (International Standard Serial Numbers) for each publication, which can refer to a previous title under which that publication had been published.
Web of Science indexes a segment of the journals published globally. Global Comparisons is based on the individual documents published in this pool of publications. To create a mapping between Web of Science–indexed journals and FoR classifications, journal titles and ISSNs for those journals listed in the Australian Research Council journal title list were matched to the publication information for publications indexed in Web of Science. Based on this match, to each Web of Science–indexed journal, the appropriate Excellence in Research for Australia ID (unique publication ID) was assigned and the match between title and ISSN and all FoR category codes was preserved.
In the published journal title list and for each publication, the FoR2 (division) codes are not published where an FoR4 (group) code belonging to a given division already exists. (For example, a publication categorised as belonging to the FoR4 classification Political Science [FoR4=“1606”] would not be explicitly categorised into the appropriate FoR2 field, Studies in Human Society [FoR2=“16”].) To create the appropriate roll-up, FoR4 codes were truncated and de-duplicated to map journals to an FoR2 classification where no link had previously been explicitly defined. Furthermore, not all journals will be sufficiently specialised to warrant an FoR4 (group) code, so the sum of individual publication counts will not necessarily equal counts of the same at the FoR2 level; all matched publications will be assigned an FoR2 code.
While there is substantial overlap between the two, there are a number of publications in the FoR classifications not included in Web of Science and vice versa. Australian Bureau of Statistics fields of research included in the analysis are 01 to 11. Analysis of field 11 is limited to fields in the Excellence in Research for Australia field cluster Biomedical and Clinical Health Sciences.
FoR TITLE
01 MATHEMATICAL SCIENCES
0101 Pure Mathematics
0102 Applied Mathematics
0103 Numerical and Computational Mathematics
0104 Statistics
0105 Mathematical Physics
0199 Other Mathematical Sciences
02 PHYSICAL SCIENCES
0201 Astronomical and Space Sciences
0202 Atomic, Molecular, Nuclear, Particle and Plasma Physics
0203 Classical Physics
0204 Condensed Matter Physics
0205 Optical Physics
0206 Quantum Physics
0299 Other Physical Sciences
03 CHEMICAL SCIENCES
0301 Analytical Chemistry
0302 Inorganic Chemistry
0303 Macromolecular and Materials Chemistry
0304 Medicinal and Biomolecular Chemistry
0305 Organic Chemistry
0306 Physical Chemistry (Incl. Structural)
0307 Theoretical and Computational Chemistry
0399 Other Chemical Sciences
04 EARTH SCIENCES
0401 Atmospheric Sciences
0402 Geochemistry
0403 Geology
0404 Geophysics
0405 Oceanography
0406 Physical Geography and Environmental Geoscience
0499 Other Earth Sciences
FoR TITLE
05 ENVIRONMENTAL SCIENCES
0501 Ecological Applications
0502 Environmental Science and Management
0503 Soil Sciences
0599 Other Environmental Sciences
06 BIOLOGICAL SCIENCES
0601 Biochemistry and Cell Biology
0602 Ecology
0603 Evolutionary Biology
0604 Genetics
0605 Microbiology
0606 Physiology
0607 Plant Biology
0608 Zoology
0699 Other Biological Sciences
07 AGRICULTURAL & VET SCIENCES
0701 Agriculture, Land and Farm Management
0702 Animal Production
0703 Crop and Pasture Production
0704 Fisheries Sciences
0705 Forestry Sciences
0706 Horticultural Production
0707 Veterinary Sciences
0799 Other Agricultural and Veterinary Sciences
08 INFORMATION & COMPUTING SCIENCES
0801 Artificial Intelligence and Image Processing
0802 Computation Theory and Mathematics
0803 Computer Software
0804 Data Format
0805 Distributed Computing
0806 Information Systems
0807 Library and Information Studies
0899 Other information and computing sciences
Table A-1 ANZSRC Field of Research classifications for STEM fields
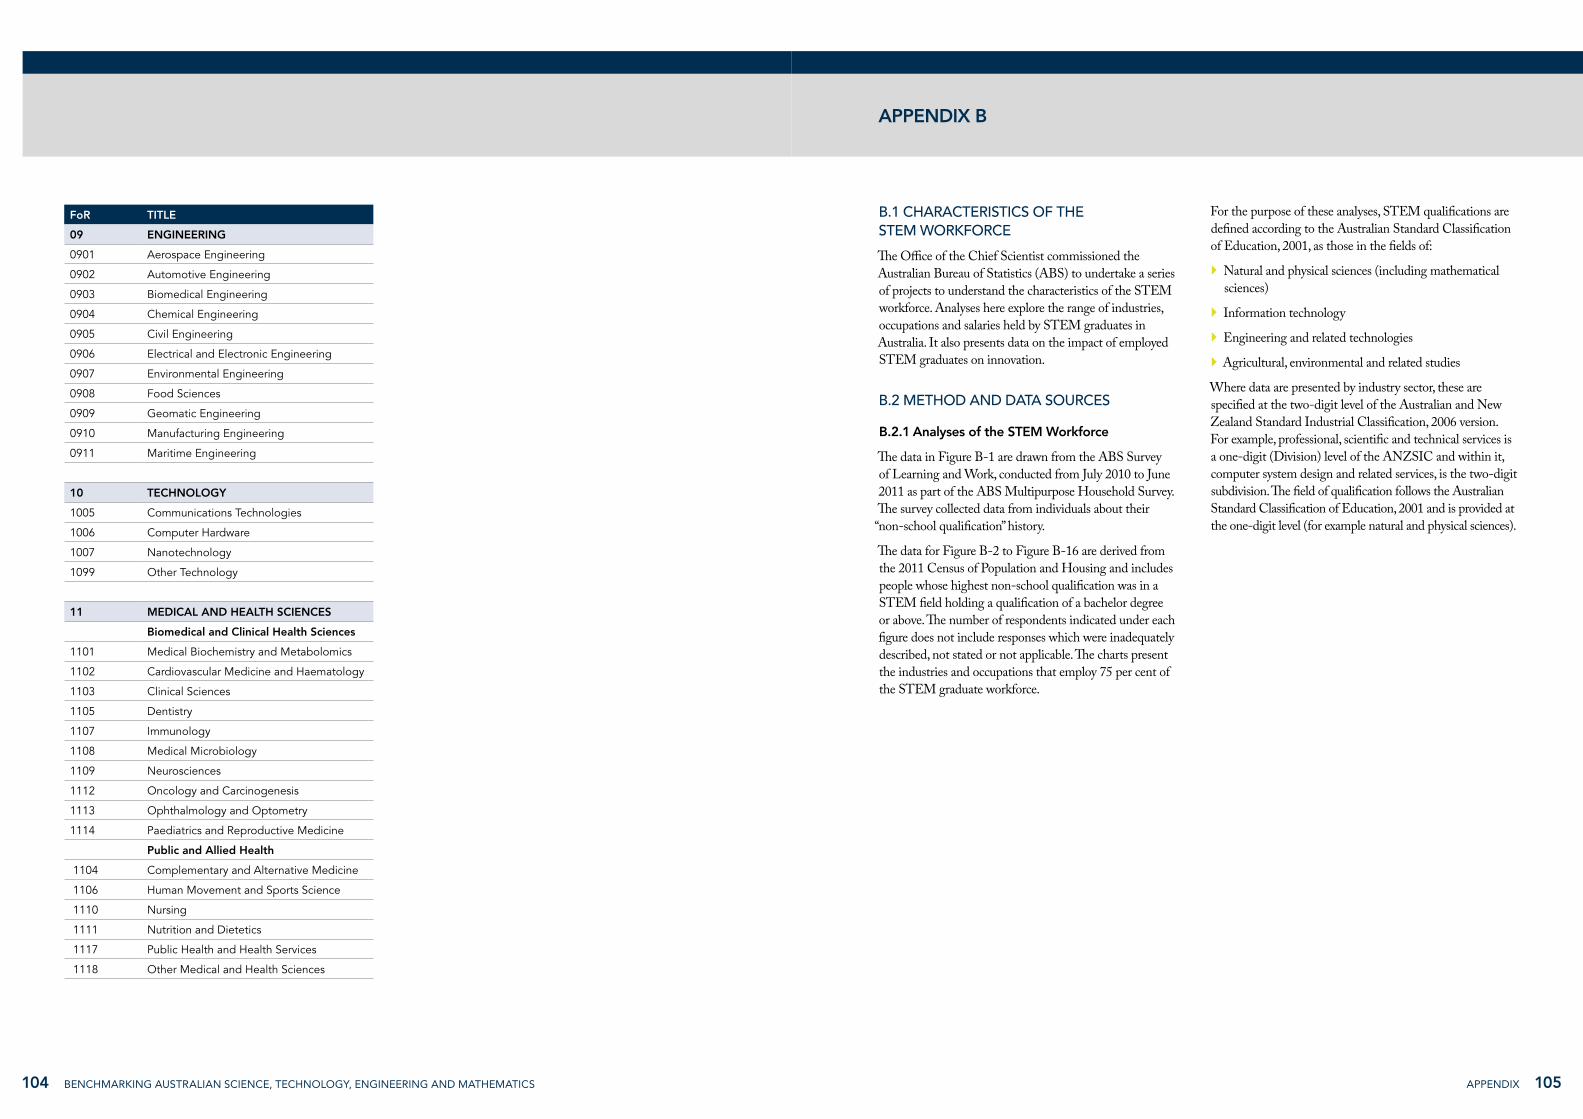
105appendix104 BENCHMARKING AUSTRALIAN SCIENCE, TECHNOLOGY, ENGINEERING AND MATHEMATICS
B.1 CHARACTERISTICS OF THE STEM WORKFORCE
The Office of the Chief Scientist commissioned the Australian Bureau of Statistics (ABS) to undertake a series of projects to understand the characteristics of the STEM workforce. Analyses here explore the range of industries, occupations and salaries held by STEM graduates in Australia. It also presents data on the impact of employed STEM graduates on innovation.
B.2 METHOD AND DATA SOURCES
B.2.1 Analyses of the STEM Workforce
The data in Figure B-1 are drawn from the ABS Survey of Learning and Work, conducted from July 2010 to June 2011 as part of the ABS Multipurpose Household Survey. The survey collected data from individuals about their “non-school qualification” history.
The data for Figure B-2 to Figure B-16 are derived from the 2011 Census of Population and Housing and includes people whose highest non-school qualification was in a STEM field holding a qualification of a bachelor degree or above. The number of respondents indicated under each figure does not include responses which were inadequately described, not stated or not applicable. The charts present the industries and occupations that employ 75 per cent of the STEM graduate workforce.
For the purpose of these analyses, STEM qualifications are defined according to the Australian Standard Classification of Education, 2001, as those in the fields of:
` Natural and physical sciences (including mathematical sciences)
` Information technology
` Engineering and related technologies
` Agricultural, environmental and related studies
Where data are presented by industry sector, these are specified at the two-digit level of the Australian and New Zealand Standard Industrial Classification, 2006 version. For example, professional, scientific and technical services is a one-digit (Division) level of the ANZSIC and within it, computer system design and related services, is the two-digit subdivision. The field of qualification follows the Australian Standard Classification of Education, 2001 and is provided at the one-digit level (for example natural and physical sciences).
APPENDIX B
FoR TITLE
09 ENGINEERING
0901 Aerospace Engineering
0902 Automotive Engineering
0903 Biomedical Engineering
0904 Chemical Engineering
0905 Civil Engineering
0906 Electrical and Electronic Engineering
0907 Environmental Engineering
0908 Food Sciences
0909 Geomatic Engineering
0910 Manufacturing Engineering
0911 Maritime Engineering
10 TECHNOLOGY
1005 Communications Technologies
1006 Computer Hardware
1007 Nanotechnology
1099 Other Technology
11 MEDICAL AND HEALTH SCIENCES
Biomedical and Clinical Health Sciences
1101 Medical Biochemistry and Metabolomics
1102 Cardiovascular Medicine and Haematology
1103 Clinical Sciences
1105 Dentistry
1107 Immunology
1108 Medical Microbiology
1109 Neurosciences
1112 Oncology and Carcinogenesis
1113 Ophthalmology and Optometry
1114 Paediatrics and Reproductive Medicine
Public and Allied Health
1104 Complementary and Alternative Medicine
1106 Human Movement and Sports Science
1110 Nursing
1111 Nutrition and Dietetics
1117 Public Health and Health Services
1118 Other Medical and Health Sciences

107106 appendix BENCHMARKING AUSTRALIAN SCIENCE, TECHNOLOGY, ENGINEERING AND MATHEMATICS
Figure B-2 STEM graduates (bachelor and above) by industry of employment, 2011
1614102 6 181280 4
Percentage of graduates
Food RetailingConstruction Services
AgriculturePublic Order, Safety and Regulatory Services
Electricity SupplyFood Product Manufacturing
Heavy and Civil Engineering ConstructionDefence
Administrative ServicesBasic Chemical Product Manufacturing
Building ConstructionMetal Ore Mining
Auxiliary Finance and Insurance ServicesFood and Beverage Services
Telecommunications ServicesHospitals
Machinery and Equipment WholesalingMachinery and Equipment Manufacturing
Other Store-Based RetailingMedical and Other Health Care Services
Preschool and School EducationFinance
Tertiary EducationPublic Administration
Computer System Design and Related ServicesProfessional, Scientific and Technical Services
Notes: The total number of respondents was 557 834. Professional, scientific and technical services (except computer system design and related services) and basic chemical and chemical product manufacturing industries have been abbreviated.
Source: ABS (2011).
Figure B-4 STEM graduates (bachelor and above) by occupation, 2011
5 15 25200 10
Percentage of graduates
Sales Assistants and SalespersonsHospitality, Retail and Service Managers
Office Managers and Program AdministratorsEducation Professionals
Engineering, ICT and Science TechniciansBusiness, HR and Marketing Professionals
Specialist ManagersICT Professionals
Design, Engineering, Science, Transport
Notes: The total number of respondents was 557 979. Design, engineering, science and transport professionals has been abbreviated.
Source: ABS (2011).
Figure B-1 Highest qualification by field and level, 2010–11
16008004002000 18001200 1400600 1000
Thousands
Certificate III to Advanced Diploma Bachelor to Graduate Diploma Postgraduate degree
Natural and Physical Sciences
Information Technology
Engineering and RelatedTechnologies
Agriculture, Environmentaland Related Studies
Notes: These population data are based on a sample of 13 366 fully responding households, which represented a response rate of 78 per cent. Data cover all persons aged 15 and above.
Source: ABS (2012c).
Figure B-3 Natural and physical science graduates (bachelor and above) by industry of employment, 2011
14102 6 161280 4
Percentage of graduates
Exploration and Other Mining Support ServicesMachinery and Equipment Wholesaling
Administrative ServicesFood Retailing
Other Goods WholesalingAuxiliary Finance and Insurance Services
Food Product ManufacturingMetal Ore Mining
Public Order, Safety and Regulatory ServicesFood and Beverage Services
FinanceOther Store-Based Retailing
Basic Chemical ManufacturingComputer System Design and Related Services
HospitalsPreschool and School Education
Medical and Other Health Care ServicesPublic Administration
Tertiary EducationProfessional, Scientific and Technical Services
Notes: The total number of respondents was 172 482. Professional, scientific and technical services (except computer system design and related services) and basic chemical and chemical product manufacturing industries have been abbreviated.
Source: ABS (2011).

109108 appendix BENCHMARKING AUSTRALIAN SCIENCE, TECHNOLOGY, ENGINEERING AND MATHEMATICS
Figure B-5 Natural and physical science graduates (bachelor and above) by occupation, 2011
5 15 25200 10
Percentage of graduates
Hospitality, Retail and Service ManagersSales Assistants and Salespersons
Office Managers and Program AdministratorsProfessionals, not further defined
Health ProfessionalsICT Professionals
Engineering, ICT and Science TechniciansBusiness, HR and Marketing Professionals
Education ProfessionalsSpecialist Managers
Design, Engineering, Science, Transport
Notes: The total number of respondents was 172 574. Design, engineering, science and transport professionals has been abbreviated. Professionals not further defined refers to occupations that could not be assigned to a specific occupational category within the broader (major) category of professionals but is known to be an occupation in the professionals category.
Source: ABS (2011).
Figure B-8 Engineering and related technologies graduates (bachelor and above) by industry of employment, 2011
5 15 200 2510
Percentage of graduates
Basic Chemical ManufacturingTransport Support Services
FinanceFood Product ManufacturingFood and Beverage Services
Oil and Gas ExtractionOther Store-Based Retailing
Water Supply, Sewerage and Drainage ServicesPrimary Metal and Metal Product Manufacturing
DefenceConstruction Services
Metal Ore MiningElectricity Supply
Telecommunications ServicesTransport Equipment Manufacturing
Machinery and Equipment WholesalingBuilding Construction
Heavy and Civil Engineering ConstructionTertiary Education
Machinery and Equipment ManufacturingPublic Administration
Computer System Design and Related ServicesProfessional, Scientific and Technical Services
Notes: The total number of respondents was 206 545. Professional, scientific and technical services (except computer system design and related services) has been abbreviated.
Source: ABS (2011).
Figure B-6 Information Technology graduates (bachelor and above) by industry of employment, 2011
5 15 200 25 3010
Percentage of graduates
Machinery and Equipment ManufacturingRoad Transport
Public Order, Safety and Regulatory ServicesPreschool and School Education
Food RetailingFood and Beverage Services
Administrative ServicesInsurance and Superannuation Funds
Other Store-Based RetailingAuxiliary Finance and Insurance ServicesMachinery and Equipment Wholesaling
Telecommunications ServicesTertiary Education
FinanceProfessional, Scientific and Technical Services
Public AdministrationComputer System Design and Related Services
Notes: The total number of respondents was 136 064. Professional, scientific and technical services (except computer system design and related services) has been abbreviated.
Source: ABS (2011).
Figure B-7 Information Technology graduates (bachelor and above) by occupation, 2011
10 30 400 5020
Percentage of graduates
Office Managers and Program AdministratorsHospitality, Retail and Service Managers
Engineering, ICT and Science TechniciansBusiness, HR and Marketing Professionals
Specialist ManagersICT Professionals
Notes: The total number of respondents was 135 245.
Source: ABS (2011).

111110 appendix BENCHMARKING AUSTRALIAN SCIENCE, TECHNOLOGY, ENGINEERING AND MATHEMATICS
Figure B-10 Agriculture, environmental and related studies graduates (bachelor and above) by industry of employment, 2011
5 150 2010
Percentage of graduates
Basic Chemical and Chemical Product ManufacturingFood Retailing
Metal Ore MiningFinance
Building Cleaning, Pest Control, Support ServicesWater Supply, Sewerage and Drainage Services
Food and Beverage ServicesFood Product ManufacturingPersonal and Other Services
Construction ServicesAgriculture, Forestry and Fishing Support Services
Public Order, Safety and Regulatory ServicesHeritage Activities
Basic Material WholesalingOther Store-Based Retailing
Preschool and School EducationTertiary Education
AgricultureProfessional, Scientific and Technical Services
Public Administration
Notes: The total number of respondents was 42 743. Professional, scientific and technical services (except computer system design and related services) has been abbreviated.
Source: ABS (2011).
Figure B-12 Salaries of STEM graduates (bachelor and above), 2011
201550 2510
Percentage of STEM/non-STEM graduates
Non-STEM graduatesSTEM graduates
Negative incomeNil income
$1–$10,399$10,400–$15,599$15,600–$20,799$20,800–$31,199$31,200–$41,599$41,600–$51,999$52,000–$64,999$65,000–$77,999
$78,000–$103,999$104,000 or more
Notes: The total number of respondents was 697 483.
Source: ABS (2011).
Figure B-11 Agriculture, environmental and related studies graduates (bachelor and above) by occupation, 2011
5 150 2520 3010
Percentage of graduates
Chief Executives, General Managers and LegislatorsSales Assistants and Salespersons
Farm, Forestry and Garden WorkersHospitality, Retail and Service ManagersSkilled Animal and Horticultural Workers
Engineering, ICT and Science TechniciansOffice Managers and Program Administrators
Education ProfessionalsBusiness, HR and Marketing Professionals
Farmers and Farm ManagersSpecialist Managers
Design, Engineering, Science, Transport
Notes: The total number of respondents was 42 693. Design, engineering, science and transport professionals has been abbreviated.
Source: ABS (2011).
Figure B-9 Engineering and related technologies graduates (bachelor and above) by occupation, 2011
5 15 200 40353025 4510
Percentage of graduates
Office Managers and Program AdministratorsEngineering, ICT and Science TechniciansBusiness, HR and Marketing Professionals
ICT ProfessionalsSpecialist Managers
Design, Engineering, Science, Transport
Notes: The total number of respondents was 207 467. The category Design, engineering, science and transport professionals has been abbreviated.
Source: ABS (2011).

113112 appendix BENCHMARKING AUSTRALIAN SCIENCE, TECHNOLOGY, ENGINEERING AND MATHEMATICS
Figure B-14 STEM doctorate holders by industry of employment, 2011
10 300 4020
Percentage of doctorate holders
Preschool and School EducationHospitals
Computer System Design and Related ServicesPublic Administration
Professional, Scientific and Technical ServicesTertiary Education
Notes: The total number of respondents was 42 440. Professional, scientific and technical services (except computer system design and related services) has been abbreviated.
Source: ABS (2011).
Figure B-15 STEM doctorate holders by occupation, 2011
10 300 4020
Percentage of doctorate holders
Professionals not further defined
Specialist Managers
Education Professionals
Design, Engineering, Science, Transport
Notes: The total number of respondents was 42 414. Professionals not further defined refers to occupations that could not be assigned to a specific occupational category within the broader (major) category of professionals but is known to be an occupation in the professionals category. Design, engineering, science and transport professionals has been abbreviated.
Source: ABS (2011).
Figure B-16 Salaries of STEM doctorate holders, 2011
201550 4010 353025 45
Percentage of doctorate holders
Non-STEM graduatesSTEM graduates
Negative incomeNil income
$1–$10,399$10,400–$15,599$15,600–$20,799$20,800–$31,199$31,200–$41,599$41,600–$51,999$52,000–$64,999$65,000–$77,999
$78,000–$103,999$104,000 or more
Notes: A total 52 925 STEM and 62 194 non-STEM doctorate holders responded.
Source: ABS (2011).
Figure B-13 Salaries of STEM and non-STEM graduates by field of qualification (bachelor and above), 2011
Information Technology
Natural and Physical Sciences Non-STEM
Agriculture, Environmental and Related Studies Engineering and Related Technologies
201550 3010 25 35
Percentage of graduates
Negative income
Nil income
$1–$10,399
$10,400–$15,599
$15,600–$20,799
$20,800–$31,199
$31,200–$41,599
$41,600–$51,999
$52,000–$64,999
$65,000–$77,999
$78,000–$103,999
$104,000 or more
Notes: A total of 697 483 STEM graduates and 2 535 800 non-STEM graduates responded.
Source: ABS (2011).

114 BENCHMARKING AUSTRALIAN SCIENCE, TECHNOLOGY, ENGINEERING AND MATHEMATICS
SHORTENED FORMS
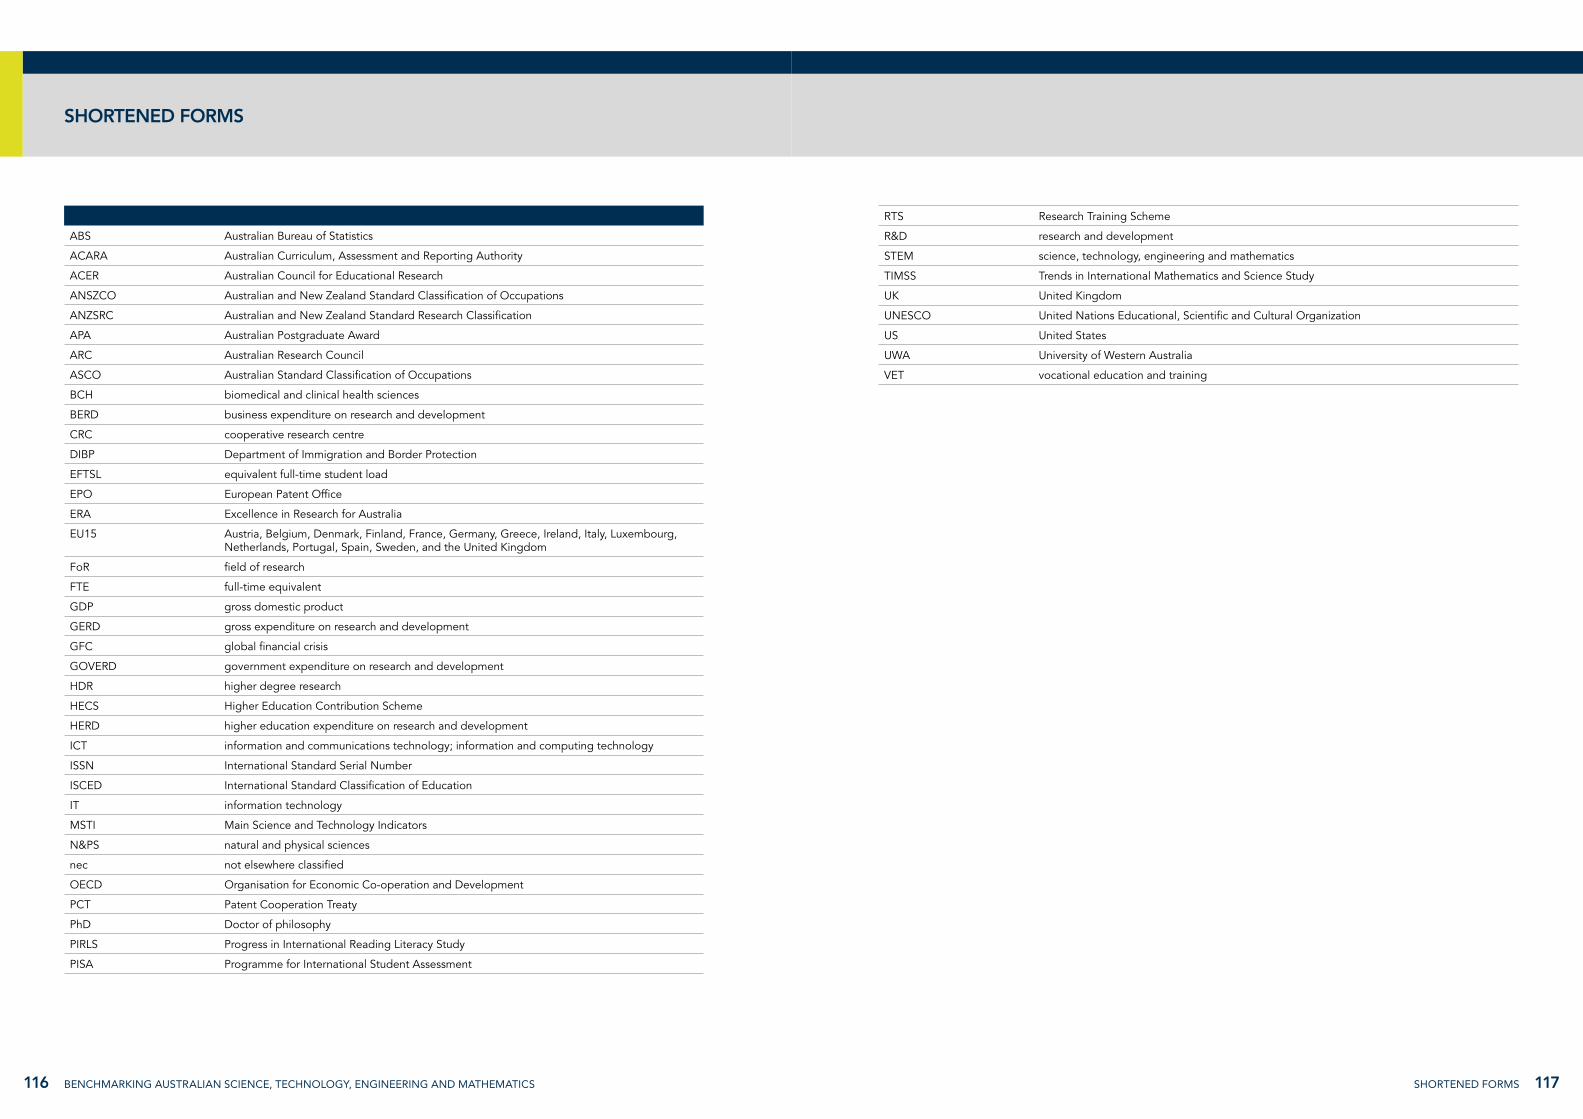
117Shortened FormS 116 BENCHMARKING AUSTRALIAN SCIENCE, TECHNOLOGY, ENGINEERING AND MATHEMATICS
RTS Research Training Scheme
R&D research and development
STEM science, technology, engineering and mathematics
TIMSS Trends in International Mathematics and Science Study
UK United Kingdom
UNESCO United Nations Educational, Scientific and Cultural Organization
US United States
UWA University of Western Australia
VET vocational education and training
SHORTENED FORMS
ABS Australian Bureau of Statistics
ACARA Australian Curriculum, Assessment and Reporting Authority
ACER Australian Council for Educational Research
ANSZCO Australian and New Zealand Standard Classification of Occupations
ANZSRC Australian and New Zealand Standard Research Classification
APA Australian Postgraduate Award
ARC Australian Research Council
ASCO Australian Standard Classification of Occupations
BCH biomedical and clinical health sciences
BERD business expenditure on research and development
CRC cooperative research centre
DIBP Department of Immigration and Border Protection
EFTSL equivalent full-time student load
EPO European Patent Office
ERA Excellence in Research for Australia
EU15 Austria, Belgium, Denmark, Finland, France, Germany, Greece, Ireland, Italy, Luxembourg, Netherlands, Portugal, Spain, Sweden, and the United Kingdom
FoR field of research
FTE full-time equivalent
GDP gross domestic product
GERD gross expenditure on research and development
GFC global financial crisis
GOVERD government expenditure on research and development
HDR higher degree research
HECS Higher Education Contribution Scheme
HERD higher education expenditure on research and development
ICT information and communications technology; information and computing technology
ISSN International Standard Serial Number
ISCED International Standard Classification of Education
IT information technology
MSTI Main Science and Technology Indicators
N&PS natural and physical sciences
nec not elsewhere classified
OECD Organisation for Economic Co-operation and Development
PCT Patent Cooperation Treaty
PhD Doctor of philosophy
PIRLS Progress in International Reading Literacy Study
PISA Programme for International Student Assessment

118 BENCHMARKING AUSTRALIAN SCIENCE, TECHNOLOGY, ENGINEERING AND MATHEMATICS
GLOSSARY

121GloSSary 120 BENCHMARKING AUSTRALIAN SCIENCE, TECHNOLOGY, ENGINEERING AND MATHEMATICS
GLOSSARY
Applied Research Original work done primarily to acquire new knowledge with a specific application in view. It is done either to determine possible uses for the findings of basic research or to determine new ways of achieving some specific and predetermined objectives.
Bachelor degree A bachelor degree qualifies individuals who apply a broad and coherent body of knowledge in a range of contexts to undertake professional work and as a pathway for further learning. The volume of learning of a bachelor degree is typically 3–4 years.
Bibliometrics Bibliometrics involve the application of quantitative analysis and statistics to publications such as journal articles and their accompanying citation counts. Bibliometric analyses of peer-reviewed publications provide insights into how research findings are shared, and credited by other researchers and how they influence the global research effort.
Capital Expenditure Measures the value of purchases of fixed assets, i.e. those assets that are used repeatedly in production processes for more than a year. The value is at full cost price. Sales of fixed assets are not deducted.
Citation The formal acknowledgment of intellectual debt to previously published research.
International co-authorship The proportion of the papers authored by the country that contain a co-author from another country. This is an indicator of the country’s ability to collaborate in a global environment.
Comparator countries Austria, Belgium, Denmark, Finland, France, Germany, Ireland, Norway, Sweden, Switzerland, the United Kingdom, China, India, Indonesia, Japan, Malaysia, the Philippines, Singapore, South Korea, Thailand, Vietnam, the United States, Canada and New Zealand.
Completion When students satisfy the requirements of their course and graduate they are counted as completions.
Doctorate The Doctoral Degree qualifies individuals who apply a substantial body of knowledge to research, investigate and develop new knowledge, in one or more fields of investigation, scholarship or professional practice. The volume of learning of a Doctoral Degree is typically 3–4 years.
Experimental development Systematic work, using existing knowledge gained from research or practical experience, that is directed to producing new materials, products or devices, installing new processes, systems and services, or substantially improving those already produced or installed.
Field-weighted citation rate A measure of the actual citations received compared with the citations expected on the basis of the average of the field.
Higher education Students enrol in higher education courses, which are offered at different levels. Typical course levels include entry-level undergraduate courses such as a bachelor’s degree and higher, research-based degrees such as the PhD (doctorate).
Innovation The implementation of a new or significantly improved product (good or service), or process, a new marketing method, or a new organisational method in business practices, workplace organisation or external relations.
Patent A right granted by a government to an inventor in exchange for the publication of the invention; it entitles the inventor to prevent any third party from using the invention in any way, for an agreed period.
Pure basic research Experimental and theoretical work done in order to acquire new knowledge without looking for long-term benefits other than the advancement of knowledge.
Research and development A term covering three activities: basic research, applied research, and experimental development.
Research Intensity Research intensity refers to R&D expenditure as a share of gross domestic product.
Researcher Professional engaged in the conception or creation of new knowledge, products, processes, methods, and systems, and in the management of the projects concerned.
Standard patent An Australian standard patent gives long-term protection and control over an invention in Australia. It lasts for up to 20 years from the complete application filing date (or up to 25 years for pharmaceutical substances).
STEM Science, Technology, Engineering and Mathematics.
Strategic basic research Experimental and theoretical work done in order to acquire new knowledge directed into specified broad areas in the expectation of useful discoveries. It provides the broad base of knowledge necessary for the solution of recognised practical problems.
The Melbourne Model In 2008 the University of Melbourne introduced major changes to the structure of its undergraduate STEM programs. Under the new model the number of separate bachelor’s degrees offered at the university was reduced and students who wanted eventually to qualify eventually in a specific vocational field such as engineering or medicine would first need to complete a bachelor’s degree in science.
Triadic patent family A set of patent applications filed at the European Patent Office and the Japanese Patent Office, and granted by the United States Patent and Trademark Office, sharing one or more priority applications.

122 BENCHMARKING AUSTRALIAN SCIENCE, TECHNOLOGY, ENGINEERING AND MATHEMATICS
REFERENCES

125reFerenCeS 124 BENCHMARKING AUSTRALIAN SCIENCE, TECHNOLOGY, ENGINEERING AND MATHEMATICS
Dernis, H 2003. OECD Triadic Patent Families, OECD Methodology: an overview. Economic Analysis and Statistics Division, OECD Directorate for Science, Technology and Industry, Paris.
Dernis, H 2007. Nowcasting patent indicators, STI Working Paper 2007/3. OECD Directorate for Science, Technology and Industry, Paris.
DIISR 2012. Innovation Policy Report February 2012. Department of Industry, Innovation, Science, Research and Tertiary Education, Canberra.
Dobson, I 2012. Unhealthy Science? University Natural and Physical Sciences 2002 to 2009/10. Report prepared for the Office of the Chief Scientist, Canberra.
Dobson, IR 2014. Staffing University Science in the Twenty-first Century. Australian Council of Deans of Science, Sydney.
European Commission 2014. HORIZON 2020 in brief. The EU Framework Programme for Research & Innovation. European Commission, Luxembourg.
Eurostat 2012. Europe in figures — Eurostat yearbook 2012. European Commission, Luxembourg.
Goodrum, D, Druhan, A & Abbs, J 2011. The Status and Quality of Year 11 and 12 Science in Australian Schools. Australian Academy of Science, Canberra.
Guellec, D & Potterie, B 2001. The internationalisation of technology analysed with patent data, Research Policy, vol. 30, pp. 1253–66.
Hall, B, Griliches, Z, & Hausman, J 1986. Patents and R and D: Is there a lag? International Economic Review, vol. 27, no. 2, pp. 265–283.
IP Australia 2013. Australian Intellectual Property Report. Online. http://www.ipaustralia.gov.au/about-us/reports/australian-ip-report-2014.
Kennedy, J, Lyons, T & Quinn, F 2014. The continuing decline of science and mathematics enrolments in Australian high schools. Teaching Science, vol. 60, pp. 34–46.
Mara, K 2010. First-ever Drop in Filings under Patent Cooperation Treaty Seen in 2009. Online. http://www.ip-watch.org/2010/02/08/first-ever-drop-in-filings-under-patent-cooperation-treaty-in-2009/
Matthews, M, Biglia, B, Glennie, K & Harris, P 2010. Mapping Australia’s research strengths from an international perspective. FEAST Discussion Paper 1/09. 7th European Framework Programme for RTD. http://www.access4.eu/_img/article/D1_4_Australia_research_strength.pdf
Matthews, M, Biglia, B, Henadeera, K, Desvignes-Hicks, J-F, Faletic, R & Wenholz, O 2009. A bibliometric analysis of Australia’s international research collaboration in science, engineering and technology: analytical methods and initial findings. FEAST discussion paper 1/09. http://marklmatthews.files.wordpress.com/2014/02/matthews_bibliometric2009.pdf.
McKenzie, P, Rowley, G, Weldon, PR & Murphy, M 2011. Staff in Australia’s Schools 2010: main report on the survey. Australian Council for Educational Research, Melbourne. http://research.acer.edu.au/tll_misc/14.
Merrill, SA, Levin, RC & Myers, MB 2004. A Patent System for the 21st Century. The National Academies Press, Arlington VA.
National Science Foundation 2014. Science and Engineering Indicators 2014. National Center for Science and Engineering Statistics, Arlington VA.
OECD 2011a. R&D Expenditure, OECD Science, Technology and Industry Scoreboard 2011. Online.
OECD 2011b. Science, Technology and Industry Scoreboard 2011, Innovation and Growth in Knowledge Economies. Online.
OECD 2012. Science, Technology and Industry Outlook. http://www.oecd.org/sti/oecdsciencetechnologyandindustryoutlook.htm.
OECD 2013. Education at a Glance 2013: OECD indicators. http://www.oecd.org/edu/eag2013%20(eng)--FINAL%2020%20June%202013.pdf.
Office of the Chief Scientist 2012. Health of Australian Science. Australian Government, Canberra.
Prime Minister of Australia 2014. Doorstop interview. http://www.pm.gov.au/media/2014-06-11/doorstop-interview-p-tech-brooklyn.
Thomson Reuters 2008. Using Bibliometrics: a guide to evaluating research performance with citation data. http://thomsonreuters.com/products/ip-science/04_030/using-bibliometrics-a-guide-to-evaluating-research-performance-with-citation-data.pdf.
ABS 2006. Australian and New Zealand Standard Industrial Classification (ANZSIC), 2006 (Revision 1.0). Australian Bureau of Statistics, Canberra. Accessed 1 March 2014 http://www.abs.gov.au/AUSSTATS/[email protected]/0/8464D4BB38214E7DCA25711F00146E44?opendocument.
ABS 2008. Australian and New Zealand Standard Research Classification (ANZSRC). Australian Bureau of Statistics, Canberra. Accessed 1 March 2014 http://www.arc.gov.au/pdf/ANZSRC_FOR_codes.pdf.
ABS 2010. Research and Experimental Development, Businesses, Australia, 2010–11, Australia, Appendix Gross Expenditure on R&D. Australian Bureau of Statistics, Canberra. Accessed 1 March 2014 http://www.abs.gov.au/Ausstats/[email protected]/Previousproducts/8104.0Appendix12010-11.
ABS, 2011. Census of Population and Housing Cat. no. 2011. Australian Bureau of Statistics, Canberra.
ABS 2012a. Research and Experimental Development, Businesses, Australia, 2011–12. Cat. no. 8104.0. Australian Bureau of Statistics, Canberra.
ABS 2012b. Research and Experimental Development, Government and Private Non-profit Organisations, Australia, 2011–12. Cat. no. 8109.0. Australian Bureau of Statistics, Canberra.
ABS 2012c. Learning and Work, Australia, 2010–11. Cat. No. 4235.0. Australian Bureau of Statistics, Canberra.
ABS 2013. Research and Experimental Development, Higher Education Organisations, Australia, 2011–12. Cat. no. 8109.0. Australian Bureau of Statistics, Canberra.
ACARA 2013. Curriculum design paper Version 3.1. Australian Curriculum Assessment and Reporting Authority, Sydney.
Adams, J, Gurney, K & Marshall, S 2007. Patterns of International Collaboration for the UK and Leading Partners: summary report. Report commissioned by the UK Office of Science and Innovation, London. http://image.guardian.co.uk/sys-files/Education/documents/2007/07/13/OSICollaborationSummaryRepo.pdf.
Advisory Council on Intellectual Property 2011. Review of the Innovation Patent System. Issues paper. ACIP, Canberra.
ARC 2013. Annual Report 2012–13. Australian Research Council, Canberra. Accessed 1 March 2014 http://www.arc.gov.au/pdf/annual%20report%2012-13/Annual%20Report%20PDF%20for%20web_Part2.pdf.
ATSE 2013. Advancing STEM Education. Australian Academy of Technological Sciences and Engineering, Melbourne.
AUCC 2009. International Research Collaboration. Association of Universities and Colleges of Canada, Ontario.
Australian Government 2008a. Education, Employment and Workplace Relations. In: Budget Paper no. 2, (ed.). http://www.budget.gov.au/2008-09/content/bp2/html/expense-09a.htm.
Australian Government 2008b. Expense Measures, Industry, Innovation, Science, Research and Tertiary Education. In: Budget Paper no. 2, (ed.). http://www.budget.gov.au/2012-13/content/bp2/html/bp2_expense-15.htm.
Australian Workforce and Productivity Agency 2014. Engineering Workforce. Issues paper. http://www.awpa.gov.au/our-work/sector-specific-skill-needs/Pages/Engineering-workforce-study.aspx.
CIA 2014. The World Factbook — Country Comparison: Population. Central Intelligence Agency, Washington DC, Accessed March 27, 2014 https://www.cia.gov/library/publications/the-world-factbook/rankorder/2119rank.html
Cornell University, INSEAD & WIPO 2014. The Global Innovation Index 2014: the human factor in innovation. Fontainebleau, Ithaca & Geneva.
Department of Employment 2014. Skill Shortages Australia 2012–13 in Engineering Workforce. Issues paper. Australian Workforce and Productivity Agency, Canberra.
Department of Immigration and Border Protection 2014. Temporary Work (Skilled) visa (subclass 457), DIBP, Canberra. http://www.immi.gov.au/Visas/Pages/457.aspx, retrieved 15 April 2014.
Department of Industry n.d. International Collaboration. Online. 1 March 2014. http://www.industry.gov.au/science/internationalcollaboration/Pages/default.aspx.
Department of Industry 2013. Australian Innovation System Report 2013. http://apo.org.au/research/australian-innovation-system-report-2013.
REFERENCES

126 BENCHMARKING AUSTRALIAN SCIENCE, TECHNOLOGY, ENGINEERING AND MATHEMATICS
Thomson Reuters 2012. InCites Help Australia ERA 2012. Accessed 27 June 2014. http://incites-help.isiknowledge.com/incitesLive/globalComparisonsGroup/globalComparisons/subjAreaSchemesGroup/ERAFOR.html.
Thomson Reuters 2013. InCites. Thomson Reuters, New York.
Thomson Reuters 2014. About Highly Cited Researchers. http://highlycited.com/info.htm Accessed 30 June 2014.
Thomson, S, De Bortoli, L & Buckley, S 2012a. PISA 2012: how Australia measures up. Australian Council for Educational Research, Melbourne.
Thomson, S, Hillman, K & Wernert, N 2012b. Monitoring Australian Year 8 Student Achievement Internationally: TIMSS 2011. Australian Council for Educational Research, Melbourne.
Thomson, S, Hillman, K, Wernert, N, Schmid, M, Buckley, S & Munene, A 2012c. Monitoring Australian Year 4 Student Achievement Internationally: TIMSS and PIRLS 2011. In: Australian Council for Educational Research, Melbourne.
West, M 2013. Benchmarking Australian Science Performance. Occasional paper series. Australian Government, Canberra.
Wissenschaftsrat 2010. Recommendations on German Science Policy in the European Research Area. Online.
Wooldridge, J.M. 2010 in Econometric Analysis of Cross Section and Panel Data. MIT Press, Cambridge.
World Intellectual Property Organization 2010. International Patent Filings Dip in 2009 Amid Global Economic Downturn. Accessed 20 June 2014.
