ben c. gerwick, inc. adaptive measures for sea level...
TRANSCRIPT

Adaptive Measures for Sea Level Change
PREVENTION FIRST 2014 1
Jack Gerwick Jean Toilliez
Ben C. Gerwick, Inc.
› Introduction to Sea Level Change › Sea Level Change Project Approach
› Inform › Analyze › Implement
› Case Studies › Questions & Answers
Outline
PREVENTION FIRST 2014 2
Introduction
OCTOBER 20, 2014
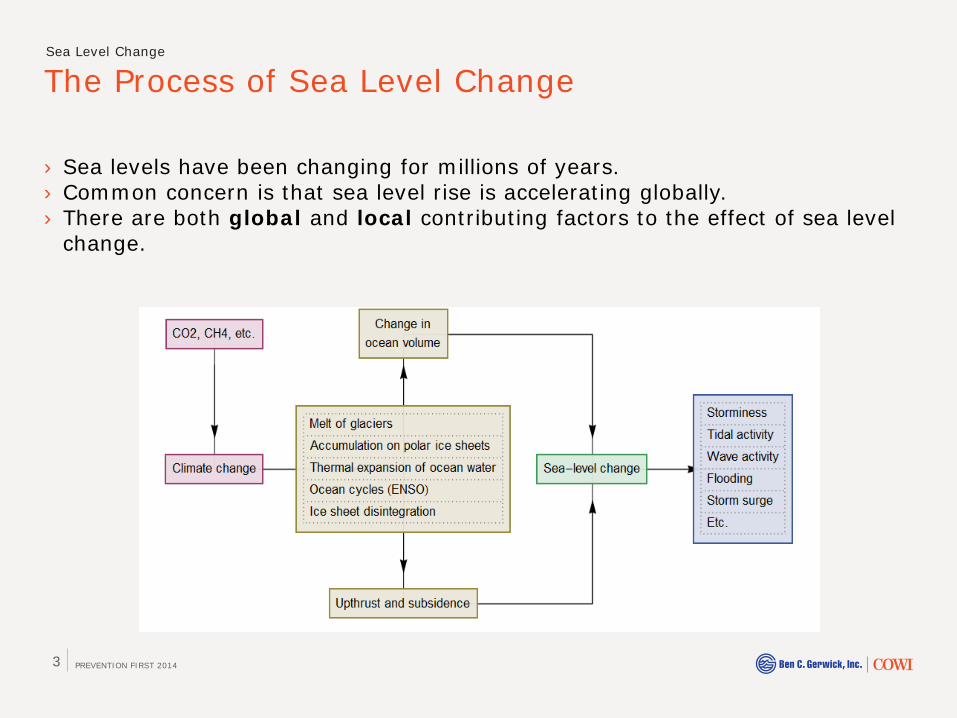
The Process of Sea Level Change
PREVENTION FIRST 2014 3
› Sea levels have been changing for millions of years. › Common concern is that sea level rise is accelerating globally. › There are both global and local contributing factors to the effect of sea level
change.
Sea Level Change

Sea Level Change Projections
PREVENTION FIRST 2014 4
Sea Level Change

› MOTEMS (2013 CBC) › All MOTs shall consider the predicted SLR over the remaining life of the terminal.
Consideration shall include variation in fender locations, additional berthing loads, and components near the splash zone.
› Bay Conservation and Development Commission (BCDC) › New projects affected by future sea level rise must be set back from shoreline to
avoid flooding, be elevated above expected flood levels, be designed to tolerate flooding, or employ other means of addressing flood risks.
› California Coastal Commission › Sea-Level Rise Policy Guidance provides recommended steps for addressing SLR in
Coastal Commission planning and regulatory actions.
California Regulatory Environment
OCTOBER 20, 2014 PREVENTION FIRST 2014 5
Sea Level Change

Approach
Sea Level Change Adaptation And Marine Infrastructure
INFORM ANALYZE IMPLEMENT
PREVENTION FIRST 2014 6
PREVENTION FIRST 2014 7
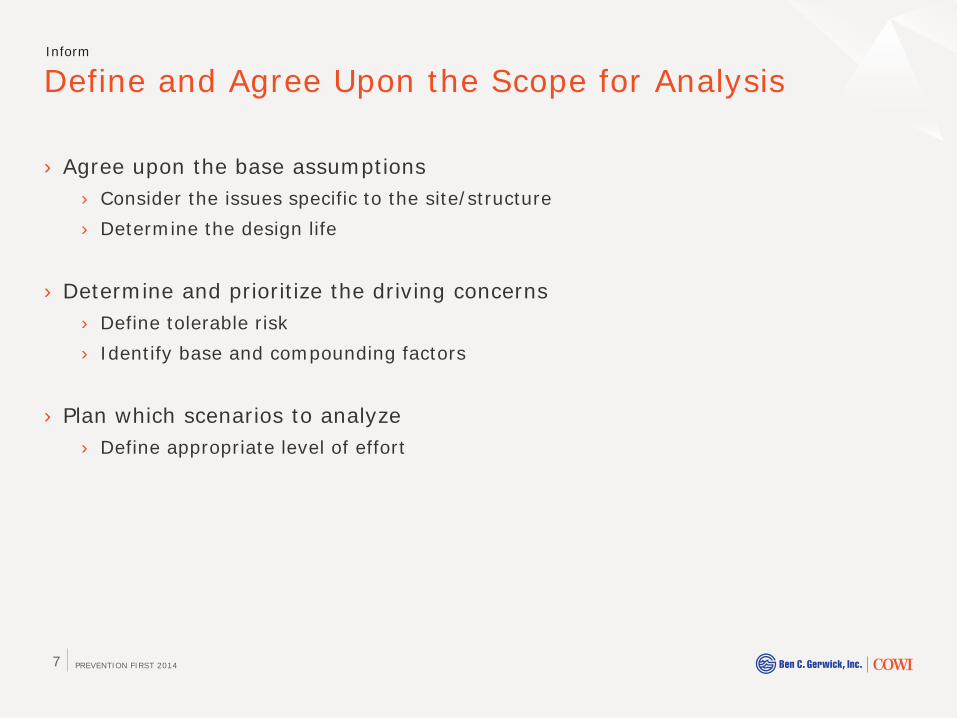
› Agree upon the base assumptions › Consider the issues specific to the site/structure › Determine the design life
› Determine and prioritize the driving concerns › Define tolerable risk › Identify base and compounding factors
› Plan which scenarios to analyze › Define appropriate level of effort
Define and Agree Upon the Scope for Analysis Inform

PREVENTION FIRST 2014 8
› Components › Maps › Facilities › Topography › Bathymetry › Geotechnical and Geological › Land uses
Data Acquisition Analyze
› NOAA Digital Elevation Model (DEM) of San Francisco Bay. Vertical exaggeration: 3. Vertical datum is NAVD88. (NOAA 2011)
OCTOBER 20, 2014 PREVENTION FIRST 2014 9
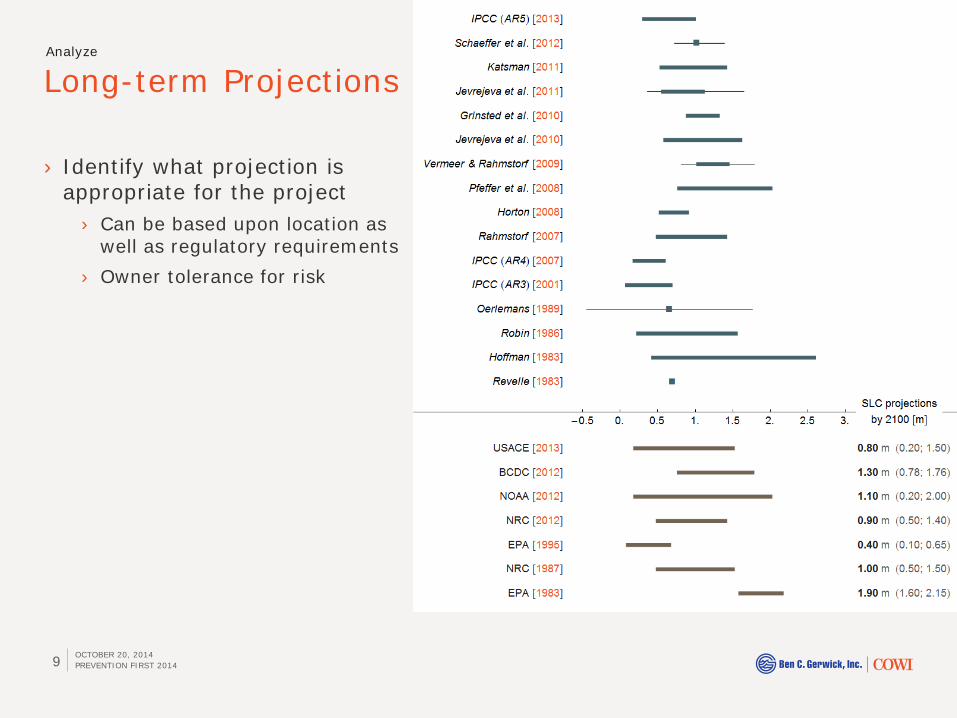
› Identify what projection is appropriate for the project
› Can be based upon location as well as regulatory requirements
› Owner tolerance for risk
Long-term Projections Analyze

OCTOBER 20, 2014 PREVENTION FIRST 2014 10
Compounding Phenomena Analyze
Eustatic sea level change
Simultaneity of events
Return periods
Waves
Ocean cycles
OCTOBER 20, 2014 PREVENTION FIRST 2014 11
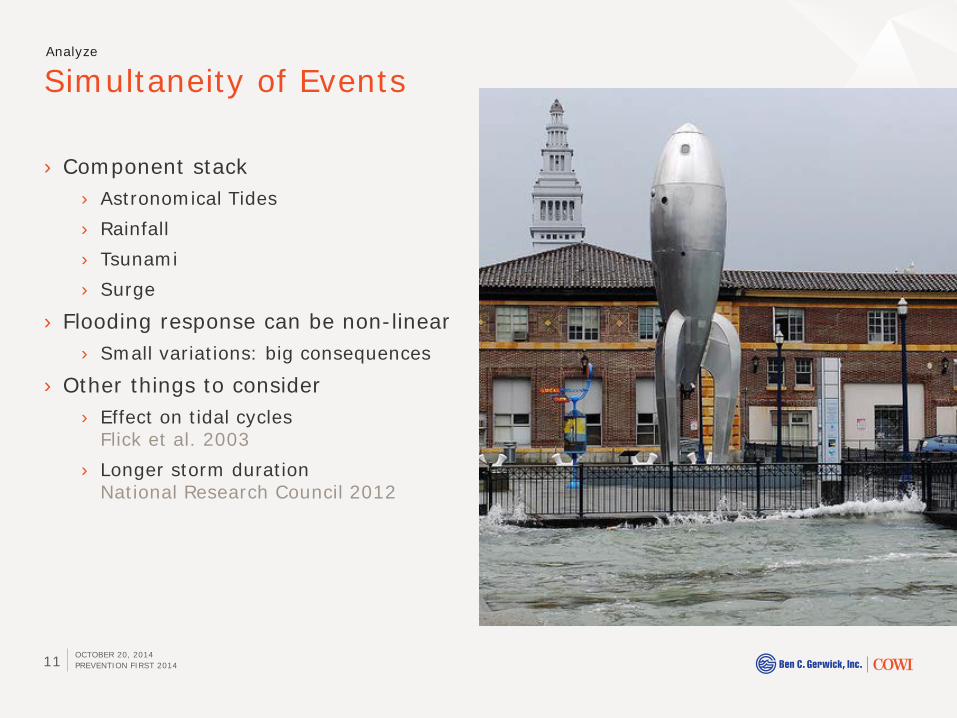
› Component stack › Astronomical Tides › Rainfall › Tsunami › Surge
› Flooding response can be non-linear › Small variations: big consequences
› Other things to consider › Effect on tidal cycles
Flick et al. 2003 › Longer storm duration
National Research Council 2012
Simultaneity of Events Analyze

PREVENTION FIRST 2014 12
Return Periods and Levels
› Return level is increasing › Higher elevations
› Return period is decreasing › Rare events are now more frequent
› Cumulative risk of occurrence is increasing"
› 𝑃 = 1 − 1 − 1𝑇 𝑡
𝑛
Analyze
With sea-level rise, the "100-year" flood level today is not the same as the "100-year"
flood level in 50 years
OCTOBER 20, 2014 PREVENTION FIRST 2014 13
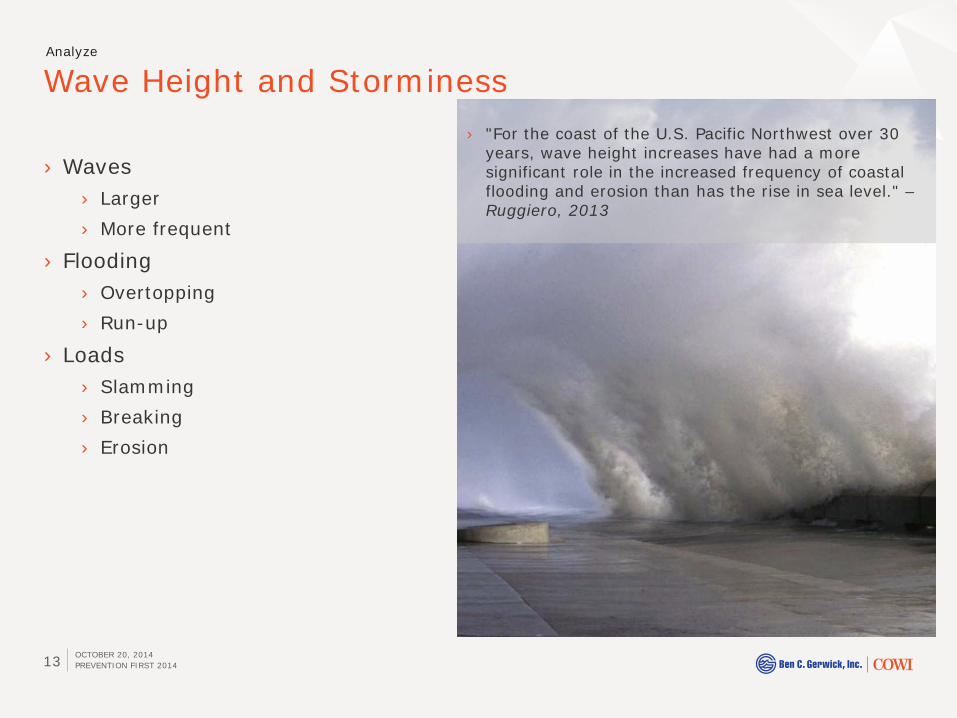
Wave Height and Storminess
› Waves › Larger › More frequent
› Flooding › Overtopping › Run-up
› Loads › Slamming › Breaking › Erosion
Analyze
› "For the coast of the U.S. Pacific Northwest over 30 years, wave height increases have had a more significant role in the increased frequency of coastal flooding and erosion than has the rise in sea level." – Ruggiero, 2013
PREVENTION FIRST 2014 14
› Although a global increase in sea level is a key consideration, local dynamic response of the land is also important
› This is a key LOCAL factor affecting NET sea level change › Induced by subsidence, subsurface resource extraction (oil/gas/water), glacial
rebound, permafrost degradation, continental plate movement
› Examples › Cook Inlet, AK has a negative NET sea level rise due to regional ground uplift; -17
mm/year › Grand Isle, LA had a NET sea level rise ~3x greater than the global trend in the 20th
century; +10 mm/year
Global versus Local Sea Level Change Analyze

PREVENTION FIRST 2014 15
Global vs. Local Trends
› Mean sea-level is dependent on many physical parameters › Mean may possibly deviate from historical trends and long-term projections › Illustration
› Fort Point, CA › MSL exhibits strong positive deviations from historical trends › These two events point out to strong El Nino phases
Analyze

PREVENTION FIRST 2014 16
Cost Consequences of Failure Analyze
1) Direct damages (e.g. structures, equipment, freight, land, etc.)
2) Indirect costs (e.g. lost wages, business interruptions, cleanup costs)
3) Intangible consequences (e.g. quality of life, environmental damages, loss of essential services)
Rotten Meat From Katrina Still in Gulfport Neighborhood
OCTOBER 20, 2014 PREVENTION FIRST 2014 17
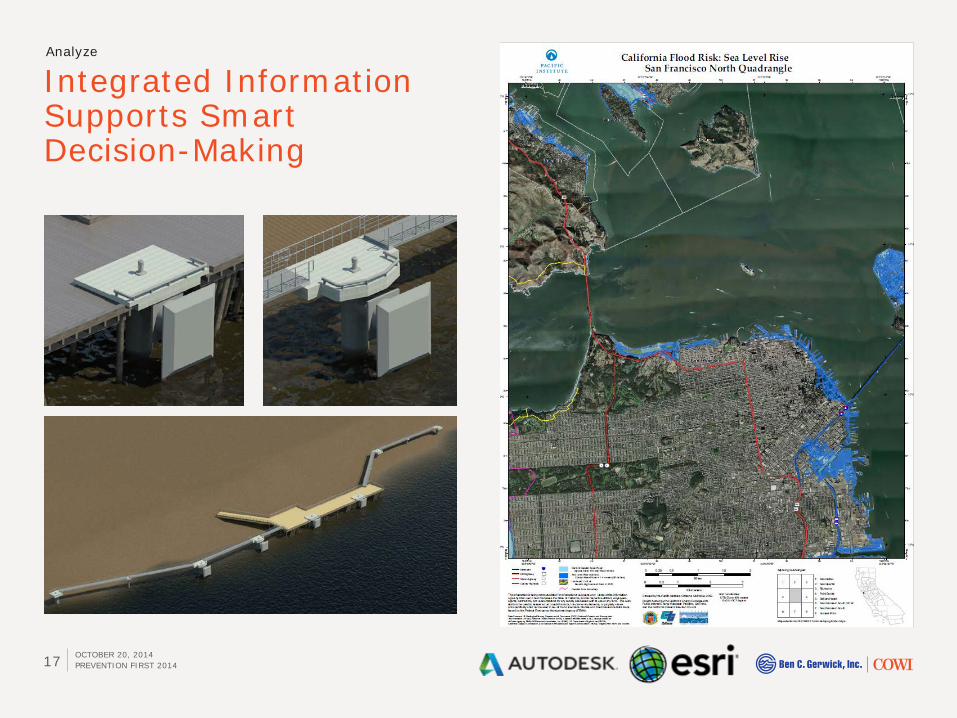
Analyze Integrated Information Supports Smart Decision-Making
Analyze

Protect
Accommodate
Manage
Path Forward Alternatives to Consider
PREVENTION FIRST 2014 18
Analyze
IHNC Storm Surge Barrier
OCTOBER 20, 2014 PREVENTION FIRST 2014 19
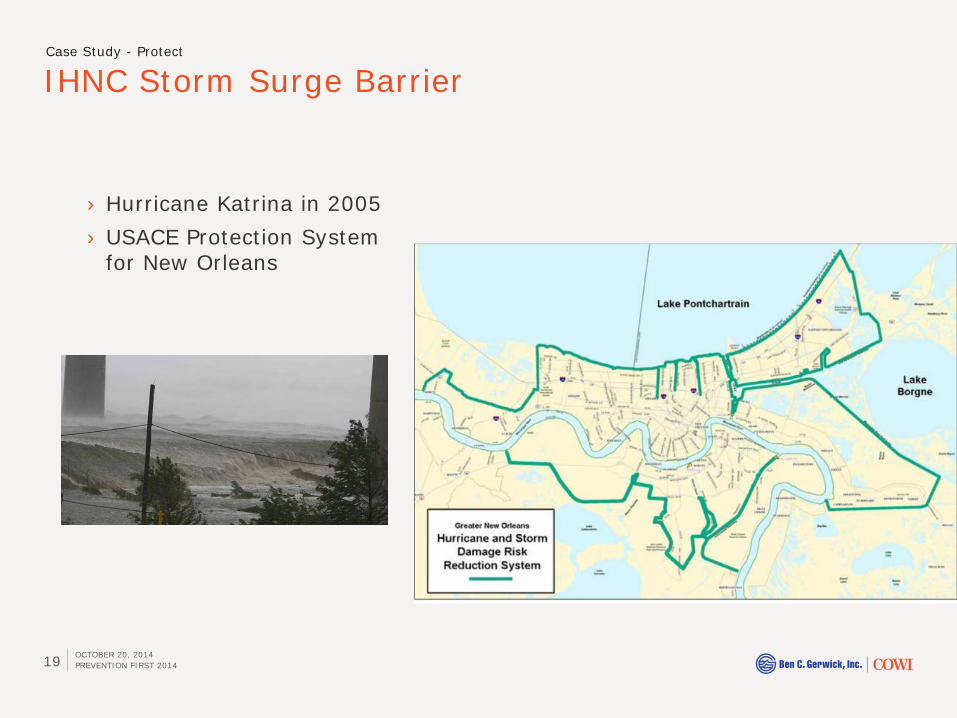
Case Study - Protect
› Hurricane Katrina in 2005 › USACE Protection System
for New Orleans
IHNC Storm Surge Barrier
OCTOBER 20, 2014 PREVENTION FIRST 2014 20
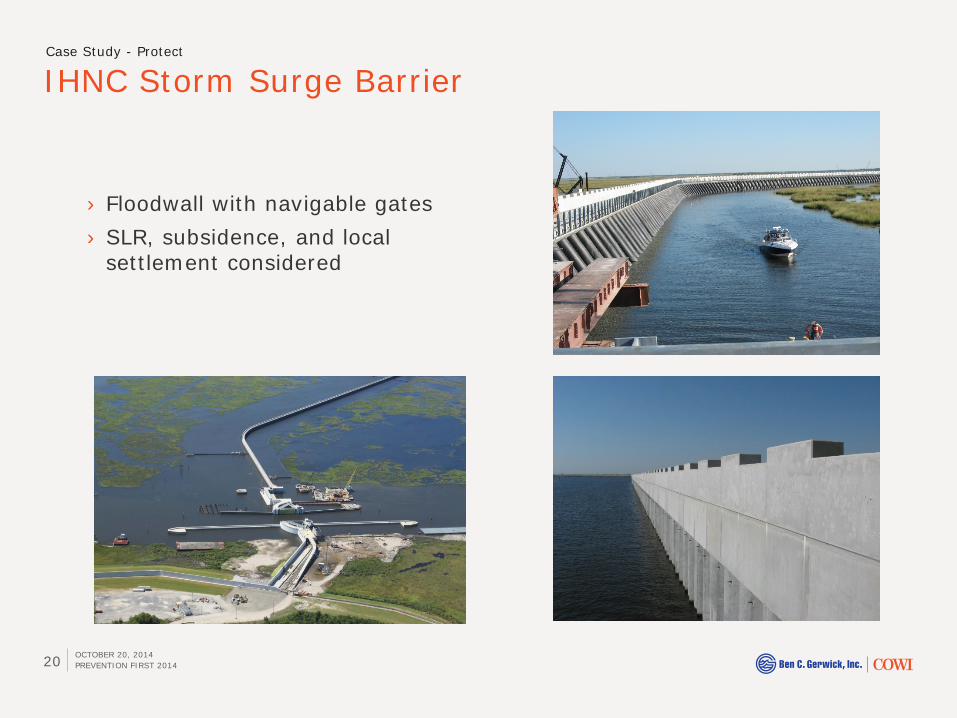
Case Study - Protect
› Floodwall with navigable gates › SLR, subsidence, and local
settlement considered
Port of Redwood City
OCTOBER 20, 2014 PREVENTION FIRST 2014 21
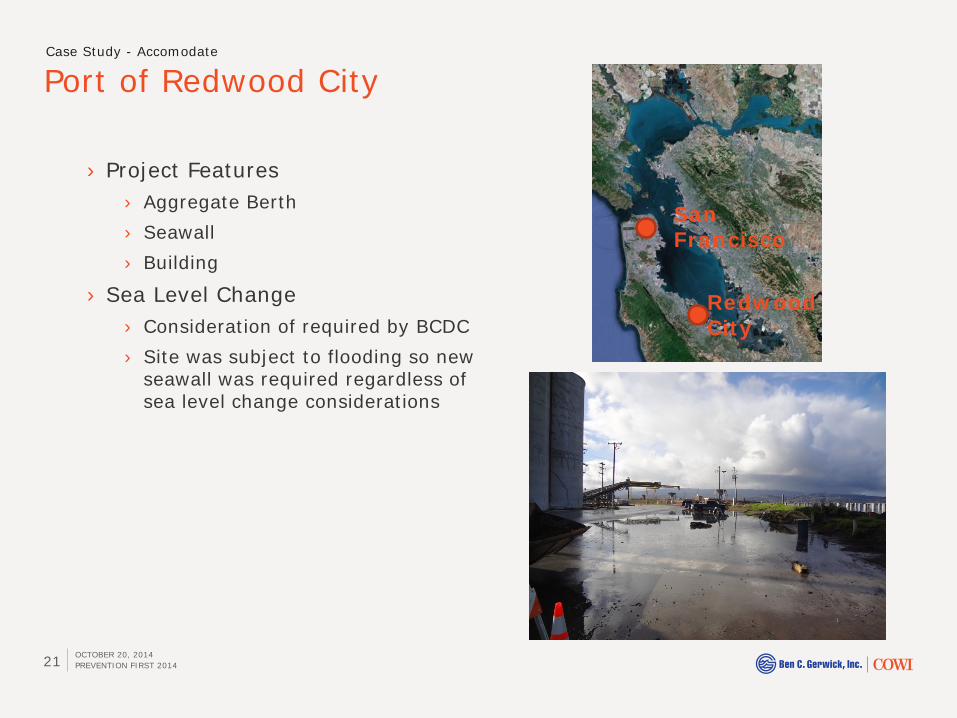
Case Study - Accomodate
› Project Features › Aggregate Berth › Seawall › Building
› Sea Level Change › Consideration of required by BCDC › Site was subject to flooding so new
seawall was required regardless of sea level change considerations
San Francisco
Redwood City

Port of Redwood City
OCTOBER 20, 2014 PREVENTION FIRST 2014 22
Case Study - Accomodate
› Flooding › Seawall › Adaptive design
› Operations › Utilities › Mooring and Berthing Hardware and
Geometry › Deck Elevation for Loading
Operations

Case Study – Pipeway and Roadway
OCTOBER 20, 2014 PREVENTION FIRST 2014 23
Case Study - Accomodate
› Replace existing mile long trestle
› Improved seismic performance
› Improve access with addition of roadway
› SLR criteria › Consideration
required by regulation
› Challenge as existing piping will continue to service the marine terminal
Case Study – Pipeway and Roadway
OCTOBER 20, 2014 PREVENTION FIRST 2014 24
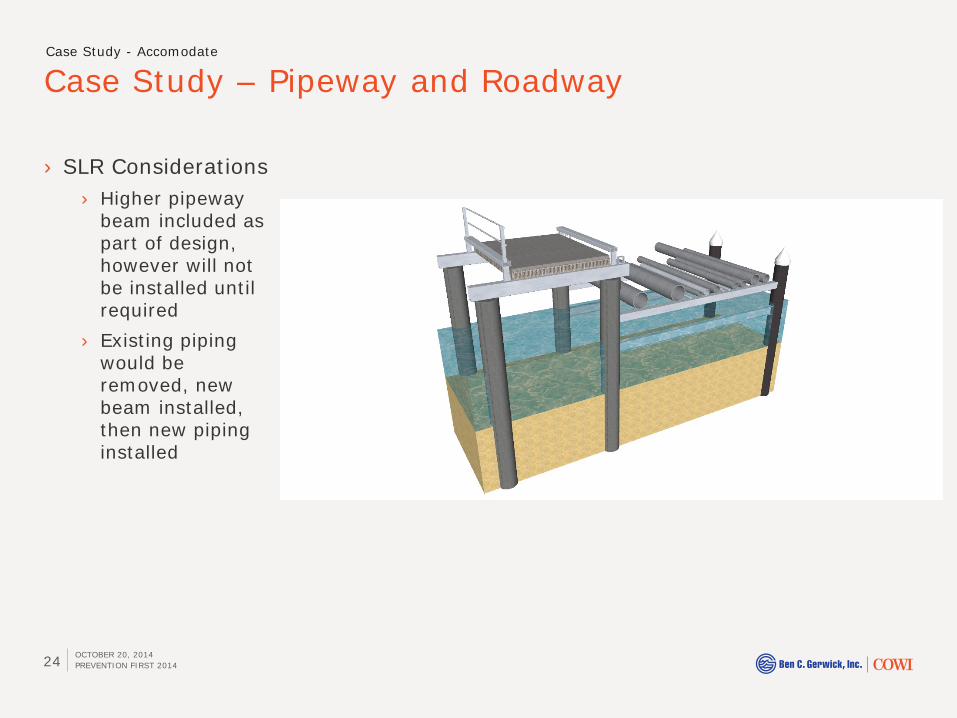
Case Study - Accomodate
› SLR Considerations › Higher pipeway
beam included as part of design, however will not be installed until required
› Existing piping would be removed, new beam installed, then new piping installed
Elliot Bay Seawall
OCTOBER 20, 2014 PREVENTION FIRST 2014 25
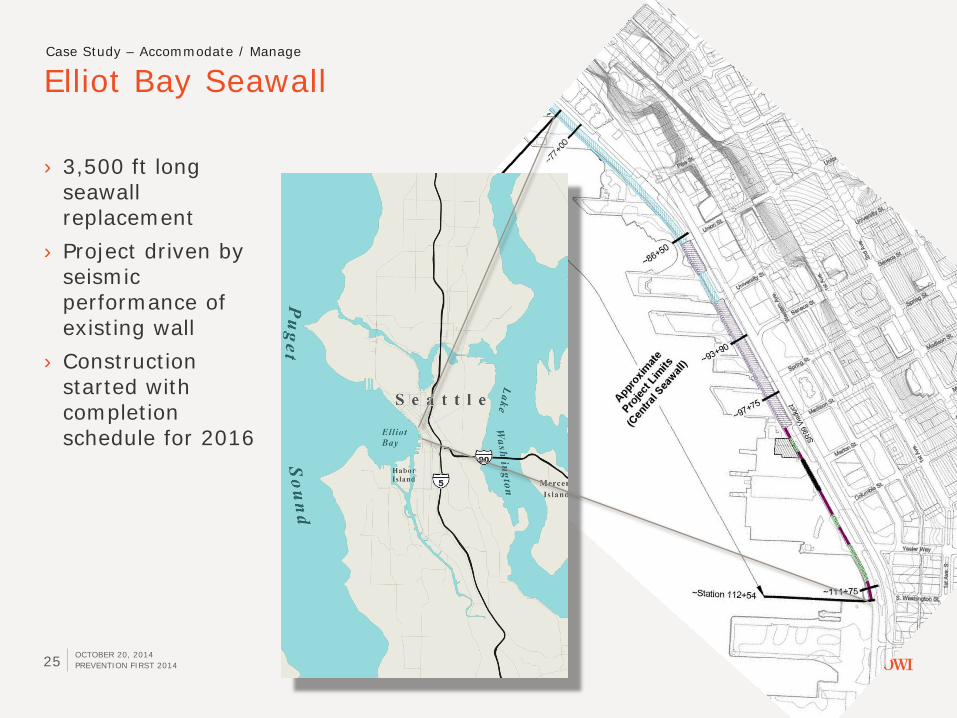
Case Study – Accommodate / Manage
› 3,500 ft long seawall replacement
› Project driven by seismic performance of existing wall
› Construction started with completion schedule for 2016

Elliot Bay Seawall
OCTOBER 20, 2014 PREVENTION FIRST 2014 26
› Varying levels of SLR scenarios considered
› Seawall Structure › Year 2100 › High estimate
› Beach and Habitat › Year 2050 › Medium estimate
Case Study – Accommodate / Manage
Conclusions
OCTOBER 20, 2014 PREVENTION FIRST 2014 27
› Projections of sea level change vary › Locally, globally, and within the scientific community
› Agencies have implemented sea level change into regulation › Established a rational approach for incorporating sea level change
considerations into design and have implemented practical measures to reduce risk