bellevue summer electrofishing 2017 - utilities · fulton conditions factor index for cutthroat...
TRANSCRIPT

Bellevue Summer Electrofishing 2017
Final Report
November 20, 2017
12754-04
Prepared for Prepared by City of Bellevue Jim Starkes Utilities Department Senior Associate Fisheries Biologist
City of Bellevue 190 West Dayton Street, Suite 201 450 110th Avenue NE Edmonds, WA 98020 P.O. Box 90012 425-329-1169 Bellevue, WA 98009 [email protected]

Contents
Executive Summary.................................................................................................... i
1.0 Introduction .................................................................................................. 1
2.0 Methods ........................................................................................................ 3
3.0 Results ........................................................................................................... 4
3.1 HABITAT AND WATER QUALITY MEASUREMENTS.................................................................................... 4
3.2 SPECIES DISTRIBUTION AND DENSITY ....................................................................................................... 8
3.3 CUTTHROAT LENGTH DISTRIBUTION AND HABITAT USE .................................................................... 10
3.4 CUTTHROAT LENGTH-WEIGHT RELATIONSHIP ..................................................................................... 14
3.5 OTHER SPECIES ........................................................................................................................................... 15
3.6 NATIVE AND NON-NATIVE SPECIES ........................................................................................................ 18
3.7 CUTTHROAT TROUT STOMACH ANALYSIS FOR NEW ZEALAND MUDSNAILS (POTAMOPYRGUS
ANTIPODARUM) .................................................................................................................................................. 22
4.0 Discussion and Recommendations for Future Actions ............................ 27
4.1 DISCUSSION .................................................................................................................................................. 27
4.2 RECOMMENDATIONS .................................................................................................................................. 28
5.0 Literature Cited ........................................................................................... 31
Appendix A - 2015 Raw Data .......................................................................................
Appendix B - Project Photos .......................................................................................
Tables Table 1. Survey dates and site summary for 2017 electrofishing. ...................................................................... 5
Table 2. Stream channel data for survey areas. ..................................................................................................... 7
Table 3. Water quality parameters for electrofishing sites during July 2017. ................................................... 8
Table 4. Estimated density of fish species. ......................................................................................................... 10
Table 5. Number caught and length range for cutthroat across all sites sampled. ....................................... 14
Table 6. Native species documented in Bellevue streams during 1983, 1996–1997, 2002, 2007, and 2010–2017 summer fish surveys. .................................................................................................................................... 19
Table 7. Non-native species documented in Bellevue streams during 1983, 1996–1997, 2002, 2007, and 2010–2017 summer fish surveys. ......................................................................................................................... 21
Table 8. Benthic availability of New Zealand mudsnails in Kelsey Creek in 2014, 2016, and 2017.......... 24

Figures Figure 1. Map showing locations and results of electrofishing sites sampled in July 2017. ........................... 2
Figure 2. Species distribution by stream reach for 2017 sampling. ................................................................... 9
Figure 3. Length frequency distribution of cutthroat at Newport Tributary Site 1 (RM 0.01) in 2017. ... 11
Figure 4. Length frequency distribution of cutthroat at Newport Tributary Site 2 (RM 0.06) in 2017. ... 12
Figure 5. Length frequency distribution of cutthroat Yarrow West Tributary (RM 0.10) in 2017. ........... 12
Figure 6. Length frequency distribution of cutthroat Yarrow East Tributary (RM 0.25) in 2017. ............ 13
Figure 7. Length frequency distribution of cutthroat Kelsey Creek (RM 1.81) in 2017. ............................. 13
Figure 8. Fulton Conditions Factor Index for cutthroat trout at Kelsey and Newport Creek survey areas in 2017. .................................................................................................................................................................... 15
Figure 9. Length frequency distribution of longnose dace Kelsey Creek (RM 1.81) 2017. ........................ 16
Figure 10. Length frequency distribution of sculpin Newport Tributary Site 1 (RM 0.01) in 2017. ......... 17
Figure 11. Length frequency distribution of sculpin Newport Tributary Site 2 (RM 0.06) in 2017. ......... 17
Figure 12. Size range of cutthroat trout feeding on New Zealand mudsnails. ............................................. 22
Figure 13. Condition index values for cutthroat trout that did and did not feed on mudsnails. ............... 23
Figure 14. Total diet of individual cutthroat trout that fed upon New Zealand mudsnail (NZMS) ......... 25
Figure 15. Length frequency distribution of cutthroat trout during pre-mudsnail infestation years (2007 and 2010) and post-infestation years (2014 and 2017). .................................................................................... 26

Bellevue Summer Electrofishing 2017
City of Bellevue
i November 20, 2017
Executive Summary Five reaches of streams within the Coal, Yarrow, and Kelsey Creek basins, all urban streams in the City of Bellevue were surveyed for fish presence, absence, and diversity during the summer of 2017—two sites on the Newport Tributary of Coal Creek (RM 0.01 and 0.06), two sites on the East Fork and West Fork of Yarrow Creek, and one site on mainstem Kelsey Creek. One of the two Newport Tributary sites and the West Fork Yarrow Creek site have recently undergone riffle reconstruction and improvements; 2017 surveys were to determine fish use and performance success of the rehabilitated habitats. Work at the other Newport Tributary was a pre-assessment for future stream restoration efforts. Similarly, the East Fork Yarrow Creek site is scheduled to undergo a culvert removal and stream channel daylighting construction project within the site reach; 2017 sampling was to establish baseline conditions. The Kelsey Creek reach was not associated with a capital improvement project, but a continuing status and trends and cutthroat trout gastric lavage project.
Results from 2017 surveys found a total of six fish species, with cutthroat trout as dominant within the Yarrow and Kelsey basins, and sculpin the dominant species within Newport Tributaries. Length frequency analyses suggest that multiple age classes (i.e., juvenile, subadult, and adult) of cutthroat were present in Kelsey and Newport tributary Site 2 (RM 0.06), with mostly juvenile cutthroat in Newport tributary Site 1 and Yarrow survey areas. Cutthroat were most abundant in Kelsey and Yarrow East, with much lower abundances in the other three survey areas. An apparent association with pool dominance and cutthroat abundance was observed. Length-weight condition values indicated similar physical condition of cutthroat trout in Kelsey and Newport Site 2 (Conditions index was not collected in the remaining streams because of the lack of larger fish). Native secondary fish abundance differed in each stream reach with moderate numbers of longnose dace found in Kelsey Creek, and low numbers of lamprey found in the Newport Tributaries and Kelsey Creek. Two non-native sunfish (pumpkinseed and bluegill) were captured at Kelsey Creek.
Diet monitoring was conducted at Kelsey Creek to determine the level of predation on the invasive New Zealand mudsnail. This is the third year of diet monitoring in Kelsey Creek. A total of 9.6 percent of cutthroat trout fed upon New Zealand mudsnail in 2017 compared to 8.2 percent in 2016 and 42.5 percent in 2014. New Zealand mudsnails represented 2 percent of available prey in 2017, whereas they comprised 5 percent of available prey in 2016 and 18 percent in 2014. A comparison of condition index values between fish that fed on mudsnails and those that did not found no statistically significant difference in length-weight conditions. Though data perhaps show a decline between 2014 and 2017, additional monitoring is necessary to determine the degree of predation on this invasive species, and the overall potential effects on fish health and populations within the basin. Data for 2017 did show that of the fish that fed on mudsnails, they were found in stomachs at a much higher proportion then in stream habitats. Annual monitoring of mudsnails should also be undertaken to determine the degree of infestation and population trends in abundance.
Additional studies are recommended to further evaluate the effectiveness of existing and future capital projects for improving fish habitat. Below is a detailed list of recommendations for the City of Bellevue to facilitate these actions.
• Compare diversity, size, and abundance of fish species across all years for sites with historical data.

Bellevue Summer Electrofishing 2017
City of Bellevue
November 20, 2017 ii
• Conduct electrofishing at low, middle, and upper reaches of creeks during the same sampling events to determine how salmonids and native fish are distributed across the watershed.
• Continue fish condition index at electrofishing sites to assess the relative health of priority fish species. The index could then be compared to other Western Washington urban streams where this particular data has been collected.
• Collect additional stream habitat data within survey reaches including woody debris counts, percent canopy coverage and shading, cutbank lengths, boulder cluster counts (which can enhance microhabitats in very small streams), and substrate type. Survey observations strongly suggest that the presence of these stream and riparian habitat attributes effect the abundance and diversity of fish in survey reaches and should be quantified.
• Continue to collect gut content data from priority salmonid species at benthic index of biotic integrity (BIBI) sites to determine if aquatic or terrestrial prey species dominate and to further investigate New Zealand mudsnail predation. These data will help determine prey species availability and use by salmonids. Data collected can also help determine if riparian and/or substrate improvements are necessary.
• Compare size of coho and cutthroat fish populations to other Puget Sound lowland reference streams.
• Continue a consistent electrofishing program within select index reaches to increase robustness of data for determination of status and trends of priority fish species and to determine the prevalence of non-native species.
• Include adult coho escapement data in the status and trends database in order to associate coho presence or absence with run size.

Bellevue Summer Electrofishing 2017
City of Bellevue
1 November 20, 2017
1.0 Introduction As part of annual status and trends monitoring, the City of Bellevue (City) conducted electrofishing on a total of five stream reaches—two reaches within the Newport Tributary of Coal Creek, two reaches on East and West Fork Yarrow Creek, and one reach within Kelsey Creek in July 2017. (Figure 1).
The purpose of electrofishing at these locations was to develop a multi-year baseline for fish species presence/absence and diversity, evaluate trends in previously sampled locations, evaluate the success of reconstructed riffles and other capital improvement projects (CIPs), and establish baseline conditions on stream reaches that will undergo CIPs. These sites can be revisited in coming years to determine if cumulative changes (habitat, operation of public facilities, private development, and land use regulations) are having positive or detrimental effects on fish population structures. Four of the five sites were either associated with recent CIPs, or identified for future CIP work.
• At river mile (RM) 0.01 on the Newport Tributary of Coal Creek, riffle habitats werereconstructed to improve habitats. Some revegetation of the upper stream banks and placementof large woody debris was also conducted. The RM 0.06 Newport site was surveyed in 2017 as apre-CIP evaluation. This site has been identified for habitat improvements within the D-86Stream Channel Modification CIP program.
• At RM 0.1 on West Fork Yarrow Creek, riffle habitats were reconstructed to improve habitats.Revegetation of the riparian zone was also conducted.
• At RM 0.25 on East Fork Yarrow Creek, there is a scheduled CIP project that will remove aburied culvert, daylight the entire stream reach, and reconstruct riffle and pool habitats.
• At RM 1.81 on Kelsey Creek, there is no CIP project, but the site has been a status and trendslocation since 1996 and the location for an ongoing gastric lavage project of cutthroat trout,continuing investigations of predation on the invasive New Zealand mud snail started in 2014.
This report describes the methods used for sampling, results from electrofishing and gut content studies in the summer of 2017, and recommendations for future actions. The data presented in this report represent a reference point from which the City can determine possible changes in the status and trends of fish populations in response to local or basinwide environmental changes.

Bellevue Summer Electrofishing 2017
City of Bellevue
November 20, 2017 2
Figure 1. Map showing locations and results of electrofishing sites sampled in July 2017.
Bellevue Summer Electrofishing 2017
City of Bellevue
3 November 20, 2017
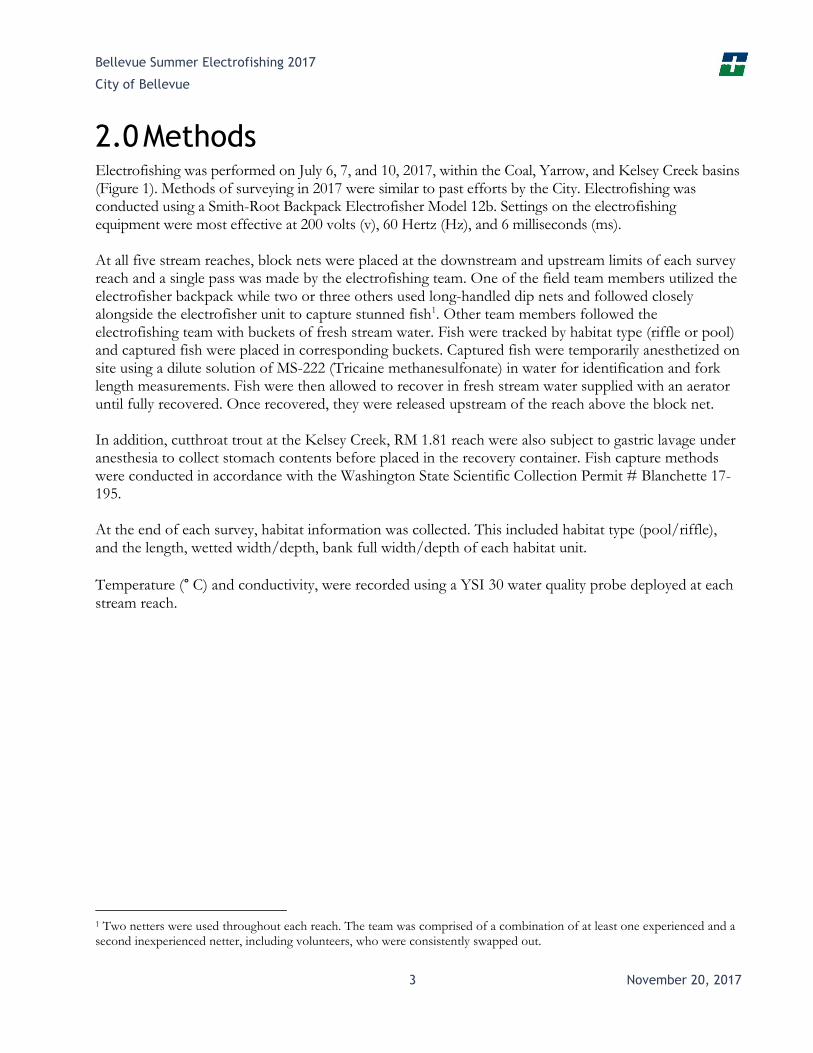
2.0 Methods Electrofishing was performed on July 6, 7, and 10, 2017, within the Coal, Yarrow, and Kelsey Creek basins (Figure 1). Methods of surveying in 2017 were similar to past efforts by the City. Electrofishing was conducted using a Smith-Root Backpack Electrofisher Model 12b. Settings on the electrofishing equipment were most effective at 200 volts (v), 60 Hertz (Hz), and 6 milliseconds (ms).
At all five stream reaches, block nets were placed at the downstream and upstream limits of each survey reach and a single pass was made by the electrofishing team. One of the field team members utilized the electrofisher backpack while two or three others used long-handled dip nets and followed closely alongside the electrofisher unit to capture stunned fish1. Other team members followed the electrofishing team with buckets of fresh stream water. Fish were tracked by habitat type (riffle or pool) and captured fish were placed in corresponding buckets. Captured fish were temporarily anesthetized on site using a dilute solution of MS-222 (Tricaine methanesulfonate) in water for identification and fork length measurements. Fish were then allowed to recover in fresh stream water supplied with an aerator until fully recovered. Once recovered, they were released upstream of the reach above the block net.
In addition, cutthroat trout at the Kelsey Creek, RM 1.81 reach were also subject to gastric lavage under anesthesia to collect stomach contents before placed in the recovery container. Fish capture methods were conducted in accordance with the Washington State Scientific Collection Permit # Blanchette 17-195.
At the end of each survey, habitat information was collected. This included habitat type (pool/riffle), and the length, wetted width/depth, bank full width/depth of each habitat unit.
Temperature (° C) and conductivity, were recorded using a YSI 30 water quality probe deployed at each stream reach.
1 Two netters were used throughout each reach. The team was comprised of a combination of at least one experienced and a second inexperienced netter, including volunteers, who were consistently swapped out.

Bellevue Summer Electrofishing 2017
City of Bellevue
November 20, 2017 4
3.0 Results
3.1 Habitat and Water Quality Measurements A summary description of the habitat attributes at surveying locations is presented in Table 1. Riffle, pool, and stream channel data are presented in Table 2. Riffle and pool habitats were present at all five reaches sampled in 2017.
Both Newport Tributary sites were composed of riffle/pool habitats, each with four riffles and three pools or glides in each reach. Pools or deeper glides comprised 14 (Site 1; RM 0.01) and 24 percent (Site 2; RM 0.06) of the total lengths of each reach. Both tributaries were small streams with mean wetted widths between 5.6 and 8.6 feet and mean depths of less than 0.5 feet (Table 2). Both meandered through dense, mature riparian forest with substantial shade canopy at Site 2. At Site 2, low hanging tree branches completely covered the stream in some locations. Less canopy was present at Site 1; the City had supplemented stream habitats with woody debris placements and supplemental plantings on the stream bank. Some undercut banks were present, but were not dominant features of either site. Riffles were composed of cobble and gravel, interspersed with large rocks, which increased habitat complexity of both stream channels.
Substantial differences were found between Yarrow West and Yarrow East tributaries. Yarrow West (RM 0.10) was the smallest stream in the 2017 survey with a mean wetted width of less than 5 feet and mean depths of 0.4 feet (Table 2). The stream reach traversed a moderately steep bank, uniformly vegetated with young riparian trees and shrubs. Large woody debris, placed by the City, was interspersed throughout the entire reach, though most did not enter the stream channel or channel sediments. Large rock clusters were also present through most of the reach. Very little undercut banks were present, but a fair amount of vegetation overhung the stream channel. The Yarrow East survey reach (RM 0.25) was composed primarily of two large pools with wetted widths between 9 and 12 feet across and maximum depths estimated at over 4 feet. A large earthen embankment separated the two pools completely; stream flows through the embankment were through a subsurface culvert. Because of the depths and water volumes of the two pools, both were depositional, composed of a surface layer of silty sediments. Despite the earthen embankment bisecting the stream, substantial vegetation canopy and shading by mature trees and shrubs was present. Large amounts of small and large wood were also imbedded into both pools. Both the earthen embankment and buried culvert are scheduled for removal.
The Kelsey Creek reach at RM 1.81 was located on the Glendale Golf Course. This reach was relatively straight but contained three pools, one glide and three riffles within relatively steep streambanks composed primarily of native and non-native vegetation and some rock armor. Undercut bank habitats were also present through most of the stream reach. The steepened stream profile also provided for relatively deep pools ranging from 1 to 3 feet, and riffles of over 0.5 feet. Wetted widths ranged widely from 3.2 to 16.6 feet (Table 2). Though the high pool ratio and cut banks provided good aquatic habitat, the highly variable vegetation/armored streambanks provided considerably less vegetation cover relative to the other stream reaches. The riparian zone was further limited by groomed golf course fairway. Some grass vegetation extended into the stream channel.

Bellevue Summer Electrofishing 2017
City of Bellevue
5 November 20, 2017
Table 1. Survey dates and site summary for 2017 electrofishing.
Date Stream Name River Mile (RM)
Reach Length (feet)
Site Description
July 6, 2017
Newport Creek
Tributary Site 1
0.01 204
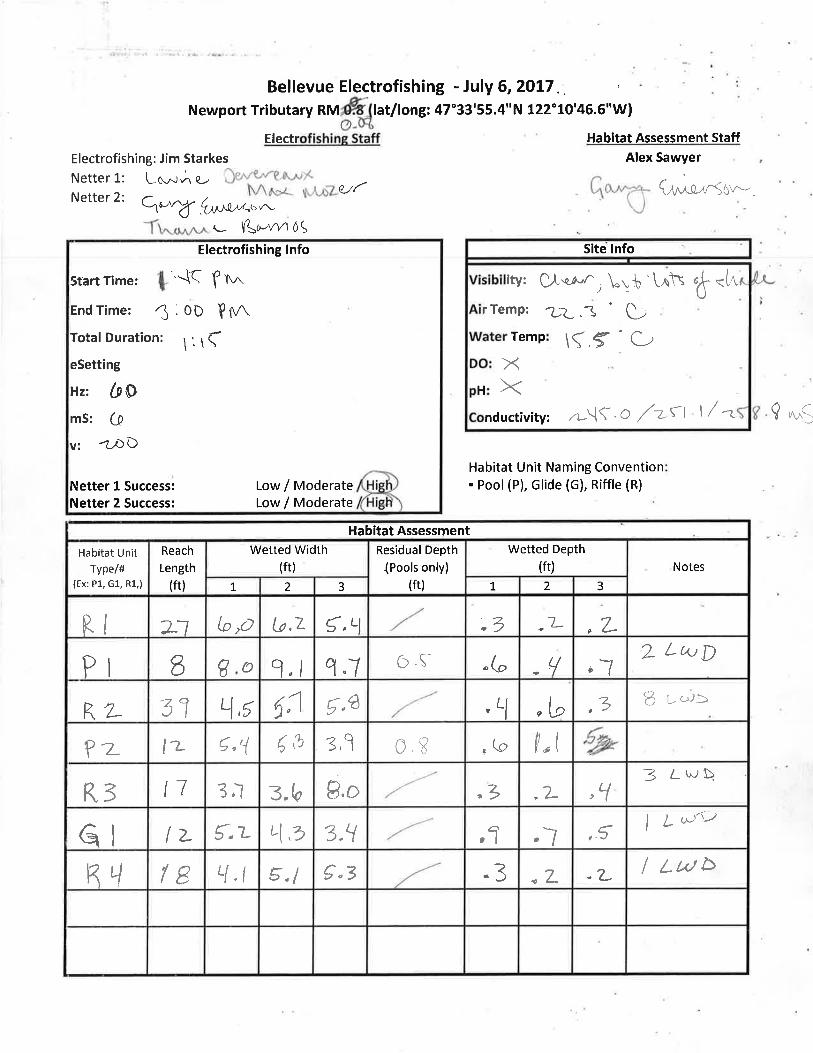
Site of a CIP riffle reconstruction. This survey reach is relatively narrow composed of a main channel with no braids and moderate riparian densities of mature deciduous trees and shrubs. Though riparian vegetation extends to the streambank in many areas of the survey reach, little wood was observed in the channel. Two placed rootwads were observed, as well as some areas of riparian plantings. Sediments are primarily composed of cobble and gravel with some areas of larger rock. Except for placed wood, little undercut bank was observed. Multiple riffles and shallow pools are present within the survey reach (Photos 1-3).
July 6, 2017
Newport Creek
Tributary Site 2
0.06 133
Site of a future CIP habitat enhancement project. This survey reach is similar to slightly narrower than Site 1; no braiding. Riparian vegetation is considerably more dense, with some areas completely covering the stream with low hanging branches. Substantially more woody debris is present either in the stream channel or crossing it. Sediments are composed of more uniform cobble and gravel with few larger rocks. Some undercut banks, but substantial amounts of habitat beneath low hanging vegetation. Multiple riffles and shallow pools are present within the survey reach (Photos 4-6).
July 7, 2017
Yarrow Creek West Tributary
0.10 213
Site of a CIP riffle reconstruction. This survey reach is very narrow and straight within moderately steep banks. Streambank vegetation is moderately dense and relatively young (small shrubs and saplings). A footbridge is present at the top of the steepened bank. Woody debris is interspersed throughout the survey reach, but little is imbedded within the stream channel. Shallow stream with pools under 1 foot deep and most riffles under 0.4 feet deep. (Photos 7 and 8).

Bellevue Summer Electrofishing 2017
City of Bellevue
November 20, 2017 6
Date Stream Name River Mile (RM)
Reach Length (feet)
Site Description
July 7, 2017
Yarrow Creek East Tributary
0.25 102
This survey reach was sampled to collect baseline data for a future CIP project. Substantially different from West Yarrow, primarily composed of 2 deep pools (estimated 4 feet deep) completely separated by an earthen embankment with a buried culvert (scheduled or removal). Stream flows subsurface through the buried culvert beneath the embankment. Substantial amounts of mature riparian trees; survey reach is well shaded. Both pools are much larger than would be expected in a small stream and are depositional; bottom sediments have a silt layer. Adjacent riffles are very shallow with few habitat features (<than 0.25 feet deep; Photos 9 and 10).
July 10,
2017 Kelsey Creek 1.81 301
Located on a relatively open area on the Glendale Golf Course. Habitats are composed of relatively deep riffles and pools with moderately steep banks, variably vegetated with native and invasive vegetation (blackberry), ornamental vegetation, (ivy) and some armored rock. Some areas of cultivated lawn. Beyond the stream banks lie cultivated golf course fairway. Several pieces of woody debris; some undercut banks and areas of densely overhanging vegetation. Most of the reach is open with less than 10 percent canopy cover. (Photos 11 and 12).
Bellevue Summer Electrofishing 2017
City of Bellevue
7 November 20, 2017
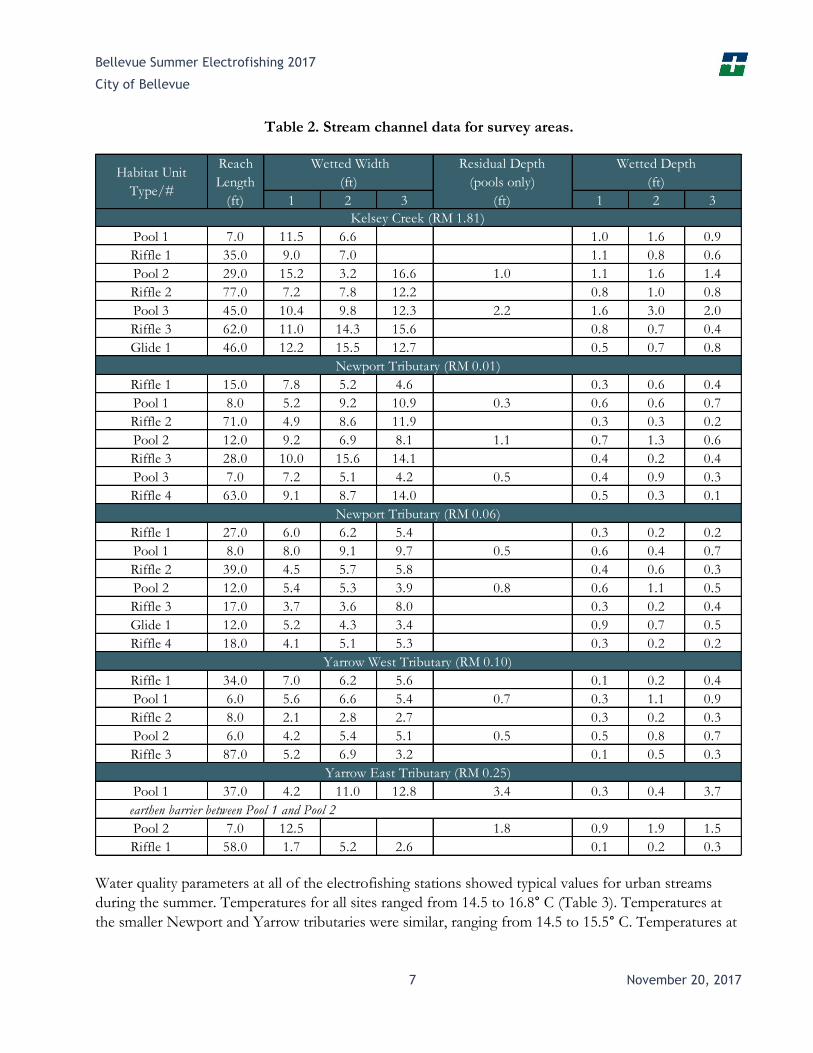
Table 2. Stream channel data for survey areas.
Water quality parameters at all of the electrofishing stations showed typical values for urban streams
during the summer. Temperatures for all sites ranged from 14.5 to 16.8° C (Table 3). Temperatures at
the smaller Newport and Yarrow tributaries were similar, ranging from 14.5 to 15.5° C. Temperatures at
1 2 3 1 2 3
Pool 1 7.0 11.5 6.6 1.0 1.6 0.9
Riffle 1 35.0 9.0 7.0 1.1 0.8 0.6
Pool 2 29.0 15.2 3.2 16.6 1.0 1.1 1.6 1.4
Riffle 2 77.0 7.2 7.8 12.2 0.8 1.0 0.8
Pool 3 45.0 10.4 9.8 12.3 2.2 1.6 3.0 2.0
Riffle 3 62.0 11.0 14.3 15.6 0.8 0.7 0.4
Glide 1 46.0 12.2 15.5 12.7 0.5 0.7 0.8
Riffle 1 15.0 7.8 5.2 4.6 0.3 0.6 0.4
Pool 1 8.0 5.2 9.2 10.9 0.3 0.6 0.6 0.7
Riffle 2 71.0 4.9 8.6 11.9 0.3 0.3 0.2
Pool 2 12.0 9.2 6.9 8.1 1.1 0.7 1.3 0.6
Riffle 3 28.0 10.0 15.6 14.1 0.4 0.2 0.4
Pool 3 7.0 7.2 5.1 4.2 0.5 0.4 0.9 0.3
Riffle 4 63.0 9.1 8.7 14.0 0.5 0.3 0.1
Riffle 1 27.0 6.0 6.2 5.4 0.3 0.2 0.2
Pool 1 8.0 8.0 9.1 9.7 0.5 0.6 0.4 0.7
Riffle 2 39.0 4.5 5.7 5.8 0.4 0.6 0.3
Pool 2 12.0 5.4 5.3 3.9 0.8 0.6 1.1 0.5
Riffle 3 17.0 3.7 3.6 8.0 0.3 0.2 0.4
Glide 1 12.0 5.2 4.3 3.4 0.9 0.7 0.5
Riffle 4 18.0 4.1 5.1 5.3 0.3 0.2 0.2
Riffle 1 34.0 7.0 6.2 5.6 0.1 0.2 0.4
Pool 1 6.0 5.6 6.6 5.4 0.7 0.3 1.1 0.9
Riffle 2 8.0 2.1 2.8 2.7 0.3 0.2 0.3
Pool 2 6.0 4.2 5.4 5.1 0.5 0.5 0.8 0.7
Riffle 3 87.0 5.2 6.9 3.2 0.1 0.5 0.3
Pool 1 37.0 4.2 11.0 12.8 3.4 0.3 0.4 3.7
Pool 2 7.0 12.5 1.8 0.9 1.9 1.5
Riffle 1 58.0 1.7 5.2 2.6 0.1 0.2 0.3
Kelsey Creek (RM 1.81)
Habitat Unit
Type/#
Reach
Length
(ft)
Wetted Width
(ft)
Residual Depth
(pools only)
(ft)
Wetted Depth
(ft)
Newport Tributary (RM 0.01)
Newport Tributary (RM 0.06)
Yarrow West Tributary (RM 0.10)
Yarrow East Tributary (RM 0.25)
earthen barrier between Pool 1 and Pool 2

Bellevue Summer Electrofishing 2017
City of Bellevue
November 20, 2017 8
the larger Kelsey Creek reach were higher (16.8° C), likely the result of a small lake headwater, which receives substantial solar radiation during the summer.
Table 3. Water quality parameters for electrofishing sites during July 2017.
3.2 Species Distribution and Density Six species of fish were captured during the 2017 electrofishing surveys—cutthroat trout (Oncorhynchus clarki), longnose dace (Rhinichthys cataractae), lamprey (Lampetra spp.), and sculpin (Cottus spp.) and two non-native sunfish species, pumpkinseed (Lepomis gibbosus) and bluegill (Lepomis macrochirus; Figure 2).
In 2017, cutthroat trout dominated catch at the Yarrow and Kelsey reaches; this species was the only fish captured at both West and East Yarrow tributaries (Figure 2). Cutthroat comprised 71.5 percent of total catch at the Kelsey reach. At the Newport tributaries, cutthroat only comprised 34.3 percent of total catch, with sculpin being the dominant species within this basin. Table 4 shows the estimated density of fish species caught for each reach. Fish density analysis was determined by normalizing the total fish count per linear foot surveyed for each reach2. The density of cutthroat trout in the three stream reaches where the species dominated varied widely, ranging from 0.24 to 1.86 fish per linear foot of stream (Table 4). A clear association with high cutthroat densities and pool predominance was found. Cutthroat densities between 0.98 and 1.86 fish per linear foot were found at Kelsey Creek and Yarrow East Tributary, both of which were composed of over 40 percent pool or deep glide within the survey reach. Cutthroat densities within the Newport tributaries and Yarrow West tributary ranged from 0.12 to 0.24 fish per linear foot; pool percentages within these survey reaches ranged from 8.5 to 24.1 percent of the total survey reach.
2 Comparison of relative abundance data between sites should be considered only on a gross level as differences in collection technique and netting efficiency can vary.
Site Temperature (oC) Conductivity (µs/cm)
Kelsey Creek
RM 1.8116.8 257.9
Newport
Tributary
RM 0.01
14.7124.0 (d/s)
252.3 (u/s)
Newport
Tributary
RM 0.06
15.5 251.6
Yarrow W
Tributary
RM 0.10
14.5 250.9
Yarrow E
Tributary
RM 0.25
14.7230.5 (P1)
204.1 (P2)

Bellevue Summer Electrofishing 2017
City of Bellevue
9 November 20, 2017
Figure 2. Species distribution by stream reach for 2017 sampling.
Cutthroat densities observed in 2017 were near those found historically in Kelsey Creek at Glendale Golf Course reaches. At RM 2.1, surveys were conducted over five years between 1996 and 2016 with densities ranging from 0.63 to 1.09 fish per linear foot. A mean of 0.82 fish per linear foot was found over those survey years, slightly lower than the 0.98 fish per linear foot found in 2017.
Longnose dace were captured in notable numbers, but only in the Kelsey Creek reach, comprising 23.2 percent of catch and a density of 0.32 fish per linear foot at RM 1.81 (Figure 2; Table 4). This was quite similar to that found at RM 2.1 in 2016 (29.4 percent of total catch; density of 0.30 fish per linear foot), but much higher than that found historically (0.01 to 0.03 fish per linear foot between 1996 and 2010).
Sculpin were only observed in the Newport Creek basin, where they were dominant, comprising 57.3 percent of total catch (Figure 2). Densities ranged from 0.12 to 0.29 fish per linear foot (Table 4). This represents an upstream colonization of sculpin from Coal Creek, where they are commonly found. In 2015, a fish passage/riffle reconstruction project was constructed at the confluence of Coal Creek and the Newport Tributary, which has successfully allowed recolonization by sculpin. Previous sampling
0
10
20
30
40
50
60
70
80
90
100
110
120
Kelsey CreekRM 1.81
Newport TributaryRM 0.01
Newport TributaryRM 0.06
Yarrow W TributaryRM 0.10
Yarrow E TributaryRM 0.25
Nu
mb
er C
aptu
red
2017 Species Distribution by Stream Reach
Bluegill Cutthroat Dace Lamprey Pumpkinseed Sculpin
↑ Total Kelsey Creek Cutthroat: 296Total Yarrow E Trib Cutthroat: 190 ↑

Bellevue Summer Electrofishing 2017
City of Bellevue
November 20, 2017 10
efforts in 1996 and 2013 found no sculpin in the Newport Tributary. These fish were likely recruited from Coal Creek and Lake Washington. Relatively low numbers of lamprey were also captured in the Kelsey and Newport survey reaches at densities ranging from 0.02 to 0.06 fish per linear foot. In addition, two invasive species of sunfish, a pumpkinseed sunfish, and bluegill were captured at Kelsey Creek RM 1.81. Notably absent in 2017 surveys were juvenile coho salmon, but this was expected since there were no coho redds in 2016. This species has been observed in several reaches of the Kelsey Creek basin in previous survey years. In 2014, a relatively high proportion and density of juvenile coho were captured in Kelsey Creek at RM 1.4 (28.6 percent of total catch; 0.24 fish per linear foot), which represented the highest densities observed in recent years. During that year, coho were also captured at RM 1.8, though at lower densities (0.05 fish per linear foot; Hart Crowser 2014). In 2013, coho were also captured at RM 4.0 at low densities (0.04 fish per linear foot; Hart Crowser 2013). In 17 surveys between 1996 and 2016, juvenile coho have been captured in 11 of 17 years within Kelsey Creek and West Tributary.
Table 4. Estimated density of fish species.
3.3 Cutthroat Length Distribution and Habitat Use The majority of trout in the Newport, Yarrow, and Kelsey Creek survey reaches were less than 80 mm in fork length (88.9 percent). Maximum lengths were near 200 mm except for the Yarrow West reach where all fish were small (Table 5). Within the Newport tributaries, between 8.3 (RM 0.01) and 40 percent (RM 0.06) of the cutthroat captured were over 80 mm, with most of the larger fish within the size classes of 130-160 mm and greater than 170 mm (Figures 3 and 4). Newport Creek had the highest percentage of trout greater than 80mm in all survey reaches in 2017; however, there were very low numbers of total fish captured. The smallest fish were captured within the Yarrow tributaries with only 3.9 (West) and 1.6 percent (East) of fish over 80 mm (Figures 5 and 6). The highest distribution of larger cutthroat were captured in Kelsey Creek with a total of 16.9 percent of fish larger than 80 mm. Length frequency data do not show clear clusters of fish that suggests separate year classes above the young of
Kelsey Creek
RM 1.81
Newport Tributary
RM 0.01
Newport Tributary
RM 0.06
Yarrow W Tributary
RM 0.10
Yarrow E Tributary
RM 0.25
301 204 133 213 102
Cutthroat
(fish/ft)0.98 0.12 0.15 0.24 1.86
Dace
(fish/ft)0.32 0.00 0.00 0.00 0.00
Lamprey
(fish/ft)0.06 0.04 0.02 0.00 0.00
Sculpin
(fish/ft)0.00 0.29 0.12 0.00 0.00
Pumpkinseed
(fish/ft)0.01 0.00 0.00 0.00 0.00
Bluegill
(fish/ft)0.01 0.00 0.00 0.00 0.00
Species
Fish Density (fish/linear foot)
Reach Length (linear feet)

Bellevue Summer Electrofishing 2017
City of Bellevue
11 November 20, 2017
the year. However, there is likely more than 1 year class clustered from 110 to 160 mm and a larger year class greater than 170 mm (Figure 7).
Although the highest densities of fish were captured in reaches with the highest proportion of pools (Kelsey Creek 42.2 percent pool/glide habitat and 0.98 fish per linear foot; Yarrow East with 43.1 percent pool and 1.86 fish per linear foot), aggregate data from all reaches show that larger fish were not necessarily associated with pools. This is likely because of the high number of smaller trout captured in the large deep pools associated with the Yarrow East tributary. These pools were formed artificially by the earthen embankment in what otherwise is a very small stream. The size of the stream may not be capable of supporting larger fish, and the two large pools attracted high densities of fish because of the lack of habitat or water volumes in other portions of the small stream.
Figure 3. Length frequency distribution of cutthroat at Newport Tributary Site 1 (RM 0.01) in 2017.
0
1
2
3
4
5
6
7
8
9
10
<80 80-89 90-99 100-109 110-119 120-129 130-139 140-149 150-159 160-169 170-179 180-189 190-199 >200
Num
ber
Capt
ured
Length Category (mm)
2017 Length Frequency Distribution of CutthroatNewport Tributary (RM 0.01)
Total Cutthroat Captured: 24
↑ Total Cutthroat <80 mm: 22

Bellevue Summer Electrofishing 2017
City of Bellevue
November 20, 2017 12
Figure 4. Length frequency distribution of cutthroat at Newport Tributary Site 2 (RM 0.06) in
2017.
Figure 5. Length frequency distribution of cutthroat Yarrow West Tributary (RM 0.10) in 2017.
0
1
2
3
4
5
6
7
8
9
10
<80 80-89 90-99 100-109 110-119 120-129 130-139 140-149 150-159 160-169 170-179 180-189 190-200 >200
Num
ber
Capt
ured
Length Category (mm)
2017 Length Frequency Distribution of CutthroatNewport Tributary (RM 0.06)
Total Cutthroat Captured: 20
↑ Total Cutthroat <80 mm: 12
0
1
2
3
4
5
6
7
8
9
10
<80 80-89 90-99 100-109 110-119 120-129 130-139 140-149 150-159 160-169 170-179 180-189 190-199 >200
Num
ber
Capt
ured
Length Category (mm)
2017 Length Frequency Distribution of CutthroatYarrow West Tributary (RM 0.10)
Total Cutthroat Captured: 51
↑ Total Cutthroat <80 mm: 49

Bellevue Summer Electrofishing 2017
City of Bellevue
13 November 20, 2017
Figure 6. Length frequency distribution of cutthroat Yarrow East Tributary (RM 0.25) in 2017.
Figure 7. Length frequency distribution of cutthroat Kelsey Creek (RM 1.81) in 2017.
0
5
10
15
20
25
<80 80-89 90-99 100-109 110-119 120-129 130-139 140-149 150-159 160-169 170-179 180-189 190-199 >200
Num
ber
Capt
ured
Length Category (mm)
2017 Length Frequency Distribution of CutthroatYarrow East Tributary (RM 0.25)
# Captured Downstream # Captured Upstream
Total Cutthroat Captured: 190
↑ Total Downstream Cutthroat <80 mm: 165
0
5
10
15
20
25
<80 80-89 90-99 100-109 110-119 120-129 130-139 140-149 150-159 160-169 170-179 180-189 190-200 >200
Num
ber
Capt
ured
Length Category (mm)
2017 Length Frequency Distribution of CutthroatKelsey Creek (RM 1.81)
↑ Total Cutthroat <80 mm: 246

Bellevue Summer Electrofishing 2017
City of Bellevue
November 20, 2017 14
Table 5. Number caught and length range for cutthroat across all sites sampled.
At Kelsey RM 1.81, most fish captured in pools were associated with woody debris. Fish were also pulled out of undercut banks present throughout both pool and riffle habitats. At the Newport tributaries, most fish were captured in pools either with woody debris or low hanging vegetation (see Photos 2 and 6). Most fish collected from riffle habitats at the Newport reaches were associated with undercut banks, with some fish under overhanging vegetation and under woody debris.
3.4 Cutthroat Length-Weight Relationship During the 2017 fish surveys, weights (grams) of all individual cutthroat trout were collected. However, the weights of small fish were impacted by residual water in the sample, so weights of fish smaller than 80 mm should be considered more qualitative indicators. Weights of trout ranged from 1 to 85.5 grams within the Kelsey and Newport Creek (RM 0.06) basins. These were the only basins with appreciable numbers of larger fish. To evaluate the relative health and robustness of trout, a weight-length relationship was used to determine a condition index of fish. The Fulton Condition Factors Index was used (Anderson and Neumann 1996), calculated as:
K = (W/L3) X 100,000 where,
K = Condition Index W = Weight L = Length
This conditions index should be used to compare fish of similar size; the higher the index value, the more robust the fish. Condition index values for cutthroat trout in the Kelsey basin ranged from 0.8 to 1.9, with both the highest index values and highest variability occurring with smaller fish. The mean
SiteNumber of
Cutthroat CaughtMin Length (mm) Max Length (mm)
Kelsey Creek
RM 1.81296 40 204
Newport
Tributary
RM 0.01
25 47 176
Newport
Tributary
RM 0.06
20 50 212
Yarrow W
Tributary
RM 0.10
51 33 85
Yarrow E
Tributary
RM 0.25
190 35 196

Bellevue Summer Electrofishing 2017
City of Bellevue
15 November 20, 2017
condition index for trout in the Kelsey and Newport survey reaches were quite similar at 1.17 and 1.16, respectively (Figure 8). The difference found at the two survey areas were not statistically significant.
Figure 8. Fulton Conditions Factor Index for cutthroat trout at Kelsey and Newport Creek survey areas in 2017.
3.5 Other Species All longnose dace were captured in Kelsey Creek at RM 1.81. Length frequency distributions do not show clear year-classes, but the size range captured indicate that several are likely present (Figure 9). According to age and growth data presented by Wydoski and Whitney (2003), juvenile year classes between 60 and 70 mm and multiple adult year classes as old as Age 5 may be present. Over 90 percent of all dace were captured in riffles, which is the preferential habitat of this species. Observations during the surveys indicated that most were associated with moderate to large cobble and rocks rather than woody debris. Many were also captured from under cut banks associated with at least moderate currents.
0.6
0.8
1
1.2
1.4
1.6
1.8
2
30 50 70 90 110 130 150 170 190 210 230
Co
nd
itio
n In
dex
(K
)
Fork Length (mm)
2017 Condition Index of CutthroatKelsey Creek (RM 1.81) and Newport Tributary (RM 0.06)
Kelsey Creek RM 1.81 Newport Tributary RM 0.06

Bellevue Summer Electrofishing 2017
City of Bellevue
November 20, 2017 16
Figure 9. Length frequency distribution of longnose dace Kelsey Creek (RM 1.81) 2017.
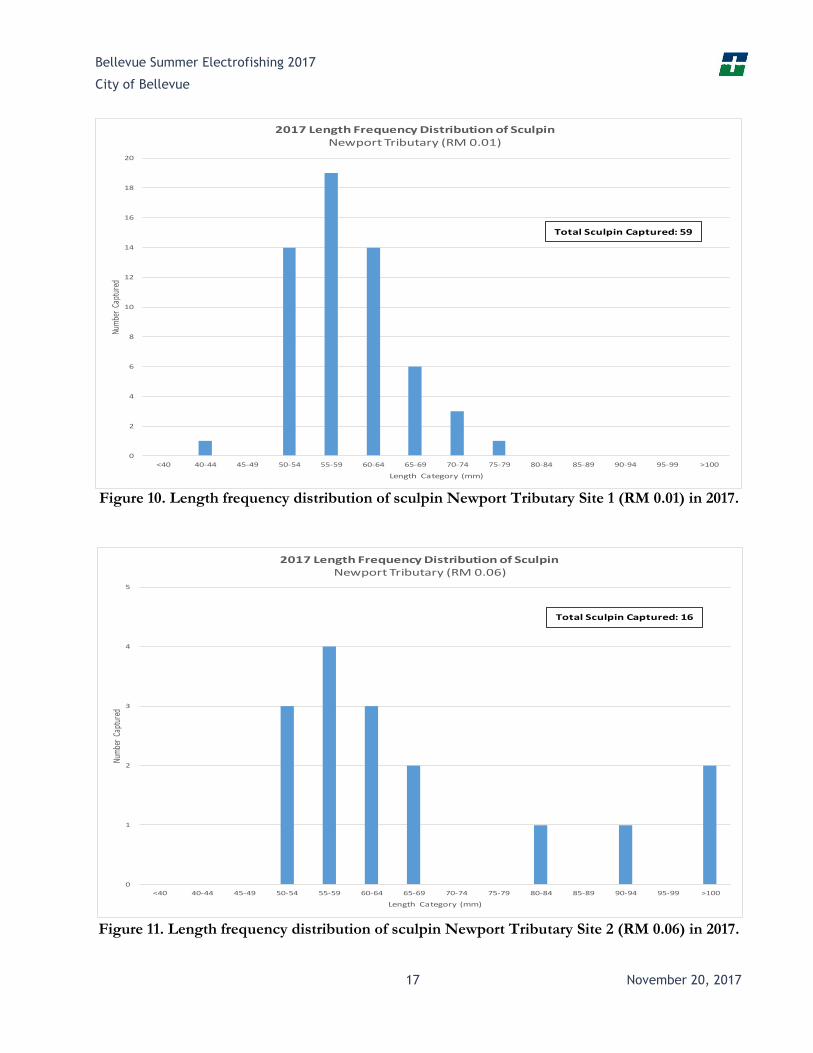
Sculpin were dominant at the lower Newport Tributaries comprising 57.3 percent of total catch in 2017. Comparing length frequency data from Newport (Figures 10 and 11) and age and growth data from Lake Washington indicate that fish likely range from young of the year to adult fish between Ages 2 and 4. According to references, over 90 percent of Age 2 fish are reproductively mature in the lake (Wydoskiand Whitney 2003).
A total of 29 lamprey were captured in Kelsey Creek (18 individuals) and the two Newport Tributaries (11 individuals) in 2017. The size range of lamprey captured were between 66 and 195 mm suggesting that fish were likely between 1 and 4 year old ammocoetes (Wydoski and Whitney 2003).
0
5
10
15
20
25
30
35
40
<50 50-59 60-69 70-79 80-89 90-99 100-109 110-119 120-129 130-139 140-149 150-159
Num
ber
Capt
ured
Length Category (mm)
2017 Length Frequency Distribution of DaceKelsey Creek (RM 1.81)
Bellevue Summer Electrofishing 2017
City of Bellevue
17 November 20, 2017
Figure 10. Length frequency distribution of sculpin Newport Tributary Site 1 (RM 0.01) in 2017.
Figure 11. Length frequency distribution of sculpin Newport Tributary Site 2 (RM 0.06) in 2017.
0
2
4
6
8
10
12
14
16
18
20
<40 40-44 45-49 50-54 55-59 60-64 65-69 70-74 75-79 80-84 85-89 90-94 95-99 >100
Num
ber
Capt
ured
Length Category (mm)
2017 Length Frequency Distribution of SculpinNewport Tributary (RM 0.01)
Total Sculpin Captured: 59
0
1
2
3
4
5
<40 40-44 45-49 50-54 55-59 60-64 65-69 70-74 75-79 80-84 85-89 90-94 95-99 >100
Num
ber
Capt
ured
Length Category (mm)
2017 Length Frequency Distribution of SculpinNewport Tributary (RM 0.06)
Total Sculpin Captured: 16

Bellevue Summer Electrofishing 2017
City of Bellevue
November 20, 2017 18
3.6 Native and Non-Native Species The diversity of fish captured during the 2017 survey was comparable to that found in 2016 and 2014 with the exception of coho salmon found in 2014 (none were captured in 2016 or 2017). In 2014, coho were second in abundance (Hart Crowser 2014; Table 6). No coho were captured in Kelsey Creek in 2012 (Hart Crowser 2012). The lack of juvenile coho in 2016 and 2017 were the result of no observed natural spawning and no hatchery releases in 2015 and 2016. Juvenile coho salmon were therefore not expected. The abundance of longnose dace was comparable in numbers found in 2016. Only two non-native sunfish species, a single pumpkinseed and bluegill, were found in Kelsey Creek in 2017; the same low occurrence of these species were found in 2014 and 2016 within the basin. Non-native species were captured in Kelsey Creek in previous years, all warm water Centrachids (sunfish and bass) or carp (Cyprinus carpio; Table 7).

Bellevue Summer Electrofishing 2017
City of Bellevue
19 November 20, 2017
Table 6. Native species documented in Bellevue streams during 1983, 1996–1997, 2002, 2007, and 2010–2017 summer fish surveys.
YearYarrow
W Trib
Yarrow E
Trib
River
Mile0.2 1.06 1.4 1.8 2.1 2.59 3.81 3.83 3.97 0.01 0.06 1.13 1.8 0.1 0.25
1983 x x x
1996 x x x x
1997 x x
2002 x
2007 x x
2010
2011 x x
2012 x
2013 x
2014 x x
2015
2016
2017
1983 x x x
1996 x x x x x x
1997 x x
2002 x x x
2007 x x x x x
2010 x x x
2011 x x x
2012 x x
2013 x x x
2014 x x
2015
2016 x x
2017 x x x x x
1983 x x x
1996
1997 x
2002
2007
2010
2011
2012
2013
2014
2015
2016
2017
1983
1996 x
1997 x
2002
2007
2010
2011
2012 x
2013
2014
2015
2016 x
2017 x x
1983 x x x
1996
1997
2002 x
2007 x
2010
2011
2012
2013
2014
2015
2016
2017
Cutthroat
Trout
Oncorhynchus
clarki
Common
Name
Scientific
Name
Kelsey Creek Newport Creek Yarrow Creek
Coho SalmonOncorhynchus
kisutch
Rainbow
Trout
Oncorhynchus
mykiss
Sculpin Cottus spp.
Three-spine
stickleback
Gasterosteus
aculeatus

Bellevue Summer Electrofishing 2017
City of Bellevue
November 20, 2017 20
Table 6 (cont’d)
= did not sample
= sampled, no fish seen
x = sampled, fish seen
YearYarrow
W Trib
Yarrow E
Trib
River
Mile0.2 1.06 1.4 1.8 2.1 2.59 3.81 3.83 3.97 0.01 0.06 1.13 1.8 0.1 0.25
1983
1996 x
1997
2002 x
2007 x x x x
2010 x
2011
2012 x x
2013 x
2014 x x
2015
2016
2017 x x
1983
1996 x x
1997
2002
2007 x
2010
2011
2012
2013
2014
2015
2016
2017
1983
1996 x x
1997 x
2002 x x
2007 x x x
2010 x x
2011
2012 x x
2013
2014 x
2015
2016 x x
2017 x
1983
1996 x
1997 x x
2002 x x x
2007 x x x x x
2010 x x x
2011 x x x
2012
2013 x x
2014 x x
2015
2016 x x
2017 x x x x x
Newport Creek Yarrow CreekCommon
Name
Scientific
Name
Kelsey Creek
LampreyLampetra
spp.
Largescale
Sucker
Catostomus
macrocheilus
Dace
(longnose or
speckled)
Rhinichthys
spp.
Trout Fry
(<80 mm)

Bellevue Summer Electrofishing 2017
City of Bellevue
21 November 20, 2017
Table 7. Non-native species documented in Bellevue streams during 1983, 1996–1997, 2002, 2007, and 2010–2017 summer fish surveys.
= did not sample
= sampled, no fish seen
x = sampled, fish seen
YearYarrow
W Trib
Yarrow E
Trib
River
Mile0.2 1.06 1.4 1.8 2.1 2.59 3.81 3.83 3.97 0.01 0.06 1.13 1.8 0.1 0.25
1983
1996 x x x
1997
2002 x
2007
2010 x x
2011
2012
2013
2014
2015
2016
2017 x
1983
1996
1997 x
2002
2007
2010 x
2011
2012
2013
2014
2015
2016
2017
1983
1996
1997
2002 x
2007
2010
2011
2012
2013
2014 x
2015
2016 x
2017 x
1983
1996
1997
2002
2007
2010 x x
2011
2012
2013
2014
2015
2016
2017
1983
1996
1997
2002
2007
2010 x
2011
2012
2013
2014
2015
2016
2017
Common
Name
Scientific
Name
Kelsey Creek Newport Creek Yarrow Creek
BluegillLepomis
macrochirus
Carp Cyprinus carpio
Largemouth
Bass
Micropterus
salmoides
PumpkinseedLepomis
gibbosus
Crappie (black
or white)Pomoxis spp.

Bellevue Summer Electrofishing 2017
City of Bellevue
November 20, 2017 22
3.7 Cutthroat Trout Stomach Analysis for New Zealand Mudsnails (Potamopyrgus antipodarum)
The invasive species, New Zealand mudsnail (Potamopyrgus antipodarum) has been documented in the Kelsey Creek drainage, as well as several others within the City of Bellevue. When fed upon by fish, this species can pass through the intestinal tract intact without providing any nutrient value, potentially decreasing condition and health. On July 10, 2017 during the fish survey on Kelsey Creek (RM 1.81), 283 cutthroat trout were subject to gastric lavage while anesthetized to flush the stomach contents and determine if fish were feeding on this invasive species. Due to budget constraints, only 125 samples could be analyzed. The samples were sorted into size classes. Individual samples were selected by randomly generated number tables according to percentages by size class. These investigations continued what was first conducted in 2014 and 2016 surveys. Efforts could not be conducted in 2015 because of warm water temperatures and concerns that gastric lavage procedures would place too much of a stressor on captured fish.
Of the 125 cutthroat trout samples analyzed, New Zealand mudsnails were found in only 12 fish, just 9.6 percent of fish examined. Fish that consumed mudsnails were larger, ranging from 122 to 189 mm. With only one exception, no more than two fish from each size range contained New Zealand mudsnail (Figure 12).
Figure 12. Size range of cutthroat trout feeding on New Zealand mudsnails.
0
5
10
15
20
25
<80 80-89 90-99 100-109 110-119 120-129 130-139 140-149 150-159 160-169 170-179 180-189 190-200 >200
Nu
mb
er C
ap
ture
d
Length Category (mm)
2017 Length Frequency Distribution of CutthroatKelsey Creek (RM 1.81)
No NZMS NZMS
↑ Total Cutthroat <80 mm: 246
Bellevue Summer Electrofishing 2017
City of Bellevue
23 November 20, 2017
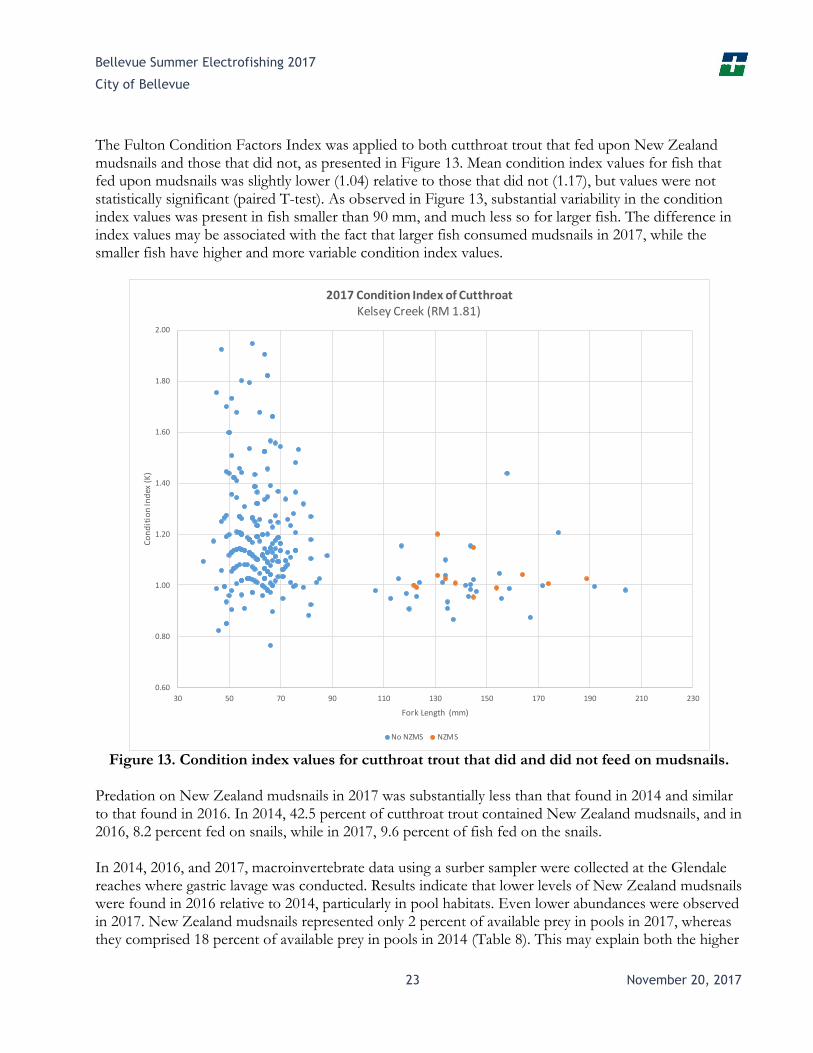
The Fulton Condition Factors Index was applied to both cutthroat trout that fed upon New Zealand mudsnails and those that did not, as presented in Figure 13. Mean condition index values for fish that fed upon mudsnails was slightly lower (1.04) relative to those that did not (1.17), but values were not statistically significant (paired T-test). As observed in Figure 13, substantial variability in the condition index values was present in fish smaller than 90 mm, and much less so for larger fish. The difference in index values may be associated with the fact that larger fish consumed mudsnails in 2017, while the smaller fish have higher and more variable condition index values.
Figure 13. Condition index values for cutthroat trout that did and did not feed on mudsnails.
Predation on New Zealand mudsnails in 2017 was substantially less than that found in 2014 and similar to that found in 2016. In 2014, 42.5 percent of cutthroat trout contained New Zealand mudsnails, and in 2016, 8.2 percent fed on snails, while in 2017, 9.6 percent of fish fed on the snails.
In 2014, 2016, and 2017, macroinvertebrate data using a surber sampler were collected at the Glendale reaches where gastric lavage was conducted. Results indicate that lower levels of New Zealand mudsnails were found in 2016 relative to 2014, particularly in pool habitats. Even lower abundances were observed in 2017. New Zealand mudsnails represented only 2 percent of available prey in pools in 2017, whereas they comprised 18 percent of available prey in pools in 2014 (Table 8). This may explain both the higher
0.60
0.80
1.00
1.20
1.40
1.60
1.80
2.00
30 50 70 90 110 130 150 170 190 210 230
Co
nd
itio
n In
dex
(K
)
Fork Length (mm)
2017 Condition Index of CutthroatKelsey Creek (RM 1.81)
No NZMS NZMS

Bellevue Summer Electrofishing 2017
City of Bellevue
November 20, 2017 24
predation levels found in 2014 and the higher proportion of mudsnails in the diet of larger cutthroat trout during that year.
Table 8. Benthic availability of New Zealand mudsnails in Kelsey Creek in 2014, 2016, and 2017.
Survey Year
Percentage of New Zealand Mudsnail Abundance
Pool Riffle
2014 18% Mudsnails 82% Other Macroinvertebrates
5% Mudsnails 95% Other Macroinvertebrates
2016 5% Mudsnails 95% Other Macroinvertebrates
3% Mudsnails 97% Other Macroinvertebrates
2017 2% Mudsnails 98% Other Macroinvertebrates
2% Mudsnails 98% Other Macroinvertebrates
Cutthroat trout consumed several invertebrate taxa within the Kelsey survey reach. The most frequent prey items found were dipteran insects, most of which were midges with a secondary abundance of crane flies. These comprised 50 percent of all prey recovered by gastric lavage. Aquatic insects from the order Ephemeroptera (mayflies) and trichoptera (caddis flies) comprised approximately 21 percent of recovered prey. Aquatic amphipods comprised 14 percent of prey. Combined, these four groups comprised 85 percent of all prey recovered through gastric lavage from cutthroat trout. New Zealand mudsnails comprised just 2.9 percent of all prey consumed.
The diets of the 12 fish that preyed upon New Zealand mudsnails contained a much higher proportion of snails relative to other invertebrates, as presented in Figure 14. Ten of the 12 fish preyed upon both aquatic and terrestrial prey, as well as mudsnails; the other two fish preyed upon other aquatic prey and mudsnails only in roughly equal proportions. Only one fish fed predominantly on mudsnails, comprising 53 percent of prey by weight. However, all 12 fish contained significant amounts of mudsnails, comprising between 25 and 53 percent by weight of prey consumed. Of the three prey groups, mudsnails comprised a slightly higher proportional mean found in the 12 fish at 36 percent. Aquatic species comprised 35 percent of prey, while terrestrial species comprised 29 percent of prey.
According to surber sample data, cutthroat trout as a whole consumed mudsnails at similar levels to their presence in the Kelsey survey reach—two percent relative abundance within stream habitats and 2.9 percent consumption relative to other species. However, the 12 fish that consumed New Zealand mudsnails preyed upon them at a much higher proportion then their availability within the survey reach (average of 36 percent and a range of 25 to 53 percent of diet). It is not known why these fish preyed upon mudsnails at a higher consumption rate. Given that all had consumed substantial amounts of other prey species, this may indicate a patchy distribution of mudsnails within the stream channel and opportunistic feeding where encountered, rather than the targeting of the species. As reported, fish that consumed mudsnails did not occupy a particular year or size class, except that small cutthroat did not appear to feed on them (Figure 12). In 2017, those that fed upon them also did not have significantly different condition index values.

Bellevue Summer Electrofishing 2017
City of Bellevue
25 November 20, 2017
Figure 14. Total diet of individual cutthroat trout that fed upon New Zealand mudsnail (NZMS)
Fish surveys in Kelsey Creek at RM 1.81 have been conducted in 2007, 2010, 2014, and 2017, with length frequency distributions presented in Figure 15. These distributions can be evaluated into pre-New Zealand mudsnail years (2007 and 2010) and post-infestation years (2014 and 2017) to determine if any differences in the size distribution of fish can be observed that may be attributed to mudsnails or other
27%
40%
33%
A4 Diet (122 mm)
Aquatic Terrestrial NZMS
27%
48%
25%
A14 Diet (138 mm)
Aquatic Terrestrial NZMS
55%
45%
A42 Diet (145 mm)
Aquatic Terrestrial NZMS
36%
30%
34%
B33 Diet (164 mm)
Aquatic Terrestrial NZMS
33%
36%
30%
C2 Diet (174 mm)
Aquatic Terrestrial NZMS
31%
33%
36%
C8 Diet (131 mm)
Aquatic Terrestrial NZMS
31%
29%
40%
C38 Diet (145 mm)
Aquatic Terrestrial NZMS
47%53%
C42 Diet (189 mm)
Aquatic Terrestrial NZMS
34%
33%
34%
D6 Diet (134 mm)
Aquatic Terrestrial NZMS
34%
31%
35%
D48 Diet (154 mm)
Aquatic Terrestrial NZMS
33%
32%
35%
D53 Diet (123 mm)
Aquatic Terrestrial NZMS
32%
36%
32%
D54 Diet (131 mm)
Aquatic Terrestrial NZMS

Bellevue Summer Electrofishing 2017
City of Bellevue
November 20, 2017 26
possible habitat variables. The results of statistical analyses are mixed. For example, for smaller fish under 80 mm in length, the mean length of fish between pre- and post-infestation periods are very similar and not statistically different (paired T-test), but the variance was statistically different (paired F-test)—i.e., a higher distribution of small fish sizes was observed during the pre-infestation years relative to post. The causes of this statistically significant difference are not apparent, but given that the preponderance of mudsnail predation occurs in larger fish, it would appear that mudsnails are not a factor.
For larger fish over 80 mm, the opposite was observed—there was a statistically significant difference in the mean size of fish (120.9 mm for pre-infestation years and 132.2 mm for post), but no statistically significant difference in the variance of larger fish sizes. The notable finding here is that the mean size of cutthroat trout was actually larger during the post-infestation period, which is not the expected outcome if mudsnail predation is harming the population.
Figure 15. Length frequency distribution of cutthroat trout during pre-mudsnail infestation years (2007 and 2010) and post-infestation years (2014 and 2017).
Though the sample periods are small, these early analyses of condition index and size distribution suggest that predation has not reached a threshold where adverse effects to the cutthroat trout population are occurring. The 2017 data do appear to indicate that at least some cutthroat trout will consume them at relatively high rates given the opportunity. Further monitoring of both infestation levels and predation are necessary to determine if the mudsnail is disrupting the ecological foodweb and subsequent abundance and health of trout within basins where infestations have been documented.
0.0%
5.0%
10.0%
15.0%
20.0%
25.0%
30.0%
35.0%
40.0%
Per
cen
t o
f To
tal C
ap
tru
ed
Length Category (mm)
Length Frequency Distribution of CutthroatKelsey Creek RM 1.8
2007 % of Total
2010 % of Total
2014 % of Total
2017 % of Total

Bellevue Summer Electrofishing 2017
City of Bellevue
27 November 20, 2017
4.0 Discussion and Recommendations for Future Actions
4.1 Discussion Two of the survey reaches in 2017 involved sites where stream restoration projects have been previously undertaken—woody debris placements and reconstructed riffles at the lower Newport tributary and stream channel and riparian improvements on West Yarrow tributary (Table 1). The 2017 survey represented an initial sampling of these sites to determine the long-term performance of this habitat enhancement, as well as a recent fish passage construction at the confluence of the Newport Tributary and Coal Creek.
Results indicate relatively good fish use of habitats at the lower restored Newport site. Both upper and lower Newport sites had similar abundance and densities of cutthroat trout. A somewhat greater diversity of age classes and older fish was observed at the upstream site, which may be attributed to the much denser concentrations of natural wood within the stream at this location and the dense low hanging vegetation and shade canopy present.
For the first time, sculpin were found at both Newport sites, owing to recent downstream fish passage/riffle reconstruction, which eliminated a barrier to the species. Survey results appear to indicate that the construction is quite successful as sculpin were the dominant species at both Newport sites. Densities at the lower restoration site were also higher than the upper (0.29 vs 0.12 fish per linear foot). Riffle-pool (or glide) habitats were similar for both reaches, but the restored reach has a higher incidence of larger rock clusters throughout the stream channel, creating an increased level of habitat complexity and microhabitats within the riffles. This may have contributed to higher sculpin densities, though the closer proximity to Coal Creek may also provide a higher level of recruitment from Coal Creek or Lake Washington. At the upper Newport site, proposed stream enhancements would be beneficial to such a small stream. Large woody debris can provide microhabitat formations that create deeper water habitats for fish, particularly in smaller streams. Enhancements should be imbedded directly in the stream channel; sufficient overhanging vegetation is already present.
The Yarrow West tributary has had both stream channel and riparian improvements that appear to be attracting a moderate level of fish use. Despite being a small, straight stream reach, densities of cutthroat trout were 0.24 fish per linear foot, which are well within abundances found historically within the basin. The larger rocks within the stream channel create deeper and more complex habitats within riffles. The stream is somewhat open, but most of the planted riparian species are young tree saplings and smaller shrubs. As the riparian zone matures it will likely provide additional improvements to the stream. Wood placements may add to the stability of the moderately steep slopes, but most do not extend into the thalweg, so may not contribute directly to stream habitat complexity.
Continued surveys at these restoration locations and Capital Improvement Projects on Bellevue’s urban streams will be necessary to determine if performance objectives are being achieved on the long-term.

Bellevue Summer Electrofishing 2017
City of Bellevue
November 20, 2017 28
The survey conducted at Yarrow East tributary was a baseline for any future work to this stream reach. The earthen embankment the separates the upstream and downstream portions of the two survey reaches has likely contributed to the size of the two pools, which contain numerous cutthroat trout, but the high densities are likely due to the lack of habitat elsewhere in the stream reach. The adjacent riffles both upstream and downstream of the pools are extremely shallow with very few habitat features. This survey reach, while having the highest cutthroat densities (1.86 fish per linear foot), had the lowest number of fish over 80 mm in length (3 individuals). The pools, while deep and contain woody debris, are depositional with a layer of silt across most of the bottom. Removal of the earthen embankment and associated buried culvert and reconnecting the two pools will improve flows. Riffles adjacent to the two pools would also benefit from wood placements, since these areas presently have little habitat features or complexity.
A weight-length conditions index applied to cutthroat trout captured in two reaches in 2017 found a similar degree of condition, and similar to values found in 2016, as well. This is the second survey in which individual weights were collected for fish; collection of this metric should continue so that comparisons of fish condition can be made between the different stream basins that drain the City.
Two closely located stream reaches of Kelsey Creek flowing through the Glendale Golf Course have been surveyed in 2014, 2016, and 2017. Catch rates of cutthroat trout in 2017 (0.98 fish per linear foot) were within the range and somewhat higher than those found in the stream between 1996 and 2016, suggesting that trout populations are holding their own or increasing within reaches on the golf course. Although the riparian zones at most of the reaches have been altered by the golf course and private homes, the relatively steep stream banks and moderate grades have produced deep pools and glides that provide good habitat for trout and longnose dace.
It should also be noted that elevated stream temperatures were found in Kelsey Creek on the golf course during 2015 as a result of the abnormally warm summer that year. Proposed gastric lavage studies could not be safely conducted within golf course reaches during that year. Other streams surveyed in 2015 (Coal Creek and Richards Creek) had acceptable stream temperatures (<16o C). The headwaters of Kelsey Creek are in Larsen Lake, which can also experience warm summertime temperatures. In 2017, the Kelsey Creek stream reach at the golf course had the highest water temperatures of all reaches surveyed, suggesting that lack of riparian vegetation may also be contributing to higher temperatures (Table 3). Other factors may include warm runoff from impervious surfaces during the summer and lack of groundwater discharge.
Similar predation rates on New Zealand mudsnails by cutthroat trout were found in 2017 relative to 2016, and much lower than that found in 2014; reduced predation may be due to lower abundances found in both pool and riffle habitats in 2017. It is not known why lower abundances of snails were observed, but additional surveys of both gut content and macroinvertebrates will be necessary to determine if this is a positive trend. In 2017, those fish that fed upon mudsnails did so at much higher proportions than found in the stream reach. This suggests that substantial opportunistic feeding on snails may be occurring with some fish, which is a concern. Analysis of fish condition should also continue to determine the long-term potential effects on fish health.
4.2 Recommendations It is recommended that the City continue studies on the reaches sampled this year and in previous years. Conducting additional surveys on reaches where capital projects were undertaken will be important to

Bellevue Summer Electrofishing 2017
City of Bellevue
29 November 20, 2017
determine the long-term success of these projects relative to stream health and function, as well as on the effectiveness of future capital projects designed to improve fish habitat and passage. Continued studies to track the diversity, size, and abundance of native and non-native fish species for use as an indicator of overall stream health is also advised. In addition, it is recommended that the City continue stomach content studies to determine if New Zealand mudsnails are a substantial component of the diet of cutthroat trout and juvenile coho salmon. Additional data are necessary to determine why a decrease in both predation and abundance were observed in 2016 and 2017 relative to 2014, and to determine if this is a trend. As well, assessing mudsnail densities within infested index reaches should continue to determine trends in abundance and ultimate availability to fish. In addition, it is recommended that fish condition assessments, including length, weight and general condition observations continue on order to evaluate impacts on fish health.
Below is a detailed list of recommendations for the City of Bellevue to facilitate these actions.
• Compare diversity, size, and abundance of fish species across all years for sites with historicaldata.
• Conduct electrofishing at low, middle, and upper reaches of creeks during the same samplingevents to determine how salmonids and native fish are distributed across the watershed.
• Continue fish condition index at electrofishing sites to assess the relative health of priority fishspecies. The index could then be compared to other Western Washington urban streamswhere this particular data have been collected.
• Collect additional stream habitat data within survey reaches including debris counts, percentcanopy coverage and shading, cutbank lengths, boulder cluster counts (which can enhancemicrohabitats in small streams), and substrate type. Survey observations strongly suggest thatthe presence of these stream and riparian habitat attributes effect the abundance and diversityof fish in survey reaches and should be quantified.
• Continue to collect gut content data from priority salmonid species at benthic index ofbiotic integrity (BIBI) sites to determine if aquatic or terrestrial prey species dominate andto further investigate New Zealand mudsnail predation. These data will help determineprey species availability and use by salmonids. Data collected can also help determine ifriparian and/or substrate improvements are necessary.
• Compare size of coho and cutthroat fish populations to other Puget Sound lowland referencestreams.
• Continue a consistent electrofishing program within select index reaches to increaserobustness of data for determination of status and trends of priority fish species and todetermine the prevalence of non-native species.
• Include adult coho escapement data in the status and trends database in order to associatecoho presence or absence with run size.
Data collected for native and non-native fish species presence, status, and trends in urban streams can be a useful tool in determining the health of urban streams. Changes in these attributes can also be used to determine if cumulative alterations in land use, habitat restoration activities, and supplementation efforts are influencing fish populations. However, fish use (or lack thereof) in urban streams can be due to many variables, including temporal and spatial changes, habitat type and condition, water quality, and

Bellevue Summer Electrofishing 2017
City of Bellevue
November 20, 2017 30
climate. Changes to any one of these variables, without collecting data on each of them, make it difficult to determine what might be causing changes in fish densities and species composition. However, collecting consistent data on habitat change, fish use, and diets (both temporally and spatially), would help ascertain if changes in fish populations and density are due to natural environmental changes, beneficial habitat modifications, or changes in land use. Implementing the recommendations mentioned above would help the City of Bellevue further answer these questions about its local, urban streams.

Bellevue Summer Electrofishing 2017
City of Bellevue
November 20, 2017
5.0 Literature Cited Anderson, R.O. and R.M. Neumann. 1996. Length Weight and Associated Structural Indices. Pages 447-482 in B.R. Murphy and D.W. Willis, editors. Fisheries Techniques, 2nd Edition. American Fisheries Society, Bethesda, Maryland. Hart Crowser. 2014. Bellevue Electrofishing 2014. Final Report. Prepared for the City Bellevue Utilities Department, Bellevue, Washington. Hart Crowser. 2014. Bellevue Electrofishing 2014. Final Report. Prepared for the City Bellevue Utilities Department, Bellevue, Washington. Hart Crowser. 2013. Bellevue Electrofishing 2014. Final Report. Prepared for the City Bellevue Utilities Department, Bellevue, Washington. Hart Crowser. 2012. Bellevue Electrofishing 2012. Final Report. Prepared for the City Bellevue Utilities Department, Bellevue, Washington. Wydoski, R.S. and R.R. Whitney. 2003. Inland Fishes of Washington. Second Edition, Revised and Expanded. American Fisheries Society, Bethesda, Maryland in association with University of Washington Press, Seattle, Washington. \\edmsrv\data\NOTEBOOKS\1275403_Bellevue 2015-2018 Electrofish Survey\Deliverables\Reports\Electrofishing Report 2017\Draft 2017 Bellevue Electrofishing Report.docx

Bellevue Summer Electrofishing 2017
City of Bellevue
November 20, 2017
Appendix A - 2015 Raw Data

Bellevue Summer Electrofishing 2017
City of Bellevue
November 20, 2017
[This page intentionally left blank.]


Bellevue Summer Electrofishing 2017
City of Bellevue
November 20, 2017
Appendix B - Project Photos

[This page intentionally left blank.]
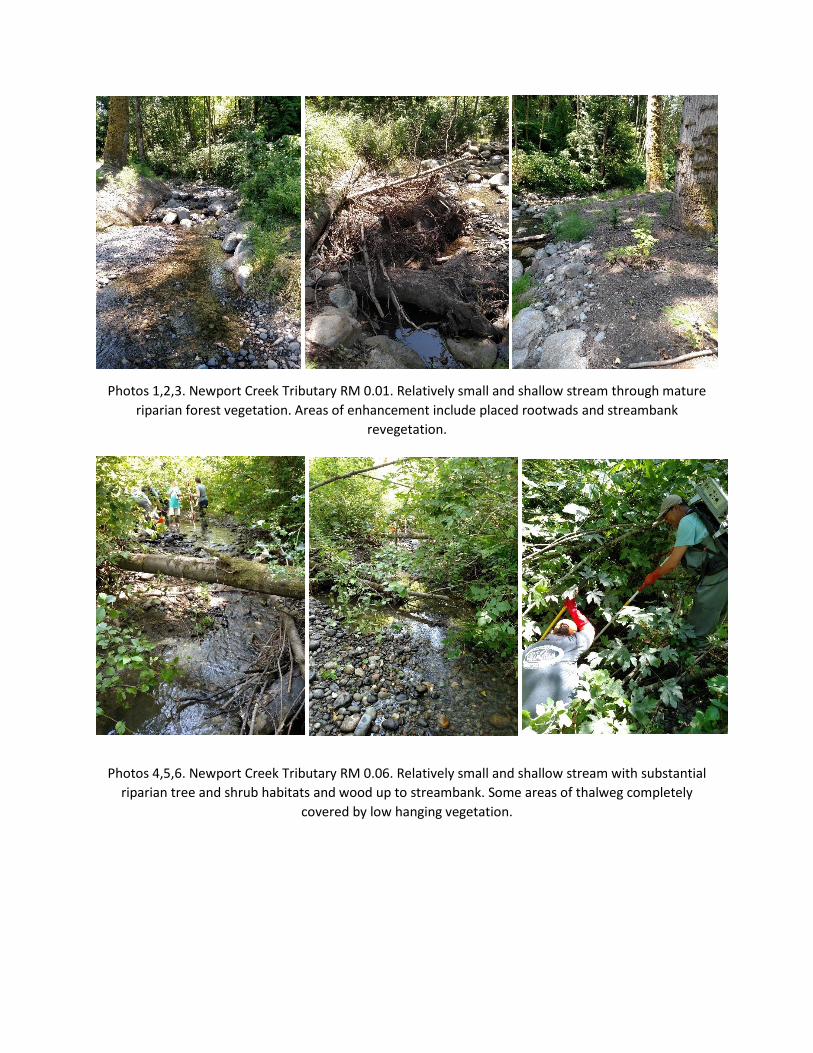
Photos 1,2,3. Newport Creek Tributary RM 0.01. Relatively small and shallow stream through mature
riparian forest vegetation. Areas of enhancement include placed rootwads and streambank
revegetation.
Photos 4,5,6. Newport Creek Tributary RM 0.06. Relatively small and shallow stream with substantial
riparian tree and shrub habitats and wood up to streambank. Some areas of thalweg completely
covered by low hanging vegetation.

Photos 7,8. West Fork Yarrow Creek RM 0.10. Straight stream reach within moderately steep slope
vegetated with young trees and shrubs. Small and narrow, but with overhanging wood and large rock
microhabitats.
Photo 9. East Fork Yarrow Creek RM 0.25. Deep pool habitat, deepest sections over 4 ft. Downstream
portion of separated by earthen embankment. Highly vegetated with trees, shrubs, and grasses. Well
shaded. Much finer sediments.

Photo 10. East Fork Yarrow Creek RM 0.25. Immediately upstream of earthen embankment. Somewhat
smaller pool size relative to downstream of embankment, but same depths. Well shaded. Much finer
sediments.
Photo 11. Sampling team at Kelsey Creek RM 1.81 on Glendale Golf Course. Previously sampled reach
and site of gastric lavage study for New Zealand mud snail predation. Relatively large stream reach with
riffle-pool habitats and highly variable vegetation.

Photo 12. Sampling team sampling riffle within Kelsey Creek.
Photo 13. Typical cutthroat trout from Kelsey Creek. Comparatively larger fish in Kelsey Creek relative to
Yarrow and Newport.

Photo 14. Native longnose dace in Kelsey Creek.
Photo 15. Non-native sunfish species captured in Kelsey Creek.

Photo 16. Gastric lavage team on the bank of Kelsey Creek.
Photo 17. Gastric lavage procedure performed on anesthetized fish.