beitrag rziha-wuhrmann 10.06.2009 10:41 uhr seite 1 ppchem
TRANSCRIPT

PPCHEM Cation Conductivity Monitoring during Startup
Michael RzihaSiemens AG Power Generation, DE-91058 ErlangenDr. Peter WuhrmannSWAN Analytische Instrumente AG, CH-8340 Hinwil
SPEC
IAL
PRIN
TPOWERPLANT CHEMISTRY
PowerPlant Chemistry SPECIAL PRINT (2009) PowerPlant Chemistry 2007, 9(11)
Beitrag Rziha-Wuhrmann 10.06.2009 10:41 Uhr Seite 1

Cation Conductivity Monitoring during Startup
644 PowerPlant Chemistry 2007, 9(11)
PPChem
Michael Rziha
Peter Wuhrmann
ABSTRACT
In recent years, the requirements on startup time dura-tions of combined cycle units with heat recovery steamgenerators have become extreme. In this context,measures taken in the area of monitoring of the keycycle chemistry parameters towards reducing the timenecessary to obtain correct and representative analy-sis values are very important. This paper describessome recent developments and clearly demonstratesthat the response time of the instrumentation may bereduced by more than half. In this way, the bypassoperation time may be markedly reduced, yielding sig-nificant benefits.
INTRODUCTION
In recent years, the requirements on startup time durationsof combined cycle units with heat recovery steam genera-tors (HRSGs) have become much more extreme. Due tothe liberalization of the power market, combined cycleunits are more frequently operated in cycling mode. In thisoperation mode, units may be started and shut down daily(≥ 250 starts per year). Considering the substantial fuelcosts and environmental aspects, any shortening of thetime between startup and reaching full load is very impor-tant – each individual minute carries weight. Figure 1 is acomparison of the combined cycle power plant startuptimes between the late 1990s and 2007.
A comparison of startup times of a combined cycle unitdesigned for base-load operation (older design) and a cur-rent combined cycle unit reveals that the startup time up tofull load has been reduced to about 40 % (Figure 2). Thismakes the work of plant chemists very difficult: there isvery little time to implement measuring devices and for aplausibility check of monitoring results. It is imperative toreappraise the chemist's working methods and to adapt tonew demand.
ACTIVITIES DURING STARTUP
Cation conductivity (called acid conductivity in [1]) is stillthe decisive criterion for startup of a steam turbine. Table 1shows the guideline values for the steam quality duringstartup of a turbine [2]. As a rule of thumb, the cation con-ductivity of the steam should be less than 0.5 µS · cm–1
with a recognizable downward tendency.
The decisive factors are how fast the cation conductivityvalue of the steam is available and how correct this value is(the plausibility check). If the period required for the prepa-ration of the monitoring equipment, sample availabilityincluded, is considered in the context of the time neces-sary for the startup of the turbine (Figure 3), it is clear thatthe preparation of the measurement and the plausibilitycheck may considerably prolong the startup procedure.
Cation Conductivity Monitoring during Startup
© 2007 by PowerPlantChemistry GmbH. All rights reserved.
Figure 1: Reduction in combined cycle unit startup time(values for a 400 MW single-shaft cycling unit).
Figure 2: Unrestricted gas turbine startup and maximumsteam turbine load ramp – a comparison of astandard and a cycling plant.
GT gas turbine ST steam turbine
Beitrag Rziha-Wuhrmann 10.06.2009 10:41 Uhr Seite 2

Cation Conductivity Monitoring during Startup
645PowerPlant Chemistry 2007, 9(11)
PPChem
PUTTING MONITORS INTO OPERATION
Optimization of the Monitoring Equipment
A closer inspection reveals that the time necessary toobtain correct and representative analysis values may beconsiderably influenced by skilled design of the monitoringequipment:
• Sample Availability– Optimization of the sampling line– Installation of high-pressure blowdown valves– Application of back-pressure regulators
• Readiness for Service– Dimensioning of the cation filter– Use of regenerated and pre-flushed resins– Installation of an automatic air vent
Figure 3: Startup of the unit and expenditure of time fora reliable cation conductivity measurement.
Figure 4: Influence of cation resin quality (courtesy of H.Maurer).
Sample conductivity 0.057 µS · cm–1; resin volume 1 L; sample flow velocity 6 L · h–1; degasser temperature 99.3 °C.
Table 1: Guide values valid exclusively for startup (1) and deviation from the values recommended for continuous operation.Generally: if one individual parameter of a particular action level reaches or exceeds the value stated, the nextaction level applies.
* continuous measurement at the sampling point at 25 °C
AL1 action level 1 AL2 action level 2 AL3 action level 3 AL4 action level 4(1) In order to avoid efficiency and lifetime reduction, the turbine startup should preferably occur at values of
> AL2 with a downward tendency.(2) AL4: steam quality is poor; damage to the turbine cannot be ruled out. The turbine should be shut down. (3) Copper content monitoring is not necessary in copper-free systems.(4) Sodium monitoring is not mandatory if solid alkalizing agents (caustic or trisodium phosphate) are not applied.
Parameter Unit AL1 AL2 AL3 AL4
Cation conductivity * µS · cm–1 ≥ 0.2 < 0.35 ≥ 0.35 < 0.5 ≥ 0.5 < 1.0 ≥ 1.0
Silica mg · kg–1 ≥ 0.020 < 0.030 ≥ 0.030 < 0.040 ≥ 0.040 < 0.050 ≥ 0.5
Iron (total) mg · kg–1 ≥ 0.020 < 0.030 ≥ 0.030 < 0.040 ≥ 0.040 < 0.050 ≥ 0.5
Copper (total) (3) mg · kg–1 ≥ 0.003 < 0.005 ≥ 0.005 < 0.008 ≥ 0.008 < 0.010 ≥ 0.010
Sodium (4) mg · kg–1 ≥ 0.010 < 0.015 ≥ 0.015 < 0.020 ≥ 0.020 < 0.025 ≥ 0.25
Period per incident during which the turbine may be h ≤ 100 ≤ 24 ≤ 4 0 (2)
further operated
Accumulated total period per year h per year ≤ 2 000 ≤ 500 ≤ 80 0 (2)
Beitrag Rziha-Wuhrmann 10.06.2009 10:41 Uhr Seite 3

Cation Conductivity Monitoring during Startup
646 PowerPlant Chemistry 2007, 9(11)
PPChem
• Avoidance of Incorrect Results– Minimization of the contribution of carbon dioxide to
cation conductivity
Use of Regenerated and Pre-flushed Resins Eachindividual measure contributes to the acceleration of themonitoring activity. Figure 4 demonstrates the optimummonitoring results with regenerated and pre-flushed resinsin comparison to new non-pre-flushed resins. The use of aregenerated and pre-flushed resin may result in a time sav-ings of more than 1 hour. If non-regenerated resins are tobe used, focus must be on their cleanliness, and a sepa-rate device for resin flushing is required.
Air Venting of the Resin Column Manual air vent-ing of cation resin columns is a particularly laborious activ-ity, which has to be performed on the spot, thus tyingdown the staff. Figure 5 shows that more than half an hourmay be saved using automatic air-venting devices.
Importance of the Data Measured
As already stated, the cation conductivity of the steamshould be less than 0.5 µS · cm–1 with a recognizabledownward tendency. Higher values may be tolerated forshort periods of time and during startup provided that theyare caused exclusively by carbon dioxide. However, credi-ble evidence must be provided that the increased cationconductivity is actually caused by carbon dioxide and notby dangerous steam contaminants such as chlorides ororganic acids. Table 2 specifies the contribution of water,contaminants and alkalizing agents during the cation con-ductivity measurement.
Elimination of the carbon dioxide contribution is possiblevia thermal degassing of the sample. For a reliable meas-urement, the reproducibility of this procedure is ofimmense importance. The degassing temperature has tobe close to the boiling point at the current air pressure.Identical measuring devices operating at identical temper-atures allow for comparison and interpretation of themeasured values. A degassed cation conductivity monitor-ing system is shown in Figure 6.
Under no circumstances may contaminants other thancarbon dioxide or its species be removed from the sample.
Figure 5: Influence of cation column air venting (courtesyof M. Lormies).
1 Combined cycle, high-pressure steam sample, cold startup.
2 Combined cycle, condensate sample.
Figure 6: Degassed cation conductivity monitoring system.
Beitrag Rziha-Wuhrmann 10.06.2009 10:41 Uhr Seite 4

Contaminants in the form of acids (e.g., hydrochloric, sul-furic, formic, acetic acid) must remain in the degassedsample and be measured by the conductivity measure-ment. Figure 7 shows the time-dependent behavior of thedegassing device (comparison of the degassed and non-degassed cation conductivity in the presence of carbondioxide). It reveals that carbon dioxide is almost com-pletely removed from the sample. In contrast, Figure 8confirms that acetic acid is not removed from the sampleduring degassing. The small difference between the cationand degassed cation conductivity indicates the presenceof carbon dioxide in the sample.
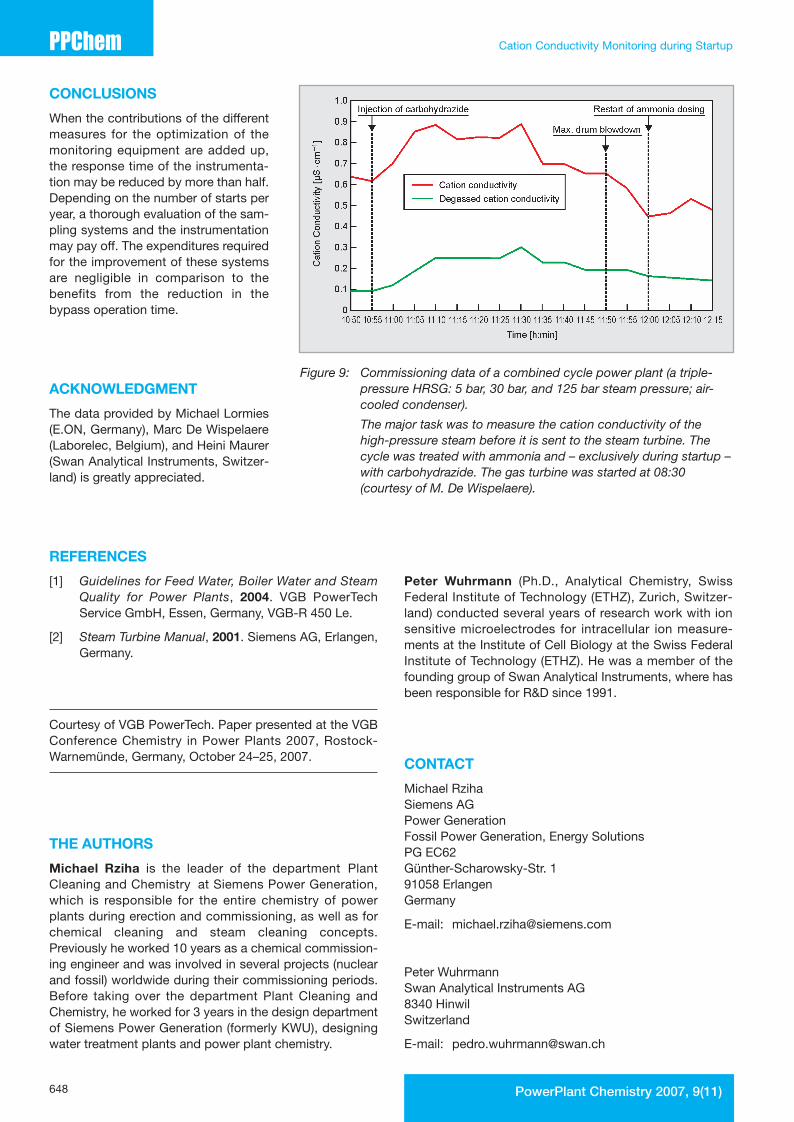
Using the degassed cation conductivity system it is possi-ble to reliably determine whether an increased cation con-ductivity can be tolerated for a short time or if a risk ofundesirable contamination exists. Figure 9 shows actualoperation data. It clearly demonstrates that during thestartup of a combined cycle power plant – while the cationconductivity reading is higher than the tolerable value of0.5 µS · cm–1 for more that one hour – the degassed cationconductivity remains below 0.5 µS · cm–1. It should benoted that the data shown in Figure 9 was measured dur-ing injection of carbohydrazide in the startup period.
Sample upstream of the cation exchanger pH typically > 9
Water H+, OH–
Contaminants Na+, Cl–, CO32–, COO–, CH3COO–, …
Alkalizing agents NH4+
Sample downstream of the cation exchanger pH typically < 7
Water H+, OH–
Contaminants Cl–, CO32–, COO–, CH3COO–, …
Sample downstream of the cation exchanger and degasser
Water H+, OH–
Contaminants Cl–, COO–, CH3COO–, …
Conductivity
LX equivalent conductance [µS · L · cm–1 · mol–1]
[X] concentration of X [mol · L–1]
Table 2: Sample chemistry – contribution of individual components to conductivity, cation conductivity, and degassedcation conductivity.
Figure 7: Degassing of the sample in the presence ofcarbon dioxide (lab experiments).
Sample contains carbon dioxide;sample pH 9.8; resin volume 1 L;sample flow velocity 10 L · h–1;degasser temperature 99.3 °C.
Figure 8: Degassing of the sample in the presence ofacetic acid in two concentrations(lab experiments).
Sample pH about 7.0; resin volume 1 L; sample flow velocity 10 L · h–1;degasser temperature 99.3 °C.
647PowerPlant Chemistry 2007, 9(11)
Cation Conductivity Monitoring during Startup PPChem
Beitrag Rziha-Wuhrmann 10.06.2009 10:41 Uhr Seite 5
CONCLUSIONS
When the contributions of the differentmeasures for the optimization of themonitoring equipment are added up,the response time of the instrumenta-tion may be reduced by more than half.Depending on the number of starts peryear, a thorough evaluation of the sam-pling systems and the instrumentationmay pay off. The expenditures requiredfor the improvement of these systemsare negligible in comparison to thebenefits from the reduction in thebypass operation time.
ACKNOWLEDGMENT
The data provided by Michael Lormies(E.ON, Germany), Marc De Wispelaere(Laborelec, Belgium), and Heini Maurer(Swan Analytical Instruments, Switzer-land) is greatly appreciated.
REFERENCES
[1] Guidelines for Feed Water, Boiler Water and SteamQuality for Power Plants, 2004. VGB PowerTechService GmbH, Essen, Germany, VGB-R 450 Le.
[2] Steam Turbine Manual, 2001. Siemens AG, Erlangen,Germany.
Courtesy of VGB PowerTech. Paper presented at the VGBConference Chemistry in Power Plants 2007, Rostock-Warnemünde, Germany, October 24–25, 2007.
THE AUTHORS
Michael Rziha is the leader of the department PlantCleaning and Chemistry at Siemens Power Generation,which is responsible for the entire chemistry of powerplants during erection and commissioning, as well as forchemical cleaning and steam cleaning concepts.Previously he worked 10 years as a chemical commission-ing engineer and was involved in several projects (nuclearand fossil) worldwide during their commissioning periods.Before taking over the department Plant Cleaning andChemistry, he worked for 3 years in the design departmentof Siemens Power Generation (formerly KWU), designingwater treatment plants and power plant chemistry.
Peter Wuhrmann (Ph.D., Analytical Chemistry, SwissFederal Institute of Technology (ETHZ), Zurich, Switzer-land) conducted several years of research work with ionsensitive microelectrodes for intracellular ion measure-ments at the Institute of Cell Biology at the Swiss FederalInstitute of Technology (ETHZ). He was a member of thefounding group of Swan Analytical Instruments, where hasbeen responsible for R&D since 1991.
CONTACT
Michael RzihaSiemens AGPower GenerationFossil Power Generation, Energy SolutionsPG EC62Günther-Scharowsky-Str. 191058 ErlangenGermany
E-mail: [email protected]
Peter WuhrmannSwan Analytical Instruments AG8340 HinwilSwitzerland
E-mail: [email protected]
Figure 9: Commissioning data of a combined cycle power plant (a triple-pressure HRSG: 5 bar, 30 bar, and 125 bar steam pressure; air-cooled condenser).
The major task was to measure the cation conductivity of thehigh-pressure steam before it is sent to the steam turbine. Thecycle was treated with ammonia and – exclusively during startup –with carbohydrazide. The gas turbine was started at 08:30(courtesy of M. De Wispelaere).
Cation Conductivity Monitoring during Startup
648 PowerPlant Chemistry 2007, 9(11)
PPChem
Beitrag Rziha-Wuhrmann 10.06.2009 10:41 Uhr Seite 6