behavioral/systems/cognitive ... neuronalencodingofsubjectivevalueindorsalandventral...
TRANSCRIPT

Behavioral/Systems/Cognitive
Neuronal Encoding of Subjective Value in Dorsal and VentralAnterior Cingulate Cortex
Xinying Cai1 and Camillo Padoa-Schioppa1,2,3
Departments of 1Anatomy and Neurobiology, 2Economics, and 3Biomedical Engineering, Washington University in St. Louis, St. Louis, Missouri 63110
We examined the activity of individual cells in the primate anterior cingulate cortex during an economic choice task. In the experiments,monkeys chose between different juices offered in variables amounts and subjective values were inferred from the animals’ choices. Weanalyzed neuronal firing rates in relation to a large number of behaviorally relevant variables. We report three main results. First, therewere robust differences between the dorsal bank (ACCd) and the ventral bank (ACCv) of the cingulate sulcus. Specifically, neurons inACCd but not in ACCv were modulated by the movement direction. Furthermore, neurons in ACCd were most active before movementinitiation, whereas neurons in ACCv were most active after juice delivery. Second, neurons in both areas encoded the identity and thesubjective value of the juice chosen by the animal. In contrast, neither region encoded the value of individual offers. Third, the populationof value-encoding neurons in both ACCd and ACCv underwent range adaptation. With respect to economic choice, it is interesting tocompare these areas with the orbitofrontal cortex (OFC), previously examined. While neurons in OFC encoded both pre-decision andpost-decision variables, neurons in ACCd and ACCv only encoded post-decision variables. Moreover, the encoding of the choice outcome(chosen value and chosen juice) in ACCd and ACCv trailed that found in OFC. These observations indicate that economic decisions (i.e.,value comparisons) take place upstream of ACCd and ACCv. The coexistence of choice outcome and movement signals in ACCd suggeststhat this area constitutes a gateway through which the choice system informs motor systems.
IntroductionDuring economic choice, subjects assign values to the availableoptions; a decision is then made by comparing values. Substantialwork in recent years examined these mental processes at the neu-ral level. In particular, it was found that neurons in the primateorbitofrontal cortex (OFC) encode the subjective values of of-fered and chosen goods, that subjective values correlate with theblood oxygenation signal in the human OFC and ventromedialprefrontal cortex, and that lesions to these brain areas selectivelydisrupt choice behavior. This collective evidence led us and oth-ers to propose that economic choices might be based on valuescomputed in these regions (Kable and Glimcher, 2009; Padoa-Schioppa, 2011). However, important questions remain open.For example, the mechanisms through which values are com-pared to make a decision are poorly understood. Furthermore, itremains unclear whether and how other prefrontal regions con-tribute to valuation and decision making. Most prominent in thisrespect is the anterior cingulate cortex (ACC)—a region often
proposed to have a key role in various types of decision making(Lee et al., 2007; Rushworth et al., 2007; Rushworth and Behrens,2008; Rangel and Hare, 2010; Wallis and Kennerley, 2010).
While the encoding of subjective value in the ACC has not yetbeen examined thoroughly, several lines of evidence suggest thatneurons in this region might represent value. In early work, Nikiand Watanabe (1979) found cells in the dorsal bank of the ACCthat responded to the delivery of juice reward, an observationconfirmed in subsequent studies (Ito et al., 2003; Matsumoto etal., 2003; Williams et al., 2004; Seo and Lee, 2007). More recently,Amiez et al. (2006) varied the probability and the quantity ofjuice. They found that ACC responses covary with the expectedjuice quantity. Other studies found that the neuronal activity inthis region is modulated by the effort exerted to obtain a reward(Kennerley and Wallis, 2009a; Kennerley et al., 2009). Similarly,Hillman and Bilkey (2010) found that neurons in the rodent ACCare modulated both by food quantity and physical effort. Argu-ably, these studies did not provide an accurate measure of sub-jective value because they did not include a trade-off betweenqualitatively different goods. However, all the results are consis-tent with the hypothesis that a representation of value exists in theACC.
In the OFC, the encoding of value presents three key traits.First, different neurons encode different choice-related vari-ables—Offer Value cells encode the value of one of the twooffers, Chosen Value cells encode the value of the chosen offer,and Chosen Juice cells (or Taste cells) encode the binary result ofthe choice process. Second, all these variables are encoded inde-pendently of the visuomotor contingencies of choice (in goodsspace). Third, the encoding of value is range-adapting—the same
Received July 28, 2011; revised Jan. 3, 2012; accepted Jan. 23, 2012.Author contributions: C.P.-S. designed research; X.C. and C.P.-S. performed research; X.C. and C.P.-S. analyzed
data; X.C. and C.P.-S. wrote the paper.This work was supported by National Institute of Mental Health Grant R00-MH080852 and The Whitehall Foun-
dation Grant 2010-12-13. We thank Jordan McCall for substantial help in animal training and in preliminary datacollection. The content is solely the responsibility of the authors and does not necessarily represent the official viewsof the National Institute of Mental Health or the National Institutes of Health.
The authors declare no competing financial interests.Correspondence should be addressed to Dr. Camillo Padoa-Schioppa, Department of Anatomy and Neurobiology,
Washington University in St. Louis, 660 South Euclid Avenue, Campus Box 8108, St. Louis, MO 63110. E-mail:[email protected].
DOI:10.1523/JNEUROSCI.3864-11.2012Copyright © 2012 the authors 0270-6474/12/323791-18$15.00/0
The Journal of Neuroscience, March 14, 2012 • 32(11):3791–3808 • 3791

range of neuronal firing rates describes different ranges of valuesin different behavioral conditions. In this perspective, the currentunderstanding of how values might be encoded in the ACC israther superficial. At least three issues remain open. First, it is notclear whether ACC neurons encode pre-decision variables (e.g.,Offer Value) or post-decision variables (e.g., Chosen Value, Cho-sen Juice). Second, it is not clear whether and how this represen-tation of value depends on the visuomotor contingencies ofchoice. Indeed, some studies found that roughly one-half of ACCneurons are spatially selective (Amiez et al., 2006; Kennerley etal., 2009; Hayden and Platt, 2010), while other studies found thatspatial selectivity in this area is modest at best (Ito et al., 2003;Nakamura et al., 2005; Seo and Lee, 2007). Third, the adaptabilityof this representation remains to be examined (but see Sallet etal., 2007; Kennerley et al., 2011). The current study was con-ducted to address these important questions.
Materials and MethodsThe discrepancy in the literature as for whether neurons in ACC arespatially selective may be partly due to the fact that experiments in whichmonkeys respond with arm movements (as opposed to eye movements)generally confound spatial selectivity with exerted effort. Indeed, in astudy that used both response modalities, “spatial selectivity” was moreprevalent when monkeys responded with arm movements comparedwith eye movements (Kennerley et al., 2009). Another possible explana-tion is that different studies might have recorded from different regionsof the cingulate sulcus. Indeed, different papers equally label as “ACC”brain regions located as far as 15 mm from one another, and on eitherbank of the cingulate sulcus (Koyama et al., 2001; Shidara and Rich-mond, 2002; Matsumoto et al., 2007). For these reasons, we used aneconomic choice task in which the actions associated with the offers bearthe same cost (isometric saccade to the left and to the right). Further-more, we explored extensively both banks of the cingulate sulcus.
Economic choice task, surgery, and recordings. All the procedures forbehavioral control, neuronal recording, and data analysis were similar tothose used in previous studies of OFC (Padoa-Schioppa and Assad, 2006,2008; Padoa-Schioppa, 2009). Two rhesus monkeys (L, female, 6.5 kg; V,male, 8.5 kg) participated in the experiments. The animals sat in anelectrically insulated enclosure, their head was restrained, and the eyeposition was monitored with an eye-coil system (Riverbend Instruments;monkey L) or with an infrared video camera (Eyelink; SR Research;monkey V). In each session, the monkey chose between two juices labeledA and B, with A preferred. In each trial, the monkey initially fixated asmall point at the center of a computer monitor (see Fig. 1a). After 1.5 s,two sets of squares (offers) appeared at the two sides of the fixation point.For each offer, the color of the squares indicated the juice type and thenumber of squares represented the juice quantity. Thus, in the trial de-picted in Figure 1a, the monkey chose between 1 drop of grape juice and4 drops of apple juice. The monkey had to maintain center fixation for arandomly variable delay (1–2 s), after which the fixation point was extin-guished and two saccade targets appeared by the offers (radial distancefrom center fixation: 7° of visual angle). The animal indicated its choicewith a saccade and had to maintain peripheral fixation for 0.75 s beforereceiving the chosen juice.
The quantities of the two offers and their spatial configuration variedpseudorandomly across trials. Across sessions, we used a variety of dif-ferent juices, resulting in many possible juice pairs. Typically, the behav-ior of the animal presented a trade-off: if the less preferred juice wasoffered in sufficiently high quantity, the monkey would choose it. Therelative value of the two juices was thus inferred from the indifferencepoint by fitting a normal sigmoid. This measure, which reflects the sub-jective nature of valuation, was used to define several value-related vari-ables tested in the analysis of neuronal activity (see Table 3). Thus, eachcell was analyzed in relation to the choice pattern recorded in the samesession.
Under general anesthesia, we implanted a head-restraining device andan oval recording chamber on the skull. The chamber (main axes, 50 �
30 mm) was centered on stereotaxic coordinates (A30, L0), with thelonger axis parallel to a coronal plane. Recordings were performed on thetwo banks of the cingulate sulcus and extended 12 mm in the anterior–posterior direction, from A23 to A35 (with the corpus callosum extend-ing anteriorly to A31 and A30 in monkeys L and V, respectively).Tungsten electrodes (125 �m diameter; Frederick Haer) were advancedwith a custom-made system driven remotely. We typically used fourelectrodes each day. Usually, we advanced the electrodes by pairs (onemotor for two electrodes), with the two electrodes placed at 1 mm fromeach other. Electric signals were amplified, filtered (high-pass cutoff, 400Hz; low-pass cutoff, 6 kHz) and recorded (Power 1401; Cambridge Elec-tronic Design). Action potentials were detected on-line, and waveforms(25 kHz) were saved to disk for off-line clustering (Spike 2; CambridgeElectronic Design). Only cells that appeared well isolated and stablethroughout the session were included in the analysis. Thus, data setsincluded 1044 cells from the right hemisphere of monkey L (760 fromACCd; 284 from ACCv) and 860 cells from the left hemisphere of mon-key V (365 from ACCd; 495 from ACCv).
All experimental procedures conformed to the NIH Guide for the Careand Use of Laboratory Animals and with the regulations at WashingtonUniversity School of Medicine and at Harvard Medical School.
Neuronal activity: preliminary analysis. All the analyses were per-formed in MATLAB (version R2010b; MathWorks). Behavioral choicepatterns were analyzed as previously described (Padoa-Schioppa andAssad, 2006, 2008). Briefly, for every session, the percentage of B choiceswas plotted as a function of log(qB/qA), where qA and qB are the offeredquantities of juices A and B, respectively. The percentage of B choices wasthen fitted with a normal cumulative distribution function (normal sig-moid). The relative value of the two juices was inferred from the flexpoint of the sigmoid. Neuronal data were analyzed in relation to therelative value measured in the same session.
Neuronal activity was analyzed in eight time windows: Preoffer (from0.5 s before the offer to the offer), Postoffer (0 – 0.5 s after the offer), LateDelay (0.5–1.0 s after the offer), Pre-go (0 – 0.5 s before the “go”), Reac-tion Time (from “go” to saccade), Prejuice (0 – 0.5 s before the juice),Postjuice (0 – 0.5 s after the juice), and Postjuice2 (0.5–1.0 s after thejuice). These are the same time windows defined in previous studies withthe addition of the Postjuice2 time window, which was particularly rele-vant for ACCv. An “offer type” was defined by two quantities of juiceoffered to the monkey (e.g., [1A:3B]), independently of both the spatialconfiguration and the choice of the animal. A “trial type” was defined byan offer type and a choice (e.g., [1A:3B, 1A]), independently of the spatialconfiguration. A “trial typeLR” was defined by a trial type and the spatialconfiguration (e.g., [1A:3B, 1A, R], where the last “R” indicates that thechosen offer was presented on the right). A neuronal response was de-fined as the activity of a neuron in one time window as a function of eitherthe trial type or the trial typeLR, as specified in the text.
Our analysis proceeded in steps. First, we submitted our data sets to aseries of ANOVAs, in which we always imposed the significance thresh-old p � 0.001. We used this relatively conservative criterion to conformwith the methods used in our previous papers and because of the largenumber of responses analyzed (1904 cells � 8 time windows). In essence,these analyses indicated that neurons in ACCd can be modulated by thetrial type and/or by the movement direction, independently. In contrast,neurons in ACCv can be modulated by the trial type, but they are inde-pendent of the visuomotor contingencies of choice. Moreover, neuronsin the two areas tend to respond in different time windows (see Results)(Tables 1, 2). Thus, in all subsequent analyses, we examined separatelythe data sets from ACCd and ACCv. For both data sets, “task-related”responses were identified with a one-way ANOVA (factor: trial typeLR).Only responses that passed this criterion were included in subsequentanalyses.
Second, we defined a large number of variables that neurons in ACCdand ACCv might potentially encode (Table 3). Each neuronal responsewas fitted against each variable. Since responses can generally depend onthe movement direction, the fit was done using an analysis of covariance(ANCOVA) using the variable as a predictor and grouping data by themovement direction. In a preliminary analysis, we examined the fullANCOVA model, including the interaction term. However, we observed
3792 • J. Neurosci., March 14, 2012 • 32(11):3791–3808 Cai and Padoa-Schioppa • Neuronal Encoding of Subjective Value in the ACC

that the interaction term was rarely significant (which confirmed theresults of the two-way ANOVAs) (see Results). We thus report here onlythe results obtained using the “parallel” model. This model assumes thatthe encoding of the factor (variable) and the group (movement direc-tion) are statistically independent. A variable was said to “explain” theresponse if the factor in the ANCOVA was significant ( p � 0.05). Foreach variable, the ANCOVA also provided an R 2. This was the total R 2,computed including both the factor and the group. For variables that didnot explain the response, we arbitrarily set R 2 � 0. These criteria wereused for all variables except the Mov Dir Only, for which we proceeded asfollows. We computed the “horizontal lines” model of the ANCOVA,which assumes that firing rates only depend on the group (movementdirection). The variable Mov Dir Only was thus said to explain the re-
sponse if the group was significant in this analysis ( p � 0.05). From thismodel, we also obtained the R 2, which was set equal to 0 if the group wasnot significant. Importantly, the R 2 thus obtained for the variable MovDir Only was always lower than that obtained for any other variable thatexplained the response. Hence, for any given response, Mov Dir Onlyprovided the best explanation (highest R 2) only if it provided the soleexplanation.
The overall rationale of this approach (already used in previous studiesof OFC) was as follows. On the one hand, we imposed a rather conser-vative criterion when we admitted individual responses in the analysis(ANOVA, p � 0.001), to weed out noise from the data set. On the otherhand, we set a more liberal criterion when we identified the encoding ofany given variable (linear fit, p � 0.05), to maintain high sensitivity.Responses from ACCd presented one additional issue. Consider a direc-tionally selective response. In principle, the response could pass the one-way ANOVA criterion largely because of its spatial selectivity (as opposedto a dependence on the trial type). Yet, following the ANOVA, the en-coding of any particular variable would be established with a relativelyliberal threshold. As a consequence, this procedure might occasionallyassess that a variable explains a response even though the dependence ofthe response on the trial type is weak. To obviate this issue, we imposedan additional criterion: any variable (except Mov Dir Only) could explaina response only if the factor offer type in the three-way ANOVA wassignificant at the liberal threshold of p � 0.05.
Based on this analysis, we identified for each area and for each neuro-nal response the variable that provided the best fit (highest R 2). We thencomputed the number of responses best explained by each variable, sep-arately for each time window. Finally, for each area, we identified thevariables that best accounted for the neuronal population, as follows.
Variable selection analysis. In general, although one can define manyvariables potentially relevant to a particular experiment, a small subset ofthem might suffice to describe a given data set. To identify the variablesthat provided the best account for our data, we used two methods ofvariable selection—stepwise and best subset— originally designed formultilinear regressions in presence of multicollinearity (Dunn and Clark,1987; Glantz and Slinker, 2001) and previously adapted to analyze largeneuronal data sets (Padoa-Schioppa and Assad, 2006). The proceduresused here are essentially identical to those described previously.
Table 1. ACCd, results of ANOVAs
Three-way Two-way
One-wayTrial type L/R
Offertype
Offerposition
Movdirection
Trialtype
Movdirection (Both)
Preoffer 0 0 2 1 1 0 0Postoffer 99 5 70 95 69 20 114Late Delay 170 5 88 171 88 28 168Pre-go 134 4 72 139 73 19 137React Time 77 1 66 78 68 14 97Prejuice 141 3 85 142 83 14 149Postjuice 106 1 48 114 49 7 99Postjuice2 110 1 12 112 13 2 81At least 1 427 15 224 440 219 66 406
A total of 1125 cells were recorded from ACCd and included in these analyses. The table reports the results of severalANOVAs. Each column represents one factor, each row represents one time window, and numbers represent thenumber of cells significantly modulated by the corresponding factor. The last row indicates, for given factor, thenumber of cells that pass the criterion in at least one of the eight time windows. The three leftmost columns reportthe results of a three-way ANOVA with factors offer type, offer position, and movement direction. Pooling timewindows, it can be noted that neuronal activity generally did not depend on the spatial configuration of the offers(factor offer position). In contrast, ACCd cells were often modulated by the offer type �427 of 1125 cells (38%)�and/or by the movement direction �224 of 1125 cells (20%)�. We next ran a two-way ANOVA with factors trial typeand movement direction, including the interaction (not shown here). This analysis indicated that the interactionterm was significant in a small minority of cases: pooling time windows, the interaction was significant for 31 of1125 cells (3%). We thus ran a two-way ANOVA excluding the interaction term, the results of which are shown here(columns 4 – 6). The column labeled “Both” reports the number of cells for which both factors (trial type andmovement direction) were significant. Pooling time windows, only 66 of 1125 cells (6%) were modulated by bothfactors. This measure is very similar to that expected if the two modulations were completely independent (chancelevel, 7%). The same is true if we only consider �central� time windows from Postoffer to Prejuice. In this case, the 61cells modulated by both factors are 5% of the population and chance level is also 5%. Finally, we ran a one-wayANOVA with factor trial typeLR (rightmost column). Only neuronal responses that passed this test (N � 845, poolingtime windows) were included in subsequent analyses. For all the ANOVAs, we always imposed the significancethreshold p � 0.001.
Table 2. ACCv, results of ANOVAs
Three-way Two-way
One-wayTrial type L/R
Offertype
Offerposition
Movdirection
Trialtype
Movdirection (Both)
Preoffer 1 1 0 3 0 0 0Postoffer 34 2 3 37 4 2 28Late Delay 63 0 1 65 3 0 48Pre-go 53 0 14 51 15 2 45React Time 33 2 13 32 12 2 19Prejuice 72 0 20 71 21 3 62Postjuice 102 0 8 106 9 1 75Postjuice2 110 1 0 112 0 0 82At least 1 231 6 41 241 44 8 194
A total of 779 cells were recorded from ACCv and included in these analyses. The three leftmost columns reportthe results of a three-way ANOVA with factors (offer type by offer position by movement direction). Pooling timewindows, it can be noted that neuronal activity rarely depended on the visuomotor contingencies of the choice(factor offer position and movement direction). (In particular, only 41 of 779 � 5% cells were modulated by themovement direction. Curiously, 14 of these cells came from the same penetration. If data from this penetration wereexcluded, cells modulated by the movement direction would be 27 of 747 � 4%.) In contrast ACCv cells were oftenmodulated by the offer type (231 of 779 � 30% cells). Next, we ran a two-way ANOVA with factors (trial type bymovement direction) (columns 4 – 6). The column labeled “Both” reports the number of cells for which both factors(trial type and movement direction) were significant. Again, very few neurons were modulated by either themovement direction or the interaction. Finally, we ran a one-way ANOVA with factor trial typeLR (rightmost column).Only neuronal responses that passed this test (N � 359, pooling time windows) were included in subsequentanalyses.
Table 3. Defined variables
Variable name Definition
1 Offer Value A Value of juice A offered2 Offer Value B Value of juice B offered3 Chosen Value Value of the chosen offer4 Other Value Value of the nonchosen offer5 Total Value Sum of the two offer values6 Ch�Oth Value (Value Difference) Chosen value�other value7 Oth/Ch Value (Value Ratio) Other value/chosen value8 Chosen Value A Value of juice A chosen (0 if B choice)9 Chosen Value B Value of juice B chosen (0 if A choice)
10 Chosen Juice (Taste) 0 if A choice, 1 if B choice11 Max # Max offered quantity12 Min # Min offered quantity13 Chosen # Quantity of the chosen juice14 Other # Quantity of the nonchosen juice15 Total # Sum of the two quantities16 Oth/Ch # Other number/chosen number17 Ch�Oth # Chosen number�other number18 Min/Max # Min number/max number19 Max�Min # Max number�min number20 Offer Value L Value of offer on the left21 Offer Value R Value of offer on the right22 Chosen Value L Value chosen on the left (0 if right choice)23 Chosen Value R Value chosen on the right (0 if left choice)24 Mov Dir Only 1 if left saccade, 0 if right saccade
All value variables that depend on both juices and thus reflect the subjective nature of valuation (Chosen Value,Other Value, Total Value, Value Difference, etc.) were defined based on the measure obtained on a session-by-session basis from the behavioral indifference point.
Cai and Padoa-Schioppa • Neuronal Encoding of Subjective Value in the ACC J. Neurosci., March 14, 2012 • 32(11):3791–3808 • 3793

The stepwise method—an iterative procedure—was applied as fol-lows. At the first step, we selected the variable that provided the highestnumber of best fits within any time window. We then removed from thedata set all the responses explained by this variable (across time win-dows). At the second step, we repeated the procedure with the residualdata set. We defined the “marginal explanatory power” of a variable X asthe percentage of responses explained by X and not explained by anyother selected variable. At each step, we imposed that all selected vari-ables have a marginal explanatory power of at least 5% (if necessary, wedropped previously selected variables that failed to meet the criteriononce new variables were added; in practice, this situation never occurredfor the present data sets). We thus continued the procedure until whenany additional variable failed to meet the 5% criterion.
The stepwise method had the advantage of analyzing different timewindows separately but in parallel (see Results). However, this methoddid not guarantee optimality because its results were path dependent. Incontrast, the best subset method—an exhaustive procedure—identifiedthe subset of variables that provided the highest explanatory power. Forthis method, we pooled responses from different time windows. For eachpossible subset of d variables, we computed the number of responsesexplained in the data set, and we identified the subset that explained thehighest number of responses. We repeated this procedure for d � 1, 2, 3,etc. In general, if n(d) is the number of responses explained by d variables,the number of variables necessary to account for the data set (d*) can beidentified either by an elbow in the function n(d) or by a thresholdcriterion (e.g., 90% of responses explained). In practice, for both of cur-rent data sets, there appeared to be a natural breaking point (see Results).
One question left open by both these methods is whether the explan-atory power of the selected variables is significantly higher than that ofother possible variables—an issue referred to as possible “overfitting.” Toaddress it, we performed a post hoc analysis in which we compared themarginal explanatory power of each selected variable with that of dis-carded but highly correlated variables. The procedure has been describedpreviously (Padoa-Schioppa and Assad, 2006). In a nutshell, we labeled Xa selected variable (e.g., Chosen Value) and Y a discarded variable thatwas highly correlated with the selected variable and that would thusrepresent a “challenging” alternative (e.g., Total Value). First, we quan-tified the marginal explanatory power of the selected variable (nX ) as thenumber of responses explained by that variable, not explained by thechallenging variable, and not explained by any other variable in the bestsubset. Second, we quantified the marginal explanatory power of thechallenging variable (nY ) as the number of responses explained by thatvariable, not explained by the selected variable, and not explained by anyother variable in the best subset. The best subset method ensures thatnX � nY. To establish the statistical significance of this inequality, we rana binomial test. This analysis was repeated for each selected variable andfor each challenging variable with a correlation of � � 0.8 (Tables 4, 5).
Notably, the variable selection analysis described above was defined onspatially dependent responses, where each data point represents one trialtypeLR. This procedure is most appropriate for ACCd, where neuronswere indeed spatially selective. However, for data from ACCv, it is actu-
ally preferable to perform the analysis on nonspatial responses, whereeach data point represents one trial type. Indeed, because more trialscontribute to each data point, the results obtained with the nonspatialprocedure (previously used for OFC) are generally more robust. Forclarity of exposure, we detail in the following the results of the variableselection analysis obtained for both brain areas using the same spatialprocedure. However, we also report the main results obtained for ACCvusing nonspatial responses. In all subsequent analyses of neurons fromACCv, we pooled trials for different movement directions.
Subjective value versus physical property: analysis of U-shaped responses.The variable selection analysis indicated that many neurons in ACCd andACCv encoded the Chosen Value. In a further analysis, we examinedmore specifically whether these “U-shaped” responses indeed reflectedthe subjective nature of value, as opposed to encoding any physicalproperty of the juice. For this analysis, we separated trials in which theanimal chose juice A or juice B. For each group of trials, we fitted theneuronal firing rate against the amount of juice chosen (and received)by the animal. For ACCd cells, this fit was performed with anANCOVA (parallel lines); for ACCv, this fit was performed with alinear regression. In either case, the fit provided two slopes � and � forjuices A and B, respectively. If both slopes differed significantly fromzero (95% confidence interval) and had the same sign, the responsewas said to be “U-shaped.”
If U-shaped responses indeed encode the Chosen Value, the slope ratio�/� should provide a neuronal measure for the relative value of the twojuices. This measure should thus reflect the subjective nature of value andshould be indistinguishable from the behavioral measure of relative valueobtained from the choice pattern (indifference point). To test this pre-diction, we performed an ANCOVA using the neuronal measure as adependent variable, the behavioral measure as a predictor, and groupingdata by the juice pair. (Data recorded with different juice pairs weregrouped separately because relative values generally depend on the juicepair.) We used the full ANCOVA model and we included only juice pairsfor which we had at least 20 U-shaped responses (6 pairs for ACCd; 7pairs for ACCv; see Fig. 8).
Analysis of range adaptation. The analysis of range adaptation closelyfollowed the methods previously used for OFC (Padoa-Schioppa, 2009).In the following, we will indicate with � the neuronal firing rate and withV the Chosen Value. The linear fit performed for the variable selectionanalysis provided for each response the intercept c0and the slope c1 suchthat as follows:
� � c0 � c1V.
(For responses from ACCd, the intercept c0 depends on the movementdirection.) For each response, we defined the value range �Vas the rangeof values chosen by the animal within the session and the minimum valueV0 as the lowest value chosen within the session. In general, Equation 1can be rewritten as follows:
� � �0 � �� �V V0
�V,
where �0 � c0 c1V0 is the baseline activity and �� � c1 * �V is theactivity range. If the encoding of value is linear, the hypothesis that neu-rons adapt to the value range amounts to the hypothesis that neuronalparameters �0 and �� do not depend on the value range �V.
Conventionally, we always expressed the variable Chosen Value inunits of juice B (uB). Each neuron in our data set was recorded in onesession, which typically included 200 – 400 trials. Within each session, the
Table 4. ACCd, results of post hoc variable selection analysis
Selected variable (X) Challenging variable (Y) nX nY p value
Chosen Value Total Value 20 11 �0.05Chosen Value Ch�Oth Value 75 7 �10 �10
Chosen Value Chosen # 59 12 �10 �9
Chosen Juice Chosen Value A 27 4 �10 �6
Chosen Juice Chosen Value B 20 9 �0.02Mov Dir Only Chosen Value L 132 11 �10 �10
Mov Dir Only Chosen Value R 133 7 �10 �10
Each row represents one statistical comparison. For a selected variable (X, first column), we considered a discardedbut highly correlated variables (Y, second column) that would thus represent a challenging alternative. We definedthe marginal explanatory power nX (third column) as the number of responses explained by X, not explained by Y,and not explained by any other variable in the best subset. We also defined the marginal explanatory power nY(fourth column) as the number of responses explained by Y, not explained by X, and not explained by any othervariable in the best subset. The best subset method ensures that nX � nY. The statistical significance of thisinequality was established with a binomial test, the results of which are shown in the last column. The analysis wasrepeated for each selected variable and for all discarded variables with a correlation of � � 0.8.
Table 5. ACCv, results of post hoc variable selection analysis
Selected variable (X) Challenging variable (Y) nX nY p value
Chosen Value Total Value 7 7 0.40Chosen Value Ch�Oth Value 37 5 �10 �8
Chosen Value Chosen # 34 6 �10 �6
Chosen Juice Chosen Value A 13 9 0.14Chosen Juice Chosen Value B 10 8 0.24
See legend to Table 4.
3794 • J. Neurosci., March 14, 2012 • 32(11):3791–3808 Cai and Padoa-Schioppa • Neuronal Encoding of Subjective Value in the ACC

Chosen Value ( V) varied from trial to trial,within a range (�V ). This range varied fromsession to session depending both on the offersand the animal’s choices. Across sessions, therange of chosen values varied roughly twofoldbetween 4 and 8 uB. To examine how the en-coding of Chosen Value depended on the valuerange, we pooled responses from different timewindows and we rectified responses with neg-ative slopes. For each area, we then divided theneuronal population of responses in two groups,depending on whether the neuron was recordedin a session such that �V 6 uB or �V 6 uB.Finally, we compared the two groups of responsesin several measures, including the distribution ofregression slopes (c1), the activity range (��),and the average normalized response.
To compute the average normalized response(see Figs. 9e, 10e), we subtracted the baseline ac-tivity �0 corresponding to V � V0. We then di-vided the range of chosen values (x-axis) in 2 uBbins. For each bin and for each group of re-sponses, we computed the average normalizedfiring rate ( y-axis) and Chosen Value (x-axis) av-eraging across all relevant trial types and all re-sponses. A similar procedure was used tocompute averages when we examined the regres-sion slope in relation to the value range (see Figs.9c, 10c, color symbols).
Finally, we examined neuronal adaptationon the timescale of individual trials. In thisanalysis, we pooled trials for different move-ment directions, for both areas.
ResultsWe recorded the activity of 1904 neuronsfrom two animals performing economicchoices (Fig. 1a). Our recordings extended12 mm in the anterior–posterior direction
Figure 1. Behavioral task and recording locations. a, Experimental design. Offers were presented on the two sides of the fixation point.The color indicated the juice type the number of squares indicated the juice amount. Monkeys indicated their choice with a
4
saccade. Different offer types and different left/right configu-rations were pseudorandomly interleaved. b, Time windows.All time windows lasted 0.5 s except the Reaction Time, whichlasted from the go signal to the initiation of the saccade. c, Re-cording locations. Our recordings extended for 12–15 mm an-terior–posterior. Data from the dorsal bank and fundus (ACCd)and data from the ventral bank (ACCv) were analyzed sepa-rately. d, Reconstruction of recording sites. Anterior–posterior(AP) and mediolateral (ML) coordinates are represented by they-axis and x-axis, respectively. The recording system provideda spatial resolution of 1 mm. The gray scale indicates for eachlocation the number of cells recorded from that location (scaleindicated in the legend). For each location, we computed theproportion of cells modulated by the trial type and/or by themovement direction in at least one time window (two-wayANOVA). These proportions are represented by green and pur-ple circles, respectively, for trial type and movement direction(scale indicated in the legend). For this analysis, we pooleddata from the two monkeys and we displayed the results asthough all the cells were recorded from the right hemisphere.Interestingly, the distribution of neurons modulated by themovement direction within ACCd was not even. In particular,we found more spatially selective cells in the anterior part thanin the posterior part (limit set at AP A30, p � 10 �6, Pear-son’s � 2), and more spatially selective cells in the medial partthan in the lateral part (limit set at ML L4, p � 10 �4,Pearson’s � 2).
Cai and Padoa-Schioppa • Neuronal Encoding of Subjective Value in the ACC J. Neurosci., March 14, 2012 • 32(11):3791–3808 • 3795

and covered both banks of the cingulate sulcus (Fig. 1c,d). A prelim-inary inspection of individuals cells revealed clear differences be-tween the two banks. Neurons in the dorsal bank and fundus(ACCd, 1125 cells) were often spatially selective and typically mod-ulated during the delay. In contrast, neurons in the ventral bank(ACCv, 779 cells) were not spatially selective and most frequentlymodulated at the time of juice delivery. For all the population anal-yses, we thus examined separately neurons recorded in ACCd andneurons recorded in ACCv.
Identification of task-related responsesA first set of analyses were conducted to identify task-relatedneuronal responses, which would be subject to further examina-tion. First, we submitted each neuron in each time window to athree-way ANOVA with factors (offer type by offer position bymovement direction). In this analysis, the factor “offer position”captured the spatial left/right configuration of the offers on themonitor, whereas “movement direction” captured the left/rightdirection of the eye movement. Our results for ACCd and ACCvare summarized in Tables 1 and 2, respectively. In essence, neu-rons modulated by the offer type were present in both regions. Incontrast, neurons modulated by the spatial configuration of theoffers were very infrequent in either region (�2% of cells, pool-ing time windows). Finally, neurons modulated by the directionof the eye movement were fairly frequent in ACCd (20% cells,pooling time windows) but rather infrequent in ACCv (5% ofcells, pooling time windows).
Starting with data from ACCd, we submitted each neuron to atwo-way ANOVA with factors (trial type by movement direction)including the interaction term (results not included in Table 1).This analysis confirmed that both main factors modulated theactivity of neurons in this area: pooling time windows, cells mod-ulated by factors trial type and movement direction were 38 and20%, respectively. In contrast, cells presenting a significant inter-action term were very infrequent (�3% of cells, pooling timewindows). In other words, the good-related modulation (cap-tured by the factor trial type) and the action-related modulation(captured by the factor movement direction) were essentially in-
Figure 2. ACCd, activity of single neurons. The figure represents the activity of five neuronalresponses. a, Response encoding the Chosen Value. In the left panel, the x-axis represents
4
different offer types, ranked from left to right by the ratio #B:#A. The black dots represent thebehavioral choice pattern and the relative value inferred from the sigmoid fit is indicated in thetop left (1A � 3.2B). The color symbols indicate the neuronal firing rate recorded in the Prejuicetime window. Each symbol represents one trial typeLR. The red and green symbols represent,respectively, trials in which the animal executed a leftward and rightward saccade. The dia-monds and circles represent, respectively, trials in which the animal chose juice A and juice B. Inthe right panel, the same data points ( y-axis) are plotted against the variable Chosen Value(expressed in units of juice B). The two lines represent the results of the ANCOVA (parallelmodel). It can be observed that the activity of this cell encodes the variable Chosen Value (asconfirmed by the variable selection analysis) and is not directionally selective. b, Another re-sponse encoding the Chosen Value. This response was recorded in the Pre-go time window.c, Response encoding the Chosen Value and in a directionally selective way. This response,recorded in the Postoffer time window, encoded the Chosen Value. In addition, the firing ratewas higher when the animal executed a leftward saccade compared with a rightward saccade.Cells such as this one, modulated both by the Chosen Value and the saccade direction, werepresent in the population. However, their incidence was not higher than would be expected bychance (Table 1). d, Response encoding the Mov Dir Only. This neuronal response, recorded inthe Late Delay time window, was spatially selective (higher for rightward saccades) but did notdepend on the offer type. In the right panel, the firing rate is plotted against the Chosen Value,even though this variable did not explain the response. The two lines represent the results of theANCOVA (horizontal lines model). e, Response encoding the Chosen Juice. This neuronal re-sponse, recorded in the Postjuice time window, was binary depending on the chosen juice andwas not spatially selective. All conventions in b– e are as in a. Regression lines in a– c and e areall from the ANCOVA (parallel model).
3796 • J. Neurosci., March 14, 2012 • 32(11):3791–3808 Cai and Padoa-Schioppa • Neuronal Encoding of Subjective Value in the ACC

dependent from each other for any given cell. We thus repeatedthe two-way ANOVA including only the main factors, and wequantified how many neurons in ACCd were modulated by bothfactors (Table 1, sixth column). We found that the size of thissubpopulation was very close from that expected by chance if thetwo modulations were completely independent (6% of cells mod-ulated by both factors vs 7% expected by chance). In other words,the good-related modulation and the action-related modulationwere independent across the neuronal population. For data fromACCv, the two-way ANOVAs confirmed that the neuronal activ-ity could be modulated by the trial type, but was independent ofthe visuomotor contingencies of choice.
Finally, we identified for each area task-related responsesusing a one-way ANOVA (factor “trial typeLR”). Across timewindows, task-related responses were 845 for ACCd and 359for ACCv. Pooling time windows, neurons that passed theANOVA criterion in at least one time windows were 406 of1125 (36%) in ACCd and 194 of 779 (25%) in ACCv. Thesepreliminary analyses also revealed that the two brain regionsdiffered for the activation timing. Indeed, neurons in ACCd weremodulated most prominently during the delay (time windowsLate Delay and Pre-go). In contrast, in ACCv the modulation wasmost prominent immediately after juice delivery (time windowsPostjuice and Postjuice2). This difference provided further evi-dence that ACCd and ACCv are physiologically distinct areas.
Choice-related variables encoded in ACCdWhat choice-related variables are encoded in ACCd? A qualita-tive inspection revealed that neurons in ACCd often presentedU-shaped responses, suggesting that they encoded the variableChosen Value. As revealed by the ANOVAs (Table 1), many neu-rons were also modulated by the movement direction. However,these two factors appeared to be largely independent, in the sensethat some neurons encoded only the Chosen Value (Fig. 2a,b),other neurons encoded both the Chosen Value and the move-ment direction (Fig. 2c), and yet other neurons encoded only themovement direction (variable Mov Dir Only; Fig. 2d). In addi-tion, some neurons presented a binary response seemingly en-coding the Chosen Juice (Fig. 2e). Of course, Chosen Value andChosen Juice are only two of the many variables potentially en-coded by this population. To identify the variables that best ex-plained our data set, we adopted the same basic approach used ina previous study (Padoa-Schioppa and Assad, 2006).
Casting a wide net, we defined 24 variables that neurons inACCd might potentially encode (Table 3). Specifically, we de-fined several good-based value-related variables (Offer Value,Chosen Value, Other Value, etc.), several quantity-related vari-ables (Max #, Chosen #, Total #, etc.), a binary variable capturingthe outcome of the choice process (Chosen Juice), and four spa-tial value-related variables (Offer Value L, Offer Value R, ChosenValue L, Chosen Value R). We also defined the variable Mov DirOnly, a purely spatial variable that captured responses modulatedonly by the movement direction (see Materials and Methods).
For each response and for each variable, we ran an ANCOVA,using the variable as a predictor and grouping data by the move-ment direction. A given variable was said to “explain” the neuro-nal response if the corresponding factor in the ANCOVA wassignificant (p � 0.05). As previously noted (Padoa-Schioppa andAssad, 2006), different variables included in this analysis could behighly correlated with one another (e.g., Chosen Value and TotalValue were highly correlated in our experiments). Hence, anygiven response might be explained by more than one variable. Inthe light of this consideration, we generated two qualitative de-
scriptions of our neuronal data set. Figure 3a illustrates for eachtime window the number of responses explained by each variable.Notably, any given response may appear in more than one bin inthis plot. Conversely, Figure 3b illustrates for each time windowand for each variable the number of responses best explained bythat variable (highest R 2). In this plot, each response appears in atmost one bin. A qualitative inspection of Figure 3b revealed thatthe best explanation was often provided by Chosen Value. How-ever, a sizable number of responses are best explained by ChosenJuice and/or by Mov Dir Only.
Overall, 804 of 845 (85%) task-related responses were ex-plained by at least 1 of the 24 variables defined here. For aquantitative assessment of the variables that best explained thepopulation, we used the stepwise selection method. As illus-trated in Figure 4, a and b, the first three iterations of thisprocedure selected variables Chosen Value, Mov Dir Only, andChosen Juice. Collectively, these three variables explained 763responses. All variables selected in subsequent iterations pro-vided a marginal explanatory power of �5%. The best subsetmethod confirmed this result (Fig. 4c,d). As a single variable,Chosen Value explained more responses than any other vari-able. As a pair of variables, Chosen Value and Mov Dir Onlyexplained more responses that any other pair of variables.Finally, the three variables Chosen Value, Mov Dir Only, andChosen Juice explained more responses than any other subsetof three variables. Again, these three variables collectively ex-plained 763 responses, corresponding to 95% of the responsesexplained by the whole 24 variables, and to 90% of responsesthat passed the ANOVA criterion.
In summary, the explanatory power of variables ChosenValue, Chosen Juice, and Mov Dir Only was higher than thatof any other subset of three variables. To examine whether thisstatement was true in a statistical sense, we ran a post hocanalysis in which the marginal explanatory power of each se-lected variable was tested against that of a discarded and “chal-lenging” variable. As illustrated in Table 4, we found that theexplanatory power of each selected variable was significantlyhigher than that of all challenging alternatives (all p � 0.05).
In conclusion, neurons in the ACCd appear to encode variablesChosen Value, Chosen Juice, and Mov Dir Only. On the basis of thisresult, we classified task-related responses from this area as encodingone of these three variables. Responses explained by more than onevariable were assigned to the variable with highest R2. Responses notexplained by any of these variables were labeled “unexplained.” Ingeneral, the encoded variable provided a good account of the re-sponses [across variables, mean(R2) 0.5; Fig. 4e].
Choice-related variables encoded in ACCvA qualitative inspection revealed that neurons in ACCv oftenpresented U-shaped responses, suggesting that they encoded thevariable Chosen Value (Fig. 5a– c). Other cells presented a binaryresponse suggesting that they encoded the Chosen Juice (Fig. 5d).These latter responses were most frequent in late time windows,after juice delivery. For a population analysis, we examined thesame variables examined in the analysis of ACCd. For each re-sponse, we performed an ANCOVA on each variable (group:movement direction). We generated two descriptions of this dataset. Figure 6a illustrates for each time window the number ofresponses explained by each variable. Figure 6b illustrates foreach time window and for each variable the number of responsesbest explained by that variable (highest R 2). A qualitative inspec-tion reveals that the best explanation was often provided by thevariable Chosen Value. However, especially in late time windows,
Cai and Padoa-Schioppa • Neuronal Encoding of Subjective Value in the ACC J. Neurosci., March 14, 2012 • 32(11):3791–3808 • 3797

a sizable number of responses were best explained by the variableChosen Juice.
Overall, the 24 variables explained 337 of 359 (94%) responsesthat passed the ANOVA criterion. For a quantitative assessmentof the variables that best explain the population, we first used thestepwise selection method. As illustrated in Figure 7, a and b, thefirst two iterations selected variables Chosen Value and ChosenJuice. All variables selected in subsequent iterations provided amarginal explanatory power of �5%. This result was confirmedby the best-subset procedure (Fig. 7c,d). As a single variable, Cho-sen Value explained more responses than any other variable. As apair of variables, Chosen Value and Chosen Juice explained moreresponses than any other pair of variables. Collectively, ChosenValue and Chosen Juice explained 304 responses, correspondingto 90% of responses explained by the whole 24 variables and to85% of responses that passed the ANOVA criterion.
We thus proceeded with a post hoc analysis, in which we com-pared the marginal explanatory power of each of these two vari-ables pairwise against that of other, highly correlated variables(Table 5). In this analysis, the explanatory power of Chosen Valuewas significantly higher than that of both Value Difference andChosen #. However, the explanatory power of Chosen Value wasnot statistically higher than that of Total Value, and the explana-tory power of Chosen Juice was not statistically higher than that
of either Chosen Value A or Chosen Value B. This analysis wouldthus leave us with some degree of ambiguity.
To gain further insight, we repeated the variable selectionanalysis on this data set based on spatially invariant responses. Inthis case, each data point represented a trial type (not a trialtypeLR) and linear fits were performed using linear regressions,from which we obtained a slope and the R 2. Notably, this proce-dure is in principle preferable for ACCv, where responses are notspatially selective, because the statistical power is entirely “spent”to identify encoded variables. We obtained results similar tothose described above. Across time windows, the one-wayANOVA (factor: trial type) identified 473 task-related responses.Overall, the 19 nonspatial variables included in the analysis ex-plained 433 of 473 (92%) responses. The stepwise method iden-tified Chosen Value, Chosen Juice, and Total Value in the firstthree iterations, and no other variable reached the 5% criterion insubsequent iterations. The best-subset method revealed that thehighest explanatory power was provided by Chosen Value (as asingle variable), by Chosen Value and Chosen Juice (as a pair ofvariables), and by Chosen Value, Chosen Juice, and Max # (as aset of three variables). The partial discrepancy between the resultsobtained with the two methods was clarified by the post hoc anal-ysis, which revealed the following points. First, the explanatorypower of both Chosen Value and Chosen Juice was significantly
Figure 3. ACCd, population results of ANCOVA. a, Explained responses. The number indicated in each bin represents the number of responses explained by each variable in each timewindow. For example, in the Postoffer time window, the variable Total Value explains 83 responses. Notably, because total value is highly correlated with Chosen Value, many of these83 responses are also explained by Chosen Value and thus appear in both bins. The same results indicated numerically are also represented as images by different shades of gray. b, Bestfit. The number indicated in each bin represents the number of responses for which the corresponding variable provides the best explanation (highest R 2). Thus, in this panel, eachresponse appears in at most one bin. The best fitting variable was identified separately for each response (i.e., for each time window). It can be noted that the redundancy between TotalValue and Chosen Value appears clearly resolved in favor of the latter variable. In later time windows, many responses are best explained by the Chosen Juice. Analogous plots for the OFCcan be found in the study by Padoa-Schioppa and Assad (2006), their Figure S6.
3798 • J. Neurosci., March 14, 2012 • 32(11):3791–3808 Cai and Padoa-Schioppa • Neuronal Encoding of Subjective Value in the ACC

Figure 4. ACCd, variable selection analysis. a, Stepwise selection. The figure illustrates the results of six iterations of the procedure (from top to bottom). The first panel is the same as in Figure3b. In the first iteration, we select the variable that provides the highest number of best fits in any time window, namely the Chosen Value (highlighted with a star symbol immediately below thepanel). Across time windows, this variable explains 556 (66%) responses. The second panel illustrates the residual population of neuronal responses that were not explained by Chosen Value. In thesecond iteration, we select the variable that provides the highest number of best fits for this residual population, namely the Mov Dir Only. Across time windows, this variable explains an additional146 (17%) responses. In the third iteration, we select the Chosen Juice, which explains an additional 61 (7%) responses. In all subsequent iterations, the marginal explanatory power of selectedvariables (i.e., the number of additional responses explained) failed to reach the threshold of 5% of the total. These variables (highlighted with a dot symbol immediately below the panel) were thusdiscarded. b, Stepwise selection, percentage of explained responses. The figure illustrates the percentage of responses explained at subsequent iterations of the stepwise procedure. In this plot,“100” on the y-axis represents the total number of responses that passed the ANOVA criterion. The dotted line ( y � 95%) indicates the number of responses explained overall by the 24 variablesexamined in the analysis. The three variables Chosen Value, Mov Dir Only, and Chosen Juice collectively explained 95% of the responses explained by the 24 variables, corresponding to 90% of thetotal responses. c, d, Best-subset selection. c illustrates the percentage of responses ( y-axis) explained by the best subset as a function of the number of variables (Figure legend continues.)
Cai and Padoa-Schioppa • Neuronal Encoding of Subjective Value in the ACC J. Neurosci., March 14, 2012 • 32(11):3791–3808 • 3799

higher than that of any other challenging variable (all p � 0.005).In particular, the explanatory power of Chosen Value was signif-icantly higher than that of Total Value (p � 10�5). Second, theexplanatory power of Max # was statistically indistinguishablefrom that of Total Value and Total #. In summary, these analysesindicated that the population of neurons in ACCv certainly en-coded variables Chosen Value and Chosen Juice. Together, thesetwo variables explained 367 responses, corresponding to 85% ofthe responses explained by the whole 19 variables, and to 78% ofthe responses that passed the ANOVA criterion. In addition, asmaller population of neurons in ACCv might encode the Max #,or the Total # or the Total Value. However, we could not disam-biguate between these possibilities based on our current data.
Based on these results, we concluded that the population ofACCv indeed encoded variables Chosen Value and Chosen Juice.We thus classified task-related responses from ACCv as encodingone of these two variables. In general, the two variables provideda good account of the population [across variables, mean(R 2) 0.5; Fig. 7e]. In all subsequent analyses of ACCv, we pooled trialsfor different movement directions.
Subjective value versus physical properties: analysis ofU-shaped responsesOne major conclusion of the analyses presented above is that wefound in both ACCd and ACCv neurons that encode the ChosenValue. Apart from the dissociation between Chosen Value and othervalue variables (Total Value, etc.), perhaps the most interesting as-pect of this result is that neurons in both ACCd and ACCv appear toencode economic value—a subjective quantity that integrates phys-ically distinct dimensions (juice type and juice amount). In this re-spect, however, one caveat is in order. Although our analysisincluded many physical variables, it forcedly did not include all pos-sible physical variables. For example, we did not examine the variableSugar Amount. Thus, to test whether U-shaped responses indeedencode the subjective value as opposed to any physical property ofthe juices, we conducted the following analysis.
The hypothesis that U-shaped responses encode the ChosenValue leads to a simple prediction. Separating trials in which theanimal chose juice A and juice B, we can regress separately theneuronal firing rate against the amounts of juice A and juice Bchosen by the animal. The two regressions provide slopes � and �(Fig. 8a,b). If the neuronal response indeed encodes the ChosenValue, then slope � should be proportional to the subjective valueof juice A, slope � should be proportional to the subjective valueof juice B, and the ratio �/� should be equal to the value ratio. Inother words, the slope ratio �/� provides an independent andneuronal measure of the relative value of the two juices, whichshould be equal to the relative value measured behaviorally fromthe choice pattern. For the response illustrated in Figure 8a,b, thisprediction is met: the relative value measured neuronally (�/� �
4
(Figure legend continued.) (x-axis). d, The table indicates the best subset for n � 1, 2, and 3variables. In essence, variables Chosen Value, Mov Dir Only, and Chosen Juice provide indeed thebest subset of three variables. The fact that Chosen Value and Mov Dir Only also provide the bestsubsets of one and two variables can be seen as a sign of robustness of this result. Most impor-tantly, the results obtained with the best-subset method are essentially identical to thoseobtained with the stepwise selection. e, Distribution of R 2. Each response was classified asencoding one of the three selected variables based on the R 2. Notably, many more responsesencoded the Chosen Value (N � 521) compared with the Mov Dir Only (N � 137) and theChosen Juice (N � 105). The three histograms here represent the distribution of R 2 for each ofthe three variables. The mean of the distribution was equal to 0.55, 0.52, and 0.46 for ChosenValue, Mov Dir Only, and Chosen Juice, respectively.
Figure 5. ACCv, activity of single neurons. The figure represents the activity of four neuronalresponses. All conventions are as in Figure 2. a, Response encoding the Chosen Value. In the leftpanel, the x-axis represents different offer types, the black dots represent the behavioral choicepattern, and the color symbols indicate the neuronal firing rate. Each symbol represents onetrial typeLR. The diamonds and circles represent, respectively, trials in which the animal chosejuice A and juice B. The red and green symbols represent, respectively, trials in which the animalexecuted a leftward and rightward saccade. In the right panel, the same data points ( y-axis) areplotted against the variable Chosen Value (expressed in units of juice B). The two lines representthe results of the ANCOVA (parallel model). As typically the case in ACCv, the activity of this cellis not directionally selective. This response was recorded in the Late Delay time window. b, An-other response encoding the Chosen Value. This response was recorded in the Prejuice timewindow. c, Response encoding the Chosen Value with a negative slope. This response, recordedin the Postjuice time window, was higher for lower values. d, Response encoding the ChosenJuice. This neuronal response, recorded in the Postjuice2 time window, was binary dependingon the chosen juice. All conventions in b– d are as in a.
3800 • J. Neurosci., March 14, 2012 • 32(11):3791–3808 Cai and Padoa-Schioppa • Neuronal Encoding of Subjective Value in the ACC

2.2 � 0.6, SD computed with error propagation) is statisticallyindistinguishable from that measured behaviorally at the indif-ference point (A/B � 2.6).
The evidence that U-shaped responses indeed encode subjec-tive value as opposed to any physical property of the juicesemerges from the following observation. For any given juices Aand B, the relative value measured behaviorally may vary to someextent from day to day. For example, on some days, the animalmay be very thirsty and may not forego large quantities of juice Bto obtain 1A, resulting in a lower relative value. On other days, theanimal may be less thirsty, resulting in a higher relative value. IfU-shaped responses encode a physical property of the juices, theyshould be unaffected by this day to day variability. Conversely, ifU-shaped responses encode the subjective value, the slope ratio�/� should also vary from day to day matching the variability inrelative value measured behaviorally. Our data were consistentwith the latter prediction. In Figure 8c, we plotted the neuronalmeasure of relative value (slope ratio, y-axis) against the behav-ioral measure of relative value (indifference point, x-axis). Eachcircle represents one response, and the plot includes all and onlyU-shaped responses recorded in ACCv with 2/3 fruit punch and1/3 cranberry juice. A linear regression y � a0 a1x provided thefollowing estimates (�95% confidence interval): a0 � 0.09(�0.45) and a1 � 0.99 (�0.66). In other words, the two measuresof relative value were statistically indistinguishable.
To test the identity between neuronal and behavioral mea-sures of relative values across the population, we performed an
ANCOVA (full model) in which we regressed the slope ratioagainst the behavioral indifference point and we grouped re-sponses by the juice pair. This analysis was done separately for thetwo brain areas. For ACCd (six juice pairs; Fig. 8d), we found thatthe slope ratio depended significantly on the indifference point(p � 10�10) but did not depend on either the juice pair or theinteraction (indifference point by juice pair) (both p 0.07).Specifically, for the relationship between slope ratio and indiffer-ence point (main term), we obtained slope � 1.18 (�0.24) andintercept � �0.19 (�0.22) (estimate � SEM). In other words,the neuronal measure and the behavioral measure of relativevalue were statistically identical with one another.
For ACCv (seven juice pairs; Fig. 8e), we obtained verysimilar results. The full model ANCOVA indicated that theslope ratio depended significantly on the indifference point( p � 10 �10) but did not depend on either the juice pair or theinteraction (indifference point by juice pair) (both p 0.5).For the relationship between slope ratio and indifferencepoint (main term), we obtained slope � 0.83 (�0.16) andintercept � 0.20 (�0.12) (estimate � SEM). (Note that theintercept did not differ significantly from zero, p 0.09.) Inother words, the two measures of relative value were statisti-cally identical to one another.
In conclusion, this analysis demonstrates that U-shaped re-sponses indeed encode a subjective quantity–namely, the ChosenValue–as opposed to any physical property of the juices.
Figure 6. ACCv, population results of ANCOVA. a, Explained responses. The number indicated in each bin represents the number of responses explained by each variable in each time window.b, Best fit. The number indicated in each bin represents the number of responses for which the corresponding variable provides the best explanation (highest R 2). The best fitting variable wasidentified separately for each response (i.e., for each time window). Notably, ACCv neurons were most frequently modulated after juice delivery (Table 2). In terms of encoded variables, Chosen Valueappears dominant throughout the delay, whereas Chosen Juice is most prominent after juice delivery. All conventions are as in Figure 3.
Cai and Padoa-Schioppa • Neuronal Encoding of Subjective Value in the ACC J. Neurosci., March 14, 2012 • 32(11):3791–3808 • 3801

Figure 7. ACCv, variable selection analysis. All conventions are as in Figure 4. a, Stepwise selection. The first panel is the same as in Figure 6b. In the first two iterations, the algorithm selected variables ChosenJuice and Chosen Value. All variables selected in subsequent iterations fail to meet the 5% threshold and were thus discarded. The variable selected (discarded) at each iteration is highlighted with a star (dot)symbol immediately below the panel. b, Stepwise selection, percentage of explained responses. The figure illustrates the percentage of responses explained at subsequent iterations of the stepwise procedure.In this plot, “100” on the y-axis represents the total number of responses that passed the ANOVA criterion. The dotted line ( y � 94%) indicates the number of responses explain overall by the 24 variablesexamined in the analysis. The two variables Chosen Value and Chosen Juice collectively explained 304 responses, corresponding to 90% of the responses explained by the 24 variables and to 85% of the totalresponses. c, d, Best-subset selection. c indicates the percentage of responses ( y-axis) explained by the best subset as a function of the number of variables (x-axis). d, The table indicates the best subset for n�1, 2. Variables Chosen Value and Chosen Juice provide the best subset of two variables. (See main text for details on post hoc analysis.) e, Distribution of R 2. Each response was classified as encoding either theChosen Value or the Chosen Juice based on the R 2. The two histograms here represent the distribution of R 2 for the two variables. The distribution mean was equal to 0.53 for the Chosen Value (N � 221) andto 0.51 for the Chosen Juice (N � 83).
3802 • J. Neurosci., March 14, 2012 • 32(11):3791–3808 Cai and Padoa-Schioppa • Neuronal Encoding of Subjective Value in the ACC

Range adaptation in ACCd and ACCvIn a previous study, we found that value-encoding neurons inthe OFC adapt to the range of values available in any givensession (or trial block). In other words, the same range ofneuronal firing rates describes different ranges of values indifferent behavioral conditions (Padoa-Schioppa, 2009). Thisadaptation phenomenon ensures in principle a computation-ally efficient encoding of subjective value. We thus examinedwhether the representations of subjective value in ACCd andACCv also undergo range adaptation.
We first examined the population of 521 Chosen Valueresponses recorded in ACCd. Consistent with previous reports(Seo and Lee, 2007; Kennerley et al., 2009), their activity couldeither increase or decrease as a function of the encoded value.Specifically, responses with positive and negative slopes were310 of 521 (60%) and 211 of 521 (40%), respectively (Fig. 9a).Apart from the sign, the two distributions obtained for posi-tive and negative slopes had equal median ( p � 0.84, Wilcox-
on’s rank-sum test). For all the analyses of range adaptation,we thus rectified negative-slope responses and pooled themwith positive-slope responses (Fig. 9b).
The variable selection analyses presented above indicated that theencoding of the variable Chosen Value was roughly linear. In otherwords, indicating with � the firing rate, with V the Chosen Value,and with c0 and c1 the intercept and slope of the encoding, respec-tively, the following held true: � � c0 c1V. Having defined thevalue range �V as the range of values chosen by the animal within asession and the minimum value V0 as the lowest value chosen in thatsession, this relationship can be written as follows: � � �0 �� * (V � V0)/�V, where �0 � c0 c1V0 is the baseline activity and�� � c1 * �V is the activity range. In this formalism, the hypothesisthat neuronal firing rates adapt to the range of values available in anygiven session corresponds to the hypothesis that neuronal parame-ters �0 and �� are independent of the value range �V.
In our experiments, each neuron was recorded in one sessionwith one value range (�V). However, the range of chosen values
Figure 8. U-shaped responses reflect the subjective nature of value. a, b, One response. This neuron was recorded in ACCv and trials for different movement directions were pooled (see Materialsand Methods). For this analysis (b), the firing rate was regressed on the amount of juice chosen and received by the animal, separately for trials in which the animal chose juice A and juice B. We thusobtained slopes � and �. If the response indeed encodes the Chosen Value, the slope ratio �/� should provide a neuronal measure for the relative value and thus equal the behavioral measureobtained from the choice pattern—a prediction met by this response (slope ratio �/�� 2.2 � 0.6; indifference point A/B � 2.6). c, Match between neuronal and behavioral measures of relativevalue, one juice pair. The scatterplot (log–log scale) includes all U-shaped responses recorded from ACCv while monkeys chose between 2/3 fruit punch and 1/3 cranberry juice (55 responses).The line, obtained from a linear regression, is statistically indistinguishable from identity (y � x). The fact that the neuronal measure of relative value (y-axis) matched the variability observed in thebehavioral measure (x-axis) demonstrates that these neurons indeed reflect the subjective nature of value. Indeed, if U-shaped responses encoded a physical property of the juice, the variability inthe slope ratio should be independent of that observed in the choice pattern and the regression line should be horizontal. d, e, Neuronal versus behavioral measure of relative value, population. Inthe scatterplot, each symbol represented one response, different symbols and colors indicate different juice pairs (see legend), and regression lines represent the results of the ANCOVA (full model).This analysis included only juice pairs for which we had at least 20 responses. For both areas, we found a significant effect of the main factor and no effect of either the group or the interaction. In bothareas, the relationship between neuronal measure (slope ratio) and behavioral measure (indifference point) was statistically indistinguishable from identity.
Cai and Padoa-Schioppa • Neuronal Encoding of Subjective Value in the ACC J. Neurosci., March 14, 2012 • 32(11):3791–3808 • 3803

varied from session to session, roughly twofold between 4 and 8 uB.We thus divided neuronal responses in two groups depending onwhether the range values chosen in that session was �V 6 uB or�V 6 uB. If neuronal firing rates indeed adapt to the value range,then the slope of the encoding c1 should be inversely proportional tothe value range �V. Consistent with this prediction, we found thatthe average slope was significantly higher when neurons were re-corded with �V 6 uB compared with when neurons were re-corded with �V 6 uB (p � 10�10, ANOVA; Fig. 9c).
The most direct evidence for neuronal adaptation came from apopulation analysis of the firing rate as a function of the ChosenValue. For this analysis, we normalized each response by subtractingthe baseline activity �0 corresponding to the minimum chosen valueV0. The entire population of 521 responses is illustrated in Figure 9d,where the two colors label responses recorded with �V 6 uB and�V 6 uB, respectively. In general, activity ranges (y-axis) variedsubstantially across the population. However, when we averaged thefiring rates separately for the two groups of responses neuronal ad-aptation appeared evident (Fig. 9e).
We also examined the distributions of activity ranges (��)measured for the two groups of responses. Consistent with rangeadaptation, the two distributions were statistically indistinguish-able (p � 0.10, Kruskal–Wallis test; Fig. 9f). One possible con-cern is that this last result may be due to saturation or ceilingeffects, as opposed to adaptation. However, it can be noted thatthe two activity traces in Figure 9e are well separated throughoutthe spectrum of chosen values, and both traces are close to linear.
This observation indicates that the fact that activity ranges areindependent of the value range (Fig. 9f) is genuinely due to rangeadaptation.
We repeated these same analyses for the population of 256Chosen Value responses recorded in ACCv, and we obtained verysimilar results (Fig. 10). In ACCv, responses with positive andnegative slopes were 172 of 256 (67%) and 84 of 256 (33%),respectively. The two distributions had equal median (p � 0.69,Wilcoxon’s rank-sum test; Fig. 10a). Thus, we rectified negative-slope responses and pooled them with positive-slope responses(Fig. 10b). We separated neuronal responses in two groups de-pending on whether they had been recorded in sessions withvalue range �V 6 uB or �V 6 uB, and we examined the slopeof the encoding as a function of the value range. Consistent withrange adaptation, the average slope was significantly higher whenneurons were recorded with �V 6 uB compared with whenneurons were recorded with �V 6 uB (p � 10�10, ANOVA;Fig. 10c). We then examined the neuronal firing rate directly as afunction of the Chosen Value. We normalized responses by sub-tracting the baseline activity, and we plotted the entire population of256 responses (Fig. 10d). In general, activity ranges ( y-axis)varied substantially across the population. However, when weaveraged the firing rates separately for the two groups of re-sponses, neuronal adaptation appeared evident (Fig. 10e). Thedistributions of activity ranges measured for the two groups ofresponses were statistically indistinguishable (p � 0.65, Kruskal–Wallis test; Fig. 10f). Importantly, the activity traces for the two
Figure 9. Range adaptation in ACCd. a, Distribution of regression slopes. Responses with positive/negative slopes were in ratio 60/40 ( p � 10 �5, binomial test). Apart from the sign,the distributions obtained for positive and negative slopes had equal median ( p � 0.84, Wilcoxon’s rank-sum test). We thus rectified responses with negative slopes and we pooled allresponses for this analysis. b, Distribution of unsigned slopes. c, Regression slope versus value range. In the scatterplot, each cross represents one response, the y-axis represents theregression slope (c1), and the x-axis represents the range of values (�V) available to the monkey in the corresponding session. Responses were divided in two groups depending onwhether �V 6 uB or �V 6 uB. The two color diamonds represent the two groups (blue for �V 6 uB; yellow for �V 6 uB). Their x- and y-coordinates are in the center of massof the corresponding group. On average, regression slopes measured in sessions with a small value range (blue) were larger than regression slopes measured in sessions with a large valuerange (yellow) ( p � 10 �10, ANOVA). d, Population firing rates, individual responses. The plot shows the entire population of 521 responses Chosen Value responses recorded in ACCd.Each response was normalized, rectified, and color coded depending on the value range. e, Average neuronal responses. The blue and yellow lines represent, respectively, the averageneuronal response obtained for �V 6 uB and for �V 6 uB. Notably, the two average responses are well separated throughout the value spectrum, and both are close to linear.f, Distribution of activity ranges. Each histogram illustrates the distribution of activity ranges (��) obtained for the corresponding group. The small triangles indicate the medians. Thetwo distributions are statistically indistinguishable ( p � 0.10, Kruskal–Wallis test). Color codes in d–f are the same as in c.
3804 • J. Neurosci., March 14, 2012 • 32(11):3791–3808 Cai and Padoa-Schioppa • Neuronal Encoding of Subjective Value in the ACC

groups of responses (Fig. 10e) were well separated throughout thespectrum of chosen values, indicating that the result in Figure 10fwas indeed due to neuronal adaptation as opposed to saturation orceiling effects.
In conclusion, our analyses indicated that value-encoding neu-rons in both ACCd and ACCv undergo range adaptation. In bothareas, neuronal responses encoding the Chosen Value adapted insuch a way that a given range of firing rates represented differentranges of values in different behavioral conditions.
Partial adaptation on the timescale of individual trialsThe results illustrated in Figures 9 and 10 demonstrated rangeadaptation on the timescale of behavioral sessions, which in thisstudy typically included 200 – 400 trials. One interesting questionconcerns the time course of the adaptation process. In our exper-iments, monkeys learned the range of values included in eachsession by performing in the task. Thus, adaptation presumablytook place over the course of multiple trials at the beginning ofeach session. In the following analysis, we examined whether andto what extent adaptation could be observed on a trial-by-trialbasis.
We used the same approach previously undertaken for theanalysis of OFC. In our experiments, different trial types wererandomly interleaved so that the Chosen Value varied from trialto trial. The hypothesis that neurons undergo range adaptationleads to a simple prediction. Consider for example the cell inFigure 11a, recorded in a session in which the Chosen Valuevaried between 2 and 6 uB. Consider now only trials in which themonkey chose 3B (Chosen Value � 3 uB). These trials could
follow trials in which the Chosen Value was �3 uB; alternatively,they could follow trials in which the Chosen Value was 3 uB. Ifthe neuron indeed undergoes adaptation, then its activity shoulddepend at least slightly on the value chosen in the previous trial.Specifically, its activity should be slightly elevated when the valuechosen in the previous trial was �3 uB; it should be slightlydepressed when the value chosen in the previous trial was 3 uB.
To test this prediction more generally, we divided trials de-pending on whether the Chosen Value in the current trial (trial n)was higher or lower than the Chosen Value in the previous trial(trial n � 1). Indicating with V(k) the value chosen in trial k, thetwo groups of trials were thus defined as V(n) V(n � 1) andV(n) � V(n � 1). Consistent with the prediction, the activity fortrials V(n) V(n � 1) was slightly higher than that for trialsV(n) � V(n � 1) (Fig. 11a).
To quantify this effect, we computed for each trial type the “nor-malized difference,” defined as the difference between the firing rateobtained for trials V(n) V(n � 1) and the firing rate obtained fortrials V(n) � V(n � 1), normalized by the firing rate obtained pool-ing all trials. We then defined � as the average normalized difference(average across trial types). Thus, � represented the average percent-age modulation of trial n � 1 on trial n. For the response in Figure11a, we obtained � � 13%. Two panels in Figure 11b illustrate thedistributions of � obtained, respectively, for the population of 521Chosen Value responses recorded in ACCd and for the populationof 256 Chosen Value responses recorded in ACCv. Although bothareas present a substantial variability, responses with � 0 were asignificant majority in both areas (both p � 10�4, binomial test). Fur-thermore, in both areas, mean(�) was significantly greater than zero
Figure 10. Range adaptation in ACCv. a, Distribution of regression slopes. Responses with positive/negative slopes were in ratio 67/33 ( p � 10 �8, binomial test). Apart from the sign, thedistributions obtained for positive and negative slopes had equal median ( p � 0.69, Wilcoxon’s rank-sum test). We thus rectified responses with negative slopes, and we pooled all responses forthis analysis. b, Distribution of unsigned slopes. c, Regression slope versus value range. In the scatterplot, each cross represents one response, the y-axis represents the regression slope (c1), and thex-axis represents the range of values (�V). Responses were divided in two groups depending on whether �V 6 uB or �V 6 uB. The blue and yellow diamonds represent responses with �V 6 uB and responses with �V 6 uB, respectively. Each diamond is located in the center of mass of the corresponding group. On average, regression slopes measured in sessions with a small valuerange were larger than regression slopes measured in sessions with a large value range ( p � 10 �10, ANOVA). d, Population firing rates, individual responses. The plot shows the entire populationof 256 Chosen Value responses recorded in ACCv. Each response was normalized, rectified, and color coded depending on the value range. e, Average neuronal responses. The blue and yellow linesrepresent, respectively, the average neuronal response obtained for �V 6 uB and for �V 6 uB. Notably, the two average responses are well separated throughout the value spectrum, and bothare close to linear. f, Distribution of activity ranges. Each histogram illustrates the distribution of activity ranges (��) obtained for the corresponding group, and small triangles indicate the medians.The two distributions are statistically indistinguishable ( p � 0.65, Kruskal–Wallis test). Color codes in d–f are the same as in c.
Cai and Padoa-Schioppa • Neuronal Encoding of Subjective Value in the ACC J. Neurosci., March 14, 2012 • 32(11):3791–3808 • 3805
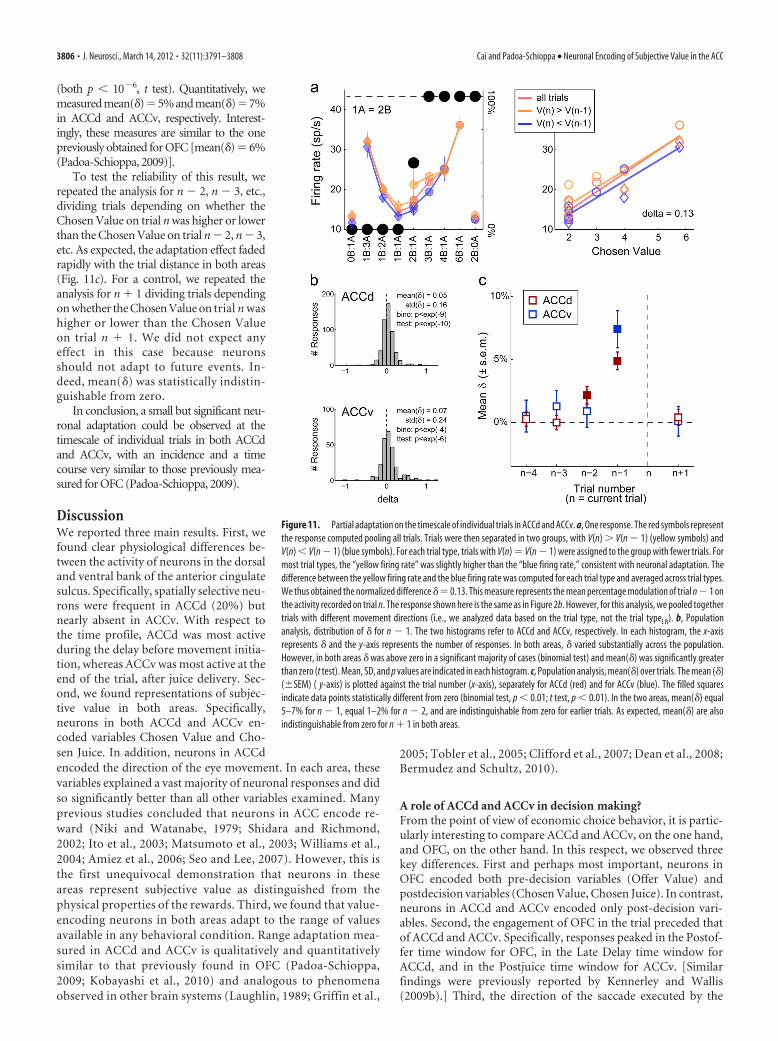
(both p � 10�6, t test). Quantitatively, wemeasuredmean(�)�5%andmean(�)�7%in ACCd and ACCv, respectively. Interest-ingly, these measures are similar to the onepreviously obtained for OFC [mean(�) � 6%(Padoa-Schioppa, 2009)].
To test the reliability of this result, werepeated the analysis for n � 2, n � 3, etc.,dividing trials depending on whether theChosen Value on trial n was higher or lowerthan the Chosen Value on trial n � 2, n � 3,etc. As expected, the adaptation effect fadedrapidly with the trial distance in both areas(Fig. 11c). For a control, we repeated theanalysis for n 1 dividing trials dependingon whether the Chosen Value on trial n washigher or lower than the Chosen Valueon trial n 1. We did not expect anyeffect in this case because neuronsshould not adapt to future events. In-deed, mean(�) was statistically indistin-guishable from zero.
In conclusion, a small but significant neu-ronal adaptation could be observed at thetimescale of individual trials in both ACCdand ACCv, with an incidence and a timecourse very similar to those previously mea-sured for OFC (Padoa-Schioppa, 2009).
DiscussionWe reported three main results. First, wefound clear physiological differences be-tween the activity of neurons in the dorsaland ventral bank of the anterior cingulatesulcus. Specifically, spatially selective neu-rons were frequent in ACCd (20%) butnearly absent in ACCv. With respect tothe time profile, ACCd was most activeduring the delay before movement initia-tion, whereas ACCv was most active at theend of the trial, after juice delivery. Sec-ond, we found representations of subjec-tive value in both areas. Specifically,neurons in both ACCd and ACCv en-coded variables Chosen Value and Cho-sen Juice. In addition, neurons in ACCdencoded the direction of the eye movement. In each area, thesevariables explained a vast majority of neuronal responses and didso significantly better than all other variables examined. Manyprevious studies concluded that neurons in ACC encode re-ward (Niki and Watanabe, 1979; Shidara and Richmond,2002; Ito et al., 2003; Matsumoto et al., 2003; Williams et al.,2004; Amiez et al., 2006; Seo and Lee, 2007). However, this isthe first unequivocal demonstration that neurons in theseareas represent subjective value as distinguished from thephysical properties of the rewards. Third, we found that value-encoding neurons in both areas adapt to the range of valuesavailable in any behavioral condition. Range adaptation mea-sured in ACCd and ACCv is qualitatively and quantitativelysimilar to that previously found in OFC (Padoa-Schioppa,2009; Kobayashi et al., 2010) and analogous to phenomenaobserved in other brain systems (Laughlin, 1989; Griffin et al.,
2005; Tobler et al., 2005; Clifford et al., 2007; Dean et al., 2008;Bermudez and Schultz, 2010).
A role of ACCd and ACCv in decision making?From the point of view of economic choice behavior, it is partic-ularly interesting to compare ACCd and ACCv, on the one hand,and OFC, on the other hand. In this respect, we observed threekey differences. First and perhaps most important, neurons inOFC encoded both pre-decision variables (Offer Value) andpostdecision variables (Chosen Value, Chosen Juice). In contrast,neurons in ACCd and ACCv encoded only post-decision vari-ables. Second, the engagement of OFC in the trial preceded thatof ACCd and ACCv. Specifically, responses peaked in the Postof-fer time window for OFC, in the Late Delay time window forACCd, and in the Postjuice time window for ACCv. [Similarfindings were previously reported by Kennerley and Wallis(2009b).] Third, the direction of the saccade executed by the
Figure 11. Partial adaptation on the timescale of individual trials in ACCd and ACCv. a, One response. The red symbols representthe response computed pooling all trials. Trials were then separated in two groups, with V(n) V(n � 1) (yellow symbols) andV(n) � V(n � 1) (blue symbols). For each trial type, trials with V(n) � V(n � 1) were assigned to the group with fewer trials. Formost trial types, the “yellow firing rate” was slightly higher than the “blue firing rate,” consistent with neuronal adaptation. Thedifference between the yellow firing rate and the blue firing rate was computed for each trial type and averaged across trial types.We thus obtained the normalized difference �� 0.13. This measure represents the mean percentage modulation of trial n � 1 onthe activity recorded on trial n. The response shown here is the same as in Figure 2b. However, for this analysis, we pooled togethertrials with different movement directions (i.e., we analyzed data based on the trial type, not the trial typeLR). b, Populationanalysis, distribution of � for n � 1. The two histograms refer to ACCd and ACCv, respectively. In each histogram, the x-axisrepresents � and the y-axis represents the number of responses. In both areas, � varied substantially across the population.However, in both areas � was above zero in a significant majority of cases (binomial test) and mean(�) was significantly greaterthan zero (t test). Mean, SD, and p values are indicated in each histogram. c, Population analysis, mean(�) over trials. The mean (�)(�SEM) ( y-axis) is plotted against the trial number (x-axis), separately for ACCd (red) and for ACCv (blue). The filled squaresindicate data points statistically different from zero (binomial test, p � 0.01; t test, p � 0.01). In the two areas, mean(�) equal5–7% for n � 1, equal 1–2% for n � 2, and are indistinguishable from zero for earlier trials. As expected, mean(�) are alsoindistinguishable from zero for n 1 in both areas.
3806 • J. Neurosci., March 14, 2012 • 32(11):3791–3808 Cai and Padoa-Schioppa • Neuronal Encoding of Subjective Value in the ACC

animal modulated the activity of neurons in ACCd. In contrast,the activity of neurons in OFC and ACCv did not depend on thevisuomotor contingencies of the task. Together, our results indi-cate that information about the choice outcome (Chosen Valueand Chosen Juice) reached ACCd and ACCv after the compari-son between values (i.e., the decision) took place in other brain re-gions. In this respect, it is also interesting to note that, although theactivity of neurons in ACCd was spatially selective, we did not findevidence for the encoding of “action value” variables Offer Value Land Offer Value R. In other words, at least from the limited vantagepoint provided by ACCd, it appears that decisions in our choice taskdid not involve the comparison of action values. Conversely, theactivation timing and the coexistence in ACCd of choice outcomesignals and movement direction signals raises the possibility that thisarea may contribute to the processes through which choice out-comes and subjective values inform the motor systems.
Prima facie, the conclusion that ACCd/v are computationallydownstream of economic decisions may appear at odds with pre-vious studies (Walton et al., 2002; Williams et al., 2004; Kennerleyet al., 2006; Rudebeck et al., 2008; Camille et al., 2011). Uponcloser examination, however, the present results complementwell recently emerging notions on the functional role of ACC. Inbroad strokes, decision tasks can be distinguished depending (1)on whether the task includes or does not include a learning com-ponent and (2) on whether options are defined by stimuli and/orby actions. For example, Rudebeck et al. (2008) tested monkeys intwo tasks that included a learning component and such that op-tions were defined either only by stimuli or only by actions. Arecently emerging notion is that ACC lesions seem to impairperformance particularly in tasks that include a learning compo-nent, and especially if options are defined exclusively by actions.In contrast, performance is essentially spared in tasks that do notinclude learning and/or when options are defined by stimuli(Kennerley et al., 2006; Rudebeck et al., 2008). Notably, our eco-nomic choice task did not include a learning component. Fur-thermore, in any given trial, each option was associated with botha stimulus and an action. Thus, the conclusion that ACCd/v doesnot contribute to decision making in our task is consistent withprevious results. In fact, our present observations seem to reso-nate with recent reports indicating a specific role of ACC in asso-ciative learning (Alexander and Brown, 2011; Kennerley et al.,2011; Wallis and Rich, 2011). It can be noted that variables Cho-sen Value and Chosen Juice encoded in ACCd/v, if measured in alearning context, could provide the quantities necessary to eval-uate performance and thus compute a teaching signal. In thisview, the role of ACC in decision making would be indirect: byinfluencing learning, the activity of this areas in any given trialwould affect decisions in subsequent trials.
Possible roles of ACCd and ACCv in other cognitive processesOur results are also relevant to two hypotheses previously putforth on the functional role of ACC. First, based mostly on imag-ing data, several authors proposed that neural activity in ACCgenerally reflects the cognitive conflict or the difficulty of the task(Botvinick et al., 2001; Paus, 2001; Ridderinkhof et al., 2004;Rushworth et al., 2004). In our experimental paradigm, the deci-sion difficulty can be operationally identified with the variableValue Ratio (i.e., Oth/Ch Value). This variable has its maximumat the indifference point (Value Ratio � 1), where the two valuesare very similar and thus the decision is presumably difficult. Asone “moves away” from the indifference point, the Value Ratiobecomes smaller and the decision becomes presumably easier. Inthe extreme cases of forced choices (Value Ratio � 0), the deci-
sion is trivial. Consistent with this operational definition, we pre-viously observed in a version of the task that did not impose adelay between offer and movement initiation that reaction timeswere highly correlated with the Value Ratio (Padoa-Schioppa etal., 2006). With this premise, current results appear in contrastwith the cognitive conflict hypothesis because vanishingly fewneurons encoded the Value Ratio in either area. Notably, ourrecordings sampled densely and extensively both banks of thecingulate sulcus. Thus, the negative result vis-a-vis decision dif-ficulty appears credible. Interestingly, other studies searched andfailed to find individual cells encoding cognitive conflict or taskdifficulty in the primate ACC (Ito et al., 2003; Nakamura et al.,2005). The discrepancy between single-cell and imaging studiesmay possibly be due to anatomical mismatches between species(e.g., human ACC include cell types not found in macaques) orperhaps to the imperfect correspondence between hemodynamicresponses and neuronal spiking activity (Botvinick, 2007). In anycase, the cognitive conflict hypothesis did not find support in ourdata.
Second, in a recent study, Hayden et al. (2009) reported thatneurons in the ACC encode fictive (counterfactual) reward sig-nals. In their experiment, monkeys selected one among eightpossible targets, seven of which delivered a small amount of juiceand one of which (the optimal target) delivered an amount ofjuice randomly variable but on average much higher than that ofthe other targets. On any given trial, the position of the optimaltarget was most likely (60% of trials) the same as in the previoustrial. Thus, the optimal strategy was to select on each trial thetarget located in the same position occupied by the optimal targetin the previous trial. If on trial n the monkey selected the optimaltarget, the optimal strategy on trial n 1 was to select the sametarget; if on trial n the monkey selected a different target, theoptimal strategy on trial n 1 was to switch and select the posi-tion occupied by the optimal target on trial n. Since the amount ofjuice delivered by the optimal target varied randomly from trial totrial, switching in the latter case was optimal independently of theamount “missed” on trial n (the fictive reward). However, curi-ously, the fictive reward significantly affected switching in bothanimals. Remarkably, Hayden et al. (2009) found in ACC neu-rons encoding the fictive reward size as well as the actual rewardsize. In our experiments, fictive rewards are measured by thevariable Other Value, which accounted for very few responses inour data sets. So how can our results be reconciled with those ofHayden et al. (2009)? In this respect, it can be noted that, in thestudy by Hayden et al. (2009), fictive rewards were behaviorallyrelevant because they guided target selection in the next trial. Inother words, the task included a learning component that wasbased on both the location and the amount of the fictive reward.Thus, one possibility is that neurons recorded by Hayden et al.(2009) did not encode fictive reward per se (i.e., Other Value),but rather encoded the value of stimuli that guided the learningprocess. This hypothesis predicts that fictive reward signals inACC should disappear if they do not guide learning. In this view,our conclusion that neurons in ACCd and ACCv encode thesubjective value of chosen goods might extend to the subjectivevalue of other behaviorally relevant goods. Similar considerationsapply to OFC, where very few responses encoded the Other Valuein our experiments (Padoa-Schioppa and Assad, 2006, 2008),whereas a recent study found fictive reward signals in a learningcontext (Abe and Lee, 2011) [see discussion in the study byPadoa-Schioppa and Cai (2011)].
In conclusion, we found two independent representations ofsubjective value in ACCd and ACCv. The general roles of these
Cai and Padoa-Schioppa • Neuronal Encoding of Subjective Value in the ACC J. Neurosci., March 14, 2012 • 32(11):3791–3808 • 3807

representations in various cognitive functions remain somewhatunclear. Our results suggest that these two areas do not contrib-ute to economic decisions per se. At the same time, our resultscomplement well recent work indicating a specific role of ACC inassociative learning. More generally, the coexistence in ACCd ofchoice outcome signals and movement direction signals suggeststhat this area may represent a gateway through which the choicesystem informs motor systems.
ReferencesAbe H, Lee D (2011) Distributed coding of actual and hypothetical out-
comes in the orbital and dorsolateral prefrontal cortex. Neuron70:731–741.
Alexander WH, Brown JW (2011) Medial prefrontal cortex as an action-outcome predictor. Nat Neurosci 14:1338 –1344.
Amiez C, Joseph JP, Procyk E (2006) Reward encoding in the monkey ante-rior cingulate cortex. Cereb Cortex 16:1040 –1055.
Bermudez MA, Schultz W (2010) Reward magnitude coding in primateamygdala neurons. J Neurophysiol 104:3424 –3432.
Botvinick MM (2007) Conflict monitoring and decision making: reconcil-ing two perspectives on anterior cingulate function. Cogn Affect BehavNeurosci 7:356 –366.
Botvinick MM, Braver TS, Barch DM, Carter CS, Cohen JD (2001) Conflictmonitoring and cognitive control. Psychol Rev 108:624 – 652.
Camille N, Tsuchida A, Fellows LK (2011) Double dissociation of stimulus-value and action-value learning in humans with orbitofrontal or anteriorcingulate cortex damage. J Neurosci 31:15048 –15052.
Clifford CW, Webster MA, Stanley GB, Stocker AA, Kohn A, Sharpee TO,Schwartz O (2007) Visual adaptation: neural, psychological and com-putational aspects. Vision Res 47:3125–3131.
Dean I, Robinson BL, Harper NS, McAlpine D (2008) Rapid neural adapta-tion to sound level statistics. J Neurosci 28:6430 – 6438.
Dunn OJ, Clark V (1987) Applied statistics: analysis of variance and regres-sion, Ed 2. New York: Wiley.
Glantz SA, Slinker BK (2001) Primer of applied regression and analysis ofvariance, Ed 2. New York: McGraw-Hill, Medical Publishing Division.
Griffin SJ, Bernstein LR, Ingham NJ, McAlpine D (2005) Neural sensitivityto interaural envelope delays in the inferior colliculus of the guinea pig.J Neurophysiol 93:3463–3478.
Hayden BY, Platt ML (2010) Neurons in anterior cingulate cortex multiplexinformation about reward and action. J Neurosci 30:3339 –3346.
Hayden BY, Pearson JM, Platt ML (2009) Fictive reward signals in the ante-rior cingulate cortex. Science 324:948 –950.
Hillman KL, Bilkey DK (2010) Neurons in the rat anterior cingulate cortexdynamically encode cost-benefit in a spatial decision-making task. J Neu-rosci 30:7705–7713.
Ito S, Stuphorn V, Brown JW, Schall JD (2003) Performance monitoring bythe anterior cingulate cortex during saccade countermanding. Science302:120 –122.
Kable JW, Glimcher PW (2009) The neurobiology of decision: consensusand controversy. Neuron 63:733–745.
Kennerley SW, Wallis JD (2009a) Evaluating choices by single neurons inthe frontal lobe: outcome value encoded across multiple decision vari-ables. Eur J Neurosci 29:2061–2073.
Kennerley SW, Wallis JD (2009b) Encoding of reward and space during aworking memory task in the orbitofrontal cortex and anterior cingulatesulcus. J Neurophysiol 102:3352–3364.
Kennerley SW, Walton ME, Behrens TE, Buckley MJ, Rushworth MF (2006)Optimal decision making and the anterior cingulate cortex. Nat Neurosci9:940 –947.
Kennerley SW, Dahmubed AF, Lara AH, Wallis JD (2009) Neurons in thefrontal lobe encode the value of multiple decision variables. J Cogn Neu-rosci 21:1162–1178.
Kennerley SW, Behrens TE, Wallis JD (2011) Double dissociation of valuecomputations in orbitofrontal and anterior cingulate neurons. Nat Neu-rosci 14:1581–1589.
Kobayashi S, Pinto de Carvalho O, Schultz W (2010) Adaptation of rewardsensitivity in orbitofrontal neurons. J Neurosci 30:534 –544.
Koyama T, Kato K, Tanaka YZ, Mikami A (2001) Anterior cingulate activityduring pain-avoidance and reward tasks in monkeys. Neurosci Res39:421– 430.
Laughlin SB (1989) The role of sensory adaptation in the retina. J Exp Biol146:39 – 62.
Lee D, Rushworth MF, Walton ME, Watanabe M, Sakagami M (2007)Functional specialization of the primate frontal cortex during decisionmaking. J Neurosci 27:8170 – 8173.
Matsumoto K, Suzuki W, Tanaka K (2003) Neuronal correlates of goal-based motor selection in the prefrontal cortex. Science 301:229 –232.
Matsumoto M, Matsumoto K, Abe H, Tanaka K (2007) Medial prefrontalcell activity signaling prediction errors of action values. Nat Neurosci10:647– 656.
Nakamura K, Roesch MR, Olson CR (2005) Neuronal activity in macaqueSEF and ACC during performance of tasks involving conflict. J Neuro-physiol 93:884 –908.
Niki H, Watanabe M (1979) Prefrontal and cingulate unit activity duringtiming behavior in the monkey. Brain Res 171:213–224.
Padoa-Schioppa C (2009) Range-adapting representation of economicvalue in the orbitofrontal cortex. J Neurosci 29:14004 –14014.
Padoa-Schioppa C (2011) Neurobiology of economic choice: a good-basedmodel. Annu Rev Neurosci 34:333–359.
Padoa-Schioppa C, Assad JA (2006) Neurons in orbitofrontal cortex encodeeconomic value. Nature 441:223–226.
Padoa-Schioppa C, Assad JA (2008) The representation of economic valuein the orbitofrontal cortex is invariant for changes of menu. Nat Neurosci11:95–102.
Padoa-Schioppa C, Cai X (2011) The orbitofrontal cortex and the compu-tation of subjective value: consolidated concepts and new perspectives.Ann N Y Acad Sci 1239:130 –137.
Padoa-Schioppa C, Jandolo L, Visalberghi E (2006) Multi-stage mental pro-cess for economic choice in capuchins. Cognition 99:B1–B13.
Paus T (2001) Primate anterior cingulate cortex: where motor control, driveand cognition interface. Nat Rev Neurosci 2:417– 424.
Rangel A, Hare T (2010) Neural computations associated with goal-directedchoice. Curr Opin Neurobiol 20:262–270.
Ridderinkhof KR, Ullsperger M, Crone EA, Nieuwenhuis S (2004) The roleof the medial frontal cortex in cognitive control. Science 306:443– 447.
Rudebeck PH, Behrens TE, Kennerley SW, Baxter MG, Buckley MJ, WaltonME, Rushworth MF (2008) Frontal cortex subregions play distinct rolesin choices between actions and stimuli. J Neurosci 28:13775–13785.
Rushworth MF, Behrens TE (2008) Choice, uncertainty and value in pre-frontal and cingulate cortex. Nat Neurosci 11:389 –397.
Rushworth MF, Walton ME, Kennerley SW, Bannerman DM (2004) Actionsets and decisions in the medial frontal cortex. Trends Cogn Sci8:410 – 417.
Rushworth MF, Behrens TE, Rudebeck PH, Walton ME (2007) Contrastingroles for cingulate and orbitofrontal cortex in decisions and social behav-iour. Trends Cogn Sci 11:168 –176.
Sallet J, Quilodran R, Rothe M, Vezoli J, Joseph JP, Procyk E (2007) Expec-tations, gains, and losses in the anterior cingulate cortex. Cogn AffectBehav Neurosci 7:327–336.
Seo H, Lee D (2007) Temporal filtering of reward signals in the dorsal ante-rior cingulate cortex during a mixed-strategy game. J Neurosci27:8366 – 8377.
Shidara M, Richmond BJ (2002) Anterior cingulate: single neuronal signalsrelated to degree of reward expectancy. Science 296:1709 –1711.
Tobler PN, Fiorillo CD, Schultz W (2005) Adaptive coding of reward valueby dopamine neurons. Science 307:1642–1645.
Wallis JD, Kennerley SW (2010) Heterogeneous reward signals in prefrontalcortex. Curr Opin Neurobiol 20:191–198.
Wallis JD, Rich EL (2011) Challenges of interpreting frontal neurons duringvalue-based decision-making. Front Neurosci 5:124.
Walton ME, Bannerman DM, Rushworth MF (2002) The role of rat medialfrontal cortex in effort-based decision making. J Neurosci 22:10996 –11003.
Williams ZM, Bush G, Rauch SL, Cosgrove GR, Eskandar EN (2004) Hu-man anterior cingulate neurons and the integration of monetary rewardwith motor responses. Nat Neurosci 7:1370 –1375.
3808 • J. Neurosci., March 14, 2012 • 32(11):3791–3808 Cai and Padoa-Schioppa • Neuronal Encoding of Subjective Value in the ACC