behavioral risk factor surveillance system annual ... · behavioral risk factor surveillance system...
TRANSCRIPT

2016 Behavioral Risk Factor Surveillance System Annual Prevalence Report Mississippi State Department of Health 570 East Woodrow Wilson Drive P. O. Box 1700 Jackson, MS 39215-1700

Mississippi Behavioral Risk Factor Surveillance Survey
2016 Prevalence Report
August 19, 2017

Mississippi Behavioral Risk Factor Surveillance Survey 2016 iii
Table of Contents
Table of Contents ........................................................................................................ iii
Introduction .................................................................................................................. v
Methodology ................................................................................................................ vi
Definition of Terms and Risk Factors ....................................................................... ix
Survey Results .............................................................................................................. 1
Health Status .................................................................................................................... 2
Health Care Coverage ...................................................................................................... 5
Healthy Days ................................................................................................................... 9
Tobacco Use .................................................................................................................. 14
E-Cigarettes ................................................................................................................... 16
Diabetes ......................................................................................................................... 20
Cardiovascular Disease.................................................................................................. 23
Asthma ........................................................................................................................... 28
Arthritis .......................................................................................................................... 32
Depression ..................................................................................................................... 35
Cancer Prevalence ......................................................................................................... 38
Chronic Obstructive Pulmonary Disease ....................................................................... 43
Kidney Disease .............................................................................................................. 46
Breast Cancer Screening ................................................................................................ 49
Cervical Cancer Screening ............................................................................................ 55
Prostate Cancer Screening ............................................................................................. 59
Colorectal Cancer Screening ......................................................................................... 63
Immunization ................................................................................................................. 67
Overweight and Obesity ................................................................................................ 73
Exercise ......................................................................................................................... 77
Oral Health .................................................................................................................... 80
Disability ....................................................................................................................... 84
Alcohol Consumption .................................................................................................... 88
Mississippi Behavioral Risk Factor Surveillance Survey 2016 iv
Drinking and Driving .................................................................................................... 92
Falls ............................................................................................................................... 94
Seat Belt Use ................................................................................................................. 99
Sleep ............................................................................................................................ 102
HIV/AIDS .................................................................................................................... 105

Mississippi Behavioral Risk Factor Surveillance Survey 2016 v
Introduction
It is generally agreed among health care professionals that certain conditions and
behavior patterns are associated with disease, injury and death. Some examples are
cigarette smoking, physical inactivity, obesity, alcohol consumption and risky sexual
behavior. The Behavioral Risk Factor Surveillance System (BRFSS) is a random sample
telephone survey designed to estimate the prevalence of these and other health risk
factors by each state in the United States. The results provide a tool for evaluating health
trends, assessing the impact of chronic disease, along with measuring the effectiveness of
policies, programs, intervention strategies and awareness campaigns.
The BRFSS is a cooperative agreement between the Centers for Disease Control and
Prevention (CDC) and the Mississippi State Department of Health (MSDH). The first
survey was completed in 1984 when the data was collected at one given point in time.
The survey was repeated in 1988 using the same methodology. Beginning in 1990 there
has been an annual survey with the data being collected monthly.
The BRFSS survey contains a set of core questions provided by the CDC to gather
comprehensive standard information nationwide. The questions are related to health
status, access to health care, health awareness, lifestyle, preventive health and chronic
health conditions. Individual states are allowed to include optional module questions
addressing specific issues that may be of particular concern to that state.

Mississippi Behavioral Risk Factor Surveillance Survey 2016 vi
Methodology
A. SAMPLING DESIGN
The Mississippi BRFSS is a random sample telephone survey. Utilizing a
disproportionate stratified sample (DSS) design with random digit dialing and the
Computer Assisted Telephone Interviewing (CATI) system, the survey has the potential
to represent all households in Mississippi that have telephones which according to the
United States Census Bureau, Housing and Household Economic Statistics Division is
approximately 94.5 percent. A sample size of 5,135 interviews over a 12-month period
was selected to obtain a 95 percent confidence interval of ±2.5% on risk factor
prevalence estimates in the adult population. Prevalence estimates by individual
demographic variables, comprising smaller sample sizes, do not achieve the same level of
accuracy as the total sample.
Until the 2011 survey, the BRFSS had relied exclusively on interviews of households
with only land line phones. But the number of households with only cell phones
increased by more than 700 percent between 2003 and 2009. The National Health
Interview Survey (NHIS) reports that approximately 51 percent of American homes now
have only cellular telephones. The NHIS reports that the rate in Mississippi for 2015 was
57.7 percent. This trend has been especially strong among younger adults and those in
social and ethnic minority groups. The 2016 Mississippi BRFSS has approximately 39
percent land line and 61 percent cell phone households in the survey.
For land line surveys, interviewers, contracted by the MSDH, contact the residences
during weekdays between 9:00 a.m. and 9:00 p.m. and Saturdays between 10:00 a.m. and
4:30 p.m. After a residence has been contacted, one adult (18 years of age or older) is
randomly selected to be interviewed from all adults residing in the household. The
majority of interviews are collected over a two-week period each month of the survey
year.
For cell phone surveys, the same protocol is followed except that the interviewer
establishes that the person answering the phone is at least 18 years old, that it is safe for
the respondent to be interviewed and that the person uses the cell phone for at least 90
percent of their telephone service.
B. QUESTIONNAIRE
The questionnaire, designed through cooperative agreements with the CDC, is
divided into three sections. The first section contains questions on health risk behavior;
the second section contains demographic information; and the third contains optional
modules covering topics of particular interest to the state.

Mississippi Behavioral Risk Factor Surveillance Survey 2016 vii
C. DATA ANALYSIS
A recent, significant change in the BRFSS has been the introduction of a different
weighting method known as iterative proportional fitting, also referred to as “raking.”
The procedure, while not new, has been made feasible through the development of ultra-
fast computer processors. The current weighting methodology was first used in the 2011
survey.
In addition to the standard age, gender, race and ethnicity variables, the use of raking
allows for consideration of demographic variables such as education level, marital status,
renter or owner status, and phone source. Inclusion of these additional variables in the
weighting process will allow the survey to more accurately reflect Mississippi’s adult
population. The data collected by the MSDH Office of Public Health Statistics was
edited and weighted by the CDC. Weighted counts are based on the 2015 Mississippi
population estimates to accurately reflect the population demographics.
Therefore, the estimated prevalence of any risk factor from the survey represents the
total population of Mississippi residents very well. The reader should be aware that the
numbers presented in the tables of this report reflect the actual, non-weighted
observations for each cell while the percentages in each cell represent the weighted
prevalence.
This report presents the weighted percentage of high-risk behaviors, conditions and
certain chronic diseases by gender, age group, race, education level, annual household
income, and employment status. Respondents who either refused to answer or did not
know the answer to the questions on demographics were excluded from the tables. For
this reason the total for each of the demographic sections may not be equal to the total for
the entire table.
D. LIMITATIONS OF THE DATA
All data collection systems are subject to error, and records may be incomplete or
contain inaccurate information. All information in this survey is self-reported; people
may not remember essential information, a question may not mean the same thing to
different respondents, and some individuals may not respond at all. It is not always
possible to measure the magnitude of these errors or their impact on the data. The user
must be the final arbiter in evaluating the data.
E. SAMPLE SIZE
In the 2016 BRFSS, 5,135 people were sampled: 2,005 landline surveys and 3,130
cell phone surveys. The reader should note that sample sizes by question and response
category may vary because of non-response and skip patterns within the survey
instrument. Overall estimates generally have relatively small sampling errors, but
estimates for certain population subgroups may be based on small numbers and have
relatively large sampling errors. Interpreting estimates that are based on small numbers
can mislead the reader into believing that a given finding is more precise than it actually
is. When the number of events is small and the probability of such an event is small,

Mississippi Behavioral Risk Factor Surveillance Survey 2016 viii
considerable caution should be observed in interpreting the estimates or differences
among groups. The BRFSS recommends not interpreting percentages where the
denominator is based upon fewer than 50 non-weighted respondents. In the tables of the
report, such results are marked with an asterisk that indicates a sample size less than 50
for the particular cell in the table.
So that a more accurate portrait of local health conditions may be obtained, the
MSDH stratifies the BRFSS sample by its nine public health districts. Stratification
allows weighting of the data which produces a more precise estimate of health conditions
in each district from the BRFSS. For the data to be weighted, a minimum of 500
completed surveys is required.

Mississippi Behavioral Risk Factor Surveillance Survey 2016 ix
Definition of Terms and Risk Factors
Alcohol Consumption
Binge Drinking Risk Factor – Respondents who report they have had at least five
drinks on one or more occasion during the past thirty days.
Heavy Drinking Risk Factor – Male respondents who report having more than two
drinks per day and female respondents who report having more than one drink per
day during the past thirty days.
Drinking and Driving – Respondents who report they have driven a vehicle after they
have had too much to drink
Arthritis
Diagnosed with Arthritis – Respondents who report they have been diagnosed with
arthritis by a health care professional.
Asthma
Asthma Awareness – Respondents who report being told they have asthma by a
doctor, nurse or other health professional.
Current Asthma – Respondents who report being told they have asthma by a doctor,
nurse or other health professional and who still suffer from the condition.
Breast Cancer Screening
Mammogram Age 40+ – Female respondents, age 40 and older, who report they have
had a mammogram within the past two years,
Mammogram Age 50+ – Female respondents, age 50 and older, who report they have
had a mammogram within the past two years.
Cancer
Skin Cancer – Respondents who report a diagnosis of skin cancer by a health care
professional.
Other Cancer – Respondents who report a diagnosis of cancer other than skin cancer
by a health care professional.
Cervical Cancer Screening
Pap Smear – Female respondents, age 18 and older, who have not had a hysterectomy
and who report they have ever had a pap smear.
Pap Smear Within 3 Years – Female respondents, age 18 and older, who have not had
a hysterectomy and who report they have a pap smear within the last three years.

Mississippi Behavioral Risk Factor Surveillance Survey 2016 x
Colorectal Cancer Screening
Colonoscopy or Sigmoidoscopy – Respondents age 50 and older who report they have
ever had a sigmoidoscopy or colonoscopy test.
Blood Stool Test – Respondents age 50 and older who report they have not had a fecal
occult blood (FOBT) test in the past two years.
Cardiovascular Disease
Heart Attack – Respondents who report they have ever been diagnosed with a heart
attack.
Stroke – Respondents who report they have ever been diagnosed with a stroke.
Coronary Heart Disease – Respondents who report they have ever been diagnosed
with angina or coronary heart disease.
Chronic Obstructive Pulmonary Disease (COPD)
COPD – Respondents who report ever being diagnosed with COPD by a health care
professional.
Diabetes
Diabetes Awareness – Respondents who report they have ever been told by a doctor
they have diabetSes. Female respondents diagnosed with diabetes only during
pregnancy are not included.
Disability
Disabled – Respondents who report that because of a physical, mental or emotional
condition they are 1) deaf or have serious difficulty hearing, 2) are blind or have
serious difficulty seeing, 3) have difficulty concentrating, remembering or making
decisions, 4) have difficulty walking or climbing stairs, 5) have difficulty dressing or
bathing, or 6) have difficulty doing errands alone such as visiting a doctor or
shopping.
Exercise
Exercise in Last 30 Days – Respondents who report that, excluding their regular job,
in the past 30 days they participated in any physical activity or exercise such as
running, walking, calisthenics, golf, or gardening.
Falls
Falls – Respondents, age 45 and older, who report they have sustained one or more
falls in the past twelve months.
Injury From Falls – Respondents, age 45 and older, who report that the fall limited
their regular activities for at least one day or required them to see a doctor.

Mississippi Behavioral Risk Factor Surveillance Survey 2016 xi
Health Insurance
Health Care Coverage – Respondents age 18 to 64 who report they have no health
care coverage, including health insurance, Health Maintenance Organizations, or
Medicare.
Unable to See a Doctor – Respondents who report they needed to see a doctor within
the past 12 months but who were unable because of the cost.
Health Status
Self-Reported Health Status – Respondents who report their general health status is
fair or poor.
Healthy Days
Physical Health – Respondents who report their physical health was not good for
more than seven days during the past month.
Mental Health – Respondents who report their mental health was not good for more
than seven days during the past month.
Activities Limited – Respondents who report they could not perform their normal
activities because of poor physical or mental health for more than seven days during
the past month.
HIV/AIDS
Never Tested for HIV – Respondents age 18 to 64 who report they have never been
tested for HIV, excluding tests done as part of a blood donation.
Immunization
Flu Shots – Respondents who report they received a flu shot or the flu spray vaccine
within the last twelve months.
Pneumonia Shots – Respondents who report they have ever received a pneumonia
shot.
Kidney Disease
Kidney Disease – Respondents who report being diagnosed with kidney disease other
than kidney stones, bladder infections or incontinence.
Mental Health
Depression Disorder – Respondents who report they have ever been diagnosed with a
depressive disorder.

Mississippi Behavioral Risk Factor Surveillance Survey 2016 xii
Oral Health
Permanent Teeth Extracted – Respondents who report they have had at least one of
their permanent teeth extracted excluding extraction because of injury or
orthodontics.
Dental Visits – Respondents who report that their last visit to a dentist was more than
one year ago.
Prostate Cancer
Prostate Cancer Screening – Males, age 40 and older, who report they have ever had
a prostate specific antigen (PSA) test.
Seat Belt Use
Seat Belt Usage – Respondents who report always or nearly always wearing seat
belts.
Sleep
Inadequate Sleep – Respondents age 18 - 21 who report less than eight hours of sleep
per day and respondents age 22 and older who report less than seven hours per day.
Smoking
Cigarette Smoker – Respondents who have ever smoked 100 cigarettes in their
lifetime and report currently smoking every day or some days. The Healthy People
2020 Objective is ≤12%.
E-Cigarette User – Respondents who have ever smoked an e-cigarette.
Current E-Cigarette User – Respondents who have ever smoked an e-cigarette and
who currently smoke e-cigarettes.
Weight Based on Body Mass Index (BMI)
Healthy Weight: – Respondents whose body mass index (BMI) is 18.5 ≤ BMI < 25.
This measures Healthy People 2020 Objective 19.1 – Target ≥60%.
Overweight – Respondents whose body mass index (BMI) is 25.0 ≤ BMI < 30.
Obese – Respondents whose body mass index (BMI) ≥30.0. This measures Healthy
People 2020 Objective 19.2 – Target ≤15%
.

Mississippi Behavioral Risk Factor Surveillance Survey 2016
Survey Results

Mississippi Behavioral Risk Factor Surveillance Survey 2016
2
Health Status
Survey Question
Would you say that in general your health is excellent, very good,
good, fair, or poor?
The questions related to
general health in the survey
attempt to determine how
people view their personal
health and how well they
function physically,
psychologically and socially
while engaged in normal, daily
activities. The questions are
important because they may
indicate dysfunction and
disability not measured in
standard morbidity and
mortality data.
Both white and black
females reported their health as
worse than males (Figure
1). Black respondents
report their health as worse than whites. Black respondents reported fair or poor health at
a rate of 25.9 percent compared to 22.0 percent for whites. Older respondents reported
fair or poor health at a much higher rate than the younger ones. Persons in the 18 to 24
age group reported a rate of 5.9 percent while those more than 65 years of age reported a
rate of 36.4 percent (Table 1).
Figure 1
0
5
10
15
20
25
30
Male Female Total
Pe
rce
nt
General Health Fair or Poor By Race and Sex
White
Black

Mississippi Behavioral Risk Factor Surveillance Survey 2016
3
Figure 2
0
10
20
30
40
50
60
Pe
rce
nt
General Health Fair or Poor By Race and Income Groups
White
Black

Mississippi Behavioral Risk Factor Surveillance Survey 2016
4
Table 1: General Health Fair or Poor
White Black Total
Groups Number1 Percent2 Number1 Percent2 Number1 Percent2
Sex
Male 259 20.1 191 22.7 459 20.7
Female 474 23.9 380 28.5 870 25.6
Age Group
18-24 7 6.0 6 3.9 14 5.9
25-34 25 10.2 31 13.1 57 11.1
35-44 51 16.4 59 20.9 113 18.1
45-54 100 25.5 113 33.5 217 28.0
55-64 180 29.7 181 43.5 369 34.8
65+ 366 33.5 177 44.4 551 36.4
Education
< High School Graduate 151 43.3 180 46.5 337 43.9
High School Graduate or GED 268 21.6 203 22.6 477 21.5
Some College or Technical School 213 21.8 113 20.5 332 21.3
College Graduate 100 7.5 74 15.1 181 9.9
Income
< $15,000 141 56.0 216 49.8 366 53.0
$15-$24,999 175 30.5 160 26.3 336 27.7
$25-$34,999 77 25.4 43 19.0 128 22.7
$35-$49,999 61 13.9 32 13.9 95 13.6
$50-$74,999 56 15.0 18 11.8 75 14.1
$75,000+ 52 7.7 9 9.9 63 7.9
Employment Status
Employed 133 11.0 115 11.7 255 11.3
Not Employed 34 22.0 32 25.2 66 23.1
Student/Homemaker 33 8.9 15 11.2 48 9.1
Retired/Unable to Work 532 43.2 408 54.6 957 47.3
Total 733 22.0 571 25.9 1,329 23.3
1Unweighted
2Weighted

Mississippi Behavioral Risk Factor Surveillance Survey 2016
5
Health Care Coverage
Survey Question
Do you have any kind of health care coverage, including health
insurance, prepaid plans such as HMOs, or government plans such as
Medicare?
The questions in this
section are designed to
estimate the number of
people who cannot obtain
the health care they need
because they are not
covered by a health care
plan or other health
insurance. The survey
limits this question to
those between the ages of
18 and 64 since most
people age 65 and older
have some kind of health
insurance coverage.
In 2016, 20.1 percent of
respondents between the ages
of 18 and 64 indicated they had no health care plan. According to the survey, black
0
10
20
30
40
Male Female Total
Pe
rce
nt
No Health Insurance By Race and Sex (Age 18-64)
White
Black
Figure 3
0
10
20
30
40
50
Pe
rce
nt
No Health Insurance By Race and Age Group (Age 18-64)
White
Black
Figure 4

Mississippi Behavioral Risk Factor Surveillance Survey 2016
6
males have the highest rate of non-coverage at 29.6 percent; black females were next at
20.4 percent (Figure 3). When viewed by levels of income, white respondents reporting
an annual income between of less than $15,000 annually had a non-coverage rate of 41.5
percent followed by blacks reporting an annual income of less than $15,000 with a rate of
36.8 percent.
Figure 5
With respect to age groups, blacks age 18-24 reported the highest rate non-coverage
at 32.9 percent. With respect to levels of education, blacks who did not complete high
school reported a rate of 39.3 percent (Table 2). Overall blacks with no health insurance
had a rate of 24.6 percent while whites reported a rate of 17.2 percent.
0
10
20
30
40
50
Pe
rce
nt
No Health Insurance By Race and Income Group (Age 18-64)
White
Black

Mississippi Behavioral Risk Factor Surveillance Survey 2016
7
Table 2: Have No Health Care Coverage
White Black Total
Groups Number1 Percent2 Number1 Percent2 Number1 Percent2
Sex
Male 128 18.6 130 29.6 265 22.7
Female 145 15.8 153 20.4 303 17.6
Age Group
18-24 29 21.4 36 32.9 66 25.7
25-34 58 20.8 64 26.6 125 23.0
35-44 50 17.9 61 22.4 114 19.9
45-54 74 18.4 55 20.6 132 19.4
55-64 62 9.4 67 20.7 131 13.3
Education
< High School Graduate 49 30.6 64 39.3 117 35.1
High School Graduate or GED 107 22.7 130 29.0 241 25.1
Some College or Technical School 78 14.0 55 18.6 135 15.6
College Graduate 38 6.2 34 10.2 74 7.3
Income
< $15,000 57 41.5 91 36.8 152 39.6
$15-$24,999 69 28.7 100 30.3 173 29.3
$25-$34,999 39 26.2 17 13.0 57 18.9
$35-$49,999 26 13.4 19 19.9 47 17.0
$50-$74,999 14 5.7 2 1.7 16 4.6
$75,000+ 18 3.9 8 9.2 26 4.7
Employment Status
Employed 145 15.9 150 22.3 304 18.6
Not Employed 47 44.4 58 54.8 105 48.6
Student/Homemaker 37 18.4 16 23.3 55 19.8
Retired/Unable to Work 44 12.9 58 19.1 103 15.5
Total 273 17.2 283 24.6 568 20.1
1Unweighted
2Weighted

Mississippi Behavioral Risk Factor Surveillance Survey 2016
8
Table 3: Unable to See Doctor in Past 12 Month Because of Cost
White Black Total
Groups Number1 Percent2 Number1 Percent2 Number1 Percent2
Sex
Male 140 13.5 123 22.7 269 16.4
Female 264 18.2 273 26.6 550 21.5
Age Group
18-24 24 18.2 29 26.5 54 20.9
25-34 54 18.6 64 25.5 121 20.9
35-44 70 23.4 79 29.0 154 26.1
45-54 93 20.9 84 30.0 182 24.1
55-64 107 16.1 97 26.4 206 19.6
65+ 51 4.9 41 10.3 95 6.5
Education
< High School Graduate 79 27.5 77 30.5 159 28.0
High School Graduate or GED 134 17.1 158 24.2 297 19.8
Some College or Technical School 117 14.2 100 26.2 222 18.3
College Graduate 73 8.4 61 14.9 140 10.6
Income
< $15,000 82 32.9 119 34.7 204 33.3
$15-$24,999 106 26.9 138 30.9 248 28.5
$25-$34,999 47 21.0 37 18.4 88 19.5
$35-$49,999 44 15.6 31 19.1 78 17.1
$50-$74,999 32 7.9 6 5.7 39 7.4
$75,000+ 28 5.3 6 11.1 35 6.4
Employment Status
Employed 159 14.1 187 23.6 356 17.6
Not Employed 54 44.0 47 47.3 101 44.6
Student/Homemaker 42 18.2 19 24.6 64 20.3
Retired/Unable to Work 148 14.4 142 21.8 296 17.0
Total 404 15.9 396 24.9 819 19.1
1Unweighted
2Weighted

Mississippi Behavioral Risk Factor Surveillance Survey 2016
9
Healthy Days
Survey Question
1. Now thinking about your physical health, which includes physical
illness and injury, for how many days during the past 30 days was
your physical health not good?
2. Now thinking about your mental health, which includes stress,
depression, and problems with emotions, for how many days during
the past 30 days was your mental health not good?
In both public and private medicine, the concept of health-related quality of life
refers to the physical and mental health perceived by a person or a group of persons.
Health care professionals have often used health-related quality of life to measure the
effects of chronic illness in patients to better understand how an illness interferes with the
day-to-day life activities of an individual.
Figure 6
Similarly, health professionals use health-related quality of life to measure the
effects of numerous disorders, short-term and long-term disabilities, and diseases in
different populations. Tracking health-related quality of life in different populations can
aid in identifying subgroups with poor physical or mental health and can help in
developing policies or interventions to improve their health.
0
10
20
30
40
Pe
rce
nt
Physical Health Not Good for More Than 7 Days in Past Month
By Race and Age Group
White
Black
Mississippi Behavioral Risk Factor Surveillance Survey 2016
10
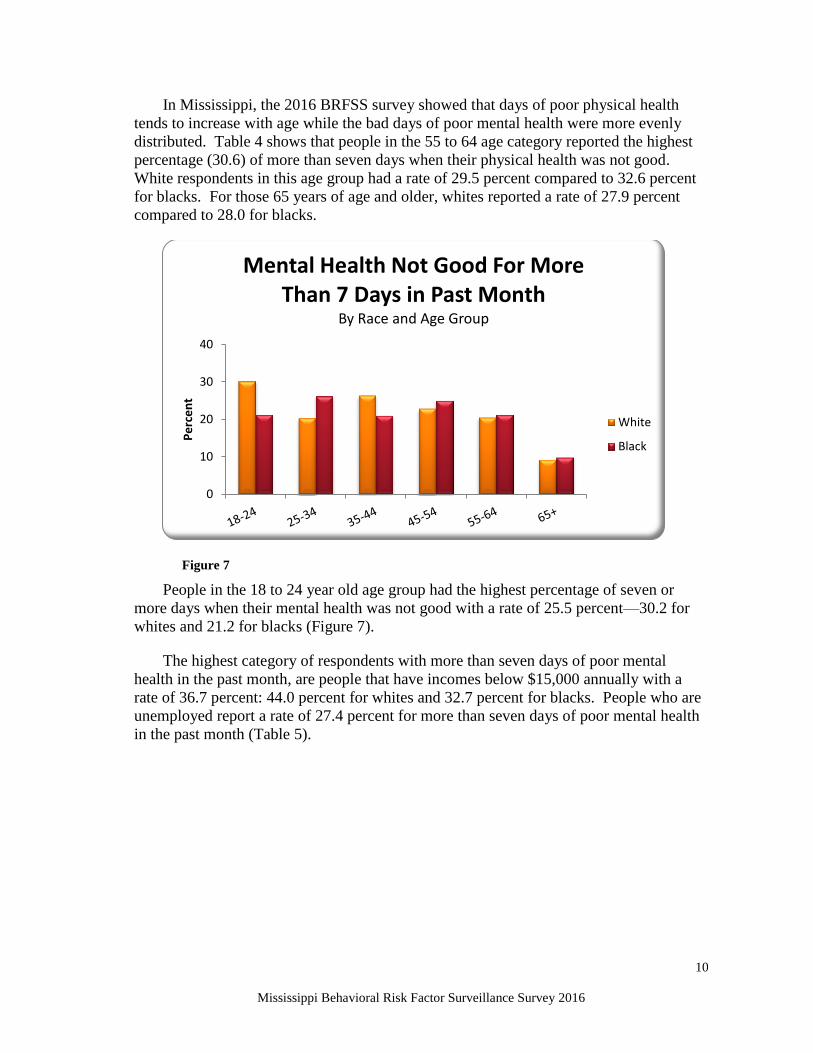
In Mississippi, the 2016 BRFSS survey showed that days of poor physical health
tends to increase with age while the bad days of poor mental health were more evenly
distributed. Table 4 shows that people in the 55 to 64 age category reported the highest
percentage (30.6) of more than seven days when their physical health was not good.
White respondents in this age group had a rate of 29.5 percent compared to 32.6 percent
for blacks. For those 65 years of age and older, whites reported a rate of 27.9 percent
compared to 28.0 for blacks.
Figure 7
People in the 18 to 24 year old age group had the highest percentage of seven or
more days when their mental health was not good with a rate of 25.5 percent—30.2 for
whites and 21.2 for blacks (Figure 7).
The highest category of respondents with more than seven days of poor mental
health in the past month, are people that have incomes below $15,000 annually with a
rate of 36.7 percent: 44.0 percent for whites and 32.7 percent for blacks. People who are
unemployed report a rate of 27.4 percent for more than seven days of poor mental health
in the past month (Table 5).
0
10
20
30
40
Pe
rce
nt
Mental Health Not Good For More Than 7 Days in Past Month
By Race and Age Group
White
Black

Mississippi Behavioral Risk Factor Surveillance Survey 2016
11
Table 4: Physical Health Not Good for More Than 7 Days in Past Month
White Black Total
Groups Number1 Percent2 Number1 Percent2 Number1 Percent2
Sex
Male 187 18.6 109 16.6 305 17.6
Female 353 23.5 212 22.4 573 23.0
Age Group
18-24 11 8.0 9 11.7 22 9.9
25-34 22 8.8 14 8.8 36 8.4
35-44 44 21.3 32 12.7 78 17.7
45-54 70 23.4 72 28.2 148 25.0
55-64 145 29.5 102 32.6 250 30.6
65+ 246 27.9 90 28.0 340 28.0
Education
< High School Graduate 100 34.7 83 31.2 186 32.1
High School Graduate or GED 198 22.0 115 17.3 321 19.8
Some College or Technical School 154 20.6 73 19.0 230 19.9
College Graduate 88 10.2 49 10.8 140 10.9
Income
< $15,000 110 51.8 116 33.7 233 41.4
$15-$24,999 131 31.2 83 21.2 214 25.7
$25-$34,999 47 18.5 26 12.7 75 15.3
$35-$49,999 48 17.8 24 18.2 73 17.5
$50-$74,999 40 12.2 13 7.7 54 11.0
$75,000+ 44 7.9 7 4.3 52 7.4
Employment Status
Employed 82 8.8 67 9.5 154 9.1
Not Employed 24 24.7 10 6.9 34 16.0
Student/Homemaker 27 8.4 10 17.5 38 10.5
Retired/Unable to Work 407 42.5 234 43.2 651 42.7
Total 540 21.0 321 19.7 878 20.3
1Unweighted
2Weighted

Mississippi Behavioral Risk Factor Surveillance Survey 2016
12
Table 5: Mental Health Not Good for More Than 7 Days in Past Month
White Black Total
Groups Number1 Percent2 Number1 Percent2 Number1 Percent2
Sex
Male 139 15.8 81 14.8 228 15.2
Female 280 23.8 205 26.1 495 24.7
Age Group
18-24 29 30.2 15 21.2 45 25.5
25-34 50 20.4 47 26.2 100 22.2
35-44 61 26.4 51 21.0 115 23.7
45-54 74 22.9 65 25.0 144 23.5
55-64 106 20.5 70 21.2 177 20.6
65+ 98 9.2 35 9.8 138 9.7
Education
< High School Graduate 68 28.5 53 24.9 126 26.1
High School Graduate or GED 134 20.4 108 19.6 248 19.9
Some College or Technical School 135 21.3 78 22.2 215 21.4
College Graduate 82 10.2 47 15.0 134 11.9
Income
< $15,000 86 44.0 97 32.7 187 36.7
$15-$24,999 93 29.2 69 18.6 166 24.0
$25-$34,999 46 22.8 25 19.4 74 21.0
$35-$49,999 44 17.9 29 24.5 74 19.6
$50-$74,999 44 13.4 16 12.2 61 12.9
$75,000+ 31 7.2 7 7.9 38 7.1
Employment Status
Employed 125 14.1 107 16.6 238 14.8
Not Employed 34 28.0 20 28.0 54 27.4
Student/Homemaker 42 26.9 14 27.0 59 26.6
Retired/Unable to Work 218 25.2 145 26.3 371 25.7
Total 419 19.8 286 21.0 723 20.0
1Unweighted
2Weighted

Mississippi Behavioral Risk Factor Surveillance Survey 2016
13
Table 6: Activities Limited More Than 7 Days in Past Month Due to Physical or Mental Health*
White Black Total
Groups Number1 Percent2 Number1 Percent2 Number1 Percent2
Sex
Male 113 25.7 71 33.6 191 28.1
Female 221 29.9 127 22.7 357 27.2
Age Group
18-24 6 6.7 6 18.7 12 10.8
25-34 18 15.4 14 19.0 35 17.7
35-44 36 30.1 21 21.4 58 26.7
45-54 62 40.9 55 35.7 122 38.9
55-64 103 41.2 55 34.8 159 38.9
65+ 108 26.7 47 31.2 161 28.6
Education
< High School Graduate 62 36.3 48 33.0 113 34.7
High School Graduate or GED 111 28.6 76 28.4 194 28.8
Some College or Technical School 106 29.4 51 24.9 160 27.9
College Graduate 55 14.7 23 13.3 81 14.8
Income
< $15,000 77 53.2 78 38.6 162 45.5
$15-$24,999 86 40.9 50 26.8 137 34.3
$25-$34,999 32 27.6 14 15.4 48 23.5
$35-$49,999 24 16.4 13 21.1 38 17.7
$50-$74,999 26 21.4 7 7.5 34 18.5
$75,000+ 24 12.5 3 17.6* 27 13.0
Employment Status
Employed 48 12.0 34 13.0 84 12.3
Not Employed 23 39.9* 11 27.0* 34 33.5
Student/Homemaker 17 11.8* 6 13.6* 25 13.1
Retired/Unable to Work 246 48.8 147 46.3 404 48.2
Total 334 28.0 198 26.6 548 27.6
1Unweighted
2Weighted
* Denominator is those who had more than 7 days of poor physical or mental health in past month

Mississippi Behavioral Risk Factor Surveillance Survey 2016
14
0
5
10
15
20
25
30
Male Female Total
Pe
rce
nt
Current Smokers By Race and Sex
White
Black
Tobacco Use
Survey Question
Have you smoked at least 100 cigarettes in your entire life and do you
now smoke cigarettes every day, some days, or not at all?
Tobacco use is the single leading preventable cause of death in Mississippi and the
United States. Each year, about one-fifth of the deaths in Mississippi are from tobacco-
related causes. Health problems related to tobacco use include cancers, lung disease, and
heart disease. Over the
past decade the percentage
of current adult smokers
has not changed
significantly. During the
same period smokeless
tobacco and cigar use
among adults has
increased. Mississippi was
the first state to reach a
settlement with the tobacco
industry. The Mississippi
State Department of Health
has drafted a state tobacco
plan that includes strategies
to prevent initiation of
tobacco use among youth,
promote cessation among
youth and adults, and
eliminate exposure to
environmental tobacco smoke.
According to the 2016 BRFSS report, the group with the highest percentage of
current smokers is white respondents whose annual income is less than $15,000 who
report a rate of 42.9 percent. The second highest are white respondents that are
unemployed with a rate of 39.4 percent. The group with the lowest percentage in
demographic groups for current smokers is black respondents who are college graduates
with a rate of 7.9 percent (Table 7). Overall, the rate of current smoking in Mississippi is
22.8 percent; the rate in 2015 was 22.6 percent. The Healthy People 2020 objective is 12
percent or less.
Figure 8

Mississippi Behavioral Risk Factor Surveillance Survey 2016
15
Table 7: Current Smokers
White Black Total
Groups Number1 Percent2 Number1 Percent2 Number1 Percent2
Sex
Male 232 23.0 170 26.8 413 24.4
Female 329 24.8 142 15.7 483 21.3
Age Group
18-24 39 32.8 13 16.1 53 25.4
25-34 85 28.9 49 26.2 138 27.0
35-44 74 26.0 49 19.8 128 24.3
45-54 109 28.8 67 25.1 181 27.6
55-64 133 24.1 86 23.2 224 24.0
65+ 118 12.0 48 12.2 169 12.0
Education
< High School Graduate 104 38.4 83 32.6 192 36.0
High School Graduate or GED 187 25.5 127 23.5 320 24.4
Some College or Technical School 187 24.7 68 15.4 260 21.5
College Graduate 82 9.5 33 7.9 122 9.6
Income
< $15,000 94 42.9 79 25.3 179 33.6
$15-$24,999 121 33.1 98 22.9 224 28.0
$25-$34,999 53 22.2 26 16.8 83 20.1
$35-$49,999 66 22.0 27 15.4 94 19.2
$50-$74,999 60 19.7 10 9.3 72 17.6
$75,000+ 73 16.2 14 11.9 91 16.1
Employment Status
Employed 242 23.9 144 20.7 400 23.0
Not Employed 46 39.4 30 32.5 77 35.3
Student/Homemaker 49 21.4 6 8.4 56 17.6
Retired/Unable to Work 224 22.7 132 20.2 363 21.8
Total 561 23.9 312 20.6 896 22.8
1Unweighted
2Weighted

Mississippi Behavioral Risk Factor Surveillance Survey 2016
16
E-Cigarettes
Survey Question
Have you ever used an e-cigarette or other electronic “vaping”
product, even just one time, in your entire life?
Do you now use e-cigarettes or other electronic “vaping” products
every day, some days, or not at all?
Electronic cigarettes (or
e-cigarettes) are an
alternative nicotine delivery
system. According to the
CDC, smoking tobacco is
responsible for one out of
every five deaths in the
United States. The
ingredients which cause
smoking-related illnesses
are not the important
components in an e-
cigarette. Smokers inhale
tar, carbon monoxide,
arsenic, formaldehyde and
other carcinogens to gain
access to nicotine. One of
the appeals of e-cigarettes is
that there is less risk for gaining
access to nicotine.
Rather than burning tobacco leaves to produce the smoke of cigarettes, e-cigarettes
use pure pharmaceutical-grade nicotine which is heated to produce a vapor. And because
the ingredients in it can be controlled, the number of chemicals that smokers consume is
drastically reduced.
Electronic cigarettes have been marketed to smokers as a way to help them quit, but
to date there is no evidence that they actually help people stop smoking. E-cigarettes have
been found to be a health risk for people who use them, as well as for bystanders who
breathe in the second and third-hand vapor.
In the 2016 Mississippi BRFSS survey, 22.4 percent of the respondents reported that
they have ever smoked an e-cigarette. White respondents age 18 to 24 had by far the
0.0
5.0
10.0
15.0
20.0
25.0
30.0
35.0
Male Female Total
Pe
rce
nt
Ever Smoked an E-Cigarette By Race and Sex
White
Black
Figure 9

Mississippi Behavioral Risk Factor Surveillance Survey 2016
17
highest usage of e-cigarettes with a rate of 50.4 percent. The next highest rate was
reported by white respondents in the 25-34 age-group at 48.0 percent. Whites had overall
usage rate of 26.7 percent compared to only 14.8 percent for blacks.
Of those who
reported ever having
smoked an e-cigarette,
21.0 percent said that
they continue to smoke
them. The highest rate
for current users of e-
cigarettes is among black
respondent in the 45-54
age category who
reported a rate of 41.4
percent followed by
blacks age 18-24 with a
rate of 34.6 percent.
Blacks age 25-34 were
next with a rate of 29.5
percent. Overall, blacks
reported a usage rate of
26.7 percent while white
reported of rate of 18.6
percent.
White males had the lowest rate of current e-cigarette usage with a rate of 18.0 percent.
Next were white females with a rate of 19.4 percent followed by black females at 24.1
percent. Black males reported a rate of 28.9 percent.
0.0
5.0
10.0
15.0
20.0
25.0
30.0
35.0
Male Female Total
Pe
rce
nt
Smoke E-Cigarettes Now By Race and Sex
White
Black
Figure 10

Mississippi Behavioral Risk Factor Surveillance Survey 2016
18
Table 8: Ever Smoked an E-Cigarette
White Black Total
Groups Number1 Percent2 Number1 Percent2 Number1 Percent2
Sex
Male 243 28.7 105 18.0 360 25.3
Female 296 24.7 107 12.3 410 19.7
Age Group
18-24 66 50.4 29 27.6 99 40.0
25-34 122 48.0 52 21.0 180 36.5
35-44 85 31.6 26 9.5 114 22.1
45-54 91 22.4 38 16.2 131 19.9
55-64 100 17.8 49 10.8 152 15.4
65+ 74 8.2 18 4.4 93 7.2
Education
< High School Graduate 74 29.7 40 13.7 118 22.4
High School Graduate or GED 177 27.2 69 15.2 253 22.6
Some College or Technical School 200 34.4 53 15.2 258 27.8
College Graduate 88 11.0 50 15.0 141 12.3
Income
< $15,000 75 33.6 44 15.5 123 22.9
$15-$24,999 103 31.0 52 12.7 160 22.6
$25-$34,999 50 26.1 28 19.9 80 22.5
$35-$49,999 62 27.0 24 16.9 88 24.0
$50-$74,999 68 29.4 14 14.3 83 26.1
$75,000+ 80 18.6 12 8.6 94 17.3
Employment Status
Employed 270 30.5 108 15.9 389 24.9
Not Employed 37 37.9 21 15.8 59 26.3
Student/Homemaker 54 29.8 15 23.9 72 28.5
Retired/Unable to Work 178 18.5 67 10.8 249 15.8
Total 539 26.7 212 14.8 770 22.4
1Unweighted
2Weighted

Mississippi Behavioral Risk Factor Surveillance Survey 2016
19
Table 9: Smoke E-Cigarette Now3
White Black Total
Groups Number1 Percent2 Number1 Percent2 Number1 Percent2
Sex
Male 42 18.0 21 28.9 67 21.4
Female 65 19.4 24 24.1 90 20.5
Age Group
18-24 13 21.9 8 34.6 22 25.8
25-34 18 12.4 15 29.5 34 16.4
35-44 21 20.7 2 6.6 25 20.2
45-54 19 19.5 11 41.4 31 26.6
55-64 19 22.1 6 5.9 25 17.9
65+ 16 19.7 3 11.7 19 18.2
Education
< High School Graduate 11 14.6 6 24.4* 17 16.8
High School Graduate or GED 26 14.7 17 27.8 45 19.0
Some College or Technical School 42 20.2 12 30.6 56 22.4
College Graduate 28 31.6 10 18.7 39 28.3
Income
< $15,000 15 18.2 11 20.8* 26 18.9
$15-$24,999 15 13.5 8 15.1 25 14.6
$25-$34,999 15 27.2 7 38.4* 23 31.9
$35-$49,999 12 17.8 8 59.8* 20 26.9
$50-$74,999 13 17.2 2 3.2* 15 15.3
$75,000+ 18 19.1 4 37.4* 24 24.6
Employment Status
Employed 60 20.5 22 26.1 86 22.2
Not Employed 8 21.4* 6 33.5* 14 24.8
Student/Homemaker 6 9.7 5 36.7* 12 17.8
Retired/Unable to Work 33 17.8 12 21.8 45 18.6
Total 107 18.6 45 26.7 157 21.0
1Unweighted
2Weighted
*Observations < 50
3 Denominator is those who have ever smoked an E-Cigarette

Mississippi Behavioral Risk Factor Surveillance Survey 2016
20
0
5
10
15
20
Male Female Total
Pe
rce
nt
Diagnosed With Diabetes By Race and Sex
White
Black
Diabetes
Survey Question
Have you ever been told by a doctor that you have diabetes? (Females
diagnosed only during pregnancy are excluded.)
Diabetes was the seventh leading cause of death in Mississippi for the year 2015
with a death rate of 36.5 per 100,000 population. According to the 2016 BRFSS survey,
13.7 percent of all respondents reported being told by a doctor that they have diabetes. In
2015 the reported rate was
14.8 percent.
Black females continue
to comprise the largest group
having a rate of 18.6 percent
followed by black males with
a rate of 15.7 percent. White
males reported a rate of 12.3
percent and white females
were the lowest at 11.7
percent (Figure 11).
The rate of diabetes
showed a marked difference
by categories of education.
Respondents who did not
complete high school
reported rates of 21.0 percent
which is almost 36 percent
higher than those with a high school degree. Those with a high school education reported
a rate of 13.5 percent; those with some college work, a rate of 12.9 percent; and college
graduates a rate of 8.3 percent. Blacks with no high school education reported a diabetes
rate of 27.2 percent (Table 10).
There are obvious differences seen by age of the respondent in the rate of diabetes.
Respondents between the age of 18 and 24 reported a rate on only 1.4 percent but 26.8
percent of those older than age 65 reported they had diabetes (Table 10).
Figure 11

Mississippi Behavioral Risk Factor Surveillance Survey 2016
21
0
10
20
30
40
50
Diagnosed With Diabetes By Race and Age Group
White
Black
Figure 12

Mississippi Behavioral Risk Factor Surveillance Survey 2016
22
Table 10: Diabetes
White Black Total
Groups Number1 Percent2 Number1 Percent2 Number1 Percent2
Sex
Male 186 12.3 132 15.7 325 13.2
Female 265 11.7 288 18.6 560 14.2
Age Group
18-24 1 0.7 4 2.7 5 1.4
25-34 6 2.4 5 1.1 11 1.7
35-44 16 5.8 43 16.7 60 10.3
45-54 52 12.9 63 16.3 117 14.0
55-64 121 18.6 134 31.8 260 23.5
65+ 252 22.1 167 40.4 425 26.8
Education
< High School Graduate 64 17.4 111 27.2 178 21.0
High School Graduate or GED 160 13.6 146 14.5 308 13.5
Some College or Technical School 128 10.8 90 16.7 222 12.9
College Graduate 97 7.7 73 10.0 175 8.3
Income
< $15,000 58 20.5 113 22.3 174 21.3
$15-$24,999 100 14.5 101 14.7 204 14.3
$25-$34,999 48 13.2 38 15.8 88 13.9
$35-$49,999 52 9.4 28 12.1 81 10.1
$50-$74,999 39 8.1 33 17.8 73 10.3
$75,000+ 64 8.4 18 17.9 83 9.8
Employment Status
Employed 102 6.7 111 9.5 216 7.6
Not Employed 12 8.6 15 10.5 27 9.3
Student/Homemaker 19 5.7 9 6.8 28 5.7
Retired/Unable to Work 317 22.4 284 35.0 611 26.9
Total 451 12.0 420 17.3 885 13.7
1Unweighted
2Weighted

Mississippi Behavioral Risk Factor Surveillance Survey 2016
23
0
2
4
6
8
Male Female Total
Pe
rce
nt
Diagnosed With Stroke By Race and Sex
White
Black
Cardiovascular Disease
Survey Question
Has a doctor, nurse, or other health professional ever told you that
you had any of the following: A heart attack, also called a myocardial
infarction? Angina or coronary heart disease? A stroke?
Cardiovascular disease
(CVD) includes coronary
heart disease, stroke,
complications of
hypertension, and diseases of
the arterial blood vessels. In
addition to causing almost
half of all deaths in
Mississippi, CVD is a major
cause of premature,
permanent disability among
working adults. Stroke alone
disables almost 2,000
Mississippians each year. In
the 2016 BRFSS survey
approximately 12.0 percent of
Mississippi adults or more
than 272,000 people report
having some kind of CVD,
such as coronary heart
disease, angina, previous
heart attack, or stroke.
In 2015 Mississippi
reported 7,965 deaths
from heart disease and
1,733 from cerebro-
vascular disease (stroke).
The two combined
accounted for more than
thirty percent of all the
deaths reported that year
and more than thirty-nine
percent of the total from
0
2
4
6
8
10
Male Female Total
Pe
rce
nt
Diagnosed With Heart Attack By Race and Sex
White
Black
Figure 13
Figure 14

Mississippi Behavioral Risk Factor Surveillance Survey 2016
24
the ten leading causes of death.
The 2016 BRFSS survey revealed that 15.3 percent of the population 65 years of age
or older reported that they have been diagnosed as having had a heart attack: 16.1 for
white respondents and 11.8 for blacks. The second highest age group that reported being
diagnosed with a heart attack was the 55 to 64 category. White respondents reported a
rate of 7.5 percent while
blacks reported a rate of
9 percent (Table 11).
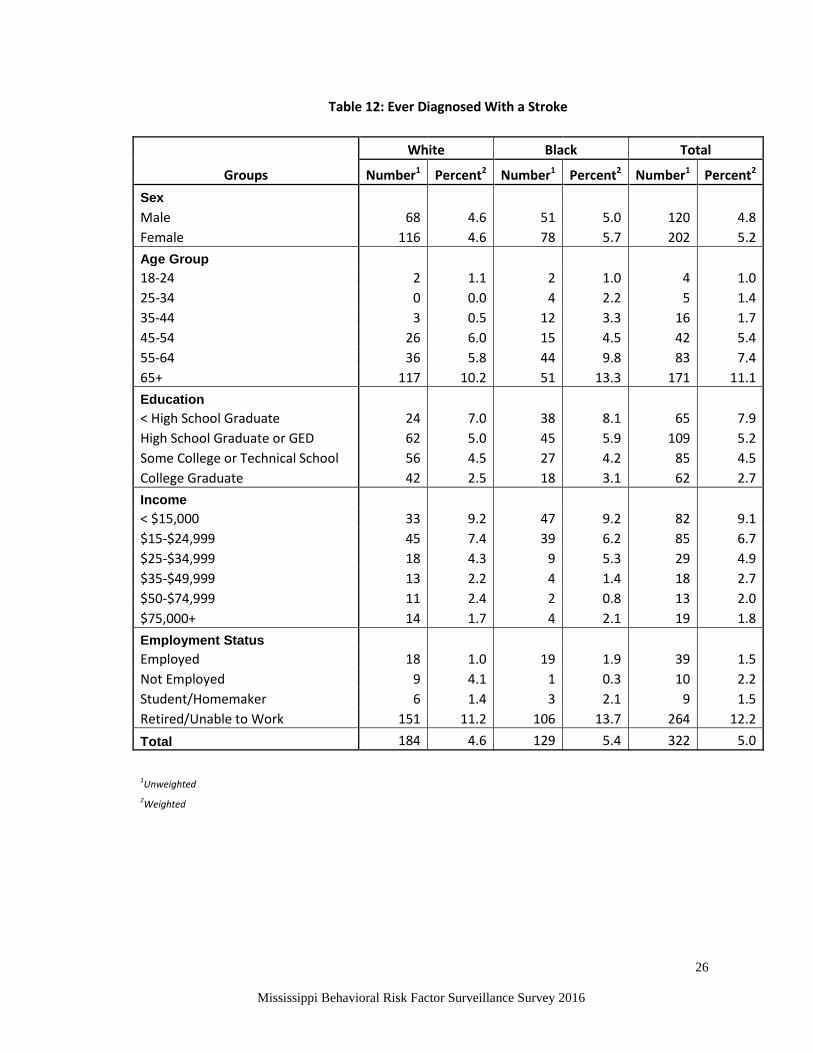
Table 12 shows that
the rate for those who
had been diagnosed
with a stroke age 65 and
greater was 10.2 percent
for whites and 13.3
percent for blacks. In
the 55 to 64 group the
rates were 5.8 and 9.8
for whites and blacks
respectively.
Those in the older
age groups also reported
a higher rate of
coronary artery disease.
People in the age group 65 and older reported a rate of 15.4 percent with white
respondents having a rate of 16.5 percent compared to 12.7 for blacks. The 55 to 64 age
category had an overall rate of 9.6 percent: 9.6 for whites and 9.5 for blacks (Table 13).
0
2
4
6
8
Male Female Total
Pe
rce
nt
Diagnosed With Coronary Heart Disease
By Race and Sex
White
Black
Figure 15

Mississippi Behavioral Risk Factor Surveillance Survey 2016
25
Table 11: Ever Diagnosed With a Heart Attack
White Black Total
Groups Number1 Percent2 Number1 Percent2 Number1 Percent2
Sex
Male 126 8.6 46 4.5 174 6.9
Female 100 4.6 62 3.8 171 4.5
Age Group
18-24 0 0.0 0 0.0 0 0.0
25-34 3 1.5 2 0.4 5 1.0
35-44 5 1.8 2 0.5 8 1.3
45-54 18 5.4 13 4.7 32 5.1
55-64 46 7.5 45 9.7 95 8.4
65+ 153 16.1 45 11.8 203 15.3
Education
< High School Graduate 44 12.0 30 7.2 78 9.8
High School Graduate or GED 74 6.3 43 4.3 118 5.3
Some College or Technical School 61 6.1 24 3.0 89 5.1
College Graduate 46 3.3 11 1.8 59 2.9
Income
< $15,000 35 12.1 35 6.3 75 9.0
$15-$24,999 47 8.6 38 6.0 87 7.3
$25-$34,999 19 5.8 9 2.6 31 4.6
$35-$49,999 26 6.0 3 1.1 29 4.2
$50-$74,999 22 5.5 3 1.1 25 4.4
$75,000+ 20 2.6 3 2.8 23 2.6
Employment Status
Employed 39 3.2 14 1.1 54 2.3
Not Employed 3 0.6 4 2.0 7 1.3
Student/Homemaker 7 2.0 2 1.3 9 1.8
Retired/Unable to Work 177 14.0 88 10.8 275 13.2
Total 226 6.6 108 4.1 345 5.7
1Unweighted
2Weighted
Mississippi Behavioral Risk Factor Surveillance Survey 2016
26
Table 12: Ever Diagnosed With a Stroke
White Black Total
Groups Number1 Percent2 Number1 Percent2 Number1 Percent2
Sex
Male 68 4.6 51 5.0 120 4.8
Female 116 4.6 78 5.7 202 5.2
Age Group
18-24 2 1.1 2 1.0 4 1.0
25-34 0 0.0 4 2.2 5 1.4
35-44 3 0.5 12 3.3 16 1.7
45-54 26 6.0 15 4.5 42 5.4
55-64 36 5.8 44 9.8 83 7.4
65+ 117 10.2 51 13.3 171 11.1
Education
< High School Graduate 24 7.0 38 8.1 65 7.9
High School Graduate or GED 62 5.0 45 5.9 109 5.2
Some College or Technical School 56 4.5 27 4.2 85 4.5
College Graduate 42 2.5 18 3.1 62 2.7
Income
< $15,000 33 9.2 47 9.2 82 9.1
$15-$24,999 45 7.4 39 6.2 85 6.7
$25-$34,999 18 4.3 9 5.3 29 4.9
$35-$49,999 13 2.2 4 1.4 18 2.7
$50-$74,999 11 2.4 2 0.8 13 2.0
$75,000+ 14 1.7 4 2.1 19 1.8
Employment Status
Employed 18 1.0 19 1.9 39 1.5
Not Employed 9 4.1 1 0.3 10 2.2
Student/Homemaker 6 1.4 3 2.1 9 1.5
Retired/Unable to Work 151 11.2 106 13.7 264 12.2
Total 184 4.6 129 5.4 322 5.0
1Unweighted
2Weighted

Mississippi Behavioral Risk Factor Surveillance Survey 2016
27
Table 13: Ever Diagnosed With Coronary Artery Disease
White Black Total
Groups Number1 Percent2 Number1 Percent2 Number1 Percent2
Sex
Male 119 7.3 36 4.3 156 6.0
Female 161 6.8 63 4.3 227 5.8
Age Group
18-24 0 0.0 1 1.0 1 0.4
25-34 3 1.4 1 0.3 4 0.9
35-44 9 2.9 3 0.7 13 2.0
45-54 19 5.1 11 4.0 30 4.6
55-64 60 9.6 36 9.5 98 9.6
65+ 187 16.5 46 12.7 234 15.4
Education
< High School Graduate 43 10.6 30 8.3 75 9.3
High School Graduate or GED 104 7.9 31 3.2 136 5.8
Some College or Technical School 71 6.6 24 3.9 95 5.5
College Graduate 62 4.2 14 1.7 77 3.5
Income
< $15,000 49 15.8 28 5.6 80 9.8
$15-$24,999 60 9.4 24 5.2 84 7.1
$25-$34,999 27 6.5 10 3.6 37 4.9
$35-$49,999 30 6.3 6 2.9 36 5.0
$50-$74,999 24 4.6 5 1.8 29 3.9
$75,000+ 32 3.7 5 4.0 37 3.6
Employment Status
Employed 39 3.1 13 1.1 52 2.2
Not Employed 8 3.3 2 1.4 10 2.3
Student/Homemaker 12 1.6 2 1.3 14 1.5
Retired/Unable to Work 221 15.6 81 11.3 306 14.1
Total 280 7.0 99 4.3 383 5.9
1Unweighted
2Weighted

Mississippi Behavioral Risk Factor Surveillance Survey 2016
28
Asthma
Survey Question
Have you ever been told by a doctor, nurse, or other health
professional that you had asthma? If yes: Do you still have asthma?
According to the U. S. Department of Health and Human Services, Healthy People
2020 publication, asthma is a serious and growing health problem. Asthma is a chronic
lung disease that affects more than 17 million Americans. The disease is characterized by
inflammation of the airways with intermittent bronchospasm which is a narrowing of the
bronchial tubes. The inflammation makes the airways smaller making it more difficult
for air to move in and out of the lung. In some cases, breathing may be so labored that an
asthma attack becomes
life-threatening.
Most of the problems
caused by asthma could be
averted if persons with
asthma and their health
care providers managed
the disease according to
established guidelines.
Effective management of
asthma comprises four
major components:
controlling exposure to
factors that trigger asthma
episodes, adequately
managing asthma with
medicine, monitoring the
disease by using objective
measures of lung function
and educating asthma patients to become partners in their own care. Such prevention
efforts are essential to interrupt the progression from disease to functional limitation and
disability and to improve the quality of life for persons with asthma.
In the 2016 BRFSS survey for Mississippi, 8.0 percent of the respondents indicated
that they presently have asthma. The black rate was 8.9 percent compared to 7.5 percent
for white respondents. Women reported a higher rate than men with black females
having the highest rate at 10.4 percent (Table 15).
0
5
10
15
Male Female Total
Pe
rce
nt
Ever Diagnosed With Asthma By Race and Sex
White
Black
Figure 16

Mississippi Behavioral Risk Factor Surveillance Survey 2016
29
Figure 17
0
5
10
15
20
Pe
rce
nt
Ever Diagnosed With Asthma By Race and Age Group
White
Black

Mississippi Behavioral Risk Factor Surveillance Survey 2016
30
Table 14: Ever Diagnosed With Asthma
White Black Total
Groups Number1 Percent2 Number1 Percent2 Number1 Percent2
Sex
Male 109 9.9 71 12.8 185 10.8
Female 244 14.7 170 13.7 427 14.5
Age Group
18-24 20 14.8 20 17.8 40 15.0
25-34 37 13.3 36 12.6 78 13.8
35-44 41 13.4 29 8.9 73 11.4
45-54 52 13.6 52 16.2 108 14.4
55-64 87 12.4 57 13.4 146 12.7
65+ 113 9.2 47 12.7 164 10.2
Education
< High School Graduate 57 20.7 53 16.6 113 18.8
High School Graduate or GED 94 9.4 87 15.5 187 11.8
Some College or Technical School 106 12.8 55 9.3 165 11.7
College Graduate 96 9.8 46 12.7 147 10.5
Income
< $15,000 57 23.3 78 18.6 140 20.5
$15-$24,999 64 14.1 65 12.8 131 13.2
$25-$34,999 33 12.7 20 10.0 58 12.2
$35-$49,999 36 9.0 23 16.1 61 12.1
$50-$74,999 45 13.2 9 4.8 55 11.2
$75,000+ 53 7.3 6 2.6 60 6.3
Employment Status
Employed 117 10.3 72 9.5 195 10.1
Not Employed 16 22.2 14 13.6 31 17.6
Student/Homemaker 28 10.7 13 13.0 43 11.2
Retired/Unable to Work 192 14.8 141 20.0 342 16.7
Total 353 12.4 241 13.3 612 12.7
1Unweighted
2Weighted

Mississippi Behavioral Risk Factor Surveillance Survey 2016
31
Table 15: Currently Have Asthma
White Black Total
Groups Number1 Percent2 Number1 Percent2 Number1 Percent2
Sex
Male 55 4.6 39 7.1 97 5.3
Female 177 10.3 128 10.4 317 10.5
Age Group
18-24 9 8.3 8 9.5 17 8.3
25-34 14 5.6 21 6.7 39 6.5
35-44 23 6.4 23 7.7 49 7.1
45-54 35 8.5 39 11.7 78 9.7
55-64 63 9.1 42 9.5 107 9.3
65+ 86 7.1 34 9.7 122 7.8
Education
< High School Graduate 42 13.2 42 14.0 86 13.1
High School Graduate or GED 73 6.7 64 9.6 142 7.9
Some College or Technical School 66 7.4 36 6.4 105 7.2
College Graduate 51 4.6 25 5.8 81 5.0
Income
< $15,000 46 18.9 59 13.9 110 16.1
$15-$24,999 50 10.0 47 9.1 98 9.4
$25-$34,999 20 7.6 16 6.0 41 7.8
$35-$49,999 18 3.8 11 6.8 29 4.7
$50-$74,999 24 6.6 4 1.4 29 5.4
$75,000+ 27 2.7 2 1.1 30 2.4
Employment Status
Employed 56 4.4 41 5.5 102 4.9
Not Employed 12 18.5 11 11.6 24 14.9
Student/Homemaker 16 5.5 6 4.4 24 5.3
Retired/Unable to Work 148 11.4 108 15.2 263 12.8
Total 232 7.5 167 8.9 414 8.0
1Unweighted
2Weighted

Mississippi Behavioral Risk Factor Surveillance Survey 2016
32
Arthritis
Survey Question
Have you ever been told by a doctor or other health professional that
you have some form of arthritis, rheumatoid arthritis, gout, lupus, or
fibromyalgia?
According to the Healthy People 2020 publication, arthritis affects one in five adults
in the United States and continues to be the most common cause of disability and
generates more than $128 billion per year to the cost of health care. All of the human and
economic costs are projected to increase over time as the population ages.
Figure 18
There are more than 100 types of arthritis which commonly occurs with other
chronic conditions, such as diabetes, heart disease, and obesity. Interventions to treat the
pain and reduce the functional limitations from arthritis are important, and may also
enable people with these other chronic conditions to be more physically active.
The significant public health impact of arthritis is reflected in a variety of measures.
First, arthritis is the leading cause of disability. Arthritis limits major activities such as
regular work, housekeeping and school for nearly three percent of the U. S. population
and almost twenty percent of those who are afflicted with the condition. Arthritis trails
only heart disease as a cause of work disability. As a consequence, arthritis limits the
independence of affected persons and disrupts the lives of family members and other care
givers.
0
10
20
30
40
50
60
70
80
Pe
rce
nt
Ever Diagnosed With Arthritis By Race and Age Group
White
Black

Mississippi Behavioral Risk Factor Surveillance Survey 2016
33
Health-related quality of life measures are consistently worse for persons with
arthritis, whether the measure is healthy days in the past 30 days, days without severe
pain, “ability days” (that is, days without activity limitations), or difficulty in performing
personal care activities.
In Mississippi, the 2016 BRFSS survey showed that 31.3 percent of the population
had been diagnosed with arthritis by a health care professional. As noted in the
“Definitions of Terms and Risk Factors,” the question in the current report has been
amended so that only those who have actually been diagnosed with arthritis by a health
care professional are being reported. Until 2003, the report included those who had
reported pain or stiffness in the joints for at least 30 days during the previous year.
As seen in Figure 18, the proportion increases with age. Respondents over the age of
65 reported being diagnosed with arthritis at a rate of 60.3 percent. The rate for blacks
within this age group was higher than for whites. Blacks reported a rate of 67.3 percent
while whites only 57.5 percent. Only 5.4 percent of those 18-24 years old reported this
condition.

Mississippi Behavioral Risk Factor Surveillance Survey 2016
34
Table 18: Ever Diagnosed Arthritis
White Black Total
Groups Number1 Percent2 Number1 Percent2 Number1 Percent2
Sex
Male 416 27.5 230 27.2 657 26.7
Female 850 37.4 520 33.4 1,391 35.6
Age Group
18-24 8 5.3 8 6.4 16 5.4
25-34 31 10.3 22 9.9 55 9.8
35-44 63 21.5 54 17.8 119 19.5
45-54 140 33.5 128 35.0 276 33.8
55-64 297 45.6 242 57.3 544 49.5
65+ 720 57.5 289 67.3 1,024 60.3
Education
< High School Graduate 165 43.5 202 49.6 375 44.8
High School Graduate or GED 423 35.4 267 29.5 700 32.2
Some College or Technical School 349 31.1 154 24.9 510 28.9
College Graduate 328 23.4 127 18.1 462 21.5
Income
< $15,000 165 57.6 224 43.8 398 48.8
$15-$24,999 237 39.4 192 30.7 435 34.6
$25-$34,999 131 35.3 65 24.4 203 29.9
$35-$49,999 149 32.5 62 26.7 212 29.7
$50-$74,999 129 23.2 39 17.6 171 22.0
$75,000+ 167 18.4 30 22.5 198 18.6
Employment Status
Employed 299 18.5 202 17.1 508 17.4
Not Employed 41 29.4 20 11.4 62 20.1
Student/Homemaker 77 18.1 23 20.2 101 18.0
Retired/Unable to Work 848 59.2 503 61.6 1,374 60.2
Total 1,266 32.5 750 30.7 2,048 31.3
1Unweighted
2Weighted

Mississippi Behavioral Risk Factor Surveillance Survey 2016
35
Depression
Survey Question
Has a doctor or other healthcare provider ever told you that you have
a depressive disorder including depression, major depression,
dysthymia, or minor depression?
Affective disorders, which encompass major depression and manic depressive
illness, constitute a second category of severe mental illness. The World Health
Organization found major
depression to be the leading
cause of disability among
adults in developed nations
such as the United States.
About 6.5 percent of women
and 3.3 percent of men will
have major depression in any
year. Manic depressive illness
affects around one percent of
adults, with comparable rates
of occurrence in men and
women. A high rate of suicide
is associated with such mood
disorders.
Almost all adults will at
some time experience a tragedy
or times of profound sadness,
grief, or distress. Major depressive disorder, however, differs both quantitatively and
qualitatively from episodes of normal sadness or grief. Depression disrupts the lives of
depressed persons and their families and reduces economic productivity. Depression also
can result in suicide and has an especially severe impact on women.
Depression also has a negative impact on the economy, costing the United States
over $40 billion each year, both in diminished productivity and in use of health care
resources. In the workplace, depression is a leading cause of absenteeism and diminished
productivity. Although only a minority seek professional help to relieve a mood disorder,
depressed people are significantly more likely than others to visit a physician for some
other reason.
The 2016 Mississippi BRFSS revealed that 19.0 percent of those surveyed said they
had been diagnosed with a depressive disorder. The rate for women was almost 1.7 times
0
5
10
15
20
25
30
Male Female Total
Pe
rce
nt
Ever Diagnosed With Depressive Disorder
By Race and Sex
White
Black
Figure 19

Mississippi Behavioral Risk Factor Surveillance Survey 2016
36
higher than for men. Females reported a rate of 23.1 percent to only 14.5 for males, a
difference of more than 37 percent (Figure 19). Similarly, the respondents in lower
income categories reported a much higher rate of diagnosed depression than those in the
upper income groups. The group with the highest rate of depression was whites whose
income was less than $15 thousand annually with a rate of 40.1 percent (Figure 20 and
Table 19).
0
10
20
30
40
50
Pe
rce
nt
Ever Diagnosed With Depressive Disorder
By Race and Income Level
White
Black
Figure 20

Mississippi Behavioral Risk Factor Surveillance Survey 2016
37
Table 19: Ever Diagnosed With Depression
White Black Total
Groups Number1 Percent2 Number1 Percent2 Number1 Percent2
Sex
Male 175 15.3 86 13.2 267 14.5
Female 453 25.9 217 19.0 683 23.1
Age Group
18-24 18 11.5 14 14.7 33 13.2
25-34 61 22.1 34 12.6 97 17.4
35-44 77 25.3 46 14.9 125 20.5
45-54 108 25.0 64 21.5 176 23.4
55-64 170 26.0 86 23.3 259 25.0
65+ 192 15.3 58 12.6 257 14.9
Education
< High School Graduate 92 29.1 71 22.8 166 25.3
High School Graduate or GED 190 19.3 111 17.5 307 18.7
Some College or Technical School 196 22.0 77 14.6 278 19.4
College Graduate 150 14.3 44 8.4 199 12.6
Income
< $15,000 105 40.1 108 28.6 218 32.9
$15-$24,999 117 23.3 74 15.3 194 19.2
$25-$34,999 67 20.6 26 10.8 98 17.6
$35-$49,999 67 22.3 28 19.0 96 20.6
$50-$74,999 62 16.5 9 5.9 71 13.9
$75,000+ 78 11.5 6 2.8 85 9.8
Employment Status
Employed 183 14.0 75 8.9 263 12.0
Not Employed 36 29.8 15 17.4 52 23.2
Student/Homemaker 48 17.8 15 16.9 64 17.1
Retired/Unable to Work 360 30.7 198 30.0 569 30.5
Total 628 20.7 303 16.4 950 19.0
1Unweighted
2Weighted

Mississippi Behavioral Risk Factor Surveillance Survey 2016
38
Cancer Prevalence
Survey Question
Ever told you had skin cancer?
Ever told you had any other types of cancer?
Skin Cancer
According to the American Cancer Society (ACS) basal cell and squamous cell
cancers are the most common cancers of the skin. They develop from skin cells called
keratinocytes. Both basal cell and squamous cell cancers are found mainly on parts of the
body exposed to the sun, such as the head and neck. These cancers are strongly related to
the amount of sun exposure a person has had.
Basal and squamous
cell cancers are much less
likely than melanomas to
spread to other parts of the
body and become life
threatening. Still, it is
important to find and treat
them early. If left
untreated, they can grow
quite large and invade into
nearby tissues and organs,
causing scarring,
deformity, or even loss of
function in some parts of
the body. Some of these
cancers (especially
squamous cell cancers)
may even spread and if not
treated can be fatal.
Melanomas are cancers that develop from melanocytes, the cells that make the
brown pigment that gives skin its color. Melanocytes can also form benign (non-
cancerous) growths called moles. Melanomas can occur anywhere on the body, but are
more likely to start in certain locations. The chest and back are the most common sites in
men. In females, the legs are the most common site with the neck and face being other
common sites.
0
2
4
6
8
10
Male Female Total
Pe
rce
nt
Diagnosed Skin Cancer By Race and Sex
White
Black
Figure 21

Mississippi Behavioral Risk Factor Surveillance Survey 2016
39
Melanomas are not as common as basal cell and squamous cell skin cancers, but they
can be far more serious. Like basal cell and squamous cell cancers, melanoma is almost
always curable in its early stages. Left alone, melanoma is much more likely to spread to
other parts of the body, where it can be extremely difficult to treat.
In Mississippi 6.0 percent of the 2016 BRFSS respondents reported they have had
skin cancer. The rate among whites was 9.2 percent with blacks reporting a rate of only
0.8 percent. Nationally, skin cancer accounts for only one to two percent of all cancers in
the black population.
Other Cancer
Cancer is the general name for a group of more than 100 diseases. Although there are
many kinds of cancer, all cancers start because abnormal cells grow out of control.
Untreated cancers can cause serious illness and death.
Figure 22
The human body contains trillions of living cells. Normal body cells grow, divide,
and die in an orderly fashion. Cancer starts when cells in a part of the body start to grow
out of control. Cells become cancer cells because of deoxyribonucleic acid (DNA)
damage. In a normal cell, when DNA gets damaged the cell either repairs the damage or
the cell dies. In cancer cells, the damaged DNA is not repaired, and the cell does not die
but goes on making new cells that the body does not need. These new cells all have the
same abnormal DNA as the first cell does.
0
5
10
15
20
Pe
rce
nt
Diagnosed Other Cancer By Race and Age Group
White
Black

Mississippi Behavioral Risk Factor Surveillance Survey 2016
40
In most cases, the cancer cells form a tumor. Some cancers, like leukemia, rarely
form tumors. Instead, these cancer cells involve the blood and blood-forming organs and
circulate through other tissues where they reproduce.
The ACS states that half of all men and one-third of all women in the United
States will develop cancer during their lifetimes.
The rate for people who reported having cancer other than skin cancer was 6.4
percent. Whites reported a rate of 7.6 percent which was more than thirty-nine percent
higher than the rate for blacks who reported a rate of 4.6 percent. As may be observed
from Figure 22, the rate for cancer increases dramatically with age.

Mississippi Behavioral Risk Factor Surveillance Survey 2016
41
Table 20: Ever Diagnosed Skin Cancer
White Black Total
Groups Number1 Percent2 Number1 Percent2 Number1 Percent2
Sex
Male 178 10.2 4 1.0 184 6.7
Female 233 8.3 10 0.7 246 5.3
Age Group
18-24 3 2.8 1 1.4 4 2.1
25-34 6 1.2 0 0.0 6 0.7
35-44 5 2.0 0 0.0 6 1.1
45-54 23 5.5 3 1.1 26 3.8
55-64 70 10.6 3 0.6 74 7.0
65+ 301 23.6 7 2.2 311 18.0
Education
< High School Graduate 35 8.9 4 1.8 39 5.5
High School Graduate or GED 149 10.9 3 0.7 152 6.5
Some College or Technical School 99 8.6 3 0.3 104 5.7
College Graduate 128 8.3 4 0.8 135 6.0
Income
< $15,000 47 13.0 3 0.9 51 5.7
$15-$24,999 59 8.3 6 1.3 65 4.8
$25-$34,999 47 9.3 1 0.1 49 5.3
$35-$49,999 46 8.4 2 2.0 49 6.1
$50-$74,999 42 6.7 1 0.3 43 5.2
$75,000+ 74 8.0 0 0.0 74 6.4
Employment Status
Employed 84 4.3 3 0.3 88 2.7
Not Employed 7 4.0 1 0.2 8 2.0
Student/Homemaker 19 5.4 2 1.6 22 4.3
Retired/Unable to Work 301 18.7 8 1.7 312 12.7
Total 411 9.2 14 0.8 430 6.0
1Unweighted
2Weighted

Mississippi Behavioral Risk Factor Surveillance Survey 2016
42
Table 21: Ever Diagnosed Other Cancer
White Black Total
Groups Number1 Percent2 Number1 Percent2 Number1 Percent2
Sex
Male 101 5.2 37 4.0 139 4.6
Female 233 9.9 76 5.1 314 8.0
Age Group
18-24 0 0.0 1 1.4 1 0.5
25-34 5 1.5 4 2.3 9 1.7
35-44 13 4.2 7 2.8 21 3.6
45-54 25 5.4 19 6.7 45 5.8
55-64 61 9.0 30 5.7 92 7.8
65+ 229 17.9 51 10.1 283 15.9
Education
< High School Graduate 26 6.3 28 7.3 54 6.4
High School Graduate or GED 119 8.6 32 3.3 154 6.3
Some College or Technical School 86 7.7 25 4.4 112 6.5
College Graduate 103 7.1 28 4.0 133 6.1
Income
< $15,000 37 12.5 36 8.4 73 9.8
$15-$24,999 57 8.5 36 5.3 95 6.9
$25-$34,999 34 7.6 11 2.1 46 5.2
$35-$49,999 44 8.5 9 5.3 53 7.2
$50-$74,999 35 5.0 7 3.1 43 4.5
$75,000+ 55 5.4 5 3.4 61 5.0
Employment Status
Employed 71 3.8 20 2.3 93 3.1
Not Employed 5 2.8 3 3.2 8 2.9
Student/Homemaker 16 3.2 3 1.7 19 2.7
Retired/Unable to Work 241 15.4 86 9.6 331 13.4
Total 334 7.6 113 4.6 453 6.4
1Unweighted
2Weighted

Mississippi Behavioral Risk Factor Surveillance Survey 2016
43
Chronic Obstructive Pulmonary Disease
Survey Question
Ever told you have Chronic Obstructive Pulmonary Disease or
COPD, emphysema or chronic bronchitis?
Chronic Obstructive Pulmonary Disease or COPD is a progressive disease that
makes breathing difficult. It can cause coughing that produces large amounts of mucus,
wheezing, shortness of breath, chest tightness, and other symptoms.
COPD is a major cause of disability, and is the third leading cause of death in the
United States as well as in Mississippi. Currently, millions of people are diagnosed with
COPD and the National Heart, Lung and Blood Institute states that many more people
may have the disease without knowing it.
Cigarette smoking is the leading cause of COPD. Most people who have the disease
either smoke or have a history of smoking. Long-term exposure to other lung irritants
such as air pollution,
chemical fumes, or dust
also may contribute to
COPD.
COPD symptoms
develop slowly and often
become more severe over
time and can limit the
ability to do routine
activities. Severe COPD
may prevent even basic
activities like walking,
cooking, or personal care.
Most of the time, COPD is
diagnosed in middle-aged
or older adults. The disease
isn't passed from person to
person—it cannot be caught
from someone else.
Presently there is no cure and damage to the lungs and airways cannot be reversed.
Certain treatments and lifestyle changes can be of benefit in slowing the progress of
COPD.
0
2
4
6
8
10
12
Male Female Total
Pe
rce
nt
Diagnosed COPD By Race and Sex
White
Black
Figure 23

Mississippi Behavioral Risk Factor Surveillance Survey 2016
44
The 2016 BRFSS survey revealed that Mississippians have a COPD rate of 8.3
percent. White respondents who reported a rate of 9.3 percent have a higher rate than
blacks who had a rate of 6.9 percent. In the gender category, white females show the
highest prevalence at 11.0 percent followed by black females at 7.7 percent.
As may be seen in Table 22, there is an close association between the rate of COPD
and the level of education among the respondents. Those who did not graduate from high
school have a COPD rate almost five times higher than college graduates.

Mississippi Behavioral Risk Factor Surveillance Survey 2016
45
Table 22: Ever Diagnosed COPD
White Black Total
Groups Number1 Percent2 Number1 Percent2 Number1 Percent2
Sex
Male 94 7.6 45 5.9 142 6.8
Female 225 11.0 99 7.7 332 9.7
Age Group
18-24 3 2.7 5 2.9 8 2.6
25-34 11 4.6 10 4.2 22 4.3
35-44 17 6.1 12 4.3 30 5.3
45-54 37 9.1 26 7.9 64 8.5
55-64 91 14.5 42 9.7 136 13.0
65+ 159 14.2 48 14.0 212 14.3
Education
< High School Graduate 72 19.9 45 12.5 119 16.0
High School Graduate or GED 104 8.4 48 6.2 156 7.4
Some College or Technical School 101 9.3 30 5.1 134 7.9
College Graduate 42 3.1 21 4.2 65 3.4
Income
< $15,000 62 23.2 49 11.9 117 16.9
$15-$24,999 74 12.6 42 7.7 118 10.1
$25-$34,999 27 7.5 9 5.6 38 6.6
$35-$49,999 31 6.2 6 1.5 37 4.5
$50-$74,999 27 6.0 2 0.6 29 4.7
$75,000+ 22 3.9 4 2.4 27 3.5
Employment Status
Employed 57 4.2 24 2.4 82 3.4
Not Employed 22 15.8 13 11.0 35 13.1
Student/Homemaker 9 2.6 5 4.1 14 2.9
Retired/Unable to Work 231 18.6 102 14.6 343 17.4
Total 319 9.3 144 6.9 474 8.3
1Unweighted
2Weighted
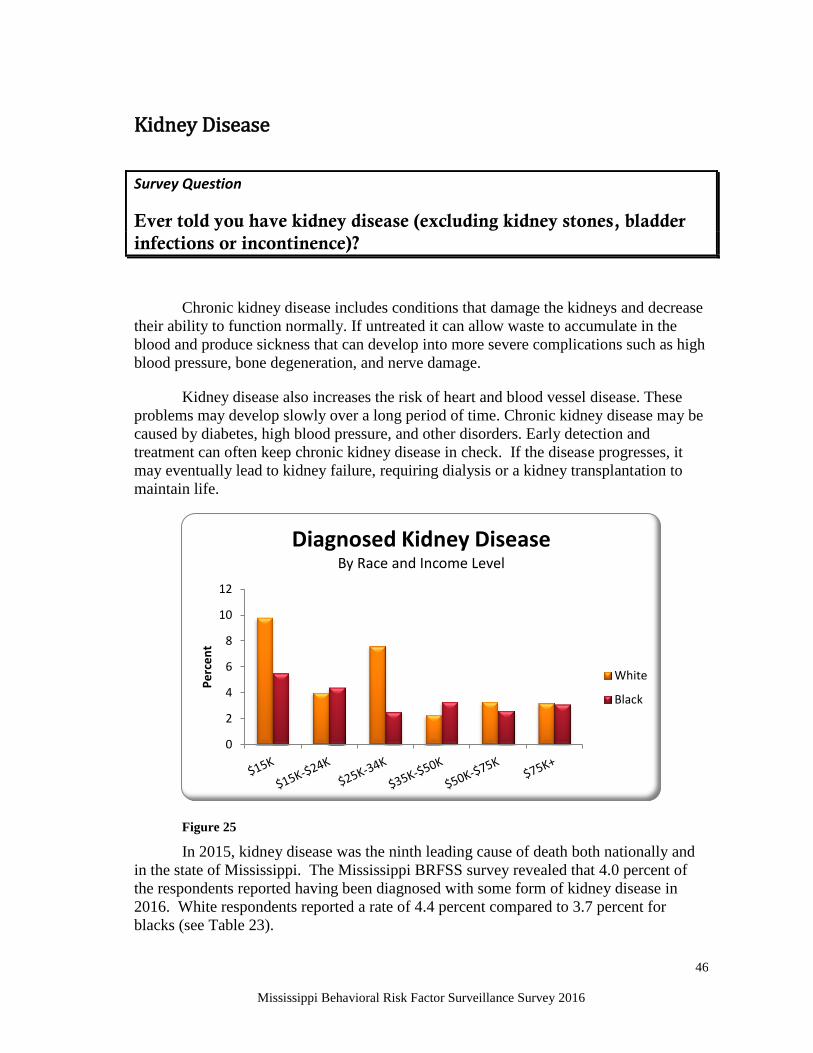
Mississippi Behavioral Risk Factor Surveillance Survey 2016
46
Kidney Disease
Survey Question
Ever told you have kidney disease (excluding kidney stones, bladder
infections or incontinence)?
Chronic kidney disease includes conditions that damage the kidneys and decrease
their ability to function normally. If untreated it can allow waste to accumulate in the
blood and produce sickness that can develop into more severe complications such as high
blood pressure, bone degeneration, and nerve damage.
Kidney disease also increases the risk of heart and blood vessel disease. These
problems may develop slowly over a long period of time. Chronic kidney disease may be
caused by diabetes, high blood pressure, and other disorders. Early detection and
treatment can often keep chronic kidney disease in check. If the disease progresses, it
may eventually lead to kidney failure, requiring dialysis or a kidney transplantation to
maintain life.
Figure 25
In 2015, kidney disease was the ninth leading cause of death both nationally and
in the state of Mississippi. The Mississippi BRFSS survey revealed that 4.0 percent of
the respondents reported having been diagnosed with some form of kidney disease in
2016. White respondents reported a rate of 4.4 percent compared to 3.7 percent for
blacks (see Table 23).
0
2
4
6
8
10
12
Pe
rce
nt
Diagnosed Kidney Disease By Race and Income Level
White
Black

Mississippi Behavioral Risk Factor Surveillance Survey 2016
47
As seen in Figure 25, kidney disease is higher among low income groups. Those
reporting an income of less than $15,000 per year were more than twice as likely to have
kidney disease than those making $75,000 per year or higher.

Mississippi Behavioral Risk Factor Surveillance Survey 2016
48
Table 23: Ever Diagnosed With Kidney Disease
White Black Total
Groups Number1 Percent2 Number1 Percent2 Number1 Percent2
Sex
Male 54 4.3 29 3.3 83 3.8
Female 97 4.5 58 4.0 157 4.3
Age Group
18-24 2 3.2 1 1.4 3 2.3
25-34 1 0.4 0 0.0 1 0.2
35-44 9 4.1 6 1.8 15 3.0
45-54 20 4.8 14 5.2 34 4.8
55-64 35 4.6 28 5.5 64 4.9
65+ 82 7.5 38 10.4 121 8.2
Education
< High School Graduate 21 6.0 26 6.6 48 6.0
High School Graduate or GED 55 4.8 25 3.5 81 4.2
Some College or Technical School 48 5.0 19 2.6 67 4.1
College Graduate 27 1.7 17 2.4 44 1.8
Income
< $15,000 29 9.8 24 5.5 54 7.1
$15-$24,999 19 4.0 28 4.4 48 4.1
$25-$34,999 16 7.6 9 2.5 25 5.1
$35-$49,999 13 2.3 7 3.3 20 2.6
$50-$74,999 17 3.3 4 2.6 21 3.1
$75,000+ 21 3.2 4 3.1 25 3.1
Employment Status
Employed 25 1.9 14 1.4 39 1.6
Not Employed 3 4.2 2 2.4 5 3.2
Student/Homemaker 4 4.3 1 0.3 5 3.1
Retired/Unable to Work 119 8.4 70 9.1 191 8.6
Total 151 4.4 87 3.7 240 4.0
1Unweighted
2Weighted
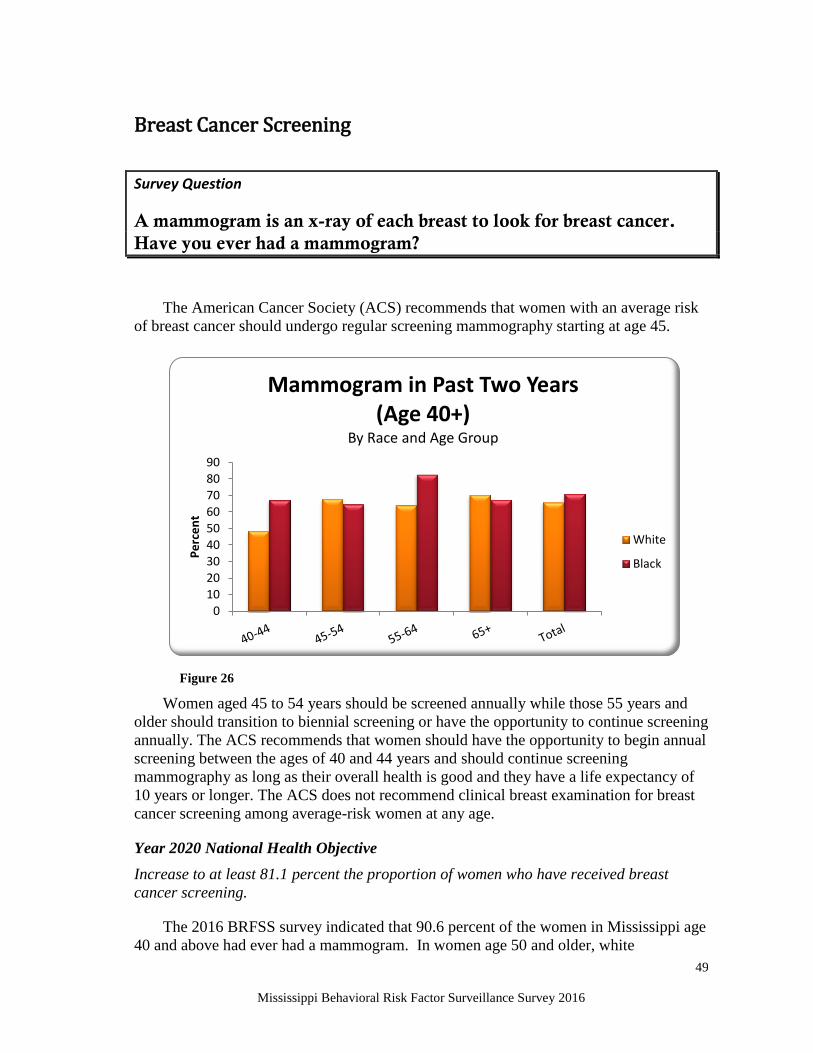
Mississippi Behavioral Risk Factor Surveillance Survey 2016
49
0102030405060708090
Pe
rce
nt
Mammogram in Past Two Years (Age 40+)
By Race and Age Group
White
Black
Breast Cancer Screening
Survey Question
A mammogram is an x-ray of each breast to look for breast cancer.
Have you ever had a mammogram?
The American Cancer Society (ACS) recommends that women with an average risk
of breast cancer should undergo regular screening mammography starting at age 45.
Women aged 45 to 54 years should be screened annually while those 55 years and
older should transition to biennial screening or have the opportunity to continue screening
annually. The ACS recommends that women should have the opportunity to begin annual
screening between the ages of 40 and 44 years and should continue screening
mammography as long as their overall health is good and they have a life expectancy of
10 years or longer. The ACS does not recommend clinical breast examination for breast
cancer screening among average-risk women at any age.
Year 2020 National Health Objective
Increase to at least 81.1 percent the proportion of women who have received breast
cancer screening.
The 2016 BRFSS survey indicated that 90.6 percent of the women in Mississippi age
40 and above had ever had a mammogram. In women age 50 and older, white
Figure 26

Mississippi Behavioral Risk Factor Surveillance Survey 2016
50
0.0
20.0
40.0
60.0
80.0
100.0
Mammogram in Past Two Years (Age 50+)
By Race and Income Level
White
Black
respondents had a mammogram within two years at a rate of 64.8 percent compared to a
rate of 69.8 percent for blacks.
The U.S. Preventive Services Task Force (USPSTF) recommends the following with
regard to screening for breast cancer.
Women age 40-49
The decision to start screening mammography in women prior to age 50 years should be
an individual one. Women who place a higher value on the potential benefit than the
potential harms may choose to begin biennial screening between the ages of 40 and 49
years.
• For women who are at average risk for breast cancer, most of the benefit of
mammography results from biennial screening during ages 50 to 74 years. Of all of the
age groups, women aged 60 to 69 years are most likely to avoid breast cancer death
through mammography screening. While screening mammography in women aged 40
to 49 years may reduce the risk for breast cancer death, the number of deaths averted is
smaller than that in older women and the number of false-positive results and
unnecessary biopsies is larger. The balance of benefits and harms is likely to improve
as women move from their early to late 40s.
•
In addition to false-positive results and unnecessary biopsies, all women undergoing
regular screening mammography are at risk for the diagnosis and treatment of
noninvasive and invasive breast cancer that would otherwise not have become a threat
to their health, or even apparent, during their lifetime (known as “over diagnosis”).
Figure 27

Mississippi Behavioral Risk Factor Surveillance Survey 2016
51
Beginning mammography screening at a younger age and screening more frequently
may increase the risk for over diagnosis and subsequent overtreatment.
• Women with a parent, sibling, or child with breast cancer are at higher risk for breast
cancer and thus may benefit more than average-risk women from beginning screening
in their 40s.
Women age 50-74
The USPSTF recommends biennial screening mammography for women aged 50 to 74
years.
Women age 75+
The USPSTF concludes that the current evidence is insufficient to assess the balance of
benefits and harms of screening mammography in women aged 75 years or older.

Mississippi Behavioral Risk Factor Surveillance Survey 2016
52
Table 24: Ever Had a Mammogram (Age 40+)
White Black Total
Groups Number1 Percent2 Number1 Percent2 Number1 Percent2
Age Group
35-44 59 70.1 63 77.4 123 72.5
45-54 205 88.8 172 89.1 382 89.1
55-64 348 94.8 246 95.0 602 94.9
65+ 746 94.2 305 96.5 1,063 94.7
Education
< High School Graduate 129 88.2 175 94.8 312 91.5
High School Graduate or GED 438 91.5 245 86.0 688 89.6
Some College or Technical School 393 89.4 170 93.5 568 90.5
College Graduate 396 93.2 196 90.3 600 91.7
Income
< $15,000 123 84.3 185 88.9 313 86.4
$15-$24,999 238 90.7 199 86.3 442 88.9
$25-$34,999 127 91.0 87 96.2 218 92.3
$35-$49,999 150 92.1 80 95.7 231 93.2
$50-$74,999 154 87.4 55 97.3 209 89.3
$75,000+ 235 94.2 39 93.1 277 94.2
Employment Status
Employed 395 89.3 268 89.0 668 88.9
Not Employed 37 86.8* 21 84.4* 60 86.4
Student/Homemaker 117 81.0 28 94.7* 146 83.1
Retired/Unable to Work 808 93.5 468 93.2 1,294 93.3
Total 1,358 90.5 786 91.2 2,170 90.6
1Unweighted
2Weighted
*Observations < 50

Mississippi Behavioral Risk Factor Surveillance Survey 2016
53
Table 25: Mammogram in Past Two Years (Females Age 40+)
White Black Total
Groups Number1 Percent2 Number1 Percent2 Number1 Percent2
Age Group
40-44 44 48.6 53 67.2 97 55.7
45-54 157 68.0 141 64.7 303 67.2
55-64 242 64.1 209 82.7 457 71.0
65+ 544 70.4 218 67.4 769 69.2
Education
< High School Graduate 77 52.6 123 66.2 205 59.5
High School Graduate or GED 316 69.3 196 69.5 515 69.3
Some College or Technical School 295 66.4 130 72.4 429 68.0
College Graduate 299 71.1 172 80.0 477 73.1
Income
< $15,000 77 50.9 146 69.6 225 60.6
$15-$24,999 166 64.8 150 64.8 320 65.0
$25-$34,999 88 64.5 67 71.2 157 66.2
$35-$49,999 112 66.7 72 86.2* 184 72.0
$50-$74,999 122 70.3 49 88.4 171 73.9
$75,000+ 191 72.1 35 86.2 229 73.8
Employment Status
Employed 304 67.9 225 70.5 534 69.0
Not Employed 23 60.1* 16 75.8* 41 66.9
Student/Homemaker 89 62.1 20 62.8* 109 62.0
Retired/Unable to Work 571 65.6 360 72.0 942 67.6
Total 987 65.9 621 71.0 1,626 67.5
1Unweighted
2Weighted

Mississippi Behavioral Risk Factor Surveillance Survey 2016
54
Table 26: Had Mammogram In Past 2 Years (Females 50+)
White Black Total
Groups Number1 Percent2 Number1 Percent2 Number1 Percent2
Age Group
50-54 82 60.6 71 64 156 62.3
55-64 242 62.8 209 78 457 68.4
65+ 544 67.5 218 64.9 769 66.4
Education
< High School Graduate 69 50.6 110 61.8 184 56.8
High School Graduate or GED 291 65.8 157 71.3 451 67.3
Some College or Technical School 262 68.7 101 73.5 366 69.7
College Graduate 246 68.8 130 79.9 381 71.9
Income
< $15,000 68 53.8 118 66.7 188 60.8
$15-$24,999 149 62.3 123 68.3 275 64.9
$25-$34,999 72 59.7 50 69.6 123 62.5
$35-$49,999 103 73.1 49 86.6 152 75.8
$50-$74,999 106 71.5 38 91.1* 144 74.7
$75,000+ 147 71.1 26 79.8* 176 72.6
Employment Status
Employed 226 67.8 145 72.2 375 69.7
Not Employed 16 44.3* 9 75.3* 26 58.4
Student/Homemaker 70 61.7 16 60.6* 86 61.6
Retired/Unable to Work 556 64.7 328 69.2 895 65.9
Total 868 64.8 498 69.8 1,382 66.4
1Unweighted
2Weighted

Mississippi Behavioral Risk Factor Surveillance Survey 2016
55
Cervical Cancer Screening
Survey Question
A Pap test is a test for cancer of the cervix. Have you ever had a Pap
test?
According to the National Cancer Institute (NCI), cervical cancer―once one of the
most common cancers affecting U.S. women―now ranks 14th in frequency. Because
precancerous lesions found by Pap smears can be treated and cured before they develop
into cancer, and because cervical cancer is often detected before it becomes advanced, the
incidence and death rates for this disease are relatively low. According to the most recent
data from the National Institutes of Health the incidence rate for cervical cancer was 8.1
cases per 100,000 women per year in the United States. The mortality rate was 2.3 deaths
per 100,000 women per year. In 2017, an estimated 12,820 women in the United States
will be diagnosed with cervical cancer and an estimated 4,210 will die from the disease.
Approximately 0.6 percent of women will be diagnosed with cervical cancer at some
point during their lifetime, based on 2012-2014 data.
Figure 28
There is ample epidemiological evidence to suggest that screening can reduce the
number of deaths from cervical cancer. Invasive cervical cancer is preceded in a large
proportion of cases by pre-cancerous changes in cervical tissue that can be identified with
a Pap test. If cervical cancer is detected early, the likelihood of survival is almost 100
0
20
40
60
80
100
Pe
rce
nt
Pap Test in Past Three Years By Race and Age Group
White
Black

Mississippi Behavioral Risk Factor Surveillance Survey 2016
56
percent with appropriate treatment and follow-up. Risk is substantially decreased among
former smokers in comparison to continuing smokers.
The 2020 National Health Objectives call for an increase to at least 93.0 percent the
proportion of women who receive a cervical cancer screening.
2016 BRFSS data indicate that 90.7 percent of Mississippi women aged 18 and older
has received a Pap test (Table 27). This figure represents a slight increase from 89.6
percent reported in 2014 and also a decrease from 92.8 percent reported in 2012.
The 2016 BRFSS data indicate that 83.0 percent of Mississippi women from ages 21
to 65 have received a Pap test within the preceding one to three years.

Mississippi Behavioral Risk Factor Surveillance Survey 2016
57
Table 27: Female Respondents Who Have Ever Had a Pap Test3
White Black Total
Groups Number1 Percent2 Number1 Percent2 Number1 Percent2
Age Group
18-24 30 66.9* 47 71.0 79 69.3
25-34 125 95.2 129 98.7 262 96.8
35-44 131 97.5 137 94.6 274 96.0
45-54 132 98.9 113 94.5 248 97.0
55-64 177 94.7 120 94.6 300 94.8
65+ 287 91.0 131 87.8 425 89.9
Education
< High School Graduate 74 88.9 107 87.5 184 88.2
High School Graduate or GED 235 86.2 209 88.3 451 87.1
Some College or Technical School 264 92.7 163 89.8 433 91.6
College Graduate 320 93.8 206 98.2 539 95.4
Income
< $15,000 74 87.1 163 91.4 241 89.2
$15-$24,999 141 88.8 186 91.3 335 90.4
$25-$34,999 80 93.0 77 98.8 165 96.2
$35-$49,999 101 88.3 75 90.4 177 89.1
$50-$74,999 118 98.3 44 90.0* 164 96.5
$75,000+ 190 98.3 36 100.0* 228 98.5
Employment Status
Employed 391 90.0 350 94.7 754 92.2
Not Employed 44 92.9* 60 92.7 106 92.9
Student/Homemaker 125 90.2 39 63.7 168 83.6
Retired/Unable to Work 333 92.5 235 90.2 578 91.4
Total 894 90.8 685 90.5 1,608 90.7
1Unweighted
2Weighted
3 Denominator is females who have never had a hysterectomy
*Denominator < 50

Mississippi Behavioral Risk Factor Surveillance Survey 2016
58
Table 28: Had a Pap Test in Past 3 Years (Age 21-65)
White Black Total
Groups Number1 Percent2 Number1 Percent2 Number1 Percent2
Age Group
18-24 21 75.9* 36 87.5* 59 82.2
25-34 111 84.6 118 90.5 236 87.5
35-44 108 77.2 133 92.8 246 84.2
45-54 107 81.5 96 78.0 206 80.1
55-64 143 79.1 96 75.5 241 77.8
65+ 11 77.0 12 81.9 24 80.0
Education
< High School Graduate 37 77.4 50 71.8 88 74.4
High School Graduate or GED 95 70.5 141 82.1 240 76.7
Some College or Technical School 158 82.0 133 92.5 296 86.4
College Graduate 211 86.2 167 93.9 388 89.1
Income
< $15,000 35 71.9 109 80.2 147 77.0
$15-$24,999 54 64.6 145 87.2 205 77.9
$25-$34,999 38 76.2 62 92.7 104 85.0
$35-$49,999 60 87.0 63 99.3 123 91.5
$50-$74,999 83 87.4 35 87.1* 120 87.7
$75,000+ 158 95.4 29 99.4* 188 95.9
Employment Status
Employed 319 84.2 307 88.8 638 86.5
Not Employed 26 62.5* 45 76.3 73 70.9
Student/Homemaker 78 78.9 27 92.7* 108 81.4
Retired/Unable to Work 78 74.0 111 81.7 192 77.3
Total 501 80.1 491 86.5 1,012 83.0
1Unweighted
2Weighted
3 Denominator is females who have never had a hysterectomy
*Denominator < 50

Mississippi Behavioral Risk Factor Surveillance Survey 2016
59
Prostate Cancer Screening
Survey Question
A Prostate-Specific Antigen test, also called a PSA test, is a blood test
used to check men for prostate cancer. Have you ever had a PSA test?
The public health burden of prostate cancer is substantial. For the United States in
2017, the American Cancer Society estimates there will be 161,360 new cases of prostate
cancer and 27,730 deaths from the disease making it the most frequent cancer among
men with the exception of skin cancer. For a male, the lifetime risk of prostate cancer is
one in six. Prostate cancer is the second leading cause of cancer death in men, exceeded
only by lung cancer.
Figure 29
Some men with prostate cancer remain asymptomatic and die from unrelated causes
rather than as a result of the cancer itself. This may be due to the advanced age of many
men at the time of diagnosis, slow tumor growth, or response to therapy. The estimated
number of men with latent prostate carcinoma (i.e., prostate cancer that is present in the
prostate gland but never detected or diagnosed during a patient’s life) is greater than the
number of men with clinically detected disease. A better understanding is needed of the
genetic and biologic mechanisms that determine why some prostate carcinomas remain
clinically silent, while others cause serious, even life-threatening illness.
In 2015 the death rate in Mississippi among males for prostate cancer was 21.8 per
100,000 male population which is a decrease from 21.2 reported in 2014. The mortality
0
20
40
60
80
100
Pe
rce
nt
Ever Had PSA Test By Race and Age Group
White
Black

Mississippi Behavioral Risk Factor Surveillance Survey 2016
60
rate for whites was 18.3 and 19.5 respectively for 2014 and 2015 and for blacks it was
27.8 and 27.2 in the same years.
Prostate cancer is most common in men aged 65 years and older, who account for
approximately 80 percent of all cases of prostate cancer. Digital rectal examination
(DRE) and the prostate-specific antigen (PSA) test are two commonly used methods for
detecting prostate cancer.
The 2016 BRFSS survey for Mississippi indicated that 56.8 percent of males more
than 40 years of age reported ever having had a PSA test. The overall rate for white
respondents was 58.4 percent while blacks reported a rate of 54.1 percent. There was a
greater difference in rates for men age 65 and older. In the 65 and older age group, the
screening rate for whites was 77.0 percent compared to 72.5 percent for blacks.
Figure 30
For males over 40 years of age, 56.3 percent reported having a PSA test within the
past two years. The rate for white respondents was 55.2 percent compared to 58.4
percent for blacks. For men more than 65 years of age, white males reported a rate of
37.1 percent while in the black group the rate was 41.1 percent.
0
20
40
60
80
100
Pe
rce
nt
PSA Test in Past Two Years By Race and Age Group
White
Black

Mississippi Behavioral Risk Factor Surveillance Survey 2016
61
Table 29: Ever Had a PSA Test (Males Age 40+)
White Black Total
Groups Number1 Percent2 Number1 Percent2 Number1 Percent2
Age Group
40-44 16 27.1 17 45.4* 34 35.9
45-54 75 40.5 54 41.8 130 39.8
55-64 161 66.0 84 57.4 248 63.4
65+ 325 77.0 91 72.5 420 75.9
Education
< High School Graduate 41 44.1 59 52.8 102 48.7
High School Graduate or GED 155 53.2 86 46.5 243 50.3
Some College or Technical School 145 62.4 54 60.2 201 61.7
College Graduate 240 71.6 51 69.1 294 69.7
Income
< $15,000 35 42.9 42 47.0 78 44.9
$15-$24,999 77 56.1 62 52.7 139 53.5
$25-$34,999 57 53.1 26 48.0* 84 52.4
$35-$49,999 70 61.7 29 54.7 101 58.9
$50-$74,999 79 58.4 25 55.4* 106 58.1
$75,000+ 179 62.5 34 73.8* 214 63.8
Employment Status
Employed 225 50.0 93 46.1 323 48.4
Not Employed 9 18.2* 8 43.8* 17 29.0
Student/Homemaker 1 40.0* 1 100.0* 2 42.3
Retired/Unable to Work 345 70.2 147 63.7 496 68.1
Total 581 58.4 250 54.1 840 56.8
1Unweighted
2Weighted
*Denominator < 50

Mississippi Behavioral Risk Factor Surveillance Survey 2016
62
Table 30: Had PSA Test in Past 2 Years (Males 40+)
White Black Total
Groups Number1 Percent2 Number1 Percent2 Number1 Percent2
Age Group
40-44 48 85.5 34 65.9* 83 75.6
45-54 124 72.8 81 68.8 213 72.2
55-64 109 48.3 84 56.2 195 50.7
65+ 115 37.1 42 41.1 159 38.0
Education
< High School Graduate 64 72.8 66 65.5 132 68.3
High School Graduate or GED 136 57.9 102 63.6 241 60.3
Some College or Technical School 96 52.3 48 48.4 145 51.1
College Graduate 99 42.0 24 45.0 130 43.7
Income
< $15,000 47 71.0 51 70.7 99 70.7
$15-$24,999 61 56.7 67 59.1 131 58.7
$25-$34,999 51 61.4 25 58.4* 78 59.0
$35-$49,999 41 48.7 34 65.9 76 54.8
$50-$74,999 58 61.9 17 47.7* 76 58.4
$75,000+ 90 50.0 11 30.5* 104 47.0
Employment Status
Employed 209 63.5 122 64.5 340 63.9
Not Employed 18 84.7* 14 81.9* 32 83.6
Student/Homemaker 1 60.0* 0 0.0* 1 60.0
Retired/Unable to Work 167 44.1 105 49.4 276 45.7
Total 396 55.2 241 58.4 650 56.3
1Unweighted
2Weighted
*Denominator < 50

Mississippi Behavioral Risk Factor Surveillance Survey 2016
63
Colorectal Cancer Screening
Survey Question
A sigmoidoscopy and colonoscopy are exams in which a tube is
inserted in the rectum to view the colon for signs of cancer or other
health problems. Have you ever had either of these exams?
According to CDC, of cancers affecting both men and women, colorectal cancer
(CRC), cancer of the colon and rectum, is the second leading cancer killer in the United
States. In the U.S. in 2014, there were 139,992 people who were diagnosed with
colorectal cancer, and 51,651 deaths from it. CDC estimates that screening could prevent
up to 60 percent of the deaths from this form of cancer.
The American Cancer Society (ACS) estimates that in 2017 there will be 135,430
new cases of colorectal cancer with 50,260 deaths from the disease. The ACS also
estimates that in the same year Mississippi will experience 17,290 new cases of colorectal
cancer with 6,560 deaths.
In the past 15 years there have been fewer cases of colorectal cancer with a
consequent decrease in death rates. Screening tests help identify polyps that can be
removed before they develop into cancer. When detected early the cancer is easier to
cure. Improved treatment protocols have also contributed to the decrease in mortality.
Figure 31
0
20
40
60
80
Pe
rce
nt
Never Had Colonoscopy or Sigmoidoscopy
(Age 50+) By Race and Age Group
White
Black

Mississippi Behavioral Risk Factor Surveillance Survey 2016
64
Risk factors for CRC may include age, personal and family history of polyps or
colorectal cancer, inflammatory bowel disease, inherited syndromes, physical inactivity
(colon only), obesity, alcohol use and a diet high in fat and low in fruits and vegetables.
Fecal Occult Blood Testing and sigmoidoscopy are widely used to screen for CRC, along
with barium enema and colonoscopy tests.
In 2015 the death rate for colorectal cancer in Mississippi was 84.6 per 100,000
among people age sixty-five and older; in 2014 it was 88.2. Colonoscopy and
sigmoidoscopy examinations are designed to detect colorectal cancer and other problems
at an early stage to enhance the success of medical intervention. Regular screening,
beginning at age 50, is the key to preventing colorectal cancer. The U.S. Preventive
Services Task Force (USPSTF) recommends screening for colorectal cancer using high-
sensitivity fecal occult blood testing, sigmoidoscopy, or colonoscopy beginning at age 50
years and continuing until age 75 years.
Figure 32
The 2016 BRFSS data for Mississippi indicates that for people age 50 and older 36.2
percent of those surveyed had never had sigmoidoscopy or colonoscopy examination. In
the 2014 survey the rate was 37.1 percent. The survey showed that black respondents
were more than 1.2 times more likely to have never had an examination.
The rate for blacks was 42.8 percent compared to 32.9 percent for whites. Blacks
who are age 65 or older were also 1.4 times more likely to have never had a
sigmoidoscopy or colonoscopy: 31.0 for blacks and 22.6 for whites (Figure 31 and Table
31).
0
20
40
60
Pe
rce
nt
Never Had Colonoscopy or Sigmoidoscopy (Age 50+)
By Race and Income Level
White
Black
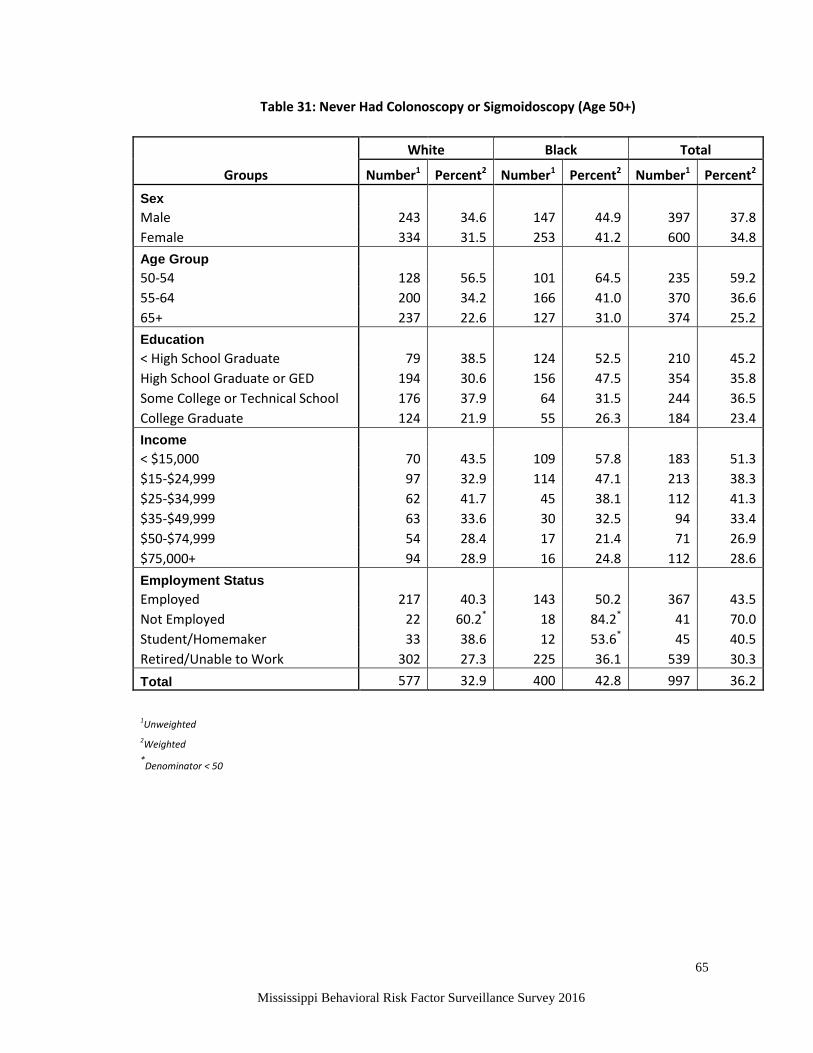
Mississippi Behavioral Risk Factor Surveillance Survey 2016
65
Table 31: Never Had Colonoscopy or Sigmoidoscopy (Age 50+)
White Black Total
Groups Number1 Percent2 Number1 Percent2 Number1 Percent2
Sex
Male 243 34.6 147 44.9 397 37.8
Female 334 31.5 253 41.2 600 34.8
Age Group
50-54 128 56.5 101 64.5 235 59.2
55-64 200 34.2 166 41.0 370 36.6
65+ 237 22.6 127 31.0 374 25.2
Education
< High School Graduate 79 38.5 124 52.5 210 45.2
High School Graduate or GED 194 30.6 156 47.5 354 35.8
Some College or Technical School 176 37.9 64 31.5 244 36.5
College Graduate 124 21.9 55 26.3 184 23.4
Income
< $15,000 70 43.5 109 57.8 183 51.3
$15-$24,999 97 32.9 114 47.1 213 38.3
$25-$34,999 62 41.7 45 38.1 112 41.3
$35-$49,999 63 33.6 30 32.5 94 33.4
$50-$74,999 54 28.4 17 21.4 71 26.9
$75,000+ 94 28.9 16 24.8 112 28.6
Employment Status
Employed 217 40.3 143 50.2 367 43.5
Not Employed 22 60.2* 18 84.2* 41 70.0
Student/Homemaker 33 38.6 12 53.6* 45 40.5
Retired/Unable to Work 302 27.3 225 36.1 539 30.3
Total 577 32.9 400 42.8 997 36.2
1Unweighted
2Weighted
*Denominator < 50

Mississippi Behavioral Risk Factor Surveillance Survey 2016
66
Table 32: No Blood Stool Test in Past 2 Years (Age 50-75)
White Black Total
Groups Number1 Percent2 Number1 Percent2 Number1 Percent2
Sex
Male 552 88.4 267 86.6 834 88.0
Female 835 93.8 513 94.3 1,368 94.0
Age Group
50-54 216 95.1 157 92.9 383 94.4
55-64 569 91.8 369 91.4 950 91.8
65+ 602 87.7 254 87.9 869 87.9
Education
< High School Graduate 133 89.2 187 92.1 329 90.8
High School Graduate or GED 421 92.0 278 93.1 710 92.5
Some College or Technical School 410 91.7 166 88.9 583 91.0
College Graduate 423 90.2 148 85.7 579 89.4
Income
< $15,000 125 90.5 183 94.2 315 92.6
$15-$24,999 219 91.0 212 91.2 436 91.2
$25-$34,999 119 91.4 85 90.0 210 91.1
$35-$49,999 156 90.3 77 90.6 234 90.2
$50-$74,999 177 91.0 53 86.0 232 90.2
$75,000+ 321 89.2 43 74.4 369 87.5
Employment Status
Employed 529 93.3 277 92.3 818 93.1
Not Employed 39 82.5 19 92.7 59 86.6
Student/Homemaker 68 95.0 14 95.8 82 95.1
Retired/Unable to Work 750 89.6 468 89.5 1,240 89.7
Total 1,387 91.1 780 90.8 2,202 91.2
1Unweighted
2Weighted
*Denominator < 50

Mississippi Behavioral Risk Factor Surveillance Survey 2016
67
Immunization
Survey Question
A flu shot is an influenza vaccine injected in your arm. During the
past 12 months, have you had a flu shot or have you had a flu vaccine
that was sprayed in your nose?
Influenza and pneumonia was the eighth leading cause of death in Mississippi for
2015 producing a death rate of 26.4 per 100,000 population.
The Healthy People 2020 goal for influenza vaccinations is that 90 percent of the
non-institutionalized people age 65 and older have been vaccinated in the preceding
twelve months. The target for those in the 18 to 64 age group who are non-
institutionalized is 80 percent. Influenza vaccine can prevent the disease and its
complications. In the elderly, the vaccine is less effective in disease prevention, but
reduces severity of disease and the incidence of complications and death. It is an
important intervention to reduce hospitalizations due to complications of influenza.
Influenza vaccine is recommended for all persons 65 years of age and older, and for those
with chronic health problems which put them at risk for complications.
Figure 33
In the 2016 BRFSS survey, 61.7 percent of the respondents age 65 and older
reported they had received the influenza vaccine in the last 12 months. The proportion
vaccinated in this age group reflected a substantial difference according to race: 66.8
0
20
40
60
80
Pe
rce
nt
Flu Vaccination in Past 12 Months By Race and Age Group
White
Black

Mississippi Behavioral Risk Factor Surveillance Survey 2016
68
percent of whites reported having been vaccinated compared to only 47.0 percent for
blacks. For the total population the vaccination rate among females was 38.8 percent
compared to a rate of 35.5 percent for males.
Only 30.8 percent of the respondents said that they had ever received a pneumonia
vaccination. Respondents over the age of 65 reported a vaccination rate of 65.6 percent.
As was the case with influenza vaccinations there was a marked difference in this age
category with respect to race: 71.7 percent for whites but only 48.4 percent for blacks.

Mississippi Behavioral Risk Factor Surveillance Survey 2016
69
Table 33: Flu Vaccination in Past 12 Months
White Black Total
Groups Number1 Percent2 Number1 Percent2 Number1 Percent2
Sex
Male 530 38.2 219 29.7 764 35.5
Female 934 44.2 411 30.5 1,364 38.8
Age Group
18-24 25 19.7 24 22.1 53 22.1
25-34 89 29.1 56 23.1 149 26.6
35-44 102 34.9 70 25.6 177 31.2
45-54 137 33.7 106 31.3 249 32.8
55-64 277 42.1 147 33.4 429 39.1
65+ 820 66.8 218 47.0 1,048 61.7
Education
< High School Graduate 117 35.9 140 34.6 265 35.4
High School Graduate or GED 428 37.6 199 29.5 635 34.5
Some College or Technical School 407 41.8 125 24.5 538 35.8
College Graduate 510 49.3 166 37.4 688 45.7
Income
< $15,000 115 40.9 150 31.5 271 35.1
$15-$24,999 224 37.6 134 25.0 361 31.0
$25-$34,999 132 39.7 64 29.1 204 36.9
$35-$49,999 173 42.6 75 33.4 250 39.6
$50-$74,999 181 40.9 55 33.3 238 38.9
$75,000+ 312 42.3 47 36.3 367 41.8
Employment Status
Employed 501 36.3 222 24.0 739 31.7
Not Employed 27 19.2 25 19.6 52 19.3
Student/Homemaker 84 24.9 30 34.4 118 27.7
Retired/Unable to Work 850 56.7 352 42.7 1,216 51.8
Total 1,464 41.2 630 30.1 2,128 37.2
1Unweighted
2Weighted

Mississippi Behavioral Risk Factor Surveillance Survey 2016
70
Table 34: Flu Vaccination in Past 12 Months (Age 65+)
White Black Total
Groups Number1 Percent2 Number1 Percent2 Number1 Percent2
Sex
Male 271 62.6 66 44.3 339 58.2
Female 549 70.2 152 48.9 709 64.4
Education
< High School Graduate 78 62.3 73 50.0 155 57.1
High School Graduate or GED 292 68.8 56 43.1 349 63.3
Some College or Technical School 215 67.0 36 42.8 253 62.4
College Graduate 234 67.2 53 52.4 290 64.1
Income
< $15,000 78 68.5 58 52.5 139 62.1
$15-$24,999 148 62.9 52 38.2 202 54.4
$25-$34,999 84 67.5 21 54.5 107 64.3
$35-$49,999 98 66.7 16 50.0 114 63.4
$50-$74,999 88 66.6 14 69.3 102 66.8
$75,000+ 101 61.5 11 64.4 113 61.7
Employment Status
Employed 80 55.8 18 49.2 98 54.3
Not Employed 7 66.6 1 100.0 8 68.6
Student/Homemaker 43 70.1 4 43.9 47 66.4
Retired/Unable to Work 690 68.3 195 46.8 895 62.4
Total 820 66.8 218 47.0 1,048 61.7
1Unweighted
2Weighted
*Denominator < 50

Mississippi Behavioral Risk Factor Surveillance Survey 2016
71
Table 35: Ever Had Pneumonia Vaccination
White Black Total
Groups Number1 Percent2 Number1 Percent2 Number1 Percent2
Sex
Male 424 33.9 174 26.3 605 30.8
Female 821 37.1 301 20.1 1,142 30.9
Age Group
18-24 27 26.0 17 19.1 47 24.4
25-34 46 18.0 22 11.4 71 15.6
35-44 44 18.5 41 13.9 88 16.3
45-54 74 19.9 68 22.5 146 20.8
55-64 175 29.7 112 25.5 290 28.2
65+ 868 71.7 212 48.4 1,091 65.6
Education
< High School Graduate 121 36.9 105 29.0 231 32.3
High School Graduate or GED 417 36.6 143 19.9 565 29.9
Some College or Technical School 358 36.9 113 23.3 478 32.5
College Graduate 347 31.0 114 18.5 471 27.9
Income
< $15,000 130 50.0 119 25.9 255 35.6
$15-$24,999 248 41.0 113 20.6 366 30.7
$25-$34,999 115 33.5 46 23.0 167 30.5
$35-$49,999 147 34.8 45 20.4 193 29.1
$50-$74,999 129 29.7 34 17.6 165 27.2
$75,000+ 181 25.5 34 32.6 217 26.6
Employment Status
Employed 232 18.7 126 14.2 368 17.3
Not Employed 26 31.2 20 13.6 46 21.3
Student/Homemaker 85 28.7 21 27.7 109 29.4
Retired/Unable to Work 899 61.2 308 38.6 1,221 53.4
Total 1,245 35.6 475 22.8 1,747 30.8
1Unweighted
2Weighted

Mississippi Behavioral Risk Factor Surveillance Survey 2016
72
Table 36: Ever Had Pneumonia Vaccination (Age 65+)
White Black Total
Groups Number1 Percent2 Number1 Percent2 Number1 Percent2
Sex
Male 267 65.8 63 45.4 332 60.7
Female 601 76.5 149 50.4 759 69.3
Education
< High School Graduate 79 67.8 62 47.2 143 57.9
High School Graduate or GED 328 78.0 54 45.0 384 71.2
Some College or Technical School 225 70.4 42 50.3 270 66.8
College Graduate 235 66.3 54 56.0 293 64.6
Income
< $15,000 82 76.1 54 52.7 138 65.7
$15-$24,999 179 78.8 55 46.0 237 67.5
$25-$34,999 88 67.0 21 53.6* 111 63.7
$35-$49,999 99 67.0 18 59.9* 118 65.6
$50-$74,999 88 75.7 12 62.2* 100 74.5
$75,000+ 104 65.5 9 50.1* 114 63.7
Employment Status
Employed 73 44.9 19 49.0* 93 45.9
Not Employed 5 55.4* 1 100.0* 6 58.6
Student/Homemaker 51 85.4 4 27.2* 55 76.3
Retired/Unable to Work 738 75.0 188 48.9 936 67.7
Total 868 71.7 212 48.4 1,091 65.6
1Unweighted
2Weighted
*Denominator < 50

Mississippi Behavioral Risk Factor Surveillance Survey 2016
73
Overweight and Obesity
Survey Question
There is no survey question that solicits the respondent to provide his
body mass index (BMI) rather it is calculated from the reported height
and weight. See the “Definitions” section for the formula.
The proportion of overweight persons has increased substantially during the past
twenty-five years. Morbidity related to being overweight is the second leading cause of
death in the United States and causes approximately 300,000 deaths each year.
Overweight persons substantially increase their risk of illness from hypertension, high
cholesterol, Type 2 diabetes, heart disease and stroke, gallbladder disease, cancer of the
endometrium, breast, prostate and colon as well as arthritis. Overweight people may also
suffer from social stigmatization, discrimination and low self-esteem.
Figure 34
Weight may be controlled by dietary changes such as decreasing caloric intake and
by increasing physical activity. According to the 2016 BRFSS study 71.2 percent of
those surveyed in Mississippi reported themselves as being either overweight ( BMI ≥
25) or obese (BMI ≥30). The rate for whites was 68.0 percent compared to 78.0 percent
for blacks (Table 37). In year 2015 the self-reported rate was 70.1 percent and in 2014 it
was 68.7 percent.
0
20
40
60
80
100
Pe
rce
nt
Persons Overweight or Obese By Race and Age Group
White
Black

Mississippi Behavioral Risk Factor Surveillance Survey 2016
74
Figure 35
0
15
30
45
60
75
90P
erc
en
t
Persons Who Are Overweight or Obese By Race and Income Level
White
Black

Mississippi Behavioral Risk Factor Surveillance Survey 2016
75
Table 37: Overweight or Obese
White Black Total
Groups Number1 Percent2 Number1 Percent2 Number1 Percent2
Sex
Male 922 75.3 481 74.1 1,433 74.1
Female 1,036 60.6 946 81.3 2,008 68.5
Age Group
18-24 56 49.2 57 51.1 118 49.5
25-34 176 68.6 183 85.4 370 74.5
35-44 210 73.7 219 81.7 437 76.8
45-54 309 77.1 268 87.9 591 80.8
55-64 449 74.1 342 76.8 798 75.2
65+ 751 62.9 348 82.0 1,110 67.7
Education
< High School Graduate 178 66.8 257 77.6 445 70.4
High School Graduate or GED 613 68.4 488 75.1 1,122 70.8
Some College or Technical School 568 70.2 348 82.0 925 74.1
College Graduate 598 64.5 333 76.1 947 67.5
Income
< $15,000 166 65.8 297 71.7 472 68.4
$15-$24,999 314 66.9 397 80.6 723 72.5
$25-$34,999 181 60.3 152 78.7 343 67.8
$35-$49,999 251 71.1 163 78.1 419 73.1
$50-$74,999 281 80.5 105 85.1 392 81.4
$75,000+ 438 70.7 103 84.6 548 72.5
Employment Status
Employed 867 70.9 683 82.2 1,581 74.6
Not Employed 65 66.0 75 60.7 141 62.4
Student/Homemaker 119 52.5 46 55.0 169 53.0
Retired/Unable to Work 906 68.7 622 79.1 1,547 72.2
Total 1,958 68.0 1,427 78.0 3,441 71.2
1Unweighted
2Weighted

Mississippi Behavioral Risk Factor Surveillance Survey 2016
76
Table 38: Obese
White Black Total
Groups Number1 Percent2 Number1 Percent2 Number1 Percent2
Sex
Male 404 33.6 253 39.4 674 35.2
Female 512 30.9 630 53.6 1,159 39.5
Age Group
18-24 18 17.6 31 25.1 50 20.1
25-34 82 33.4 114 48.9 200 38.4
35-44 118 41.4 154 56.4 278 47.9
45-54 165 39.8 183 56.1 357 45.5
55-64 217 35.2 213 48.0 436 40.0
65+ 314 26.1 182 44.9 504 31.1
Education
< High School Graduate 81 26.2 160 44.7 250 34.3
High School Graduate or GED 298 34.5 301 44.8 610 38.3
Some College or Technical School 281 35.7 228 51.4 514 41.0
College Graduate 255 27.6 193 46.1 457 32.2
Income
< $15,000 84 30.7 209 49.9 301 41.6
$15-$24,999 159 33.4 256 52.5 422 41.9
$25-$34,999 91 32.2 84 43.3 181 36.5
$35-$49,999 122 34.1 95 40.6 219 35.9
$50-$74,999 131 39.1 61 44.2 195 40.0
$75,000+ 172 28.1 56 52.9 232 32.4
Employment Status
Employed 414 34.4 419 48.5 847 39.1
Not Employed 27 28.2 52 41.5 79 33.9
Student/Homemaker 47 22.4 27 28.4 77 24.6
Retired/Unable to Work 427 32.4 384 49.6 827 38.6
Total 916 32.3 883 47.1 1,833 37.4
1Unweighted
2Weighted

Mississippi Behavioral Risk Factor Surveillance Survey 2016
77
Exercise
Survey Question
During the past month, other than your regular job, did you
participate in any physical activities or exercises such as running,
calisthenics, golf, gardening, or walking for exercise?
On average, physically active people outlive those who are inactive. Regular
physical activity helps to maintain the functional independence of older adults and
enhances the quality of life for people of all ages. The role of physical activity in
preventing coronary heart disease (CHD) is of particular importance, given that CHD is
the leading cause of death and disability in the United States and in Mississippi.
Physically inactive people are almost twice as likely to develop CHD as persons who
engage in regular physical activity. The risk posed by physical inactivity is almost as high
as several well-known CHD risk factors such as cigarette smoking, high blood pressure
and high blood cholesterol. Physical inactivity is more prevalent than any other of these
risk factors.
Figure 36
Regular physical activity is important for people who have joint or bone problems
and has been shown to improve muscle function, cardiovascular function, and physical
performance. People with osteoporosis may respond positively to regular physical
activity, particularly weight-bearing activities such as walking and especially when
combined with appropriate drug therapy and calcium intake.
0
10
20
30
40
50
Pe
rce
nt
No Exercise in Past 30 Days By Race and Education Level
White
Black

Mississippi Behavioral Risk Factor Surveillance Survey 2016
78
In Mississippi, 30.2 percent of the population is reported as not participating in any
physical activity outside of work in the past 30 days. People with less education (Figure
36) and in lower income levels (Figure 37) reported the highest percentage of physical
inactivity.
Figure 37
0
10
20
30
40
50
60
Pe
rce
nt
No Exercise in Past 30 Days By Race and Income Level
White
Black
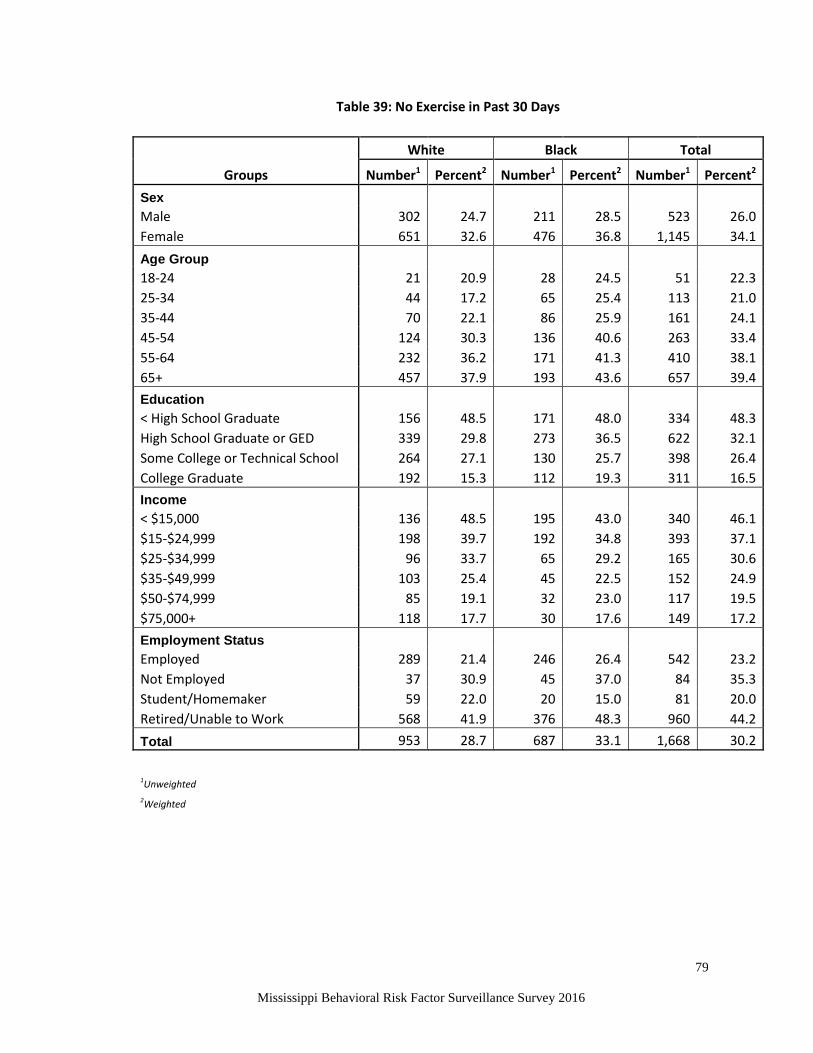
Mississippi Behavioral Risk Factor Surveillance Survey 2016
79
Table 39: No Exercise in Past 30 Days
White Black Total
Groups Number1 Percent2 Number1 Percent2 Number1 Percent2
Sex
Male 302 24.7 211 28.5 523 26.0
Female 651 32.6 476 36.8 1,145 34.1
Age Group
18-24 21 20.9 28 24.5 51 22.3
25-34 44 17.2 65 25.4 113 21.0
35-44 70 22.1 86 25.9 161 24.1
45-54 124 30.3 136 40.6 263 33.4
55-64 232 36.2 171 41.3 410 38.1
65+ 457 37.9 193 43.6 657 39.4
Education
< High School Graduate 156 48.5 171 48.0 334 48.3
High School Graduate or GED 339 29.8 273 36.5 622 32.1
Some College or Technical School 264 27.1 130 25.7 398 26.4
College Graduate 192 15.3 112 19.3 311 16.5
Income
< $15,000 136 48.5 195 43.0 340 46.1
$15-$24,999 198 39.7 192 34.8 393 37.1
$25-$34,999 96 33.7 65 29.2 165 30.6
$35-$49,999 103 25.4 45 22.5 152 24.9
$50-$74,999 85 19.1 32 23.0 117 19.5
$75,000+ 118 17.7 30 17.6 149 17.2
Employment Status
Employed 289 21.4 246 26.4 542 23.2
Not Employed 37 30.9 45 37.0 84 35.3
Student/Homemaker 59 22.0 20 15.0 81 20.0
Retired/Unable to Work 568 41.9 376 48.3 960 44.2
Total 953 28.7 687 33.1 1,668 30.2
1Unweighted
2Weighted
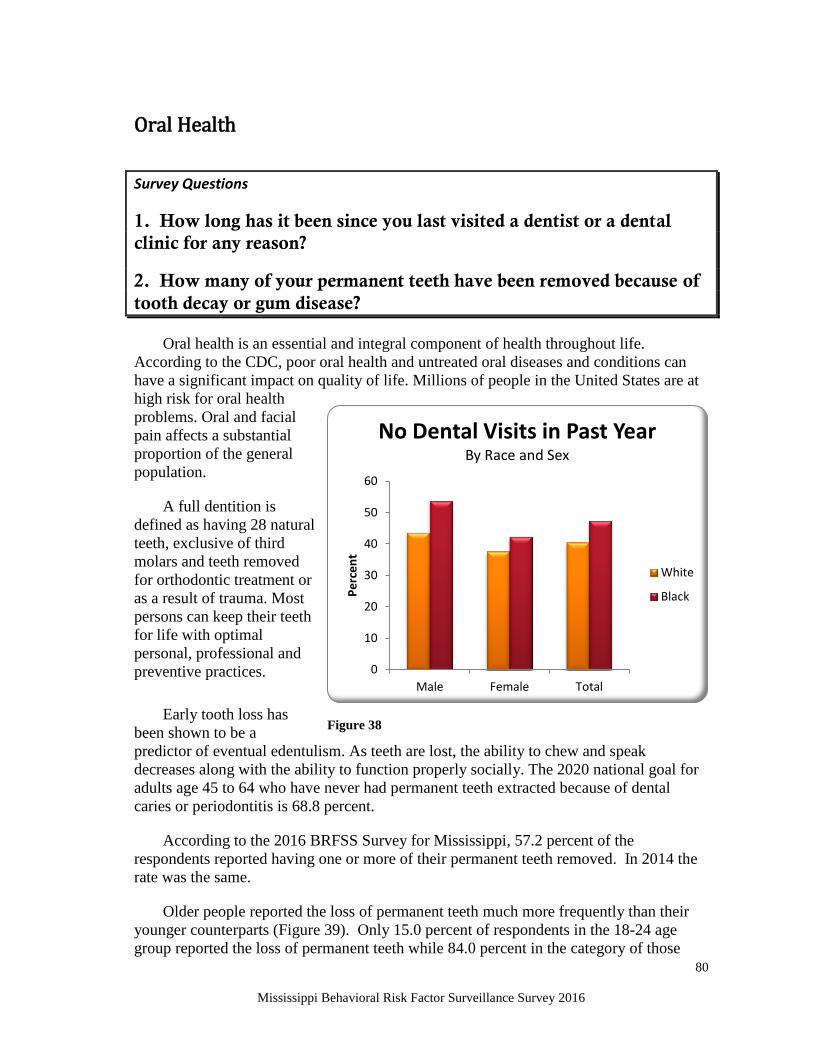
Mississippi Behavioral Risk Factor Surveillance Survey 2016
80
0
10
20
30
40
50
60
Male Female Total
Pe
rce
nt
No Dental Visits in Past Year By Race and Sex
White
Black
Oral Health
Survey Questions
1. How long has it been since you last visited a dentist or a dental
clinic for any reason?
2. How many of your permanent teeth have been removed because of
tooth decay or gum disease?
Oral health is an essential and integral component of health throughout life.
According to the CDC, poor oral health and untreated oral diseases and conditions can
have a significant impact on quality of life. Millions of people in the United States are at
high risk for oral health
problems. Oral and facial
pain affects a substantial
proportion of the general
population.
A full dentition is
defined as having 28 natural
teeth, exclusive of third
molars and teeth removed
for orthodontic treatment or
as a result of trauma. Most
persons can keep their teeth
for life with optimal
personal, professional and
preventive practices.
Early tooth loss has
been shown to be a
predictor of eventual edentulism. As teeth are lost, the ability to chew and speak
decreases along with the ability to function properly socially. The 2020 national goal for
adults age 45 to 64 who have never had permanent teeth extracted because of dental
caries or periodontitis is 68.8 percent.
According to the 2016 BRFSS Survey for Mississippi, 57.2 percent of the
respondents reported having one or more of their permanent teeth removed. In 2014 the
rate was the same.
Older people reported the loss of permanent teeth much more frequently than their
younger counterparts (Figure 39). Only 15.0 percent of respondents in the 18-24 age
group reported the loss of permanent teeth while 84.0 percent in the category of those
Figure 38

Mississippi Behavioral Risk Factor Surveillance Survey 2016
81
over age 65 reported losing permanent teeth. The rate for white respondents reporting
tooth loss was 53.9 percent; for blacks it was 64.8 percent.
Oral health diseases such as tooth decay and periodontal diseases are common health
problems in Mississippi, yet 43.0 percent of respondents from the 2016 BRFSS Survey
reported that they had not seen a dentist within the last twelve months (Table 40). Failure
to see a dentist within the past year was observed most frequently among white
respondents with an annual income of less than $15,000 who reported a rate of 74.2
percent. Next were blacks who report an annual income of less than $15,000 with a rate
of 62.4 percent followed by black respondents with less than a high school education
with a rate of 66.8 percent.
Figure 39
As has been the case historically, people with incomes above $75,000 per year have
the most frequent dental visits within the past year. Only 22.5 percent of this group
report that it has been more than one year since the last visit. The survey revealed that as
the income of the respondent decreases, so also the number of people with no dental
visits increases. With respect to race, 53.7 percent of the black males reported no visits
to a dental facility within the past year compared to 43.6 percent for white males. The
rate for black females was 42.3 percent while white females reported a rate of 37.7
percent (Table 40).
0
20
40
60
80
100
Pe
rce
nt
One or More Permanent Teeth Removed
By Race and Age Group
White
Black

Mississippi Behavioral Risk Factor Surveillance Survey 2016
82
Table 40: No Dental Visits in Past Year
White Black Total
Groups Number1 Percent2 Number1 Percent2 Number1 Percent2
Sex
Male 484 43.6 357 53.7 862 47.1
Female 654 37.7 570 42.3 1,243 39.2
Age Group
18-24 40 32.3 43 39.0 86 34.8
25-34 110 39.5 91 40.3 206 39.3
35-44 122 41.4 120 41.5 249 42.0
45-54 165 44.2 160 49.6 332 46.0
55-64 247 42.1 247 57.2 500 47.3
65+ 447 42.0 259 61.1 718 47.0
Education
< High School Graduate 194 65.1 235 66.8 440 66.0
High School Graduate or GED 424 45.0 347 48.7 790 46.5
Some College or Technical School 334 38.8 179 40.3 517 38.9
College Graduate 184 20.5 166 32.8 356 23.6
Income
< $15,000 189 74.2 258 62.4 459 67.8
$15-$24,999 252 55.6 275 48.0 536 51.8
$25-$34,999 115 42.9 85 43.8 205 42.2
$35-$49,999 118 38.5 79 38.5 201 39.1
$50-$74,999 99 31.2 31 27.8 133 30.3
$75,000+ 118 22.3 31 23.7 152 22.5
Employment Status
Employed 406 34.9 363 43.8 783 38.3
Not Employed 69 64.2 62 52.2 131 57.9
Student/Homemaker 83 33.3 35 34.2 122 33.4
Retired/Unable to Work 580 48.8 465 55.6 1,067 51.3
Total 1,138 40.6 927 47.4 2,105 43.0
1Unweighted
2Weighted

Mississippi Behavioral Risk Factor Surveillance Survey 2016
83
Table 41: Have Had at Least One Permanent Tooth Extracted
White Black Total
Groups Number1 Percent2 Number1 Percent2 Number1 Percent2
Sex
Male 701 51.5 486 64.5 1,207 54.8
Female 1,125 56.1 890 65.0 2,049 59.5
Age Group
18-24 12 11.1 22 21.5 36 15.0
25-34 86 30.5 118 50.6 209 38.7
35-44 133 45.3 167 59.3 306 50.9
45-54 226 57.7 262 80.2 500 65.3
55-64 423 72.1 385 91.8 819 79.0
65+ 932 81.2 411 91.1 1,361 84.0
Education
< High School Graduate 237 73.2 302 84.6 549 76.0
High School Graduate or GED 666 62.5 491 63.2 1,174 61.7
Some College or Technical School 519 51.2 302 59.8 833 54.4
College Graduate 400 32.9 280 50.0 695 37.4
Income
< $15,000 207 75.0 322 72.7 540 72.7
$15-$24,999 362 69.5 383 67.9 756 68.4
$25-$34,999 196 62.4 133 57.5 340 58.9
$35-$49,999 210 48.3 138 61.0 350 51.2
$50-$74,999 201 46.1 95 65.5 299 49.8
$75,000+ 260 36.3 78 55.7 343 39.1
Employment Status
Employed 563 40.5 560 57.8 1,143 46.3
Not Employed 66 58.2 66 57.4 134 58.1
Student/Homemaker 111 32.3 43 39.0 158 34.2
Retired/Unable to Work 1,083 81.1 706 85.5 1,817 82.8
Total 1,826 53.9 1,376 64.8 3,256 57.2
1Unweighted
2Weighted

Mississippi Behavioral Risk Factor Surveillance Survey 2016
84
Disability
Survey Questions
Are you deaf or do you have serious difficulty hearing?
Are you blind or do you have serious difficulty seeing, even when
wearing glasses?
Because of a physical, mental, or emotional condition, do you have
serious difficulty concentrating, remembering, or making decisions?
Do you have serious difficulty walking or climbing stairs?
Do you have difficulty dressing or bathing?
Because of a physical, mental, or emotional condition, do you have
difficulty doing errands alone such as visiting a doctor’s office or
shopping?
According to the Healthy People 2020 publication, the U.S. Census of 2000 counted
49.7 million people with some type of long-lasting condition or disability. An individual
may sustain a disabling impairment or chronic condition at any point in life. Disability is
part of human life, and an impairment or condition does not define individuals, their
health, or their talents and abilities.
0
10
20
30
40
50
60
70
Pe
rce
nt
Disabled Persons By Race and Age Group
White
Black
Figure 40

Mississippi Behavioral Risk Factor Surveillance Survey 2016
85
People with disabilities play an important and valued role in every community. All
people, including people with disabilities, must have the opportunity to take part in
important daily activities that add to a person’s growth, development, fulfillment, and
community contribution.
According to the Centers for Disease control and Prevention (CDC), people who
have activity limitations report having had more days of pain, depression, anxiety, and
sleeplessness and fewer days of vitality during the previous month than people not
reporting activity limitations. In view of the increased rates of disability, it is important to
target activities and services that address all aspects of health and well-being, as well as
providing access to medical care. For an older person with a disability, it is important to
target conditions that may threaten their well-being.
Figure 41
Before 2016, the BRFSS defined disability in two ways. One was a respondent whose
activity was limited in any way because of physical, mental or emotional problems. The
other was a respondent who had a health problem that required the use of special
equipment such as a cane, wheelchair, special bed or special telephone.
Starting in 2016 disability was defined as anyone with the following conditions:
someone who is deaf or has serious difficulty hearing; someone who is blind or has serious
difficulty seeing even when wearing glasses; someone who because of a physical, mental or
emotional condition has difficulty concentrating, remembering or making decisions; someone
who has difficulty walking or climbing stairs; someone who has difficulty dressing or
bathing; or someone who because of a physical, mental or emotional condition has difficulty
doing errands alone such as visiting a doctor’s office or shopping.
0
10
20
30
40
50
60
70
Pe
rce
nt
Disabled Pesons By Race and Income Level
White
Black

Mississippi Behavioral Risk Factor Surveillance Survey 2016
86
In the 2016 BRFSS survey, 35.3 percent of Mississippians reported that they had
some type if disability. The racial differences were negligible. Whites reported a rate of
35.4 percent compared to 35.0 percent for blacks.
Huge differences among the disabled were observed in the income category. Those
whose annual income was less than $15,000 per year reported a rate of 59.7 percent to
only 15.7 percent for those with an income of at least $75,000 annually. White
respondents who make less than $15,000 reported an astounding rate of being disabled of
66.1 percent; the same group in blacks had a rate of 54.2 percent (Figure 41 and Table
42).

Mississippi Behavioral Risk Factor Surveillance Survey 2016
87
Table 42: Disabled Persons
White Black Total
Groups Number1 Percent2 Number1 Percent2 Number1 Percent2
Sex
Male 441 33.9 246 31.2 702 33.1
Female 749 37.0 522 38.0 1,295 37.2
Age Group
18-24 23 17.0 20 19.9 48 20.2
25-34 57 20.9 43 16.0 105 19.1
35-44 70 24.3 77 24.4 151 24.3
45-54 136 36.1 150 45.9 290 39.0
55-64 262 43.4 223 48.4 492 45.2
65+ 636 54.6 250 63.4 900 57.1
Education
< High School Graduate 189 55.3 214 53.4 413 54.1
High School Graduate or GED 414 37.7 279 34.7 707 36.6
Some College or Technical School 347 34.7 156 29.5 508 32.8
College Graduate 238 19.5 118 20.3 366 19.6
Income
< $15,000 185 66.1 251 54.2 446 59.7
$15-$24,999 252 47.3 221 38.0 482 42.4
$25-$34,999 128 37.5 60 27.0 193 33.5
$35-$49,999 125 33.5 45 18.6 172 28.4
$50-$74,999 96 22.7 27 14.9 124 20.7
$75,000+ 110 15.5 20 15.2 135 15.7
Employment Status
Employed 244 19.9 161 15.6 418 18.8
Not Employed 49 38.5 47 40.3 96 38.5
Student/Homemaker 69 19.8 28 26.5 100 21.5
Retired/Unable to Work 827 63.5 531 69.8 1,381 65.8
Total 1,190 35.4 768 35.0 1,997 35.3
1Unweighted
2Weighted

Mississippi Behavioral Risk Factor Surveillance Survey 2016
88
Alcohol Consumption
Survey Question
Considering all types of alcoholic beverages, how many times during
the past 30 days did you have 5 or more drinks on an occasion?
Excessive drinking has consequences for virtually every part of the human body. The
wide range of alcohol-induced disorders is due, among other factors, to differences in the
amount, duration, and patterns of alcohol consumption, as well as differences in genetic
vulnerability to particular alcohol-related consequences.
Figure 42
Alcohol use has been linked with a substantial proportion of injuries and deaths from
motor vehicle crashes, falls, fires and drowning. It also is a factor in homicide, suicide,
marital violence, and child abuse and has been associated with high-risk sexual behavior.
Persons who drink even relatively small amounts of alcoholic beverages may contribute
to alcohol-related death and injury in occupational incidents especially if they drink
before operating a vehicle. According to CDC, in 2015 there were 10,265 traffic deaths
associated with alcohol consumption representing 29 percent of all motor vehicle crash
fatalities in the United States.
White males 18 to 24 years of age continue to report the highest rates of binge
drinking. In 2016 the rate for this group was 27.4 percent; the rate in 2015 was 26.3
percent.
0
5
10
15
20
25
30
Pe
rce
nt
Binge Drinking By Race and Age Group
White
Black

Mississippi Behavioral Risk Factor Surveillance Survey 2016
89
The 2016 survey also revealed that males were almost 2.5 times more likely than
females to indulge in binge drinking. Only 7.2 percent of female respondents said they
had five or more drinks on one occasion during the last thirty days compared to 18.1
percent for males.

Mississippi Behavioral Risk Factor Surveillance Survey 2016
90
Table 43: Report Binge Drinking
White Black Total
Groups Number1 Percent2 Number1 Percent2 Number1 Percent2
Sex
Male 173 19.9 75 14.5 255 18.1
Female 79 7.1 57 6.8 140 7.2
Age Group
18-24 36 27.4 11 9.3 51 20.8
25-34 57 23.3 27 16.3 86 20.4
35-44 39 15.1 30 10.9 70 13.2
45-54 46 11.3 30 11.5 79 11.4
55-64 50 10.8 26 7.9 76 9.8
65+ 23 2.5 8 3.8 32 2.9
Education
< High School Graduate 22 12.2 18 11.5 42 12.2
High School Graduate or GED 61 11.0 49 10.1 114 11.0
Some College or Technical School 76 14.5 37 10.0 113 12.8
College Graduate 93 15.3 28 8.6 126 14.1
Income
< $15,000 19 10.9 23 7.9 42 8.9
$15-$24,999 21 8.2 37 9.8 61 8.9
$25-$34,999 21 10.6 17 10.2 39 10.7
$35-$49,999 41 18.0 21 16.3 64 18.2
$50-$74,999 35 14.7 11 13.3 48 14.7
$75,000+ 87 20.1 12 12.7 100 18.7
Employment Status
Employed 179 19.2 86 12.8 274 17.0
Not Employed 9 10.7 12 9.9 21 10.2
Student/Homemaker 22 16.2 5 7.0 28 13.7
Retired/Unable to Work 42 4.0 29 6.4 72 4.8
Total 252 13.3 132 10.2 395 12.4
1Unweighted
2Weighted

Mississippi Behavioral Risk Factor Surveillance Survey 2016
91
Table 44: Report Chronic Drinking
White Black Total
Groups Number1 Percent2 Number1 Percent2 Number1 Percent2
Sex
Male 70 8.1 25 4.3 95 6.6
Female 44 3.3 20 2.9 65 3.1
Age Group
18-24 16 12.3 4 4.2 20 8.3
25-34 15 6.3 5 4.7 20 5.4
35-44 17 6.4 9 4.2 26 5.3
45-54 23 5.8 11 3.1 35 4.8
55-64 30 5.5 10 2.6 40 4.5
65+ 13 1.5 6 2.0 19 1.6
Education
< High School Graduate 12 7.2 10 4.8 22 5.9
High School Graduate or GED 27 4.7 20 3.1 47 3.9
Some College or Technical School 28 4.4 10 3.7 39 4.1
College Graduate 47 7.8 5 2.0 52 5.9
Income
< $15,000 9 3.9 9 2.9 18 3.2
$15-$24,999 16 5.0 14 3.2 30 4.0
$25-$34,999 9 3.7 5 4.1 15 3.8
$35-$49,999 14 6.2 7 7.3 21 6.4
$50-$74,999 16 7.5 3 4.8 19 6.8
$75,000+ 32 7.7 2 3.9 34 6.9
Employment Status
Employed 74 7.8 24 4.2 99 6.2
Not Employed 7 5.7 8 6.8 15 6.2
Student/Homemaker 10 6.5 1 0.6 11 4.8
Retired/Unable to Work 23 2.1 12 2.1 35 2.1
Total 114 5.6 45 3.5 160 4.7
1Unweighted
2Weighted

Mississippi Behavioral Risk Factor Surveillance Survey 2016
92
0
2
4
6
8
10
Male Female Total
Pe
rce
nt
Drove Vehicle After Too Many Drinks
By Race and Sex
White
Black
Drinking and Driving
Survey Question
During the past month, how many times have you driven when you
have had perhaps too much to drink?
In 2014 there were 9,967 reported alcohol-related motor vehicle fatalities in the
United States according to the National Highway Traffic Safety Administration
(NHTSA). In the same year Mississippi reported 207 such fatalities which accounted for
approximately 34 percent of all vehicular deaths that year.
Between 2004 and
2013 there were a total
7,575 traffic fatalities on
roadways in Mississippi
and 2,503 or 33 percent of
those, the crash victims
registered a blood alcohol
content of 0.08 percent or
higher. This is an average
of 250 fatalities per year
and accounts for a little
over 33 percent of all
traffic fatalities during the
10 year period.
In Mississippi, males
were much more likely
than females to have driven
after having too much to
drink according to the 2016 BRFSS report. The rate for males was 5.5 percent compared
to only 3.9 for females. White males were more likely to drive after excessive drinking
than white females but black females were more likely than their male counterparts to do
so (see Table 45).
The demographic group that reported the highest rate of drinking and driving was
white respondents age 25 to 34 with a rate of 8.2 percent. Both white respondents age
18-24 and black respondents age 45-54 reported a rate of 6.9 percent. Overall whites
reported a rate of 4.2 percent compared to 4.0 percent for blacks (Table 45).
Figure 43

Mississippi Behavioral Risk Factor Surveillance Survey 2016
93
Table 45: Report Driving While Having Too Much to Drink in Past Month3
White Black Total
Groups Number1 Percent2 Number1 Percent2 Number1 Percent2
Sex
Male 21 5.2 15 3.9 39 5.5
Female 11 2.7 7 4.2 19 3.9
Age Group
18-24 5 6.9 2 5.4 10 10.2
25-34 11 8.2 5 5.3 16 6.6
35-44 1 0.6 3 1.9 5 1.8
45-54 5 3.1 7 6.9 12 4.3
55-64 7 3.9 5 2.1 12 3.3
65+ 3 1.2 0 0.0 3 1.0
Education
< High School Graduate 2 9.0 5 12.4 7 9.7
High School Graduate or GED 7 2.0 8 2.5 18 4.3
Some College or Technical School 9 4.0 4 1.2 13 3.0
College Graduate 14 4.5 5 4.8 20 5.5
Income
< $15,000 3 5.4 5 6.0 8 5.5
$15-$24,999 3 2.1 5 2.0 8 2.0
$25-$34,999 3 5.5 3 9.1 7 10.9
$35-$49,999 3 2.2 6 9.5 9 4.6
$50-$74,999 6 3.2 1 1.3 7 2.7
$75,000+ 7 3.8 2 1.2 10 3.8
Employment Status
Employed 19 4.4 16 3.8 38 5.1
Not Employed 2 3.3* 3 7.1 5 5.2
Student/Homemaker 5 6.8 0 0.0* 6 6.2
Retired/Unable to Work 6 2.3 3 4.1 9 2.9
Total 32 4.2 22 4.0 58 4.8
1Unweighted
2Weighted
3Denominator is those who report drinking *
Denominator < 50

Mississippi Behavioral Risk Factor Surveillance Survey 2016
94
0
5
10
15
20
25
30
35
Male Female Total
Pe
rce
nt
Fall in Past Twelve Months By Race and Sex (Age 45+)
White
Black
Falls
Survey Question
1. The next question asks about a recent fall. By a fall, we mean when
a person unintentionally comes to rest on the ground or another lower
level. In the past twelve months, how many times have you fallen?
2. How many of these falls caused an injury? By an injury, we mean
the fall caused you to limit your regular activities for at least a day or
to go see a doctor.
According to the
CDC, each year one in
every three adults age 65
and older falls. Falls can
cause moderate to severe
injuries, such as hip
fractures and head
injuries, and can increase
the risk of early death.
Fortunately, falls are a
public health problem that
is largely preventable.
Among older adults aged
65 or older, falls are the
leading cause of injury
death. They are also the
most common cause of
nonfatal injuries and
hospital admissions for trauma. In 2013, there were approximately 2.5 million nonfatal
fall injuries among older adults treated in emergency departments and more than 734
thousand of these patients were hospitalized.
Falls are the most common cause of traumatic brain injury. Of those who fall,
twenty to thirty percent suffer moderate to severe injuries such as fracture or head trauma
that reduce mobility and independence, and increases the risk of premature death. Most
fractures among older adults are caused by falls. The most common are fractures of the
spine, hip, forearm, leg, ankle, pelvis, upper arm, and hand. The direct cost of fall
injuries in 2013 for people age 65 and older was $34 billion.
Figure 44

Mississippi Behavioral Risk Factor Surveillance Survey 2016
95
0
10
20
30
40
50
Male Female Total
Pe
rce
nt
Injury From Fall By Race and Sex (Age 45+)
White
Black
One of the strongest predictors of a fall is having sustained a previous fall. A fall is
often a marker of increasing fragility, functional decline, or neurological impairment and
may indicate the need for a secondary prevention strategy such as hip protectors to guard
against hip fractures.
Figure 45
In the 2016 BRFSS survey for Mississippi, the question related to falls was only
asked of those who were 45 year old or older. Of those, 29.4 percent reported that they
had sustained a fall in the past twelve months. White respondents reported a rate of 29.7
percent compared to 29.1
percent for black respondents
(Table 46).
Lower income groups
reported a higher rate of falls
than those with incomes in
the upper group. Those with
incomes less than $15
thousand annually had a rate
of 43.8 percent and those
with incomes in the range of
$15 to $25 thousand annually
reported a rate of 33.8
percent while those with
incomes greater than $75
thousand annually experienced
a rate of 18.6 percent (See Figure 45 and Table 46). Females, at 32.0 percent, reported a
higher rate of falls than males who had a rate of 26.5 percent (Figure 44).
0
10
20
30
40
50
60
Pe
rce
nt
Fall in Past Twelve Months By Race and Income Level (Age 45+)
White
Black
Figure 46

Mississippi Behavioral Risk Factor Surveillance Survey 2016
96
Of those who reported a fall, 42.6 percent said that they sustained an injury from the
fall. As was the case with falls, those in the lower income groups had the higher rates of
injury as was true for females in the survey. Nearly half (47.9 percent) of those with
incomes less than $15 thousand annually reported receiving an injury from the fall and
44.8 percent of the females reported an injury from a fall compared to 39.5 percent for
males (See Figures 46, 47 and Table 47).
Figure 47
0
10
20
30
40
50
60
Pe
rce
nt
Injury From Fall By Race and Income Level (Age45+)
White
Black
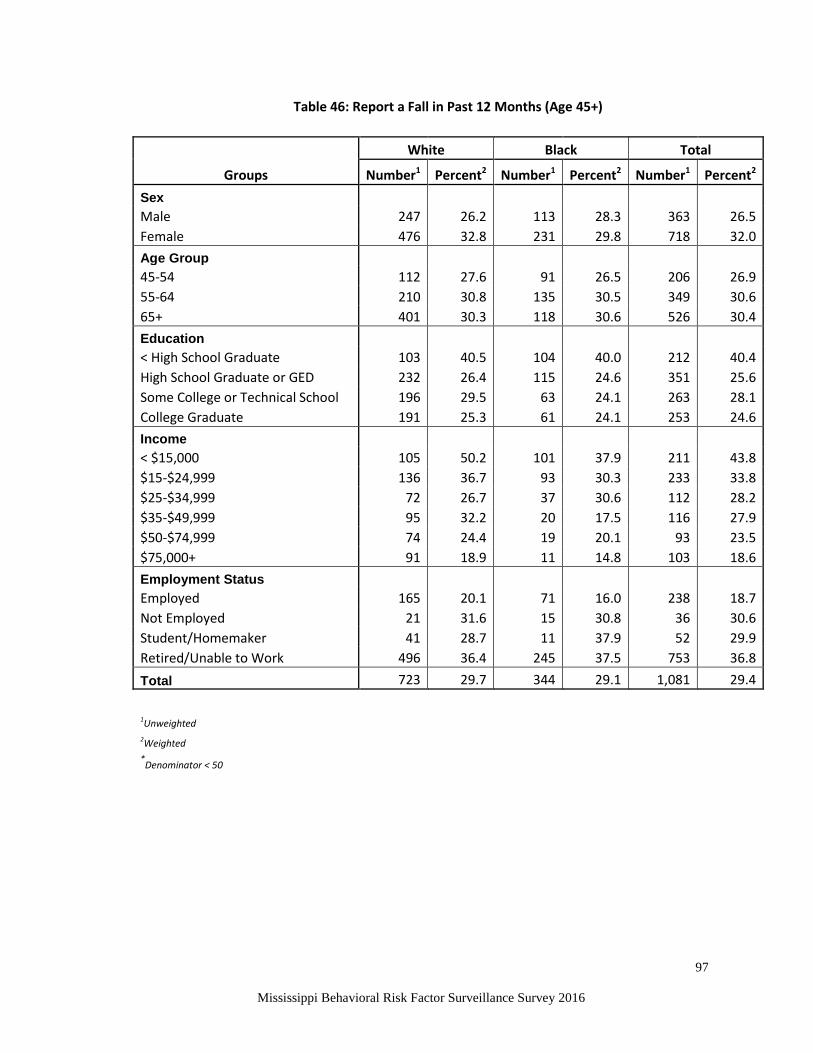
Mississippi Behavioral Risk Factor Surveillance Survey 2016
97
Table 46: Report a Fall in Past 12 Months (Age 45+)
White Black Total
Groups Number1 Percent2 Number1 Percent2 Number1 Percent2
Sex
Male 247 26.2 113 28.3 363 26.5
Female 476 32.8 231 29.8 718 32.0
Age Group
45-54 112 27.6 91 26.5 206 26.9
55-64 210 30.8 135 30.5 349 30.6
65+ 401 30.3 118 30.6 526 30.4
Education
< High School Graduate 103 40.5 104 40.0 212 40.4
High School Graduate or GED 232 26.4 115 24.6 351 25.6
Some College or Technical School 196 29.5 63 24.1 263 28.1
College Graduate 191 25.3 61 24.1 253 24.6
Income
< $15,000 105 50.2 101 37.9 211 43.8
$15-$24,999 136 36.7 93 30.3 233 33.8
$25-$34,999 72 26.7 37 30.6 112 28.2
$35-$49,999 95 32.2 20 17.5 116 27.9
$50-$74,999 74 24.4 19 20.1 93 23.5
$75,000+ 91 18.9 11 14.8 103 18.6
Employment Status
Employed 165 20.1 71 16.0 238 18.7
Not Employed 21 31.6 15 30.8 36 30.6
Student/Homemaker 41 28.7 11 37.9 52 29.9
Retired/Unable to Work 496 36.4 245 37.5 753 36.8
Total 723 29.7 344 29.1 1,081 29.4
1Unweighted
2Weighted
*Denominator < 50

Mississippi Behavioral Risk Factor Surveillance Survey 2016
98
Table 47: Report Injury From a Fall in Past 12 Months (Age 45+)3
White Black Total
Groups Number1 Percent2 Number1 Percent2 Number1 Percent2
Sex
Male 95 40.8 37 37.0 133 39.5
Female 207 47.6 94 41.0 303 44.8
Age Group
45-54 50 48.7 41 39.7 92 45.0
55-64 87 44.5 56 44.8 144 44.2
65+ 165 42.6 34 32.8 200 39.6
Education
< High School Graduate 53 54.3 38 37.8 92 46.0
High School Graduate or GED 93 41.2 48 41.6 143 41.5
Some College or Technical School 78 43.6 26 42.2 104 42.6
College Graduate 78 39.4 19 32.5 97 37.7
Income
< $15,000 53 51.9 49 45.1 103 47.9
$15-$24,999 60 53.3 35 41.6 96 48.7
$25-$34,999 30 39.5 12 29.2 43 34.9
$35-$49,999 36 39.6 4 19.6 40 35.8
$50-$74,999 23 34.9 4 32.4 27 34.6
$75,000+ 31 31.5 3 32.8 34 30.7
Employment Status
Employed 51 36.0 18 25.3 69 32.5
Not Employed 7 36.4 6 23.1 13 31.0
Student/Homemaker 12 35.0 4 45.2 16 36.7
Retired/Unable to Work 232 49.3 103 44.7 338 47.3
Total 302 44.8 131 39.3 436 42.6
1Unweighted
2Weighted
3Denominator is those who report a fall in past 12 months
*Denominator < 50

Mississippi Behavioral Risk Factor Surveillance Survey 2016
99
0
20
40
60
80
100
Male Female Total
Pe
rce
nt
Always or Nearly Always Wear Seatbelts
By Race and Sex
White
Black
Seat Belt Use
Survey Question
How often do you use seat belts when you drive or ride in a car?
Would you say always, nearly always, sometimes, seldom or never?
In the United States motor vehicle crashes are a leading cause of death according to
CDC. The National Highway Traffic Safety Administration (NHTSA), reports that there
were 22,441 passengers killed in motor vehicle traffic crashes in 2015. Of these
occupants, 10,635 or 52 percent were known to be restrained. Of those where the
restraint status was known, 48 percent were unrestrained at the time of the crash. The
restraint status was not
known for nine percent of
the occupants.
The proportion of
unrestrained passenger
vehicle occupants killed in
motor vehicle traffic
crashes has decreased from
2006 to 2015. Among
passenger vehicle
occupants killed, when
restraint use was known,
the percentage of
unrestrained deaths
decreased by seven
percentage points from 55
percent in 2006 to 48 percent
in 2015.
Among passenger vehicle occupants 5 and older, seat belts saved an estimated
13,941 lives in 2015. If all passenger vehicle occupants 5 and older had worn seat belts,
16,745 lives (that is, an additional 2,804) could have been saved in 2015. The Agency
also states that child restraints saved an estimated 266 lives of children under the age of
five.
In 2015, according to the NHTSA, 57 percent of the traffic fatalities in Mississippi
were from unbelted occupants. The Mississippi Office of Highway Safety (MOHS)
classifies non-fatal traffic injuries into three categories from most severe (A-level) to
least severe (C-level). According to the latest MOHS Highway Safety and Performance
Plan, there were 463 A-level injuries in 2012 and 43.0 percent were belted and prevented
Figure 48

Mississippi Behavioral Risk Factor Surveillance Survey 2016
100
from more serious injury or death. There were 4,112 B-level injures and of these, 76.1
percent were using belts. In the C-level category there were 13,840 non-fatal injuries and
93.0 percent of those were wearing safety belts. The Plan concluded that seat belt usage
significantly reduces the risk of serious injury and death.
Figure 49
The 2016 BRFSS survey in Mississippi revealed that 92.2 of the respondents say that
they always or nearly always wear a seat belt when they either drive or ride in a car.
Females report that they use seat belts more often than men. Women had a usage rate of
95.0 percent compared to 89.0 percent for men (Figure 48). Younger respondents
reported a higher rate of non-usage that older respondents. In the 18 to 24 age group,
86.7 percent said that they always or nearly always use seat belts while those in the age
group 65 and older reported a rate of 94.7 percent (Figure 49).
0
20
40
60
80
100
Pe
rce
nt
Always or Nearly Always Wear Seatbelts By Race and Age Group
White
Black

Mississippi Behavioral Risk Factor Surveillance Survey 2016
101
Table 48: Always or Nearly Always Wear Seatbelts
White Black Total
Groups Number1 Percent2 Number1 Percent2 Number1 Percent2
Sex
Male 1,067 88.5 583 89.8 1,690 89.0
Female 1,733 96.7 1,118 92.5 2,895 95.0
Age Group
18-24 109 88.8 89 82.4 208 86.7
25-34 254 85.7 201 90.2 471 87.5
35-44 281 96.5 258 91.7 551 94.4
45-54 391 93.9 295 90.1 702 92.6
55-64 593 94.5 406 96.7 1,011 95.3
65+ 1,146 94.3 436 96.4 1,600 94.7
Education
< High School Graduate 270 92.7 324 90.9 609 91.7
High School Graduate or GED 839 91.8 589 92.3 1,455 92.1
Some College or Technical School 779 91.9 386 89.9 1,178 91.1
College Graduate 907 95.4 401 92.8 1,337 94.9
Income
< $15,000 232 90.9 373 90.4 619 90.9
$15-$24,999 436 93.1 458 95.3 908 93.4
$25-$34,999 265 92.6 172 83.9 450 89.3
$35-$49,999 328 91.8 187 94.2 523 92.8
$50-$74,999 370 95.5 127 93.3 505 95.2
$75,000+ 599 91.5 115 93.2 727 92.1
Employment Status
Employed 1,154 90.4 751 89.7 1,949 90.3
Not Employed 97 96.3 97 88.1 196 90.6
Student/Homemaker 233 95.2 76 87.4 318 93.6
Retired/Unable to Work 1,311 94.7 775 95.7 2,115 95.0
Total 2,800 92.6 1,701 91.3 4,585 92.2
1Unweighted
2Weighted

Mississippi Behavioral Risk Factor Surveillance Survey 2016
102
Sleep
Survey Question:
On average how many hours of sleep to you get in a 24-hour period?
While sleep is often considered a passive activity, sufficient sleep is increasingly
being recognized as an essential aspect of health promotion and chronic disease
prevention in the public health community.
Insufficient sleep is associated with a number of chronic diseases and conditions—
such as diabetes,
cardiovascular disease,
obesity, and depression—
which threaten our nation’s
health. Notably, while
insufficient sleep is
associated with the onset of
these diseases, it also poses
important implications for
their management and
outcome. Moreover,
insufficient sleep is
responsible for motor
vehicle and machinery-
related crashes, causing
substantial injury and
disability each year. Drowsy
driving can be as dangerous
as driving while intoxicated.
More than one-quarter of
the U.S. population report occasionally not getting enough sleep, while nearly 10 percent
experience chronic insomnia. However, new methods for assessing and treating sleep
disorders are bringing hope to the millions suffering from insufficient sleep.
Fundamental to the success of all of these efforts is the recognition that sufficient sleep is
not a luxury but rather a necessity and should be thought of as a vital sign of good health.
According to the CDC there are four major sleep disorders: 1) Insomnia which is an
inability to initiate or maintain sleep, 2) Narcolepsy, the hallmarks of which are daytime
sleepiness combined with sudden muscle weakness, 3) Restless Leg Syndrome or RLS
characterized by an unpleasant sensation which feels like it is originating in the lower
legs, but often associated with aches and pains throughout the legs and which may cause
Figure 50
0
10
20
30
40
50
Male Female Total
Pe
rce
nt
Report Inadequate Sleep By Race and Sex
White
Black

Mississippi Behavioral Risk Factor Surveillance Survey 2016
103
difficulty initiating sleep, and 4) Sleep Apnea a potentially serious sleep disorder in
which breathing repeatedly stops and starts and often results in loud snoring or gasping
sounds during sleep and cause a person to be tired even after a full night of sleep.
Figure 51
In Mississippi the group with the highest rate of inadequate sleep was black
respondents 25 to 34 age group with a rate of 53.4 percent. The next highest group was
blacks in the age group of 18 to 24 who reported a rate of 51.6 percent followed by
whites whose annual income is less than $15,000 with a rate of 51.5 percent. Table 49
contains the details. Overall, blacks reported an inadequate sleep rate of 42.6 percent
compared to 35.1 percent for whites (Figure 50).
.
0
10
20
30
40
50
60
Pe
rce
nt
Report Inadequate Sleep By Race and Income
White
Black

Mississippi Behavioral Risk Factor Surveillance Survey 2016
104
Table 49: Report Getting Inadequate Sleep
White Black Total
Groups Number1 Percent
2 Number
1 Percent
2 Number
1 Percent
2
Sex
Male 372 34.3 237 40.7 633 37.0
Female 570 35.8 484 44.0 1,077 39.3
Age Group
18-24 53 46.3 59 51.6 119 49.3
25-34 100 34.5 115 53.4 222 42.6
35-44 113 37.7 114 37.3 233 37.6
45-54 163 40.1 140 46.2 311 42.1
55-64 203 32.8 153 32.3 362 33.0
65+ 285 24.4 123 29.6 421 26.4
Education
< High School Graduate 112 40.5 113 35.6 233 37.8
High School Graduate or GED 302 34.2 236 38.6 557 37.0
Some College or Technical School 277 36.8 197 51.2 481 42.1
College Graduate 248 29.2 174 41.4 435 33.2
Income
< $15,000 117 51.5 172 47.0 299 48.5
$15-$24,999 170 41.6 167 38.7 345 40.2
$25-$34,999 96 36.7 79 41.7 184 40.3
$35-$49,999 112 33.0 89 48.7 204 38.4
$50-$74,999 106 29.4 52 44.6 163 33.4
$75,000+ 151 26.6 50 38.5 205 28.9
Employment Status
Employed 415 35.7 367 44.7 803 39.5
Not Employed 46 40.3 46 35.0 93 37.3
Student/Homemaker 83 39.4 38 55.4 127 44.3
Retired/Unable to Work 395 31.9 266 37.2 679 34.2
Total 942 35.1 721 42.6 1,710 38.2
1Unweighted
2Weighted
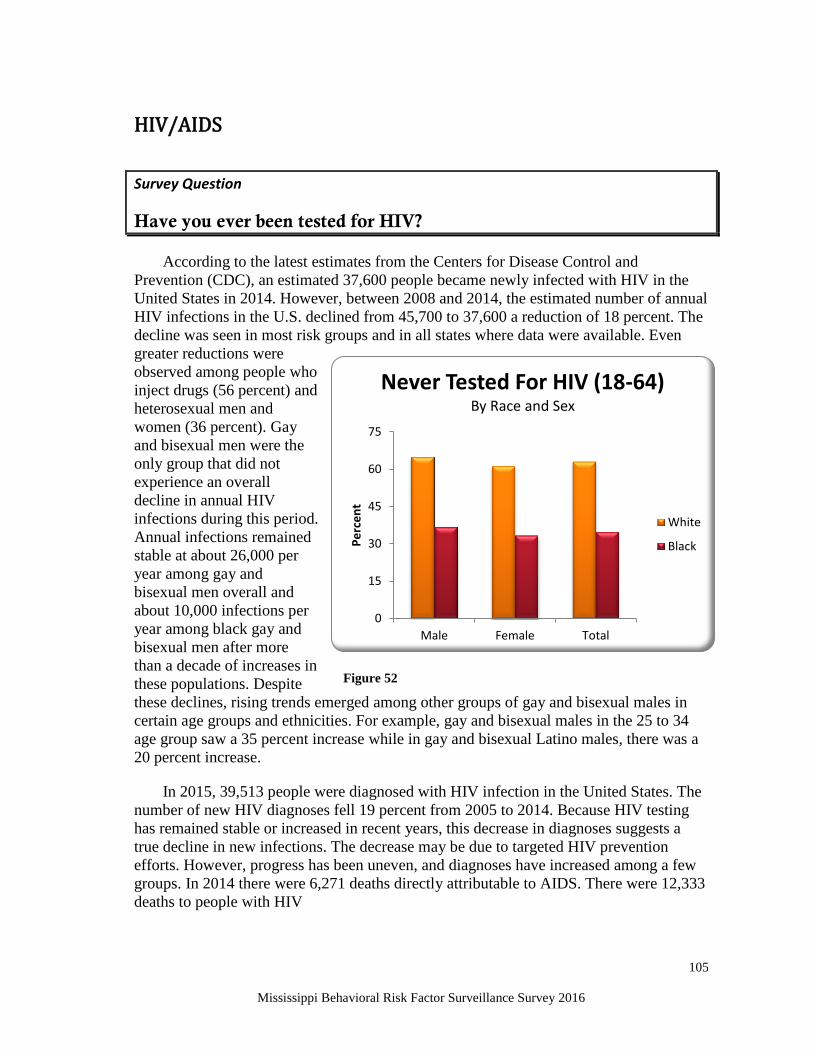
Mississippi Behavioral Risk Factor Surveillance Survey 2016
105
0
15
30
45
60
75
Male Female Total
Pe
rce
nt
Never Tested For HIV (18-64) By Race and Sex
White
Black
HIV/AIDS
Survey Question
Have you ever been tested for HIV?
According to the latest estimates from the Centers for Disease Control and
Prevention (CDC), an estimated 37,600 people became newly infected with HIV in the
United States in 2014. However, between 2008 and 2014, the estimated number of annual
HIV infections in the U.S. declined from 45,700 to 37,600 a reduction of 18 percent. The
decline was seen in most risk groups and in all states where data were available. Even
greater reductions were
observed among people who
inject drugs (56 percent) and
heterosexual men and
women (36 percent). Gay
and bisexual men were the
only group that did not
experience an overall
decline in annual HIV
infections during this period.
Annual infections remained
stable at about 26,000 per
year among gay and
bisexual men overall and
about 10,000 infections per
year among black gay and
bisexual men after more
than a decade of increases in
these populations. Despite
these declines, rising trends emerged among other groups of gay and bisexual males in
certain age groups and ethnicities. For example, gay and bisexual males in the 25 to 34
age group saw a 35 percent increase while in gay and bisexual Latino males, there was a
20 percent increase.
In 2015, 39,513 people were diagnosed with HIV infection in the United States. The
number of new HIV diagnoses fell 19 percent from 2005 to 2014. Because HIV testing
has remained stable or increased in recent years, this decrease in diagnoses suggests a
true decline in new infections. The decrease may be due to targeted HIV prevention
efforts. However, progress has been uneven, and diagnoses have increased among a few
groups. In 2014 there were 6,271 deaths directly attributable to AIDS. There were 12,333
deaths to people with HIV
Figure 52

Mississippi Behavioral Risk Factor Surveillance Survey 2016
106
Questions about HIV and AIDS were only asked of persons between the ages of 18
and 64. One of the questions was whether the respondent had ever been tested for the
AIDS virus. In 2016, 52.1 percent of the respondents reported that they had never been
tested. White respondents were more likely to have never been tested than blacks: 63.1
percent to 34.8. The rate for white respondents who have never been tested was 64.9
percent for males and 61.3 percent for females. For blacks, the rates were 36.7 percent
for males and 33.4 for females (Figure 52 and Table 50).

Mississippi Behavioral Risk Factor Surveillance Survey 2016
107
Table 50: Never Tested for HIV (Age 18-64)
White Black Total
Groups Number1 Percent2 Number1 Percent2 Number1 Percent2
Sex
Male 471 64.9 191 36.7 687 55.0
Female 594 61.3 345 33.4 957 49.4
Age Group
18-24 88 77.5 40 37.9 136 61.7
25-34 131 49 53 19.5 193 36.9
35-44 134 49.4 57 23.2 197 38.6
45-54 254 64.1 125 38.6 390 54.9
55-64 436 75.8 248 58.5 693 69.8
Education
< High School Graduate 102 65.9 99 45.7 209 57.9
High School Graduate or GED 305 70.1 216 38 536 55.8
Some College or Technical School 283 58.2 99 27.2 388 46.2
College Graduate 372 60.5 121 31.6 507 51.8
Income
< $15,000 73 61.8 116 39.7 196 48.9
$15-$24,999 145 62.3 139 30.1 292 46.1
$25-$34,999 89 58.8 62 34.5 157 47.9
$35-$49,999 118 61.2 46 22.7 166 45.4
$50-$74,999 161 61 36 27.1 200 52.6
$75,000+ 299 63.3 44 44 351 60.3
Employment Status
Employed 669 61.7 267 30 967 49.7
Not Employed 47 59.4 36 36.8 84 48.2
Student/Homemaker 106 69.6 27 41.4 137 61.2
Retired/Unable to Work 239 64.3 205 46.7 451 56.8
Total 1,065 63.1 536 34.8 1,644 52.1
1Unweighted
2Weighted