behavior of astm c 850 concrete box culverts without shear ... · pdf filebehavior of astm c...
TRANSCRIPT

BEHAVIOR OF ASTM C 850 CONCRETE BOX CULVERTS . WITHOUT SHEAR CONNECTORS
by
Ray W. James
Research Report 294-1
Determination of Earth Pressures on Reinforced Concrete Box Culverts
Research Study No. 2-5-81-294
Sponsored by
Texas State Department of Highways and Public Transportation
in cooperation with U.S. Department of Transportation Federal Highway Administration
May 1983
Texas Transportation Institute The Texas A&M University System
College Station, Texas

DISCLAIMER
The contents of this report reflect the views of the authors who are
responsible for the opinions, findings, and conclusions presented herein.
The contents do not necessarily reflect the official views or policies of
the Federal Highway Administration. This report does not constitute a stan
dard, specification, or regulation.
KEY WORDS
Culverts, Concrete Box, Shear Connectors, Load Tests, Reinforcing Steel
Stresses
ACKNOWLEDGMENTS
The work was sponsored by the Texas State Department of Hi ghways and
Public Transportation (TSDHPT) in cooperation with the Federal Highway
Administration. This study is a portion of the work done under project
2-5-81-294, which also includes a more extensive investigation of a cast-in
place reinforced concrete culvert to be reported separately.
The two box culverts were fabricated by Gifford-Hill & Co., Pipe Divi
sion, Ft. Worth, Texas. Materials and support were provided by Gifford-Hill
& Co. and Ivy Steel and Wire Co. of Houston.
Numerical predictions of culvert response were provided by Mr. Charles
Terry of the TSDHPT. His assistance is gratefully acknowledged. The test
i ng was conducted at the Texas A&M Uni vers ity Research Annex. The author
appreciates the assistance of the staff of the Research Annex and the Texas
i i

Transportat i on I nstitute, part i cul arly Mr. Ri chard E. Bartoskewitz, who
assisted with the instrumentation and directed the testing.
IMPLEMENTATION STATEMENT
The results of this study suggest that shear connectors are not
required in 7 x 5 ASTM C 850 culverts. Included are recommendations to
perform field tests and further study to determine whether revisions to all
C 850 standard designs may be recommended.
iii

SUMMARY
A series of static loads simulating factored HS20-44 wheel loads was
appl ied to the 7 ft and 5 ft spans of two experimental box cul vert sec
tions. The culverts were designed in accordance with ASTM C 850 except that
the steel areas in the 5 ft slabs were sized according to the C 850 require
ments for 5 x 5 boxes, and the steel areas in the 7 ft slabs were sized
according to the C 850 requirements for 7 x 5 boxes, so that testing of 5 ft
as well as 7 ft spans could be conducted.
The major objective of the study was to determine whether shear connec
tors required by ASTM C 850 and AASHTO might be safely omitted. To accom
plish this objective, stresses in reinforcing steel were measured while
simulated critical wheel loads were applied.
The following conclusions are apparent:
(1) Maximum measured steel stresses are well below design steel
stresses for design service wheel loads and for factored ultimate design
wheel loads.
(2) Cracking caused by the design ultimate wheel load is relatively
insignificant with respect to cracking assumed in a "cracked section" design
philosophy.
iv

TABLE OF CONTENTS
Part
1 I NTRODU cn ON
1.1 Background
1.2 Present Design Standards
1.2.1 ASTM C 850
1.2.2 AASHTO
2 THEORETICAL ANALYSIS
2.1 Predicted Internal Moments and Deflections
2.2 Predicted Steel Stresses
3 EXPERIMENTAL PROCEDURE
3.1 Test Sections
3.2 I nst rumentat ion
3.3 Test Procedure
4 TEST RESULTS
4.1 Measured Stresses
4.2 Measu red Def1 ect ions
4.3 Discussion of Results
5 HS 20 AXLE LOAD STRESSES
6 CONCLUSIONS
7 RECOMMENDATIONS
REFERENCES
APPENDIX A. MEASURED STRAIN GAGE ISOLATION RESISTANCE TO REINFORCING STEEL
APPENDIX B. STRAIN GAGE DATA
APPENDIX C. VERTICAL DEFLECTION DATA
APPENDIX D. MEASURED CONCRETE COVER AT STRAIN GAGES
APPENDIX E. FIELD SKETCH OF OBSERVED CRACK PATTERNS
v
Page
1
1
2
2
6
7
7
11
14
14
14
19
22
22
25
28
32
33
34
35
36
38
57
64
66

Figure No.
1
2
3
4
5
6
7
8
9
10
11
12
13
14
LIST OF FIGURES
ASTM C 850 Concrete Box Section Reinforcing Steel
ASTM C 850 Design Wheel Load Distribution - No Cover
SLAB 49 Model of 7 ft Top Slab
Predicted Top Slab Flexural Moments - Centerline of 7 ft Slab
Predicted Vertical Deflections - Centerline of 7 ft Slab
Predicted Reinforcing Steel Stresses - Centerline of 7 ft Slab
Geometry and Reinforcement Schedule for Test Specimens
Strain Gage Locations and Nomenclature
Test Configuration Schematic
Measured Reinforcing Steel Stresses - Centerline of 7 ft Slab
Measured Reinforcing Steel Stresses - Centerline of 5 ft Slab
Measured Vertical Deflections - Centerline of 7 ft Slab
Measured Vertical Deflections - Centerline of 5 ft Slab
Repeated Load - Deflection Data - Station 1-7-73 -Test Configuration 7M1
vi
3
4
8
9
10
13
15
17
20
23
24
26
27
31
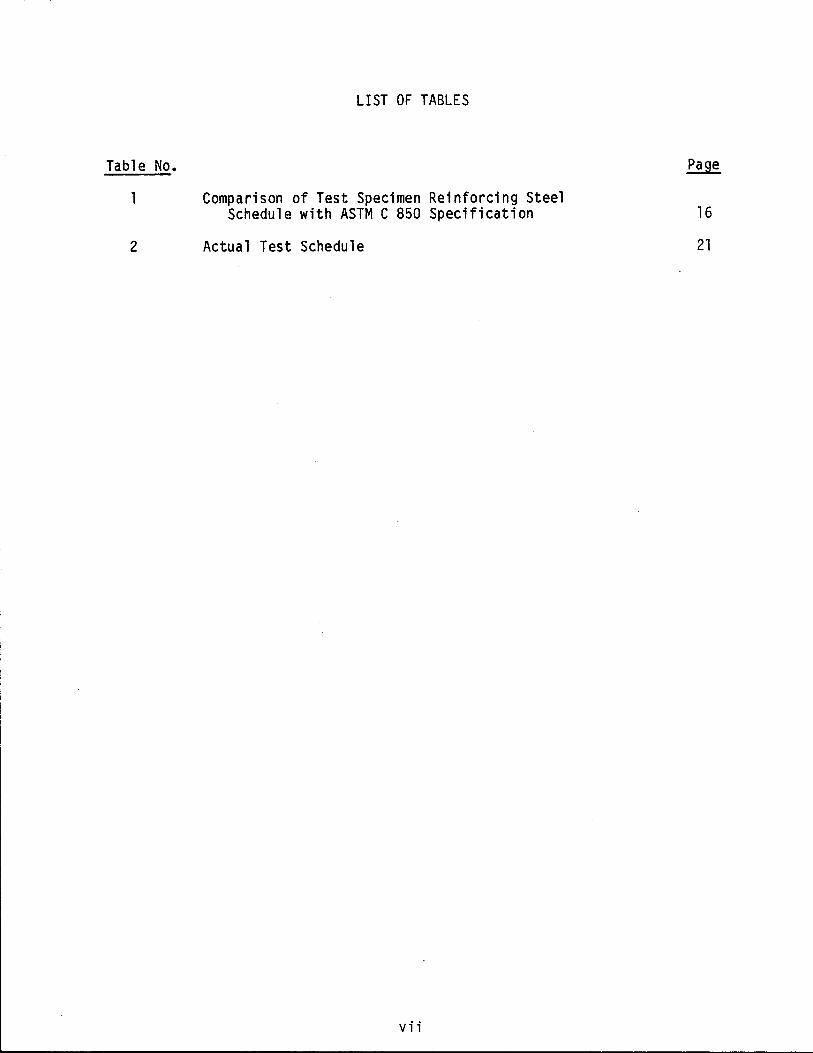
Table No.
1
2
LIST OF TABLES
Comparison of Test Specimen Reinforcing Steel Schedule with ASTM C 850 Specification
Actual Test Schedule
vi i
16
21

1. I NTRODUCTI ON
1.1 Background
Precast box culverts have been extensively used to economically span
smaller drainage channels. Presently, design standards exist for two cate
gories of box culverts: ASTM C 850 establishes standard designs for boxes
with less than 2 ft of cover subject to highway loadings, while ASTM C 789
establishes standard designs for other precast box sections. The C 850
standard requires shear connectors between top slabs of adjacent box sec
tions, a requirement that is also adopted by AASHTO.
Proposed structural criteria changes to ASTM C 850 or C 789 are first
presented to the AASHTO Rigid Culvert Liaison Committee to the AASHTO Bridge
Committee. The question of the necessity of shear connectors is being stud
ied by this committee, and this project was initiated to determine the
structural integrity of C 850 culverts without shear connectors subject to
concentrated wheel loads. A similar research project has also been initi
ated in Ohio under the direction of Ohio Department of Transportation engi
neer John D. Her1. Prel iminary reports of both these projects were pre
sented to Transportation Research Board Committee A2C06 on January 17, 1983.

1.2 Present Design Standards
1.2.1 ASTM C 850 - The ASTM Standard C 850 [lJ* establishes design
standards for precast concrete box culverts to be used wi th 1 ess than 2 ft
of cover. The standard specifies minimum steel and concrete strengths,
areas, and geometri es for 42 standard cul vert sizes subject to two load
i ngs. The desi gn criteri a, computer programs, and standard desi gns are
based on studies and tests sponsored by the American Concrete Pipe Associa-
tion, the Virginia Department of Highways, and the Wire Reinforcement Insti
tute [2,3J. The required transverse steel areas are based on computer solu
tions using several simplifying assumptions, including the following assump-
tions regarding wheel load distribution:
(1) Wheel loads are distributed parallel to span over a length equal
to (8 in. + 1.75 H), where H = height of soil cover, in.
(2) The effective width of top slab resisting wheel load is taken to
be (48 in. + 0.06 (SPAN-HAUNCH)).
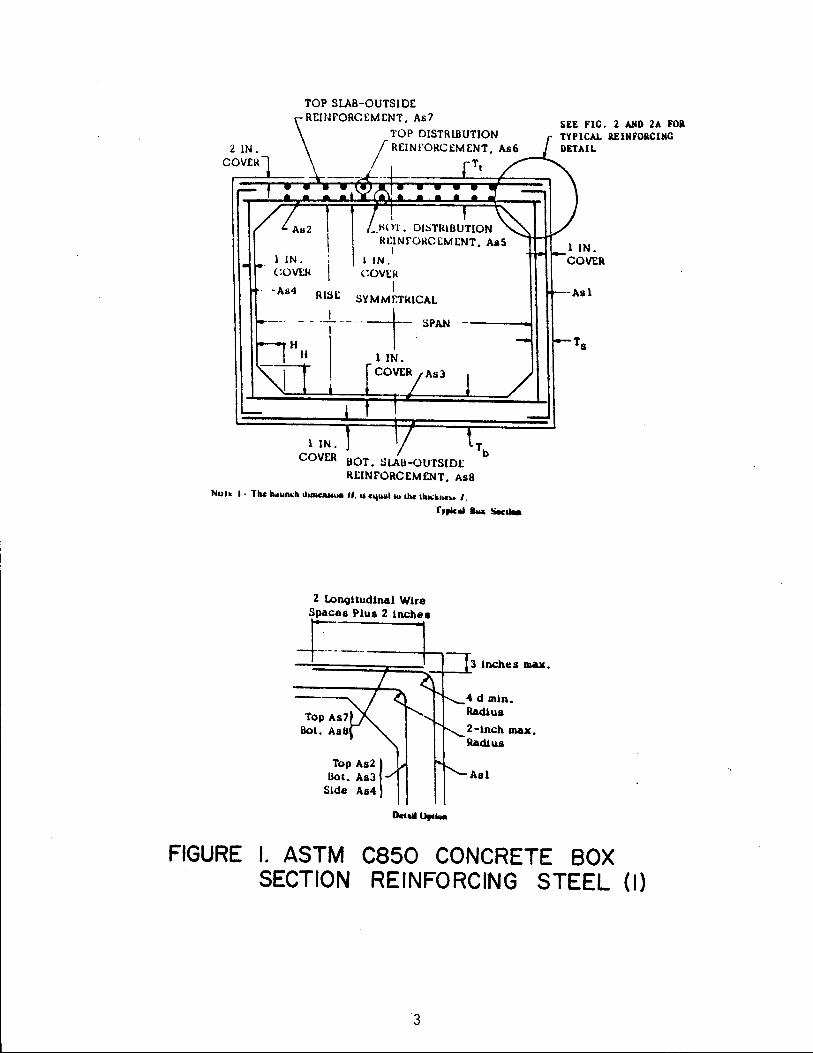
Figure 1 shows the reinforcement detail and cross section geometry for
a C 850 box section. Figure 2 shows the assumed simplified wheel loading
specified for the so-called "strip" design method.
The design procedure used to develop the standard box sections [2J
limits the crack widths at service load to 0.010 in. by limiting the design
service steel stress to a value given by
65
s - 3 t 2 s f -~ b f
+ 5( ks;) , (1 )
where tb is the distance from the centroid of the tension steel to the
outermost concrete tension fiber (in.), and Sf is the spacing of the
*Numbers in brackets refer to numbered references.
2
TOP SLAB-OUTSIDE REINFORCEMENT, As7
TOP DISTRLBUTION r REINfORCEMENT, As6
/ T(
I
_.tH )'1. DI~1'RIBUTION IU:INfORCEMENT, AsS
I 1 IN. 1 IN. COvtH COV1:R
-As4 S'. I Rl ''; SYMMl:TkICAL
-_. H - - -+ -_._. -t SPAN -
H 1 IN. COVER
BOT, ~LAU-OU'rSID[ REINFORCEMENT, As8
SEE FIC. 2 AND 2A FOR TYPICAL lEINFORCINC DETAIL
-Asl
NUl> I· The """A"" UaAaClWUIl II. "c ...... 1 ... 1M 11uo;~11C" I.
FIGURE
r,,,, ... Iu& Sec ...
2 Loll9ltudlnal Wire !:l .. ' lnche.
-====F=::"'_+--1:3 inches max,
I. ASTM SECTION
Asl
C850 CONCRETE BOX REINFORCING STEEL (I)
3

LOADED AREA
FIGURE 2. ASTM C850 DESIGN WHEEL LOAD DISTRIBUTION - NO COVER

longitudinal reinforcing steel wires (in.). This equation is based on
studies by Lloyd, Rejali and Kessler [4J and subsequent criteria developed
by Gergely and Lutz [5], and is a more conservative limitation than the ACI
crack control criteria [6] and the AASHTO crack control criteria [7]; but
the stress allowed by this limitation may be greater than the AASHTO fatigue
stress limitation of 21 ksi [8] or the ACI allowable service load stress of
36 ksi [7]. For example, the two 7 x 5 boxes tested here have tb = 1.0 in.
and s1. = 3.0 in., so the maximum steel stress to limit cracking is
approximately fs = 50.1 ksi.
Addit i ana lly, ASTM C 850 speci fi es that the j oi nt provi de a smooth
interior free of appreciable irregularities, and that the joint be designed
or modified to transmit a minimum of 3000 lb of vertical shear force per
foot of top slab joint. Shear connectors used to satisfy this requirement
must be spaced no more than 30 in. on center and with a minimum of two con
nectors per joint. These requirements are intended to provide continuity of
shears and deflections across joints to reduce culvert stresses when loaded
near a joint and minimize relative displacements of culvert and cover.
5

1.2.2 AASHTO Standard Specification for Highway Bridges [7,8] - The
AASHTO specifications include minimum requirements for design and methods of
analysis for highway bridge structures, including culverts. These
requirements are essentially satisfied by the ASTM C 850 standard. At
longitudinal edges of reinforced concrete slabs, AASHTO 1.3.2{0} [8]
requires an edge beam additional reinforcement in the slab, or an integral
reinforced section of slab and curb. Since edge beams and curbs are not
acceptable, and to provide continuity of deflections as well as shears, ASTM
C 850 8.2 specifies that shear connectors be used to transmit the calculated
shear across joi nts between cul vert segments. Thi s requi rement is also
adopted by AASHTO 1.15.7{0}{4} [7].
6

2. THEORETICAL ANALYSIS
2.1 Predicted Internal Moments
The FORTRAN code SLAB 49 [9J was used to predict the internal moments
in the top slab of the model shown in Figure 3. For simplicity, the slab is
assumed to be isotropic, neglecting the difference in distribution and
flexural steel areas. SLAB 49 uses discrete elements which simulate linear,
small deformation plate behavior. A 2.0 in. x 2.0 in. mesh size was used.
The symmetric boundary conditions along the centerline were approximated
with zero vertical restraint and essentially infinite rotational restraint
along the centerline. Edge support at the side wall was approximated by a
simple support and an elastic rotational restraint simulating the rotational
stiffness of the side wall. Membrane reactions and forces were neglected,
consistent with linear plate theory simplifications.
The predicted internal moments are shown in Figure 4 for two basic
plate stiffnesses. The result labeled "uncracked" is the predicted moment
distribution assuming the stiffness is equal to that of an uncracked 8 in.
thick concrete plate, neglecting the reinforcing steel which would change
the stiffness by only 6% approximately. The result labeled "cracked" is the
predicted moment distribution neglecting the contribution of concrete in the
tensile region. It is noteworthy that while the cracked stiffness is only
23% of the uncracked stiffness, the predicted maximum flexural moments are
not s i gnifi cant ly different. In addi ti on to predi cted moments, vert i ca 1
deflections are also predicted, and Figure 5 presents the predicted top slab
vertical deflection along the culvert centerline.
7

SUPPORT
811
811
CELASTIC ROTATIONAL RESTRAINT
/'-K:: 8.86 in-Ib/in
----T+.. - - - ..... - - .. - - - 1- -.----+!.
o
IT]
r-eo PI
:< i1>
I~
f>::. 20.8~ = 104 PSI-/ 2CO'M'"
!IJ r J> z
... - - - I-
I
r o 1> o P1 o 1> :{) IT)
1> I
; (l)=
- L - ----+-,
n o z -..
U' r ,
-~-' ---------~ ...... --j , SYMMETRIC BOUNDARY ABOUT CENTER LINE
FIGURE 3. SLAB 49 MODEL OF 7ft TOP SLAB

20.8 KIPS
UNCRACKED
o 234 5 6 78
STATION'· (FT)
FIGURE 4. PREDICTED TOP SLAB
FLEXURAL MOMENTS CENTERLINE OF 7FT SLAB
9

- 0.100 z --.0.080 -' LL loU o 0.060 -oJ « U 0.040
~ ~ OD20
20.8 KIPS
2345 6 78 STATiON (FT)
FIGURE 5. PREDICTED VERTICAL DEFLECTIONS
CENTERLINE OF 7FT SLAB
10

2.2 Predicted Steel Stresses
Steel stresses are calculated from predicted slab flexural moments as
follows: Assuming isotropic elastic plate behavior, the flexural stress in
the reinforcing steel is
(2)
where n = Es/Ec is the modular ratio,
Ml is the flexural moment per unit length,
y is the distance of the tension steel from the neutral surface,
and bh3
2 is the moment of inertia per unit width b for a slab 12(1-v of thickness h and Poisson's ratio v.
Using n = 7.44,
h = 8.0 in. ,
v = 0.15,
and Y = 3.0 in. ,
the moment of inertia becomes
11 = 43.6 in.4/in.,
and the steel stress is given by
fs = Ml/l.96 in.3/in. (3)
This calculation is based on the assumptions that the stresses are linearly
distributed, and that the reinforcing steel areas may be neglected in compu
tation of neutral surface location and moment of inertia.
If cracking occurs, the concrete stresses can be assumed to be nonzero
in the compression region only, with the tensile force resultant provided
entirely by the tension steel. Using this assumption, the calculated
11

equivalent concrete section has a depth
c = 1.765 in.,
and the equivalent concrete section moment of inertia is approximately
11 = 10.22 in. 4/in.
The distance from the neutral surface to the tension steel is approximately
y = 5.235 in.,
and the resulting relation between flexural stress and moment becomes
fs = Ml/0.262 in. 3/in. (4)
Steel stresses calculated from predicted top slab moments are shown in
Figure 6. While the predicted maximum moments in the uncracked and cracked
section models differ by only approximately 2%, the predicted maximum steel
stress in the cracked section is approximately 7.5 times the predicted steel
stress in the uncracked section.
The maximum predicted steel stress of 37 ksi in the cracked section
exceeds the 21 ksi AASHTO fatigue limit stress and the 36 ksi service load
1 imit stress of ACI, but is less than the crack control 1 imit stress for
this geometry used in the ASTM C 850 design procedure.
12

-iii " -.oJ &AI &AI
40
30
... 20 In
Ie
Z -
20.8 KIPS
CRACKED SECTION
~. __ . ,5UNCRACKED SECTION ------.-0" • • • • , I I I ; I 5 I $ I 0, I ' I o 10 20 30 40 50 60 70 80 90
STATION (IN 0)
FIGURE 6. PREDICTED REINFCX1CING STEEL STRESSES - CENTERLINE OF 7FT. SLAB
13

3. EXPERIMENTAL PROCEDURE
3.1 Test Sections
Two 7 x 5 precast concrete box culverts were fabricated at the Gifford
Hill & Co. plant in Ft. Worth, Texas. The geometry is described in
Figure 7. The design and materials met ASTM C 850 minimum requirements with
the exception of reinforcement area Asl. Standard 5 x 5 box requirements
for As7 were gi ven precedence over 7 x 5 requi rements for Asl. The steel
areas were in accordance with C 850 except for the 5 ft slabs which were
more heavily reinforced in order to approximately simulate behavior of stan
dard 5 x 5 box culverts using the same 7 x 5 specimens rolled 900 • The
measured concrete compressi ve strength was 5725 ps i, whi ch exceeds the
design compressive strength of 5000 psi. The reinforcing mesh is grade 65
(65 ksi yield strength). According to ASTM C 850, the yield strength is
taken to be 60 ksi for purposes of analysis.
3.2 Instrumentation
The cul verts were instrumented with strai n gages bonded to the 8 gage
main transverse reinforcing steel wires in theoretical maximum tensile
stress regions. Strain gage locations are described in Figure 8. Six gages
were installed in each culvert, however two gages were damaged during place
ment of concrete, leaving ten serviceable strain gages. The gages chosen
were Tokyo Sokki Kenkyujo Type FLA-6-11. The gages were bonded with Micro
Measurements M-bond 200 adhesive, waterproofed with Micro-Measurements
M-Coat A polyurethane and Dow Corning 3145 RTV. Additional mechanical pro
tection was provided by wrapping each installation with several layers of
aluminum foil tape. Lead wires were routed downward along longitudinal
14

E (2" COVER) F---.......
.---- A ( 2" COVER) B
COVER)
G ( t" COVER) I--H
WIRE A 8. e o E
t-H
--C ( I" COVER)
~ W5.0113 W4.8.3 waO.2 W4.8113 W4 .• 3
;'~i W5.!5a3
000
7'-0"
-'NSTRUM£NT£O WIRES.
ABEA !in-1ft )
0.20 0.19
8·48 .19
')-l9
&J.I 0.22
8"
o 0
o 0
o 0
5'-0"
." I I ~ ... ~
8
FIGURE 7. GEOMETRY AND REIM='ORCEMENT SCHEDULE FOR TE'ST SPECIt.£NS.
15

(a)
(b)
Table 1. Comparison of Test Specimen Reinforcing Steel Schedule with ASTM C 850 Specification
7 x 5 Test Configuration (7 ft Span)
C 850 7 x 5 Required Area Reinforcement HS 20 Interstate As Bu il t Area
(in. 27ft) (in. 27ft) (in. 2 7ft) Asl(E) 0.29 0.30 0.19 As2(C) 0.48 0.48 0.48 As3(C) 0.27 0.34 0.48 As4(G) 0.19a 0.19a 0.48 As7(A) 0.20 0.20 0.20 As8(a) 0.19a 0.19a 0.20 As5(D) 0.19a 0.19a 0.19 As6(B) 0.19a 0.19a 0.19
5 x 7 Test Configuration (5 ft Span)
C 850 5 x 7 Required Area Reinforcement HS 20 Interstate As Bu il t Area
(in. 2 /ft) (in. 21ft) (in. 21ft)
As1(A) 0.16 0.21 0.20 As2(G) 0.46 0.46 0.48 As3(G) 0.26 0.34 0.48 As4(C) 0.14a 0.14a 0.48 As7(E) 0.19a 0.19a 0.19 As8(E) O.l7a O.l7a 0.19 As5(H) 0.22 0.22 0.22 As6(F) 0.19a 0.19a 0.19
aMinimum reinforcement area is specified.
16

7'-6' =90" LAY LENGTH
+ + + H-~-II N-~-43N- 73
II"
73"
NOTES: "N" DENOTES BOX NUMBER , OR 2. GAGES '-5-11 AND 1-7-11 WERE DAMAGED DURING Cc..CRE TE PLACEMENT.
~'-SII
--E'-S"
FIGURE 8. STRAIN GAGE LOCATION a NOMENCLATURE
17

steel (perpendicular to traffic), exiting the reinforcing cage and form at
the female connection end. The gages were wired into ten single active arm
bridges using three wire hookups to eliminate signals due to thermally
induced lead wire resistance changes.
Installed gage resistance was checked at the time of installation, but
gage isolation resistance was not measured because of tight fabrication
schedules. Gage isolation resistance was measured after testing had been
completed, and after semi-destructive measurements of concrete cover had
been made. Measured gage isolation resistances were approximately 150 M Q
or greater, which indicates acceptable isolation [10,11] at all but three
gages as shown in Appendix A. Gages at stations 1-7-42,2-7-11, and 2-7-43
all indicated unacceptably low gage isolation resistances. Strain gages at
critical stations 1-5-73,1-7-73,2-5-73, and 2-7-73 all indicated open
circuit gage isolation resistance with the analog ohmmeter used, which can
detect resistances below 150 M Q. The strain gage at station 1-5-42 had a
marginal isolation resistance.
In addition to the resistance strain gages installed on the reinforcing
steel, the culverts were instrumented with deflection dial indicators to
measure vertical deflection at three of the top surface strain gage loca
tions. The dial indicators were supported in fixtures mounted to the bottom
slab inside surface. Deflections were monitored at the point of load appli
cat i on and at the two adjacent strai n gage stations in order to monitor
relative deflection across the joint.
18

3.3 Test Procedure
After curing, the culverts were transported to the test site and assem
bled in the fixture as shown schematically in Figure 9. Concentrated loads
were appl ied to the top surface of the cul vert through ali n. x 10 in. x
20 in. steel bearing plate and 1/2 in. neoprene pad located as shown in
Figure 9. A hydraulic ram and electric motor driven hydraulic pump were
used to apply the loads. A 100,000 lb compression load cell was used to
measure the applied load. The lower surfaces of the culverts rested on
1/2 in. plywood sheets over doubled 3/4 in. rigid foam thermal insulating
panels which rested on the steel reaction frame bed.
The culvert sections were aligned and fitted together snugly without
grout, joint filler material, or shear transfer connectors. The fit of the
joint was qualitatively evaluated by inserting a sheet of paper through the
joint. The paper could be slipped through the joint at several places, but
interference between the two faces prevented drawing the paper along the
length of the joint. The visible joint was generally of uniform width, with
no significant variations.
The reported test loads represent HS20-44 16 kip wheel loads multiplied
by a 1.3 impact factor specified by AASHTO for a design service load of
20.8 kip and a 16 kip wheel multiplied by factors (1.3)(1.67)(1.3) = 2.82
for a design ultimate factored load of 45.2 kip. The 78.0 kip load reached
in test No.9 represents the limiting load on the test fixture compression
members, which indicated impending lateral instability.
19

Hs20 WHEEL LOAD CENTERED ON B~. PL. 71;.... _____
I lI. lOll. 20 IN. STEEL BAG. PL.
ON tiN. NEOPRENE PAD ON CULVERT ~
.~ t FROM JOINT (TVP.)
BOX I BOX 2
FEMALE MALE
t N. PLYWOOD
It IN. RIGID FtW.t PANELS
FIGLRE 9. TEST CQ\JFIGURATION SCHEMATIC
20

The testing schedule is summarized in the following table:
Table 2. Actual Test Schedule
Test Test Confi gu rat ion
Date No. Code1 Max. Test Load ReEetitions Comments
7-29-82 1 7F2 20.8 k 2
7-29-82 2 7M1 20.8 k 2
8-17-82 3 5F2 20.8 k 3
8-17-82 4 5M1 20.8 k 3
8-17-82 5 5M1 45.2 k 2 Replaced 1/2" Brg. PL with 1" PL
8-18-82 5A 5M1 45.1 k '" ,)
8-18-82 6 5F2 45.2 k 3
8-19-82 7 7F2 45.7 k 3
8-19-82 8 7Ml 45.5 k 3
8-19-82 9 7Ml 78.0 k 1
8-20-82 10 7M2 45.5 k 3
IThe first digit in the test configuration code denotes the span in feet, the letter M or F refers to the male or female end, and the second digit refers to box No.1 or 2.
21

4. TEST RESULTS
4.1 Measured Stresses
Calibration of the strain gages was accomplished by performing uniaxial
tension tests on an instrumented steel wire. Measured tangent moduli were
31.1 x 10³ ksi and 29.7 x 10³ ksi in two tests, so measured strains were
converted to steel stresses using an elastic modulus of 30 x 103 ksi.
Measured ultimate tensile strength was 74.2 ksi.
Figure 10 presents measured steel stresses for test configurations 7M1,
7F2, and 7M2 for test loads of 20.8 kip and 45.2 kip. Critical loading
occurs in test 7M1, and maximum steel stress for the design service loading
of 20.8 kip is 6.4 ksi in the top slab steel at gage location 1-7-73. For
the design ultimate load of 45.2 kip, the maximum steel stress is 17.2 ksi.
Figure 11 presents measured steel stresses for test configurations 5Ml
and 5F2 and for test loads of 20.8 kip and 45.2 kip. Critical steel
stresses occur in test configuration 5Ml, however stresses are lower than
measured stresses in tests of the 7 ft span.
22

1M1 7F2 7M2 #"'fEST DESIGNATION
1 1 l---LOAD LOCATION
Ljr--.. 8(j(1rZr'T'-'-1 --_c:::::!:==-'-S~!~O*rr--.,2-----==-'L, TOP SL AS
! ~ rt Y ~ ~S1:~~A~~
(I) (I) L\J a::
20
t; 10
..J L\J L\J ... (I)
-en ~ -(I) (I)
W ... (I)
..J L\J L\J ... (I)
~
CiS ¥ (I) CI') L\J
I! (I)
..J L\J L\J b;
20
10
0 0
2
10
2
"'i I N I'j- "i-N N
TEST 7MI
/20<11' 4 6 8 10 12 14 i STATION (FT.)
TEST 7F2
4 I 8 10 12 14 fl STATION (FT.)
TEST 7M2
4 12 14 { STATION
•
. FIGURE 10. MEASURED REINFORCING STEEL STRESSES - CENTERLINE OF 7FT. SLAB
23

5MI 5F2 ..-rEST DESIGNATION
1 t ...-LOAO LOCATION ., S L, TOP SLAB . I i ~
- ~ ." / STRAIN GAGE ;b .-. I I I IXSGNATION
.!. I N It) In - I I N N
20 -I nSf W -B .45.2"
E to
-'
~ II C 10.'
0~ 0
4 ~ • ~o t. S ~TION (fT. 14
ao
i 'UI Sf2 " -.,.
i to 46.2" 0 .,.
-' w ~
0 4 6 • 10 12 14 t STATION (fT.)
AGURE II. MEASLRED REINFORCING STEEL STRESSES CENTERLINE CF 5FT. SLAB
24

4.2 Measured Deflections
Measured top slab deflections are presented in Figure 12 for test
configurations 7Ml, 7F2, and 7M2 and for test loads of 20.8 kip and
45.2 kip. Test configuration 7M1 is critical with respect to maximum
absolute deflection and relative deflection across the joint.
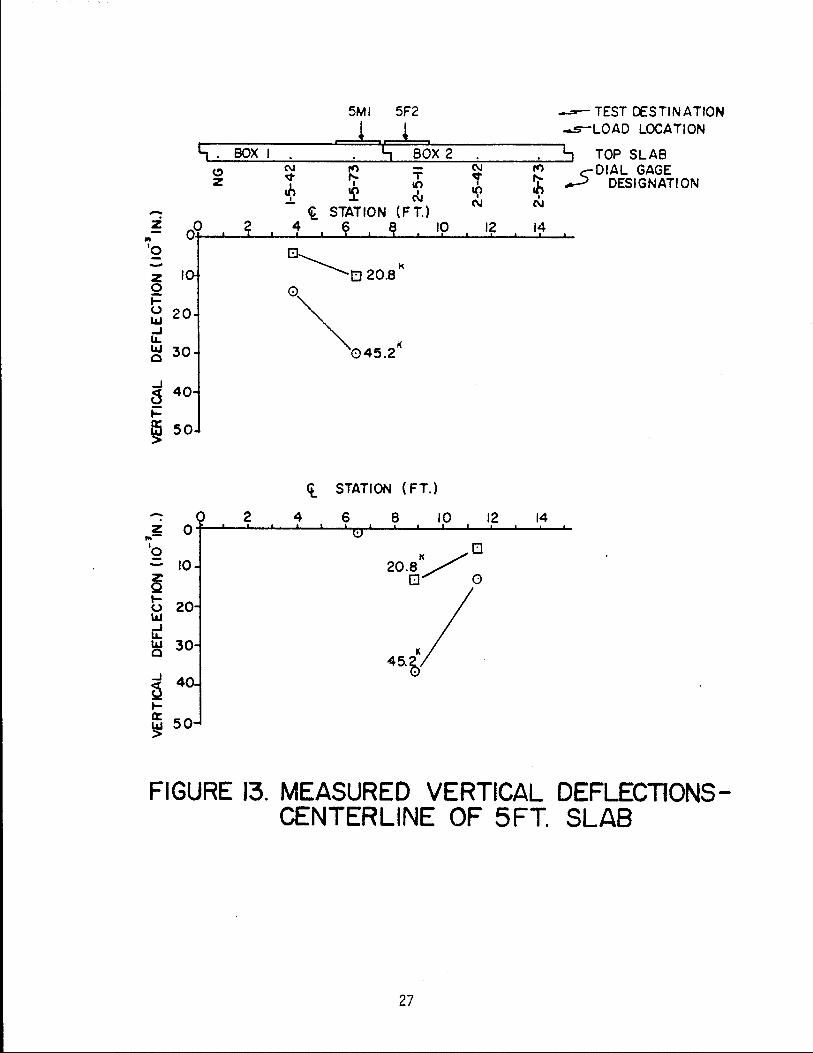
Measured top slab deflections are presented in Figure 13 for tests 5Ml
and 5F2 for test loads of 20.8 kip and 45.2 kip. Maximum absolute and
relative deflections occur in configuration 5F2.
25

% ':'2
0
-~
10
... U loW -J I.L.
~
~ 40 ... a: ~50
., It 0 1ft
'2 -~
10
-J C ~ ... a: &..I :>
'i '2
0
~ 10 ... U &..I -J I.L.
~
7MI 7F2 7M2~
Lj I
.l-h !~TEST IESIGNATION ~-----.l::::=::a.~,r::::::.!::::::L. ____ .c=::~ LOAD LDCATI~ ~---~----~--~----~~~----~~~T~ SLM
(!) Z I
0
0
0
o:t ,.... I o:t ,....
r;. ,...._: ... ,.!.. r!.~DIAL GAGE N ctJ cl. DE SIGNAT ION
S T A TION (F T ) 2 4 6 8 10 /2 14
o TEST 7MI
K
2 4 045.2 ¢.. STATION (FT)
6 8 . 10 /2 /4
Q
TEST 7F2
'- STATION (FT) 2 4 6 8 /0
TEST 7M2
o
o
/2 /4
~ 20.eK
o
FIGURE 12. MEASURED VERTICAL DEFLECTIONS
CENTERLINE OF 7 FT SLAB 26
-Z .. '0
Z I o i= u 20 L&.I ..J LL. L&.I 30 o
8 40 i= ~ 50
5MI 5F2 --s- TEST ce:STINATJON
! * -s-LOAD LOCATION ~G-.--60-X-I----~==~S===8~OX-2--------~S TOP SLAB
(!) N It) N It) C- DIAL GAGE z ~ ";- J; Y J; ~ DESIGNATION
2
J, It) N' ~ , ~ ~ N N
~ STATION (FT.) 4 6 10
o ~lJ20.8K
o
~045.2K
<t. STATION (FT.)
4 6 8 10
12 14
12 14 z O+-~~~~~~~~~~~~~~~ ",-
'0 10
FIGURE 13. MEASURED VERTICAL DEFLECTIONSCENTERLINE OF 5 FT. SLAB
27

4.3 Discussion of Results
For test loads of 20.8 kip, representing the design service wheel load,
all measured steel stresses are well below the C 850 live load fatigue limit
stress of 21.0 ksi. The maximum measured stress is 6.4 ksi in configuration
7Ml.
For test loads of 45.2 kip, representing the design ultimate wheel
load, all measured steel stresses are well below the C 850 ultimate total
load yield stress limitation of 60 ksi. The maximum measured steel stress
is 17.2 ksi in confi gu rat ion 7Ml. Dead load stresses have not been cal cu
lated here.
Significant load transfer across the joint is obvious in the data from
test configuration 7F2 only. Stress data for test configuration 5F2, in
which load transfer is also possible, does not indicate any significant load
transfer although deflection data does indicate some minor load transfer is
occurring. As is expected, no load transfer across the joint is observed in
test configurations 7Ml or 5Ml. While maximum measured stresses occurred at
gage locations 1-7-73 and 1-5-73, maximum deflections occurred at stations
1-7-73 and 2-5~11. The stiffness at stations 2-7-11 and 2-5-11 is expected
to be less, neglecting shear interaction across the joint, than the stiff
ness at stations 1-7-73 and 1-5-73, respectively, because of the joint
geometry. Both stations are located 11 in. from the joint line, but the
male connection of stations 1-5-73 and 1-7-73 has more concrete outboard of
the poi nt of load app 1 i cat i on than does the fema 1 e connect i on at stat ions
1-5-11 and 1-7-11. The vertical deflection in configuration 7F2 is less
than the deflection in configuration 7Ml because of the significant shear
transfer that occurs in configuration 7F2. Without significant shear
transfer in configuration 5F2, the deflection is slightly greater than that
of configuration 5M1.
28

A comparison of the measured stresses presented in Figure 10 and the
predicted stresses in Figure 6 suggests that the top slab is behaving essen
tially as an uncracked section. Measured maximum service load steel
stresses are approxi mate ly 6. 1 to 6.4 ks i, approxi mate ly 75% greater than
the predicted steel stress of 3.6 ksi assuming the section is uncracked, and
well below the approximately 32 ksi predicted steel stress in the cracked
section. Measured vertical deflections presented in Figure 12 more closely
agree with p redi cted uncracked sect ion defl ect ions than predi cted cracked
section deflections presented in Figure 5.
Cracking was not observed in the top slab at service load. The first
observed crack in the 7 ft slab appeared at a test load of 27 kip. Two
other flexural cracks opened at test loads of 50 kip and 55 kip, respective
ly. These three cracks were the only observed cracks havi ng planes which
might intersect the instrumented tension steel. The width of the central
crack was measured with a graduated reticle at various loads. The observed
crack widths were 0.010 in. at 50 kip and 0.013 in. at 60 kip. The field
sketch of observed cracks is included in Appendix E.
The effects of the progressive cracking are apparent in Figure 14 which
presents steel stresses and vertical deflection histories at gage station
1-7-73 during repeated tests in configuration 7Ml. The steel stress per
unit load increases with repeated testing, apparently because crack develop
ment causes a change in the neutral surface location and a reduction in the
effective moment of inertia. The stiffness of the top slab is also reduced
for the same reason. The observed effects of the cracking are still signif
icantly less than would be expected if the section is assumed to be fully
cracked, according to the design philosophy of the ACI Building Code
Requirements for Reinforced Concrete. This is interpreted as an indication
29

that the observed cracking at the strain gage section is not fully developed
in spite of the large overload applied, and that the fully cracked section
design philosophically is overly conservative when applied to the reinforced
slab with the concentrated load considered here.
The limiting crack width of 0.10 in. was observed at a test load of
50 kip. The measured steel stress at that load was approximately 21.7 ksi,
considerably less than the 50.1 ksi limiting stress given by equation (1 ,.
The strain gage station is very close to the observed crack plane shown in
Appendix E.
30

40
/' TEST 9 RUN I
30 ,/ - / CiS / ~ 2 / -(J)
,/TEST 8 ffl ~ /' RUN 2 (J)
10 /' ~ ,/ UJ I..LJ #/'TEST 2 t- ",/' RUN I en
? !P
0 0 10 20 30 40 50 60 70 80
, TEST LOAD ( KIP.)
0 10 20 30 40 50 60 70 80 ~
, TEST 2 """= ~:--, RUN I ~ 20 "
~ " - 40 z "'" TESTS Q
',RUN 2 t-60 "-u
UJ
\ ~ LL UJ SO '\ 0
~ ~ 100
\ u t-o: 120 UJ
\ >
140 TEST 9 i RUN I
FIGLRE 14. REPEATED LOAD-DEFLECTION DATA-STATION 1-7-73 TEST CONFIGURATION 7M I
31

5. HS 20 AXLE LOAD STRESSES
The live load stresses due to two wheels of an HS 20 axle can be
approximated by superposition of measured wheel load stresses. Since the
It·ad locations of tests 7F2 and 7M2 are approximately 5 1 -8" apart, superpo
sition of measured steel stresses in these two tests will allow a conserva
tive approximation of steel stresses caused by two HS 20 wheels spaced
6 1 -0". By such superposition, the maximum steel stress expected under a
design 32.0 kip axle with a 1.3 impact factor is approximately
6.1 ksi + 0.3 ksi = 6~4 ksi.
This maximum.stress occurs at gage station 2-7-73, the male joint end of the
cu1 vert.
The maximum steel stress due to a design ultimate axle load of 90.4 kip
is
14.0 ksi + 0.4 ksi = 14.4 ksi.
32

6. CONCLUSIONS
The following conclusions are drawn from the results:
1. Maximum reinforcing steel stresses in ASTM C 850 7 x 5 box culverts
subjected to a design wheel load of 20.8 kip are significantly less
than the AASHTO 1.5.26(8) design allowable service steel stress of
24 ksi. The maximum steel stress measured was approximately 6.4
ksi.
2. Maximum reinforcing steel stresses in ASTM C 850 7 x 5 box culverts
subjected to a design ultimate wheel load of 45.2 kip are signifi
cantly less than the design yield strength of 60 ksi. The maximum
measured steel stress was approximately 17.2 ksi.
3. Cracking caused by application of the design ultimate wheel load is
relatively insignificant with respect to cracking in a fully
cracked section condition specified by the ACI design criteria.
Live load stresses due to other forces and dead load stresses have not
been investigated.
33

7. RECOMMENDATIONS
The following recommendations are offered:
1. ASTM C 850 size 7 x 5 reinforced concrete box sections appear to be
conservatively designed due in part to design assumptions and
simplifications regarding load distribution. A three-dimensional
analysis and experimentally measured stresses support the use of
these boxes without shear connectors.
2. A field trial of a C 850 box culvert installed without shear
connectors is recommended. Sufficient instrumentation should be
installed to verify the presented test results for 7 x 5 boxes, or
in the case of boxes of other sizes, to extend the test results.
Particular attention should be given to absolute and relative
deflection measurements and long-term crack pattern observations.
3. The results of the present study, and future test results, should
be presented for consideration to the AASHTO Rigid Culvert Liaison
Committee to the AASHTO Bri dge Committee, and to ASTM Committee
C-13.
34

[1 ]
[2]
[3]
[4]
[5]
[6]
[7]
REFERENCES
"Standard Specification for Precast Reinforced Concrete Box Sections for Culverts, Storm Drains, and Sewers with Less than 2 ft of Cover Subjected to Highway Loadings," (ASTM C 850-82), American Society for Testing and Materials, Philadelphia, April 1982, 12 pp.
Latona, Raymond W., Heger, Frank J., and Bealy, Mike, "Computerized Desi gn of Precast Rei nforced Concrete Box Cul verts, II Transportation Research Record No. 443, Transportation Research Board, 1973, pp. 40-51.
Boring, Marvin R., Heger, Frank J., and Bealy, "Test Program for Evaluating Design Method and Standard Designs for Precast Concrete Box Culverts with Wire Fabric Reinforcing,1I Transportation Research Record No. 518, Transportation Research Board, 1974, pp. 49-63.
Lloyd, J. P., Rejali, H. M., and Kesler, C.E., "Crack Control in One-Way Slabs Reinforced with Deformed Welded Wire Fabric," ACI Journal, Oct. 1963.
Gergely, P., and Lutz, L. A., "Maximum Crack Width in Reinforced Concrete," Symposium on Cracking of Concrete, American Concrete Institute, March 1966.
ACI Commi ttee 318, "Buil di ng Code Requi rements for Rei nforced Concrete (ACI 318-77)," 6th ed., American Concrete Institute, Detroit, March 1981, 103 pp.
Interim Specifications - Bridge 1981, American Association of State Highway and Transportation Offlcia1s, Washington, D.C., 1981.
[8] Standard Specifications for Highway Bridres, 12th ed., American Association of State Highway and Transportat on Officials, Washington, D.C., 1977, 496 pp.
[9]
[10]
[11 ]
Panak, John J. and Matlock, Hudson, "A Discrete-Element Method of Analy~is for Orthogonal Slab and Grid Bridge Floor Systems," Research Report 56-25, Project 3-5-63-56. Center for Hi ghway Research, The University of Texas at Austin, May 1972, 155 pp.
Practical Strain Gage Measurements, Application Note 290-1, Hewlett Packard, September 1 81, 29 pp.
Perry, C. C. and Lissner, H. R., The Strain Gage Primer, McGraw-Hill, Inc., New York, 1962.
35

APPENDIX A
MEASURED STRAIN GAGE ISOLATION
RESISTANCE TO REINFORCING STEEL
36

Notes:
MEASURED STRAIN GAGE ISOLATION RESISTANCE TO REINFORCING STEELl
Gage Designation Gage Isolation Resistance2
1-5-11 N-A
1-5-42 > 100M Q
1-5-73 00
1-7-11 N-A
1-7-42 20MTI
1-7-73 00
2-5-11 00
2-5-43 00
2-5-73 00
2-7-11 50MQ
2-7-43 llMQ
2-7-73 00
lMeasured 3/83, six months after testing.
2Using analog ohmmeter, resolution 100 M Q •
31100 11 reported res i stance can be interpreted as "greater than approximately 500 M QII.
37

APPENDIX B
STRAIN GAGE DATA
38

TTl PROJECT 2294 PRECAST BOX CULVERT TEST DATA
DATE 7-29-82 TIME: START 1025 FINISH 1109 TEST No. 1
LOAD APPLIED ON 7 -ft SIDE OF FEMALE END OF BOX No. 2
STRAIN INDICATOR GAGE FACTOR SETTING 2.00
LOAD STRAIN GAGE READING, in./in. X 106 CELL
READING 1542 1573' 2511 2542 2573 1743 1773 2711 2743 2773 lb 1 2 3 4 5 6 7. 8 9 10
Run 111 Zero - - - - - 0 0 0 0 0 4,000 - - - - - 0 0 +10 0 0
8,000 - - - - - 0 +2 +20 + 7 + 2 12,000 - - - - - 0 + 4 +28 +10 + 4
16.000 - - - - - 0 + 9 +35 +11 ___ +6 .--.
20,840 - - - - - +3 +14 +52 +16 +10 16,720 - - - - - +2 +12 +52 +13 +8
10,640 - - - - - 0 +8 +42 + 8 + 8 8,120 - - - - - 0 +5 +37 + 7 + 7 4,100 - - - - - 0 0 +27 + 5 + 7
Zero ----- - - . - - 0 0 +15 0 + 5
Run 1f2 Zero 0 ·0 0 0 0
4.100 - - - - - 0 0 +13 +4 0 8,000 - - - - - 0 0 +20 + 5 + 4
12,000 - - - - - 0 + 7 +30 +10 + 8 ? ..
17 000 - - - - - +1 +12 +42 +12 + 4 ? 20,800 - - - - - +5 +12 +50 +13 +8 16,100 - - - - - +2 +10 +45 +12 + 7. 12,000 - - - - - 0 + 8 +37 +10 + 6
8.100 - - - - - 0 +4 +28 +8 + 8
4,000 - - - - - 0 +2 +20 . + 6 + 6 Zero - - - - - 0 0 + 6 + 0 + 8
39

i
TTl PROJECT 2294 PRECAST BOX CULVERT TEST DATA - -
DATE 7-29-82 TINE: START 1416 FINISH 1499 TEST No. 2
LOAD APPLIED ON 7 -ft SIDE OF MALE END OF BOX No. 1
STRAIN INDICATOR GAGE FACTOR SETTING 2.00
LOAD STRAIN GAGE READING, in./in. X 106 CELL >
READING ·1542 1573 2511 2542 2573 1743 1773 2711 2743 2773 lb 1 2 3 4 5 6 7 8 9 10
Run #1 Zero --- --- --- --- --- 0 0 0 0 n 4,200 --- --- --- --- --- .+ 5 +.-36 0 0 0 8,000 -- --- --- --- --- +12 + 78 0 0 0
12,000 -- --- --- --- --- +18 +122 0 0 0 16,000 --- --- -- --- --- +25 +168 0 0 0 20,800 --- --- --- --- --- +37 +222 0 0 0 ---16,000 --- ---- --- --- --- +32 +182 _0 0 0 12.000 --- --- --- --- --- +25. i_±l3R ..fi n n
8,000 --- --- --- --- --- +16 + 91 0 0 + 3 4,000 --- --- --- --- --- +10 + 45 0 0 0
Zero --- --- --- --- --- 0 0 0 0 0
Run 112
Zero --- --- --- --- --- 0 _0. 0 n n 4 100 --- --- --- - - -- 4- h 14- ,:\7 4-? n n 8,000 --- --- --- --- --- +14 + 82 0 0 + 3
12,000 --- - . --- --- --- +20 +1_3} Il n + 3 16,300 --- --- --- --- --- +28 +174 0 0 0 20,800 --- --- --- --- -- +39 +23l 0 n n 15,400 --- --- --- --- --- +32 +177 0 0 0 12,000 --- --- --- --- --- +25 +139 0 n n 8,000 --- -- --- --- --- +16 + 91 0 0 0 4.000 --- --- --- --- --- +8. l±JU ..fi n n Zero --- --- --- --- --- 0 0 0 n n
40

i
TTl PROJECT 2294 PRECAST BOX CULVERT TEST DATA
DATE 8-17-82 TIME: START - FINISH - TEST No. 3
LOAD APPLIED ON 5 -ft SIDE OF Female , END OF BOX No. 2
- - - -
STRAIN INDICATOR GAGE FACTOR SETTING 2.00
LOAD STRAIN GAGE READING, in./in. X 106 CELL
READING -1542 1573 2511 2542 2573 1743 1773 2711 2743 2773 lb 1 2 3 4 5 6 7 8 9 10
-Run ill Zero 0 0 0 0 0 0 0 0 0 0 4000 + 2 + 1 + 10 + 6 + 3 + 1 0 0 0 + 3 8000 + 2 + 2 + 18 + 8 + 6 + 3 0 0 0 0
,...2000 + 2 + 2 + 28 + 11 + 6 + 2 + 2 0 0 0
~6000 + 4 + 4 + 37 + 14 + 8 + 2 + 2 - 3 0 0
21800 + 4 + 4 + 57 + 19 + 10 + 2 + 2. - 6 - ? 0 -~6020 + 4 + 4 + 50 + 18 + 8 + 4 + 2 - 2 0 + 2 10480 + 4 + 4 + 38 + 16 + 7 + 4 + 4 0 0 0
8300 + 4 + 4 + 34 + 15 + 8 + 4 + 3 0 0 0 4660 + 4 + 4 + 26 + 12 + 7 + 4 --± .2 Q () 0 Zero + 4 + 4 + 8 + 10 + 6 + 3 + 3 + 3 + 3 + 1
Run il2
Zero 0 0 0 0 0 0 n () n 1'1
4000 0 0 + 9 + 4 + 1 0 0 - 2 - 2 0 8000 + 2 0 + 17 - + 6 + 2 0 0 - 2 0 0
[l2000 + 2 0 + 26 + 8 + 2 0 0 - 4 - 2 0 16000 + 1 0 + 35 + 10 + 4 0 O. - 4 - 4 0 20800 + 2 + 1 + 47 + 13 + 4 0 0 - 8 - 5 - 2 16400 0 0 + 40 + 10 + 4 0 0 - 6 - 4 0 10140 0 0 + 26 + 7 + 2 0 - 2 - 4 - 2 - -0
6380 0 0 + 18 + 5 + 1 0 0 - 2 - 2 0 3740 0 0 + 12 + 2 0 0 0 0 0 0 Zero '0 0 + 4 + 2 0 0 0 0 0 0
~;
~~ ...... . -~ -.
41

TTl PROJECT 2294 PRECAST BOX CULVERT TEST DATA
DATE 8-17-82 TIME: START - FINISH - TEST No. 3
LOAD APPLIED ON 5 -ft SIDE OF Female END OF BOX No. 2
STRAIN INDICATOR GAGE FACTOR SETTING 2.00 -
LOAD STRAIN GAGE READING, in./in. X 106 CELL
READING 1542 1573 2511 2542 2573 1743 1773 2711 2743 2773 lb 1 2 3 4 5 6 7 8 9 10
Run If3 Zero 0 0 0 0 0 0 0 0 0 0
4480 0 0 + 8 + 2 + 1 0 0 0 0 0 8000 0 0 + 15 + 4 + 2 0 0 2 - 2 0
12000 0 0 + 25 + 6 + 2 0 - 2 0 - 4 - 4 16000 0 0 + 35 + 9 + 4 0 - 2 - 6 - 4 - 2 ----20800 0 0 + 49 + 12 + 6 0 - 1 - 9 - 6 - -2 15980 0 0 + 40 + 9 + 4 (j - 1 - 7 - 4 0 12240 0 0 + 31 + 6 + 4 0 0 - 5 - 3 0
8540 0 0 + 23 + 6 + 3 0 0 - 3 - 2 0 4300 0 0 + 13 + 2 + 2 0 0 - 2 - 2 0
Zero 0 0 + 3 0 0 0 0 0 0 0
-
42 ---------------- ---------

DATE 8-17-82
: . ;
TTl PROJECT 2294
PRECAST BOX CULVERT TEST DATA
TIME: START,;,..... _-__ FINISH _-__ _ TEST No •. 4 -----LOAD APPLIED ON 5 -ft SIDE OF _M_a_1e ______ END OF BOX No. _1 __ _
STRAIN INDICATOR GAGE FACTOR SETTING ·2.-Q"0
LOAD CELL
READING lb
Run tIl
1542
1
1573 '2
------
STRAIN GAGE READING, in./in. X 106.
2511 2542 2573 1743 11773 3 4 5 6 7.
2711 8
2743
9
2773 10
Zero 0 0 0 0 0 0 0 0 0 o. 4300 + 4 + 12 . 0 0 0 0 - 3 0 0 0
8000 + 6 +24 0 0 0 - 2 - 8 0 0 0
12950 + 10 + 37 + 1 0 0 - 4 - 11 . 0 0 0
16000 + 14 + 54 + 1 0 0 - 6 - 15 0 0 0
1-2=..:0:..;:8~0.::..0 -+_+.:......=2:=2-1-~+__=9:..:9_+---.:0~~--0=-- f-:. 0 - 8 _-,--=1:..::::8-t-_--=0=--+ __ 0~-~·0~ 15800 + 15 + 92 + 2 0 0 -'5 - 15 0 0 0 11700 + 12 + 77 + 2 0 0 - 4 - 12 0 0 0
8100 + 9 + 62 0 0 0 0 - 8 0 0 0 3800 + 5 + 43 0 0 0 0 - 3 0 0 0
-r·-----r----+~--~----~--~~ft Zero 0 + 28 0 0 0 0 0 0 0 0
Run #2 Zero o . 0 o. 0 0 0 0 0 ·0 0
4100 + 4 + 14 o - 0 o. 0 - 3 0 0 0 8000 + 6 + 29 + 2 0 0 0 - 6 0 0 + 1
11900 + 10 + 47 + 2 0 0 0 - 10 0 0 + 3
16000. + 15 + 66 + 3 0 0 - 4 - 6 0 0 + 3 20800 + 18 + 90 + 2 0 O· - 6 - 18 0 0 + 2
15600 + 14 +.76 0 0 0 - 4 - 15 '0 0 +'3
6800 + 6 + 39 0 0 0 0 - 6 0 0 + -3
3900 + 4 + 26 0 0 0 0 - 4 0 0 + 3
Zero .0 + 10 0 0 0 0 0 0 0 + 3
43
;
TTl PROJECT 2294 PRECAST BOX CULVERT TEST DATA
DATE 8-17-82 TIME: START - FINISH - TEST No. 4
LOAD APPLIED ON -ft SIDE OF Male END OF BOX No . 1 . -.
STRAIN INDICATOR GAGE FACTOR SETTING 2.00 --
LOAD STRAIN GAGE READING, in./in. X 106 . CELL
READING 1542 1573 2511 2542 2573 1743 1773 2711 2743 2773 lb 1 2 3 4 5 6 7 8 9 10
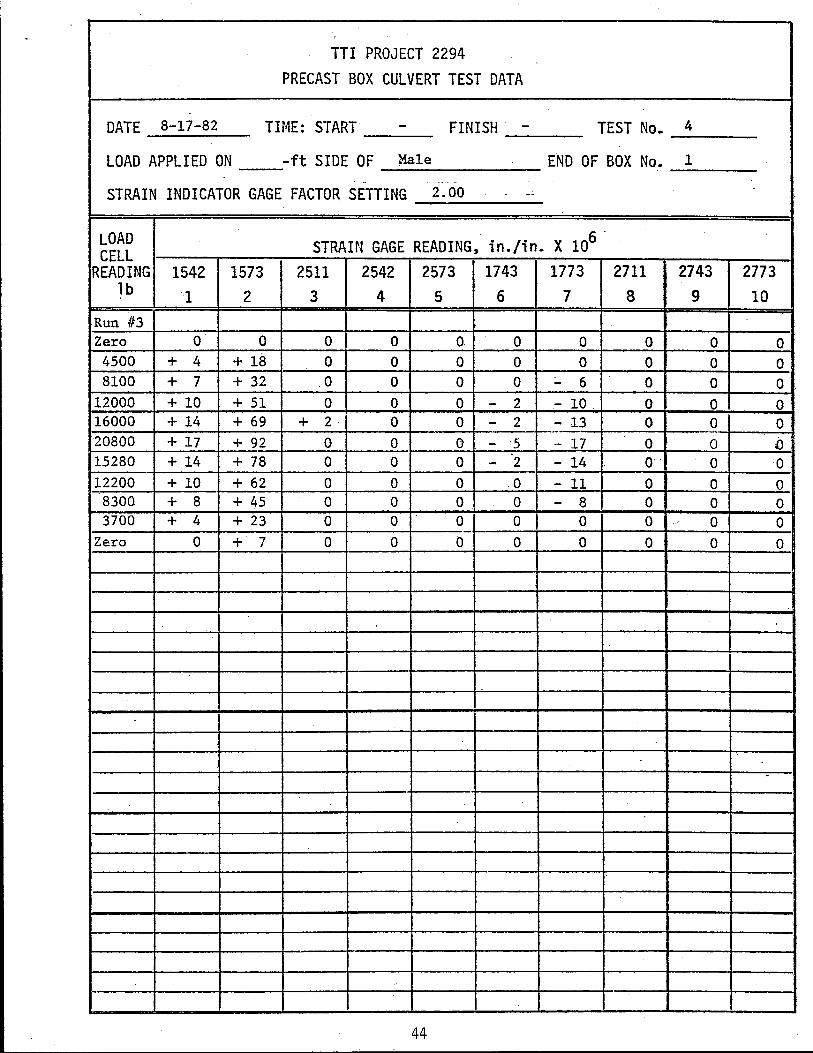
Run 1/3 Zero 0 0 0 0 0 0 0 0 0 0
4500 + 4 + 18 0 0 0 0 0 0 0 0 8100 + 7 + 32 .0 0 0 0 - 6 0 0 0
12000 + 10 + 51 0 0 0 - 2 - 10 0 0 0 16000 + 14 + 69 + 2 0 0 - 2 - 13 0 0 0 _. 20800 + 17 + 92 0 0 0 - 5 .- 17 0 0 .0 15280 + 14 + 78 0 0 0 - 2 - 14 0 0 0 12200 + 10 + 62 0 0 0 0 - 11 0 0 0
8300 + 8 + 45 0 0 0 0 - 8 0 0 0 3700 + 4 + 23 0 0 0 0 0 0 0 0
Zero 0 + 7 0 0 0 0 0 0 0 0
-
-
-
44

.. TTl PROJECT 2294
PRECAST BOX CULVERT TEST DATA
DATE 8-17":82 TIr1E: START ---- FINISH ----- TEST No.,
LOAD APPLIED ON 5 -ft SIDE OF MALE END OF BOX No.
STRAIN INDICATOR GAGE FACTOR SETTING 2.00
LOAD CELL
READING lb
Run fn Zero
9,000 18,100, 27.000 37,000 45,150 34,600
27.780 17,900
9,500
Zero
Run tf2 Zero , Q ?()()
_18. .000
27,200 36 200 45,200
36 400
27 500 15 700
9 200
Zero
STRAIN GAGE READING, in./in. X 106
1542 1573 2511 2542 2573 1743 1 2 3 4 5 6
0 0 0 0 0 0 + 4 f+'37 0 0 0 0 + 15 f+ 83 -2 0 0 -10 + 45 +312 -2 0 0 -Pi
+ ~66 f+495 -3 -2 0 -25 +105 +591 -3 -2 0 -30 + 98 +500 +2 0 + 3 . -23 + 89 +427 0 0 + 3 -18 + 73 +321· 0 0 + 2 -13 + 60 +232 0 0 0 - 7 + 44 +143 0 0 0 0
.
0 0 0 0 0 0
+11 .+ 71 0 0 0 - 2
4- 21l i+lnn 0 - 0 0 -10 +' 40 +266 0 0 0 -15
+54 +358 . 0 0 0 -22 +70 +449 0 0 0 -25
+58 +365 0 0 0 -23
+45 +268 0 0 0 -17 +25 +131 0 0 0 -10
+14 + 74 0 0 0 - 5 '0 - 10 0 0 0 0
. ..
Test 5 terminated due to warped 1/2" thick steel bearing plate beneath load cell.
45
I 17;3
0
- 10 ?1
- in - 44 - 53 - 49
- !,~
- 34 _ 22
- 4
0
1?
- 25 - 35 - 43 - 51 - 46 - 40 - 25 - 18
0
, .
2711 8
0 i1 ()
()
-1 -1 +1
(\
0 0 o·
0 0
0 0 0 0
0 0 0 0
0
5
1 .
.
-
2743 2773 9 10
0 0 n 0
4.? ()
+? ()
+2 0 +2 0
0 +4 n ()
0 0 0 +Il n 4-h
0 0
0 ·0 0 0 0 0
0 0 0 0
0 0 0 0 0 0 0 O.
0 0
;
TTl PROJECT 2294 PRECAST BOX CULVERT TEST DATA
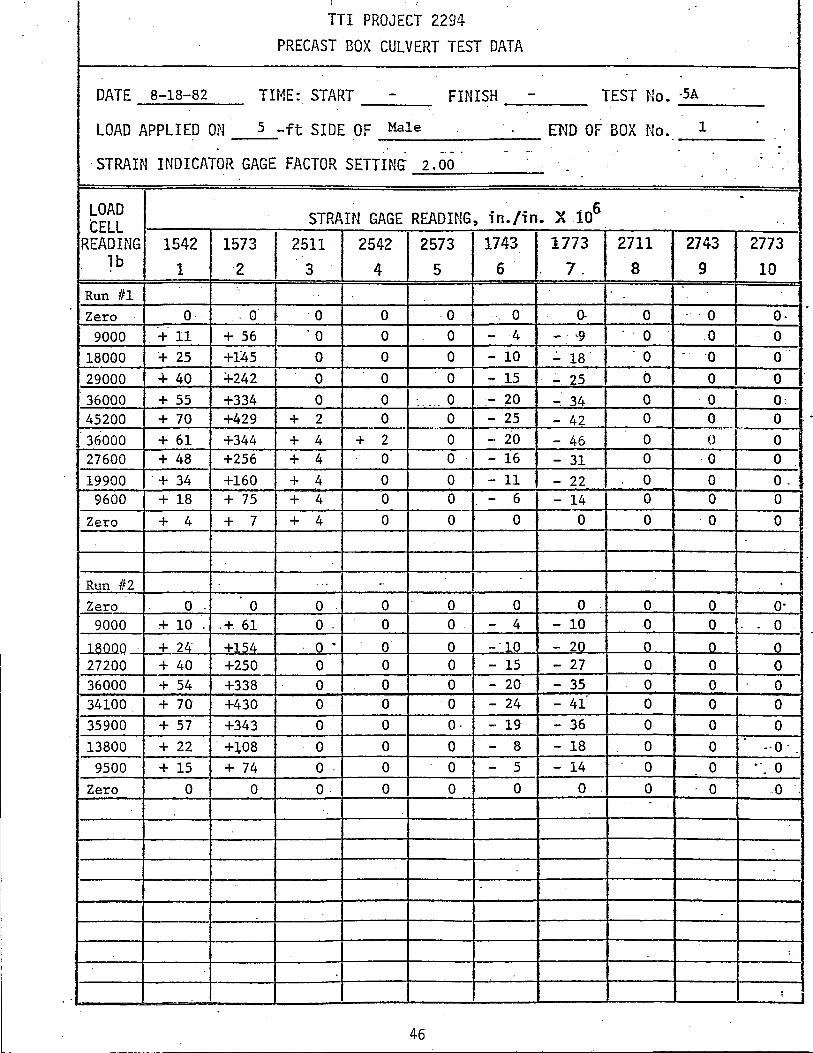
DATE 8-18-82 TH1E: START - FINISH - TEST No. -5A
LOAD APPLIED ON 5 -ft SIDE OF Male El'm OF BOX No. 1 . -- - . - -.
'STRAIN INDICATOR GAGE FACTOR SETTING: 2.00 -
-LOAD STRAIN GAGE READING, in./in. X 10
6 tELL
READING 1542 1573 2511 2542 2573 1743 11~3 2711 2743 2773 lb 1 '2 3 4 5 6' 8 9 10
Run fl1 '.
Zero 0 ,0' 0 0 0 . ' 0 a- 0 .. ·0 0-, '
9000 + 11 + 56 '0 0 0 - 4 - . '9 '0 0 0
18000 + 25 +145 0 0 0 - 10 .:.. 18 '0 - , 0 0
29000 + 40 +242 ,0 0 0 - 15 - 25 0 0 0
36000 + 55 +334 0 0 .- ... 0 - 20 - 34 0 ·0 0: 45200 + 70 +429 + 2 0 0 - 25 - 42 0 0 0 +--- ~
36000 + 61 +344 + 4 + 2 0 - 20 - 46 0 0 0 27600 + 48 +256 + 4 0 0 - 16 - 31 0 0 0
19900 '+ 34 +160 + 4 0 0 - 11 - 22 0 0 o .. 9600 + 18 + 75 + 4 0 0 - 6 - 14 0 0 0 a
I Zero + 4 + 7 + 4 0 0 0 0 0 '0 0 I Run 112 ." -,
Zero 0 0 0 0 0 0 0 0 0 o· 9000 + 10 ,+ 61 0, 0 0 - 4 - 10 0 0 0
]8QQQ + 24' +154 o ., 0 0 -'10 - 20 0 0 0 27200 + 40 +250 0 0 0 - 15 - 27 0 0 0 36000 + 54 +338 0 0 0 - 20 - 35 0 0 0 34100 + 70 +430 o· 0 0 - 24 - 41 0 0 0 35900 + 57 +343 0 0 0, - 19 - 36 0 0 0
13800 + 22 +l08 0 0 0 - 8 - 18 0 0 .- 0 -
9500 + 15 + 74 o ' 0 0 .- 5 - 14 0 0 "0 0
Zero 0 0 0 0 0 0 0 0 0 0
..
,
;
46

Of! I .
TTl PROJECT 2294 PRECAST BOX CULVERT TEST DATA
DATE 8-18-8'2 . TIME: START - FINISH - TEST No. - -SA
LOAD APPLIED ON 5 -ft SIDE OF Male · END OF BOX No. ] . - . -~- - - .- . -
STRAIN INDICATOR GAGE FACTOR SETTING '2.00 · --
LOAD STRAIN GAGE READING;, ·in./in. X 106 tELL
READING 1542 1573 2511 2542 2573 1743 I 1773 2711 2743 2773 lb 1 '2 3 4' 5 6 7. 8 9 10
Run 1F3 "
Zero, 0 0 0 0 0 0 0 O· 0 0 9200 + 12 + 69 0 0 0 - 3 - 10 I ..
.0 0 0 18100 + 28 +162 0 0 0 - 9 - 19 0 0 0 27100 + 43 +256 0 0 0 - 14 - 25 0 0 0 -36100 + 55 +346 0 0 0 - 19 - 34 0 0 0 45100 + 71 +436 0' 0 0 - 23 - 40 0 n o I 36000 + 60 +350 0 0 0 - 19 - 35 0 0 0 26800 + 44 +252 0 0 0 - 15 - 30 0 0 o i 18500 + 34 +164 0 0 0 - 10 - 23 0 0 O· •
9600 + 17 + 17 0 0 0 - 4 - 6 0 0 0 Zero 0 + 5 0 0 0 0 O· 0 0 0
, .. ..
. ", ' , --
..
" · .-...
-
47 L-____________________________________ ._._

, , . , . . ,
TTl PROJECT 2294 .
PRECAST BOX CULVERT TEST DATA
DATE 8-18-82 TINE: START - FINISH - TEST No •. 6
LOAD APPLIED ON 5 -ft SIDE OF Female END OF BOX No. 2· . .
_. - . . -·STRAIN INDICATOR GAGE FACTOR SETTING" 2.00
.-'. -
-LOAD STRAIN GAGE READING, in./in. X 106 tELL
READING 1542 1573 2511 2542 . 2573. 1743 I 1773 2711 2743 2773 lb 1 '2 3 4 5 6 7. 8 9 10
Run'ill' ..
Zero 0 0 0 0 o. 0 0 0 o· o· 9300 '0 .. 0 +'20 + 5 - - 0 0 0 0 0 0
18200 0 O. + 41 + 10 0 0 0 9 - .5 '0 .. - ..,.
27200 0 .. ~ 0 + 70 + 17 + 4 0 0 -15 - 9 0 36200' 0 0 +160 + 24 :.+. 6 0 --.- 0 - 21 - 13 - 4: 40300 0 0 +284 + 28 + 5 0 0 - 24 - 16 - 7 .45100 0 0 .+371 + 29 +. 6 0 o· - 27 - 19 - 7 36300. 0 0 +353 + 23 + 5 0 0 - 24 - 15 - 6 25700 0 .0 +293 + 16 + 3 0 0 . - 15 - 11 - 4.
16900 0 0 +233 + 9 0 0 0 - 12 - 8 - 3 9700 0 0 +184 + 4 0 0 0 - 8 - 4 0
Zero 0 0 +120 0 0 0 0 0 0 0 ..
-'" ..
Run 112 . Zero O. 0 O. 0 0 0 0 0 0 O·
9200 o· 0 +. 31·· + 4 0 0 0 - 5 0 0 18200 0 '0 + 92 + 16 0 0 0 - 10 - 8 - 4 27200 0 0 +154 + 16 + 4 0 0 - 15 - 11 - 5 36100 0 0 +215· + 23 + 6 0 0 - 20 - 15 - 7
45100 0 '0 +283 + 30 + 8' 0 0 - 25 - 20 - 8 39800 0 0 +238 + 24 + 6 0 0 -19 - 15
.' -.·6-
27000 0 0 +188 + 17 + 4 0 0 - 14 ~ 12 " .. '
4 ~ .. 18600 0 0 +126· + 13 + 3 0 0 - 10 - 6 -··2
8800 . 0 0 + 56 + 5 0 0 0 - - 5 - 3 0 Zero 0 0 + 5 0 0 0 0 0 0 O·
..
;
48

:! of I ,
TTI PROJECT 2294
PRECAST BOX CULVERT TEST DATA
-DATE 8-18-"82 -TH1E: START - FINISH - TEST No. - - 6
· LOAD APPLIED ON 5 -ft SIDE OF Female - END OF BOX No. 2 --,- .. --- - - - .
STRAIN INDICATOR GAGE FACTOR SETTING -2.00 -. ·
LOAD STRAIN GAGE READING, -in./in. X 106
CELL READING 1542 1573 2511 2542 2573 1743 I 1773 2711 2.743 2773
lb 1 -2 3 4 5 6 7_ 8 9 10 Run il3 - -
Zero 0 0 0 0 0 0 0 I 0 0 0---
9200 0 0 +'37 + 6 + 3 0 0 - 5 - 4 0 18100 0 -0 +102 + 12 + 6 0 0 ... 10 - 8 - 2 • 27100 0 ·0 +170 "+ 18 + 8 0 0 - 16 - 12 - 5
-36400 0 0 +233 + 27 + 10 0 0 - 20 - 15 - 6-45200 0 0 +294 + 32 + 11 0 0 - 25 - 20 - 9 -37000 0 0 +26.0 + 27 + 9 0 0 - 21 - 15 - 6 45000 0 0 +300 + 31 + 11 0 0 - 26 - 20 - - 8_ 35400 0 0 +259 + 26 + 10 0 0 .- 20 - 16 - 6-
27300 0 0 +198 + 20 + 8 0 0 - .-17 -13 - 4 18300 0 0 +128 + 14 + 6 0 0 - 10 - 9 - 4
9300 0 0 + 64 + 7 + 5 0 0 - 4 - 4 0 Zero 0 0 + 6" 0 0 0 0 0 0 0
,-, ,-
. --, · -
" .-- , . . ' -
--,
:
49

~! .: I '.
TTl PROJECT 2294 PRECAST BOX CULVERT TEST DATA
DATE 8-18-82 ,TIME: START - FINISH - TEST No. ·7
LOAD APPLIED ON 7 -ft SIDE OF Female 2 . . END OF BOX No . . .'. . 2:'O-Cr - ,- .' - .
STRAIN INDICATOR GAGE FACTOR'SETTING ' "
. " "
LOAD STRAIN GAGE READING,in./in. X 106
CELL READING '1542 1573' 2511 2542 2573 1743 I 1773 2711 2743 2773
lb 1 '2 3 4' 5 6 7. 8 9 10 'Run 411 "
" . ,
Zero ,
0 0 0 0 0 0 0 0 0 O. 9100
.. 0 0 4 0 0 0 + 3 I +- 30 ' + ·9 + 3 -
18000 0 0 - 13 - 4 ' . 0 + 6 "+ 26 + 52 + 17 + 7 • 27100 0 0 - 22 - 8 0 + 12 + 55 + '8 + 26 +13
36100 0 - 8 I - 30 - 10 0 +'19 + 90 +190 + 42 + 17 _ ..
45300 - 8 '- 14 - 44 - 16 - 6 + 25 +125 + 326 +104 R + 22 35600 - 4 - 9 - 36 - 12 - 4 + 25 +111 +304 +105 + 23 27200 0 - 5 - 30 - 9 - 4 + 21 + 83 +266 + 98 + 20 18100 0 ,0 - 22 - 5 0 +,17 + 53 .+219 + 86 + 18 ..
7900 0 0 - 10 0 0 + 12 + 24 +158 + 72 + 16 Zero 0 + 12 0 0 0 + 13 + 20 +102 + 57 + 10
Run 112' '" ..
Zero 0, 0 O. 0 0 0 O. 0 0 0
9000 O. 0 - 7. 0, 0, 0 + 10 +50 + 14 . +. 5 18100 - 3 ,.. 6 - 18- - 6 - 2 + 7 + 40 +101 + 28 + 8 27200 - 6 - 13 - 30 - 10 - 4 + 12 + 74 +152 + 41 + 12 36600 - 9 - 2.0 - 41 . - 13 - 4 + 18 +107, .+204 + 55 '+ 15 45400 - 12 - 25 - 50 - 15 - 7 + 25 +143 +264 + 78 + 20 36800 - 11 -:- 22 - 44' - 14, - 5- + 22 +124 +232 + 70 + 19 27200 - 14 - '4 , + 18 + 90 +186
, +.-i7 - 7 -.14, - 37 + 58 -
18300 - 4 - 7 - 28, - 10 - 2 + 13 + 58 '+135 of: 45 +"14 7500 0 0 -:- 14 - 4 0 + 8 -+ 25 ' + 68 + 27 + 10
Zero 0 + 7 + 5 0 0 + 6 + 20 + 15 + 10 . +.8' , ..
-"
50

:!.: . ,
TTL PROJECT 2294 PRECAST BOX CULVERT TEST DATA
- -DATE 8-18-82 TH1E: START - FINISH - TEST No. - -7
7 -ft SIDE OF Female END OF BOX No. 2 .
LOAD APPLIED ON . " --
STRAIN INDICATOR GAGE FACTOR SETTING i:oo-- - "
"
LOAD STRAIN GAGE READING, -in./in. X 106 CELL
READING 1542 1573- 2511 2542 2573 1743 I 17;3 2711 2743 2773 lb 1 -2 3 4 5 6' 8 9 10 I
Run 113 Zero 0 0 0 0 0 0 0 0 0 q 9100 0 - 3 -'10 - 6 0 + 3 + 8 I +. 53 + 14 + 18200 0 --10 - 26 9 0 + 6 '+ 40 +105 + 29 + - 4 , 27300 - 4 - ·17 - 35 :... 10 0 + 12 + 73 +156 -I- 44 + 10 36100 - 6 - 22 - 42 - 13 - 4 + 17 +105 +204 + 57 + 12· 45600 - 10 '.,.. 30 - 54 - 20 - 7 + 22 +140 +255 +71 +-15 36100 - 10 - 27 - 48 - 17 - 6 + 20 +114 +217 + 65 + 14 27000 - 7 - 20 - 40 - 12 - 4 + 15 + 82 +171 + 51 + 12 I 18400 - 4 - 13 - 33 -11 - 4 +-10 + 50 +123 + 40 + 10- ~
8600 0 - 3 - 20 - 7 0 + 4 + 18 + 67 + 21 + 4 Zero 0 0 0 0 0 0 +11 .. ' 0 0 0
..
.
-
.--" . -
"
.-
:
51

I' ' . I
TTl PROJECT 2294 . PRECAST BOX CULVERT TEST DATA
DATE 8-18-82 TINE: START - FINISH - TEST No •. 8
7 -ft SIDE OF Male END OF BOX No. 1 .
LOAD APPLIED ON . .
. STRAIN INDICATOR GAGE FACTOR SETTING - 2-~ 00 .- -
-LOAD STRAIN GAGE READING:t in./in. X 106 tELL
READING 1542 1573 2511 2542 2573 1743 I 1773 2711 2743 2773 lb 1 '2 3 4 5 6 1. .8 9 10
Run III ..
Zero 0 .' O. 0 0 0 0 0 ·0 0 O. 9000 . - '5 -15 . ·0 + 5 + 9 + 22 .+ 7 +. 6 + 6 + 6
18000 - 17 -~32 .2 0 0 + 40 +213 0 - 0 0 -27400 '- 24 -47 - 5 0 0 +116 +368 n 0 0 35300· - 36 - 65 0 O. 0 +356 +533 + 7 + 3 + 10: -- .... . _ .. . . - .
45500 . - 52 '-' 94 0 0 -1---.- 0 +440 +731 + 5 0 + 5 35400 - 50 - 89 0 0 0 +409 +592 + 4 0 + 7 I 27900 - 42 - 82 0 0 0 +372 +483 + 2 -'5 0 17700 . - 39 - 7.0 0 0 0 +312 +338 + 5 - 4 + 9
8800 - 26 - 54 0 0 0 +256 +220 0 - 4 + 9 Zero - 13 - 30 - 5 0 0 +194 +103 + . 2 - . 9 + 6
' ..
Run /12 ... -.
Zero o . 0 o . 0 0 0 0 0 0 o· 9000 - 5 . . .., 15 O. 0 0 + 34 +104 ·0 0 \ - 0
18100 - 15 ":' 30 .. o ., 0 0 + 92 +235 0 0 0 27000 - 25 - 44 - 2 0 0 +146 +364 0 0 0 36200 - 34 - 58 - 2 0 0 +203 +495 0 0 0 45000 - 42 - '68 0 0 0 +264 +655 0 0 0 34100 - 35 - 61 0 0 O· +220 +484 0 0 0 .-27600 - 33 -.55 0 0 0 . +187 +388 0 0 .- O· . 17500 - 21 - 42 ·0 . 0 0 . +120 +242 0 . ·0
.. ' . O· 8200 - 12 -.26 0 0 0 + 53 +107 0 0 ".0
Zero 0 0 0 0 0 0 + 10 0 0 0
, ;
52

TTl PROJECT 2294
PRECAST BOX CULVERT TEST DATA
. DATE 8-18-"82 . TIME: START ___ -_ FINISH _-__ _ TEST No. _-_8 __ _
LOAD APPLIED ON __ 7_-ft SIDE OF _M_a_l_e ______ END OF BOX No. _1 ___ -
STRAIN INDICATOR GAGE FACTOR SETTING 2.00
LOAD tELL
READING lb
Run·fF3
1542 1
1573
'2
--------
STRAIN GAGE READING,in./in. X i06
2511 2542 2573 1743 11773 3 4 5 6 7,
2711 8
2743
9
2773
10
Zero 0 0 0 0 0 0 0 0 0 Q.
9000 - 8 - 21 - 6 0 - 6 + 30 +100 0 0 0
18300 - 20 - 38 - 7 0 - 7 + 99 '+240 0 ·0 0 27700 ~ 29 - 49 - 6 0 - 6 +160 +378 0 0 '.0
36300 - 40 - 61 - 7 0 - .~8~_~+-=-:21~5~f--+_:...4::-:9:79-+_-=0-l-_----70-+-_~0.:..-J' 45300 - 48 .... 71 - 8 0 - 8 +271 +630 0 0 0
~'r-___ +-____ + _____ ~ ____ +-____ +-____ ~ ____ 4-____ SI'
35000 - 40 - 65 - 7 0 - 8 +227 +495 0 0 0
26200 - 31' - -56 - 5 0 - 8 +178 +362 0 0 0
19000 - 26 - 48 - 2 0 - 6 +126 +259 0 0 o. 8800 - 16 - 30 - 4 0 - 4 + 50 +107 0 0 o
Zero - 6 - 8 - 7 0 - 7 - 5 0 0 0 o
53

~! . ~ ...
TTl PROJECT 2294 PRECAST BOX CULVERT TEST DATA
DATE 8-18-82 . TH1E: START - FINISH - TEST No. ·9
LOAD APPLIED ON 7 -ft SIDE OF Male . END OF BOX No. 1
.- ; -STRAIN INDICATOR GAGE FACTOR SETTING 2·.OO~ -
. -
LOAD STRAIN GAGE READING, ·in./in. X 106 CELL
READING 1542 1573 2511 2542 2573 1743 I 1773 2711 2743 2773 lb
1 2 3 4 5 6 7. 8 9 10 Run til ..
Zero 0 0 - - - 0 0 - - -9300 - 6 - 16 - - - + 47 +119 - - -
18100 - 12 - ·30 - - - +111 +252 - - -27500 - 21 - 38 - - - +183 +397 - -36800 - 28 ...;. 47 - - - +238 +531 - - -. 45100 - 36 - 58 - - - +286 +646 - - -__ 0_- -50200· - 42 - 65 - - - +32"4 +727 _.
'- -55600 - 52 -68 - - - +376 +805 - - -60600 - 60 . - 72 - - - +429 +892 - - - . 66700 - 68 - 76 - - - +494 +1060 - - -71200 - 70 - 80 - - - +523 +1220 ... - -78000 - 78 - 80 - - - +564 +1635 - - -
".
. ..
--
, .-
. .'
.. r 54

!
TTl PROJECT 2294 .
PRECAST BOX CULVERT TEST DATA ..
DATE 8-20-82 TIME: START - FINISH - TEST No ..
LOAD APPLI ED ON 7 -ft SIDE OF Male END OF BOX No. .. . . . . .
STRAIN INDICATOR GAGE FACTOR SETTING 2.00
LOAD STRAIN GAGE READING,in./in. X 106 tELL
READING lb
Run III Zero . 9000 18200 27300 36100 45500 35200 26000 18600
9700 Zero
Run #2 Zero
9400 18500 26900 36100 45400 35800 25600 18300
9100 Zero
1542 1573 2511 2542 2573 1 ·2 3 4 5
- - 0 0 0 - - - ·5 - 24 - 33 - - - 10 - 12 - 20 - - - 19 ..;. 23 - 33
. - - - 20 - 26 - 38
- -. -100 -109 -121 - - - 78 - 83 -92 - - - 80 - 81 - 88 - - - 76 - 76 - 81 - - - 65 - 62 - 66 - - - 60 - 54 - 56
. . ..
- - 0 0 0 - - o. 0 - 14 - - o - - 5 - 11 . - - - 3 - 10 - 17 - - - 8 .- 17 - 26 - - - 12 - 23 - 36
- - - 10 - 19 - 25 - - -. 6 - 14 - 17 - - - 4· - 7 ..:. 11
- - 0 - 3 - 2 - - 0 0 0
Loose wire on strain gage readout at end of first load cycle (Run #1).
55
1743 I 1773 2711 6· 7 8
- - 0 - - 0 .- - + 4 - - + 21 - - + 35
- - + 12 .
- - + 5 - - 0 - - 0 - - - 10
- - - 19
- - 0 - - + 14 - - + 26 - - + 39 - - + 50 - - + 62
- - + 55 - - + 45
- - + 35 - - + 23 - .• - + 8
10
2 ..
. .
.
2743 2773 9 10
0 o· + 2 + 16 + 16 + 83 + 50 +266 +121 +470 .. -. +234 +528 +238 +450 +206 +347 +180 +270 +135 +163 + 81 + 55
0 O· + 27 . +. 70 + 28 +178 +112 +281 +154 +387 +216 +495 +191 +407 +149 +289· ++16 +204 + 66 + 92 + 17 + 4

~! ': I •. ,
TTl PROJECT 2294 PRECAST BOX CULVERT TEST DATA
.
DATE 8-20-82 TIME: START - FINISH - TEST No •. ·10
LOAD APPLIED ON 7 -ft SIDE OF Male .
END OF BOX No. 2 .. . - . .
STRAIN INDICATOR GAGE FACTOR SETTING 2.00 .-.
LOAD STRAIN GAGE READING,in./in. X 106 tELL
READING 1542 1573 2511 2542 . 2573 1743
11773 2711 2743 2773
lb 1 '2 3 4 5 6 7. 8 9 10 Run 1F3 :Zero - - 0 0 0 - -' 0 0 O·
8700 - - 0 0 - 5 - - "+ 10 + 27 + 66 18100 0 6 -- - - - 13 - - + 20 + 74 +178 27600 - - - 6 :.. 11 - 22 - - + 33 +123 +292 35800 - - - 10 - 17 - 30 - - + 44 +165 +388 44600 - - ~ 12 - 23 _. 39
.f---. - - + 56 +215 +485 36000 - -- - 15 - 20 - 33 "- - + 49 +192 +405 27200 - - - 7 - 15 - 24 - - + 43 +160 +309 I 17000· - - - 5 - 6 - 13 - - .+ 27 +104 +183· :
8800 - - - 2 - 2 - 5 - - + 14 + 55 + 84 Zero - - 0 0 0 - M - 0 + 6 0 I
Run 114 ...
Zero - - o. 0 0 - - 0 0 0' 9000 - - - 2·· - ·2· -. 3 - . ~ +30 + 10 . + 73
18100 - - - 2- - 6 - 12 - - + 24 + 80 +182 27000 - - - 6 - 12 - 19 - - + 39 +129 +290 36600 - :- - 9 . . - 17 - 30 - - .+ 52 +182 . +401 45200 . - - - 11 - 24 - 38 - - + 63 +230 +497 36200 - - - 7 - 17 . - 28' - - + 60 +207 +416
. 27100 - - - 6 - 12 - 19 . - - + 48 +165 +309
-17700 - - o· - 4 - 10 - - + 36 -t:112 +195 9300 - - o. - 2 - 4 - : - + 24 + 61 + 93-
Zero - - + 2 0 0 - - + 10 + 5 +.4
I :
56

APPENDIX C
VERTICAL DEFLECTION DATA
57

TTl PROJECT 2294
PRECAST BOX CULVERT TEST DATA
DATE 29 July 82 TEST NO. 1 DATE 29 July 82 TEST NO. 2
LOAD LOCATION 7F2 LOAD LOCATION 7M1
TIME LOAD DEFLECTION, in. x 104 LOAD DEFLECTION, in. x 104 TIME
kips 2-7-11 2-7-43 1-7-73 kips 1-7-73 1-7-43 2-7-11
0930 0 - .4 1 - 6 1400 0 - 45 - 21 - 2 1025 0 0 0 0 20.0 175 88 1
4.0 37 17 0 20.0 193 95 0 8.0 65 32 8 1416 0 0 0 0
12.0 91 46 20 4.2 35 18 0
1035 16.0 115 60 33 8.0 70 34 - 1 20.8 148 78 48 12.0 109 44 - 1 16.7 127 65 37 16.0 150 73 - 1 10.6 92 45 19 1424 20 .• 8 198 97 - ., 1
8.1 77 37 12 16.0 159 78 - 3 4.1 49 22 3 12.0 121 60 - 4
1048 0 9 3 2 8.0 81 41 - 5
4.0 46 19 2 4.0 41 21 - 5 1055 8.0 73 33 11 1430 0 - 1 - 3 - 3
12.0 98 47 23 1435 0 - 2 - 2 - 4
17.2 128 53 38 4.1 38 21 - 1 20.8 154 77 48 8.0 77 41 0
16.1 126 62 35 12.0 116 59 0
1104 12.0 102 49 24 16.3 158 79 ·0
8·.1 79 36 13 1443 20.8 205 101 0
4.0 51 20 2 15.4 158 80 - 3
1109 0 11 2 1 12.0 125 65 - 3 8.0 86 45 - 4
4.0 45 25 4 I - ,
1449 0 3 2 - 1
58

TTl PROJECT 2294
PRECAST BOX CULVERT TEST DATA
DATE 17 August 82 TEST NO. 3 DATE 17 August 82 TEST NO. 4
LOAD LOCATION 5F2 LOAD LOCATION 5M1
TIME LOAD DEFLECTION, in. x 104 LOAD DEFLECTION, in. x 104
TIME kips 2-5-11 2-5-42 1-5-73 kips 1-5-73 1-5-42 2-5-11
0900 0 - 14 - 7 - 8 0 0 0 0
0 - 1 - 2 - 3 1110 4.3 16 5 0
0935 0 0 0 0 8.0 35 14 - 1
4.0 20 9 1 12.0 54 23 - 1
8.0 40 17 2 16.0 74 32 - 2 12.0 61 26 5 1115 20.8 101 45 - 2
0942 16.0 84 35 6 15.8 79 33 - 4
20.8 127 51 8 11. 7 61 24 - 3
16.0 97 40 7 8.1 44 15- - 2 ....
10.5 68 28 7 3.8 22 5 0
8.3 56 24 6 1122 0 2 - 5- - 1 4.7 38 16 6 4.2 20 2 - 2
0951 0 13 6 5 8.1 39 10 - 2
4.0 34 15 7 11.9 59 19 - 4 8.0 54 23 8 1134 16.0 77 28 - 4
12.0 75 31 9 20.8 100 40 - 5
16.0 97 41 10 15.6 80 30 - 6
20.8 125 53 12 6.7 36 8 - 4 1005 16.4 105 43 11 3.9 21 1 - 4
10.1 69 29 9 1141 0 1 - 9 - 4
6.4 51 22 9 4.5 23 2 - 4 3.7 38 16 9 8.1 39 6 - 5
1012 0 17 8 8 12.0 59 14 - 5
4.5 42 18 11 16.0 77 23 - 6
1018 8.0 60 25 12 1148 20.8 99 33 - 7 12.0 82 35 - 13 15.7 77 21 - 8
16.0 105 44 14 12.2 61 14 - 8 20.8 134 56 16 8.4 42 5 - 6 -16.0 112 46 16 3.7 18 - 6 - 5
1026 12.2 90 38 15 1154 0 - 1 - 14 - 5
8.5 71 29 14 4.3 47 19 12
1030 0 23 9 11
59

TTl PROJECT 2294
PRECAST BOX CULVERT TEST DATA
DATE 17 August 82 TEST NO. 5 DATE 18 August 82 TEST NO. SA -LOAD LOCATION 5M1 LOAD LOCATION 5M1
TIME LOAD DEFLECTION, in. x 104 LOAD DEFLECTION~ in. x 104
TIME kips 1-5-73 1-5-42 2-5-11 kips 1-5-73 1-5-42 2-5-11
1357 0 0 0 0 0835 0 0 0 0
9.1 45 21 1 9.0 54 27 2
18.1 91 44 0 18.0 112 54 0 27.1 170 75 - 1 27.0 170 80 0
37.0 257 112 - 3 0841 36.1 230 107 0
1405 45.1 337 147 - 4 45.1 290 138 - 1 8.0 Jack. ope
Decrease aator.Ac
Load t ~~~nta.L
b 8K ~0853 36.0 246 115 - 2
45.0 352 155 - 2 27.6 195 92 - 4 34.6 297 130 - 6 18.2 136 65 - 4
27.8 258 113 - 7 9.6 76 38 1
17.9 195 85 - 4 0858 0 15 8 3 1415 9.7 136 57 1 0905 0 11 8 5
0 71 25 2 9.0 65 34 4 1423 0 62 18 - 2 18.0 125 61 4
1427 9.0± Test Abo trted - C oud cau ed 27.2 184 88 3 Too Much Dr_i ff" i ~f"r::lin O::lf"::I 1428 0 62 18 - 4 36.0 241 115 4
9.2 114 43 - 5 0911 45.1 297 140 5 18.1 173 70 - 7 35.9 250 118 1
27.2 235 97 - 7 13.8 106 53 2 36.2 291 122 - 8 9.5 80 41 5
1434 45.2 351 149 - 8 0916 0 18 12 8
36.4 305 129 - 11 9.2 71 37 7
27.5 252 105 - 14 18.1 131 64 6 15.7 169 68 - 11 27,1 188 91 6
9.2 124 48 - 8 36.2 246 117 6
1441 0 62 20 - ·6 0922 45.1 302 142 7 [rest Sto ped Beca ~se 1/2" 36.0 255 121 4
Steel Be ring PIa Ite Warpe 26.8 200 96 4
18.5 146 72 2 0927 9.6 85 46 8
0 23 15 11
60 REB/26 Aug 82

TTl PROJECT 2294
PRECAST BOX CULVERT TEST DATA
DATE 18 August 82 TEST NO. 6 DATE 19 August 82 TEST NO. 7
LOAD LOCATION 5F2 LOAD LOCATION 7F2
TIME LOAD DEFLECTION, in. x 104
TIME LOAD DEFLECTION, in. x 104
kips 2-5-11 2-5-42 1-5-73 kips 2-7-11 2-7-43 1-7-73
1028 0 0 0 0 0925 0 0 0 0
9.3 57 22 - 1 9.1 84 39 2
18.2 109 43 0 18.0 145 72 29
27.2 164 64 3 27.1 208 106 58
36.2 245 95 7 36.1 292 150 91
40.3 307 112 9 0935 45.0 390 208 128
1041 45.1 . 364 130 10 0942 45.4 409 217 137
36.3 31,1 111 7 35.6 353 184 107
25.7 238 84 3 27.2 298 152 79
1051 16.9 174 60 1 18.1 231 118 49
9.7 120 40 - 2 7.9 14S 73 19
0 49 11 - 5 0952 0 66 30 11
1101 9.2 98 32 - 4 1020 0 72 30 14
18.2 164 56 - 1 9.0 158 71 24
1103 27.2 230 81 1 18.1 230 109 52
36.1 296 106 4 27.2 299 146 84
45.1 365 133 6 36.5 371 185 119
34.9 307 109 6 1032 45.4 451 227 148
1110 27.1 252 89 2 1040 45.2 465 229 153
18.7 188 66 0 36.8 413 201 127
8.8 114 39 - 4 27.3 349 167 93
1115 0 50 12 - 8 18.5 284 132 63
9.2 105 34 - 9 7.5 186 81 31'
18.0 170 59 - 6 1048 0 106 40 20
27.1 238 84 - 3 9.1 193 81 29
36.4 309 110 0 18.3 265 119 56
1121 45.2 373 134 3 27.2 337 157. 90
37.0 325 119 1 : 36.0 402 191 122 -1126 45.1 377 135 2 1058 45.6 476 230 157
35.4 317 112 1 1102 45.7 482 232 156
27.4 259 91 - 1 36.2 423 201 125
18.3 190 65 - 4 27.0 359 167 94
9.3 122 40 - 7 18.4 295 131 62
1132 0 53 13 - 10 8.6 214 87 29
1108 0 115 37 18
61

TTl PROJECT 2294
PRECAST BOX CULVERT TEST DATA
DATE 19 August 82 TEST NO. 8 DATE 19 August 82 TEST NO. 9
LOAD LOCATION 7M1 LOAD LOCATION 7M1
TIME LOAD DEFLECTION, in. x 104 LOAD DEFLECTION, in. x 104
TIME kips 1-7-73 1-7-43 2-7-11 kips 1-7-73 1-7-43
1313 0 0 0 0 1452 0 0 0 9.0 88 44 2 1453 9.3 106 53
18.0 177 88 1 1 H 1 21~ lOR 1317 27.4 283 142 1 17 <:; 1 ~::L 1';';
1325 27.4 291 152 - 1 36.8 451 218 35.3 417 229 - 6 6. <; 1 <;<;0 11Ft
1337 35.3 429 235 - 8 1459 50.0 641 298
45.5 617 317 -12 55.0 792 350 1349 45.5 628 324 -15 60.0 967 401
35.4 532 278 -19 1508 65.0 1212 491 27.9 449 240 -lg 71.0 141+2 546 17.7 328 1 Hl _lH 11510 71 0 1') 10 'iR1
8.8 219 127 -16 1356 0 101 65 - 9
9.0 192 10Q - Q Test Nc . 9 stOPl ed at 78 kiILs du to 18.1 301 163 -10 excess:· ve devia lion of ; a.ck from !vp.rtir;:tl
27.0 408 218 -10 1402 36.2 519 269 -11
45.0 632 321 -13 1410 45-.0 644 329 -14
34.1 535 278 -17 27.6 462 244 -18 17 .5 340 184 -18 8.2 216 123 -14
1416 0 110 69 - 9 1430 0 99 62 -ia
9.0 195 110 -12 18.3 311 167 -12 27.7 429 225 -13 36.3 535 275 -14
1439 45.3 645 324 -15 35.0 551 281 -19 26.2 449 234 -20 19.0 362 192 -19 8.8 226 125 -16
1443 o 110 68 - 9

TTl PROJECT 2294
PRECAST BOX CULVERT TEST DATA
DATE 20 August '82 TEST NO. 10 DATE 20 August '82 TEST NO. lQ
LOAD LOCATION 7M2 LOAD LOCATION 7M2
TIME LOAD DEFLECTION, in. x 104 LOAD DEFLECTION" in. x 104
TIME kips 2-7-73 2-7-43 kips 2-7-73 2-J.43
1007 0 0 0 27 2 421 ??.7
9.0 78 41 1 7 1 'U\1 , ~&:;
lR.2 158 R4 9.0 199 115 ?7 ':t ?hr; 1':t7 1101 0 Q7 60
36.1 397 207 o n 100 1nJ:;
1020 4 ')') . 573 1.01 18 1 2q7 159
1.1:\ ? . I,~' ?J:;O 27.0 404 215
26.0 383 210 36.6 517 271 18.7 300 168 1110· 45.2 614 320
9.9 193 115 36.2 536 282 1026 0 83 55 27.2 435 233 1030 0 78 51 17.7 322 176
9 1 164 qh 9 4 ?1 " 122
Loose c nnectioI1 noticed on 1116 0 108 65
strain n indica tor. 1033 . 0 82 54
1038 0 82 '54
9.4 172 98
18.5 274 149 1041 26:9 371 199
36.1 480 254
45.5 585 307 1043 35.8 506 269
25.6 393 212
18.3 309 169 9.1 194 III
1048 0 87 55
1051 0 89 56
8.7 172 qR
1 R 1 ?R() 1 C;?
27.5 392 210 1055 35.8 485 257
44.6 586 308
1058 44.6 596 312 36.0 518 273
63

APPENDIX D
MEASURED CONCRETE COVER
AT STRAIN GAGES
64

DATA
Strai n Gage Designation
1-5-73
1-7-73
2-5-11
2-7-11
2-7-73
MEASURED CONCRETE COVER
Measured Cover
1.387 in.
0.950 in.
2.240 in.
1.375 in.
1.600 in.
65
Design Cover
1.00 in.
1.00 in.
1.00 in.
1 .00 in.
1.00 in.

APPENDIX E
FIELD SKETCH OF OBSERVED
CRACK PATTERNS
66

i' 27 --
/ n -_. ____ --. ___ ~. -.-~- .... -- ----- . ----~ --'I;;:::;r~~~---- ------------ ---- -- ---------------- -- ------------- _
FIGt.D SKe.TC.H 0 O!3:::.E;.RV=-D c;et.;.:.<:. fJJ,rr££/v~ IIY 7C. JS/bN :5L/I(FnCB at==. 7 Fr 5MB - ;..?xJx:Fir 1. - TE5T 7M.l
67