behavior and design of high-strength prestressed … · behavior and design of high-strength...
TRANSCRIPT

September–October 2008 | PCI Journal54
Editor’s quick points
n This paper proposes provisions to extend the application of current American Association of State Highway and Transporta-tion Officials’ AASHTO LRFD Bridge Design Specifications to high-strength concrete (HSC) girders.
n The proposed design provisions are for predicting the ultimate flexural strength of prestressed concrete girders with concrete compressive strengths up to 18 ksi (124 MPa) to include com-posite action with normal-strength concrete (NSC) deck slabs.
n The experimental program investigated the failure modes of three different types of compression zones: one with NSC only, one with HSC only, and one with both NSC and HSC.
Behavior and design of high-strength prestressed concrete girdersWonchang Choi, Sami Rizkalla, Paul Zia, and Amir Mirmiran
Although a number of state departments of transportation have successfully used high-strength concrete (HSC) gird-ers as part of Federal Highway Administration (FHWA) demonstration projects, the current American Association of State Highway and Transportation Officials’ AASHTO LRFD Bridge Design Specifications1 are limited to ap-plications where concrete compressive strengths are 10 ksi (69 MPa) or less.
Concrete with compressive strengths greater than 10 ksi (69 MPa) is now available commercially as a result of im-provements in concrete admixtures and the quality control process in plants. Many researchers have shown that by us-ing HSC, engineers are able to design bridges with longer spans for a given girder cross section or reduce the number of girders by increasing the girder spacing. Adelman and Cousins2 showed that increasing the concrete design com-pressive strength from 6000 psi to 8000 psi (42 MPa to 55 MPa) resulted in an average 10% increase in span capa-bility for prestressed girders used in routine bridge design.
Due to these advantages, it is likely that the use of HSC in the design of prestressed girders will continue to increase. However, the uncertainty regarding the applicability of de-sign provisions causes reluctance on the part of designers to use HSC for highway bridge construction.3 Therefore, a need exists for reassessment of the material properties and the design provisions for the analysis of HSC girders. This need to expand the applicability of the AASHTO LRFD specifications to HSC has been addressed by a series of projects under the direction of the National Cooperative Highway Research Program (NCHRP). The goal of one of these projects, NCHRP project 12-64, was to expand the use of the AASHTO LRFD specifications to reinforced
54

55PCI Journal | September–October 2008
the girder designs required sixteen to twenty ½ in. (13 mm), grade 270 (1860 MPa), 7-wire strands. Each strand was tensioned to 75% of its ultimate strength, or 31 kip (138 kN). All strands were straight and fully bonded over their entire lengths. Figure 1 shows strand configura-tions for the three design concrete compressive strengths. After concrete was placed in the girders for each design concrete compressive strength, the concrete was moist-cured until it reached the required releasing strength. After release of the prestressing strands, the concrete girders were air-cured in the prestressing plant until they were delivered to the laboratory.
For each HSC test girder, fifteen 4 in. × 8 in. (100 mm × 200 mm) cylinders and nine 6 in. × 6 in. × 20 in. (150 mm × 150 mm × 500 mm) prisms were made for each casting to determine the HSC’s elastic modulus and modulus of rupture, respectively. The cylinder and prism specimens were cured with the test girders and under the same conditions.
After the girders were delivered to the laboratory, a 5-ft-wide (1.5 m) deck slab was cast on one of the three gird-ers, a 1-ft-wide (0.3 m) deck slab was cast on the second girder, and the third girder was left without a deck slab for each of the target concrete compressive strengths. Figure 1 shows the final cross sections for each specimen group.
A local ready-mix concrete producer supplied the concrete used to cast the 8-in.-thick (200 mm) deck slabs. The average 28-day compressive strengths of the concrete used for the 5-ft- and 1-ft-wide (1.5 m and 0.3 m) deck slabs were 4.1 ksi and 5.6 ksi (28 MPa and 38 MPa), respectively.
and prestressed concrete members with 18 ksi (124 MPa) compressive strength in flexure and compression.
As a part of NCHRP project 12-64, research was conducted to examine the validity of the current analytical methods used to determine the flexural behavior of typical AASHTO Type II prestressed HSC girders with and without a cast-in-place normal-strength concrete (NSC) deck. The ex-perimental program validated the stress block parameters currently used to determine the flexural resistance of flanged sections made with HSC. It also addressed the cases where the compression zone was composed of NSC deck and HSC girder in composite action. Test results were used to evaluate the AASHTO LRFD specifications’ equations to predict the elastic modulus and modulus of rupture for HSC.
Experimental program
Nine 40-ft-long (12 m) AASHTO Type II prestressed HSC girders were designed and tested to evaluate their flex-ural responses. They were tested under a static load using four-point bending. The concretes used for the girders were designed to achieve target compressive strengths of 10 ksi, 14 ksi, and 18 ksi (69 MPa, 97 MPa, and 124 MPa). Table 1 shows the mixture proportions of the concretes. All girders were designed based on the AASHTO LRFD specifications. However, several design details were modi-fied to prevent premature failure in shear or bond slippage prior to flexural failure. Shear reinforcement consisted of no. 4 (13M) stirrups at a spacing of 3 in. (75 mm) near the end blocks and 6 in. (150 mm) along the rest of the girder. More detailed information about the test girders can be found in Choi.4
Standard Concrete Products in Savannah, Ga., produced the girder specimens. The three concrete strengths used for
Table 1. Mixture properties for prestressed, AASHTO Type II high-strength concrete girders
Target compressive strength 10 ksi 14 ksi 18 ksi
Cement, lb/yd3 670.0 703.0 890.0
Fly ash, lb/yd3 150.0 192.0 180.0
Microsilica, lb/yd3 50.0 75.0 75.0
No. 67 granite, lb/yd3 1727.0 1700.0 1700.0
Sand (river), lb/yd3 1100.0 1098.0 917.0
Water, lb/yd3 280.0 250.0 265.0
Recover hydration stabilizer, oz/yd3 26.0 50.0 50.0
Water–reducing admixture, oz/yd3 98.0 125.0 135.0
Water–cementitious materials ratio 0.32 0.26 0.23
Source explanation for no. 67: American Society for Testing and Materials (ASTM). 2007. Standard Specification for Concrete Aggregate. ASTM C33-07. West Conshohocken, PA: ASTM.Note: 1 ksi = 6.895 MPa; 1 lb/yd3 = 0.5933 kg/m3; 1 oz/yd3 = 38.7 mL/m3.

September–October 2008 | PCI Journal56
Figure 1. These diagrams illustrate the strand configurations for 18 ksi, 14 ksi, and 10 ksi design concrete compressive strengths and the cross sections for an 18 ksi high-strength concrete girder with different deck-slab configurations. Note: HSC = high-strength concrete. 1 in. = 25.4 mm; 1 ft = 0.3048 m; 1 ksi = 6.895 MPa.
36 in.
8 in.
18 in.
6 in.
60 in.
36 in.
12 in.
18 in.
8 in.
6 in.
36 in.
12 in.
18 in.
6 in.
18 ksi concrete girder 14 ksi concrete girder 10 ksi concrete girder
18 ksi HSC girder with a 5-ft-wide deck slab
18 ksi HSC girder with a 1-ft-wide deck slab18 ksi HSC girder without a deck slab

57PCI Journal | September–October 2008
statistical analysis are presented in previous studies.4,8
Ec = 310,000K1wc2.5
fc' 0.33 (1)
where
K1 = correction factor to account for aggregate source
wc = density of concrete
fc' = specified design compressive strength of concrete
The correction factor K1 is typically assumed to be 1.0 unless determined by physical testing and as approved by the authority of jurisdiction. The results indicated that the AASHTO LRFD specifications overestimate the elastic modulus determined from HSC cylinder tests, while the proposed equation provides a closer prediction.
Figure 5 shows the average moduli of rupture fr obtained from the two control specimens for each of the nine girder specimens. Predictions of the modulus of rupture using the two expressions given by the AASHTO LRFD speci-fications are also plotted in the same figure. One of the AASHTO expressions is used for computing cracking mo-ment under service limit load combination (fr = 0.24 fc
' [in ksi]), while the other is used for determining minimum reinforcement (fr = 0.37 fc
' [in ksi]). Test results con-firmed that the current equations of the AASHTO LRFD specifications overestimated the modulus of rupture for HSC. Equation (2), which is from ACI 318-05, is therefore recommended to estimate the modulus of rupture for HSC up to 18 ksi (124 MPa):
fr = 0.19 fc' (in ksi) (2)
Five or six characters identify each girder specimen. The first two numbers represent the design concrete compres-sive strength of the girders, followed by the uppercase letters PS, which stands for prestressed concrete girder. The final one or two characters following the hyphen show the dimensions of the deck slab, using a number to represent the deck width, with either an uppercase letter S to represent slab or an uppercase letter N to represent no slab. For example, 10PS-5S represents a prestressed girder made with 10 ksi design concrete compressive strength and a 5-ft-wide (1.5 m) deck slab.
Load cells monitored the prestressing force in each girder from the start of fabrication to the time immediately before the transfer of prestress. The prestressing force was checked against the elongation of selected strands at the time of jacking. Prior to placing the concrete, two strain gauges were welded (using low voltage) to two strands at the bottom row of each girder to measure the strain changes in the prestressing strands due to elastic shorten-ing, prestress losses, and strains in prestressing strands during load tests. Figure 2 shows an installed strain gauge.
Figure 3 shows a schematic view of the test setup and a photo of the typical instrumentation layout. Potentiometers measured the deflections at midspan, loading points, and quarter points along the girder and at the supports. Load was applied in displacement control at a rate of 0.1 in./min (2.5 mm/min) in order to observe crack initia-tion in the girder. The loading rate was increased to 0.25 in./min (6.3 mm/min) after the prestressing strands yielded. Visual inspection and mapping of the cracks were per-formed throughout the tests. A high-speed data acquisition system was used to record data from the potentiometers and strain gauges. Tests were terminated after crushing of concrete occurred in the constant-moment region.
Material properties and early-age behavior
Table 2 lists the measured material properties of the concrete on the test day for each girder and deck slab. All tests for material properties conformed with ASTM speci-fications (ASTM C39,5 ASTM C469,6 and ASTM C787). Except for concrete used for girder 18PS-1S, all specimens achieved their design compressive strengths.
Table 2 also lists the average elastic moduli obtained from the three control cylinders for each of the nine prestressed AASHTO girders tested for this project. Figure 4 shows the predicted values using the AASHTO LRFD specifica-tions as well as the predictions according to Eq. (1) using 149 lb/ft3 (2387 kg/m3) as the measured density of the con-crete. Equation (1) is the proposed formula4,8 to determine the elastic modulus Ec for HSC with strengths ranging from 10 ksi to 18 ksi (69 MPa to 124MPa). It was obtained by a statistical analysis of over 4000 test results. Details of the
Figure 2. The photo shows an example of the strain gauges that were welded to two of the bottom strands in each girder to measure the strain changes in the prestressing strands due to elastic shortening, prestress losses, and strains in prestressing strands during load tests.

September–October 2008 | PCI Journal58
where
Ep = modulus of elasticity of strand
δ = strand end slippage
fpi = initial prestress of the strand just before detensioning
Transfer length
To determine the transfer lengths, the end slippages of six preselected strands were measured using a tape measure-ment before and after prestress transfer. Equation (3)9 was then used to determine the transfer lengths lt.
lt = 2E
fp
pi
δ (3)
Figure 3. Shown are a schematic view of the test setup and an instrumentation layout and a photo of the test setup for a girder with a 5-ft-wide deck slab. Note: CFL = Constructed Facilities Laboratory. 1 ft = 0.3048 m.

59PCI Journal | September–October 2008
Girder tests
Load-deflection response and failure mode
Figure 6 presents the load-deflection responses at the midspans of the three girders with 5-ft-wide (1.5 m) deck slabs. The figure shows that the initial flexural stiffnesses of all three composite girders were practically the same prior to cracking. Also, the flexural stiffnesses were not affected by the compressive strength of concrete because there were only small differences in the elastic moduli of the three different concretes. In addition, Fig. 6 shows the predicted load-deflection responses using a section analysis program, RESPONSE.10 The predicted responses agree with the measured responses for the flexural stiffness initially and at ultimate load, while the measured deflec-tion after yielding of prestressing strands is slightly less than the predicted deflection, possibly due to the variation of prestrain for input data. Figure 6 shows that the failure of test specimens occurred gradually due to crushing of concrete within the NSC deck slab.
Figure 7 shows the measured and predicted load- deflection responses of the three composite girders with 1-ft-wide (0.3 m) deck slabs. A similar behavior among the three girders was observed prior to the initiation of cracks. The measured responses reflected a small drop in load-
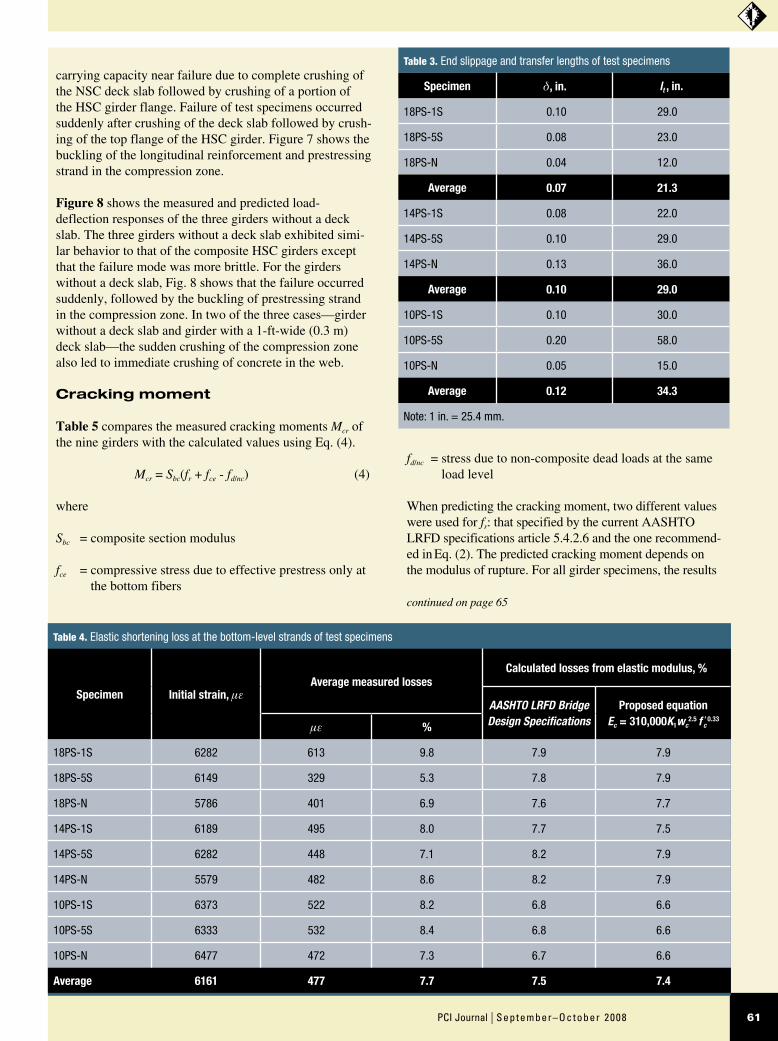
Table 3 lists the calculated transfer lengths of the girder specimens. The range of the measured transfer lengths varied from 21 in. to 34 in. (525 mm to 850 mm). Based on these data, it appears that the predicted value of 30 in. (750 mm) for ½-in.-diameter (13 mm) strand by AASHTO LRFD specifications section 5.11.4.1 is reasonable for concrete compressive strengths up to 18 ksi (124 MPa).
Elastic shortening
Table 4 compares the measured and calculated losses due to elastic shortening at the bottom level of prestressing strands. The calculated values were based on the AASHTO LRFD specifications Eq. (5.9.5.2.3a-1) with the elastic modulus specified by the current AASHTO LRFD specifi-cations, as well as the proposed Eq. (1).
The table indicates that the average loss due to elastic shortening at the bottom level of strands was 7.7%, which is close to the predicted values using the current AASHTO LRFD specifications as well as Eq. (1).
Table 2. Material properties of test specimens
Specimen Specimen type Age, days fc(test), ksi E, ksi fr , ksi
10PS-5SGirder 120 11.49 5360 0.768
Deck 29 3.78 2690 —
14PS-5SGirder 143 16.16 5560 0.711
Deck 43 5.34 3300 —
18PS-5SGirder 175 18.06 5970 0.872
Deck 67 3.99 2660 —
10PS-1SGirder 189 13.19 5630 0.820
Deck 77 5.04 2770 —
14PS-1SGirder 184 15.53 5440 0.751
Deck 70 5.04 2770 —
18PS-1SGirder 199 14.49 5150 0.680
Deck 84 5.04 2770 —
10PS-N Girder 222 11.81 5540 0.820
14PS-N Girder 228 15.66 5330 0.717
18PS-N Girder 232 18.11 6020 0.706
Note: 1 ksi = 6.895 MPa.

September–October 2008 | PCI Journal60
Figure 5. This graph plots the concrete compressive strength versus the modulus of rupture to compare the average moduli of rupture fr obtained from the two control specimens for each of the nine girder specimens with the predictions from the two expressions given by the American Association of State Highway and Transportation Officials’ AASHTO LRFD Bridge Design Specifications. Note: Equations are in English units.1 ksi = 6.895 MPa.
f'c
f r
f'c
f r,
fr = f'
fr = f'c
fr = f'c
Figure 4. This graph plots the concrete compressive strength versus the elastic modulus to compare the research results with the predicted values using the American
Association of State Highway and Transportation Officials’ AASHTO LRFD Bridge Design Specifications and the proposed equation Ec = 310,000K1wc 2.5 f 'c
0.33 .
Note: Equations are in English units. 1 kip-ft = 1.356 kN-m; 1 ksi = 6.895 MPa.
f'c
Ela
stic
mod
ulus
Ec,
ksi
Ec
E wc f'c
E c wc f'c
f'c
61PCI Journal | September–October 2008
carrying capacity near failure due to complete crushing of the NSC deck slab followed by crushing of a portion of the HSC girder flange. Failure of test specimens occurred suddenly after crushing of the deck slab followed by crush-ing of the top flange of the HSC girder. Figure 7 shows the buckling of the longitudinal reinforcement and prestressing strand in the compression zone.
Figure 8 shows the measured and predicted load- deflection responses of the three girders without a deck slab. The three girders without a deck slab exhibited simi-lar behavior to that of the composite HSC girders except that the failure mode was more brittle. For the girders without a deck slab, Fig. 8 shows that the failure occurred suddenly, followed by the buckling of prestressing strand in the compression zone. In two of the three cases—girder without a deck slab and girder with a 1-ft-wide (0.3 m) deck slab—the sudden crushing of the compression zone also led to immediate crushing of concrete in the web.
Cracking moment
Table 5 compares the measured cracking moments Mcr of the nine girders with the calculated values using Eq. (4).
Mcr = Sbc(fr + fce - fd/nc) (4)
where
Sbc = composite section modulus
fce = compressive stress due to effective prestress only at the bottom fibers
fd/nc = stress due to non-composite dead loads at the same load level
When predicting the cracking moment, two different values were used for fr: that specified by the current AASHTO LRFD specifications article 5.4.2.6 and the one recommend-ed in Eq. (2). The predicted cracking moment depends on the modulus of rupture. For all girder specimens, the results
continued on page 65
Table 3. End slippage and transfer lengths of test specimens
Specimen δ, in. lt , in.
18PS-1S 0.10 29.0
18PS-5S 0.08 23.0
18PS-N 0.04 12.0
Average 0.07 21.3
14PS-1S 0.08 22.0
14PS-5S 0.10 29.0
14PS-N 0.13 36.0
Average 0.10 29.0
10PS-1S 0.10 30.0
10PS-5S 0.20 58.0
10PS-N 0.05 15.0
Average 0.12 34.3
Note: 1 in. = 25.4 mm.
Table 4. Elastic shortening loss at the bottom-level strands of test specimens
Specimen Initial strain, µεAverage measured losses
Calculated losses from elastic modulus, %
AASHTO LRFD Bridge Design Specifications
Proposed equation Ec = 310,000K1wc
2.5 f 'c 0.33
µε %
18PS-1S 6282 613 9.8 7.9 7.9
18PS-5S 6149 329 5.3 7.8 7.9
18PS-N 5786 401 6.9 7.6 7.7
14PS-1S 6189 495 8.0 7.7 7.5
14PS-5S 6282 448 7.1 8.2 7.9
14PS-N 5579 482 8.6 8.2 7.9
10PS-1S 6373 522 8.2 6.8 6.6
10PS-5S 6333 532 8.4 6.8 6.6
10PS-N 6477 472 7.3 6.7 6.6
Average 6161 477 7.7 7.5 7.4

September–October 2008 | PCI Journal62
Figure 6. The graph plots the load-deflection responses, and the photo shows a typical failure mode of the three girders with 5-ft-wide deck slabs. Note: 1 ft = 0.3048 m.

63PCI Journal | September–October 2008
Figure 7. The graph plots the load-deflection responses, and the photo shows a typical failure mode for the three girders with 1-ft-wide deck slabs. Note: 1 ft = 0.3048 m.

September–October 2008 | PCI Journal64
Figure 8. The graph plots the load-deflection responses, and the photo shows a typical failure mode for the three girders without deck slabs.

65PCI Journal | September–October 2008
the short-term prestress losses occurring from the time of release to the time of testing and do not include the long-term prestress losses of the nine girder specimens.
Flexural strength
The flexural strengths of all girder specimens were calculated using three different approaches. In the first ap-proach, the AASHTO LRFD specifications Eq. (5.7.3.2.2-1) was used with the current values of α1 and 1 in the specification. In the second approach, Eq. (5) and (6) were used to determine α1 and 1 as the new recommended relationships.8,11,12
α1 =
0.85 for fc' 10 ksi
0.85 0.02 fc' 10( ) 0.75 for fc
' 10 ksi (5)
continued from page 61
in Table 5 indicate that the predicted cracking moment using the proposed modulus of rupture produced conservative results. The results suggest that the recommended Eq. (2) for the modulus of rupture is more appropriate to determine the cracking moment of prestressed HSC girders.
After initial cracking was observed, each test girder was unloaded. On the girder’s second loading, the moment that caused the crack to reopen was recorded. Based on these two moment measurements and the rupture modulus, the loss of prestress at the time of test was calculated.8 The calculated prestress loss varied from 7.3% to 13.9% for the nine test girders, with an average of 11%. This loss com-pares with an average of 15.1% based on AASHTO LRFD specifications and an average of 14.9% based on Eq. (2) for the rupture modulus.8 These loss values represent only
Table 5. Summary of measured and predicted cracking moments of test specimens
Specimen
Measured cracking moment
Predicted cracking moment
AASHTO LRFD Bridge Design Specifications Proposed equation Ec = 310,000K1wc2.5 f 'c
0.33
kip-ft kip-ftMeasured Predicted
kip-ftMeasured Predicted
10PS-5S 1097 1123 0.98 1061 1.03
14PS-5S 1267 1314 0.96 1244 1.02
18PS-5S 1377 1436 0.96 1373 1.00
10PS-1S 935 974 0.96 922 1.01
14PS-1S 1054 1084 0.97 1034 1.02
18PS-1S 1131 1183 0.96 1130 1.00
10PS-N 799 751 1.06 708 1.13
14PS-N 867 843 1.03 796 1.09
18PS-N 918 964 0.95 908 1.01
Note: 1 kip-ft = 1.356 kN-m.
Table 6. Flexural strength of girders with a 5-ft-wide deck
Specimen
Measured moment
Flexural strength
AASHTO LRFD Bridge Design Specifications
Proposed equation Ec = 310,000K1wc
2.5 f 'c 0.33 Strain compatibility
kip-ft kip-ftMeasured Predicted
kip-ftMeasured Predicted
kip-ftMeasured Predicted
10PS-5S 2123 1904 1.12 1904 1.12 1977 1.07
14PS-5S 2349 2181 1.08 2181 1.08 2246 1.05
18PS-5S 2543 2344 1.08 2344 1.08 2445 1.04
Note: 1 ft = 0.3048 m; 1 kip-ft = 1.356 kN-m.

September–October 2008 | PCI Journal66
LRFD specifications can be used to predict the flexural strength when the compression zone is within the NSC deck slab.
For the composite girders with the 1-ft-wide (0.3 m) deck slabs, the current AASHTO LRFD specifications do not provide clear recommendations on how to determine the flexural strength of a section when the compression zone includes two different concrete compressive strengths. Because the neutral axis was located below the deck, the compression zone required two different concrete stress-strain distributions. However, for simplicity, the stress distribution in the compression zone may be assumed conservatively using the stress-strain relationship of NSC. Therefore, the equivalent rectangular stress block can be determined with the recommended method.
The computed flexural strengths using the recommended method were about 12% to 14% less than the measured flexural resistance. These results in Table 7 indicated that this method can be used to safely determine the nomi-nal flexural strength Mn. The predicted nominal flexural strength based on the strain compatibility with the mea-sured material properties showed more accurate results within a ±1% difference of the measured flexural strength.
Table 8 gives the measured and predicted ultimate flexural strengths using the proposed α1 and 1 and the strain compatibility for the girders without a deck slab. This table
1 = 0.85 for fc
' 4 ksi
0.85 0.05 fc' 4( ) 0.65 for fc
' 4 ksi (6)
where
fc' is in ksi
α1 = stress-block parameter
1 = stress-block parameter
The third approach was based on strain compatibility, force equilibrium, and the actual stress-strain relationship of the concrete obtained from tests of control cylinders.
For the composite girders with the 5-ft-wide (1.5 m) deck slabs, the flexural strength depended on whether the neu-tral axis was located in the flange or in the girder. Because the neutral-axis depth c was located in the deck concrete, the composite girder behaved as a rectangular section. The stress-block parameters for computing the flexural strength of the composite HSC girders could be determined using the current AASHTO LRFD specifications. Table 6 shows the comparisons between the measured and predicted val-ues of flexural strength of the three girders with 5-ft-wide deck slabs using the three approaches mentioned previ-ously. The comparisons indicate that the current AASHTO
Table 7. Flexural strengths of girders with a 1-ft-wide deck
Specimen
Measured momentFlexural strength
Proposed equation Ec = 310,000K1wc2.5 f 'c
0.33 Strain compatibility
kip-ft kip-ftMeasured Predicted
kip-ftMeasured Predicted
10PS-1S 1752 1558 1.12 1735 1.01
14PS-1S 1941 1706 1.14 1928 1.01
18PS-1S 2083 1830 1.14 2107 0.99
Note: 1 ft = 0.3048 m; 1 kip-ft = 1.356 kN-m.
Table 8. Flexural strengths of girders without deck slab
Specimen
Measured momentFlexural strength
Proposed equation Ec = 310,000K1wc2.5 f 'c
0.33 Strain compatibility
kip-ft kip-ftMeasured Predicted
kip-ftMeasured Predicted
10PS-N 1465 1324 1.11 1433 1.02
14PS-N 1688 1519 1.11 1623 1.04
18PS-N 1808 1692 1.07 1813 1.00
Note: 1 kip-ft = 1.356 kN-m.

67PCI Journal | September–October 2008
References
1. American Association of State Highway and Trans-portation Officials (AASHTO). 2004. AASHTO LRFD Bridge Design Specifications. 3rd ed. Wash-ington, DC: AASHTO.
2. Adelman, D., and T. E. Cousins. 1990. Evaluation of the Use of High Strength Concrete Bridge Girders in Louisiana. PCI Journal, V. 35, No. 5 (September–October): pp. 70–78.
3. Roller, J. J., B. T. Martin, H. G. Russell, and R. N. Bruce. 1993. Performance of Prestressed High Strength Concrete Bridge Girders. PCI Journal, V. 38, No. 3 (May–June): pp. 34–45.
4. Choi, W. C. 2006. Flexural Behavior of Prestressed Girder with High Strength Concrete. PhD thesis. Department of Civil, Construction, and Environmen-tal Engineering, North Carolina State University, Raleigh, NC.
5. American Society for Testing and Materials (ASTM). 2005. Standard Test Method for Compressive Strength of Cylindrical Concrete Specimens. ASTM C39/C39M-05e1. West Conshohocken, PA: ASTM.
6. ASTM. 2002. Standard Test Method for Static Modu-lus of Elasticity and Poisson’s Ratio of Concrete in Compression. ASTM C469-02e1. West Conshohock-en, PA: ASTM.
7. ASTM. 2008. Standard Test Method for Flexural Strength of Concrete (Using Simple Beam with Third-Point Loading). ASTM C78-08. West Conshohocken, PA: ASTM.
8. Rizkalla, S., A. Mirmiran, P. Zia, H. Russell, and R. Mast. 2007. Application of the LRFD Bridge Design Specifications to High-Strength Structural Concrete: Flexure and Compression Provisions. NCHRP report 595. Washington, DC: Transportation Research Board, the National Academies.
9. Oh, B. H., and E. S. Kim. 2000. Realistic Evaluation of Transfer Lengths in Pretensioned Prestressed Con-crete Members. ACI Structural Journal, V. 97, No. 6 (November–December): pp. 821–830.
10. Bentz, E. C. 2000. Sectional Analysis of Reinforced Concrete Members. PhD thesis. Department of Civil Engineering, University of Toronto, Toronto, ON.
11. Mertol, H. C. 2006. Characteristics of High Strength Concrete for Combined Flexure and Axial Compres-sion Members. PhD thesis. Department of Civil,
indicates that it is satisfactory to use the proposed parame-ters α1 and 1 to predict the flexural strength of prestressed girders with concrete strengths up to 18 ksi (124 MPa).
Conclusion
The flexural behaviors of prestressed HSC girders with and without deck slabs were investigated, including the material properties and their early-age behaviors. Based on the ex-perimental results, the following conclusions were drawn:
The current AASHTO LRFD specifications equation •for the elastic modulus of concrete may overestimate measured values. Based on the results from this study, the recommended equation provides better agreement with the measured values for HSC girders with con-crete compressive strengths up to 18 ksi (124 MPa).
Based on the findings of this study, Eq. (2), which is •the ACI 318-05 calculation for the modulus of rupture, provides a better estimate of the cracking moment for prestressed HSC girders with concrete compressive strengths up to 18 ksi (124 MPa) than the equation provided by the AASHTO LRFD specifications.
The transfer-length equation of the AASHTO LRFD •specifications provides a reasonable estimate for prestressed HSC girders with concrete compressive strengths up to 18 ksi (124 MPa).
For a composite HSC girder with NSC deck slab, if •the compression zone occurs in both HSC and NSC, a conservative estimate of the nominal flexural strength can be determined based on the concrete compressive strength of the NSC deck with reasonable accuracy.
When the compression zone occurs only in HSC, the •nominal flexural strength can be determined using the AASHTO LRFD specifications with the recommended values of α1 and 1 for HSC girders with concrete compressive strengths up to 18 ksi (124 MPa).
Acknowledgments
The authors acknowledge the support of NCHRP project 12-64 and the senior program officer, David Beal. They are also grateful for the contributions of Henry Russell of Henry Russell Inc. and Robert Mast of Berger/ABAM Engineers Inc., both of whom served as consultants for the project. The cooperation of Standard Concrete Products in Savannah, Ga., and the personnel of the Constructed Facilities Laboratory are greatly appreciated. The authors are responsible exclusively for the findings and opinions expressed in this paper.
September–October 2008 | PCI Journal68
Construction, and Environmental Engineering, North Carolina State University, Raleigh, NC.
12. Mertol, H. C., S. Rizkalla, P. Zia, and A. Mirmiran. 2008. Characteristics of Compressive Stress Distri-bution in High-Strength Concrete. ACI Structural Journal (under review).
Notation
c = depth at neutral axis
Ec = modulus of elasticity of concrete
Ep = modulus of elasticity of strand
fc' = specified compressive strength of concrete
fce = compressive stress due to effective prestress only at the bottom fibers
fd/nc = stress due to non-composite dead loads at the same load level
fpi = initial prestress of the strand just before detensioning
fr = modulus of rupture
K1 = the correction factor to account for aggregate source
lt = transfer length
Mcr = cracking moment
Mn = nominal flexural strength
Sbc = composite section modulus
wc = density of concrete
α1 = stress-block parameter
1 = stress-block parameter
δ = strand end slippage

69PCI Journal | September–October 2008
About the authors
Wonchang Choi, PhD, is an adjunct assistant professor of Civil, Construction, and Environmental Engineering at North Carolina State University in Raleigh, N.C.
Sami Rizkalla, PhD, P.Eng., is a Distinguished Professor of Civil, Construction, and Environmental Engineering and director of the Constructed Facilities Labora-tory at North Carolina State University.
Paul Zia, PhD, P.E., FPCI, is a Distinguished University Profes-sor Emeritus at North Carolina State University.
Amir Mirmiran, PhD, P.E., is a professor and interim dean for the College of Engineering and Computing at Florida Interna-tional University in Miami, Fla.
Synopsis
This paper proposes provisions to extend the current American Association of State Highway and Trans-portation Officials’ AASHTO LRFD Bridge Design Specifications to include prediction of the ultimate flexural strength of prestressed concrete girders with concrete compressive strengths up to 18 ksi (124 MPa). The proposed design provisions include
composite action of a high-strength concrete (HSC) girder with normal-strength concrete (NSC) deck slab.
Nine 40-ft-long (12 m) AASHTO Type II HSC gird-ers were tested with and without cast-in-place NSC decks of differing widths to achieve various possible modes of failure. The concrete used for the girder was designed for three target compressive strengths of 10 ksi, 14 ksi, and 18 ksi (69 MPa, 97 MPa, and 124 MPa).
The experimental program investigated failure modes of three different types of compression zones: one with NSC only, one with HSC only, and one with both NSC and HSC. All girders were tested to failure under static loading to study the different limit-state behaviors, including prestress losses, initiation of cracking, yielding, and final failure mode.
Keywords
Bridge girder, cracking strength, elastic shortening, flexural strength, high-strength concrete, prestress loss, transfer length.
Review policy
This paper was reviewed in accordance with the Precast/Prestressed Concrete Institute’s peer-review process.
Reader comments
Please address any reader comments to PCI Journal editor-in-chief Emily Lorenz at [email protected] or Precast/Prestressed Concrete Institute, c/o PCI Journal, 209 W. Jackson Blvd., Suite 500, Chicago, IL 60606. J