beef research program - agricultural research service - us
TRANSCRIPT
.- -
Beef Research Program
Progress Report No. 1
Roman L. HruskaU.S. Meat Animal Research Center
In cooperation withUniversity of,Nebraska College of Agriculture
The Agricultural Experiment Station
Agricultural Reviews and ManualsAgricultural Research ServiceU.S. Department of Agriculture
ARM-NC-21
April 1982
-- - --

>,
Mention of a trade name, proprietary product, or specific equipment does not constitute a guaran-tee or warranty by the U.S. Department of Agriculture and does not imply its approval to the exclusion ofother products that may be suitable.
Published by Agricultural Research Service
North Central Region
U.S. Department of Agriculture
2000 W. Pioneer Parkway
Peoria, IL 61615
Library of Congress ISSN 0193-3787

CONTENTS
ROMANL. HRUSKAU.S. MEATANIMAL RESEARCHCENTER, Robert R. Oltjen iiiBREEDINGAND GENETICS
Sixteen years of selection for weaning weight, final weight, and muscling score in Herefordcattle: Robert M. Koch, Larry V. Cundiff, and Keith E. Gregory. . . . . . . . . . . . . . . . . . . . . . . . . . .. 1
Effects of heterosis in Hereford, Angus, and ShQrthorn rotational crosses: Larry V. Cundiff,Keith E. Gregory, and Robert M. Koch. . . . . . . . . . . . . . . . . . . . . . . . . . . . . . . . . . . . . . . . . . . . . . . .. 3
Heterosis and breed maternal and transmitted effects in beef cattle: Keith E. Gregory, Larry V.Cundiff,and RobertM. Koch. . . . . . . . . . . . . . . . . . . . . . . . . . . . . . . . . . . . . . . . . . . . . . . . . . . . . . . .. 6
Characterizationof breeds representing diverse biological types: preweaning traits: Keith E.Gregory, Larry V. Cundiff, and Robert M. Koch. . . . . . . . . . . . . . . . . . . . . . . . . . . . . . . . . . . . . . . .. 7
Characterization of breeds representing diverse biological types: postweaning growth andpuberty of females: Keith E. Gregory, Larry V. Cundiff, and Robert M.Koch . . . . . . . . . . . . . . . .. 9
Characterization of breeds representing diverse biological types: postweaning growth and feed~fficiency:Larry V. Cundiff, RobertM. Koch,and Keith E. Gregory. . . . . . . . . . . . . . . . . . . . . . . . . 11
Characterizationof breeds representing diverse biological types: carcass and meat traits ofsteers: RobertM. Koch,Larry V. Cundiff, and Keith E. Gregory. ... . .. . . . . ... .. . . ... . . . . .. .13
Genetic variation among and within herds of Angus and Hereford cattle: Larry V. Cundiff andKeith E. Gregory. . . . . . . . . . . . . . . . . . . . . . . . . . . . . . . . . . . . . . . . . . . . . . . . . . . . . . . . . . . . . . . . . . . 16
PHYSIOLOGYAND REPRODUCTION
Conception and embryonic development in the beef female: Ralph R. Maurer, Sherrill E.Echternkamp,and WilliamF. Pope.. ... . .. . . . .. . . .. .. .. . .. . ... . . . . .. . . . . .. . . . . . . .17
Blood flow to the uterus: Sherrill E. Echternkamp and Stephen P. Ford. . . . . . . . . . . . . . . . . . . . . . . 19Effect of pregnancy on disease resistance: Rita C. Manak. . . . . . . . . . . . . . . . . . . . . . . . . . . . . . . . . . 22Preliminary observations on the immune status of newborn normal and weak calf syndrome
calves: Rita C. Manakand WilliamG. Kvasnicka. . . . . . . . . . . . . . . . . . . . . . . . . . . . . . . . . . . . . . . . 23
Decreasing the postcalving anestrous period in suckled beef heifers: Sherrill E. Echternkamp . . . 24Testicular development and onset of puberty in beef bulls: Donald D. Lunstra . . . . . . . . . . . . . . . . . 26Sexualaggressivenessinbeefbulls:DonaldD.Lunstra . . . . . . 28Performance characteristics of feedlot bulls and steers implanted with Estradiol-17ft: Bruce D.
Schanbacherand Ronald L. Prior .. . . . . . . . . . . . . . . . . . . . . . . . . . . . . . . . . . . . . . . . . . . . . . . . . . . 29NUTRITION
Blood flow and nutrient uptake of the bovine uterus and fetus: Calvin L. Ferrell, Ronald L. Prior,RonaldK. Christenson,and Stephen P. Ford. . . . . . . . . . . . . . . . . . . . . . . . . . . . . . . . . . . . . . . . . . . 30
Effect of breed and postweaning rate of gain on onset of puberty and productive performance ofheifers: Calvin L. Ferrell. . . . . . . . . . . . . . . . . . . . . . . . . . . . . . . . . . . . . . . . . . . . . . . . . . . . . . . . . . . . . 31
Elfazepam and Synovex-S influences on growth and carcass characteristics of steers fed twodietary energy levels: Ronald L. Prior, John D. Crouse, and Virden L.Harrison. . . . . . . . . .'. . . . . 33
Energy utilization by mature cows: Calvin L. Ferrell and Thomas G. Jenkins . . . . . . . . . . . 34Lipid synthesis in the beef animal: Ronald L. Prior and Stephen B. Smith . . . . . . . . . . . . . . . . . . . . . 34
MEATSChemical composition of carcasses from Hereford, Limousin, and Simmental crossbred cattle
as related to growth and meat palatability: John D. Crouse and Michael E. Dikeman. . . . . . . . . . 36
Evaluation of traits in the USDA yield grade equation for predicting beef catcass cutability inbreed groups differing in growth and fattening characteristics: John D. Crouse. . . . . . . . . . . . . . 37
Estimation of retail product of carcass beef: John D. Crouse. . . . . . . . . . . . . . . . . . . . . . . . . . . . . . . :39
Relationship of selected beef carcass traits with meat palatabiltiy: John D. Crouse. . . . . . . . . . . . . 40AGRICULTURAL ENGINEERING
Methane and protein from beef cattle manure: Andrew G. Hashimoto, Yud-Ren Chen, VincentH. Varel,and Ronald L. Prior. . . . . . . . . . . . . . . . . . . . . . . . . . . . . . . . . . . . . . . . . . . . . . . . . . . . . . . . . 42
ANIMALHEALTHCooperative project on the weak calf syndrome: William G. Kvasnicka. . . . . . . . . . . . . . . . . . . . . . . 43
ii
ROMAN L. HRUSKAU.S. MEAT ANIMAL RESEARCH CENTER1
Overview on Center
The Roman L. Hruska U.S. Meat Animal Research Center(MARC) was authorized by Congress on June 16, 1964, therebycreating a single facility that provides an unusual opportunity formaking major contributions to the solution of problems facing theU.S. livestock industry. Development of the 35,000-acre facilitystarted in the spring of 1966 and is continuing at the present time.Phase I construction, consisting of an office-laboratory building forintensive investigations, was completed in January 1971. These fa-cilities provide a physical plant for 42 scientists and about 200 sup-port personnel. Phase II construction, consisting of the Meats Re-search Laboratory and Agricultural Engineering Building, was com-pleted in October 1977. It provides a physical plant for 25 scientistsand about 60 support personnel. Phase III construction will providefacilities for a comprehensive research program of producing, har-vesting, handling, storing, and using forages in livestock productionsystems. Approximately 35 additional scientists and 65 support per-sonnel will be required for this phase. Currently, one-third of thescientific staffing is completed.
Approximately one-half of the research program is devoted tobeef cattle, one-fourth to sheep, and one-fourth to swine. Currentresearch program objectives require breeding-age female popula-tions of approximately 7,000 cattle (20 breeds), 5,000 sheep (9breeds), and 500 swine litters (8 breeds) per year.
The research program at the Center is organizedon a multidisci-pline basis and is directed toward extending investigations into newareas not now being adequately studied to provide new technologyto increase quantities of palatable, wholesome, and nutritious beef.We are planning and conducting from the basic cellular level, ex-amining the very fundamental biology of life processes to the animallevel, and examining environmental and genetic influences on beefquantity, composition, and quality. The aim of the research programis to provide basic knowledge of the fundamental processesof biolo-gy as a basis for developing new technology with production andconsumer application.
The current program includ~s research in genetics and breed-ing, nutrition, reproduction, agricultural engineering, meats, produc-tion systems, and crop residue-forage utilization. The research pro-gram comp'lementsresearch conducted elsewhere by the U.S. De-partment of Agriculture (USDA) and is cooperativewith the NebraskaAgricultural Experiment Station and other Land Grant universityagri-cultural experiment stations throughout the country. The program isalso designed to complement existing domestic and internationalresearch programs in developing beef cattle production technology.
,Agricultural Research Service, U.S. Department of Agriculture, the University ofNebraska, and other cooperating Land Grant Universities.
iii

--
Overview on the Beef Cattle Research Program
MARC's beef cattle research program places the highest priorityon developingtechnologycapable of having an immediate and majorimpact on the beef cattle industrY.Although the program is largelyoriented towards fundamental research, emphasis is placed on thegeneration of technology that can be practically implemented bysmall farmers and commercial beef cattle producers alike within arelatively short time frame. Because of the uniqueness of the Cen-ter's resources, research is being conducted on a "conception toconsumption" basis with beef cattle.
Currently, we have 18 scientist "equivalents" conducting re-search in the beef cattle program at MARC. They are working in 19primary thrust areas and have 44 experiments under way. In addi-tion, they are coworkers on six major projects away from MARC.Also, MARC has an active predoctoral, postdoctoral, and visitingscientist program, which supports the beef cattle research program.
This report represents a cross section of our beef cattle re-search program at the present time. Since some of the projects fromwhich resultsare reportedare still in progress, the preliminary natureof some of the resultsmust be recognized. However, it is our opinionthat information useful to the industry should be provided at theearliestpossible time. Progress reports of this nature will be releasedperiodically to make current results available to the industry. Forconvenience,the research program is reviewed on a discipline basisin this reportwith problemareas listed under the disciplinary unit thatis taking the lead on research programs in each specific problemarea.
Robert R. Oltjen, DirectorRoman L. Hruska U.S. Meat
Animal Research Center
iv- -- -

SIXTEEN YEARS OF SELECTION FORWEANING WEIGHT,FINAL WEIGHT,AND MUSCLINGSCORE IN HEREFORD CATTLE
Robert M. Koch,' Larry V. Cundiff, and Keith E. Gregory
Introduction
Selection is the primary force forchanging av~rage genetic composition ofherds, breeds, or species. Individualchanges from one generation to the nextassociated with selection are usuallysmall. In time, however, the change canbe dramatic.
Selection is deciding which bulls andcows get to become parents and howmany offspring we allow them to have.Both the will of man and the will of natureare directive forces in selection. Rate ofprogress from selection is determined by(1) average selection differential of par-ents for all traits under selection, (2) heri-tability of traits, (3) genetic correlationsbetween traits, and (4) interval betweengenerations of parents.
Selection differential is the differencein performance of selected sires anddams compared with the average of theunselected group from which they came.
Heritability is the fraction of theobserved differences between animalscaused by average genetic differences.
Genetic correlation is the averagegenetic association between traits.
Interval between generations is the. average age of sires and dams whenoffspring are born (which in our herd was4.4 years).
Procedure
An experiment to study selectioneffects in beef cattle was started in 1960with the Hereford herd at the Fort Robin-son Beef Cattle Research Station, Craw-ford, Nebr. Foundation cows came from14 different herds and were the progenyof 130 different bulls. Forty-two sires wereused in the formative years. .
In 1960, about 325 cows were ran-domly divided into three lines. Weaningweight, standardized to 200 days and ad-justed for age of dam, was the selectioncriterion to pick replacement bulls andheifers in one line (WWL). Adjusted finalweight, at 424 days for bulls and 500 daysfor heifers, was the selection criterion in asecond line (FWL). In the third line, selec-tion was based on an index giving equalemphasis to adjusted final weight and amuscling score (IXL). Selected bulls andheifers born in 1960 produced the firstselected generation in 1963.
Each line was expanded and main-tained at about 150 cows and 6 sires for
. ,Robert M. Koch is a University of Nebras-ka-Lincoln research geneticist stationed atMARC.
any given year. Two or three bulls,selected on their respective criteria, wereretained in each line each year. Bulls wereused first as 2-year-olds and continued inservice for 2 or 3 years. Lines were main-tained at 150 cows by retaining 25 or morebred heifers per line and removing anequal number of cows. Cows were re-moved according to criteria in the follow-ing priority.
(1) Not pregnant when ex-amined at weaning time,
(2) Serious unsoundness,(3) Failure to raise a live calf,
and(4) Oldest age.
The cattle were transferred to MARCin 1971. A control line was established atthat time by breeding 225 of the remainingfoundation cows with semen stored fromfoundation bulls. This line serves as abase of comparison for selected and un-selected cattle.
Selection Applied
Selection differentials of replace-ment sires were calculated by expressingrecords as deviations from the average oftheir respective year line-sex group.
For example, the two sires selectedin the weaning weight line from the 1966calf crop had selection differentials asshown in Table 1.
In a typical year, there were 64 to 75bulls in a line-year group at weaning. Ofthese, 60 to 70 bulls completed post-weaning performance in sound condition.Two or three of these bulls were selectedon the basis of their weaning weight(WWL) or final weight (FWL). In the IXL,
the deviations for final weight and musclescore were combined in such a manner
that the bulls with the largest average de-viation (index) were selected. Meanselection differentials of selected sires areshown in Table 2.
Selection differentials in Table 2emphasize that primary selection for onetrait may lead to significant selection dif-ferentials in other traits because of naturalcorrelation between traits or chance.Selection differentials of all traits and theirnormal relationships were considered ininterpreting the amount of total selectionpracticed and response expected in eachtrait.
Selection of replacement heifers ineach line was similar to selection proce-dures for bulls. All remaining heifers wereexposed to bulls during the summerbreeding season. On the average, 90% ofthe heifers became pregnant, and selec-tion of replacements was restricted to the25 to 35 "best" pregnant heifers. Selec-tion differentials of the replacement heif-ers are shown in Table 2.
Sires and dams contribute equally tothe average genetic makeup of offspring.Comparative size of bull and heifer selec-tion differentials illustrates the oftenquoted phrase that "most of the selectionintensity must come from bull selection."In the case of weaning weight in WWL,80% of the total selection was due to bulls,and for final weight in FWL, 86% of theselection was due to bulls.
Total Selection And Response
The total mid-parent selection dif-ferentials (average of sires and dams),average performance for the years 1977
Avg 1966,Tra~ WWL, bulls
Table 1.-Selection differentials of sires in weaning weight line, 1966
RecordSelection
differentialsSelection
differentialsRecord
Birth wL nib _h n _00 __ n 77
Wean. wt _-'boo_ n_ 00 00 __ 465Yrlg. wth _-'bu__ ___ ___ __ 996Muscle score __ 00 u'n n __ 81
64518
108182
-135385
1
89541
103781
127641
o
Table 2.-Selection differentials of selected sires and dams 1
'From Buchanan, D.S. 1979. Selection for growth and muscle score inbeef cattle. Ph.D. Thesis. Univers~y of Nebraska, Lincoln.160p.
-- -- --
1
---
Birthweight Weaningweight Final weight MusclescoreSelection Sires Dams Sires Dams Sires Dams Sires Dams
Weaning wt 7.8 1.6 75 19 110 21 1.2 0.4Final wt h _00 6.6 1.5 57 12 140 19 1.6 0.4Index n _ 00 n 7.0 2.0 54 14 116 25 3.6 0.4
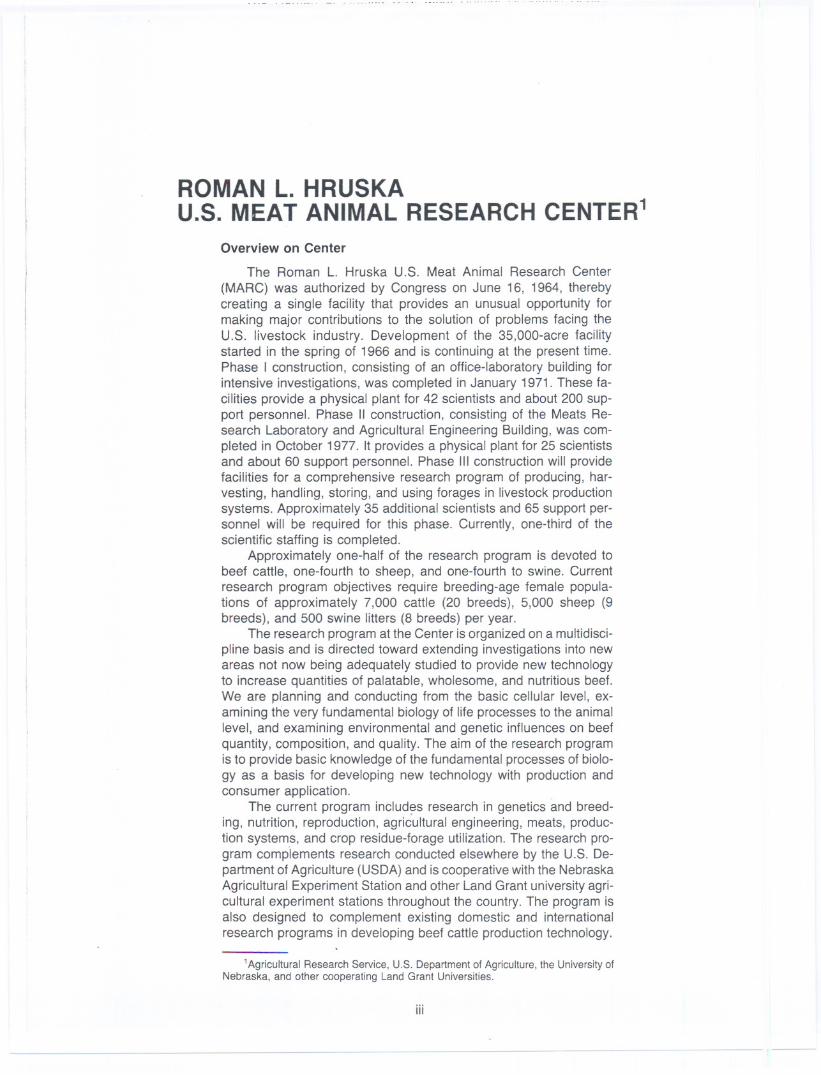
to 1979, selection response, and realizedheritability are shown in Table 3.
Total selection from 1963 to 1978 is
not as large as might be anticipated fromlooking at the selection in Table 2 be-cause many calves born in the years 1961to 1970 had foundation parents with zeroselection differentials.
Selection responses, calculated fromthe differences between the performanceof selected and control lines, show signifi-cant increases in all traits over the control.
Realized heritability represents thatfraction of parental selection differentialsdue to differences in average geneticmerit and recovered in terms of increased
(or decreased) performance of offspring.Realized heritabilities in Table 3 are theratios of selection responses to midparentselection differentials.
Birth weight increased in all lines be-cause of direct selection as a part ofweaning or final weight and from corre-lated response associated with gain frombirth to weaning or final ages. We esti-mate that the increase in birth weightcould be reduced by 30% if all growthselection was directed to gain after birthinstead of selecting for total weaning orfinal weight.
Selection response in weaningweight was highest in WWL and IXL.Although selection for weaning weight inIXL was significantly lower than in WWL,the response was about equal or higher,indicating a higher realized heritability.The slightly lower heritability for weaningweight in FWL could be due to chance orto unknown negative factors associatedwith the intense selection for postweaninggain.
The highest response in final weightwas in IXL even though more selectionwas applied in FWL.
The greatest response in musclescore was in IXL, which also had thelargest selection differential.
Correlated Response To Selection
As birth weight increased in selectedlines, percentage of first-calf heifers re-quiring assistance at calving increased.Average birth weights and percentages ofassisted births for males and females are
shown in Table 4. A significantly higherpercentage of heifers in the selected linesrequired assistance compared to the con-trol line. Also, more heifers producingmale calves required assistance thanheifers producing female calves. All of theincreased assistance among male calvescould not be accounted for by higher birthweights. Possibly the extra difficulty is dueto shapeor bone structure.
Efficiency of gain is largely deter-mined by differences in composition ofgain produced, differences in weight
2
--
Table 3.- Total midparent selection, average performance, selectionresponse,and realized heritability
maintained, and number of days weight ismaintained. Average daily gain of bullsduring the postweaning gain test, and theefficiency of gain, expressed as pounds ofgain per megacalorie of metabolizableenergy consumed for the years 1972through 1978, are shown in Table 4. Theevaluation was made over a weight con-stant interval that averaged 500 to 900 lb.Selected line bulls gained more rapidlyand had better efficiency of gain than thecontrol line bulls. Average feed consump-tion per day did not differ significantlyamong control and selection line bulls.
No measurements of composition ofgain were obtained. However, data fromsteers produced in 1963 to 1970 indicatedthat genetic increase in rate of gain is
associated with slight increases in leanand decreases in fat percentages at equalweights. The more rapid gains of theselection lines meant that they took 10 to15 days less to gain the 400 Ib and, thus,had fewer days of weight maintenance.
The evidence from this experimentindicates selection is effective in makingslow (1/2 to % percent per year) but steadychanges in growth traits. Growth mea-sured at birth and during the postweaningperiod was more highly heritable thangrowth from birth to weaning. Growth inone period was positively geneticallycorrelated with growth in other periods.The genetic increase in growth rate wasassociatedwith increased calving difficul-ty and with increased efficiency of gain.
Table 4.-Calving assistance in 2-year-olds, postweaning daily gain, andefficiency of gain through a weight constant interval (400-900 Ib)
---
Midparent Averageselection performance Selection Realized
Traitand line' differential 1977to 1979 response heritability
Birth weight, Ib:Control _ __ _ n n _ _ _ n n a 76.6 0 0WWL _ u u _ _ u _ _ _ _ _ _ _ _ 16.2 83.7 7.1 .44
FWL_ _ _ _ _ n _ n _ _ _ _ _ _ _ _ 14.7 82.7 6.2 .42IXL___________________ 14.5 85.9 9.3 .64
Weaning weight, Ib:Control u u _ u u _ n n _ 0 397.8 0WWL_u_ U_ U h_ n n_ 163 430.0 32.2 .20FWL__ U _ U _ U _ _ _ _ _ _ _ _ 116 418.2 20.5 .18IXL___________________ 116 431.2 33.6 .29
Final weight, Ib:Control _ _ U U U U _ U U 0 836.9 0WWL_________________ 220 902.8 65.9 .30FWL _ __ _ _ n ___ _ U _ __ 270 910.7 73.9 .27IXL___________________ 245 934.0 97.2 .40
Muscle score:Control _ n _ n _ _ U __ __ _ 0 80.9 0WWL_________________ 2.6 81.4 .5 .19FWL__ U _ U U U U _ __ U 3.5 81.3 .4 .11IXL___________________ 6.7 82.1 1.2 .18
'WWL= weaningweightline;FWL= finalweightline;IXL= indexline.
Calving assistanceMales remales Postweaning'gain test
Gain perBirth Percent Birth Percent Daily Meal Days
Line' wt assisted wt assisted gain ME fed(Ib) (Ib) (Ib)
Control _ __ U U _ n _ 71 50 66 19 2.24 0.113 176WWL ___________U 78 58 73 38 2.40 0.119 165FWLu U__n __ n_ 78 64 72 43 2.43 0.122 163IXL_______________ 82 77 75 39 2.47 0.121 161
'WWL= weaningweightline;FWL= finalweightline;IXL= indexline.

EFFECTS OF HETEROSIS IN HEREFORD, ANGUS, AND SHORTHORN ROTATIONALCROSSES
Larry V. Cundiff,1 Keith E. Gregory, and Robert M. Koch
Introduction
Seedstock breeders of poultry and ofmany plants; such as corn, may use staticsystems of mating that produce sufficienthybrids for complete use of heterosis incommerical production. Use of heterosisin these species can be maximized be-cause only a small proportion of the totalpopulation is required for seedstock pro-duction. Complete use of heterosis ismore difficult in cattle because of theirrelatively low reproductive rate and longgeneration interval, which overlaps fromone year to the next. However, this diffi-culty does not preclude the use of a highlevel of heterosis in commercial beef pro-duction. Systems of crossbreeding can beused that maintain significant levels ofheterosis from one generation to the next.Crossbreeding systems can also providefor use of additive genetic variation be-tween breeds to combine and match char-acteristics of breeds with feed and otherproduction resources and with market re-quirements.
Effects Of Heterosis
An extensive crossbreeding experi-ment involving Herefords, Angus, andShorthorns was initiated at the FortRobinson, Nebr., Beef Cattle ResearchStation in 1957. In 1972, the project wastransferred to MARC, where the evalua-tion of heterosis through advanced gen-erations of systematic crossbreeding wascompleted in 1976. Heterosis has beenevaluated by comparing crossbreds withstraightbreds for a comprehensive seriesof traits of economic importance in beefproduction. We conducted the experi-ment in three phases. .
In phase I, when 476 crossbredcalves were compared with 447 straight-bred calves, weaning weight per cow ex-posed was 8.5% or 29 Ib greater forstraightbred cows raising F1 crossbredcalves than for straightbred cows raisingstraighbred calves. This advantage wascaused by a 3% increase in calf cropweaned, resulting from increased survivalof crossbred calves from birth to weaning,and by a 4.6%, or 19 Ib/calf, increase inweaning weight of crossbred calves.
In phase II, crossbred cows werecompared with straightbred cows whenthey were both raising crossbred calvesby the same sires of a different breed. Forexample, to evaluate maternal heterosisin ~ereford-Angus crosses, we compared
'Larry V. Cundiff is a research leader(Breeding and Genetics) at MARC.
performance of Hereford-Angus andAngus-Hereford cows with that of Here-ford and Angus cows when the cows in allfour groups were mated to the sameShorthorn bulls. In phase II, a total of 687matings of crossbred cows and 560 mat-ings of straightbred cows were made oversix breeding seasons. Actual weaningweight was 14.8%or 51 Ibgreater per cowexposed to breeding for crossbred cowsthan for straightbred cows. This advan-tage was caused by a 6.5% increase incalf crop weaned, reflecting greater first-service conception and final pregnancyrates of crossbred cows, and by a 4.3%,or 19 Ib/calf, increase in weaning weight,reflecting greater and more persistentmilk production by crossbred cows.
" When the advantages of individualheterosis on survival and growth of F1crossbred calves (phase I) and the advan-tage of maternal heterosis on reproduc-tion and maternal ability of crossbredcows (phase II) are combined, weight ofcalf weaned per cow exposed to breedingis increased 23%, or about 80 Ib (Fig. 1).More than 60% of the increased perform-ance from heterosis was attributable tocrossbred cows.
Evaluation Of Rotational Crossing
Rotational systems of crossbreedinghave been used in commercial swine pro-duction for a number of years. The sys-tems most commonly being used in com-
Percent24
22
20
10
8
6
4
2
o
stroightbredcows
stroightbredcolvin
Figure 1.-Cumulative heterosiseffects for pounds of calf weanedper cow exposed to breeding.
mercial beef production are diagrammedin Figure 2.
The two-breed rotation is initiated bymating cows of breed A to bulls of breedB. Heifers resulting from these matingsare, in turn, mated to bulls of breed A fortheir entire lifetime. In the next generation,
ROTATIONALCROSSBREEDINGPROGRA/1S
INCREASElBS CALF
PER COW15%
3 - BREED
~
DO~ j8
INCREASElBS CALF
PER COW 19%
- ---
Figure 2.
3
heifers sired by breed A are mated to bullsof breed B, generation after generation.Thus, at least two breeding pastures arerequired for this system, and it is neces-sary to identify heifers by breed of theirsire.
In the three-breed rotation, the pat-tern is the same except that a third breedis included in the rotation. In a three-breedrotation, at least three breeding pasturesare required, and it is necessary to identifyheifers according to the breed of their sire.
Rotational systems maintain a sub-stantial level of heterozygosity from onegeneration to the next. On the average, inthe two-breed rotation, two-thirds of thegenes of the cow are of the breed of hersire, and one-third is of the breed of hergrandsire, the latter being the same as thebreed to which the cow is mated. Thus,the level of heterosis expected from a two-breed rotation is on the average two-thirds, or 67%, of the maximum level ex-pected when an F1 cow is mated to siresof a third breed. The three-breed rotationsustains a higher level of heterosis be-cause the relationship between cows andbulls being mated is more remote. Thethree-breed rotation sustains an averagelevel of 86% of the maximum heterozy-gosity realized in three-breed crosscalves out of FI cows.
Phase III of the Fort Robinson heter-
osis experiment was designed to deter-mine the level of heterosis that can bemaintained from one generation to thenext by two- and three-breed rotationsamong the Hereford, Angus, and Short-horn breeds and to determine whether ornot the level of individual and maternalheterosis maintained by rotational cros-sing is proportional to expected levels ofheterozygosity relative to FI crosses forboth individual and maternal traits. PhaseIII of the study was conducted at MARC,following transfer of cattle from the FortRobinson beef cattle research station toClay Center in 1972.
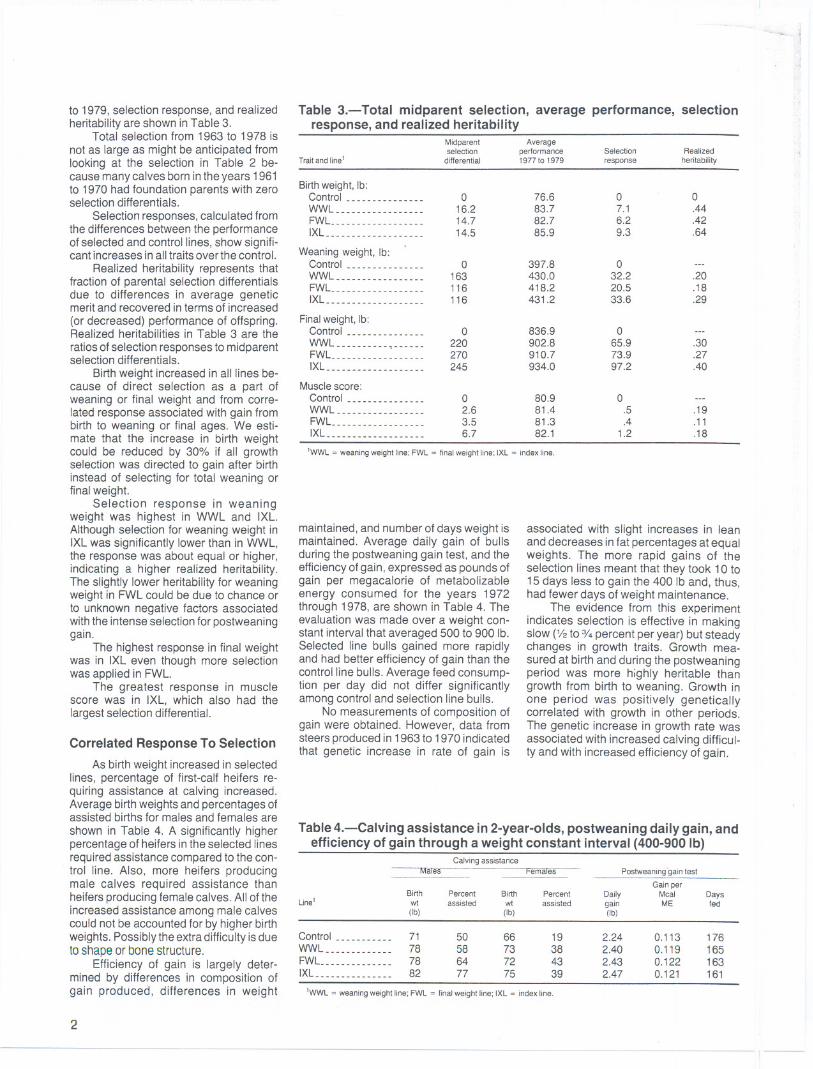
The mating plan and the number ofmatings made in phase III of the experi-ment are shown in Table 1. The phase IIcows, consisting of straightbred Hereford,Angus, and Shorthorn, and all possiblereciprocal FI crosses, were used to pro-duce the first generation of phase III.Straightbred calves were produced toprovide a basis for comparison for thetwo- and three-breed rotation systems.The FI reciprocal-cross cows were matedto produce either backcross calves (to setup the two-breed rotations) or three-waycross calves (to set up the three-breedrotations). Four calf crops were producedin generation 1 of phase III, with the finalcalf crop produced in 1972.
Heifers produced in generation 1 ofphase III were kept to evaluate heterosismaintained in two-breed and three-breed
4-- ----
rotations relative to straightbreds. Mat-ings were made such that contemporarycomparisons between controls consistingof straighbred Herefords, Angus, andShorthorns could be made with all possi-ble two-breed rotations and the three-breed rotation in all possible sequenceswhen all matings were made with thesame purebred sires. Five calf crops wereproduced. The final calf crop was pro-duced in the spring of 1975.
The expected genetic differences be-tween two- and three-breed rotation cros-ses and straightbred controls in the firstand second generation of phase III aresummarized in Table 2. Backcross calvesare expected to express only one-half ofthe individual heterozygosity of an FI calf(estimated from phase I to be 8.5% forweaning weight per cow exposed tobreeding) and all of the maternal heter-osis (estimated from phase II to be 14.8%)for a total increase of 19% more weaningweight per cow exposed than with
straightbreds. These expectations resultfor backcross calves because one-half ofthe dam's inheritance (chromosomes) isof the same breed as the sire of the calfand because the dam is an FI cow. Thethree-way cross produced to set up thethree-breed rotation expresses maximumindividual and maternal heterosis (23%).In the second generation of phase III, two-breed rotation calves were expected toexpress 75% of the individual heterosis ofan FI calf (8.5% in phase I) and, beingraised by a backcross, 50% of the mater-nal heterosis (14% in phase II). In thesecond generation of phase III, three-breed rotation calves were expected toexpress 75% of the individual heterosisand 100% of the maternal heterosis.These expectations are based on thehypothesis that heterosis retention isproportional to level of heterozygosity re-tained and is due to the dominance effectsof genes. Actual observed results couldfall short of the expectations if epistatis or
--
Table 1.-Experimental design and number of matings in phase III'ofheterosis experiment with Herefords, Angus and Shorthorns 1
Generation 1 Generation2(4calfcrops.1969-1972) (5calfcrops.1971-75)
NumberofSire Dam matings Dam H A S Total
StraightbredcontrolsH H 131 H 94 94A A 137 A 153 153S S 163 S 164 164
431 411
2-breed rotation
H HA 42 H.HA 34 34H AH 34 H.AH 26 26A HA 41 A.HA 52 52A AH 34 A.AH 42 42
151 154- --H HS 24 H.HS 35 35H SH 39 H.SH 29 29S HS 23 S.HS 17 17S SH 39 S.SH 33 33
125 114-A AS 26 A.AS 36 36A SA 40 A.SA 55 55S AS 26 S.AS 16 16S SA 42 S.SA 43 43
134 150-
All 2-breed 410 418
3-breed rotationH AS 25 H.AS 21 20 41H SA 44 H.SA 21 27 48A HS 25 A.HS 15 15 30A SH 39 A.SH 38 32 70S HA 42 S.HA 26 26 52S AH 35 S.AH 11 13 24- -
All 3-breed 210 265- -
'H= Hereford. A = Angus. S = Shorthorn

effects from many combinations of genesare important in causing heterosis.
Results from preliminary analyses onpercentage of calf crop weaned, weaningweight, and weight of calf weaned per cowexposed for the first generation of phaseIII are shown in Table 3. Calf crop was 8%greater for three-way crosses out of F,dams than for straightbreds, which com-pares closely to the expected 9.4%advantage resulting from combiningeffects of individual heterosis (3%) foundin phase I and maternal heterosis (6.4%)found in phase II. The 25% advantage inweight of calf weaned per cow exposed isclose to the cumulative advantage of 23%expected when comparing three-waycrosses out of F, cows with straightbreds.
Backcross calves are expected toshow half of the heterosis expressed byF, calves for individual heterosis (phase I)and all ofthe maternal heterosis (phase II)since they are out of F, dams. Resultsshown in Table 3 are close to expecta-tions for all three traits and are especiallyclose for weight of calf weaned per cowexposed.
Table 3 shows preliminary results forpercentage of calf crop weaned, weaningweight, and weaning weight per cow ex-posed from the second and final genera-tion of phase III. Results exceed expecta-tions slightly in both two- and three-breedrotations for all three traits. In the secondgeneration, although the performance oftwo- and three-breed rotations are bothhigher than expected relative to straight-breds, the difference between the two-breed versus the three-breed rotationdoes indicate that the loss in heterosis islinearly associated with the loss in hetero-zygosity (for example, in the second gen-eration, the expected difference and theobserved deviation from straighbreds ishalf again larger for the three-breed rota-tion than for the two-breed rotation).
Table 2.-Expected difference between 2- or 3-breed rotation crossesand straightbredcontrols infirstand secondgenerationof phase'" inheterosis experiment 1 2
Contrast H'
Increaseinweaningweightper cow exposed
First generation:Backcross vs. St-Bred ______ _____V2
3-way cross vs. St-bred __ ___u ___1
Second generation:2-Breed rotation VS. St-bred_ ______%
3-Breed rotation VS. St-bred_ _____ _%
Percent19.023.3
1H; = individual heterosis. Hm= maternalheterosis.2Basedon expection that H' = 8.5 percent. Hm= '4.84 percent.
V.1
13.821.2
Conclusions
Results with Herefords, Angus, andShorthorns indicate that heterosis can in-crease pounds of calf weaned per cow inthe breeding herd by 23%. More than halfof this advantage depends on use ofcrossbred cows. Compared to straight-breeding, rotational systems of cross-breeding sustain high levels of heterosisfrom one generation to the next. Greaterheterosis is maintained by a three-breedrotation than by a two-breed rotation. Theincrease in heterosis observed for thethree-breed rotation compared to the two-breed rotation is proportional to differ-ences in expected heterozygosity relativeto F, crosses.
Table 3.-Effects of heterosisin rotationalsystemsof crossbreeding
Item
Mating type:Cow _____u u_ ____u _______________uCalf _ _ _ _ _ u u _ _ _ u u _ _ _ _ _ u _ u __ __ _ u
No. matings _ _ _ _ u __ __ u u _ u _ _ _ _ _ _ u _ __
Calvesweaned _ __ _ _ _ u u u __ _ _% _ u u _ _
200-day WI __ _ _ u u _ on _ on __ _.Ib _ _ u u _
Weaning wt/cow exposed:Weight.. __ __ on __ _ _ on u __ _.Ib __ on __
Difference __ _ u __ _ u u u _ __ _.Ib u _ u __
Observed ratio _ _ :_ _ _ _ _ _ _ _ _ _ _ _ _ _ _ _ _ _ _ _ _
Expected ratio __u ______u u u ________Mating type:
Cow _ _ uu __ u _ __ _ _ u _ u _ __ _ _ _ _ u _ ___
Calf _ __ _ _ _ u _ _ _ _ _ _ _ _ _ _ u _ _ _ _ _ _ _ _ u u _
No. of matings _ _ u __ _ _ _ u _ u __ __ u _ u ___
Calvesweaned __ _ _ u _ u __ _ __ _ _% u __ _ _ _
205-day WI __ _ _ u __ on on __ __ __Ib u u ___
Weaning wt/cow exposed:205-day wt/cow u _ _ u u u __ ulb u u ___
Difference___ __ _ u u __ __ __u.lb u __ ___
Observed ratio _ _ _ _ _ _ _ _ _ _ _ _ _ _ _ _ _ _ _ _ _ _ _ _
Expected ratio __ u _ __ _ _ _ u u u u _ _ u __
RotationalSystemsControl 2-Breed 3-Breed
FIRST GENERATION
St-bred F1 cross F1 crossSt-bred Backcross 3-way cross
431 410 21075 79 83
433 477 488
324 378 4050 54 81
100 119 125100 110 123
SECONDGENERATION
St-bred 1st Backcross 3-way crossSt-bred 2nd Backcross 1st Backcross
367 388 23969 78 84
417 454 463
284 353 3840 69 100
100 124 135100 114 212
5

HETEROSIS AND BREED MATERNAL AND TRANSMITTED EFFECTS IN BEEF CATTLEKeith E. Gregory,1 Larry V. Cundiff, and Robert M. Koch
Introduction growth rate were expressed on averagedaily gain from 200 to 400 days. Cross-breds were 15 Ib heavier and 9.4 daysyounger than straightbreds when pubertywas observed.
Reciprocal cross differences aver-aged 74, 69, and 611b for 200-,400-, and550-day weight, respectively, in favor offemales with Red Poll and Brown Swissdams in crosses with Hereford andAngus. Breed maternal effects showedBrown Swiss and Red Poll breeds gener-ally superior to Hereford and Angusbreeds in most traits evaluated.
The Brown Swiss breed showed sig-nificantly higher breed transmit~ed effectsthan the other breeds for growth traits.Red Poll, Hereford, and Angus breeds didnot differ greatly from each other in breedtransmitted effects for growth traits; differ-ences generally favored the Angus breed.Breed transmitted effects for weight atpuberty showed the Red Poll breedreaching puberty at significantly lighterweight than the three other breeds.
The Brown Swiss breed in crosseswas significantly heavier at 200, 400, and550 days than crosses of the three otherbreeds, and the Red Poll, Hereford, andAngus breeds in crosses did not differsignificantly from each other in 550-dayweight. The Red Poll, Hereford, andAngus breeds in crosses did not differ inweight at puberty, but the Red Poll andAngus breeds reached puberty at signifi-cantly younger ages than the Herefordbreed in crosses. The Brown Swiss breedin crosses reached puberty at a signifi-cantly younger age than the three otherbreeds, and it was significantly heavierthan the Hereford and Red Poll breeds incrosses when puberty was observed.
Heterosis has been shown to haveimportant effects on most economic traitsof beef cattle. This is a report of the resultsfrom the first phase of an experiment de-signed to evaluate heterosis and breedmaternal and transmitted effects on eco-nomic traits of beef cattle and involvessome combinations of breeds not pre-viously included in crossbreeding experi-ments. Results are reported on pre-weaning traits, growth rate and puberty infemales, growth traits in steers, and car-cass traits of steers produced in an ex-perimental design that included thestraightbreds and all possible crosses ofthe Red Poll, Brown Swiss (European anddomestic), Hereford, and Angus breeds.
Preweaning Traits
Preweaning traits were analyzed on1,207 calves born and 1,151 calvesweaned. Effects of heterosis were signifi-cant for birth weight, calf crop weaned,preweaned average daily gain, and 200-day weight. Cows producing crossbredcalves weaned 7.4% more weight per cowcalving than cows producing straightbredcalves. The four breeds did not differ inbreed mean heterosis for the traits analy-zed. Calves with Red Poll and BrownSwiss dams averaged 5 Ib heavier at birthand 77 Ib heavier at 200 days than theirreciprocal crosses with Hereford andAngus dams. Breed maternal effects fa-vored the Brown Swiss and Red Pollbreeds over the Hereford and Angusbreeds for traits associated with growthrate.
Breed transmitted effects showedthe four breeds ranking in order (high tolow) of Brown Swiss, Angus, Hereford,and Red Poll for traits associated withgrowth rate. The four breeds in crossesranked in order (high to low) of BrownSwiss, Red Poll, Angus, and Hereford fortraits associated with growth rate. Thefour breeds in crosses did not differ signifi-cantly from each other in perinatal mortal-ity and calf crop weaned.
Growth Rate And Puberty InFemales
Postweaning growth rate and puber-ty data were analyzed on 536 females.Effects of heterosis on growth rate wereexpressed on average daily gain from 200to 400 days, 400-day weight, and 550-dayweight. Most of the effects of heterosis on
1 Keith E. Gregory is a research geneticistat MARC.
6
Postweaning Growth TraitsOf Steers
Data on growth traits were analyzedon 584 steers. Effects of heterosis weresignificant for weight at 200,312, and 424days. Effects of heterosis on average dai-ly gain decreased with increasing age;most of the heterosis observed on growthrate was expressed on preweaning aver-age daily gain. Breed mean heterosis forgrowth traits of steers was highest in theBrown Swiss and Red Poll breeds andlowest in the Hereford breed.
Average reciprocal effect on weightin favor of steers with Red Poll and BrownSwiss dams was 78, 82, and 85 Ib at 200,312, and 424 days, respectively. TheBrown Swiss and Red Poll breeds weresuperior in breed maternal effects to theHereford and Angus breeds for weight at200,312, and 424 days.
The rank for breeds (high to low) inbreed transmitted effects for 424-dayweight was Brown Swiss, Angus, Here-ford, and Red Poll.
The Brown Swiss breed in crosseswas superior to the three other breeds forweight at 200, 312, and 424 days. Therelative superiority of the Red Poll toHereford and Angus in breed maternaleffects and breed mean heterosis com-pensated for its relatively low level ofbreed transmitted effects and resulted inthe Red Poll breed in crosses being equalto the Angus breed and significantly su-perior to the Hereford breed in crosses forweight at 424 days.
Carcass Traits Of Steers
Data were analyzed on 537 carcas-ses from steers on an age constant basis.Heterosis effects were significant for mostof the carcass traits associated withgrowth rate, including slaughter weight,carcass weight, adjusted fat thickness,estimated retail product weight, estimatedfat trim weight, and estimated boneweight. Differences in breed mean heter-osis were not generally important.
Reciprocal differences were signifi-cant in favor of the Red Poll and BrownSwiss dams for most of the carcass traitsassociated with weight. Breed maternaleffects were greatest in Red Poll andBrown Swiss breeds for carcass traitsassociated with weight.
The Brown Swiss breed ranked firstand the Red Poll breed last in breed trans-mitted effects for carcass traits associ-ated with weight. The Angus breed rank-ed first in breed transmitted effects forcarcass quality grade and for other car-cass traits associated with carcass fat-ness.
The Brown Swiss breed in crossesranked significantly higher than crossesof the three other breeds for most carcasstraits associated with weight. Also cros-ses of the Brown Swiss breed had a high-er lean-to-fat ratio.
When carcass traits were adjusted toa constant carcass weight of 5971b, heter-osis effects, reciprocal differences, andbreed 'maternal effects were not impor-tant. Thus the heterosis, reciprocaleffects, and breed maternal effects wereassociated with growth rate.
Breed transmitted effects were im-portant for traits associated with carcasscomposition after adjustments weremade for the effects of weight. Thisobservation shows that there are impor-tant breed differences on carcass traitsindependent of carcass weight.

CHARACTERIZATION OF BREEDS REPRESENTING DIVERSE BIOLOGICALTYPES: PREWEANING TRAITS
Keith E.Gregory,1LarryV.Cundiff, andRobertM.Koch
Introduction precipitation to improved past~res withannual precipitationlevelsof 50 Inormore
The germ plasm base for beef cattle along with comparable differences inproduction in the United States has been temperature, humidity, and air move-broadened considerably during.the last ment which constitute the climatic en-decade, primarily as a result of the de- viron~ent.velopmentof appropriatequarantine facil- The germ plasm resources nowities and procedures by the Canada De- availablefor beef productionin the Unitedpartment of Agriculture that have pro- States vary considerably in performancevided for importing several new breeds of level for specific traits. There is evidenceEuropean origin. Also, the importation of of major differences in feed resource re-new breeds, along with other factors, has quirement associated with differences instimulated interest in increased use for performance level.Thus, the challenge isbeef production of several breeds that to synchronize germ plasm resources inhave been available in North America for regard to performance characteristicsmany years.The newly introduced bree~s with the feed resourcesthat are mosteco-added to the breeds already available In nomical to provide on a life cycle basis inthe United States provide a wide range in terms of maximizing output per unit ofperformance characteristics in the cattle input when viewed in the context of lifeavailable for producing beef. cycle productionsystems.
A highdegreeof uniformity inproduc- From a breeding standpoint, theretion systems at the terminal end of the are three basic approaches that may bebeef cattle production cycle has evol~ed used to synchronize cattle germ plasmin the United States and Canada. A high resources with other production re-percentage of young slaughter animals of sources and market requirement of pro-both sexes have feeding periods of vari- duct. These are (1) identify or select theable lengthon dietsof highenergy density breed that is the best "fit" or "match" toas either castrate males or as nonpr~g- the production requirement (productionnant females.Thishigh offtake production resources and market requirement) andsystem has been made possible largely then select within this breed to increaseas a result of new technologies i~ feed "adaptability" to the production situation;grain production,which have made It~?o- (2) use systematic crossbreeding involv-nomically feasible to use I~rge quantities ing breeds that will complement eachof feed grains at the terminal end of the other most effectively to provide a morebeef productioncycle. Althou~h the quan- nearlyoptimum "blend" of characteristicstities and prices of feed gr~lns may not desired;or (3) form ageneticpool bycros-continue at the levels reqUired to favor sing breedsthat providea balanceclosesttheir use for feeding cattle at the rate per to the performance characteristics mostanimal that has characterized the beef desired for the production situation andcattle industry during the past quarter of a then inter se mate the resulting progenycentury, we believe that it will continue to with a "minimum" rate of inbreeding andbe economically feasible to ~~e.s~m~ practice intrapopulation selection to for~concentratefeed resources for finishing new breeds. The purpose of this paper ISyoung slaughter animals. We believe that to characterize breeds representing di-over the long term the basic concept or versebiological typesthat maybe consid-approach will be to use limited concen- ered for use in these three approaches,trate feed resources to most effectively rather than to give attention to the advan-supplementor to complement forage feed tages and disadvantages or the "traderesources for all ruminant animal produc- offs" involved in each of thesetion. . approaches. However, it is appropriateto
While there is a high degree of Unl- indicate that the 'wo latter approachesformity in the feed environment provi~ed makeuseof the phenomenonof heterosisat the terminal end of the beef production orhybridvigor,whereasthe first approachcycle, the opposite situation character- does not.izes the feed environment of the repro-ducing animal.Considerable variation ex- Procedureists in both quantity and quality of feedresource base used by reproducing beefcattle and the climatic environment towhich they are exposed, varying fromdesert rangeswith less than 8 in of annual
,Keith E. Gregory is a research geneticistatMARC.
- -- --
In 1969, MARC implemented a pro-gram to characterize a broad range ofbiological types of cattle as representedby breeds that differ widely in characteris-ticssuchas milk level,growthrate,car-cass composition, and mature size. Theprimary objective was to characterize
breeds representing diverse biologicaltypes for the full spectrum of traits relatingto beef production. The germ plasm eval-uation program at MARC has includedthree cycles of sire breeds that were bredby artificial insemination (AI) to Herefordand Angus dams. Hereford-Angus recip-rocal crosses were repeated in each cycleas controls and to make possible the com-parison of breeds included in different cy-cles. The first cycle involved breedingHereford, Angus, Jersey, Limousin,South Devon, Simmental, and Charolaissires (20 to 35 sires per breed) by AI toHereford and Angus dams (ranging from2 to 7 years old at calving) to producethree calf crops in March and April of1970, 1971, and 1972. In Cycle II, Here-ford and Angus dams (ranging from 4 to 9years old at calving) used in Cycle I werebred by AI to Hereford, Angus, Red Poll,Brown Swiss (predominantly European),Gelbvieh, Maine-Anjou, and Chianinasires to produce two calf crops in 1973and 1974. Cycle III involved the same orcomparable Hereford and Angus dams(ranging from 4 to 11 years old at calving)mated by AI to Hereford, Angus, Taren-taise, Pinzgauer, Sahiwal, and Brahmansires to produce two calf crops in 1975and 1976. The same Hereford and Angussires were used in all three cycles of theprogram to insure a more stable controlpopulation of Hereford-Angus reciprocalcrosses as a basis for comparison ofbreeds included in different cycles of theprogram. In Cycles I and II, but not inCycle III, Hereford and Angus sires werealso mated to produce straightbred prog-eny of each of the two breeds.
The breeds that have been used inthis program on which data are presentedin this paper have been classified into sixdifferent biological types based on thecriteria of (1) growth rate and mature size,(2) lean to fat ratio, (3) age at puberty, and(4) milk production. The groupings arereflected in Table 1 with the number of"X's" indicating relative differences be-tween breed groups for each of the fourcriteria that provide the basis for classi-fication.
The data presented in Table 2 wereobtained by adding the average differ-ence between specific breed groups andHereford-Angus crosses within each cy-cle to the performance of Hereford-Anguscrosses averaged over the three cycles.
Preweaning Traits
Results for birth and weaning traitsfrom the three cycles are summarized inTable 2. Important differences were
7
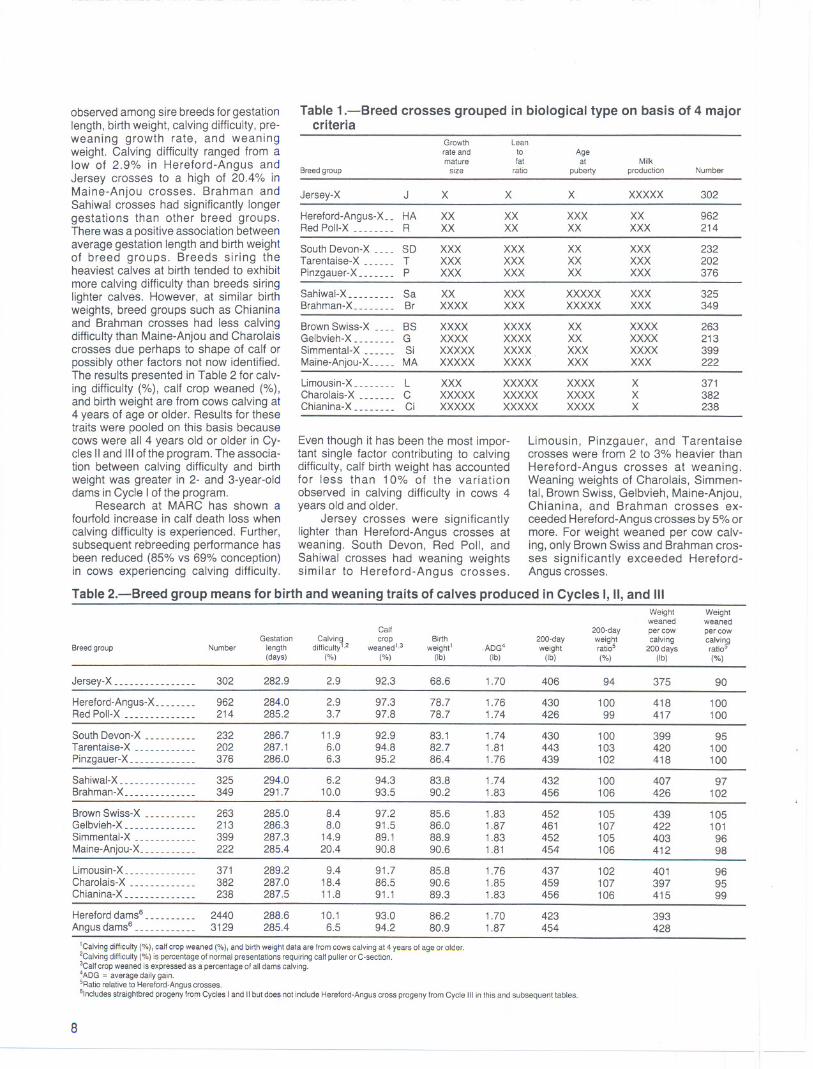
observed among sire breeds for gestationlength, birth weight, calving difficulty, pre-weaning growth rate, and weaningweight. Calving difficulty ranged from alow of 2.9% in Hereford-Angus andJersey crosses to a high of 20.4% inMaine-Anjou crosses. Brahman andSahiwal crosses had significantly longergestations than other breed groups.There was a positive association betweenaverage gestation length and birth weightof breed groups. Breeds siring theheaviest calves at birth tended to exhibitmore calving difficulty than breeds siringlighter calves. However, at similar birthweights, breed groups such as Chianinaand Brahman crosses had less calvingdifficulty than Maine-Anjou and Charolaiscrosses due perhaps to shape of calf orpossibly other factors not now identified.The results presented in Table 2 for calv-ing difficulty (%), calf crop weaned (%),and birth weight are from cows calving at4 years of age or older. Results for thesetraits were pooled on this basis becausecows were all 4 years old or older in Cy-cles II and III ofthe program. The associa-tion between calving difficulty and birthweight was greater in 2- and 3-year-olddams in Cycle I of the program.
Research at MARC has shown afourfold increase in calf death loss when
calving difficulty is experienced. Further,subsequent rebreeding performance hasbeen reduced (85% vs 69% conception)in cows experiencing calving difficulty.
Table 1.-Breed crosses grouped in biological type on basis of 4 majorcriteria
Eventhough it has been the most impor-tant single factor contributing to calvingdifficulty, calf birth weight has accountedfor less than 10% of the variationobserved in calving difficulty in cows 4yearsold and older.
Jersey crosses were significantlylighter than Hereford-Angus crosses atweaning. South Devon, Red Poll, andSahiwal crosses had weaning weightssimilar to Hereford-Angus crosses.
Limousin, Pinzgauer, and Tarentaisecrosses were from 2 to 3% heavier thanHereford-Angus crosses at weaning.Weaning weights of Charolais, Simmen-tal, Brown Swiss, Gelbvieh, Maine-Anjou,Chianina, and Brahman crosses ex-ceededHereford-Anguscrosses by5% ormore. For weight weaned per cow calv-ing, only Brown Swiss and Brahman cros-ses significantly exceeded Hereford-Angus crosses.
Growth Leanrateand to Agemature fat at Milk
Breedgroup size ratio puberty production Number
Jersey-X J X X X XXXXX 302
Hereford-Angus-Xh HA XX XX XXX XX 962Red PolI-X hhuu R XX XX XX XXX 214
South Devon-X ____ SD XXX XXX XX XXX 232Tarentaise- X _u u _ T XXX XXX XX XXX 202
Pinzgauer-X __ _____ P XXX XXX XX XXX 376
Sahiwal-X _________ Sa XX XXX XXXXX XXX 325Brahman-X_ _______ Br XXXX XXX XXXXX XXX 349
Brown Swiss-X ____ BS XXXX XXXX XX XXXX 263Gelbvieh-X _u ___u G XXXX XXXX XX XXXX 213Simmental-X ______ Si XXXXX XXXX XXX XXXX 399Maine-Anjou-X_____ MA XXXXX XXXX XXX XXX 222
Limousin-X_ _______ L XXX XXXXX XXXX X 371Charolais- X u _____ C XXXXX XXXXX XXXX X 382Chianina-X _ _____ __ Ci XXXXX XXXXX XXXX X 238
Table 2.-Breed group means for birth and weaning traits of calves produced in Cycles I, II, and IIIWeight Weightweaned weaned
Calf 200-day percow per cowGestation Calvin crop Birth 200-day weight calving calvinJlBreedgroup Number length difficulty .2 weaned1,3 weight' ADG4 weight ratioS 200 days ratio
(days) (%) (%) (Ib) (Ib) (Ib) (%) (Ib) (%)
Jersey-X _ _ _ _ _ _ _ _ _ _ _ _ _ _ __ 302 282.9 2.9 92.3 68.6 1.70 406 94 375 90
Hereford-Angus- X ________ 962 284.0 2.9 97.3 78.7 1.76 430 100 418 100Red PolI-X ______________ 214 285.2 3.7 97.8 78.7 1.74 426 99 417 100
South Devon- X __________ 232 286.7 11.9 92.9 83.1 1.74 430 100 399 95Tarentaise-X_u _u ______ 202 287.1 6.0 94.8 82.7 1.81 443 103 420 100Pinzgauer-Xu __u __u ___ 376 286.0 6.3 95.2 86.4 1.76 439 102 418 100
Sahiwal-X _ _ __ _ _ _ _ _ _ _ _ _ __ 325 294.0 6.2 94.3 83.8 1.74 432 100 407 97Brahman-X _ __ _ _ _ _ _ _ _ _ _ __ 349 291.7 10.0 93.5 90.2 1.83 456 106 426 102
Brown Swiss-X __________ 263 285.0 8.4 97.2 85.6 1.83 452 105 439 105Gelbvieh- X _ _ _ _ _ _ _ _ _ _ _ _ _ _ 213 286.3 8.0 91.5 86.0 1.87 461 107 422 101Simmental-X _________u_ 399 287.3 14.9 89.1 88.9 1.83 452 105 403 96Maine-Anjou-X_ __ ________ 222 285.4 20.4 90.8 90.6 1.81 454 106 412 98
Limousin-X ______ ________ 371 289.2 9.4 91.7 85.8 1.76 437 102 401 96Charolais-X __ ___ ___ h h_ 382 287.0 18.4 86.5 90.6 1.85 459 107 397 95Chianina-X _______h ___u 238 287.5 11.8 91.1 89.3 1.83 456 106 415 99
Hereford dams6 ___ _______ 2440 288.6 10.1 93.0 86.2 1.70 423 393Angus dams6 ____ _ __ __ __ _ 3129 285.4 6.5 94.2 80.9 1.87 454 428
'Calvingdifficulty(%j,calfcropweaned(%j,andbirthweightdataarefromcowscalvingat4years01ageorolder.2Calvingdifficulty (%) is percentageof normal presentationsrequiringcalfpuller or C-section.3Calfcropweanedisexpressedasapercentageofalldamscalving.4ADG = averagedaily gain.SRatiorelativeto Hereford-Anguscrosses."IncludesstraightbredprogenyfromCyclesI andIIbutdoesnotincludeHereford-AnguscrossprogenyfromCycleIIIinthisandsubsequenttables.
S
CHARACTERIZATION OF BREEDS REPRESENTINGDIVERSEBIOLOGICAL TYPES:POSTWEANING GROWTH AND PUBERTY OF FEMALES
Keith E. Gregory,' Larry V. Cundiff, and Robert M. Koch
Introduction breeding season when they averaged a-bout 465 days. Weights were taken at28-day intervals from weaning to the be-ginning of the breeding season, at the endof AI breeding season, and at approx-imately 550 days when heifers were pal-pated for preganancy.
From weaning in late October untilthey were placed on cool season pasture(about April 20), we fed heifers diets con-sisting of varying percentages of corn sil-age, alfalfa haylage, grass haylage, and aprotein supplement when needed to meetnutritive requirements. The diet was thesame for all breed groups and wasconsidered adequate to develop femalesof most breed groups to breed as year-lings. Generally, we noted an improve-ment in the nutritive environment over thethree cycles. Thus, the nutritive environ-ment may have been above the optimumfor some of the breed groups in Cycles IIand III of the program.
Postweaning Growth Of Females
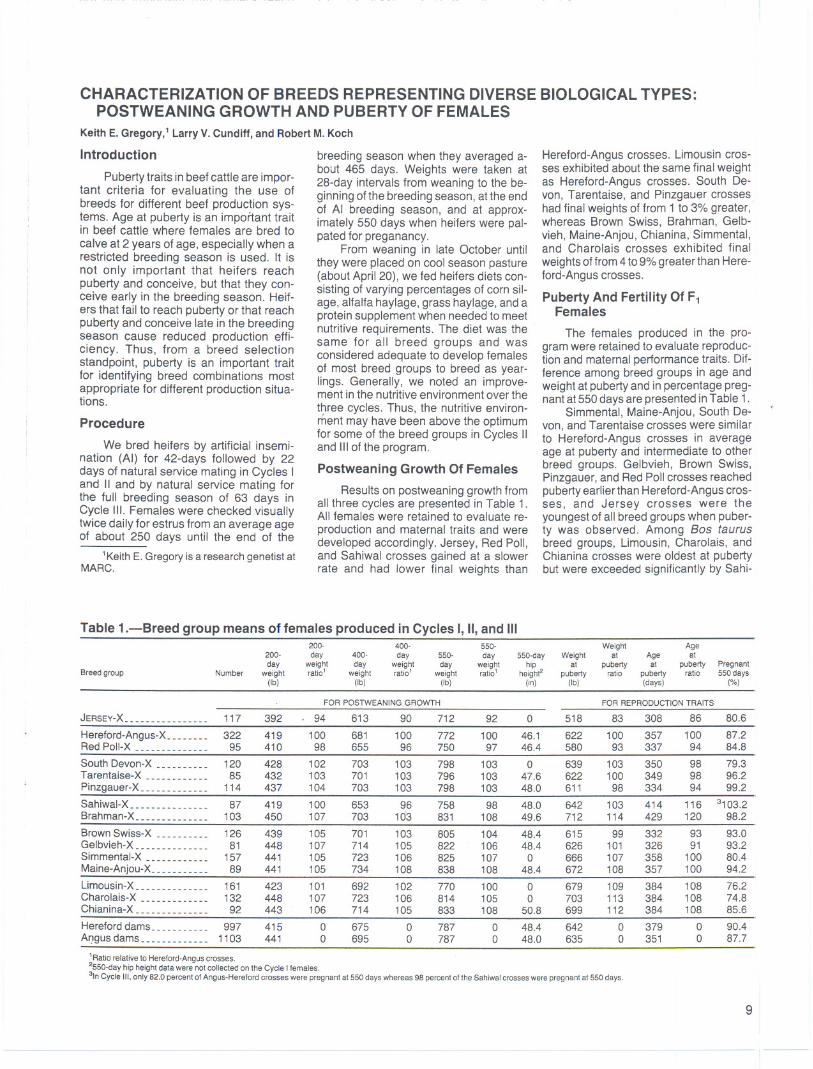
Results on postweaning growth fromall three cycles are presented in Table 1.All females were retained to evaluate re-production and maternal traits and weredeveloped accordingly. Jersey, Red Poll,and Sahiwal crosses gained at a slowerrate and had lower final weights than
Puberty traits in beef cattle are impor-tant criteria for evaluating the use ofbreeds for different beef production sys-tems. Age at puberty is an important traitin beef cattle where females are bred to
calve at 2 years of age, especially when arestricted breeding season is used. It isnot only important that heifers reachpuberty and conceive, but that they con-ceive early in the breeding season. Heif-ers that fail to reach puberty or that reachpuberty and conceive late in the breedingseason cause reduced production effi-ciency. Thus, from a breed selectionstandpoint, puberty is an important traitfor identifying breed combinations mostappropriate for different production situa-tions.
Procedure
We bred heifers by artificial insemi-nation (AI) for 42-days followed by 22days of natural service mating in Cycles Iand II and by natural service mating forthe full breeding season of 63 days inCycle III. Females were checked visuallytwice daily for estrus from an average ageof about 250 days until the end of the
,Keith E. Gregory is a research genetist atMARC.
Hereford-Angus crosses. Limousin cros-ses exhibited about the same final weightas Hereford-Angus crosses. South De-von, Tarentaise, and Pinzgauer crosseshad final weights of from 1 to 3% greater,whereas Brown Swiss, Brahman, Gelb-vieh, Maine-Anjou, Chianina, Simmental,and Charolais crosses exhibited final
weights of from 4 to 9% greater than Here-ford-Angus crosses.
Puberty And Fertility Of F1Females
The females produced in the pro-gram were retained to evaluate reproduc-tion and maternal performance traits. Dif-ference among breed groups in age andweight at puberty and in percentage preg-nant at 550 days are presented in Table 1.
Simmental, Maine-Anjou, South De-von, and Tarentaise crosses were similarto Hereford-Angus crosses in averageage at puberty and intermediate to otherbreed groups. Gelbvieh, Brown Swiss,Pinzgauer, and Red Poll crosses reachedpuberty earlier than Hereford-Angus cros-ses, and Jersey crosses were theyoungest of all breed groups when puber-ty was observed. Among Bos taurusbreed groups, Limousin, Charolais, andChianina crosses were oldest at pubertybut were exceeded significantly by Sahi-
Table 1.-Breed group means of females produced in Cycles I, II,and III200- 400- 550. Weight Age
200. day 400. day 550. day 550-day Weight at Age atday weight day weight day weight hip at puberty at puberty Pregnant
Breed group Number weight ratio' weight ratio' weight ratio' height" puberty ratio puberty ratio 550 days(Ib) (Ib) (Ib) (in) (Ib) (days) ("!O)
FOR POSTWEANING GROWTH FOR REPRODUCTION TRAITS
JERSEy-X________________ 117 392 94 613 90 712 92 0 518 83 308 86 80.6
Hereford-Angus-X_ ___ ____ 322 419 100 681 100 772 100 46.1 622 100 357 100 87.2Red PolI-X ______________ 95 410 98 655 96 750 97 46.4 580 93 337 94 84.8
South Devon-X __________ 120 428 102 703 103 798 103 0 639 103 350 98 79.3Tarentaise-X____________ 85 432 103 701 103 796 103 47.6 622 100 349 98 96.2Pinzgauer-X ___ ____ ____ __ 114 437 104 703 103 798 103 48.0 611 98 334 94 99.2
Sahiwal-X ___ ____ ___ _____ 87 419 100 653 96 758 98 48.0 642 103 414 116 3103.2Brahman-X_ _____________ 103 450 107 703 103 831 108 49.6 712 114 429 120 98.2
Brown Swiss-X __________ 126 439 105 701 103 805 104 48.4 615 99 332 93 93.0Gelbvieh- X __ ___ ____ ___ __ 81 448 107 714 105 822 106 48.4 626 101 326 91 93.2Simmental-X ____________ 157 441 105 723 106 825 107 0 666 107 358 100 80.4Maine-Anjou-X_ __________ 89 441 105 734 108 838 108 48.4 672 108 357 100 94.2
Limousin-X ____ ___ ___ ____ 161 423 101 692 102 770 100 0 679 109 384 108 76.2Charolais-X _ __ _ ___ __ ____ 132 448 107 723 106 814 105 0 703 113 384 108 74.8Chianina-X ______________ 92 443 106 714 105 833 108 50.8 699 112 384 108 85.6
Hereford dams _ ____ _____ _ 997 415 0 675 0 787 0 48.4 642 0 379 0 90.4Agus dams ___ ____ _____ _ 1103 441 0 695 0 787 0 48.0 635 0 351 0 87.7
'RatiorelativetoHereford.Anguscrosses.2550-dayhipheightdatawerenotcollectedontheCycleI females.3'nCycleIII.only82.0percentofAngus.Herefordcrosseswerepregnantat550dayswhereas98percentoftheSahiwalcrosseswerepregnantat550days.
9
-- - -
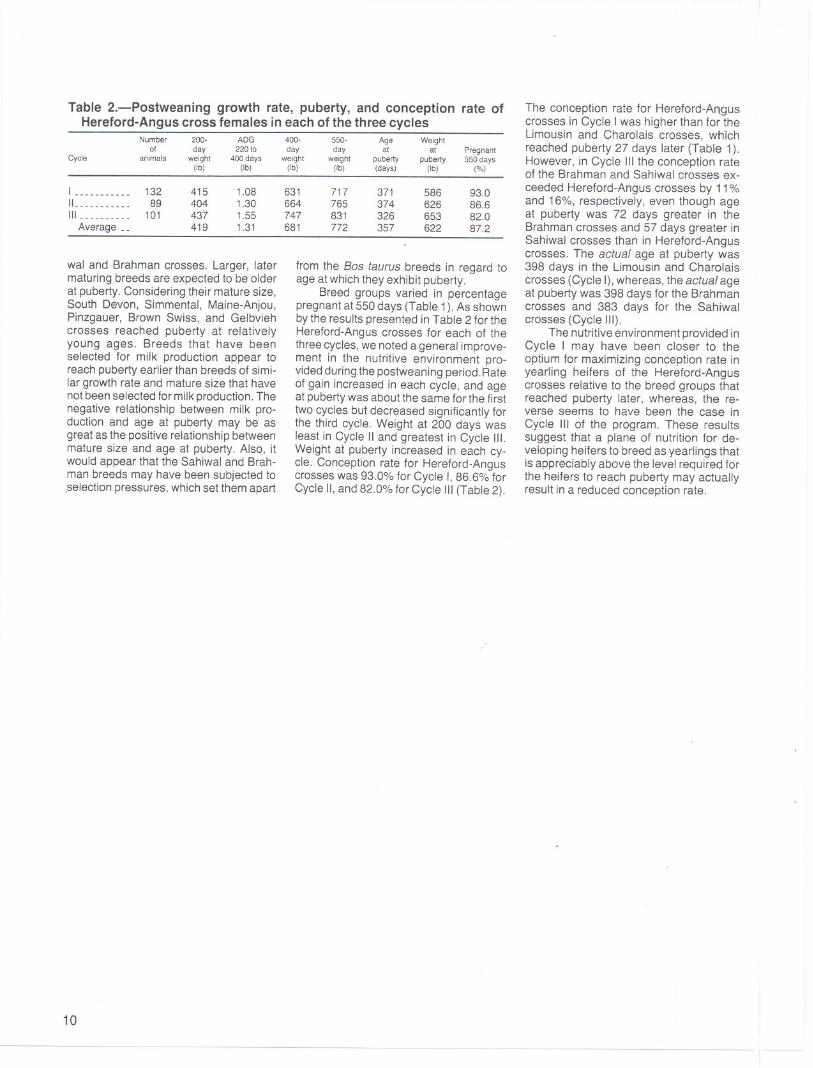
Table 2.-Postweaning growth rate, puberty, and conception rate ofHereford-Angus cross females in each of the three cycles
Number 200- ADG 400- 550. Age Weightof day 220 to day day at at Pregnant
Cycle animals weight 400 days weight weight puberty puberty 550 days(Ib) (Ib) (Ib) (Ib) (days) (Ib) (%)
371374326357
586626653622
93.086.682.087.2
wal and Brahman crosses. Larger, latermaturingbreeds are expectedto be olderat puberty.Consideringtheir maturesize,South Devon, Simmental, Maine-Anjou,Pinzgauer, Brown Swiss, and Gelbviehcrosses reached puberty at relativelyyoung ages. Breeds that have beenselected for milk production appear toreachpubertyearlier than breeds of simi-lar growth rate and maturesize that havenot beenselectedfor milk production.Thenegative relationship between milk pro-duction and age at puberty may be asgreatas the positive relationshipbetweenmature size and age at puberty. Also, itwould appear that the Sahiwaland Brah-man breeds may have been subjected to.selectionpressures,whichset them apart
10
-
from the Bos taurus breeds in regard toage at whichthey exhibit puberty.
Breed groups varied in percentagepregnantat 550days (Table 1).As shownbythe resultspresented in Table 2 for theHereford-Anguscrosses for each of thethreecycles,we noted ageneral improve-ment in the nutritive environment pro-videdduringthepostweaning period.Rateof gain increased in each cycle, and ageat pubertywas about the same for the firsttwo cycles but decreased significantly forthe third cycle. Weight at 200 days wasleast in Cycle II and greatest in Cycle III.Weight at puberty increased in each cy-cle. Conception rate for Hereford-Anguscrosseswas 93.0% for Cycle I, 86.6% forCycle II,and 82.0% for Cycle III (Table 2).
The conception rate for Hereford-Anguscrosses in Cycle I was higher than for theLimousin and Charolais crosses, whichreached puberty 27 days later (Table 1).However, in Cycle III the conception rateof the Brahman and Sahiwal crosses ex-ceeded Hereford-Angus crosses by 11%and 16%, respectively, even though ageat puberty was 72 days greater in theBrahman crosses and 57 days greater inSahiwal crosses than in Hereford-Anguscrosses. The actual age at puberty was398 days in the Limousin and Charolaiscrosses (Cycle I),whereas, the actual ageat puberty was 398 days for the Brahmancrosses and 383 days for the Sahiwalcrosses (Cycle III).
The nutritiveenvironment provided inCycle I may have been closer to theoptium for maximizing conception rate inyearling heifers of the Hereford-Anguscrosses relative to the breed groups thatreached puberty later, whereas, the re-verse seems to have been the case inCycle III of the program. These resultssuggest that a plane of nutrition for de-veloping heifers to breed as yearlings thatis appreciably above the level required forthe heifers to reach puberty may actuallyresult in a reduced conception rate.
1____uu___ 132 415 1.08 631 71711000000_--_- 89 404 1.30 664 765111--_00--__- 101 437 1.55 747 831
Average __ 419 1.31 681 772
CHARACTERIZATION OF BREEDS REPRESENTINGDIVERSEBIOLOGICAL TYPES:POSTWEANING GROWTH AND FEED EFFICIENCY
Larry V. Cundlff,1 Robert M. Koch, and Keith E.Gregory
Introduction
On a Ii.fe-cycle basis, about 30% ofthe energy requirements for beef produc-tion are consumed by steers and heifersduring the period from weaning to slaugh-ter. About 45 to 55% of the total feed costsare incurred in the postweaning period,depending on the cost of feed resourcesfor the cow herd relative to those for thefeedlot. We find it is important, therefore,to characterize breeds of cattle for rate
and efficiency of postweaning gain.
Procedure
Steers were weaned in late October
and allowed a conditioning period of a-bout 28 days before feeding trials wereinitiated in mid-November of each yearwhen the steers were about 8 months ofage. Steers were fed free choice dietsconsisting of corn silage-concentrate(concentrate contained varying amountsof ground corn, ground grain sorghum,and ground wheat) and supplement (pri-marily soybean meal) varying in energydensity from 1.2 Mcal metabolizable ener-gy (MEllb) dry matter early in the feedingperiod to about 1.35 Mcal ME/lb dry mat-ter late in the feeding period.
'Larry V. Cundiff is a research leader(Breeding and Genetics) at MARC.
Steers were allotted to pens by sirebreed groups except that Hereford-Angusreciprocal crosses were penned together.Breed groups were randomly divided intotwo pens each year to provide for statistic-al analyses of postweaning feed efficien-cy. Steers were slaughtered in three tofive groups each year with an averageinterval of 70 days between the first andlast kill. Time on feed required to reachend points of a small degree of marblingor 18.9% fat trim was estimated from
increases in marbling or fat trim associ-ated with increased time on feed. Steers
were generally weighed at 28-day inter-vals. Quadratic regression of pen meanweights and cumulative ME on days fedwere used to estimate gain, ME consump-tion, and efficiency (Mcal ME/lb gain) inalternative intervals.
Efficiency of live weight gain was e-valuated for four different intervals: timeconstant (0 to 238 days on feed), weightconstant (545 to 1,035Ib), grade-constant(0 days on feed to a small degree of marb-ling), and fat-trim constant (0 days on feedto 18.9% fat trim). The level of marblingselected as an end point was small be-cause this is the level of marbling requiredfor cattle of these ages to achieve a quali-ty grade of USDA Choice. The 18.9% fattrim level was the average fat trim forbreed groups at 0.5 in fat thickness at the12th rib.
Results
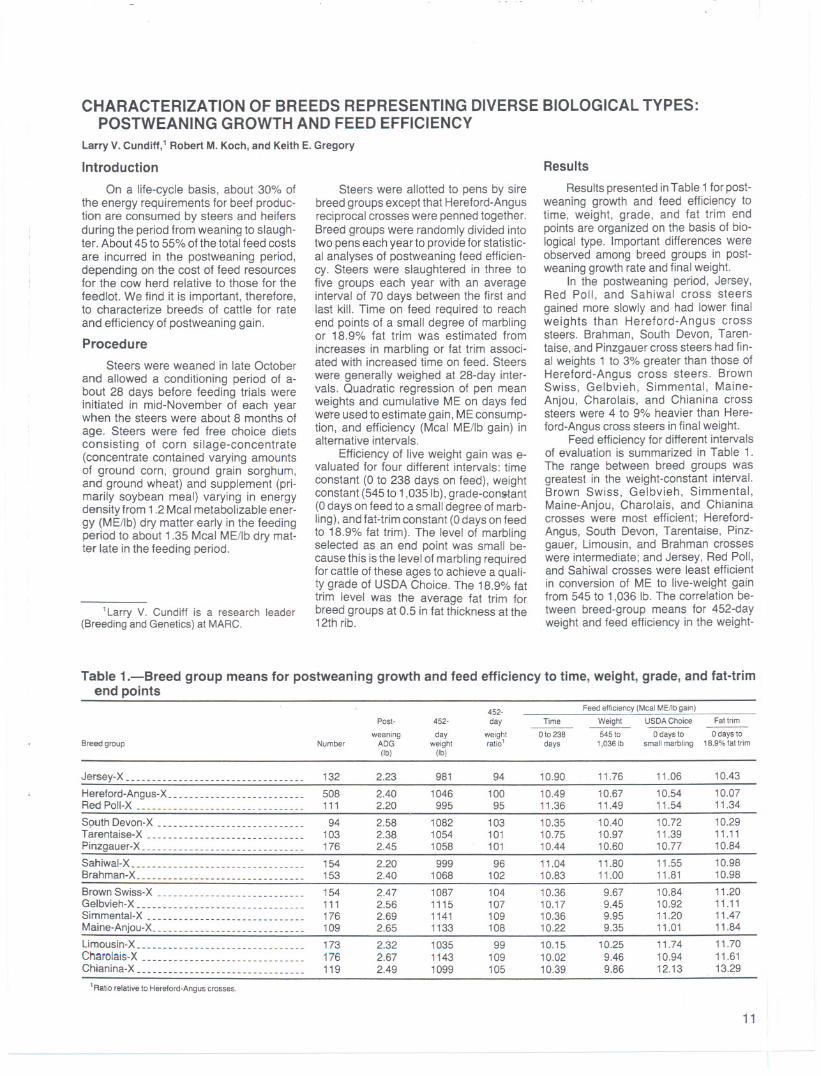
Results presented in Table 1 for post-weaning growth and feed efficiency totime, weight, grade, and fat trim endpoints are organized on the basis of bio-logical type. Important differences wereobserved among breed groups in post-weaning growth rate and final weight.
In the postweaning period, Jersey,Red Poll, and Sahiwal cross steersgained more slowly and had lower finalweights than Hereford-Angus crosssteers. Brahman, South Devon, Taren-taise, and Pinzgauer cross steers had fin-al weights 1 to 3% greater than those ofHereford-Angus cross steers. BrownSwiss, Gelbvieh, Simmental, Maine-Anjou, Charolais, and Chianina crosssteers were 4 to 9% heavier than Here-ford-Angus cross steers in final weight.
Feed efficiency for different intervalsof evaluation is summarized in Table 1.
The range between breed groups wasgreatest in the weight-constant interval.Brown Swiss, Gelbvieh, Simmental,Maine-Anjou, Charolais, and Chianinacrosses were most efficient; Hereford-Angus, South Devon, Tarentaise, Pinz-gauer, Limousin, and Brahman crosseswere intermediate; and Jersey, Red Poll,and Sahiwal crosses were least efficientin conversion of ME to live-weight gainfrom 545 to 1,036 lb. The correlation be-tween breed-group means for 452-dayweight and feed efficiency in the weight-
Table 1.-Breed group means for postweaning growth and feed efficiency to time, weight, grade, and fat-trimend points
452- Feedefficiency (Meal MEilb gain)
Post- 452. day Time Weight USDA Choice Fat trim-weaning day weight o to 238 545 to o days to o days to
Breed group Number ADG weight ratio1 days 1.0361b small marbling 18.9%fat trim(Ib) (Ib)
Jersey-X __ __ _ _00 _ uu _ _00 _ 00 _u __u _u __U 132 2.23 981 94 10.90 11.76 11.06 10.43
Hereford-Angus-X __________________________ 508 2.40 1046 100 10.49 10.67 10.54 10.07Red PolI-X 0000_______0000________ _________ 111 2.20 995 95 11.36 11.49 11.54 11.34
S9uth Devon-X ____00____________u _U ___00 94 2.58 1082 103 10.35 10.40 10.72 10.29Tarentaise-X ______________________________ 103 2.38 1054 101 10.75 10.97 11.39 11.11
Pinzgauer-X _ _ _ _ _ _ _ _ _ _ _ _ _ _ _ _ _ _ _ _ _ _ _ _ _ _ _ _ _ __ 176 2.45 1058 101 10.44 10.60 10.77 10.84
Sahiwal-X_u u___ ___ ___ ___ _00 U __00 u _uU 154 2.20 999 96 11.04 11.80 11.55 10.98Brahman-X________________________________ 153 2.40 1068 102 10.83 11.00 11.81 10.98
Brown Swiss-X ___ _00 __ __ _. ____ ___ 00 _ __00 __ 154 2.47 1087 104 10.36 9.67 10.84 11.20Gelbvieh-X _ _ _ __ 00 _ 00 _ 00 __ _ U _ _ _ _ _ 00 _ __ 00 __ 111 2.56 1115 107 10.17 9.45 10.92 11.11Simmental-X ___ ___ ___ ___ ____ ___ ____ _____ __ 176 2.69 1141 109 10.36 9.95 11.20 11.47
Maine-Anjou-X_ ___ ___ ___ ___ ____ ___ ___ ______ 109 2.65 1133 108 10.22 9.35 11.01 11.84
Limousin-X _ _ _ _ _ _ _ _ _ _ _ _ _ _ _ _ _ _ _ _ _ _ _ _ _ _ _ _ _ _ __ 173 2.32 1035 99 10.15 10.25 11.74 11.70
Charolais-X ____ __ ____ ___ __ _____ ___ ____ ____ 176 2.67 1143 109 10.02 9.46 10.94 11.61Chianina-X ___00______________00________u_ 119 2.49 1099 105 10.39 9.86 12.13 13.29
1Ratio relative to Hereford-Angus crosses.
11
constant interval was -0.91, indicatingthat larger breed groups required signifi-cantly less Mcal of ME/lb of gain thansmaller breed groups to grow from 545 to1,036 lb. Breed groups with the most rapidgrowth rates required less feed per unit ofgain than slower-gaining groups in theweight-constant interval primarily be-cause fewer days of maintenance wererequired in the weight-constant interval.
The ranking and relative differencesof breed groups for feed efficiency in thetime-constant interval (0 to 238 days post-weaning) were similar to that for theweight-constant interval, but the rangeand differences between breed groupswere smaller. The larger, faster-gainingbreed groups that were heaviest at wean-ing maintained more weight throughoutthe time-constant interval. Even withheavier weights maintained, the faster-gaining breed groups were more efficientin the time-constant interval. The correla-tion between breed-group means for 452-day weight and feed efficiency in the time-constant interval was -0.78.
Feed efficiency from weaning (ex-cept for adjustment period of about 28days) to a grade-constant end of USDA
12
Choice (0 days to small amount of mar-bling) or to a fat trim-constant end point of18.9% is also presented in Table 1. Theranking of breed groups for feed efficiencyto a USDA Choice grade end point wassimilar to that to a fat-trim end point (cor-relation of breed group means was 0.66).There is considerable difference in theranking of breed-group means for feedefficiency to a grade- or a fat-constant endpoint compared to ranking for feed effi-ciency to a time- or a weight-constant endpoint.
To a grade end point of USDAChoice, Hereford-Angus crosses weresignificantly more efficient than Charolais,Brown Swiss, Gelbvieh, Chianina, Taren-taise, Brahman, and Sahiwal crosses.The correlation of breed:group means for452-day weight and feed efficiency to agrade end point was only -0.14, indicatingno significant association between sizeand feed efficiency (Mcal of ME/lb of gain)to a grade end point. The correlation ofbreed-group means for number of dayson feed required to reach a small degreeof marbling and feed efficiency to a gradeend point was 0.62. Breed groupsreaching a small degree of marbling in the
fewest days tended to be more effioient,primarily because fewer days of mainte-nance were required. Evaluation to agrade-constant end point assumes thatfeeding to higher levels of fatness is justi-fied in terms of improving the eating quali-ty of beef. Taste-panel evaluations of fla-vor, juiciness, and tenderness indicatedthat this assumption was not justified.
To a fat-trim end point of 18.9%,Hereford-Angus crosses were significant-ly more efficient than Limousin, Charolais,Simmental, Red Poll, Brown Swiss, Gelb-vieh, Maine-Anjou. Chianina, Pinzgauer.Tarentaise, Brahman, and Sahiwal cros-ses. The correlation among breed groupmeans between 452-day weight and feedefficiency (Mcal of ME/lb of gain) to a fat-trim end point was 0.40, indicating thatbreeds of larger size tended to be lessefficient than breeds of smaller size to thefat-trim end point. The correlation of breedgroup means for number of days on feedrequired to reach 19% fat-trim and feedefficiency to a fat-trim end point was 0.92.Breed groups reaching the 18.9% fat-trimend point in the fewest days tended to bemore efficient, primarily because fewerdays of maintenance were required.

CHARACTERIZATION OF BREEDS REPRESENTINGDIVERSEBIOLOGICAL TYPES:CARCASS AND MEAT TRAITS OF STEERS
Robert M. Koch,' Larry V. Cundiff, Keith E. Gregory and M.E. Dikeman
Introduction
Carcass characteristics, includingcomposition and palatability of meat fromdifferent breeds or breed crosses, are im-portant in determining the potential valueof alternative germ plasm resources.
Procedure
The sire breeds evaluated repre-sented biological types that differed wide.Iy in mature size and rate of fattening.Hereford-Angus reciprocal crosses wererepeated in each of three breeding cyclesas controls and to make possible the com-parison of breeds included in different cy-cles. The first cycle involved breedingHereford, Angus, Jersey, Limousin,South Devon, Simmental, and Charolaissires by artifical insemination (AI) to Here-ford and Angus dams to produce threecalf crops in March and April of 1970,1971,' and 1972. In Cycle II, Hereford andAngus dams used in Cycle I were bred byAI to Hereford, Angus, Red Poll, BrownSwiss (predominately European), Gelb-veih, Maine-Anjou, and Chianina sires toproduce two calf crops in 1973 and 1974.Cycle III involved the same or comparableHereford and Angus dams mated by AI to
'Robert M.Koch is a University of Nebras-ka-Lincoln research geneticist stationed atMARC.
Hereford, Angus, Tarentaise, Pinzgauer,Sahiwal, and Braham sires to producetwo calf crops in 1975 and 1976.
Each year steers were slaughtered ateach of three to five slaughter datesspaced about 1 month apart. Slaughter atseveral dates provided a range in age,weight, and degree of fatness for each ofthe breed groups. This design permittedus to estimate values that would beobtained if animals in a breed group hadbeen fed fewer or more days until thebreed group average reached a given endpoint with regard to (1) age, (2) carcassweight, or (3) fat trim percentage.
Slaughter was carried out at a com-mercial packing plant. After a 24-hr chill,carcasses were evaluated for maturity,marbling, color, texture, firmness, andl!SDA quality and yield grades. The rightside was trucked to Kansas State Uni-versity were it was processed to obtaindetailed cutout information and tastepanel evaluation under the direction of Dr.Michael E. Dikeman.
The round, rib, loin, and chuck wereseparated into wholesale cuts and proc-essed into closely trimmed, boneless re-tail cuts, except for a small amount ofbone left in the short loin and rib roasts.Fat was trimmed to no more than 0.3 in onany surface. Lean from the flank, plate.brisket, and shank were added to the leantrim from the four major cuts. Chemical
analysis of the lean trim in each carcasswas used to adjust total lean trim to a 25%ether extract basis. The sum of roasts ane
steak meat plus adjusted lean trim wascalled retail product. Steaks at the 1Ot~and 11th ribs from fou r representative car.casses of each breed group at eac~slaughter date were frozen and later useefor a Warner-Bratzler shear force deter.mination for tenderness and a taste paneevaluation of tenderness, flavor, and juici.ness.
Results
Breed group means for carcass trait~of steers from Cycles I, II, and III adjustecto a constant age of 458 days and to ~constant fat trim of 19% are presented irTable 1. Equal age comparisons providEa measure of differential growth rate an<are related to mature size. Results presented in Table 1 reflect a large amount 0genetic variation in growth rate. At equaages, breed groups differed in carcas!weight by as much as 19% and als(varied greatly in composition of carcasses. Carcass weight varied more wide I)(Chianina crosses were 69% heavier tharJersey crosses) between breed groups aequal fat trim than at equal age, with thEmaximum difference in retail product percentage reduced to 1.7 at equal fat trin(Limousin vs Jersey crosses). Rapi(
'Marbling scores: traces = 4,5,6:slight = 7,8,9;small = 10,11, 12; modest = 13,14,15.'Includes straightbred progeny from Cycles Iand II but does not include Hereford.Anguscross progeny from Cycle III.
Table 1.-Breed group means for carcass traits-Cycles I, II,and IIIShrunk Fat Fat
live Carcass thick. Marbling Retail Fat Kidney Live Carcass thick. Marbling Retail KidneyBreed group Number weight weight ness score' product trim Bone fat weight weight ness score' product Bone fat
(Ib) (Ib) (in) (%) (%) (%) (%) (Ib) (Ib) (in) (%) (%) (%)
ADJUSTED TO A CONSTANT AGE OF 458 DAYS ADJUSTED TO 19 PERCENT FAT TRIM
Jersey-X __ __ _. _ ___ ___ 134 958 593 0.46 13.3 65.5 22.1 12.4 6.2 879 537 0.37 11.8 68.0 13.0 5.6
Hereford-Angus- X _ ___ _ 472 1008 637 .64 11.3 66.3 21.7 12.0 3.9 935 584 .53 10.2 68.4 12.6 3.6Red PolI-X ._.________ 106 979 618 .49 11.2 66.6 21.0 12.4 5.1 928 581 .43 10.4 68.2 12.8 4.8
South Devon-X _______ 94 1031 655 .48 11.3 67.7 20.0 12.3 4.7 1010 639 .46 10.9 68.5 12.5 4.5T arentaise- X _________ 102 1010 638 .44 10.1 69.8 17.7 12.5 4.9 1016 645 .44 10.4 68.6 12.4 5.1Pinzgauer-X __________ 130 1017 629 .46 10.8 69.4 17.5 13.1 4.4 1028 640 .46 11.2 68.0 13.0 4.6
Sahiwal-X _ __ _ ___ _____ 141 962 611 .54 9.7 69.1 18.4 12.4 3.9 951 606 .52 9.7 68.5 12.5 4.0Brahman-X_ __________ 128 1033 663 .56 9.3 69.4' 18.0 12.6 4.1 1032 665 .55 9.5 68.4 12.6 4.3
Brown Swiss-X _______ 120 1076 677 .39 10.4 69.1 17.6 13.3 4.0 1144 723 .46 11.2 68.1 12.9 4.1Gelbvieh-X _ _ _ _ __ _ __ __ 108 1090 687 .37 9.7 69.8 17.4 12.8 4.5 1169 741 .45 10.6 68.7 12.3 4.7Simmental- X _________ 175 1079 673 .39 9.9 71.0 15.6 13.4 4.3 1251 791 .55 11.9 68.6 12.4 4.8Maine-Anjou-X_. _.. ___ 109 1103 704 .37 10.2 70.2 16.5 13.3 4.1 1223 787 .48 11.5 68.4 12.6 4.4
Limousin- X _ __ __ ___ ___ 177 1021 652 .41 8.9 72.4 15.1 12.5 4.3 1214 787 .60 11.0 69.7 11.3 4.9Charolais- X _. ________ 177 1093 691 .38 10.3 71.8 15.2 13.0 4.2 1291 828 .55 12.6 69.1 11.9 4.8Chianina-X ___. _______ 112 1077 690 .32 8.5 73.0 13.0 14.0 3.8 1390 910 .57 11.7 68.8 12.2 4.6
Hereford dams2 _______ 1044 1025 643 .43 9.8 69.7 17.3 13.0 4.1 1082 683 .50 10.6 68.4 12.6 4.4Angus dams2 _________ 1353 1024 651 .51 11.1 68.3 19.4 12.3 4.5 1015 645 .50 10.9 68.6 12.4 4.5

Table 2.-percentage of carcass in whole cuts and percentage of total retail product, fat trim, or bone in each' cutat a constant carcass weight
Loin and Minor Kidney Loin and Minor KidneyItem Round Chuck rib cuts knOb Round Chuck rib cuts knob
Whole cut Fat trim
Jersey-X _ ________ _______ 20.99 26.18 21.43 25.03 6.33 7.59 11.76 14.91 39.31 26.43
Hereford-Angus-X_ _______ 22.72 26.35 21.90 25.08 3.94 9.64 12.95 18.33 41.12 17.96Red PolI-X u___u_unu 22.27 26.49 21.58 24.33 5.34 7.46 12.57 15.72 39.49 24.76
South Devon-X _n _____ u 23.17 26.10 21.87 24.23 4.58 8.96 11.43 16.36 39.84 23.41Tarentaise-X u u _ _ _ n n_ 22.73 26.36 21.99 23.94 4.97 6.77 10.83 15.92 39.92 26.56
Pinzgauer-X ____ __ _______ 22.92 26.56 21.88 24.16 4.47 7.36 11.80 16.16 40.76 23.92
Sahiwal-X ___ ____________ 22.98 25.68 22.28 24.67 4.37 8.01 10.63 17.11 43.37 20.88Brahman-X_ _____________ 23.68 26.25 21.72 24.22 4.12 7.94 8.67 16.26 43.93 23.20
Brown Swiss-X __________ 23.99 26.94 21.87 23.32 3.88 7.74 10.14 16.12 41.77 24.23Gelbvieh-X _ _ _ _ _ _ _ _ _ _ _ _ __ 23.27 26.89 21.76 23.76 4.32 6.19 8.48 15.37 42.84 27.12Simmental-X u _ u u _ ____ 24.19 26.72 21.50 23.40 4.18 7.09 10.49 14.55 41.05 26.82
Maine-Anjou-X_ __________ 24.32 26.91 21.60 23.39 3.78 5.05 6.53 15.18 44.73 28.51
Limousin-X ____ __________ 24.19 26.47 22.05 23.15 4.18 7.02 8.84 16.18 40.82 27.14Charolais-X _ _ _ _ u _ _ _ __ __ 24.76 26.39 21.72 23.21 3.93 8.01 9.66 14.55 40.73 27.05Chianina-X ______________ 25.00 27.43 21.80 22.25 3.52 3.23 4.80 14.88 45.04 32.05
Average ________________ 23.41 26.52 21.80 23.88 4.39 7.20 9.97 15.84 41.65 25.34
Retail product Bone
Jersey-Xu __u _n _____u 24.56 30.72 24.74 19.98 --- 28.67 30.64 17.07 23.63
Hereford-Angus-X_ _______ 25.80 30.02 24.05 20.14 --- 29.76 30.72 16.52 23.01RedPolI-Xn u __ _ __ u _ u 25.81 30.23 24.35 19.62 --- 29.49 31.00 16.87 22.65
South Devon-X ___n __u_ 25.84 29.46 24.33 20.45 --- 30.07 30.19 16.62 23.13Tarentaise-X _u __ ___ ____ 25.89 29.82 24.49 19.81 --- 29.46 30.51 17.11 22.93
Pinzgauer-X _____ ________ 25.88 29.85 24.43 19.85 --- 29.91 30.41 16.43 23.26
Sahiwal-X ___ ____________ 26.40 29.65 24.71 19.25 --- 30.21 29.82 17.63 22.35Brahman-Xu u _ __ u u _ __ 26.54 30.02 24.02 19.43 --- 30.17 30.11 16.53 23.20
Brown Swiss-X __ u u u u 26.54 30.12 24.39 18.96 --- 30.81 30.75 15.88 22.57Gelbvieh-X ______________ 26.02 30.39 24.25 19.35 --- 30.03 30.87 16.41 22.70Simmental-X u __ __n ____ 26.56 29.61 23:99 19.85 --- 30.62 30.19 16.29 22.91Maine-Anjou-X_ __ ________ 26.79 30.06 23.93 19.23 --- 30.84 30.46 16.01 22.70
Limousin-X______ ________ 26.66 29.50 24.21 19.64 n_ 30.11 30.49 16.54 22.87Charolais-X _n____n____ 26.81 29.02 24.13 20.04 --- 30.98 30.22 16.07 22.74Chianina-X ___n __n_ ____ 27.27 30.37 24.01 18.36 --- 31'.17 30.26 16.28 22.30
Average ________________26.22 29.92 24.27 19.60 --- 30.15 30.44 16.55 22.86
growing breed groups had less fat trim the highest (27.27%) and Jersey crosses Differences among breed groups in dis-and more retail product and bone, which the lowest (24.56%) amount of their retail tribution of bone were not large and wererequired these breed groups to be carried product in the round. However, the simi- similar to differences in distribution of re-to heavier weights to attain equal fat trim larities of breed groups in distribution of tail product.percentages. retail product among cuts were more strik- Marbling score is the primary deter-
Percentage of the carcass in whole- ing than the differences. The amounts of minant of carcass quality grade. As indi-sale cuts, round, chuck, loin and rib, minor retail product in the highest priced cuts, cated by Table 3, at equal age, breedcuts, and kidney knob, are shown in Table the loin and rib, were remarkably similar. groups differed significantly in average2. Minor cuts include the flank, plate, bris- No breed group deviated more than 0.5% marbling scores and in percentage of car-ket, and foreshank. There was some from the average, and most were within casses that had adequate marbling tovariation among breed groups, particular- 0.25% of the average. Jersey crosses had grade USDA Choice or better. BreedIy in the round, minor cuts, and kidney the highest percentage of loin and rib groups that had the highest marblingknob. The cause of the whole cut variation (24.7%). Distribution of the fat trim by cuts scores had higher fat trim percentagesis best examined by considering the rela- did vary significantly among breed (Tables 1 and 3). These results show thattive amount of the total retail product, fat groups. Kidney and pelvic fat showed the the genetic relationship between marblingtrim, or bone in each cut, which is also greatest variation. There was a tendency score and fat trim is high. Thus, there isshown in Table 2. The largest differences for the earlier maturing breed groups to only limited opportunity to increase car-among breed groups in distribution of re- have less and the later maturing groups to cass quality grade through breeding with-tail product were in the round. There was have more of their fat trim in the kidney out increasing total fat.a tendency for the later maturing breed and pelvic region. Hereford-Angus cros- Taste panel evaluation of rib samplesgroups to have a larger percentage of ses had the lowest (17.96%) and Chiani- from about 1,230 animals is summarizedtheir muscle in the round than the earlier na crosses the highest (32.05%) relative in Table 3. One of the most significantmaturing groups. Chianina crosses had percentage of fat trim in the kidney knob. findings in the carcass and meat trait eval-
14
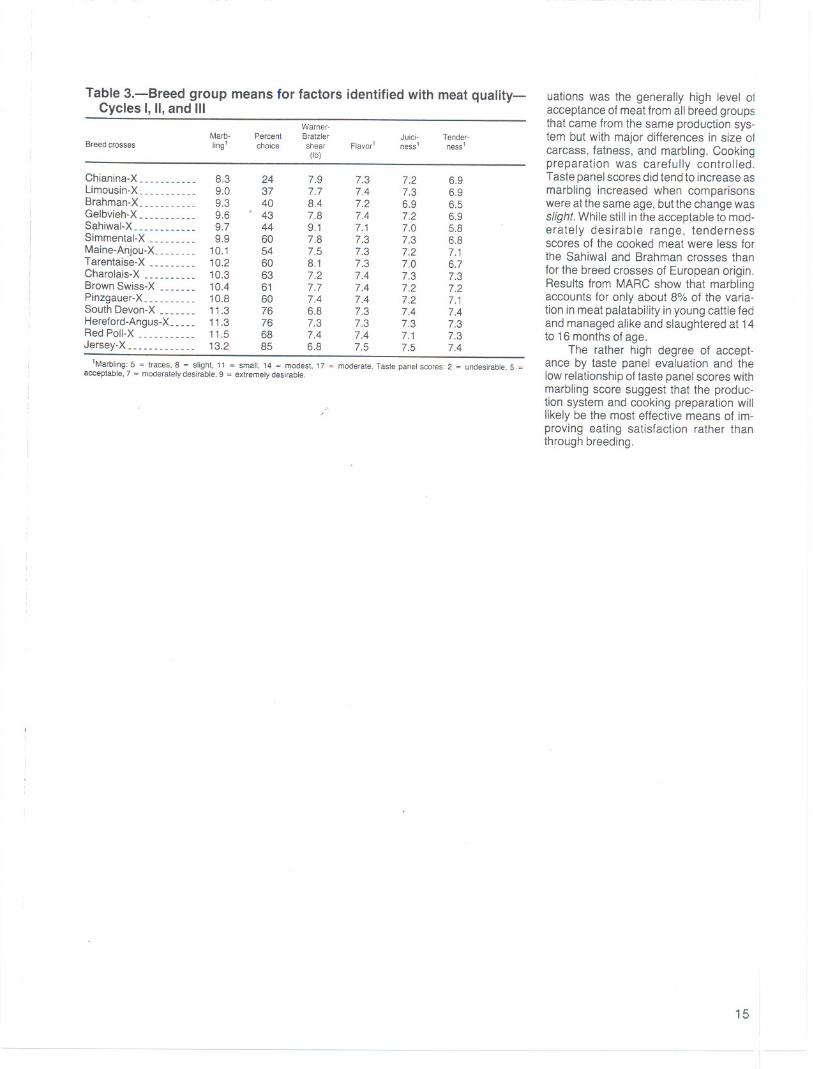
uations was the generally high level 01acceptance of meat from all breed groupsthat came from the same production sys-tem but with major differences in size ofcarcass, fatness, and marbling. Cookingpreparation was carefully controlled.Taste panel scores did tend to increase asmarbling increased when comparisonswere at the same age, but the change wasslight. While still in the acceptable to mod-erately desirable range, tendernessscores of the cooked meat were less forthe Sahiwal and Brahman crosses than
for the breed crosses of European origin,Results from MARC show that marblingaccounts for only about 8% of the varia-tion in meat palatability in young cattle fedand managed alike and slaughtered at 14to 16 months of age.
The rather high degree of accept-ance by taste panel evaluation and thelow relationship of taste panel scores withmarbling score suggest that the produc-tion system and cooking preparation willlikely be the most effective means of im-proving eating satisfaction rather thanthrough breeding.
15
Table 3.-Breed group means for factors identified with meat quality-Cycles I, II, and III
Warner-Marb- Percent Bratzler Juici- Tender-
Breedcrosses ling' choice shear Flavor' ness' ness'(Ib)
Chianina-X ___u ______ 8.3 24 7.9 7.3 7.2 6.9Limousin-X __________ 9.0 37 7.7 7.4 7.3 6.9Brahman-X_ u_ _______ 9.3 40 8.4 7.2 6.9 6.5Gelbvieh-X ___________ 9.6 43 7.8 7.4 7.2 6.9Sahiwal-X ____________ 9.7 44 9.1 7.1 7.0 5.8Simmental- X _________ 9.9 60 7.8 7.3 7.3 6.8Maine-Anjou-X_ __ _____ 10.1 54 7.5 7.3 7.2 7.1Tarentaise-X u _______ 10.2 60 8.1 7.3 7.0 6.7Charolais-X __________ 10.3 63 7.2 7.4 7.3 7.3Brown Swiss-X ___ ____ 10.4 61 7.7 7.4 7.2 7.2Pinzgauer-X __________ 10.8 60 7.4 7.4 7.2 7.1South Devon- X ___u __ 11.3 76 6.8 7.3 7.4 7.4Hereford-Angus-X _____ 11.3 76 7.3 7.3 7.3 7.3Red Poll-Xu __u u ___ 11.5 68 7.4 7.4 7.1 7.3Jersey-X __u ____ ___ __ 13.2 85 6.8 7.5 7.5 7.4
'Marbling:5 = traces,8 = slight.11 = small,14 = modest,17 = moderate.Tastepanelscores:2 = undesirable.5 =acceptable,7 = moderatelydesirable,9 = extremelydesirable.
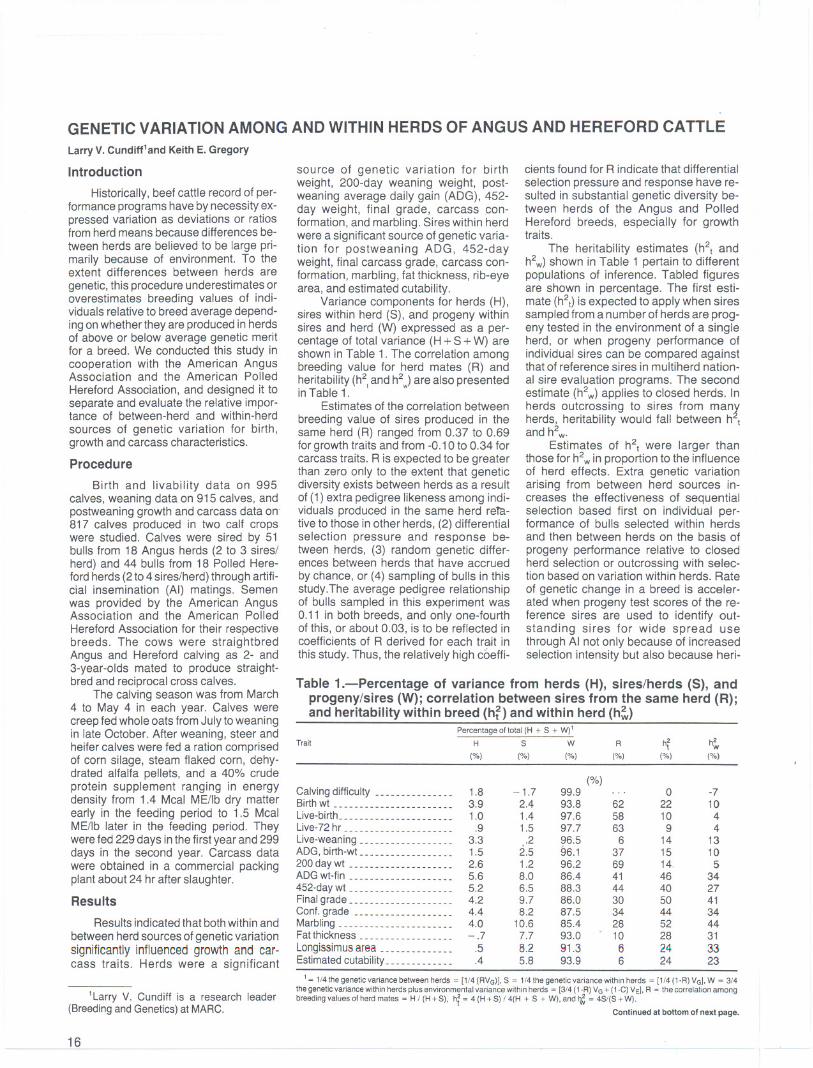
GENETIC VARIATION AMONG AND WITHIN HERDS OF ANGUS AND HEREFORD CATILELarry V. Cundiff1and Keith E. Gregory
Introduction
Historically, beef cattle record of per-formance programs have by necessity ex-pressed variation as deviations or ratiosfrom herd means because differences be-tween herds are believed to be large pri-marily because of environment. To theextent differences between herds aregenetic, this procedure underestimates oroverestimates breeding values of indi-viduals relative to breed average depend-ing on whether they are produced in herdsof above or below average genetic meritfor a breed. We conducted this study incooperation with the American AngusAssociation and the American PolledHereford Association, and designed it toseparate and evaluate the relative impor-tance of between-herd and within-herd
sources of genetic variation for birth,growth and carcass characteristics.
Procedure
Birth and livability data on 995calves, weaning data on 915 calves, andpostweaning growth and carcass data on'817 calves produced in two calf cropswere studied. Calves were sired by 51bulls from 18 Angus herds (2 to 3 sires/herd) and 44 bulls from 18 Polled Here-ford herds (2 to 4 sires/herd) through artifi-cial insemination (AI) matings. Semenwas provided by the American AngusAssociation and the American PolledHereford Association for their respectivebreeds. The cows were straightbredAngus and Hereford calving as 2- and3-year-olds mated to produce straight-bred and reciprocal cross calves.
The calving season was from March4 to May 4 in each year. Calves werecreep fed whole oats from July to weaningin late October. After weaning, steer andheifer calves were fed a ration comprisedof corn silage, steam flaked corn, dehy-drated alfalfa pellets, and a 40% crudeprotein supplement ranging in energydensity from 1.4 Mcal ME/lb dry matterearly in the feeding period to 1.5 McalME/lb later in the feeding period. Theywere fed 229 days in the first year and 299days in the second year. Carcass datawere obtained in a commercial packingplant about 24 hr after slaughter.
Results
Results indicated that both within and
between herd sources of genetic variationsignificantly influenced growth and car-cass traits. Herds were a significant
'Larry V. Cundiff is a research leader(BreedingandGenetics)at MARC.
16----
source of genetic variation for birthweight, 200-day weaning weight, post-weaning average daily gain (ADG), 452-day weight, final grade, carcass con-formation, and marbling. Sires within herdwere a significant source of genetic varia-tion for postweaning ADG, 452-dayweight, final carcass grade, carcass con-formation, marbling, fat thickness, rib-eyearea, and estimated cutability.
Variance components for herds (H),sires within herd (S), and progeny withinsires and herd (W) expressed as a per-centage of total variance (H + S + W) areshown in Table 1. The correlation amongbreeding value for herd mates (R) andheritability (h2,and h2J are also presentedin Table 1.
Estimates of the correlation betweenbreeding value of sires produced in thesame herd (R) ranged from 0.37 to 0.69for growth traits and from -0.10 to 0.34 forcarcass traits. R is expected to be greaterthan zero only to the extent that geneticdiversity exists between herds as a resultof (1) extra pedigree likeness among indi-viduals produced in the same herd reTa.-tive to those in other herds, (2) differentialselection pressure and response be-tween herds, (3) random genetic differ-ences between herds that have accruedby chance, or (4) sampling of bulls in thisstudy.The average pedigree relationshipof bulls sampled in this experiment was0.11 in both breeds, and only one-fourthof this, or about 0.03, is to be reflected incoefficients of R derived for each trait in
this study. Thus, the relatively high coeffi-
cients found for R indicate that differentialselection pressure and response have re-sulted in substantial genetic diversity be-tween herds of the Angus and PolledHereford breeds, especially for growthtraits.
The heritability estimates (h2t andh2w)shown in Table 1 pertain to differentpopulations of inference. Tabled figuresare shown in percentage. The first esti-mate (h2t) is expected to apply when siressampled from a number of herds are prog-eny tested in the environment of a singleherd, or when progeny performance ofindividual sires can be compared againstthat of reference sires in multi herd nation-al sire evaluation programs. The secondestimate (h2w) applies to closed herds. In
herds outcrossing to sires from manlherds, heritability would fall between h t
and h2w.Estimates of h2t were larger than
those for h2w in proportion to the influenceof herd effects. Extra genetic variationarising from between herd sources in-creases the effectiveness of sequentialselection based first on individual per-formance of bulls selected within herdsand then between herds on the basis ofprogeny performance relative to closedherd selection or outcrossing with selec-tion based on variation within herds. Rate
of genetic change in a breed is acceler-ated when progeny test scores of the re-ference sires are used to identify out-standing sires for wide spread usethrough AI not only because of increasedselection intensity but also because heri-
1= 1/4 the genetic variance between herds = [1/4 (RVo)], S = 1/4 the genetic variance within herds = [1/4 (1-R) Vol. W = 3/4the genetic variance within herds plus environmental variance within herds = [314 (I-R) Vo + (1-C) VEJ. R = the correlation among
breedingvaluesof herdmates = H 1(H + S). h~= 4 (H + S) 14(H + S + W), and ~ = 481(S + W).Continued at bottom of next page.
Table 1.-percentage of variance from herds (H), sires/herds (5), andprogeny/sires (W); correlation between sires from the same herd (R);and heritability within breed (h) and within herd (h)
Percentage oltotal (H + S + w) 1Trart H S W R h2 h2
t w(%) (%) (%) (%) (%) (%)
(%)
Calving difficulty _ __ __ _ _ _ _ _ __ _ _ _ 1.8 -1.7 99.9 .. . 0 -7Birthwt _______________________ 3.9 2.4 93.8 62 22 10Live-birth_ _____ _____ ____ ____ ___ 1.0 1.4 97.6 58 10 4Live-72hr ____h_________h____ .9 1.5 97.7 63 9 4Live-weaning __________________ 3.3 .2 96.5 6 14 13ADG, birth-wt ____ _ __ __ ___ _ _____ 1.5 2.5 96.1 37 15 10200 day wt ________________h __ 2.6 1.2 96.2 69 14. 5ADG wt-fin __________________h 5.6 8.0 86.4 41 46 34452-day wt __ __ ___ __ __ ___ h ____ 5.2 6.5 88.3 44 40 27Final grade _ __ ____ __h _ __ __ ____ 4.2 9.7 86.0 30 50 41Conf. grade ___________________ 4.4 8.2 87.5 34 44 34Marbling ____ __ ___ __ ___ __ ____ __ 4.0 10.6 85.4 28 52 44Fat thickness _ _ _ __ __ __ _ __ _ _ _ ___ -.7 7.7 93.0 10 28 31Longissimusarea______________ .5 8.2 91.3 6 24 33Estimated cutability _ _ _ _ _ _ _ _ _ _ _ _ _ .4 5.8 93.9 6 24 23
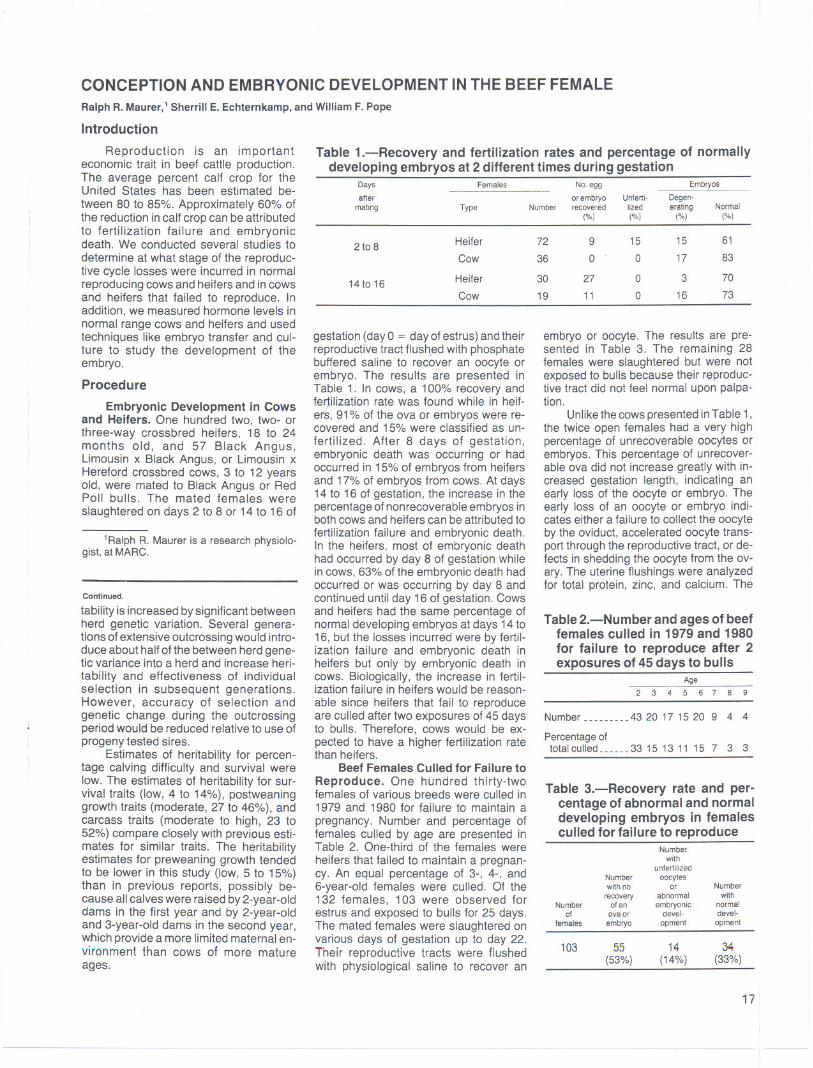
CONCEPTION AND EMBRYONIC DEVELOPMENT IN THE BEEF FEMALERalph R. Maurer,' Sherrill E. Echternkamp, and William F. Pope
Introduction
Reproduction is an importanteconomic trait in beef cattle production.The average percent calf crop for theUnited States has been estimated be-tween 80 to 85%. Approximately 60% ofthe reduction in calf cropcan be attributedto fertilization failure and embryonicdeath. We conducted several studies todetermine at what stage of the reproduc-tive cycle losses were incurred in normalreproducingcows and heifers and in cowsand heifers that failed to reproduce. Inaddition, we measured hormone levels innormal range cows and heifers and usedtechniques like embryo transfer and cul-ture to study the development of theembryo.
Procedure
Embryonic Development in Cowsand Heifers. One hundred two, two- orthree-way crossbred heifers, 18 to 24months old, and 57 Black Angus,Limousin x Black Angus, or Limousin xHereford crossbred cows, 3 to 12 yearsold, were mated to Black Angus or RedPoll bulls. The mated females wereslaughtered on days 2 to 8 or 14 to 16 of
1Ralph R. Maurer is a research physiolo-gist, at MARC.
Continued.
tability is increased by significant betweenherd genetic variation. Several genera-tions of extensive outcrossing would intro-duce about half of the between herd gene-tic variance into a herd and increase heri-tability and effectiveness of individualselection in subsequent generations.However, accuracy of selection andgenetic change during the outcrossingperiod would be reduced relative to use ofprogeny tested sires.
Estimates of heritability for percen-tage calving difficulty and survival werelow. The estimates of heritability for sur-vival traits (low, 4 to 14%), postweaninggrowth traits (moderate, 27 to 46%), andcarcass traits (moderate to high, 23 to52%) compare closely with previous esti-mates for similar traits. The heritabilityestimates for preweaning growth tendedto be lower in this study (low, 5 to 15%)than in previous reports, possibly be-cause all calves were raised by 2-year-olddams in the first year and by 2-year-oldand 3-year-old dams in the second year,which provide a more limited maternal en-vironment than cows of more matureages.
Table 1.-Recovery and fertilization rates and percentage of normallydeveloping embryos at 2 different times during gestation
gestation (day 0 = day of estrus) and theirreproductive tract flush,ed with phosphatebuffered saline to recover an oocyte orembryo. The results are presented inTable 1. In cows, a 100% recovery andfe~ilization rate was found while in heif-e(s, 91% of the ova or embryos were re-covered and 15% were classified as un-
fertilized. After 8 days of gestation,embryonic death was occurring or hadoccurred in 15% of embryos from heifersand 17% of embryos from cows. At days14 to 16 of gestation, the increase in thepercentage of nonrecoverable embryos inboth cows and heifers can be attributed tofertilization failure and embryonic death.In the heifers, most of embryonic deathhad occurred by day 8 of gestation whilein cows, 63% of the embryonic death hadoccurred or was occurring by day 8 andcontinued until day 16 of gestation. Cowsand heifers had the same percentage ofnormal developing embryos at days 14 to16, but the losses incurred were by fertil-ization failure and embryonic death inheifers but only by embryonic death incows. Biologically, the increase in fertil-ization failure in heifers would be reason-able since heifers that fail to reproduceare culled after two exposures of 45 daysto bulls. Therefore, cows would be ex-pected to have a higher fertilization rate .
than heifers.Beef Females Culled for Failure to
Reproduce. One hundred thirty-twofemales of various breeds were culled in1979 and 1980 for failure to maintain apregnancy. Number and percentage offemales culled by age are presented inTable 2. One-third of the females wereheifers that failed to maintain a pregnan-cy. An equal percentage of 3-, 4-, and6-year-old females were culled. Of the132 females, 103 were observed forestrus and exposed to bulls for 25 days.The mated females were slaughtered onvarious days of gestation up to day 22.Their reproductive tracts were flushedwith physiological saline to recover an
embryo or oocyte. The results are pre-sented in Table 3. The remaining 28females were slaughtered but were notexposedto bulls becausetheir reproduc-tive tract did not feel normal upon palpa-tion.
Unlike the cows presented in Table 1,the twice open females had a very highpercentage of unrecoverable oocytes orembryos. This percentage of unrecover-able ova did not increase greatly with in-creased gestation length, indicating anearly loss of the oocyte or embryo. Theearly loss of an oocyte or embryo indi-cates either a failure to collect the oocyteby the oviduct, accelerated oocyte trans-port through the reproductive tract, or de-fects in shedding the oocyte from the ov-ary. The uterine flushings were analyzedfor total protein, zinc, and calcium. The
Table 2.-Number and ages of beeffemales culled in 1979 and 1980for failure to reproduce after 2exposures of 45 days to bulls
Age
23456789
Number 4320171520 9 4 4
Percentage oftotal culled __ _ _ __ 33 15 13 11 15 7 3 3
Table 3.-Recovery rate and per-centage of abnormal and normaldeveloping embryos in femalesculled for failure to reproduce
17
Days Females No.egg Embryosafter orembryo Unferti. Degen-
mating Type Number recovered lized erating Normal(%) (%j (%j (%j
2t08Heifer 72 9 15 15 61
Cow 36 0 0 17 83
14to 16 Heifer 30 27 0 3 70
Cow 19 11 0 16 73
Numberwith
unfertilizedNumber oocyteswrthno or Number
recovery abnormal wrthNumber of an embryonic normal
of ova or devel- devel-females embryo opment opment
103 55 14 34(53%) (14%) (33%)
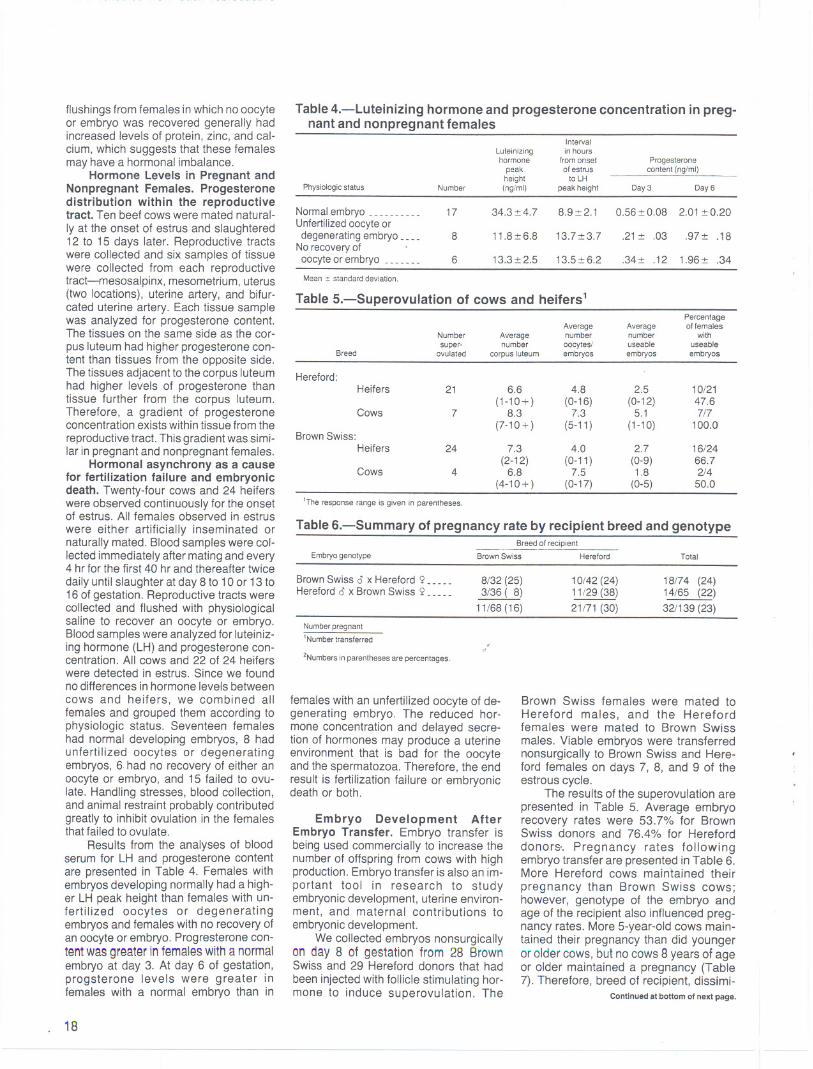
flushings from females in which no oocyteor embryo was recovered generally hadincreased levels of protein, zinc, and cal-cium, which suggests that these femalesmay have a hormonal imbalance.
Hormone Levels in Pregnant andNonpregnant Females. Progesteronedistribution within the reproductivetract. Ten beef cows were mated natural-ly at the onset of estrus and slaughtered12 to 15 days later. Reproductive tractswere collected and six samples of tissuewere collected from each reproductivetract-mesosalpinx, mesometrium, uterus(two locations), uterine artery, and bifur-cated uterine artery. Each tissue samplewas analyzed for progesterone content.The tissues on the same side as the cor-pus luteum had higher progesterone con-tent than tissues from the opposite side.The tissues adjacent to the corpus luteumhad higher levels of progesterone thantissue further from the corpus luteum.Therefore, a gradient of progesteroneconcentration exists within tissue from thereproductive tract. This gradient was simi-lar in pregnant and nonpregnant females.
Hormonal asynchrony as a causefor fertilization failure and embryonicdeath. Twenty-four cows and 24 heiferswere observed continuously for the onsetof estrus. All females observed in estruswere either artificially inseminated ornaturally mated. Blood samples were col-lected immediately after mating and every4 hr for the first 40 hr and thereafter twice
daily until slaughter at day 8 to 10 or 13 to16 of gestation. Reproductive tracts werecollected and flushed with physiologicalsaline to recover an oocyte or embryo.Blood samples were analyzed for luteiniz-ing hormone (LH) and progesterone con-centration. All cows and 22 of 24 heiferswere detected in estrus. Since we foundno differences in hormone levels betweencows and heifers, we combined allfemales and grouped them according tophysiologic status. Seventeen femaleshad normal developing embryos, 8 hadunfertilized oocytes or degeneratingembryos, 6.had no recovery of either anoocyte or embryo, and 15 failed to ovu-late. Handling stresses, blood collection,and animal restraint probably contributedgreatly to inhibit ovulation in the femalesthat failed to ovulate.
Results from the analyses of bloodserum for LH and progesterone contentare presented in Table 4. Females withembryos developing normally had a high-er LH peak height than females with un-fertilized oocytes or degeneratingembryos and females with no recovery ofan oocyte or embryo. Progresterone con-tent was greater in femaleswith a normalembryo at day 3. At day 6 of gestation,progsterone levels were greater infemales with a normal embryo than in
18
Table 4.-Luteinizing hormone and progesterone concentration in preg-nant and nonpregnant females
'The response range is given in parentheses.
Table 6.-Summary of pregnancy rate by recipient breed and genotype
Embryogenotype TotalBreedof recipient
Brown Swiss Hereford
Brown Swiss <5x Hereford 2 _ _ _ __
Hereford <5x Brown Swiss 2 __ _ __
8/32 (25)3/36 ( 8)
11/68(16)
10/42 (24)11/29 (38)
21/71 (30)
18/74 (24)14/65 (22)321139 (23)
Number pregnant
1Number transferred
2Numbersin parenthesesare percentages.
females with an unfertilized oocyte of de-generating embryo. The reduced hor-mone concentration and delayed secre-tion of hormones may produce a uterineenvironment that is bad for the oocyteand the spermatozoa. Therefore, the endresult is fertilization failure or embryonicdeath or both.
Embryo Development AfterEmbryo Transfer. Embryo transfer isbeing used commercially to increase thenumberof offspring from cows with highproduction.Embryotransfer is also an im-portant tool in research to studyembryonicdevelopment, uterine environ-ment, and maternal contributions toembryonicdevelopment.
We collected embryos nonsurgicallyon day 8 of gestationfrom 28 BrownSwiss and 29 Hereford donors that had
been injected with follicle stimulating hor-mone to induce superovulation. The
Brown Swiss females were mated toHereford males, and the Herefordfemales were mated to Brown Swissmales. Viable embryos were transferrednonsurgically to Brown Swiss and Here-ford females on days 7, 8, and 9 of theestrous cycle.
The results of the superovulation arepresented in Table 5. Average embryorecovery rates were 53.7% for BrownSwiss donors and 76.4% for Hereforddonors-. Pregnancy rates followingembryo transfer are presented in Table 6.More Hereford cows maintained theirpregnancy than Brown Swiss cows;however, genotype of the embryo andage of the recipient also influenced preg-nancy rates. More 5-year-old cows main-tained their pregnancy than did youngeror older cows, but no cows 8 years of ageor older maintained a pregnancy (Table7). Therefore, breed of recipient, dissimi-
Continued at bottom of next page.
IntervalLuteinizing in hourshormone from onset Progesterone
peak of estrus oontent (ng/ml)height toLH
Physiologicstatus Number (nglml) peak height Day 3 Day 6
Normalembryo _ _ _ _ _ _ _ _ _ _ 17 34.3:!:4.7 8.9:!:2.1 0.56:!: 0.08 2.01 :!:0.20
Unfertilized oocyte ordegeneratingembryo_ _ __ 8 11.8:!:6.8 13.7:!:3.7 .21:!: .03 .97:!: .18
No recovery ofoocyteorembryo_ _ _ _ _ _ _ 6 13.3:!:2.5 13.5:!:6.2 .34:!: .12 1.96:!: .34
Mean := standarddeviation.
Table 5.-Superovulation of cows and heifers 1
PercentageAverage Average offemales
Number Average number number withsuper. number oocytesl useable useable
Breed ovulated corpusluteum embryos embryos embryos
Hereford:Heifers 21 6.6 4.8 2.5 10/21
(1-10+) (0-16) (0-12) 47.6Cows 7 8.3 7.3 5.1 7/7
(7-10+) (5-11 ) (1-10) 100.0Brown Swiss:
Heifers 24 7.3 4.0 2.7 16/24(2-12) (0-11) (0-9) 66.7
Cows 4 6.8 7.5 1.8 214(4-10+) (0-17) (0-5) 50.0
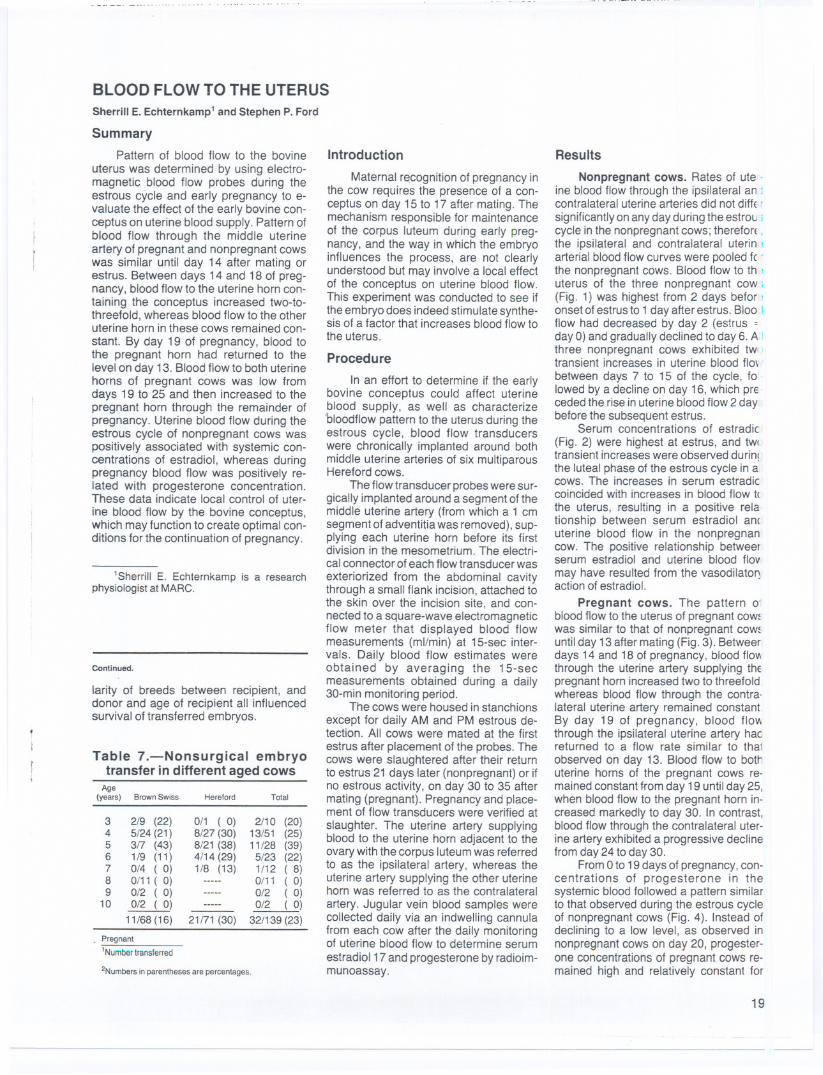
BLOOD FLOW TO THE UTERUS
Sherrill E. Echternkamp' and Stephen P. Ford
SummaryPattern of blood flow to the bovine
uterus was determined by using electro-magnetic blood flow probes during theestrous cycle and early pregnancy to e-valuate the effect of the early bovine con-ceptus on uterine blood supply. Pattern ofblood flow through the middle uterineartery of pregnant and nonpregnant cowswas similar until day 14 after mating orestrus. Between days 14 and 18 of preg-nancy, blood flow to the uterine horn con-taining the conceptus increased two-to-threefold, whereas blood flow to the otheruterine horn in these cows remained con-
stant. By day 19 of pregnancy, blood tothe pregnant horn had returned to thelevel on day 13. Blood flow to both uterinehorns of pregnant cows was low fromdays 19 to 25 and then increased to thepregnant horn through the remainder ofpregnancy. Uterine blood flow during theestrous cycle of nonpregnant cows waspositively associated with systemic con-centrations of estradiol, whereas duringpregnancy blood flow was positively re-lated with progesterone concentration.These data indicate local control of uter-ine blood flow by the bovine conceptus,which may function to create optimal con-ditions for the continuation of pregnancy.
'Sherrill E. Echternkamp is a researchphysiologist at MARC.
Continued.
larity of breeds between recipient, anddonor and age of recipient all influencedsurvival of transferred embryos.
Table 7.-Nonsurgical embryotransfer in different aged cows
Hereford Total
0/1 (0)8/27 (30)8/21 (38)4/14 (29)1/8 (13)
2/10 (20)13/51 (25)11/28 (39)5/23 (22)1/12 ( 8)0/11 (0)0/2 (0)0/2 (0)
32/139 (23)21/71 (30)
Pregnant1Number transferred
2Numbers in parentheses are percentages.
Introduction
Maternal r~cognition of pregnancy inthe cow requires the presence of a con-ceptus on day 15 to 17 after mating. Themechanism responsible for maintenanceof the corpus luteum during early preg-nancy, and the way in which the embryoinfluences the process, are not clearlyunderstood but may involve a local effectof the conceptus on uterine blood flow.This experiment was conducted to see ifthe embryo does indeed stimulate synthe-sis of a factor that increases blood flow tothe uterus.
Procedure
In an effort to determine if the earlybovine conceptus could affect uterineblood supply, as well as characterizeoloodflow pattern to the uterus during theestrous cycle, blood flow transducerswere chronically implanted around bothmiddle uterine arteries of six multiparousHereford cows.
The flow transducer probes were sur-gically implanted around a segment of themiddle uterine artery (from which a 1 emsegment of adventitia was removed), sup-plying each uterine horn before its firstdivision in the mesometrium. The electri-cal connector of each flow transducer wasexteriorized from the abdominal cavitythrough a small flank incision, attached tothe skin over the incision site, and con-nected to a square-wave electromagneticflow meter that displayed blood flowmeasurements (ml/min) at 15-sec inter-vals. Daily blood flow estimates wereobtained by averaging the 15-secmeasurements obtained during a daily30-min monitoring period.
The cows were housed in stanchionsexcept for daily AM and PM estrous de-tection. All cows were mated at the firstestrus after placement of the probes. Thecows were slaughtered after their retumto estrus 21 days later (nonpregnant) or ifno estrous activity, on day 30 to 35 aftermating (pregnant). Pregnancy and place-ment of flow transducers were verified at
slaughter. The uterine artery supplyingblood to the uterine horn adjacent to theovary with the corpus luteum was referredto as the ipsilateral artery, whereas theuterine artery supplying the other uterinehorn was referred to as the contralateralartery. Jugular vein blood samples werecollected daily via an indwelling cannulafrom each cow after the daily monitoringof uterine blood flow to determine serum
estradiol 17 and progesterone by radioim-munoassay.
----
Results
Nonpregnant cows. Rates of ute.ine blood flow through the ipsilateral an )contralateral uterine arteries did not diffE 'significantlyon anyday duringthe estrou ;cycle in the nonpregnantcows; thereforE,the ipsilateraland contralateraluterinfarterial blood flow curves were pooled f( .the nonpregnant cows. Blood flow to th !
uterus of the three nonpregnant cow,(Fig. 1) was highest from 2 days befor !
onset of estrus to 1 day after estrus. Bloo Iflow had decreased by day 2 (estrus =day 0) and gradually declined to day 6. Athree nonpregnant cows exhibited twotransient increases in uterine blood flOl
between days 7 to 15 of the cycle, folowed by a decline on day 16, which preceded the rise in uterine blood flow 2 daybefore the subsequent estrus.
Serum concentrations of estradic
(Fig. 2) were highest at estrus, and twltransient increases were observed durin!the luteal phase of the estrous cycle in acows. The increases in serum estradiccoincided with increases in blood flow tlthe uterus, resulting in a positive relationship between serum estradiol an<uterine blood flow in the nonpregnancow. The positive relationship betweerserum estradiol and uterine blood floymay have resulted from the vasodilato!,,!action of estradiol.
Pregnant cows. The pattern O'blood flow to the uterus of pregnant cow~was similar to that of nonpregnant cow~until day 13 after mating (Fig. 3). Betweerdays 14 and 18 of pregnancy, blood flo'Athrough the uterine artery supplying thepregnant horn increased two to threefoldwhereas blood flow through the contra.lateral uterine artery remained constantBy day 19 of pregnancy, blood flov.through the ipsilateral uterine artery hacreturned to a flow rate similar to thaIobserved on day 13. Blood flow to bott'uterine horns of the pregnant cows reomained constant from day 19 until day 25,when blood flow to the pregnant horn in.creased markedly to day 30. In contrast,blood flow through the contralateral uter-ine artery exhibited a progressive declinefrom day 24 to day 30.
From 0 to 19 days of pregnancy, con-centrations of progesterone in thesystemic blood followed a pattern similarto that observed during the estrous cycleof nonpregnant cows (Fig. 4). Instead ofdeclining to a low level, as observed innonpregnant cows on day 20, progester-one concentrations of pregnant cows re-mained high and relatively constant for
19
Age(years) BrownSwiss
3 2/9 (22)4 5/24 (21)5 3/7 (43)6 1/9 (11)7 0/4 ( 0)8 0/11 ( 0)9 0/2 ( 0)
10 0/2 ( 0)
11/68 (16)

25
~ 40:
oo9II) 30
...J<tii:wI- 201a::<twzii: 10WI-~
60
The results of this study indicate localcontrol of uterine blood flow by the earlybovine conceptus. Failure of the contra-lateral uterine artery to exhibit a corres-ponding increase in blood flow on days 14to 18 of pregnancy may reflect a unilateralsignal initiated by the bovine conceptusand a differential sensitivity, or both, of thetwo uterine arteries for the signal that re-duced constriction of the uterine arterysupplying the pregnant horn. Also, bloodflow to the pregnant horn of cows in-creased on the days critical for ensuringprolongation of life-span of the corpusluteum required for maintenance of preg-nancy. Thus, it appears that the concep-tus produces or stimulates uterine synthe-sis of a factor that dilates the utero-varianvasculature on the pregnant side, thuscreating optimal conditions for continuingpregnancy.
-2 0 2 4 6 8 10 12 14 16 18 20 0DAYS
Figure 1.-Pattern of blood flowto uteri of 3 nonpregnant cows through-out the estrous cycle (day 0 =estrus). Each point represents the mean~ s.e.m. of 6 uterine arteries (3 ipsilateral and 3 contralateral).
the remainder of the 3D-day monitoringperiod. As observed in the nonpregnantcows, estradiol concentrations in theblood of pregnant cows were highest atestrus followed by two transient peaksbetween days 5 and 8 and between days14 and 17 of pregnancy. Concentrationsof estradiol remained relatively constantfrom day 19 to day 30 of pregnancy.
Unlike the nonpregnant cows, noassociation could be demonstrated be-tween blood flow through the ipsilateral orcontralateral uterine arteries of pregnantcows during the first 30 days of pregnancyand systemic concentrations of estradiol.However, a positive correlation wasobserved between blood flow to the preg-nant uterine horn and systemic concen-trations of progesterone. In addition, theconcentration of progesterone in the sys-temic blood of pregnant coWs was higherthan that of nonpregnant cows from day14 to 18 after mating. Since blood concen-trations of progesterone are a reliablemeasure of luteal function and blood flowto the corpus luteum, the conceptus-induced increases in blood flow to thepregnant uterine horn may be accompa-nied by increased blood flow through thecorpus luteum, resulting in increasedsecretion of progesterone and a positiverelationship between blood flow to thepregnant uterine horn and serum pro-gesterone concentrations in the pregnantcow.
20- -
2 4 6 8 10 12 14 16 18 20 0DAYS
Figure 2.-Concentrations of progesterone (8 - - - - - 8) and estra-diol-1713(,& ,&) in systemic blood throughout the estrous cycle of 3nonpregnant cows. Each point represents the mean ~ s.e.m. Day 0 =estrus.
o
---- - --- --
3r.
LU '11 fO =,
T TT T/co- _.. I ..... _ .. . Q,
w5 2
1ft M t t 11 ;
20...Ja:: Qw
'H . l Y \/ .
0I- <tCJ) a::w I-(!) CJ)01 i '.T b " Ti Jl' 10 w
aa::a..

-4 -2 0 2 4 6 8 10 12 14 16 18 202224 26 2830DAYS
Figure 3.-Pattern of blood flow to both uterine horns of 3 cows through-out the first 30 days of pregnancy (day 0 = day of mating). Each pointrepresents the mean :t s.e.m. for 3 gravid uterine horns ( ) and3 non-gravid (A - - - - - - A) horns.
~ 1 !l~ I __11\i 1\T Tlit{ TIT~r ~~
l
lI
tt af
~ 1
f"""
1 rl\l
f
1 "'l~A1
-
j
...J
; ~ \/ \t/ 1 t¥f iff \ l"'~tttiiI\lI: ~a.
-2 0 2 4 6 8 10 12 14 16 18 20 22 24 26 28 30
DAYS
Figure4. -Concentrations of progesterone (8 - - - - - - 8) and estra-diol-1713(A A) in systemic bloodof 3cows throughoutthe first 30days of pregnancy (day 0 =day of mating). Each point represents themean :t s.e.m.
21
- - -- -
90rII.
I:s 801 I I
E
. 74 TII II!
gu..000...Ja:J
<i. 4D::W
3<tW
20IEI-::>
10

Rita C. Manak 1
EFFECT OF PREGNANCY ON DISEASE RESISTANCE
Summary
During pregnancy, the immune re-sponse of cattle has an altered potential toovercome infection than during an openperiod. Several mechanisms seem tocontrol this immune response, and theyare being currently researched.
Introduction
During pregnancy, the dam's abilityto respond to bacteria and viruses and toresist infection (its immune system) isaltered somewhat to protect the develop-ing fetus. While this system must continueto protect against infection, it must bemodulated to avoid rejecting the fetus as ifit were a growing foreign organ transplant.A disruption of this balance has impact ondam and fetal health as well as on embryosurvival. Factors responsible for this in-teraction are not clearly understood. Thepurpose of these studies was (1) toassess the ability of the dam to respond toinfectious-like agents as pregnancy pro-gresses and (2) to determine if hormonesthat change in serum concentration dur-ing pregnancy affect this response.
Methods
We obtained lymphocy1es (the cellsmediating the immune response) fromblood samples of six heifers at monthlyintervals throughout the course of gesta-tion. At the same sampling times, bloodsamples were also obtained from sixovariectomized (ovex) heifers as controlfor seasonal effects. All heifers weremixed breeds and were born the fall of1978. The intact heifers were synchro-nized and bred June 23 to 25, 1980. Thecontrol heifers were ovariectomized inApril 1980.
The lymphocy1es were assayed fortheir ability to respond to two different im-mune stimulants: Concanavalin A (Con A)and Pokeweed Mitogen (PWM). In somestudies, the response to these agents wasdetermined in the presence and absence(controls) of physiological concentrationsof estrogen, estrone, and progesterone.
Results
Table 1 summarizes the immune re-
sponsiveness of lymphocy1es from preg-nant heifers as a function of gestationalstage, compared to responsiveness ofcontrol lymphocy1es from ovex heifers.Figure 1 demonstrates the inhibitingeffect of serum factors associated with
1 Rita C. Manak is a research physiologistat MARC.
22--- ----
pregnancy on immune responsiveness oflymphocytes obtained from pregnant heif-ers. Together, these data suggest thatduring pregnancy, the potential of the im-mune response to recognize and over-come infection is heightened. However,superimposed on that $ituation is the ex-istance of soluble substances in theserum of pregnant animals, which canfurther regulate responsiveness. Thus,the immune response of pregnant ani-mals appears to be under the control ofseveral mechanisms.
To assess the role of soluble steroidhormones, which increase in the serumduring pregnancy, lymphocytes from 200-day pregnant and ovex heifers wereassayed in the presence of estrone,estrogen, and progesterone. Figure 2
shows that progesterone, estrone, and toa lesser extent, estrogen, are indeed cap-able of depressing lymphocy1e respon-siveness. Further work is in progress todefine these regulatory mechanisms andits effects on the health status of the damand her fetus.
Table 1.-Stage of pregnancy onlymphocyteresponsiveness
Response of pregnant heifers
Stageof gestation Responseof ovex heifers(%)
X 100
Prebreeding __1st Trimester __2nd Trimester3rd Trimester_ _
80130160190
COllA induced response of pregnant heifer lymphocytes_20vQx
[ 161" /wz5 12~)0-Xl-I
X".,
5 10
Figure 1.
-----STEER ~
25COllA( }'g/ml)
50
Effect of 0.5 ng/ml steroidlml on PBL response to ConA100, AVGOF 6 OVEX HEIFERS AVG OF 5 200- DAY PREGriANT HEIFERS
-IoII:I-t5(,)
lL.o"eo
PROG. ESTRONE ESTROGEN
Figure 2.
-----
PROG. ESTRONE ESTROGEN
-- - --- ----
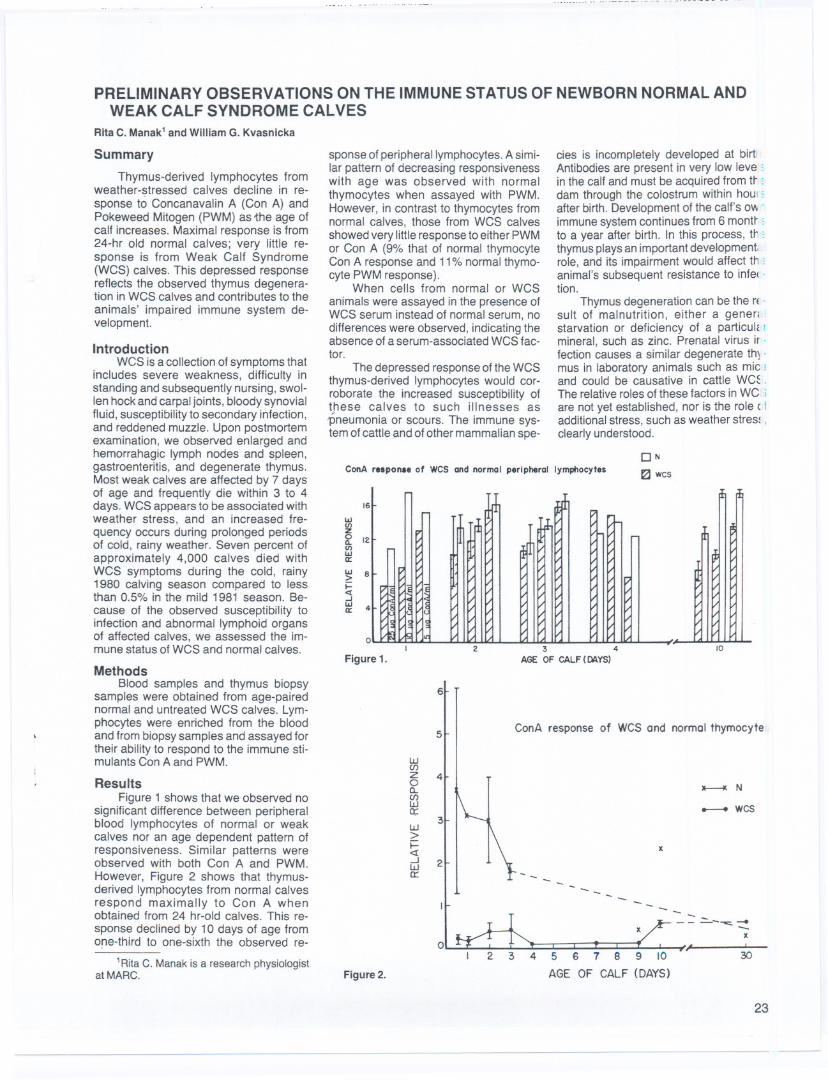
PRELIMINARY OBSERVATIONS ON THE IMMUNE STATUS OF NEWBORN NORMAL ANDWEAK CALF SYNDROME CALVES
Rita C. Manak1and WilliamG. Kvasnicka
Summary
Thymus-derived lymphocytes fromweather-stressed calves decline in re-sponse t6 Concanavalin A (Con A) andPokeweed Mitogen (PWM) as-theage ofcalf increases. Maximal response is from24-hr old normal calves; very little re-sponse is from Weak Calf Syndrome(WCS) calves. This depressed responsereflects the observed thymus degenera-tion in WCS calves and contributes to theanimals' impaired immune system de-velopment.
IntroductionWCS is a collection of symptoms that
includes severe weakness, difficulty instanding and subsequently nursing, swol-len hock and carpal joints, bloody synovialfluid, susceptibility to secondary infection,and reddened muzzle. Upon postmortemexamination, we observed enlarged andhemorrahagic lymph nodes and spleen,gastroenteritis, and degenerate thymus.Most weak calves are affected by 7 daysof age and frequently die within 3 to 4days. WCS appears to be associated withweather stress, and an increased fre-quency occurs during prolonged periodsof cold, rainy weather. Seven percent ofapproximately 4,000 calves died withWCS symptoms during the cold, rainy1980 calving season compared to lessthan 0.5% in the mild 1981 season. Be-cause of the observed susceptibility toinfection and abnormal lymphoid organsof affected calves, we assessed the im-mune status of WCS and normal calves.
MethodsBlood samples and thymus biopsy
samples were obtained from age-pairednormal and untreated WCS calves. Lym-phocytes were enriched from the bloodand from biopsy samples and assayed fortheir ability to respond to the immune sti-mulants Con A and PWM.
ResultsFigure 1 shows that we observed no
significant difference between peripheralblood lymphocytes of normal or weakcalves nor an age dependent pattern ofresponsiveness. Similar patterns wereobserved with both Con A and PWM.However, Figure 2 shows that thymus-derived lymphocytes from normal calvesrespond maximally to Con A whenobtained from 24 hr-old calves. This re-sponse declined by 10 days of age fromofle-third to one-sixth the observed re-
1RitaC. Manak is a research physiologistat MARC.
sponse of peripheral lymphocytes. A simi-lar pattern of decreasing responsivenesswith age was observed with normalthymocytes when assayed with PWM.However, in contrast to thymocytes fromnormal calves, those from WCS calvesshowed very little response to either PWMor Con A (9% that of normal thymocyteCon A response and 11% normal thymo-cyte PWM response).
When cells from normal or WCS
animals were assayed in the presence ofWCS serum instead of normal serum, nodifferences were observed, indicating theabsence of a serum-associated WCS fac-tor.
The depressed response of the WCSthymus-derived lymphocytes would cor-roborate the increased susceptibility ofthese calves to such illnesses as
.pneumonia or scours. The immune sys-tem of cattle and of other mammalian spe-
cies is incompletely developed at birtiAntibodies are present in very low leve :
in the calf and must be acquired from t~ :dam through the colostrum within houl :
after birth. Development of the calf's ov.immune system continues from 6 mont~ :to a year after birth. In this process, th :thymus plays an important development.role, and its impairment would affect th :animal's subsequent resistance to infe( .tion.
Thymus degeneration can be the rE.suit of malnutrition, either a genenstarvation or deficiency of a particulc rmineral, such as zinc. Prenatal virus ir .fection causes a similar degenerate th) .mus in laboratory animals such as mic J
and could be causative in cattle WC~.The relative roles of these factors in WC jare not yet established, nor is the role ( Iadditional stress, such as weather stres! ,clearly understood.
ON
ConA r..pon.e of WCS ond normal peripheral lymphocytes 121 wcs
2 3 4AGE OF CALF(MYSI
10
ConA response of WCSand normal thymocyte
Figure2.
- ---- - - ---
x KN
_wcs
x
- -- - - - -- - == ::,.--xx
4 5 6 7 8 9 10
AGE OF CALF (DAYS)
I30
23
16
1&1!20 12CLen1&1a:1&1 8>i=<[..J1&1 4a:
0
Figure 1.
6
5
wenz 40a..enwet:
3w>
ex:...J 2wa::

DECREASING THE POSTCAL VING ANESTROUS PERIOD IN SUCKLED BEEF HEIFERSSherrill E. Echternkamp 1
Summary
The interval from calving to firstovulation was reduced to less than 45days in 2-year-old suckled heifers byfeeding a high energy diet (ADG, 1.4-2.5Ib/day) during the postcalving period or bya single injection of exogenous gonado-tropin (2,250 IU PMSG) on day 42 post-calving. A comparison of reproductive pa-rameters for heifers on the high and lowenergy (maintenance) diets during thepostcalving period indicated that a higherpercentage of heifers on the high energydiet had ovulated by 46 days posUcalving(100 vs 0 %) and that both basal plasmaluteinizing hormone (LH) concentrationand estrogen-mediated LH release wasincreased during the early postcalvingperiod. Results of these experiments sug-gest that the level of endogenous gona-dotropin secretion may determine thelength of the postcalving anestrous periodand that plasma LH may be a useful para-meter in establishing nutrition require-ments for the postpartum lactating cow.
Introduction
Duration of the postcalving anes-trous period can be influenced by lacta-tion,nutrition,age of cow, breedof cattle,or a combination of these factors. Thedescribed experiments were conductedto determine how these factors affectovarianand pituitaryactivityin the 2-year-old suckledheifer.
Procedure
Experiment 1: Two-year-old suck-led Angus and Brown Swiss heifers, 12 ofeach breed, were treated with 750 or2,250 IU of pregnant mare serum gona-dotropin (PMSG) at 42 days postcalvingto determine (1) cause(s) of previouslyobserved breed differences in duration of
the postcalving anestrous period, and (2)the relationship between postcalving re-production. and level of milk production.Peripheral blood samples were collectedat 6-hr intervals for LH and estrogen andprogesterone measurements to assesspituitary and ovarian response respec-tively. Daily milk production for each cowwas estimated at 34, 40, and 60 dayspostcalving by the calf-weight changetechnique.
1Sherrill E. Echternkamp is a researchphysiologist at MARC.
24
The relationship among dietary ener-gy intake, ovarian follicular development,and ovarian and pituitary hormone secre-tion, during the postcalving period, wasevaluated in 36 first calf Hereford heifers(Experiment 2). Sixteen' of the heifers re-ceived a high energy diet (corn, corn si-lage, and soybean meal) during the pre-calving (last trimester) and postcalvingperiod (approximate ADG 2.6 Ib/day pre-calving and 1.6 Ib/day postcalving),whereas the remaining 20 heifers re-ceived a maintenance ration. Peripheralblood samples were collected at 3-dayintervals for LH, follicle stimulating hor-mone, prolactin, estrogen, and progester-one measurements. Heifers from bothdiets (4 high and 5 low) were ovariecto-mized at 10,28,46, and 70 days postcalv-ing to evaluate follicular development andthe occurrance of ovulation.
Results
The administration of 2,250 IUPMSGinducedovulation in all 12 heifers,whereas8 of 12 heifers receiving 750 IUPMSG had ovulated within 10 days afterthe injection (Table 1). A breed compari-son indicatedthat Brown Swiss producedmore milk (mean overall difference, 4.9Ib/day)and had a longer interval from in-jectionof2,250 IUPMSGto occurranceofthe preovulatory LH surge than Angus,which may indicate a negative rela-tionship between milk production andpituitary responsiveness. Both breedshad increased ovarian and pituitary stim-ulationwith 2,250 IU PMSG as comparedwith 750 IU.
Initiating reproduction cycles in thesuckled Hereford heifers (Experiment 2)was influenced by dietary energy intakeas 100% of the heifers on the high energydiet had ovulation by 46 days postcalving,whereas on the low energy diet (mainte-nance) 20% ovulated in the day 28 post-calving group, none in the day 46 group,and 40% in the day 70 group (Table 2).However, gross observations of folliculardevelopment at ovariectomy did not re-veal a difference in the number of follicles(grouped by size) or in mean ovarianweights. A comparison of plasma LHcon-centrations and estrogen-mediated LHsurges between the two dietary groupsindicated that the heifers on the high ener-gy diet had increased basal plasma LHconcentrations (3.3 vs 2.4 ng LH/ml plas-ma). Additional hormone analyses ofblood and follicular fluid samples are inprogress. Calf birth weight tended to beincreased by the higher energy precalvingdiet (68 vs 63Ib).
Results from these two experimentssuggest that length of the interval fromcalving to first ovulation is inversely re-lated to level of endogenous gonadotro-pin stimulation. Therefore, increased die-tary energy intake increases basel LHsecretion which, in turn, enhances ovar-ian and pituitary hormone secretion andthe spontaneous induction of ovulation.Additional experiments are being plannedto further evaluate the relationship be-tween nutrition and postpartum reproduc-tion.
Table1.-0varian and pituitaryresponse to PMSGinanestrous cows at42dayspostpartum
'Each treatment group contained 6 cows. Time interval between LHsurge and ovulation is approximately 24 h.23Significance with a column at P<O.OS.
Interval from MaximumNumber PMG to preovultory
Treatment 1 ovulating LH surge e2concentration(hours) (/ml)
750 IU of PMSG:
Angus _ __ __ _ _ _ _ _ _ _ _ 3 2 82.0:!: 12.2 238.7:!: 1.3Brown Swiss __ _____ 5 2 69.6:!: 7.0 238.3:!: 1.5
Mean_ _ _ _ _ _ _ _ _ _ _ _ 2 74.3:!: 6.2 2 38.4:!: 1.0
2,250 IU of PMSG:
Angus __ __ __ __ __ _ __ 6 3 55.0:!: 3.9 28.6:!: .7Brown Swiss _______ 6 2 68.0:!: 4.0 3 12.1:!: 1.3
Mean _ _ _ _ _ _ _ _ _ _ _ _ 2361.5:!: 3.3 2310.4:!: .9
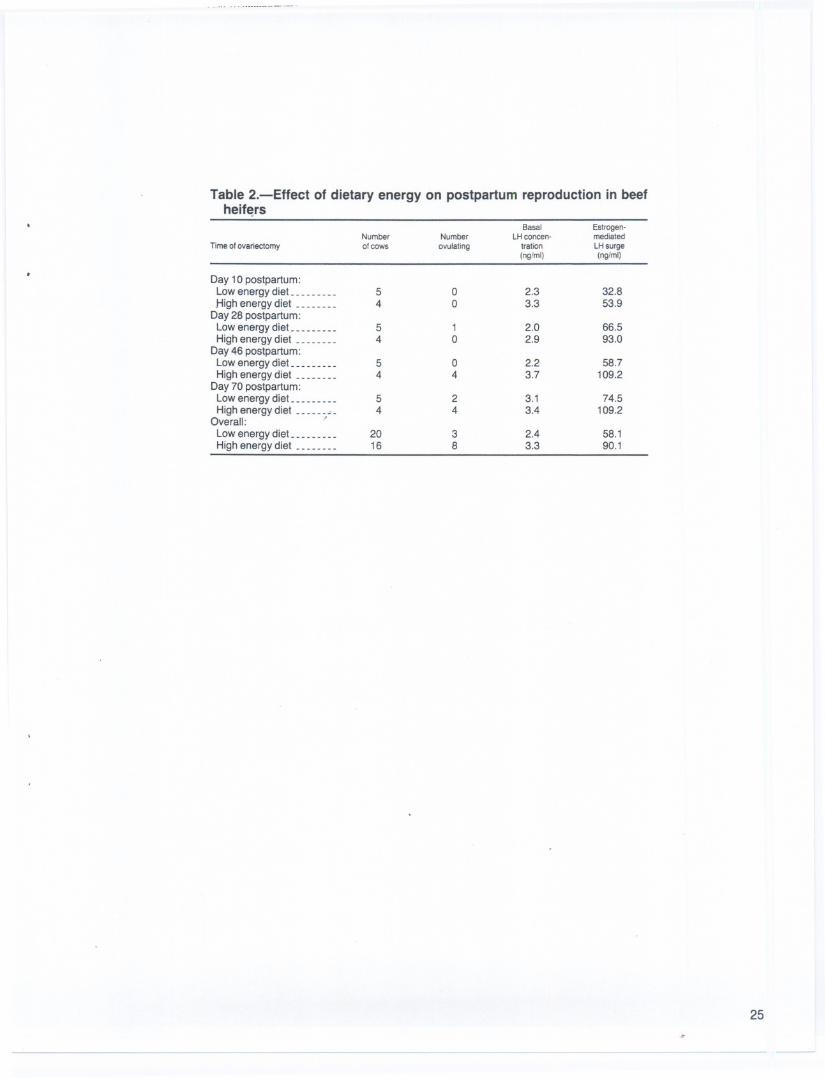
--- -- -- - -
25
---
Table 2.-Effect of dietary energy on postpartum reproduction in beefheife.rs
Basal Estrogen-Number Number LHconcen- mediated
Timeofovariectomy ofcows owlating tration LHsurge(nglml) (ngIml)
Day 10 postpartum:Low energy diet____ _____ 5 0 2.3 32.8
J-iigh energy diet ________ 4 0 3.3 53.9
Day 28 postpartum:Low energy diet _ _ _ _ _ _ ___ 5 1 2.0 66.5High energy diet ________ 4 0 2.9 93.0
Day 46 postpartum:Lowenergydiet_ _ _ _ _ _ ___ 5 0 2.2 58.7High energy diet ________ 4 4 3.7 109.2
Day 70 postpartum:Low energy dieL _ __ __ _ __ 5 2 3.1 74.5High energy diet ______"'_ 4 4 3.4 109.2
Overall: 'Low energydieL __ __ ____ 20 3 2.4 58.1High energy diet ________ 16 8 3.3 90.1
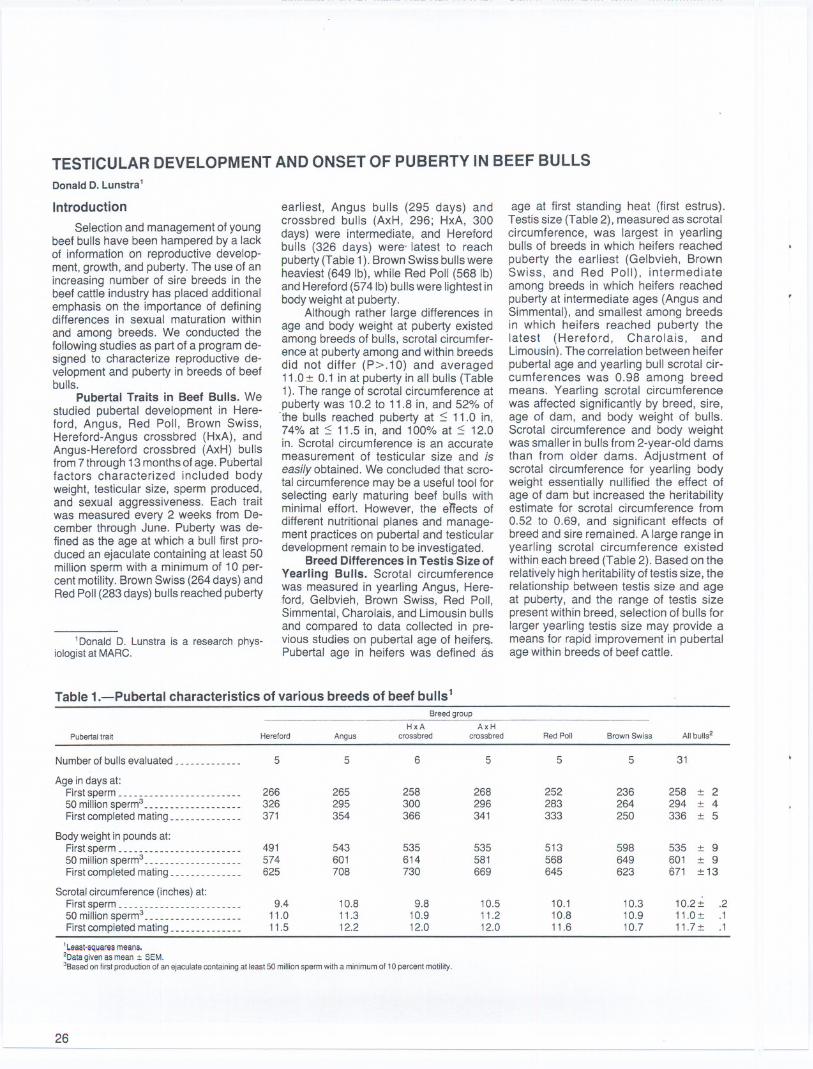
TESTICULAR DEVELOPMENT AND ONSET OF PUBERTY IN BEEF BULLSDonald D. Lunstra 1
Introduction
Selection and management of youngbeef bulls have been hampered by a lackof information on reproductive develop-ment, growth, and puberty. The use of anincreasing number of sire breeds in thebeef cattle industry has placed additionalemphasis on the importance of definingdifferences in sexual maturation withinand among breeds. We conducted thefollowing studies as part of a program de-signed to characterize reproductive de-velopment and puberty in breeds of beefbulls.
Pubertal Traits in Beef Bulls. Westudied pubertal development in Here-ford, Angus, Red Poll, Brown Swiss,Hereford-Angus crossbred (HxA), andAngus-Hereford crossbred (AxH) bullsfrom 7 through 13 months of age. Pubertalfactors characterized included bodyweight, testicular size, sperm produced,and sexual aggressiveness. Each traitwas measured every 2 weeks from De-cember through June. Puberty was de-fined as the age at which a bull first pro-duced an ejaculate containing at least 50million sperm with a minimum of 10 per-cent motility. Brown Swiss (264 days) andRed Poll (283 days) bulls reached puberty
IDonald D. Lunstra is a research phys-iologist at MARC.
earliest, Angus bulls (295 days) andcrossbred bulls (AxH, 296; HxA, 300days) were intermediate, and Herefordbulls (326 days) were' latest to reachpuberty (Table 1). Brown Swiss bulls wereheaviest (649 Ib), while Red Poll (568 Ib)and Hereford (5741b) bulls were lightest inbody weight at puberty.
Although rather large differences inage and body weight at puberty existedamong breeds of bulls, scrotal circumfer-ence at puberty among and within breedsdid not differ (P>.1 0) and averaged11.0:t 0.1 in at puberty in all bulls (Table1). The range of scrotal circumference atpuberty was 10.2 to 11.8 in, and 52% of
'the bulls reached puberty at :::: 11.0 in,74% at ::::11.5 in, and 100% at :::: 12.0in. Scrotal circumference is an accuratemeasurement of testicular size and iseasily obtained. We concluded that scro-tal circumference may be a useful tool forselecting early maturing beef bulls withminimal effort. However, the eTfects ofdifferent nutritional planes and manage-ment practices on pubertal and testiculardevelopment remain to be investigated.
Breed Differences in Testis Size ofYearling Bulls. Scrotal circumferencewas measured in yearling Angus, Here-ford, Gelbvieh, Brown Swiss, Red Poll,Simmental, Charolais, and Limousin bullsand compared to data collected in pre-vious studies on pubertal age of heifer&.Pubertal age in heifers was defined as
age at first standing heat (first estrus).Testis size (Table2), measured as scrotalcircumference, was largest in yearlingbulls of breeds in which heifers reachedpuberty the earliest (Gelbvieh, BrownSwiss, and Red Poll), intermediateamong breeds in which heifers reachedpuberty at intermediate ages (Angus andSimmental), and smallest among breedsin which heifers reached puberty thelatest (Hereford, Charolais, andLimousin).The correlation between heiferpubertal age and yearling bull scrotal cir-cumferences was 0.98 among breedmeans. Yearling scrotal circumferencewas affected significantly by breed, sire,age of dam, and body weight of bulls.Scrotal circumference and body weightwas smaller in bulls from 2-year-old damsthan from older dams. Adjustment ofscrotal circumference for yearling bodyweight essentially nullified the effect ofage of dam but increased the heritabilityestimate for scrotal circumference from0.52 to 0.69, and significant effects ofbreed and sire remained. A large range inyearling scrotal circumference existedwithin each breed (Table 2). Based on therelativelyhighheritability of testis size, therelationship between testis size and ageat puberty, and the range of testis sizepresentwithin breed, selection of bulls forlarger yearling testis size may provide ameans for rapid improvement in pubertalage within breeds of beef cattle.
26
Table 1.-Pubertal characteristics of various breeds of beef bulls 1
Breed group
HxA AxHPubertaltrait Hereford Angus crossbred crossbred Red Poll Brown Swiss All bulls2
Numberof bulls evaluated_ _ _ _ _ _.... _ __ 5 5 6 5 5 5 31
Age in days at:Firstsperm_ _____ __ _. ____..... _ ____ 266 265 258 268 252 236 258 :t 250 million sperm3. . __. _. . . __________ 326 295 300 296 283 264 294 :t 4Firstcompletedmating_ _ _ __ _ _ _ _ _ _ _ __ 371 354 366 341 333 250 336 :t 5
Bodyweight in pounds at:Firstsperm _ _ _ _ _ _ _ _ _ _ _ _ _ _ _ _ _ _ _ _ _ _ _. 491 543 535 535 513 598 535 :t 950 million sperm3. _____. _. . u . . . . ___ 574 601 614 581 568 649 601 :t 9Firstcompletedmating _ _ _ _ _ _ _ _ _ _ _ _ __ 625 708 730 669 645 623 671 :t13
Scrotalcircumference(inches)at:Firstsperm_ _ _ _ _ _ _ _ _ _ _ _ _ ___ _ _ _ _ _ _ __ 9.4 10.8 9.8 10.5 10.1 10.3 10.2:t .250 million sperm3 __ ________ __ ____. _. 11.0 11.3 10.9 11.2 10.8 10.9 11.0:t .1
Firstcompletedmating_ _ _ __ _ _ _ _ _ _ ___ 11.5 12.2 12.0 12.0 11.6 10.7 11.7:t .1
1Lot.aquaroamoana.20atagivenas mean :: SEM."Basedonfirstproductionof an ejaculatecontainingat least50millionspermwitha minimumof 10percentmotility.

-- --
Table 2.-Breed comparisons: bull testicular size versus heifer age atpuberty
BreedHeifer age at
pubert~(days)
Scrotal circumference of yearling bulls2
Average(inches)3
Range(inches)
Gelbvieh _ _ _ _ __ __ __ __ _
Brown Swiss __ _ _ _ _ __ _
Red Poll __ __ __ __ __ _ __
Angus___ _______ _____Simmental _ _ _ _ __ _ __ _ _
Hereford _ __ _ __ __ _ __ _ _
Charolais __ _ __ _ __ _ _ __
Limousin _ _ _ _ _ _ _ _ _ _ _ _ _
Average _____________Heritability ____m __ __
341:t9(81)347:t 8 (126)352:t 8 ( 95)372:t10( 24)372:t 6 (157)390:t 13 ( 27)398:t 7 (132)398:t 6 (161)368:t 3 (723)
.41
13.7:t0.2 (22)13.5:t .2 (19)13.2:t .2 (20)12.9:t .2 (79)12.9:t .3 (28)12.1:t .2 (55)12.0:t .3 (31)11.9:t .2 (20)
12.7:t.1 (274).52
11.9-16.612.2-15.611.7-14.610.3-15.110.3-15.410.3-14.210.0-14.89.6-13.5
'Least-squares means :!: standard error. Number ot heifers measured is given in parentheses. Data from Germ PlasmEvaluationProject (Cycle I, II. and III).
ZDatafrom Germ Plasm Utilization Project and adjusted to 365 days ofage.3Least-squaresmeans:!: standard error. Numberof bulls measured is given in parentheses.
---
27
---
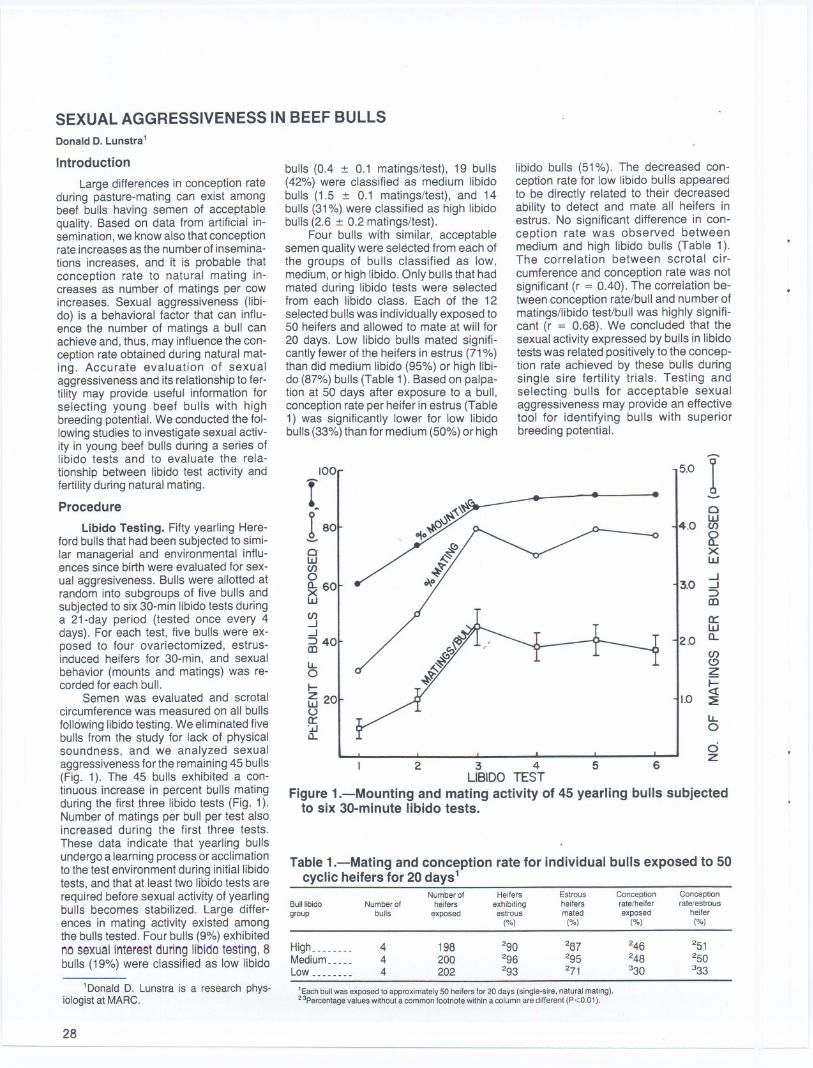
Donald D. Lunstra 1
SEXUAL AGGRESSIVENESS IN BEEF BULLS
Introduction
Large differences in conception rateduring pasture-mating can exist amongbeef bulls having semen of acceptablequality. Based on data from artificial in-semination, we know also that conceptionrate increases as the number of insemina-tions increases, and it is probable thatconception rate to natural mating in-creases as number of matings per cowincreases. Sexual aggressiveness (libi-do) is a behavioral factor that can influ-ence the number of matings a bull canachieve and, thus, may influence the con-ception rate obtained during natural mat-ing. Accurate evaluation of sexualaggressiveness and its relationship to fer-tility may provide useful information forselecting young beef bulls with highbreeding potential. We conducted the fol-lowing studies to investigate sexual activ-ity in young beef bulls during a series oflibido tests and to evaluate the rela-tionship between libido test activity andfertility during natural mating.
Procedure
Libido Testing. Fifty yearling Here-ford bulls that had been subjected to simi-lar managerial and environmental influ-ences since birth were evaluated for sex-
ual aggresiveness. Bulls were allotted atrandom into subgroups of five bulls andsubjected to six 30-min libido tests duringa 21-day period (tested once every 4days). For each test, five bulls were ex-posed to four ovariectomized, estrus-induced heifers for 30-min, and sexualbehavior (mounts and matings) was re-corded for each bull.
Semen was evaluated and scrotalcircumference was measured on all bulls
following libido testing. We eliminated fivebulls from the study for lack of physicalsoundness, and we analyzed sexualaggressiveness for the remaining 45 bulls(Fig. 1). The 45 bulls exhibited a con-tinuous increase in percent bulls matingduring the first three libido tests (Fig. 1).Numberof matings per bull per test alsoincreased during the first three tests.These data indicate that yearling bullsundergo a learning process or acclimationto the test environment during initial libidotests, and that at least two libido tests arerequired before sexual activity of yearlingbulls becomes stabilized. Large differ-ences in mating activity existed amongthe bulls tested. Four bulls (9%) exhibitednosexualinterestduringlibidotesting,8bulls (19%) were classified as low libido
1Donald D. Lunstra is a research phys-iologist at MARC.
28
bulls (0.4 :t 0.1 matings/test), 19 bulls(42%) were classified as medium libidobulls (1.5 :t 0.1 matings/test), and 14bulls (31%) were classified as high libidobulls (2.6 :t 0.2 matings/test).
Four bulls with similar, acceptablesemen quality were selected from each ofthe groups of bulls classified as low,medium, or high libido. Only bulls that hadmated during libido tests were selectedfrom each libido class. Each of the 12selected bulls was individually exposed to50 heifers and allowed to mate at will for20 days. Low libido bulls mated signifi-cantly fewer of the heifers in estrus (71%)than did medium libido (95%) or high libi-do (87%) bulls (Table 1). Based on palpa-tion at 50 days after exposure to a bull,conception rate per heifer in estrus (Table1) was significantly lower for low libidobulls (33%) than for medium (50%) or high
3 4LIBIDO TEST
Figure 1.-Mounting and mating activity of 45 yearling bulls subjectedto six 30-minute libido tests.
100
Ilaoow(/)o~ 60w(/)..J..J:) 40mIJ..o~Z 20w(,)a::'..&.1a..
2
libido bulls (51%). The decreased con-ception rate for low libido bulls appearedto be directly related to their decreasedability to detect and mate all heifers inestrus. No significant difference in con-ception rate was observed betweenmedium and high libido bulls (Table 1).The correlation between scrotal cir-cumference and conception rate was notsignificant (r = 0.40). The correlation be-tween conception rate/bull and number ofmatings/libido test/bull was highly signifi-cant (r = 0.68). We concluded that thesexual activity expressed by bulls in libidotestswas related positively to the concep-tion rate achieved by these bulls duringsingle sire fertility trials. Testing andselecting bulls for acceptable sexualaggressiveness may provide an effectivetool for identifying bulls with superiorbreeding potential.
5.0 I-cw4.0 en~xW
..J
..J:)mQ:wa..
3.0
2.0
1.0
en(.!)z
~~u..o
5 6oz
Table1.-Mating and conception rate for individual bulls exposed to 50cyclic heifers for 20 days 1
Number of Heifers Estrous Conception ConceptionBull libido Numberof heifers exhibiting heifers rate/heifer rate/estrousgroup bulls exposed estrous mated exposed heifer
(%J (%) (%) (%)
High__ __ __ __ 4 198 290 287 246 251Medium_ ____ 4 200 296 295 248 250Low _____._. 4 202 293 271 330 333
'Eachbullwasexposedtoapproximately50heifersfor20days(single-sire,naturalmating).23percentagevalueswithoutacommonfootnotewithinacolumnaredifferent(P<0.01).

PERFORMANCECHARACTERISTICSOF FEEDLOTBULLSANDSTEERS IMPLANTEDWIT.ESTRADIOL-1713
Bruce D.Schanbacher' and Ronald L.Prior
Summary
Bulls were shown to grow morerapidly (+'18%) and convert feed to liveweight gain more efficiently (22% lessfeed) when compared to steers. Whereasbulls had larger loin eye areas and yieldeda higher percentage of major retail cuts,marbling scores and quality grades weresimilar for bulls and steers. Implants con-taining estradiol-17~ dipropionate had nomajor effects on performance character-isitcs of steers but reduced the perform-ance of bulls to approximately that ofsteers. Our research shows that estradiolcan suppress performanceof feedlot bullsby inhibiting testosterone secretion fromthe testes.
Introduction
Castrating meat-producing animalshas long been a traditional practice in theUnited States. The increasing demand foranimal protein and decreasing demandfor animal fat, however, have placed re-newed emphasis on the productionpotential of intact bulls. Under most, if notall, management systems, bulls growmore rapidly, utilize feed resources moreefficiently, and produce more lean redmeat than steers. Testicular hormonesare thought to be responsible for the per-formance attributes of intact bulls; how-ever, the predominant steroid secreted bythe testis, testosterone, may not be thekey hormone in this regard. Estradiol-17~, which is secreted by the bovine testisand is produced by peripheral aromatiza-tion of testicular androgen, is a physiologi-cally potent steroid. This natural occurringestrogen, as well as such syntheticestrogens as diethylstilbestrol (DES),have been tested experimentally andused commercially to stimulate growthand improve feed utilization in beef cattle.The following study was conducted (1) todetermine the relative performance dif-ferential between bulls and steers and (2)to determine whether these two groups ofcattle respond to estradiol-17~ supple-ment.
Procedure
Forty Angus and 40 Pinzgauer xHereford crossbred bull calves, born inlate March and weaned in October, wereassigned in equal numbers to one of fourtreatment groups including (1) bulls, (2)steers, (3) bulls implanted with a Silastic
'Bruce D. Schanbacher is a researchphysiologist at MARC.
---- - - -
capsule containing estradiol.17~ dipro-pionate, and (4) steers implanted with aSilastic capsule containing estradiol-17~dipropionate. Calves were fed and main-tained by treatment in groups of five. Twoweeks after the respective treatmentswere imposed (Dec. 5), we began to col-lect data by recording initial weights.
Live weights, feed intake, testiculardiameters, and jugular blood sampleswere taken at 28 day intervals until June17, at which time all animals were taken toslaughter. Estradiol capsules were re-moved from implanted animals on April 23to insure an adequate time period for ster-iod withdrawal. Hot carcass weight andcooler data were recorded for each ani-mal.
Results
The performance characteristics ofbulls and steers, nonimplanted and im-planted, are presented in Table 1. Neithersex treatment nor estradiol treatmentaffected initial weight, whereas, bothtreatments affected (P<0.05) averagedaily gain and final weight. Feed efficien-cy differed (P<0.05) for bulls and steersbut was not affected by estradiol. Feedintake was not affected by either treat-ment. These findings confirm that bullsgrow more rapidly and gain weight moreefficiently than steers, but they providecontroversial findings regarding the pro-
posed anabolic actions expected 0estrogens in feedlot cattle.
Sex treatment had a significan'(P<0.05) influence on all carcass trait!except for adjusted backfat thickness ancmarbling scores. Bulls had heavier car.casses, larger loin eye areas, and lowelyield grade scores (Le., a greatepercentage of boneless retail cuts) tharsteers. On the other hand, reduced kid.ney-pelvic fat was associated with lowelquality grade scores.
Estradiol treatment reduced loin eyearea of bulls but not steers, whereasestradiol treatment reduced (P<0.05) thepercentage kidney-pelvic fat, marblin~score, and quality grade in both bulls ancsteers. The negative influence of estradioon carcass traits was similar to its nega.tive influence on growth rate and feecefficiency.
The effect of castration and estradioltreatment on serum concentrations 01luteinizing hormone (LH) and testoster-one are presented in Table 2. Whereasbulls are characterized by low serum LHand high serum testosterone, steers arecharacterized by the reverse: low or non-detectable serum testosterone and highserum LH. Interestingly, treatment withthe naturally occurring estrogen, estra-diol-17~, appears to block testosteronesecretion by the testes. This inhibition isaccompanied by reduced serum LH andreduced testis size. Implant removal re-
Table 1.-Effect of castration and estradiol-1713treatment on growthrate, feed utilization,and carcass traits inthe malebovine1
Bull
+ implant -imptant + implant-implant
Growth:InitialwL Jb u _
Final wI.. Jb u _
ADG ___Ib/day___
Feed data:
Dry matter intakeIb/day_ _ _
Feed efficiencyIbllb_ __
Carcass data:Hot carcass
wLJbu_ 734.7 : 14.1Kidney-pelvic faL _% 2.22: .12Backfatthickness__.in .38: .03
Marbling score2 ___ 9.1: .45Quality grade3 ____ 8.0: .34Longissimusarea2uin 13.5: .26Yield grade4 u _u _ 2.3: .14
Steer
683.6 : 13.41.99: .2
.39: .037.2: .436.5: .32
12.4: .252.5: .13
642.2 : 13.42.70: .12
.43: .039.1 : .438.5: .32
11.7: .252.8: .13
623.4 : 13.42.10: .12
.40: .037.9: .437.8: .32
11.6: .2E2.6: .13
'Cata presented as least squares means:!: standard elTOr01mean of 18 or 20 animals,2Marblingscore:slight = 7,8,9;small = 10,",12."aualny grade score: good = 7,8, 9; choice = 10,11,12.'Yield grade score: high cutabilny = '; low cutabilny = 5.
- - - - -- - - ---
Continued at bottom 01 next page.
29
550.2 : 10.6 544.5 : 10.2 528.4 : 10.1 525.8 : 10.11162.3 : 20.9 1060.8 : 19.8 1043.9 : 19.8 1008.7 : 19.8
3.12 : .09 2.64 : .09 2.64: .09 2.46 : .09
16.94: .51 16.96: .51 16.19: .51 17.69: .51
4.97: .36 5.91 : .36 6.42: .36 6.41: .36

BLOOD FLOW AND NUTRIENT UPTAKE OF THE BOVINE UTERUS AND FETUSCalvin L. Ferrell,1 Ronald L. Prior, Ronald K. Christenson, and Stephen P. Ford
Summary Table 1.-Mean metabolite concentrations and arterial-venous differ-
Basic knowledge of the nutritional ences in maternal and fetal blood1and hormonal requirements for normal Maternaldevelopment of the fetus and other gravid Metabolije UterineArteryuterine tissues is essential to establishbases from which to study factors thatmay contribute to abnormal fetal develop-ment. Despite recognition of this necessi-ty, few data are available that describeblood flow to the gravid uterus of cows.Data obtained by Ferrell and Ford (1980)indicated blood flow to the gravid uteruswas 75, 155, 154, 105 and 60 ml/min/kg at80, 140, 180, 210, and 240 days of gesta-tion. Silver and Comline (1975) reportedblood flow to be 312:t 20 mllminlkg graviduterus in cows during late gestation.Blood flow to the gravid uterus in cowswas about 14% of cardiac output, whichcompares favorably to the estimate of15.7% in sheep. The estimate obtained bySilver and Com line would represent about35% of cardiac output. It is probable thatthe estimates of Ferrell and Ford (1980)were underestimates and those of Silverand Com line (1975) were overestimatesof uterine blood flow.
Introduction
Data obtained in sheep demonstratethat glucose is a primary energy source ofgravid uterine tissues. Glucose oxidationin these and other studies representedabout 50% of fetal energy expenditures.Catabolism of amino acids to urea repre-sented about 25% of total energy expend-itures. Studies in cows indicated catabo-lism of amino acids to urea representedabout 50% of the energy available fromabsorbed glucose, but data were not
1Calvin L. Ferrell is a nutritionist at MARC.
UA-UVFetal
Umbilical Vein UM-FA
Oxygen, MM.. _________.. 6.295:t 0.040Glucose, MM _.. ________: 2.50 :t .036Lactate, MM _____________ .806:t .057a Amino nitrogen, Meq/1 ..17.11 :t .31Ureanitrogen,Meq/1____ _ 6.94 :t .16
.665:t 0.027
.132:t .011-.023:t .006.407:t .015
-.057:t .036
3.170:t 0.0671.34 :t .0232.067:t .063
35.16 :t .447.28 :t .18
1.040:t 0.054.127:t .011.174:t .002.736:t .264
-.143:t .005
'Oxygen, glucose.and lactatevalues were obtained from whole blood samples and a-amino nitrogen and urea nitrogen.Valueswere obtainedfrom plasmasamples.
available that would allow determinationof the relationship between glucose oramino acid catabolism to total energy ex-penditures. Data from sheep have de-monstrated that the utero-placental unitutilized a large portion of absorbed glu-cose and that both the uterine and fetaltissues synthesize glucose from lactateas well as from amino acids. The objec-tives of the present study were to char-acterize rate of blood flow and nutrientuptake of the bovine uterus and fetus.
Procedure
Mature (5-7 year old) Hereford cowswere obtained from the MARC herd.Cows were naturally mated to Angus bullsand breeding dates were recorded.Surgery was performed on 16 cows at171 :t 1 days post-mating. Cows wereplaced on a surgery table and mid-ventralincision was made to expose the uterus.Indwelling catheters were then placed inan artery (UA) and a vein (UV) on thesurface of the gravid uterine horn. An inci-sion was then made in the uterus and thefetus was exposed. Indwelling catheterswere then placed in a fetal femoral artery
Continued.
suited in a marked increase in serum LHin steers and a marked increase in serumtestosterone and testes size in bulls.These findings suggest that the poor per-formance of estradiol-implanted bullsmay not be a direct result of estrogen but asecondary one caused by negative influ-ences imposed by estrogen on the pitui-tary-testicular endocrine axis. Althoughthis conclusion may not necessarily re-flect the results obtainable with each and
every estrogenproposedas a growthstimulant, the findings do suggest onemechanism whereby estrogen can, infact, suppress the performance potentialof feedlot cattle.
30
Table 2.-Concentrations ofserum luteinizing hormone andtestosterone and testis dia-meters in estradiol-1713 treatedbulls and steers 1
TreatmentTestis
LH Testosterone diameter(nglml) (ng/ml) (mm)
(FA), fetal femoral vein (FV), and umbilic-al vein (UM). Beginning 2 days post-surgery, blood samples were taken fromthe UA, UV, FA, and UM catheters. Plas-ma was obtained and later analyzed forglucose, a-amino-nitrogen, and urea ni-trogen. On day 6 post-surgery, antipyrene(25g/100ml) was infused into the FVcatheter as a pulse (10ml) followed by a3.5-hr continuous infusion (0.191 Iml/min).Blood samples were taken from the UA,UV, FA, and UM catheters before infusionand at 1, 1%, 2, 2%, 3, and 3% hr after theinfusion began. Blood samples wereanalyzed for antipyrene, glucose, lactate,and oxygen immediately after collection.Uterine blood flow was estimated as RIIUV-UA and umbilical blood flow was esti-mated as RI/FA-UM, where RI was theantipyrene infusion rate and UV, UA, FA,and UM represented antipyrene concen-trations in blood from the uterine vein,uterine artery, umbilical vein, and fetalfemoral artery catheters, respectively.Uptake of each nutrient by the gravid uter-us was estimated as UA-UV concentra-tion difference times uterine blood flowand by the fetus as UM-FA concentrationdifference times umbilical blood flow.
Results
Concentrations of oxygen, glucose,lactate, a-amino-nitrogen, and urea ni-trogen (Table 1) in the uterine artery andumbilical vein indicate glucose and ox-ygen concentrations were lower in fetalthan in maternal circulation but that lac-
tate, a-amino nitrogen, and urea nitrogenwere higher in fetal circulation. The differ-ences between uterine arteriai' and uter-ine venous concentration indicate ox-ygen, glucose, and a-amino nitrogen(amino acids) were taken up by the uterusbut that lactate and urea were excreted bythe uterus into the maternal circulation.
The umbilical vein-fetal femoral arteryconcentration differences indicated a netflow of oxygen, glucose, lactate, and a-amino nitrogen from the utero-placental
Continued at bottom of next page.
Bull(-implant) 3.1:t 0.3 4.9:t 0.4 67.4:t 0.7(+ implant)2.1:t.2 .4:t.2 46.1:t 1.4
Steer(-implant) 6.4:t.3 .2:t.1(+ implant)2.1:t .1 .2:t.1
1Data presented as means :!: standard error of mean of 18or 20 animals. Data taken at the lime of implant removal. forexample. 13 months ofage.

EFFECT OF BREED AND POSTWEANING RATE OF GAIN ON ONSET OF PUBERTYAND PRODUCTIVE PERFORMANCE OF HEIFERS
Calvin L.Ferrell'
Introduction
Age at puberty is an important pro-duction tr~it in beef cattle where heifersare bred to calve at 2 years of age, espe-cially when a restricted breeding seasonis used. It is notonly important that heifersbreed and conceive, but, for maximumefficiency, they should breed and con-ceive early in the breeding season. Thus,age atpubertymay be an important selec-tion trait for identifying breeds mostsuitedfor efficient utilization of feed resources.Several researchers have demonstratedlarge differences among breed or breedcross in age at puberty of heifers. Otherresearchers have demonstrated thatundernutrition may result in increasedage at puberty, subnormal conceptionrate, and underdeveloped udders. Over-feeding, however, may result inweak heatsymptoms, subnormal conception rate,high embryonic mortality, decreasedmammary gland development, and de-
'Calvin L. Ferrell is a nutritionist at MARC
creased milk production. Thus, propernutrition during the developmental periodmay have both short and long term effectson heifer productivity. The purposes of thepresent study were to describe the effectsof breed and postweaning growth rate onthe onset of puberty, milk production, andproductivity of heifers.
Procedure
Angus (A, 68), Hereford (H, 93), RedPoll (R, 61), Brown Swiss (B, 47), Char-olais (C, 36), and Simmental (S, 90) heif-ers were used in a study designed to ev-aluate the effects of breed and postwean-ing rate of gain on the onset of pubertyand subsequent productive performance.Heifers were grouped at weaning suchthat one-third of the A, H, and R (small)baifers were fed in each of three pens aswere one third of the B, C, and S (large)heifers. One pen of heifers of each typewas fed to gain at either a low (L, 0.9Ib/day), medium (M, 1.3 Ib/day), or high(H, 1.8 Ib/day) rate. Heifer weights weredetermined at 28-day intervals through-
out the 184-day feeding period an Iperiodically thereafter. Hip height wa ;
measured. At the end ofthe 184-day feeeing period, approximately one-half eeach group of heifers was moved to pasture and one-half was kept in the feed Iethrough breeding (70 days), then movetto pasture. Puberty was evaluated b'twice daily visual observation from abou1 month post-weaning through the breeding period. All heifers were manage(under typical management conditions after breeding. Date of parturition, calf birtlweight, and survivability were evaluatedMilk production of a sample of six heifenfrom each breed and post-weaning treatment group was determined at approx.imately 50, 90, and 130 days postparturrby the weigh-suckle-weigh techniqueCow rebreeding performance and cal'weaning weight were evaluated.
Results
Heifer weight (Table 1) differedamong breeds at all times. Increased
Continued on next page.
Continued.
unit to the fetus. There was a net flow ofurea from the fetus to the utero-placentalunit, however.
Estimates of uterine and umbilicalblood flow have been presented in Table2, as well as estimates of metabolite up-take by the gravid uterus and fetus. Theseresults have been presented diagramati-cally in Figure 1. These results indicateabout 72% of the oxygen taken up by thegravid uterus was utilized by the uterusand placenta and that about 28% actuallyreached the fetus. Similarly only 17% ofthe glucose and 32% of the a-amino ni-trogen absorbed by the uterus from thematernal circulation actually reached thefetus. A relatively large portion (25%) ofthe glucose metabolized by the utero-placental tissues was converted to lac-tate. Lactate was then apparently ex-creted to both the fetal and maternal cir-culations. About 20% of the a-amino ni-trogen taken up by the fetus was ex-creted, as urea, to the utero-placental tis-sues, but only 8% of the a-amino nitrogenretained by the utero-placental tissueswas converted to urea and excreted into
the maternal circulation. These data sug-gest a rapid rate of nitrogen (or protein)retention in both fetal and uterine-
placental tissues at this stage of gesta-tion.
These data demonstrate that uterineand placental tissues utilize a major por-tion of nutrients absorbed from the mater-nal circulation. Glucose appears to be themajor energy source for these tissues at
177 days of gestation in the cow. Glucose,lactate and amino acids are major energysubstrates for the fetus. These nutrientsare 'major contributors to fetal growth aswell.
Table 2.-Blood flow and metabolite uptake of the gravid bovine uterusand fetushem Uterine Umbilical
Blood flow, ml/min __ ____________
Oxygen uptake, m mole/min _ _ _ _ _
Glucose uptake, m mole/min _ _ _ _ _
Lactate uptake, m mole/min_ _____
a Amino-nitrogen uptake, meq/minUrea-nitrogen uptake, meq/min __
6098:t 3804.06:t .16
.805:t .067-.140:t .037.248 :t .09
-.348:t .220
1094:t 591.138:t .059
.139:t .012
.190:t .024
.805:t .289-.156:t .005
MATERNAL UTERUS-PLACENTA FETUS
Figure 1.-Model of net flows of various metabolites through the gravid bovine uterus.
---
31
AMINO ACIDS2.48 meq/min .805 meq/min
GLUCOSE .805 mmole/min "\. 1.675 meq/min .139 mmole/mln\ .666 mmolelmin
UREA .348 mea/min .156 mea/min
LACTATE .140 mmole/min .190 mmole/min
OXYGEN4.06 mmoleAnin ./2£34 mmole/min 1.138mmole/min

nutrition levels postweaning resulted inincreased heifer weight and height. Thesedifferences were large immediately afterthe postweaning nutritional treatment butdecreased thereafter. No differences inheifer weight were observed, due to post-weaning nutritional treatment, at 930 daysof age (after weaning first calf), indicatingthe nutritional treatments had no long-term effects on heifer weight.
Average age at puberty for Angus,Hereford, Red Poll, Brown Swiss, Char-olais, and Simmental heifers was 409,430,359,329,390, and 351 days, respec-tively, and weight at puberty was 703,677, 456, 675, 787, and 728 lb. Heifersfed the low, medium, and high rationswere 393, 366, and 370 days of age andweighed 657, 692, and 7851b at puberty.These results demonstrated breeds differwidely in both age and weight at puberty.Breeds that have been selected for highlevels of milk production tended to reachpuberty earlier than those selected forbeef. These results also demonstratepostweaning nutrition can have a largeinfluence on both age and weight atpuberty. The low level of feeding resultedin delayed puberty, however, no advan-tage of the high level of feeding over themedium was observed.
Calf birth weight (Table 2) was influ-enced by breed but not by heifer nutrition-allevel postweaning. Milk production dif-fered among breeds and among nutrition-al treatments at 50 days postpartum(Table 3). Similar trends were observed at90 and 130 days postpartum. Calf wean-ing weight was different among breeds(Table 2) and among heifer nutritionaltreatment groups. A large portion of thenutritional treatment differences was dueto small differences in date of birth sinceall calves were weaned at a similar time.
These results demonstrate largebreed differences among breeds forgrowth, puberty, and productivity traits. Itshould be emphasized, however, that thebreed ranking for these characteristicsvaries depending on environmental andmanagement conditions. In this study, forexample, productivity favored heifershaving high levels of milk production,however, productivity of these heiferswould be expected to be less favorable onmore limiting pasture situations. Effects ofpostweaning nutrition were primarilyshort-term in nature, however, data werepresented that indicated low nutritionlevels postweaning resulted in delayedonset of first estrus and somewhat de-creased milk production. Conversely,data were presented that demonstratedthat no long-term advantages resultedfrom feeding heifers to gain 1.8 Ib/daypostweaning. In fact, the data suggestedsome detrimental effects of high post-weaning nutritional treatment.
32--- -----
'Mean weight in pounds:!: SE.'Nine Angus. 13Hereford, 2 Red Poll. 5 Charolais, and8 Simmental heifersdid notconceiveduringthe breedingseason sowere
not includedat 635 or 930 days of age.Oneadditional Red Poll, 4 BrownSwiss, and 1Charolais were removed prior to930 days ofage.
34567 6Meanswithin a main effect and columnwith different superscripts differ (P<0.05).
Table 2.-Effects of heifer breed and postweaning nutritional treatmenton calf birth date, birth weight and weaning welght1
'Mean SE.
'Twenty-four hr milk production was estimated as the differences in calf weight before and after nursing, after being penned
sefarate from the dam for 12 hr, times 2.345 76Meanswithin a main effect and columnwith different superscripts differ (P<0.05).
-- --
Table 1.-Effect of breed, postweaning nutritional treatment, and subse-quent management on heifer weight 1 2
Age(Days)Maineffect No. 198 382 403 450 550 635 930
Breed:
Angus0000_00 784432:t4 5690 :t 7 5708 :t 7 5774:t 7 4776 :t 7 4913:t9 4946:t 13Hereford_ 00 00 93 3395:t4 4624:t 7 4655 :t 7 4723 :t 7 3739 :t 7 3867:t 7 4957:t 11RedPoll 00_00 61 3397:t4 3613:t7 3646 :t 7 3706:t 9 3732 :!:9 3867:t 9 3900:!: 13BrownSwiss _ 477507:!:7 6754:t9 6778 :t 9 6862:!: 9 5904:!:951034:!:1151012:!:15Charolais00 00 36 5485<:t:7 8781 :!:9 7805:!: 9 7880:!: 11 6926:t 11 61105:t 1371195 :!:20Simmental_00 90 6494:!:4 7765 :!:7 8783 :t 7 6867:!: 7 5902:!: 7 51041:!: 7 61105:!: 11
Nutritiontreatment:Low _00___00_131454:!: 4 3628:!:4 3657 :!:4 3725:!: 7 3796:!: 7 3946:!:7 1003:t 11Mediumuuu138452:!: 4 4710:!:4 4739 :!:4 4803 :!:7 4838:!: 7 4981:!:7 1023:t 9High_________136450:!: 4 5774:!:4 5789 :t 4 5869 :t 7 5853 :!:7 5986:t7 1028:t 11
Management:Feedlot 00 00 00200 452:t 2 710:!: 4 4754 :t 4 4814:!:4 3823 :!:4 3961:!:4 1008:!: 9Pasture_0000 .205 450:!: 2 701:t. 4 3703:!: 4 3789 :t 4 4836 :t 4 4981:!:4 1028:t 9
AdjustedNumber Birth Birth Number weaning
Maineffect bom date weight weaned weight(lb) (Ib)
Breed:
Angus________________ 69 393:t 5 471:!: 1 59 3421 :t 7Hereford __ __ 00 00 _ 00 00_ 70 390 :t 5 470:!:1 62 2377:!: 7Red Poll ____00__00_00_ 61 276 :t 6 375:!: 1 52 4454:!:7BrownSwiss 00 _ 00 _ 00 00 47 277:t 7 590:!:2 35 6518:!:9Charolais 00 _ _ 00 00 _ 00 _ _ 35 4100:!:8 695:!:2 22 5485:!: 11Simmental _ _ _ 00 00 _ 00 _ _ 85 393:!:5 484:!: 1 63 6516:!:7
Nurtitional treatment:Low 00 00_ _ _ _ _ _ _ _ _ _ _ ___ 114 89:!:4 81:!: 1 94 2 3465:t 7Medium_ _ _ _ _ _ _ _ _ _ _ _ _ _ _ 125 , 84:!:4 82:!: 1 106 3472:t7
High__________________ 128 d 92:t4 80:!: 1 93 2450:!: 7
'Mean:!: SE.'345 6Meanswithina maineffectand columnwijhdifferentsuperscriptsdiffer(P<.05).
Table 3.-Effects of breed of heifer and postweanlng nutrition treatmenton milk production and calf weight1
Days postpartum
50 90 130Call Milk Calf Milk Call Milk
No. weight production weight production weight production(Ib) (Iblday) (Ib) (Iblday) (Ib) (Iblday)
Breed:
Angus _ _ _ _ _ 00 00 _ 18 4174:!: 7 418:!: 1 4267:!: 9 . 414:!: 1 4342:t 11 413:!: 1Hereford 0000____ 16 3139:!:7 313:!: 1 3210:!:9 311 :!: 1 3271 :t 11 311 :!: 1Red Poll ____0000 17 4176:t7 520:!: 1 4273:!: 9 415:!: 1 4362:!: 11 516:t 1BrownSwiss 00 00 18 6216:!:7 828 :t 1 6329:!: 7 623:!: 1 5421 :!:9 620:!: 1Charolais__ _ 00 00 17 5199:!: 7 622:!:2 5302:t 9 415:!: 1 5399:!: 11 413:!: 1Simmental ______17 5199:t 7 725:!: 1 5307 :!:9 519:!: 1 5410:!:11 517:!: 1
Nutrition treatment:Low __00000000__35 185:!:4 319:!: 1 284:!:7 15:!: 1 373:!:7 15:t1Medium_ _ _ _ _ _ _ _ _ 35 190:!:4 423:!: 1 287:!:7 17:!:1 377 :t 9 15:!: 1
High___ 00 00 _ ___ _ 33 176:t 4 320:t 1 271 :t 7 16:t1 355 :t 9 16:t1

____u ____.________
ELFAZEPAM AND SYNOVEX-S INFLUENCES ON GROWTH AND CARCASSCHARACTERISTICS OF STEERS FED TWO DIETARY ENERGY LEVELS
Ronald L. Prlor,1John D.Crouse, and Virden L. Harrison
Summary
Synovex-S improves the averagedailygain and carcass traits ofsteers andreduces losses under high fj:!ed pricelevels when compared to nonimplantedsteers. High energy diets also influenceaverage daily gain (ADG)favorably, butthey increase the amount of fat and de-crease the proteinincarcass soft tissue incomparison to lowenergy diets.
Introduction
Underpresent marketconditions,theuse of growth-promotingimplantsor feedadditives that improve gain or feed effi-ciency can be the difference betweenprofit and loss in many feeding opera-tions. Synovex-S (200 mg of progester-one and 20 mg of estradiol benzoate) im-proves ADGand feed efficiencyinsteers.
The use of stimulants in feed intakemay have desirable effects on the per-formance of growinganimals, particularlywhere voluntaryintake is not adequate toprovide sufficient net energy for gain.Alkyl-sulfonylalkyl-1-substituted benzo-diazepines have been shown to elicitfeeding in satiated animals. Voluntaryin-take is of particular concern in high-
1 Ronald L. Prior is a research chemist atMARC.
roughage diets where intake is limitedbyfill. In addition to the feeding responseelicited by Elfazepam, it has been re-ported that administering Elfazepam tosheep fed a constant amount of feed in-creased the digestibilityofthe diet.
Procedure
The objectives of this study were todetermine the effect of Elfazepam ongrowth and carcass characteristics ofsteers fed rations of two energy densitieswith corn silage as the forage base and tostudy possible interactions with Synovex-S implants. Corn silage represented81.7% of the dry matter in the low energydiets and 19.7% in the high energy diets,resulting in 5.7 and 6.8 Mcal metaboliz-able energy per pound for the two diets.Elfazepam was added to the diet to pro-vide about 8 mg/head/day. Steers werefed to 1,1221b pen mean weights. AddingElfazepam to the diet decreased rate ofgain of steers by 9% compared to controlsnot receiving Elfazepam.
Results
Steers implanted with Synovex-Shad a 27% greater ADG, a heavier hotcarcass weiQht,and less kidneyand pel-
vicfatthan nonimplantedsteers'(Table1).The trend toward a decreased qualit~grade from Synovex-S implant in thepresent experimentapproached statistic-al significance.We noted no significanttwo-way interactions between dietaryenergy level, Synovex-S implant, orElfazepamingrowthor carcass composi-tiontraits.
The effect of Synovex-S implantswas highlysignificantboth froma biolog-ical and an economic standpoint. Theseimplants made the difference betweenprofits and losses under the low feed pricelevel and reduced the losses under the
high feed price level. Although Synovex-Sresulted in similar yield grades and lowerquality grades, this lowering of steer valueper 220 Ib was offset by a 27% increase inADG. Under the low feed price level, netreturns per steer per day were $0.113higher for steers implanted with Synovex-S than for nonimplanted steers.
Ration energy level significantly influ-enced ADG. Steers fed the high energydiet had more kidney and pelvic fat andmore estimated fat and less protein incarcass soft tissue than steers fed the low
energy diet. The other carcass traits mea-sured were not significantly influenced bydietary energy levels.
Table 1.-Maln effects of Elfazepam, Synovex-S Implant, and dietary energy level on steer performance andcarcass traits1
lIem +Dietary energy level
low HighElfazepam Synovex-S implant
+
Numberof steers _ _ __ __ __ _ _ _ __ _ 00 00 _ __ __ _ 109 108 107 110 110 107Initialweight.uu lb ~__ 765.4 :!: 4.4 762.3:!: 4.4 764.9:!: 4.6 762.7:!: 4.2 765.2:!: 4.4 762.5:!: 4.4Slaughterweight lb 1119.1 :!: 7.0 1120.0 :!: 7.0 1079.1 :!: 27.3 1160.1 :!: 36.8 1135.2 :!: 37.0 1102.0 :!: 27.0Days on feed 00 134.3 :!: 24.1 144.8:!: 20.2 139.5:!: 14.7 139.5:!: 14.7 164.5:!: 20.4 115.5:!: 13.1Overallaveragedailygain_u lb u 2.79:!: 3.04 2.55:!: 2.04 2.35:!: 2.04 2.99:!: 3.04 2.31:!: 2.04 3.04:!: 3.04Hotcarcass weight u__lb 666.8 :!: 4.8 673.0:!: 4.8 674.0:!: 25.1 692.8:!: 34.8 672.8:!: 4.8 667.3:!: 5.1Adjusted fatthickness_ ___0000__.in _______ .46:!: .02 .43 :!: .02 .44 :!: .02 .44 :!: .02 .43:!: .02 .46:!: .02Longissimusarea _000000______.in2 ______ 12.2:!: .2 11.9:!: .2 12.2:!: .2 11.9:!: .2 12.0:!: .2 12.2:!: .2KidneyandpelvicfaLu u_% 2.95:!: .08 2.78:!: .08 2.99:!: 3.09 2.74:!: 2.08 2.76:!: 2.08 2.97:!: 3.08Marbling4 00 00_00_00 00_ 10.57:!: .37 10.76:!: .36 11.18:!: .42 10.16:!: .35 11.10:!: .36 10.24:!: .37Qualitygrade5 ___00_00_00___0000 00 9.45:!: .19 9.50':!: .19 9.70:!: .22 9.25:!: .18 9.61:!: .18 9.35:!: .19Yield grade 00 00 _ _ _ _ _ _ _ _ __ _ _ 00 __ __ _ _ __ 00 _ 2.94:!: .10 2.90:!: .10 2.90:!: .12 2.94:!: .10 2.93:!: .10 2.91 :!: .10
Estimated soft tissue composition %Fat_________________________________
Protein _____________________________
Moisture 00____._ 00 __0000__00 00 _ _____
35.00:!:14.30:!:50.96:!:
3.51 33.81:!: 2.51 33.90:!: .59 34.88:!: .49 33.23:!: 2.50 35.58:!: 3.522.14 14.78:!: 3.14 14.73:!: 3.16 14.36:!: 2.13 15.06:!: 3.13 14.03:!: 2.14.38 51.47:!: .38 50.89:!: .44 51.53:!: .36 51.18:!: .37 51.24:!: .39
'Data presented as least-squares means:!: standard error 01the mean. Carcass quality and oomposftion trafts were adjusted by analysis of oovariance to a hot carcass weight of 685.3 lb.2."Means within a treatment without a oommon superscript differ (P~.05)."Marbling soore: slight = 7.8. 9; small = 10,11,12.Saualitygradesoore:good = 7,8,9;choice = 10,11,12.
---
33

Calvin L.FerrellI and Thomas G. Jenkins
ENERGY UTILIZATION BY MATURE COWS
Introduction
Although considerable effort hasbeen directed toward describing nutrientrequirements for maintenance and gain ingrowing-finishing beef cattle, relatively lit-tle effort has been made to establish nu-trient requirements for these functions inmature beef cows. A high proportion (a-bout 60%) of the feed resources requiredfor beef production can be attributed tomaintenance of the cow herd, thus moreinformation is needed on the utilization of
nutrients for maintenance and gain andhow these parameters are affected bysize and type of cow.
Procedures
Twelve mature, nonpregnant, non-lactating cows of each of four types (Here-ford x Angus and Angus x Hereford,Jersey x Angus and Jersey x Hereford,Charolais x Angus, and Charolais x Here-ford, and Simmental x Angus and Sim-mental x Hereford) were selected. Thesebreed crosses were chosen to representmedium and large type cows with ability toproduce either a moderate or high level ofmilk. Cows were randomly assigned,within type, to one of three pens (12 pensof 4 cows each) and individually fed eithera low (130 kcal ME/W% daily), medium(190 kcal/W% daily), or a high (ad libitum)level. The diet consisted of corn silage(90%), soybean meal (9.1%), TM salt(0.5%), dicalcium phosphate (0.32%) and
1Calvin L. Ferrell is a nutritionist at MARC.
vitamin A, D, and E premix (0.08%) andcontained 2.53 kcal ME/kg and 12%crude protein. Cows were weighed at thebeginning of the study and at 28-day inter-vals thereafter. Cows were fed a total of
140 days beginning in ~ecember.
Results
Weights of cows of different typesand fed different levels after 0, 70, and140 days on feed are presented in Table1. Jersey cross cows weighed less initiallyand subsequently than cows of otherbreed crosses. Angus-Hereford. crosscows were heavier than Jersey crosscows but lighter than Charolais or Sim-mental cross cows. Cows fed the low andmedium rations were fed at constantlevels, based on weight, thus feed intakeswere primarily a reflection of cow weight inthese groups. Simmental cows ate morethan other types of cows, when fed adlibitum, followed by Angus-Hereford crossand Jersey cross cows. Charolais crosscows ate the least when fed ad libitum.Estimated feed requirements to maintainthe weight of Angus-Hereford cross,Jersey cross, Charolais cross, and Sim-mental cross cows were 8.6, 10.6, 6.3,and 12.81b dry feed per day, respecitvely.When expressed as kcal ME/W% daily,the values obtained were 112, 157, 85,and 154 for these types of cows, respec-tively, suggesting breed differences infeed required to maintain cow weight maybe of sufficient magnitude to be of impor-tance. Feed required to maintain weight.<5fmature cows was also estimated for each
Table 1.-Weight and daily drymatter intake of mature, non-pregnant, non lactating cows
DietItem Breed Low Medium High
(Ib) (Ib) (Ib)
Initialweight _ _ _ __ AHXCXJXSX
Weight, day 70 __ _ AHXCXJXSX
Weight, day 140 _ _ AHXCXJXSX
Daily feed intake AHXday 0-70_________ CX
JXSX
Daily feed intake AHXday 70-140 ______ CX
JXSX
115112501001118410541136893
109810301105864
1061131111138978
114712921003123711801277957
12041252134310231288
1719151814151315
118912771028134313581405116014911453142712261605
3025262926212327
half of the feeding period. These resultsindicated 191 kcal ME/W% daily was re-quired to maintain weight of cows, acrossall breed crosses, during the interval 0 to70 days, but only 112 kcal/W% daily wasrequired to maintain cow weight duringthe interval from 70 to 140 days, thus thefeed required to maintain cow weight dur-ing the winter months was substantiallyhigher (70%) than during the springmonths.
Continued on next page.
LIPID SYNTHESIS IN THE BEEF ANIMAL
Introduction
Acetate, absorbed from the gastroin-testinal tract of ruminants has historicallybeen considered the only significant pre-cursor for fat synthesis in the bovine ani-mal. Recent studies in this and other labo-ratories, however, demonstrate that lac-
tate can be converted to fats at appreci-able rates in ruminant adipose tissue inthe whole animal as well as in the labora-tory. Lactate can either be absorbed from
the gastrointestinal tract or produced byother tissues of the body for use by theadipose tissue. The only known route forconverting lactate to fatty acids is the ci-trate cleavage:malic enzyme pathway.
Ronald L. PriorI and Stephen B. Smith
Summary
Rates of in vitro fat synthesis fromacetate and lactate were compared to theactivities of enzymes thought to be in-volved in the process of lipid synthesisfrom lactate. Results of these studies indi-cate that lactate can be incorporated intofats by a pathway heretofore thought to benonfunctional in ruminants, the citratecleavage:malic enzyme pathway. Studiesof the effects of age and diet on the en-zymes of the citrate cleavage:malic en-zyme pathway support the concept of aphysiological role for this pathway in lipidsynthesis in beef cattle.
1 Ronald L. Prior is a research chemist atMARC.
34
This pathway, however, has been consid-ered to be nonfunctional in bovine adi-pose tissue because of the low activitiesof enzymes in the citrate cleavage:malicenzyme .pathway relative to thoseobserved in nonruminant adipose tissue.
We designed initial experiments todetermine whether or not key enzymes inthe citrate cleavage:malic enzyme path-way had enough activity to support ratesof lipid synthesis from lactate observed inthe laboratory. Subsequently, studieswere undertaken to determine if age anddiet could affect the activities of these en-zymes.
-- --

Table 1.-Composition of pelleteddiets1
IngredientRation2
Ration1 (high(roughage)concentrate)
Ground alfalfa hay _ _ _ _ _ _ _ _ _
Ground corn _ h _ _ _ _ _ _ _ u u
Soybean meal. __ ____ __ ___ _Calcium chloride_ ____ __ ____Trace mineralized salt _ _ _ _ __
Binder (lignin sulfate) _______Vitamins ADE2 __ __ __ ____ __
'Percent on as fed basis.2Addedto provide22.000IUA.2.200 IU D. and 220 IU E per
Ib diet.
ExperimentalProcedureExperiment 1. Samples of sub-
cutaneous adipose tissue (backfat) wereobtained by biopsy technique fromAngus-Hereford crossbred finishingsteers (1063 ::!:31 Ib) fed a high-energyration. We then analyzed samples for therate of fat synthesis from either acetate orlactate. A portion of each biopsy samplewas homogenized, and crude centrifugalfractions of the homogenates were usedfor the analysis of enzyme activities.
Experiment 2. Twenty Angus-Hereford and Red Poll steers were di-vided into two groups of 10 animals each.Both groups were initially fed a ration con-sisting of pelleted sun-cured alfalfa hay.When the steers were approximately 250days of age, one group was graduallyswitched to a pelleted 'high concentratediet (Table 1). Biopsy samples of sub-cutaneous fat were obtained every 35 to70 days, homogenized, and analyzed forenzyme activities.
Results
Experiment 1. Rates of incorpora-
tion of acetate and lactate into fatty acidsare listed in Table 2. Even though acetateis thought to be the major precursor forlipid synthesis in beef cattle, we incorpo-rated lactate into fats at rates that ex-ceeded those from acetate in both the
absence and presence of glucose. Ourresearch shows that lactate might be animportant substrate for fat synthesis inwhole animals.
Citrate cleavage enzyme, malic en-zyme, and pyruvate carboxylase activitiesare listed in Table 3. The activities of theenzymes, all of which are involved in thecitrate cleavage:malic enzyme pathway,are about one-tenth of the activitiesobserved in nonruminant adipose tissue.All three enzymes, however, exhibit suffi-cient activity to account for the rates oflipid synthesis from lactate (Table 2).
Furthermore, the activities of citrateofeavage enzyme, malic enzyme, andpyruvate carboxylase are equal to or ex-ceed that of acetyl-CoA carboxylase.Acetyl-CoA carboxylase has been shownto be involved in lipid synthesis from ace-tate and presumably is required for lipidsynthesis from lactate. Therefore, the ci-trate cleavage:malic enzyme pathwayshould not be considered nonfunctionalmerely because key enzymes in this path-way are low in the adipose tissue of beefanimals relative to those in nonruminants.
Experiment 2. As is typicallyobserved, steers fed the high-concentratediet grew at a faster rate than those on thealfalfa hay ration (Table 4). The activitiesof acetyl-CoA carboxylase, citrate cleav-age enzyme, and malic enzyme were ex-tremely low at the first biopsy. Enzyme
- -- - ---- --- - - - - -- -
Table 3.-Lipogenic enzymeacti" .ities in bovine subcutaneou ;
adipose tissue
EnzymeMaximal activ~y
(nmoVrnintgadipose tissue)
Citrate cleavage enzymeMalicenzyme _____ ___ 00
Pyruvate carboxylase _ _ _
Acetyl-CoA carboxylase
78.8 :!:: 10.1207.4 :!:: 23.5
42.4:!:: 4.954.0 :!:: 15.8
activities increased gradually until thesteers were 420 days old. Between 42Cand 489 days of age, the activities 01acetyl-CoA carboxylase and citrate cleav-age enzyme abruptly increased two- tofourfold in the alfalfa hay-fed steers andeight- to tenfold in the high concentrate-fed steers. Enzyme activities declined sig-nificantly after 540 days of age. Malic en-zyme activity doubled in the alfalfa hay-fed steers and tripled in the high concen-trate-fed steers between 315 and 350
days of age. After 420 days of age, malicenzyme activity remained constant in thealfalfa hay-fed steers but had doubled inthe high concentrate-fed steers by 489days of age. The data indicate that theactivities of lipogenic enzymes are not in-fluenced by diet in beef cattle until theanimals reach a specific age, correspond-ing to the time at which enzyme activitiesare increasing independently of dietaryregime. Furthermore, citrate cleavage en-zyme and malic enzyme responded tochanges in age and diet in the same man-ner as acetyl-CoA carboxylase, support-ing the concept of functional, biologicallyimportant, citrate cleavage:malic enzymepathway.
35
- - -
Table 4.-Effect of age and diet on lipogenic enzyme activitiesAverage Enzymeactivies (nmol/minlgadiposetissue)
Treatment age Weight Pv;(;(JA Crate cleavage Malicgroup (days) (Ib) cart>oxytase enzyme enzyme
(lb)
Table 2.-Acetate and lactate in- I ___h_uu_ 280 575 :!::16 1.8 :!::0.9 2.6 :!::0.7 21.9 :!::1.9
corporated into fatty acids in"_0000_00--- 534 :!:: 13 1.9 :!:: 1.1 1.9 :!:: .7 21.1 :!:: 3.410000_____00 3)5 640 :!:: 19 4.7 :!:: 1.9 1.8 :!:: .2 31.5 :!:: 4.3
bovine subcutaneous adipose "_00--___00- 595 :!:: 12 8.9 :!:: 2.2 2.3 :!:: .3 29.3 :!:: 4.4tissue I ___hU_U_ 350 704 :!:: 23 8.0 :!:: 1.3 6.7 :!:: .7 61.1 :!:: 6.5
Incorporationrates"___uu__h 667 :!:: 14 18.4 :!:: 4.0 15.9 :!:: 4.9 98.9 :!::19.2
Substrates' (nmol/minperg 10000_00____ 420 818 :!:: 27 22.8 :!:: 5.3 12.0 :!:: 2.4 91.5 :!::19.3adiposetissue) 1I_____h____ 813 :!:: 22 16.0 :!:: 4.6 18.7 :!:: 5.2 107.4 :!::22.2
I _h__h____ 490 928 :!:: 28 48.5 :!::13.6 45.6 :!::13.5 81.1 :!::19.710mMAcetate ______h_ 8.2 :!:: 2.5 "_u_hu_u 964 :!:: 32 129.1 :!::47.9 '197.9 :!::44.2 '181.1 :!::29.8
plus 2mM Glucose ____ 30.2 :!:: 6.3 100_00___00_ 542 1023 :!:: 28 73.9 :!::16.6 47.8 :!::13.3 105.7 :!::15.710 mM Lactate __u __ h_ 33.3 :!:: 6.5 1100 00 __ __ _ 00 1080 :!:: 40 '156.0 :!::21.1 '149.6 :!::36.7 '214.9 :!::23.8
plus 2 mM Glucose_ ___ 47.5 :!:: 6.3 1____0000___ 574 1084 :!:: 30 65.1 :!:: 8.6 28.5 :!:: 7.3 80.2 :!::11.4
'flasks that containedglucose also contained33 mu/mlof11_____00---- 1150 :!:: 44 '95.7 :!::10.9 '90.1 :!:: 8.3 '233.0 :!::24.2
insulin. 'Significantlygreaterthan TreatmentIvalue(P<O.05;Student'st-test).
100 9.7178.69
5.051.10
.455.00+-
100.00

CHEMICAL COMPOSITIONOF CARCASSES FROM HEREFORD, LlMOUSIN, AND SIM-MENTAL CROSSBRED CATTLE AS RELATED TO GROWTH AND MEAT PALATABILITY
John D. Crouse' and Michael E. Dikeman
Summary
Nine Hereford x Angus (HxA), nineSimmental x Angus (SxA), and nineLimousin x Angus (LxA) crossbred steerswere slaughtered in three equal groups(three from each breed) after 200, 242,and 284 days on feed to evaluate carcasschemical composition differences andtheir relation to growth and meat palatabil-ity.
LxA carcasses were higher in proteinand retail product percentages and signif-icantly lower in chemical fat and fat trimpercentages than either SxA or HxA car-casses. SxA carcasses were superior toHxA carcasses only in having a lower per-centage of fat trim.
SxA steers gained slightly faster inthe feedlot than HxA and LxA steers. SxAand LxA steers were equal in weight ofretail product produced per day of ageand superior to HxA steers. HxA and SxAcarcasses were similar in rib eye fat per-centages and final quality grades, andthey had higher values than LxA carcas-ses for these characteristics.
Correlation coefficients between car-cass chemical composition and palatabil-ity traits were low and inconsistent. Cor-relations between carcass chemical com-position and growth rate were also lowand inconsistent. In addition, linear re-gression coefficients indicated little or noassociation between carcass chemical
composition and growth rate or palatabil-ity.
Introduction
Several breeds of cattle recentlywere introduced into North America asgerm plasm resources to increase growthrate and proportion of muscle to fat whencompared with traditional British beefbreeds. Little research has been reportedevaluating carcass composition on thesenewly introduced breeds under beef pro-duction and feeding systems used in theUnited States, and none has involved re-lationships between carcass composi-tion, growth rate, and palatability traits.
This study was conducted to evalu-ate carcass composition differences ofcrossbred steer carcasses representingthree breed types and to relate carcasscomposition to growth rate and meat pala-tability.
'John D. Crouse is a meat scientist atMARC.
36
Experimental Procedure
Nine Hereford x Angus (HxA), nineSimmental x Angus (SxA), and nineLimousin x Angus (LxA) steers wereobtained by mating Hereford, Simmental,and Limousin bulls to Angus females of acommon genetic base. After weaning, thesteers were fed a 71 % TDN ration (90%dry matter basis). They were slaughteredin three equal groups (three from eachbreed) after an average of 200, 242, and284 days on feed.
After carcasses were chilled approx-imately 24 hr, quality grades and yieldgrades were determined. The carcasseswere transported to Kansas State Uni-versity, where the right sides were fabri-cated into trimmed retail cuts leaving 0.3in fat cover. All cuts were boneless andlean was trimmed to contain approximate-ly 25% fat. Retail product was the total ofroasts, steaks, and adjusted lean trim.
Steaks 1.25 in thick were cut froll'l theright wholesale rib at the 12th, 11th, and10th rib locations. The rib eye musclefrom the 12th rib steak was stored at -20°Fand later analyzed for intramuscular fatcontent. The 10th and 11th rib steakswere also frozen; later they were thawedovernight at 38°F, cooked at 350°F in apreheated rotary oven to an internaltemperature of 150°F, and allowed to coolat room temperature about 30 min. Six 0.5in cores were removed from each 11th ribsteak and were subjected to the Warner-Bratzler shear test. Cores removed simj...larly from the 10th rib steak were served foa six-member taste panel who scoredthem for tenderness, juiciness, flavor, andoverall acceptability on a 9-point hedonicscale.
The left side of each carcass wasseparated into bone and lean plus fat por-tions (includes kidney and pelvic fat). The
Table 1.-Least squares means
lean plus fat portion was thoroughlyground, mixed, and sampled in triplicatefor determining carcass percentages ofmoisture, chemical fat, and protein.
Results And Discussion
Means for percentages of carcasschemical fat, protein, moisture, retail pro-duct, and fat trim are presented in Table 1.LxA carcasses had lower percentages ofchemical fat and fat trim, and higher per-centages of protein, moisture, and retailproduct than SxA or HxA carcasses.Chemical fat, protein, moisture and retailproduct percentages of SxA were not dif-ferent from those of HxA carcasses.However, SxA carcasses had less fat trimwhen fabricated into retail cuts. ·
There were no carcass compositiondifferences between the first and secondslaughter groups. However, carcasses inthe third slaughter group had more chem-ical and trimmable fat, and less protein,moisture, and retail product than either ofthe other groups. One would have ex-pected steers in the second slaughtergroup, on feed 42 days longer than thosein the first group, to have more fat and lesslean than those in the first group. Thestudy revealed no significant breed xslaughter group interactions for traitsstudied.
Differences among breeds in aver-age daily gain were not considered largeenough to be of importance with the num-ber of cattle sampled (Table 2). SxA andLxA steers were equal in pounds of retailproduct produced per day of age, andboth were superior to HxA steers.Although LxA carcasses had higher per-centages of retail product than SxA, theywere not superior in retail product per dayof age because they had lighter slaughterweights at similar ages.
Item
Carcasschemical Carcass Carcass Retail Fat
fat protein moisture product trim('Yo) (%) ('Yo) (%) (%)
Breed: CARCASSCOMPOSITIONDATAHxA m 38.51 13.27 47.15 65.07 23.19SxA m 35.89 13.95 49.10 67.32 20.05LxA m___m 31.16 15.35 52.51 72.18 15.63
Average 35.19 14.19 49.59 68.19 19.62Slaughter
group:L mu_m 33.69
2__ _ _ __ __ _ _ __ _ __ _ 33.31
3 m m 38.57
14.58 51.11 69.02 18.0314.70 50.50 69.80 17.9813.29 47.15 65.74 22.87
'High Good = g. low choice = , O. etcetera.
RetailRib product
Final Quali eye perdayAOG weight grade fat ofage(Ib) (Ib) (%) (Ib)
GROWTHANOCARCASSTRAITS
2.6 1075 9.67 6.36 0.902.8 1145 9.55 6.27 .992.6 1046 8.33 4.10 1.012.7 1088 9.18 5.58 .97
2.8 1022 9.00 4.49 .992.6 1048 9.11 5.95 .972.5 1093 9.44 6.30 .97
Continued at bottom of next page.

EVALUATION OF TRAITS IN THE USDA YIELD GRADE EQUATION FOR PREDICTING BEEFCARCASS CUTABILITY IN BREED GROUPS DIFFERING IN GROWTH AND FATTENINGCHARACTERISTICS
John D.Crouse'
Summary
Carcasses of 786 steers derived
from crosses of Hereford or Angus cowsbred to Hereford, Angus, Oharolais,Limousin, Simmental, South Devon, andJersey sires were fabricated into closelytrimmed, semi-boneless retail cuts tostudy relationships among independentvariables in the USDA yield grade equa-tion in breed groups that differ in growthand fattening characteristics.
Simple correlations indicate carcassweight was a good predictor of cutabilitywithin a breed group but a poor indicatorover all breed groups. Rib eye area hadthe lowest predictive value of the four vari-ables studied. Rib eye area may be moreuseful in populations of similar weightthan in those varying widely in weight. Fatthickness at the 12th rib was the mostuseful predictor of cutability and is aboutequally useful within or over all breedgroups. Percentage of kidney and pelvicfat, though lower in predictive value than12th rib fat thickness, was useful within orover breed groups. Partial regressioncoefficients computed within each breedgroup were relatively similar though there
'John D. Crouse is a meat scientist atMARC.
were significant differences in interceptvalues for the different breed groups. Useof a single prediction equation for allbreed groups would rank animals wellwithin a breed group.
Introduction
Accurate, reliable predictors of car-cass cutability are needed by the beefcattle industry for marketing, progenytesting, and research programs. To havewidespread application, the proceduremust be rapid, inexpensive, and applic-able under diverse management condi-tions and must lend itself to a broad baseof genetic types.
Numerous equations for estimatingpercentage of carcass cutability have~een developed independently on car-casses derived from British beef, dairy,and Brahman breeding. The presentUSDA (1965) yield grade equation forestimating percentage closely trimmed,boneless round, loin, rib, and chuck wasderived from the regression equation byMurhpey et al. (1960) and has beentested on independent populations ofbeef carcasses. Although the rela-tionships in the independent populationsdiffered from that of the original popula-tion, the variables used in the yield grade
equation appear to be the most accept.able among those reported when accura.cy, rapidity, and expense are considered.
The objective of this investigatiorwas to study the relationships among vari.abies found in the multiple regressiorequation by Murphey et al. (1960) whenapplied to carcass beef derived fromsome of the newly introduced breedsbeing used in the United States.
Data for this study were obtainedfrom 786 steer calves born in 1970 and
1971 as part of a cattle germ plasm eval-uation program. Hereford and Anguscows were mated to Hereford, Angus,Charolais, Limousin, Simmental, SouthDevon, and Jersey sires by artificial in-semination. A range in length of feedingperiod was provided by stratifying calvesin sire breed groups by age and assigningthem to one of three slaughter groupseach year (215, 243, and 271 days post-weaning for 1970, and 200, 242, and 284days postweaning for 1971 calves).Therefore, animals within sire breedgroups varied slightly in age and in timeon feed, but average age and time on feedwas similar between breed groups.
Steers were slaughtered at a com-mercial packing plant. Yield and quality
Continued on next pege.
Continued.
Table 2.-Least squares means forrib eye palatability traits
"em
Taste TasteWarner- panel panel TasteBratzler tender. juici- panelshear. ness' ness' flavor'
(Ib)
--
HxA and SxA carcasses had similar
quality grades and percentages of rib eyefat even though SxA carcasses had lessfat trim:LxA carcasses were lower in qual-ity grade and had less rib eye fat as ex-pected because they had less total car-cassfat.
Neither breed nor slaughter groupsignificantly affected Warner-Bratzlershear force or taste panel palatabilityscores (Table 3). Even though LxA car-casses graded lower and had less rib eyefat than HxA or SxA, LxA shear valuesand taste panel scores were not differentform SxA and HxA values.
Correlations indicated that averagedaily gain (ADG) was not associated withprotein, moisture, or fat composition of thecarcass. Additionally, chemical composi-tion of the carcass was not correlated withtaste panel scores or Warner-Bratzlershear values. However, fatter carcassesand those with higher percentages of ribeye fat tended to have higher taste panel
--------
juiciness and overall acceptability scores(correlations ranged from 0.20 to 0.35).Results in our study indicate that carcassfat and rib eye fat are unsatisfactory in-dicators of palatability.
Linear regression indicated in-creased carcass protein percentageswere not associated with higher feedlotADG. This fact is supported by means forprotein and ADG for the three breedtypes. Each 1% increase in carcass pro-tein was associated with 49 Ib lower liveweight. Retail product percentage in-creased 3.06% for each 1% increase incarcass protein.
Rib eye chemical fat increased0.27% for each 1% increase in carcasschemical fat. The regression coefficientsfor taste panel flavor, juiciness, andtendemess scores on carcass chemicalfat were 0, 0.04 and 0.01, respectively,indicating that increased carcass fatnessdid not result in any measurable increasein palatability.
37
-----
Breed:HxAm u m u _ 6.7 7.56 7.24 7.46SxAu u. u u u 8.0 7.31 7.49 7.59LxA 8.7 6.83 6.79 7.59
Average. u u 7.8 7.23 7.17 7.55
Slaughter group:1 __ n n. n n u 7.5 7.33 6.86 7.482 u. _n n. n u 6.8 7.50 7.28 7.58
? __._mnm_ 9.1 6.88 7.38 7.59
'Scoreof1 = extremelyundesirable,9 = extremelydesir.able.
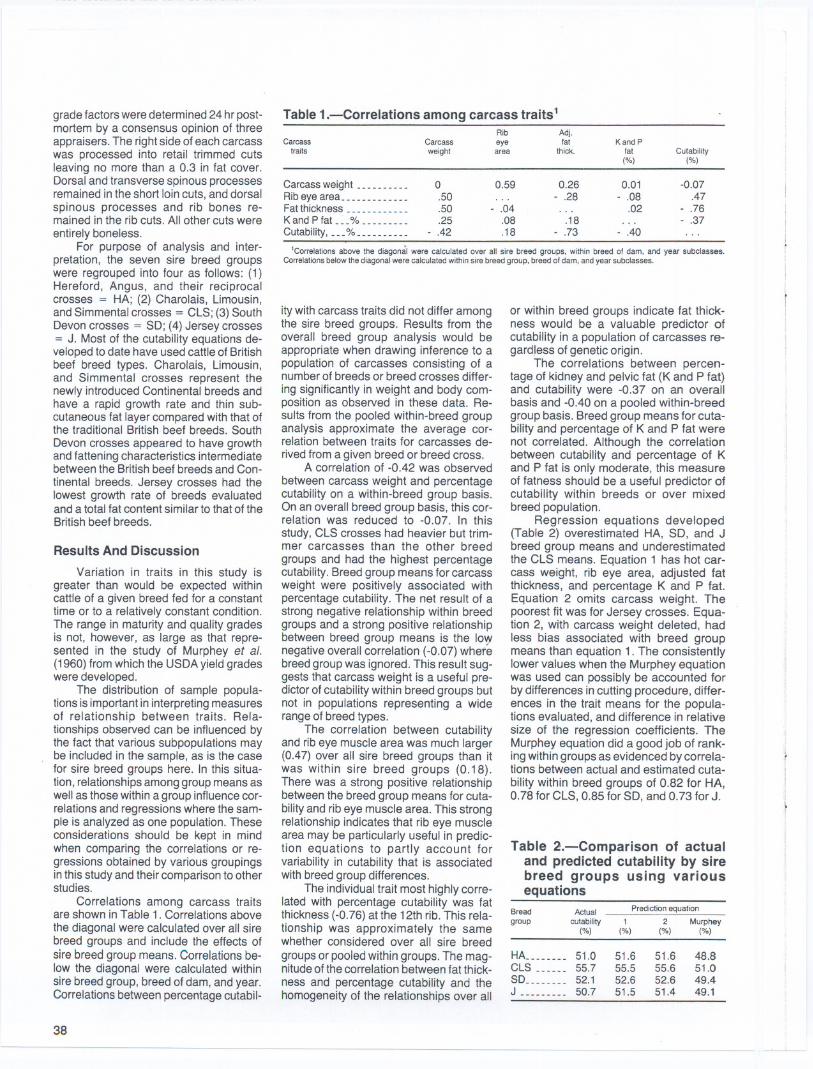
grade factors were determined 24 hr post-mortem by a consensus opinion of threeappraisers. The right side of each carcasswas processed into retail trimmed cutsleaving no more than a 0.3 in fat cover.Dorsal and transverse spinous processesremained in the short loin cuts, and dorsalspinous processes and rib bones re-mained in the rib cuts. All other cuts wereentirely boneless.
For purpose of analysis and inter-pretation, the seven sire breed groupswere regrouped into four as follows: (1)Hereford, Angus, and their reciprocalcrosses = HA; (2) Charolais, Limousin,and Simmental crosses = CLS; (3) SouthDevon crosses = SO; (4) Jersey crosses= J. Most of the cutability equations de-veloped to date have used cattle of Britishbeef breed types. Charolais, Limousin,and Simmental crosses represent thenewly introduced Continental breeds andhave a rapid growth rate and thin sub-cutaneous fat layer compared with that ofthe traditional British beef breeds. SouthDevon crosses appeared to have growthand fattening characteristics intermediatebetween the British beef breeds and Con-tinental breeds. Jersey crosses had thelowest growth rate of breeds evaluatedand a total fat content similar to that of theBritish beef breeds.
Results And Discussion
Variation in traits in this study isgreater than would be expected withincattle of a given breed fed for a constanttime or to a relatively constant condition.The range in maturity and quality gradesis not, however, as large as that repre-sented in the study of Murphey et al.(1960) from which the USDA yield gradeswere developed.
The distribution of sample popula-tions is important in interpreting measuresof relationship between traits. Rela-tionships observed can be influenced bythe fact that various subpopulations maybe included in the sample, as is the casefor sire breed groups here. In this situa-tion, relationships among group means aswell as those within a group influence cor-relations and regressions where the sam-ple is analyzed as one population. Theseconsiderations should be kept in mindwhen comparing the correlations or re-gressions obtained by various groupingsin this study and their comparison to otherstudies.
Correlations among carcass traitsare shown in Table 1. Correlations abovethe diagonal were calculated over all sirebreed groups and include the effects ofsire breed group means. Correlations be-low the diagonal were calculated withinsire breed group, breed of dam, and year.Correlations between percentage cutabil-
38---
'Correlations above the diagonlii were calculated over all sire breed groups. within breed of dam, and year subclasses.Correlationsbelow thediagonal were calculatedwithin sire breed group, breed of dam, and year subclasses.
ity with carcass traits did not differ amongthe sire breed groups. Results from theoverall breed group analysis would beappropriate when drawing inference to apopulation of carcasses consisting of anumber of breeds or breed crosses differ-
ing significantly in weight and body com-position as observed in these data. Re-sults from the pooled within-breed groupanalysis approximate the average cor-relation between traits for carcasses de-rived from a given breed or breed cross.
A correlation of -0.42 was observed
between carcass weight and percentagecutability on a within-breed group basis.On an overall breed group basis, this cor-relation was reduced to -0.07. In thisstudy, CLS crosses had heavier but trim-mer carcasses than the other breedgroups and had the highest percentagecutability. Breed group means for carcassweight were positively associated withpercentage cutability. The net result of astrong negative relationship within breedgroups and a strong positive relationshipbetween breed group means is the lo~negative overall correlation (-0.07) whetebreed group was ignored. This result sug-gests that carcass weight is a useful pre-dictor of cutability within breed groups butnot in populations representing a widerange of breed types.
The correlation between cut abilityand rib eye muscle area was much larger(0.47) over all sire breed groups than itwas within sire breed groups (0.18).There was a strong positive relationshipbetween the breed group means for cuta-bilityand rib eye muscle area. This strongrelationship indicates that rib eye musclearea may be particularly useful in predic-tion equations to partly account forvariability in cutability that is associatedwith breed group differences.
The individual trait most highly corre-lated with percentage cutability was fatthickness (-0.76) at the 12th rib. This rela-tionship was approximately the samewhether considered over all sire breed
groups or pooled within groups. The mag-nitude of the correlation between fat thick-ness and percentage cutability and thehomogeneity of the relationships over all
or within breed groups indicate fat thick-ness would be a valuable predictor ofcutability in a population of carcasses re-gard)ess of genetic origin.
The correlations between percen-tage of kidney and pelvic fat (K and P fat)and cutability were -0.37 on an overallbasis and -0.40 on a pooled within-breedgroup basis. Breed group means for cuta-bility and percentage of K and P fat werenot correlated. Although the correlationbetween cutability and percentage of Kand P fat is only moderate, this measureof fatness should be a useful predictor ofcutability within breeds or over mixedbreed population.
Regression equations developed(Table 2) overestimated HA, SO, and Jbreed group means and underestimatedthe CLS means. Equation 1 has hot car-cass weight, rib eye area, adjusted fatthickness, and percentage K and P fat.Equation 2 omits carcass weight. Thepoorest fit was for Jersey crosses. Equa-tion 2, with carcass weight deleted, hadless bias associated with breed groupmeans than equation 1. The consistentlylower values when the Murphey equationwas used can possibly be accounted forby differences in cutting procedure, differ-ences in the trait means for the popula-tions evaluated, and difference in relativesize of the regression coefficients. TheMurphey equation did a good job of rank-ing within groups as evidenced by correla-tions between actual and estimated cuta-
bility within breed groups of 0.82 for HA,0.78 for CLS, 0.85 for SO, and 0.73 for J.
Table 2.-Comparison of actualand predicted cutability by sirebreed groups using variousequations
Breadgroup
Prediction equation
1 2 Murphey('Yo) ('Yo) ('Yo)
Actualcutability
('Yo)
---
Table 1.-Correlations among carcass traits 1
Rib Adj.Carcass Carcass eye fat K and p.
traits weight area thick. fat Cutability('Yo) ('Yo)
Carcassweight _____ _n __ 0 0.59 0.26 0.01 -0.07Rib eye area_ ____________ .50 .. . - .28 - .08 .47Fatthicknessn __n __. _ n .50 - .04 .. . .02 - .76K andP fat _u % u_ u u u .25 .08 .18 .. . - .37Cutability, u _% u u u u u
- .42 .18 - .73 - .40
HAm _u __ 51.0 51.6 51.6 48.8CLS u m _ 55.7 55.5 55.6 51.0SD u u ____ 52.1 52.6 52.6 49.4J m___n. 50.7 51.5 51.4 49.1

John D. Crouse 1
ESTIMATION OF RETAIL PRODUCTOF CARCASS BEEF
SummaryCarcasses from 1,121 steers (prog-
eny of Hereford or Angus cows mated toHereford, Angus, Charolais, Simmental,Umousin,. South Devon, or Jersey siresby artificial insemination) were examinedto develop equations to estimate percen-tage of retail product. The independentvariables chosen and resultant accuracyof the equations developed, reflect differ-ent kinds of measurements that could beused to predict cutability over a widerange of data collection conditions.
Of 18 traits readily obtained in thecooler, adjusted fat thickness, rib eyearea, estimated kidney and pelvic fat, hotcarcass weight, and marbling score werethe most important in predicting percen-tage of retail product. A multiple regessionequation involving these five independentvariables accounted for 79.2% of thevariation in percentage of retail product.
Results showed that adequatealternatives other than complete cutout ofcarcasses do exist to determine yields ofretail product. Reasonably precise esti-mates of percentage or retail product canbe made based on prediction equationsinvolving independent variables mea-sured on carcasses in the cooler alone orin combination with partial cutout data.These estimates should be especiallyuseful when a large number of carcassesare to be evaluated.
Introduction
Retail product yield is a useful mea-sure of the saleable portion of carcassbeef. Time and resources are often notavailable to obtain actual retail yields.Thus, reliable estimates of retail productyield are needed in marketing, progenytesting, and in research programs.
Numerous equations for estimatingpercentage of carcass cutability havebeen developed on carcasses derivedfrom British beef, dairy, and Brahmanbreeding. The present USDA (1965) yieldgrade equation estimates percentage ofclosely trimmed, boneless round, loin, rib,and chuck (Murphey et al., 1960). In thisregression equation, independent vari-ables are those that can be measuredrapidly with minimal expense on carcas-ses in the cooler. When tested on inde-pendent populations of carcass beef, ithas been found to be useful on carcasses
derived from animals having the samegrowth and fattening patterns.
The purpose of this study was to de-velqp prediction equations to estimate re-
1John D. Crouse is a meat scientist atMARC.
tail product for carcass beef derived fromsteers varying in rate and composition ofgrowth. Predictors chosen reflect differentsituations relative to resources availableto make required observations.
Data were obtained from 1,121 steercalves born in 1970, 1971, and 1972 aspart of a cattle germ plasm evaluationprogram for beef production. Herefordand Angus cows were mated to Hereford,Angus, Charolais, Limousin, Simmental,South Devon, and Jersey sires by artificialinsemination. Calves were stratified with-in sire breed groups by age and assignedto one of three slaughter groups eachyear (215, 243, and 271 days postwean-ing for 1970; 200, 242, and 284 days for1971; and 220, 245, and 283 for 1972).
Yield grade and quality grade factorsand linear measurements were deter-mined 24 hr postmortem. Muscling wasscored from 1 (extremely thick) to 10 (ex-tremely thin). Carcass length, hindquarterlength, round length, round thickness,chuck thickness, and chest depth weremeasured.
The right side of each carcass wastaken to Kansas State University andprocessed into retail cuts trimmed to nomore than 0.3 in fat cover. Dorsal andtransverse spinous processes remainedin the short loin cuts, and dorsal spinousprocesses and rib bones remained in therib roast. All other retail cuts were madeentirely boneless. Kidney and pelvic (Kand P) fat of the right side was weighedand expressed as a percentage of theright side weight. Percentage of retail pro-duct was determined by dividing theweight of the trimmed retail yield from theround, loin, rib, and chuck plus lean trimfrom the entire side by the sum of indi-vidual weights of all side componets. Per-centages of rib retail product, rib fat trim,round retail product, and round fat trimwere expressed relative to weights of theirrespective wholesale cuts.
Results And Discussion
Regression equations with standarderrors and coefficients of determination
for predicting percentage of retail productare given in Table 1.An R2 is the variationaccounted for by a prediction equationdivided by the total variation. It is, there-fore, a measure of the accuracy of theprediciton equation. Equations are pre-sented on an overall breed of sire sub-class basis and a pooled within-breed ofsire subclass basis. Inferences from theoverall analysis would be applicable to apopulation of carcasses similar to those ofthe breed groups sampled in the presentstudy. Results from .the pooled within
analysis represent the average responsewithin the seven sire breed groups. Differ-ences in standard errors and coefficientsof determination of equations developedby the two subclass basis are largely dueto the reduction in variation associated
with breed group means. Independentvariables presented are those that werefound to be the most important by step-wise regression procedures and to be ofpractical usefulness in various resourcesituations where observations may bemade in the cooler, on partial cutout of thecarcass, or on chemical analysis of the9-10-11 th rib sections. Additional inde-
pendent variables were significant andmade some improvement in the R2, butthese contributions were negligible and oflittle practical consequence.
Equations 1 through 4 (over all sub-classes) and equations 9 through 12(within subclasses) involve independentvariables observed in the cooler, whichcan be obtained with rapidity and withmodest expense. These equations in-volve traits found in the yield grade equa-tion with the addition of marbling score.Equations 1, 9, and 11 omit hot carcassweight. The usefulness of hot carcassweight in an equation representing allbreed groups is somewhat questionable.This is due to the negative effect heaviercarcasses have on predicted percentageof retail product.
Measurements of length and thick-ness of the carcass or components of thecarcass made no practical contribution tothe R2when marbling score was includedin the equation. Subjective measure-ments of carcass muscling were impor-tant. However, if marbling score was in-cluded in the equation, then the contribu-tion of muscling score was minimal.
Preliminary correlation analysis ofclosely trimmed wholesale cuts with per-centage retail product indicated that thewholesale round and the rib cuts were thebest indicator of closely trimmed carcassretail products. Consequently, regressionequations were generated utilizing inde-pendent variables derived from coolerobservations and partial cutout of theround and rib. Equations 5 and 13, involv-ing percentage of trimmed round and per-centage of retail product of the round, re-spectively, incorporated adjusted fatthickness and the actual percentage of Kand P fat. Variation in actual K and P fatwas more highly associated with variationin retail product than estimated K and P fatas shown by the results of the correlationanalysis. Processing the round would re-quire removel of K and P fat from the
Continued 8t bottom of next page.
39
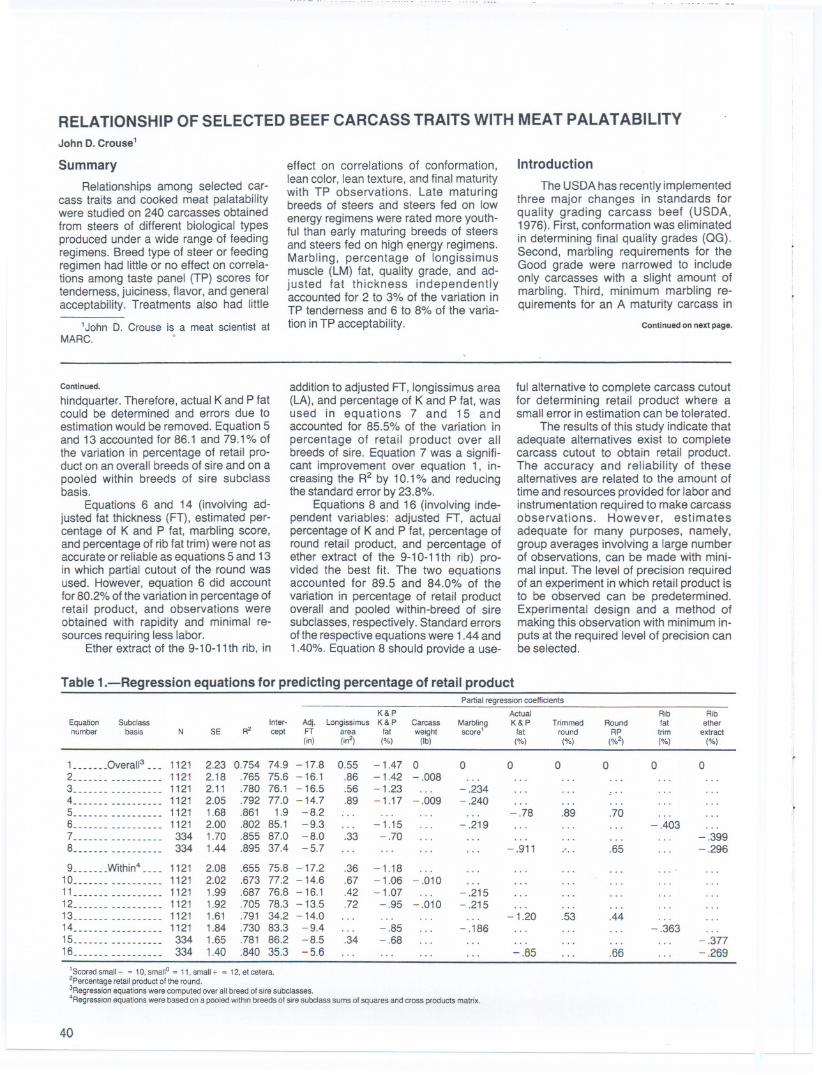
John D. Crouse'
RELATIONSHIP OF SELECTED BEEF CARCASS TRAITS WITH MEAT PALATABILITY
Summary
Relationships among selected car-cass traits and cooked meat palatabilitywere studied on 240 carcasses obtainedfrom steers of different biological typesproduced under a wide range of feedingregimens. Breed type of steer or feedingregimen had little or no effect on correla-tions among taste panel (TP) scores fortenderness, juiciness, flavor, and generalacceptability. Treatments also had little
IJohn D. Crouse is a meat scientist atMARC. .
effect on correlations of conformation,lean color, lean texture, and final maturitywith TP observations. Late maturingbreeds of steers and steers fed on lowenergy regimens were rated more youth-ful than early maturing breeds of steersand steers fed on high energy regimens.Marbling, percentage of longissimusmuscle (LM) fat, quality grade, and ad-justed fat thickness independentlyaccounted for 2 to 3% of the variation inTP tenderness and 6 to 8% of the varia-tion in TP acceptability.
Introduction
The USDAhas recently implementedthree major changes in standards forquality grading carcass beef (USDA,1976). First, conformation was eliminatedin determining final quality grades (QG).Second, marbling requirements for theGood grade were narrowed to includeonly carcasses with a slight amount ofmarbling. Third, minimum marbling re-quirements for an A maturity carcass in
Continued on next page.
Continued.
hindquarter. Therefore, actual K and P fatcould be determined and errors due toestimation would be removed. Equation 5and 13 accounted for 86.1 and 79.1% ofthe variation in percentage of retail pro-duct on an overall breeds of sire and on apooled within breeds of sire subclassbasis.
Equations 6 and 14 (involving ad-justed fat thickness (FT), estimated per-centage of K and P fat, marbling score,and percentage of rib fat trim) were not asaccurate or reliable as equations 5 and 13in which partial cutout of the round wasused. However, equation 6 did accountfor 80.2% of the variation in percentage ofretail product, and observations wereobtained with rapidity and minimal re-sources requiring less labor.
Ether extract of the 9-1 0-11th rib, in
additionto adjusted FT, longissimus area(LA),and percentageof K and P fat, wasused in equations 7 and 15 andaccounted for 85.5% of the variation inpercentage of retail product over allbreeds of sire. Equation 7 was a signifi-cant improvement over equation 1, in-creasing the R2 by 10.1% and reducingthe standarderror by 23.8%.
Equations 8 and 16 (involving inde-pendent variables: adjusted FT, actualpercentageof K and P fat, percentage ofround retail product, and percentage ofether extract of the 9-10-11th rib) pro-vided the best fit. The two equationsaccounted for 89.5 and 84.0% of thevariation in percentage of retail productoverall and pooled within-breed of siresubclasses,respectively.Standarderrorsof the respectiveequationswere 1.44and1.40%. Equation 8 should provide a use-
ful alternative to complete carcass cutoutfor determining retail product where asmall error in estimation can be tolerated.
The results of this study indicate thatadequate alternatives exist to completecarcass cutout to obtain retail product.The accuracy and reliability of thesealternatives are related to the amount of
time and resources provided for labor andinstrumentation required to make carcassobservations. However, estimatesadequate for many purposes, namely,group averages involving a large numberof observations, can be made with mini-mal input. The level of precision requiredof an experiment in which retail product isto be observed can be predetermined.Experimental design and a method ofmaking this observation with minimum in-puts at the required level of precision canbe selected.
'Scored small- = IO.smalio = 11,small + = 12.etcetera.2Percentageretail productof the round.3Regressionequationswere computedoverall breed of sire subclasses.'Regression equationswere based on a pooledwithin breeds of siresubclasssums of squaresand cross products matrix.
40
-- - - ---
Table 1.-Regression equations for predicting percentage of retail productPartialregressioncoefficients
K&P Actual Rib RibEquation Subclass Inter- Adj. Longissimus K&P Carcass Marbling K&P Trimmed Round fat ethernumber basis N SE R2 cept FT area fat weight score1 fat round RP trim extract
(in) (in2) (%) (Ib) (%) (%) (%2j (%) (%)
L ______Overall3 ___ 1121 2.23 0.754 74.9 -17.8 0.55 -1.47 0 0 0 0 0 0 02_______ _____nm 1121 2.18 .765 75.6 - 16.1 .86 - 1.42 - .0083_______ ________00 1121 2.11 .780 76.1 - 16.5 .56 -1.23 ... -.234400_____ ____m___ 1121 2.05 .792 77.0 -14.7 .89 -1.17 -.009 -.2405_____._ __m_____ 1121 1.68 .861 1.9 -8.2 ... ... ... ... -.78 .89 .706_m___ _____m__ 1121 2.00 .802 85.1 -9.3 ... -1.15 ... -.219 ... ... ... -.4037_______ __._00__00 334 1.70 .855 87.0 -8.0 .33 -.70 ... ... ... ... .., ... -.3998___0000 __________ 334 1.44 .895 37.4 -5.7 ... ... '" ... -.911 ... .65 ... -.296
9.n____Within4 ____ 1121 2.08 .655 75.8 - 17.2 .36 -1.1810_______mnm__ 1121 2.02 .673 77.2 -14.6 .67 -1.06 - .01011.._____ __________1121 1.99 .687 76.8 - 16.1 .42 -1.07 ... -.21512____m ___mm_ 1121 1.92 .705 78.3 -13.5 .72 -.95 -.010 -.21513____00_ _00_00____ 1121 1.61 .791 34.2 -14.0 ... ... ... '" -1.20 .53 .4414___________mm 1121 1.84 .730 83.3 -9.4 ... -.85 ... -.186 ... ... ... -.36315__00___ __________ 334 1.65 .781 86.2 -8.5 .34 -.68 ... ... ... ... ... ... -.37716_____00 ____00____ 334 1.40 .840 35.3 -5.6 ... ... ... ... -.85 ... .66 ... -.269

Table 1.-Simple correlations among selected carcass traits and palata-bility traits
Traitno. Trait 8
Trait number
2 3 4 5 6 7
the Prime, Choice, Good, and Standardgrade no longerincreases withincreasingmaturity.These changes were the resultof research that has shown that maturity,within youthful carcasses, and conforma-tion have little relationship to palatability.
Low positive correlations betweenmarbling score or LM lipid content with TPacceptability scores have been reportedfor steaks from youthful carcasses. Re-sults from a number of studies have indi-cated significant relationships betweenmaturity and TP palatability characteris.tics when evaluated over a range ofyouthful to mature carcasses. Berry et al.(1974) observed significant correlationsbetween TP palatability scores andmaturity when evaluated over the fullrange of maturity groups. However, thesecorrelations were observed to be low andnonsignificant when. evaluated within theA maturity group.
Because more than 97% of the "fed"beef is within A maturity, the effect ofmaturity within A maturity on palatability ofsteak and roast meat is of most interest. Inmost previous studies, carcasses fromanimals with relatively similar growthrates and fattening characteristics typicalof domestic beef breeds finished onmedium to high energy density diets havebeen sampled to determine the efficiencyof carcass criteria in estimating palatabil-ity. In the present study, relationships ofcarcass quality indicating criteria withpalatability and how these relationshipswere affected by breed groups and nutri.
Table 2.-Regression equationsfor taste panel tenderness andacceptability
tional environment were examined.Observations were made on carcassesobtainedfrom steers that variedgreatly ingrowth and fattening characteristics andproduced under a wide range of feedingregimens.
Experimental Design
.' The experimental design ensuredvariation in carcass traits such as maturity(within the A maturity classification) andcarcass composition with relatively lowcovariance among these traits. This varia-tion allowed an evaluation of independentas well as multiple effects of maturity,marbling, and other traits on palatability.Carcasses from 120 large, late maturing(Chianina, Charolais, Brown Swiss, andLimousin crosses) and 120 small, earlymaturing (Hereford, Angus, and Red Pollcrosses) steers were evaluated. Atapproximately 250 days of age, steerswere assigned to one of five feeding reg-imens ranging from pasture feeding to an80% concentrate diet. Serial slaughtertechniques were used. Steers were killedat about 90 and 105% of the approximatemature weights for females of these bio-logical types (small: 1,050 Ib; large: 1,200Ib). An additional slaughter group wasslaughtered at the beginning of the higherconcentrate feeding periods in regimensA, B, and D.
All steers were slaughtered by acommercial packer. Carcasses were e-valuated and quality graded by USDAstandards after a 24-hr chill at 2°F.
9
Correlations
Correlations among selected car.cass traits are presented in Table 1. Pre.liminary analyses indicate that breed tYPEof steer and feeding regimen had no effecon magnitude of correlations. The vel)low correlation between final maturity ancTP traits in these A maturity carcasse~agrees with previous research and sup.ports recent modifications of maturity irthe USDA grade standards.
Carcass traits most highly associ.ated with taste panel traits were mea.sures of fatness. A low positive correlatiorbetween marbling and TP traits was alscobserved; however, the amount 01variability in TP tenderness accounted fOIby marbling (3%) was low. Interestingly,fat thickness (FT) was as highly corre.lated to TP traits as measures of marbling.This relationship was not appreciabl~affected by treatment subclass means.The covariance between marbling and Fl(r = 0.58) would partly account for therelation of FT to TP traits. Partial correla-tions between FT and TP items holdingmarbling constant (Table 2) were low bu1real for TP flavor and acceptability. Partialcorrelations between marbling and TPitems holding FT constant were lowerthan the former correlations. Theseobservations indicate that FT and mar-bling would be of similar value in estimat-ing TP panel evaluations of organoleptictraits.
Holding maturity constant had littleeffect on correlations between marblingand TP traits. However, variation in mar-bling appears to be slightly less associ-ated with TP traits at a constant time onfeed than when time on feed is allowed tovary within subclass treatments.
Simple regressions of TP tendernessand TP acceptability on marbling and fatthickness are shown in Table 2. Regres-sion curves of TP traits on carcass traitswere flat. A change of 300 in marbling(scored 0 = devoid to 30 = very abun-dant) was required to make a one-unitincrease in TP tenderness values. Fatthickness was required to increase by 1 into make a similar change. Marbling, aG,and FT independently accounted for 2 to
Table 3.-Frequency distribution of taste panel tenderness scores
Marblingscore
Numberof
samples
P devoid ___ __ __ ___ __ _ __ ____ 17
Traces 47
Slight.. _____ __ __ __ __ ___ __ __ 83Small. __ __ __ _ _ __ __ __ __ _ __ __ 54Modest __ _ __ __ __ _ _ __ __ _ __ __ 26Moderate __ __ _ __ _ _ __ __ _ _ _ __ 8"" S abundant. _ _ __ __ __ _ __ _ _ 5
Number/score _ _ _ _ _ __ _ _ _ _ ___
1 Final maturity __ _ _ _ __ __ _ __ --- 0.25 0.26 0.22 0.02 - 0.07 0.08 0.04 0.042 Marbling _ __ __ ____ ___ _ __ _ --- --- .96 .66 .22 .24 .32 .33 .153 Quality grade ____________ --- --- _n .66 .22 .24 .33 .34 .144 Fat thickness ____________ n_ --- --- -.- .27 .29 .38 .38 .125 Taste panel tenderness ___' --. --- --- --- _n .32 .55 .78 - .636 Taste panel juiciness __ __ _ --- _n --- _n _n -.- .64 .66 .057 Taste panel flavor ________ .-- --- --- n_ --- _n _n .84 .238 Taste panel acceptability __ --- _n --- --- -.. _n --- _n .399 Warner-Bratzler shear ____
Carcasstraitsandcoefficients
FatDependent Inter- Marb- thick-
variable R2 SE capt ling ness
TP tender- 0.03 0.75 4.60 0.033ness .03 .75 4.75 .039
TP accept- .06 .51 4.68 .036ability .08 .50 4.65 .042
Tastepaneltendemessscores
3 or greater 4 or greater 5 or greater 6 or greaterNO. "/0 NO. "/0 NO. "'/0 NO. "/0
17 100 13 76 6 35 1 646 98 37 79 20 43 4 983 100 72 87 41 49 4 553 98 50 93 27 50 4 726 100 26 100 19 73 1 4
8 100 7 88 5 63 2 255 100 5 100 4 80 0 0
28 88 106 16
Continuedat bottom of next page.
41

METHANE AND PROTEIN FROM BEEF CATILE MANUREAndrew G. Hashimoto,1 Yud-Ren Chen, Vincent H. Varel, and Ronald L. Prior
Introduction conditions prevail in many natu~al en-. vironments ranging from pond sediments
Dwindling supplies of conventlo~al to the gastrointestinal tract of animals.fossil fuels have prompted renewed In- Use of the methanogenic process forterest in recovering energy ~hrough.the generatingenergy from organic residuesbioconversionof wasteorganic matenals. requiresan understanding of the mecha-The large quantities of manure produced nisms involved and the.factors affectingin confinement feedlots and the need to thesemechanisms.manage this manure effectively. make BIODEGRADABiliTY. Becausefeedlotsa logicalchoicefor assessingthe anaerobic fermentation is a biologicalfeasibilityof recoveri~gmethane~nd pro- process,the biodegradabilityof the mate-tein throughanaerobicfermentation. rial being fermented affects the product
Research at MA.RCis designed ~o yield.We foundthat the roug.hageconte~tdetermine the technical and economic ofcattle rations affects the blodegradabll-feasibilityof recoveringmethane and pro- ityof the manure.tein from beefcattle manure. Manure from cattle fed a ration ofSepcificobjectivesar~ to: .. . 91% cornsilage and 40% corn silage pro-
(1) Develop design cntena for Optl- duced 80% and 60%, respectively, themum productionof metha~eand amountof methane produced by manureprotein through anaerobic fer- from cattle fed 7% corn silage. We havementationof beefcattle manure, also shown that the age of manure and
(2) Developefficient methods to re- amount of such foreign material as dirtcover high protein biomass from and bedding can reduce the methanethe fermented res~~ue, yield by 30 to 50%. Thus, we estimated
(3) Evaluate the nutntlonal value of that the maximum amount of methanethe biomassas a livestockfeed, that can be produced from fresh manure
(4) Determine the capital and oper- from finishing cattle is 5.5 ft of methane/ational costs and ener~y, man- pound of organic matter. Old manure orpower, and safety reqUl.rements manurefrom cattle fed high roughage ra-for methane fermentation sys- tions would produce about one-half totems associated with livestock two-thirdsthis amount.operations. . .
This project was initiated in 1976 and IS Methane Production Ratejointly funded by the U.S. Department ofAgriculture, Agricultural Research Ser-vice and the U.S. Departmentof Energythro~ghthe Solar Energy Research Insti-tute.
AnaerobicFermentationMICROBIOLOGY. Anaerobic fer-
mentation is a biological process in whichorganic matter decomposes without ox-ygen to yield methane. The phenomenonoccurs naturally when organic material re-mains without oxygen under conditionsamenable to microbial processes. Such
1Andrew G. Hashimoto is a research lead-
er (Agricultural Engineering) at MARC.
Although our research on biodegrad-ability shows the maximum amount ofmethane that can be produced from cattlemanure, it is not practical to extract th~maximum amount because of the longfermentation time and larger fermentorvolume required. Thus, it is important forresearchers to predict the methane pro-duction rate under different fermentationconditions. We have developed an equa-tion that predicts the methane productionrate (in cubic feet of methane/cubic feet offermentor/day) based on the biodegrad-ability and concentration of manure beingfermented, the fermentation time, and twokinetic parameters. Using this equation,
we found that the highest methane pro-duction rate occurrs at 60° C. Rates at 30,35, 40, 45, 50, 55, and 65° were 42, 52,64, 78, 92, 89, and 52% of the rate at 60°.We also found that methane production isinhibited when manure concentration ex-ceeds 5 Ib of organic matter/cubic feet.Thus, to achieve high methane produc-tion rates, while maintaining stable fer-mentation, we recommend operating fer-mentors between 50 to 55°, manure load-ing rate of 1 Ib of organic matter/cubic feetof fermentor/day, and retention time of 5days.
Energy RequirementOur studies have shown that the ma-
jor energy requirement for operating fer-mentors between 50 to 55° C was forheating the fermentor. About 37% of theenergy produced by the system wasneeded for heating. This amount was re-duced to 20% when half of the effluentheat was recovered to help heat themanure entering the fermentor. The nextmain energy user was for mixing themanure and fermentor contents. Mixingamounted to 7% of the total energy pro-duction when the mixers were run con-tinously. Mixing energy can be reducedsubstantially when intermittent mixing isused. Continuous mixing produces, atmost, only a 10% higher methane produc-tion rate than mixing 2 hr/day. Energy re-quired to pump the manure into and out ofthe fermentor accounted for about 4% ofthe total energy produced. Thus, the ener-gy required to operate the fermentationsystems accounts for about 30 to 50% ofthe energy produced.
Feeding Fermentor Effluent
Using the fermentor effluent as afeed ingredientfor livestockappearstohave merit, although some technical
Continued at bottom of next page.
Continued.
3% of the variation in TP tenderness and 6to 8% of the variation in TP acceptability.
Frequency Distributions
Table 3 gives frequency distribtuionsof TP tenderness scores and acceptabilityscores for each marbling score. The per-centage of samples with or above a givenlevel of desirability for each marbling
42
score is shown. At a level of TP satisfac-tion for tenderness of three or over, theprobability of attaining this level of satis-faction would be 100% at the practicallydevoid level of marbling. However, theprobability of attaining a higher level ofsatisfaction, say 5, would only be 35% atthe practically devoid level of marbling. Toattain a TP tenderness score of four or
greater with an 87% probability, slight
amounts of marbling would have beenrequired.
In the present study, the relationshipexisted between carcass quality, indicat-ing criteria and TP traits were very low.For example, marbling accounted for only6% of the variation in TP acceptability,and a thirtyfold increase in marbling wouldbe required to yield a one-unit change inTP responses.

William G. Kvasnicka 1
COOPERATIVE PROJECT ON THE WEAK CALF SYNDROME
Introduction
The "Weak Calf Syndrome" hasbeen gaining wide recognition throughoutthe north~est and Rocky Mountain re-gions. The specific syndrome was firstnoted as possibly being caused 'by a newentity by Dr. Jack Ward in the BitterrootValley of Montana after Dr. Ward was un-able to relate the observations of necrop-sied specimens with that of any knownpublished reports. The actual orgin of thedisease responsible for the specific syn-drome noted in the area is not known andmay have had its orgin elsewhere.However, interest in the problem is in-creasing in view of the apparent recogni-tion of the disease and acknowledgmentof its presence in many different areas.
The problem is particulary devastat-ing when experienced within a herd for thefirst time, as losses range from 25% to ashigh as 75% of the calf crop. The initialrecognition has been an increase in theabortion rate followed by the calves' in-ability to rise at birth. The degree of weak-ness has varied from animal to animal.Many of the calves will be polyarthritic andmost die soon after. A few animals areable to survive when immune therapy,blood transfusion, electrolyte solutions, orother fluids are administered. A largenumber of the animals that survive prog-ress poorly, attaining weight gains of one-half that of their normal counterparts.
Gross Pathology1. Aborted fetuses: Edema of sub-
cutaneous and interstitial tis-
sues throughout the body; port-
1William G. Kvasnicka is the herd healthveterinarian at MARC.
wine colored fluid in the pleuraland peritonal cavities, andhemorrhagic lesions in the sub-cutaneous tissues.
2. Calves delivered at term and
those dying after delivery: Sub-cutaneous edema, hemor-rhages in the anterior neck andmasseter muscles and in themuscles of the extremeties.Bloody synovial fluid with fibrin.Petechial hemorrhages in thethird eyelid, sclera, conjunctiva,ventral surface of the tongue,esophagus, trachea, and fre-quently in the thymus. Enlargedand edematous suprascapularand prefemmoral lymph nodes.Mild to severe gastroenteritisassociated often with enlargedmesenteric nodes. Striking red-dish muzzle turning somewhatleathery within a few days, etc.
Neonatal calf losses observed atMARC similar to those occurring in thenorthwest were first observed near theend of calving 1975. Losses in the 1976calving season reached levels of 10% ofthe calves born to heifers;1977 losseswere similar to 1976. Dr. Arlan McClurkin,research veterinarian, National AnimalDisease Center, has observed the losseshere and has conducted extensive workattempting to isolate infectious agents.
Extensive research is being con-ducted by groups at Idaho State, MontanaState, and Montana University. In gener-al, the research being pursued is tosearch for viral agents that will reproducethe disease, to develop a diagnostic testto identify affected calves that do survive,vaccine development, and the relation of
the diseases to cold-weather stress and/or nutrition.
US MARCCooperativeResearch Project
Background. Neonatal calf diseasewith signs and lesions similar to thosedecribed for the Weak Calf Syndrome arenow recognized as a serious problem inNebraska as well as in most other states
of the Old West Region. One of the herdsin which it is a problem of considerableseverity is the one atthe U.S. Meat AnimalResearch Center (MARC). The problemat MARC has recurred annually for sever-al years in first calf heifers. This herd willbe a reliable source of materials withwhich to search for an infectious agent.
The facilities at the University of Ne-braska are excellent for carrying out asearch for a hard-to isolate infectious
agent. Facilities for obtaining and holdinggnotobiotic calves are unmatched in thiscountry, and strict isolation facilities areabundant. There are also new, well-equipped research laboratories for virolo-gy, bacteriology, pathology, biochemistry,immunology, and electron microscopy;excellent diagnostic laboratories at lin-coln and North Platte; and a smaller di-agnostic laboratory at Scottsbluff.
There are excellent facilities and per-sonnel at MARC for handling and collect-ing materials from sick animals and fordoing preliminary laboratory procedures.The record-keeping at MARC is a realasset in obtaining accurate histories fordams of weak calves.
Continued on next page.
Continued.
problems must be solved. Dried centri-fuged effluent can be fed at a level up to10% of the dietary dry matter and notchange the use of the diet components bythe animal. Disadvantages of feedingdried centrifuge effluent are that morethan one-half of the nitrogen is not cap-tured by centrifugation, and capital andenergy costs needed to install and oper-ate the centrifuge and drying systems arehigh. Eliminating the drying processwould retain more nitrogen, but storingthe wet centrifuged solids would be aproblem, Mixing the total fermentoreffluent into a ration has the advantage ofusing most of the nutrients. However, the
---
amount of moisture in the effluent limitsthe amount of effluent that can be mixedinto a total ration. The major effects offeeding fermento~ effluent have been adecreased apparent digestibility of drymatter, nitrogen, ash, and gross energy insheep and decreased total ruminal fattyacid concentrations before and after feed-ing in steers.
Economics
Economic studies show thatmethane can be economically producedat moderate plant sizes (between 3 to 7tons of dry maUer/day) when farmer-constructed and operated systems areused. Commerical "turn-key" systems
are only economical at sizes greater than25 tons of dry matter/day. This means thatfarmer-constructed and operated sys-tems are economical for confined-beeffeedlots between 1,000 to 2,000 headwithout an effluent feed credit and about300 head with an effluent feed credit of
$70Iton. Commercial "turn-key" systemsare only economical for confined feedlotslarger than 8,000 head without effluentfeed credit and between 1,000 to 2,000head with an effluent feed credit of $70/ton. For dirt feedlots, the economicalfeedlot sizes must be at least twice aslargebecauseof the lower biodegradabil-ity of the manure and contamination withdirt and debris.
43

..
Objectives.1. Attempt experimental transmis-
sion of the disease to Cae-sarean-derived, colostrum-deprived gnotobioticcalves.
2. Attempt isolation of infectiousagent(s) from experimentallyand naturallyinfectedcalves.
3. Study multiplicationof isolatedagent(s) in body tissues of ex-perimental or natural cases us-ing labelled globulins fromcon-valescent or hyperimunesera.
4. Observe and evaluate grossand microscopictissue changesin experimental and natural in-fections.
Methodology
Specific Tasks.1. Extracts of tissue suspensions
from infected calves, or culturesof infectiousagents, willbe inocu-lated into gnotobiotic calves byone or more of the followingroutes, as necessary:
a. I.M.and/or I.V.b. Respiratorytract (viaaerosol or
intratracheal injection).c. Duodenum.d. Intrauterine,at 8 mogestation.
2. If unsuccessful, the above in-oculationswillbe repeated follow-ing cold and/or corticosteroid-induced stress.
3. Agents visualizationand isolationattempts will be made usingseveral techniques. Direct isola-tion by physical procedures willstart with fluids Ooint, intestine,CNS fluid, tissue suspensions),which will be subjected to dif-ferential- and density-gradientcentrifugation and, alternately,
-- molecularseiving.Density gradient bands and
concentrated fluidswillbe nega-tively stained and viewed bytransmissionelectron microscopy(TEM).The same fluids will beused for cell culture and chickembryoinoculations.Cellculturesand embryonating egg fluidswillbe examined for hemagglutininsand also willbe negativelystainedand viewed by TEM. Unconven-tional cell culture propagationtechniques wouldbe utilizedthatwould allow for isolation ofagents, which are strongly cell-associated, or which depend onthe host cell being in an unusualmetabolic state or at below-normaltemperature.
Bodyfluidsand tissue suspen-sions willbe inoculatedintosever-al mycoplasma media, collective-ly,which are capable of support-inggrowthof the species thus farreported fromcattle.
4. Acute and convalescent serafromnaturaland experimentalin-fections will be collected whenpossible, as well as serum andcolostrum from dams that havegiven birth to an affected calf.These willbe used for immuno-chemical tests, such as the in-direct fluorescent antibody tech-nique (IFAT).The IFATwill bedone with cryostat cut sectionsfromaffectedcalves.
5. As infectiousagents are isolated,they willbe adjusted into labora-toryanimals to produce hyperim-mune sera for immunochemicaltests.
6. Blood sera and body fluids will bechecked by conventional serolo-gy for antibodies against infec-tious bovine rhinotracheitis,bovine viral diarrhea virus, andadenovirus type 5, as well as forany infectious agents isolated inthis study.
7. Detailed records of herd historywill be obtained when possible.These data will include nutritionalfactors, vaccination regimen, pre-vailing climatic conditions. hus-bandry practices. and geneticbackground. This information willbe used to help determinewhether there is any correlationbetween these factors and the in-cidence of Weak Calf Syndrome.
1Calvingseason begins February 21 and lasts for 12 weeks w~happroximately 1,200heifersand 3,800cows calving.Heiferscalve 3 to 4 weeks before the cows.
2Figures for 6th week were not available.
44
--- -
Table 1.-MARC calving difficulty Table 2.-U.S. MARC 1980 weak calf syndrome incidence (within calvingscore difficulty)
Score Degree of difficutty 909 Heiferscalving
1 No assistance Difficultyscore_ _ _ _ _ _ _ _ 1 2 3 4 5 6 Total- - - - - -2 Minor difficulty-hand assistance Weak calf deaths _ 0 _ 0 _ _ 8 0 30 8 4 3 533 Fairly difficlut-calf jack necessary Totalnumbers0 n _ 0 _ u 464 27 282 45 45 45 9094 Major difficulty Percentage_ __ ______ 1.72 0 10.63 17.77 8.88 6.66 5.835 Caesarean6 Abnormal position on presentation 4,494Cowscalving
Difficultyscore _ 0 0 _ _ _ _ _ 1 2 3 4 5 6 Total- - - - -Weak calf deaths _ _ _ _ _ _ 83 1 11 1 1 5 102Total numbers _ _ _ _ _ _ _ _ 4045 40 180 40 20 135 4,494
Percentage_ __ 0___ __ 2.05 2.50 6.11 2.50 5.00 3.70 2.26
Table 3.-Causes of neo-natal deaths 1980 by week of birth 1,2
Major causeof deathWeek of Total Weakcalving Celves calves calfseason bom lost Oystocia syndrome Scours Starvation Exposure
4th Uh_ uu 480 40 14 7 5 0 05th On__uu 815 54 15 1 2 2 17th ___UhOO 716 154 28 48 33 0 188th _ m U _ U 437 79 8 32 12 13 09th _um_oo 311 37 5 12 6 2 3- - - - - - -
Total hn_ 2,759 364 70 112 58 17 22
Percentage 13.2 2.5 4.1 2.1 0.6 0.8