bedrock manual low-cost resistivity kit. introduction this manual explains the operation of a...
TRANSCRIPT

BEDROCK
MANUAL
Low-cost
resistivity kit
and
Android app

IndexA. Introduction
B. Vertical Electrical Sounding (VES) principle
C. Materials and measurement procedure
D. Interpretation using the Bedrock app
E. Advanced interpretation
F. Local calibration
G. Problem solving

A. IntroductionThis manual explains the operation of a low-cost vertical electricalsounding (VES) kit and the interpretation of measurements using the Bedrock app. The technology has been designed by Clark and Page (2011) and was adapted by PRACTICA Foundation to meet the requirements of manual drilling teams. A corresponding Android application called ‘Bedrock’ has been developed to simplify the data interpretation process.
The VES technology can be used to estimate the depth to bedrock in order to decrease failure rates of borehole drilling. It is a complementary method for borehole siting that needs to be executedin combination with field assessments, cartography, drilling log analysisand community consultation.
The technology is still in a development phase and any feedback or questions could be addressed to [email protected]

B. The VES principle
Vertical Electrical Sounding (VES) provides an indication of the resistivity of the soil at various depths. Once interpreted, a measured resistivity corresponds to a range of soil types (see nextpage). It is particularly useful to identify the depth of bedrock in order to prevent borehole failure.

Formation Resistivity (Ohm-m)
Salty water 0 - 1
Wet clay 1.0 - 50
Dry clay 10-100
Fresh water 20 - 200
Shale 10-400
Sandy clay soil 30 - 500
Wet sand / gravel 50-500
Laterite 800-1500
Weathered zone 1500-3000
Dry sand / gravel 1000-10000
Sandstone / Limestone 1500-10000
Hard rock 3000-10000
Air 100000
Resistivity of various soil and rock formations
Note: Values above are indicative. The resistivity of any soil type highly depends on the degree of moisture and weathering.

The resistivity (in Ohm-m) at a certain depth can be determined by driving an electrical current through the ground and measuring the Voltage (Volt) and Current (Ampère) in the circuit.
Increasing the distance between the electrodes will increase the measuring depth, as shown in the next figure. As a rule of thumb, the maximum measuring depth is about equal to the electrodespacing a (see chapter E1). Repeating the measurement at givendistances will result in an indicative vertical soil profile at the central point.
The « apparant resistivity » calculated first covers the full range of layers and not the resistivity at a particular depth. The real resistivity appears after interpretation of the full data-set (afterclicking on ‘’calculate results’’ in the app).
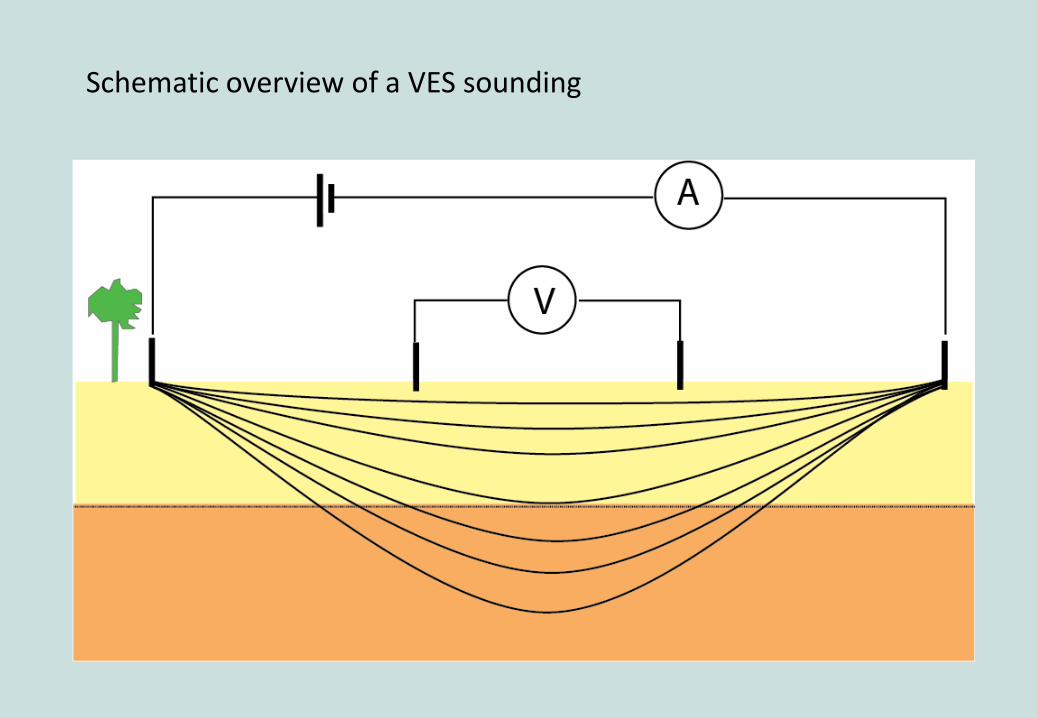
Schematic overview of a VES sounding

There are two different methods to determine the set-up of the electrodes: Schlumberger and Wenner. The VES box and Bedrockapp are suitable for both methods.
This manual focuses on the Wenner method since field workersperceived the method as more straight-forward and there is lessroom for errors.
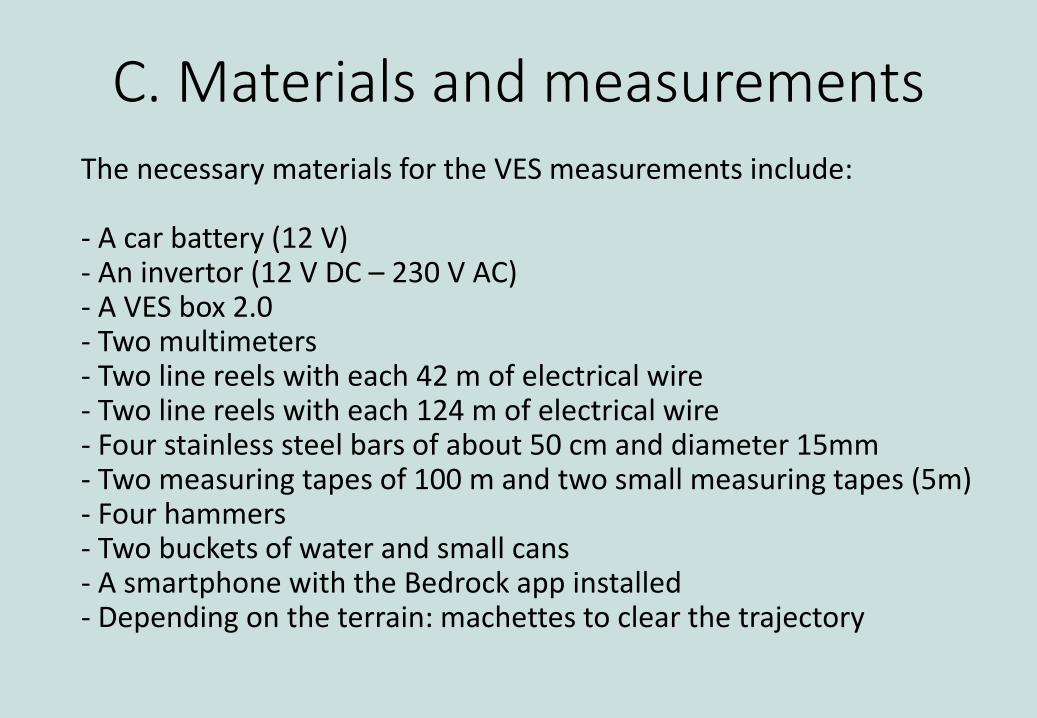
C. Materials and measurementsThe necessary materials for the VES measurements include:
- A car battery (12 V)- An invertor (12 V DC – 230 V AC) - A VES box 2.0 - Two multimeters- Two line reels with each 42 m of electrical wire- Two line reels with each 124 m of electrical wire- Four stainless steel bars of about 50 cm and diameter 15mm- Two measuring tapes of 100 m and two small measuring tapes (5m)- Four hammers- Two buckets of water and small cans- A smartphone with the Bedrock app installed- Depending on the terrain: machettes to clear the trajectory
Use the data sheet at the end of the manual to write down the measurements before entering them in the app.
Do not forgot to add the following information:
• Date
• Village, district
• GPS location
• Name and contact of responsable technicians
• Name and contact of client
• Observations on the hydro-geology (water table; soil profile)

C1: Chosing the spot
1. Mark a central point as close as possible to the selected potential drilling site. Take the following into account:
• Is it possible to lay out 120m of measuring tape in a straight line at both sides?
• Is the elevation along the tape more or less the same?
• Is the top soil along the tape more or less homogenous (road, soil, etc.)
• Are there no major obstacles or ditches at the first electrode positions?
• Can the equipment be place in the shade? (Or use an umbrella instead).
2. Take this as a starting point to lay out the measuring tapes
• Regularly look back while laying out the tape to make sure the line is straight.
• Use machetes if necessary to remove plants so that tape is placed on the ground.

C2: The electrodes1. Decide on the letters you attach to your electrodes
• Always mark the electrodes as A – M – N – B looking from left to right from your position when controlling the equipment.
2. Hammer the electrodes into the soil.
• The starting position is at 0.25 m for electrodes M and N and at 0.75 m for electrodes A and B.
• Always pour water at the electrodes to make a good contact with the soil.

1. Connect the Voltage multimeter to the wires coming fromelectrode M and N.
• Link electrode M to the COM port and electrode N to the mV port.
M N
C3: The voltage circuit

C4: The battery-only circuit
2. Link the negative pole of the battery to the COM port of the multimeter
3. Link electrode B to the positive pole of the battery when you are ready to start the current measurement. Note there will be current on the system directly!
A B
In areas where the soil is conductive you can use the battery-only circuit.
1. Link electrode A to the 10 Amp port of the Ampère multimeter (This is the start-up setting. Replace to the mA port if the current is below 200 mA)

Use the invertor-circuit to increase the outlet power from 12V to 300V DC when this is necessary (see chapter C6). Be aware that high power means a high security risk! See chapter C8 Security.
C5: The invertor circuit
A
1. Link electrode A to the 10 Amp port of the Ampère multimeter (this is the start-up setting. Replace to the mA port if the current is below 200 mA)

2. Connect the COM port of the current multimeter to the black port of the VES box.
3. Connect electrode B to the red port of the VES box.
B
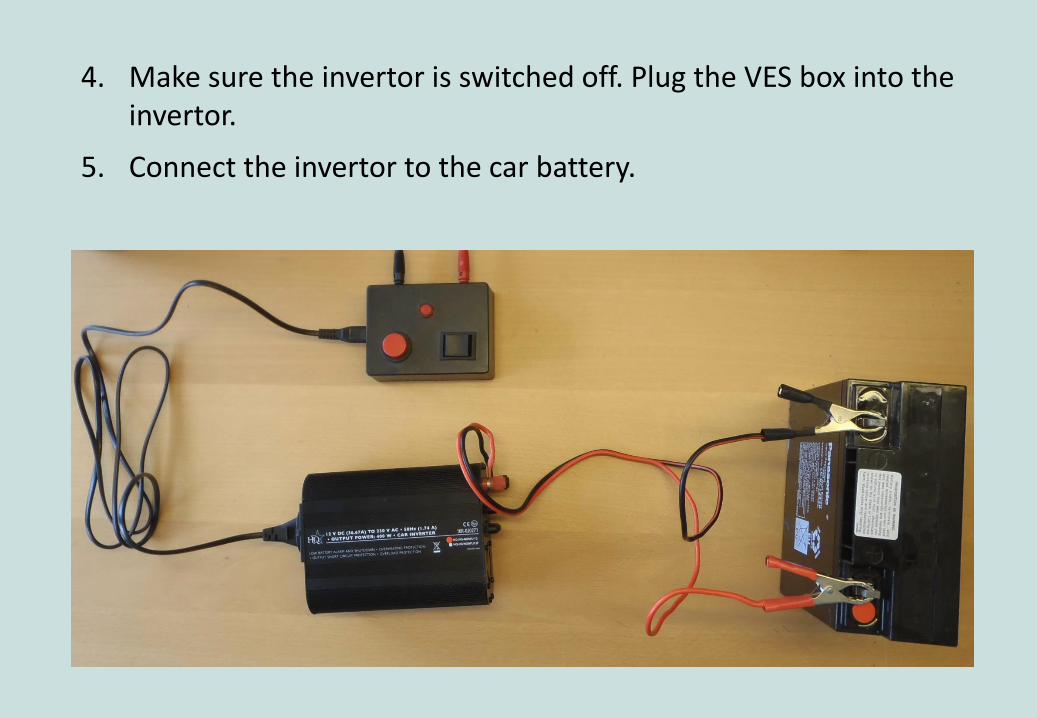
4. Make sure the invertor is switched off. Plug the VES box into the invertor.
5. Connect the invertor to the car battery.

6. Verify if the first circuit is connected like the set-up below:

7. To put current on the circuit, switch on the invertor and pressand hold the two buttons on the VES box.
• The VES box has two buttons: a black current switch and a red activation button.
• In the method described in this manual, only the positive side of the reverse current switch should be used (marked by the arrow).
Reverse current switch
Activation button
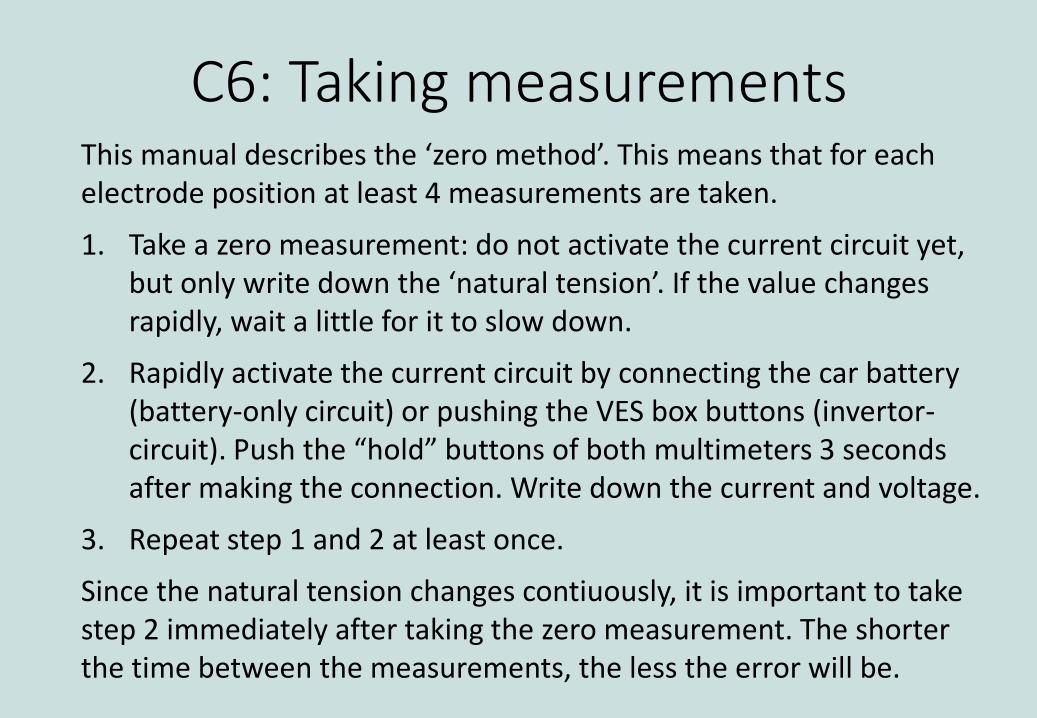
This manual describes the ‘zero method’. This means that for each electrode position at least 4 measurements are taken.
1. Take a zero measurement: do not activate the current circuit yet, but only write down the ‘natural tension’. If the value changes rapidly, wait a little for it to slow down.
2. Rapidly activate the current circuit by connecting the car battery (battery-only circuit) or pushing the VES box buttons (invertor-circuit). Push the “hold” buttons of both multimeters 3 seconds after making the connection. Write down the current and voltage.
3. Repeat step 1 and 2 at least once.
Since the natural tension changes contiuously, it is important to take step 2 immediately after taking the zero measurement. The shorter the time between the measurements, the less the error will be.
C6: Taking measurements
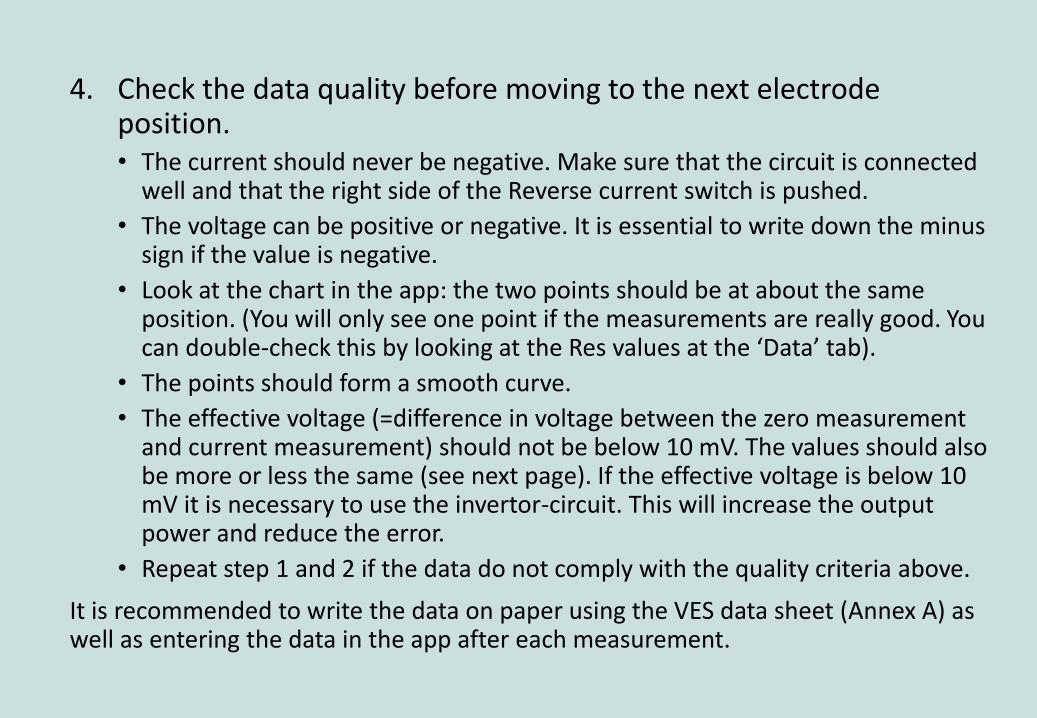
4. Check the data quality before moving to the next electrode position.• The current should never be negative. Make sure that the circuit is connected
well and that the right side of the Reverse current switch is pushed.
• The voltage can be positive or negative. It is essential to write down the minus sign if the value is negative.
• Look at the chart in the app: the two points should be at about the same position. (You will only see one point if the measurements are really good. You can double-check this by looking at the Res values at the ‘Data’ tab).
• The points should form a smooth curve.
• The effective voltage (=difference in voltage between the zero measurement and current measurement) should not be below 10 mV. The values should also be more or less the same (see next page). If the effective voltage is below 10 mV it is necessary to use the invertor-circuit. This will increase the output power and reduce the error.
• Repeat step 1 and 2 if the data do not comply with the quality criteria above.
It is recommended to write the data on paper using the VES data sheet (Annex A) as well as entering the data in the app after each measurement.
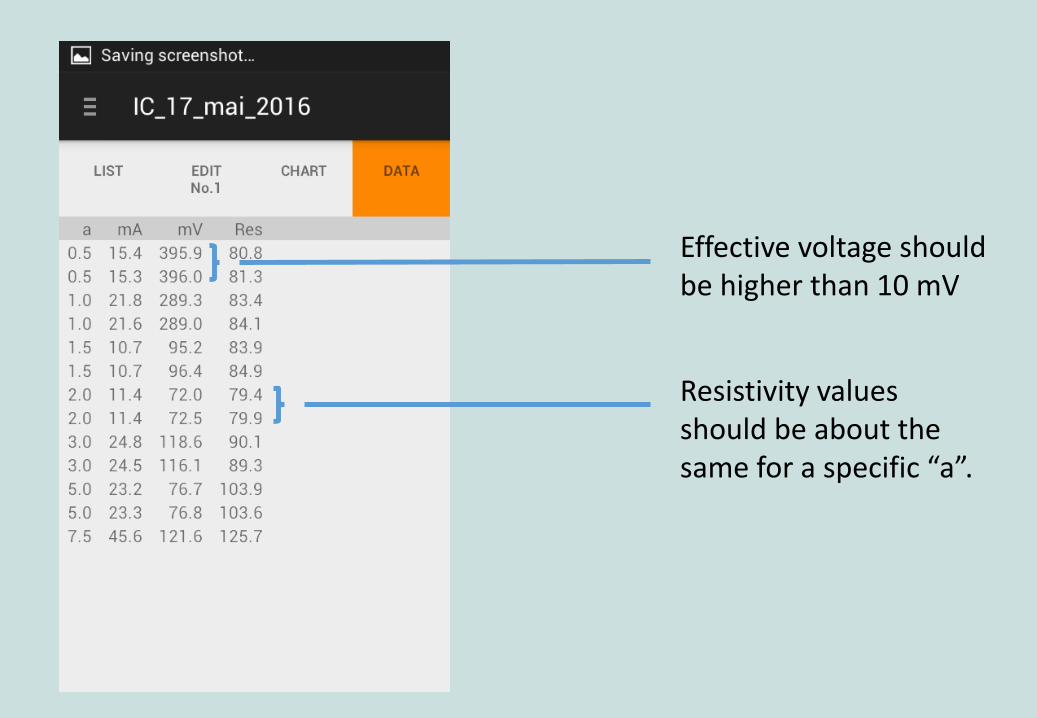
Resistivity values should be about the same for a specific “a”.
Effective voltage should be higher than 10 mV

For both circuits the following security rules should be respected:
• Always give a sign (whistle, walky-talky) before activating the current circuit.
• Disconnect the circuit right after pushing the ‘hold’ buttons of the multimeters (chapter C6 step 2). This also saves your battery and prevents the invertor from overheating.
• Make sure to inform the community about your activities and have people at both ends of the line to keep children and cattle away.
• Do not use the invertor-circuit during the rain. The battery-only circuit could be used from within the car if the planning is tight.
C7: Security

The invertor-circuit has 3 levels of security. There is only current on the circuit when all levels are activated. Make sure to use the right order for (dis) activating.
To activate:
1. Connect the car battery –make sure no one is touching the circuit before doing so.
2. Switch on the invertor.
3. Push the VES box buttons for 3 seconds during the current measurement.
To disactivate:
1. Release VES box buttons right after pressing the ‘hold’ buttons of both multimeters
2. Switch off the invertor when the 4 measurements have been taken.
3. Disconnect the battery
D. Interpretation using Bedrock
The Bedrock application functions on Android systems and can bedownloaded on http://practica.org/publications/manual-siting-kit-and-bedrock-app/
The application can be used to analyse data from VES soundingsusing a Schlumberger or Wenner method. This manual describeshow to use the app using examples from the Wenner set-up.
Please note that the application is still in an experimental phase. The developers do not take any responsibility on the consequencesfrom using the application or its results.
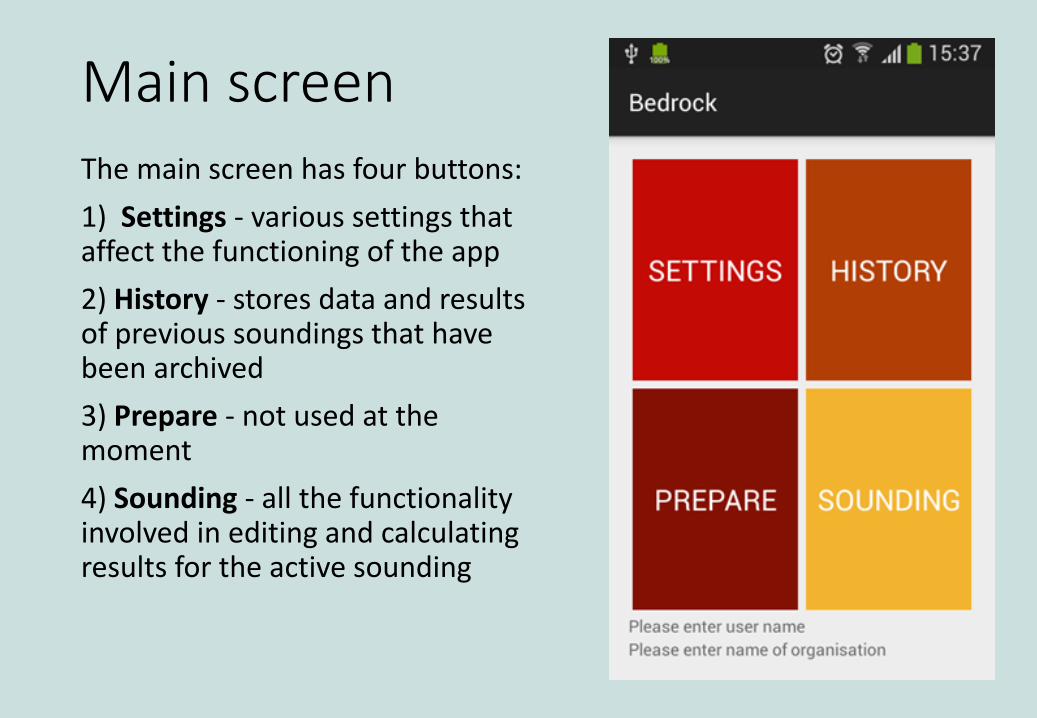
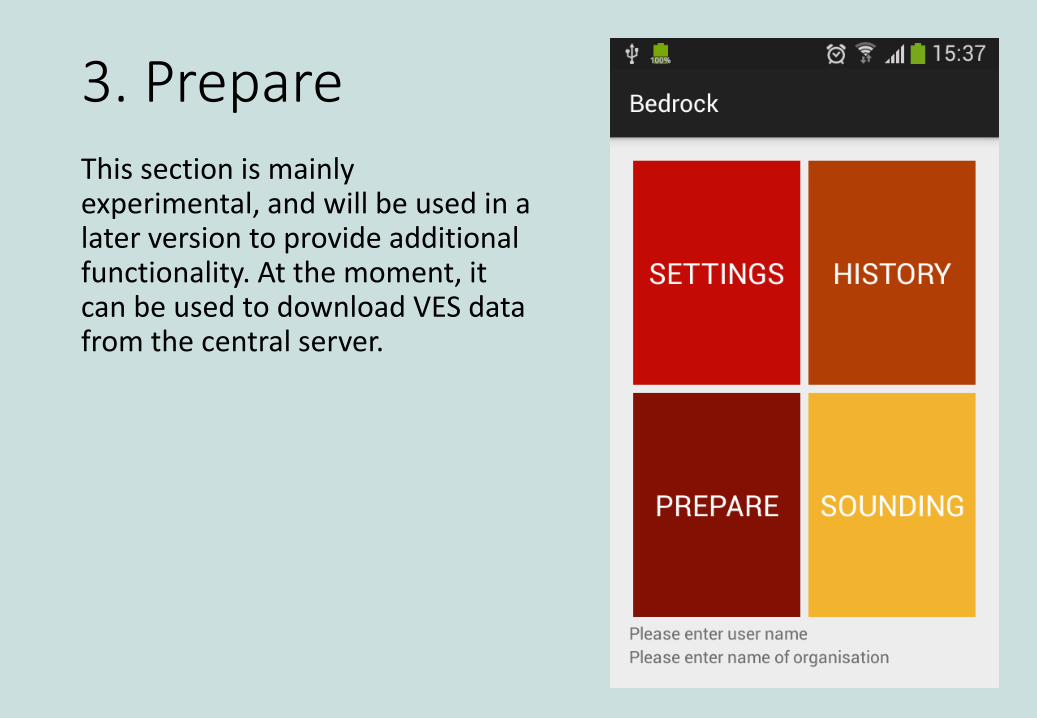
Main screenThe main screen has four buttons:
1) Settings - various settings that affect the functioning of the app
2) History - stores data and results of previous soundings that have been archived
3) Prepare - not used at the moment
4) Sounding - all the functionality involved in editing and calculating results for the active sounding

Main screen
At the bottom, the current user name and organisation is displayed.
The app is currently available in two languages: English and French. The language used by the app depends on the global language setting of the phone.
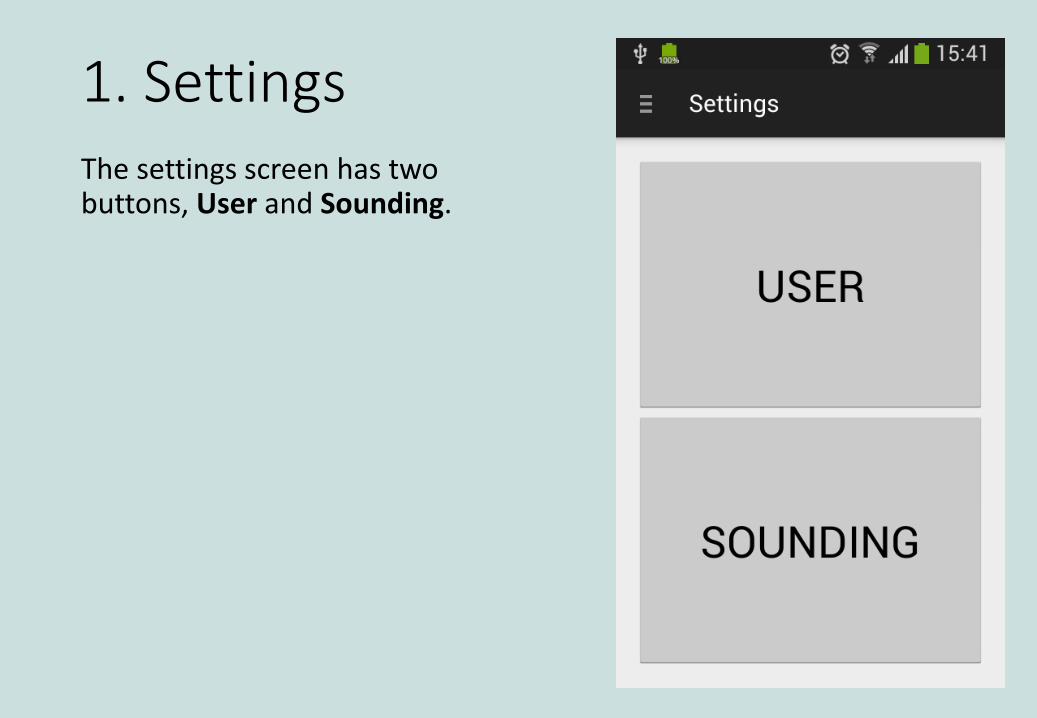
1. SettingsThe settings screen has two buttons, User and Sounding.

1.1 User
In the User screen, a name of the user and a 'company' name can be provided. If the data is uploaded to the central database, this information is important to know.

1.2 Sounding
1.2.1 Soil Profile Management
The Soil Profile Management screen is used to manage soil types and soil profiles.
Soil types
The soil types tab, which is in the right, shows a list of known soil types. Each soil type has a checkbox. If the checkbox is enabled, which is the default, the soil type will be used when analysis results are shown. If you want certain types of soil not to be used, you can disable them here.
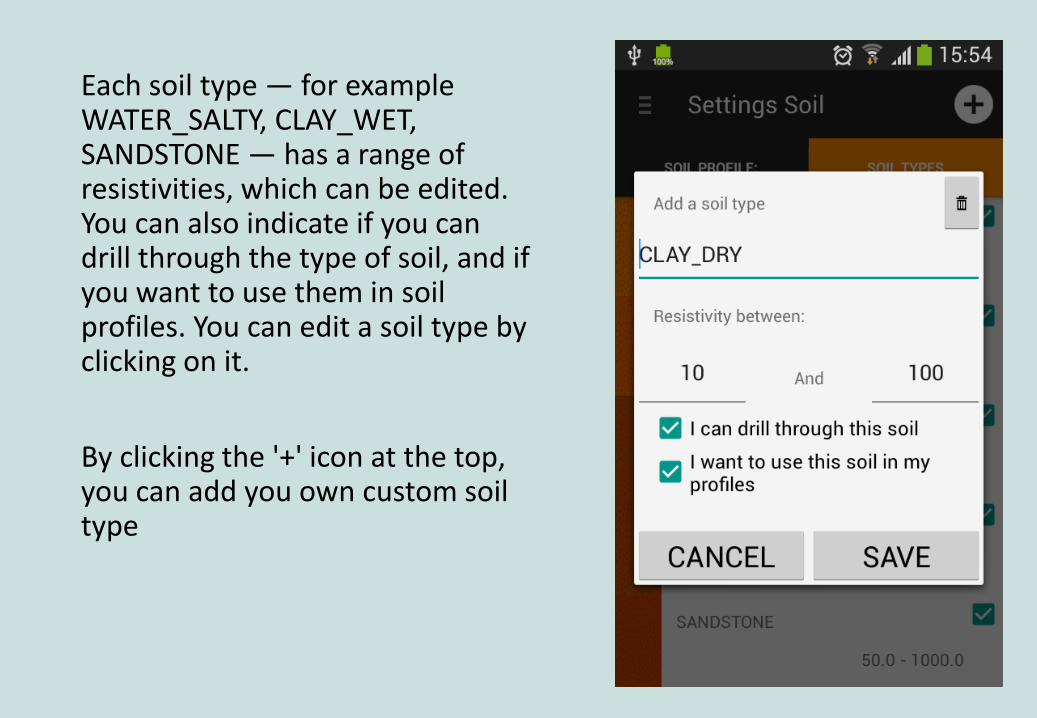
Each soil type — for example WATER_SALTY, CLAY_WET, SANDSTONE — has a range of resistivities, which can be edited. You can also indicate if you can drill through the type of soil, and if you want to use them in soil profiles. You can edit a soil type by clicking on it.
By clicking the '+' icon at the top, you can add you own custom soil type
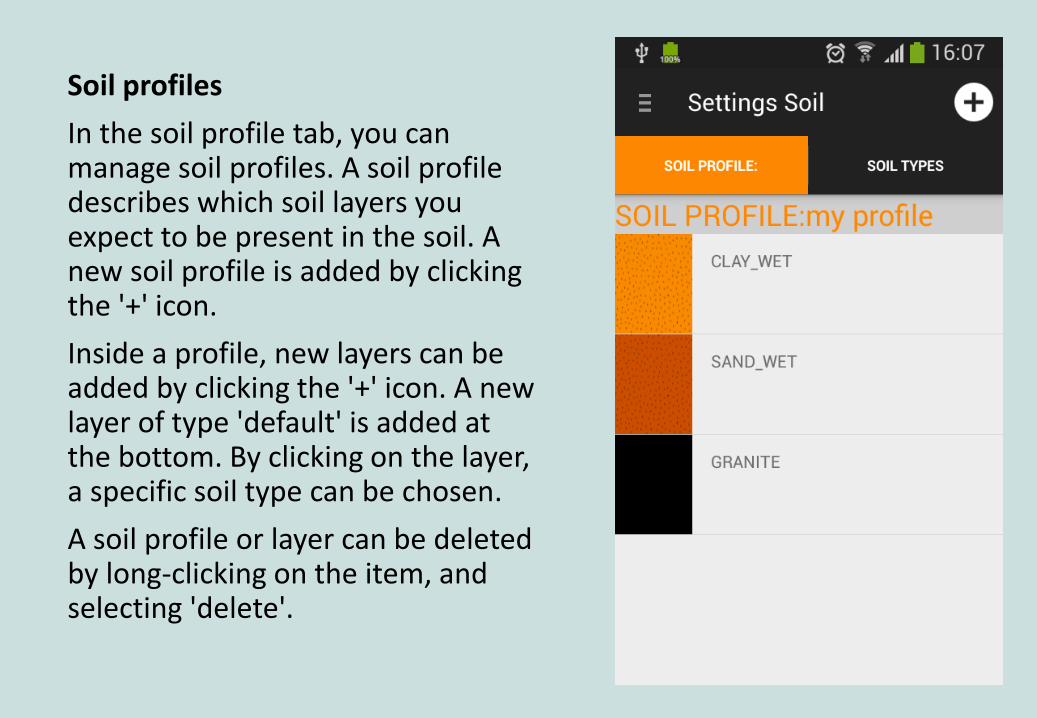
Soil profiles
In the soil profile tab, you can manage soil profiles. A soil profile describes which soil layers you expect to be present in the soil. A new soil profile is added by clicking the '+' icon.
Inside a profile, new layers can be added by clicking the '+' icon. A new layer of type 'default' is added at the bottom. By clicking on the layer, a specific soil type can be chosen.
A soil profile or layer can be deleted by long-clicking on the item, and selecting 'delete'.
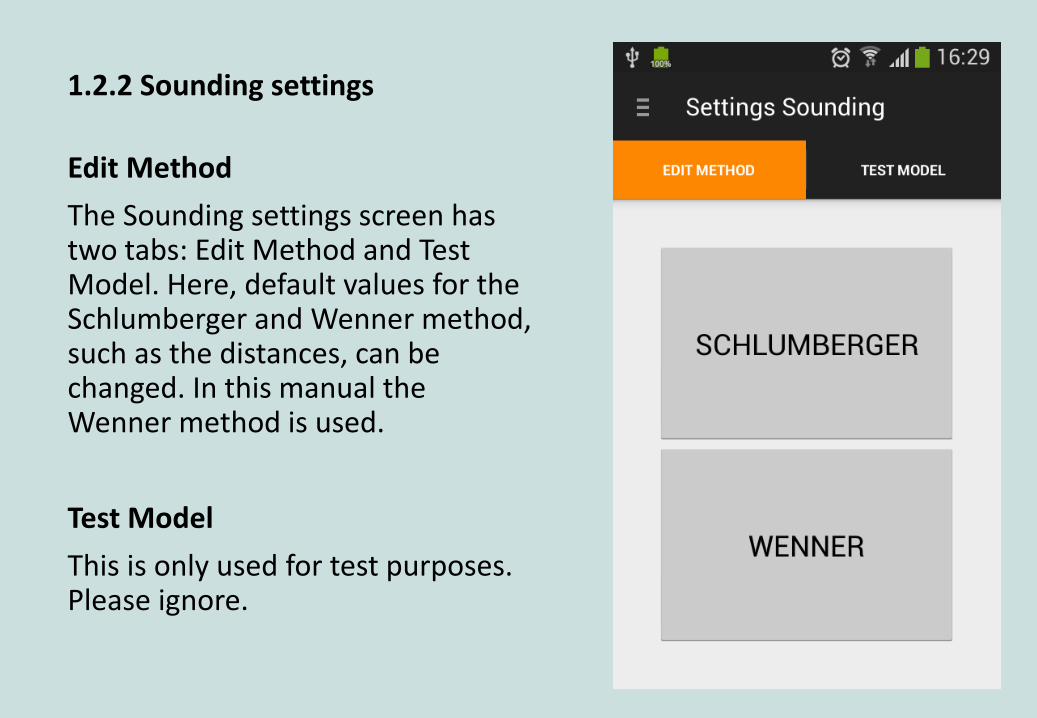
1.2.2 Sounding settings
Edit Method
The Sounding settings screen has two tabs: Edit Method and Test Model. Here, default values for the Schlumberger and Wenner method, such as the distances, can be changed. In this manual the Wenner method is used.
Test Model
This is only used for test purposes. Please ignore.
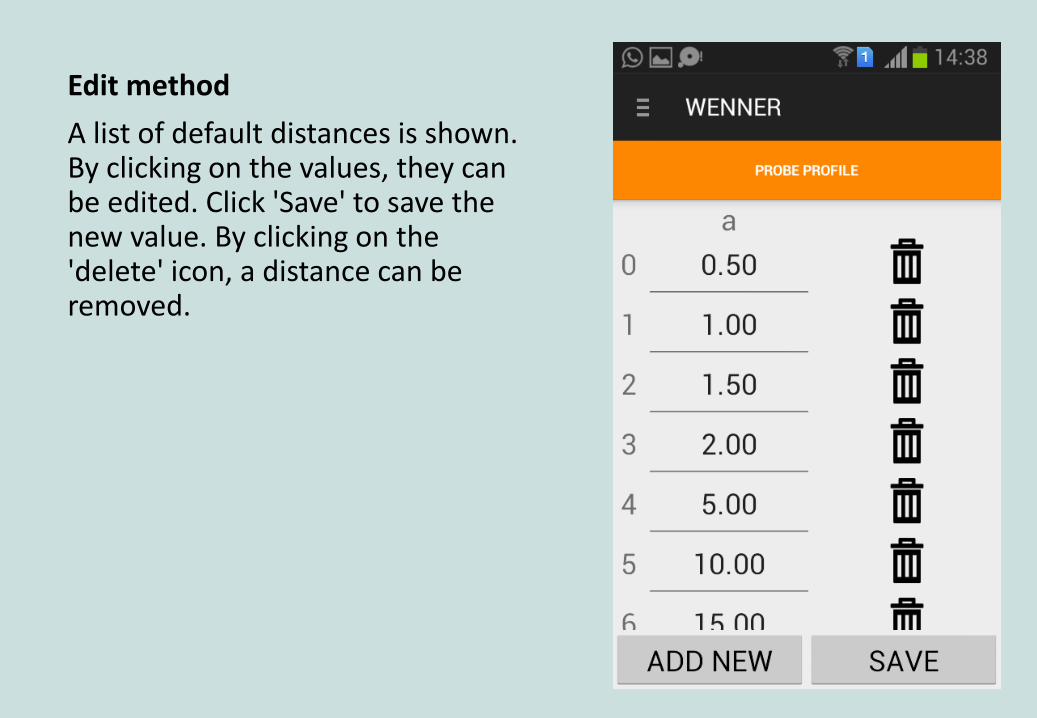
Edit method
A list of default distances is shown. By clicking on the values, they can be edited. Click 'Save' to save the new value. By clicking on the 'delete' icon, a distance can be removed.
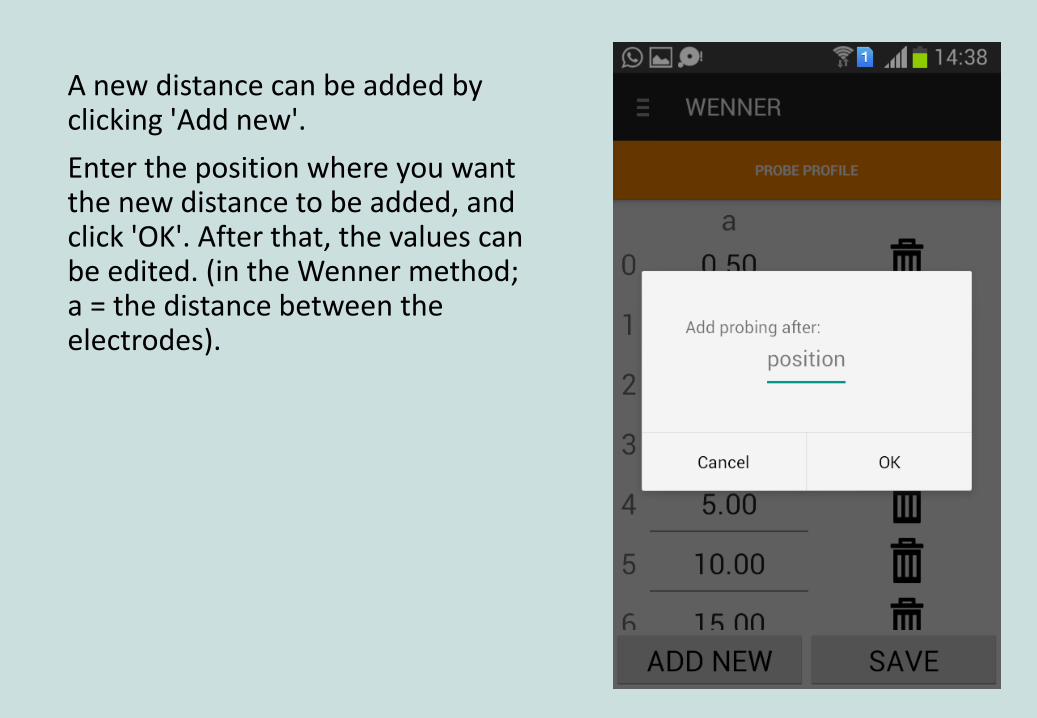
A new distance can be added by clicking 'Add new'.
Enter the position where you want the new distance to be added, and click 'OK'. After that, the values can be edited. (in the Wenner method; a = the distance between the electrodes).
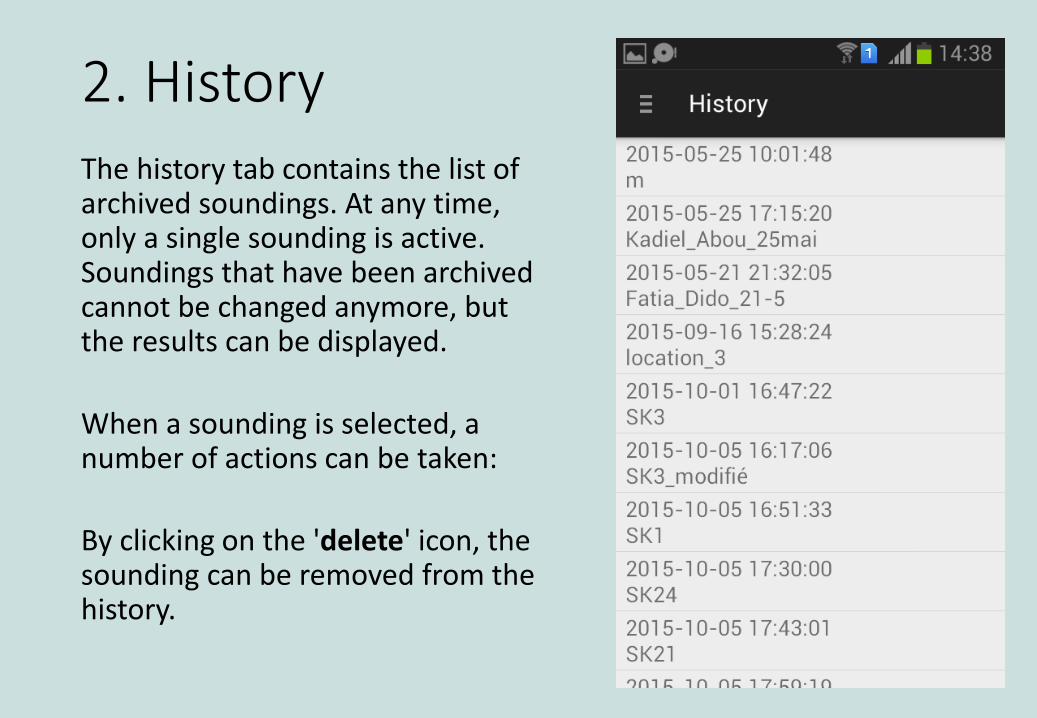
2. HistoryThe history tab contains the list of archived soundings. At any time, only a single sounding is active. Soundings that have been archived cannot be changed anymore, but the results can be displayed.
When a sounding is selected, a number of actions can be taken:
By clicking on the 'delete' icon, the sounding can be removed from the history.

Upload data to server - this will upload the VES data to a central database. From there, the data can be viewed, and downloaded to a computer. The database can be accessed through: http://practica.org/publications/manual-siting-kit-and-bedrock-app/
Show measurements - this will show a list of the measurement data.
Show result - this will display the result of the VES interpretation
Edit as new - this will make the sounding the currently active sounding again.
3. PrepareThis section is mainly experimental, and will be used in a later version to provide additional functionality. At the moment, it can be used to download VES data from the central server.

3.1 Download data for this device
When 'this device' is selected, and 'Show files' is clicked, the files present on the central database are shown. By clicking on one of the items, the data will be downloaded and placed in the History. From there, it can be displayed.
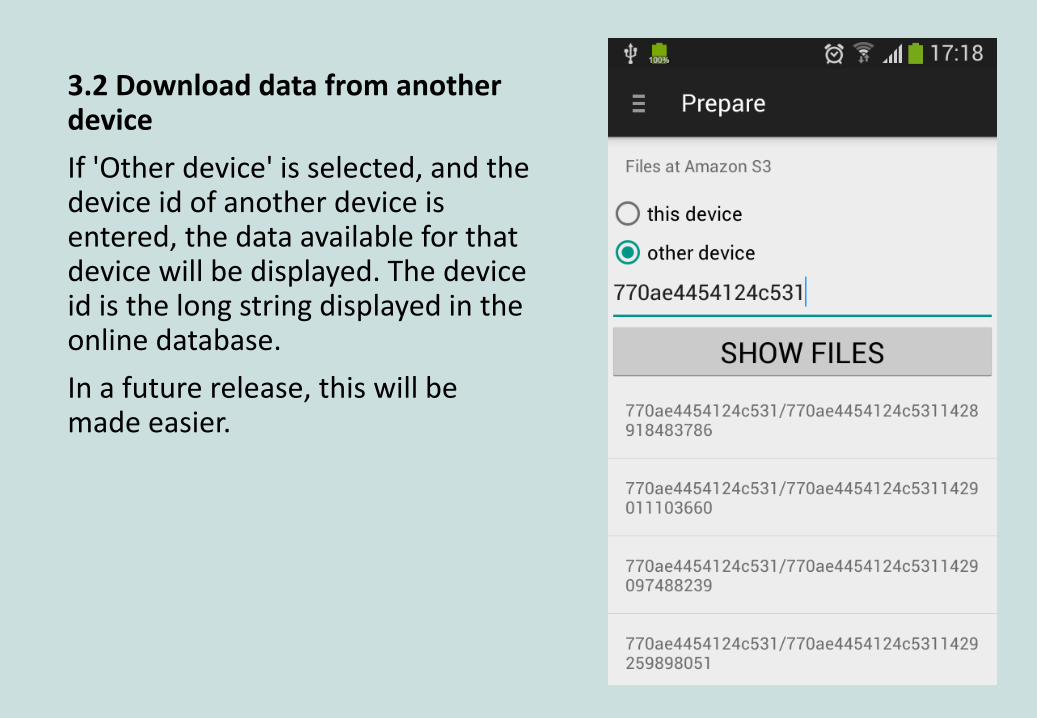
3.2 Download data from another device
If 'Other device' is selected, and the device id of another device is entered, the data available for that device will be displayed. The device id is the long string displayed in the online database.
In a future release, this will be made easier.

4. SoundingWhen there is no active sounding, a screen is shown to create a new sounding.
The app uses GPS to determine the present location. It is recommended to switch on the GPS (location) at this stage only. To save your battery, switch off the GPS right after this step and put your phone on flight mode.
GPS location - When 'Get location', is clicked, the app will determine the GPS location. This should be done while standing at the centre of where the VES measurement will be done.

When the location is found, the circle will be displayed as green, and the location will be shown. The accuracy of the position in meters is displayed within the green circle.
Name - a name for this sounding: Preferably the identification nr. and name of the village
Method - The method for data entry. The options are: 'single', 'zero', or 'reverse current'. This is explained below.
Math - The VES method: Schlumberger or Wenner.
Click 'Save' to create the new sounding.

4.1 Data entry methods
The app supports three methods for data entry: 'single', 'zero', or 'reverse current'. The procedure described in this manual uses the ‘Zero’ method.
This is what the three methods mean:
• Single - this takes a single measurement. This can be used when a compensator is used, which compensates for the self potential of the Earth.

• Zero – In this method two measurements are taken. The first measurement is the voltage measured with no current. This is the self potential and polarity of the Earth. The second step is to measure the current and voltage when a current is applied to the system. To calculate the apparent resistivity, the app subtracts the two measurements.
• Reverse current - this takes two measurements. For the second measurement, the equipment should reverse the direction of the applied current. This can only be used if the equipment also reverses the direction of the measurement. To calculate the apparent resistivity, the app adds the two measurements, and calculates the average. In order for the results to be valid, any minus signs of the measured values need to be entered. It is very easy to get invalid results using this method, when the sign of the measurement is disregarded. Only use if you know what you are doing.
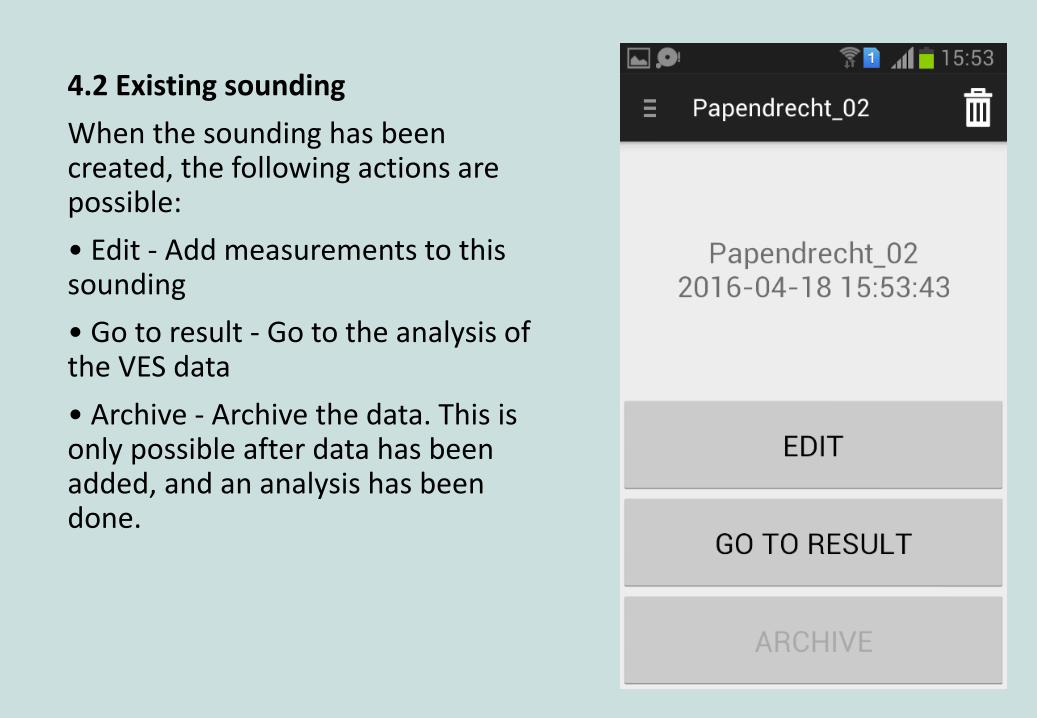
4.2 Existing sounding
When the sounding has been created, the following actions are possible:
• Edit - Add measurements to this sounding
• Go to result - Go to the analysis of the VES data
• Archive - Archive the data. This is only possible after data has been added, and an analysis has been done.

4.2.1 Edit
In the edit screen, VES measurements can be recorded. There are four tabs:
List - this lists the VES measurements positions.
Edit - this shows a single measurement
Chart - this shows a chart of all measurements.
Data - this shows a numerical list of all measurements

List
In the list tab, the VES measurement positions are shown. Click on a position to edit it.
Measurements that have already been filled in are shown with a black check mark. If there is a problem with a measurement, a red exclamation mark is shown.

Edit
In the edit tab, a single measurement can be edited. The default values for the distance are displayed:
a in case of Wenner,
AB/2 and MN/2 in the case of Schlumberger
Values can be edited by clicking on them.

Once values have been filled in for the current and voltage, the apparent resistivity ‘Res’ is displayed.
In some cases the app will display a warning. For example, when the present apparent resistivity is very different from the former value, which might indicate a measurement error, a warning will be displayed.

Chart
The chart tab shows a chart of the measured values. While taking measurements, this tab is very useful as it can be used to check the quality of the data. The curve should be smooth, so outliers can be readily detected. Often, an outlier will be caused by a faulty value, for example a wrong distance, or a value in volts instead of mili-volts.

Data
The ‘Data’ tab shows a numerical list of all measurements, including the apparent resistivity.

4.2.2 Go to result
In the result screen, the VES data can be analysed. First, select the number of layers which you expect, and click 'Calculate result'. This will analyse the VES data, and compute values for the thickness and resistivity of the layers that best fit the measurement data. For each number of layers, it tries a number of different starting conditions, in order to improve the chance to find a good solution. After the analysis is complete, the layers thicknesses and resistivities are shown.

Select number of layers
The numbers of layers used in the computation largely determines the outcome of the interpretation.
To select the right number of layers; one should have a look at the shape of the chart. A change of direction (or bend) of the curve indicates a new layer. In this example 3 layers should be selected.
It is recommended to limit the use of a 4 or 5 layer model, because the results of the interpretation will be less reliable.

Locking values
In many cases, it is desirable to lock the value of the resistivity of a certain layer. For example, it might be known that the bottom layer has a certain resistivity. The values of the resistivities of the layers can be locked by clicking on the 'lock' icon. The values can be edited by clicking on the value. When 'Calculate result' is clicked, the values which are locked will be kept constant.
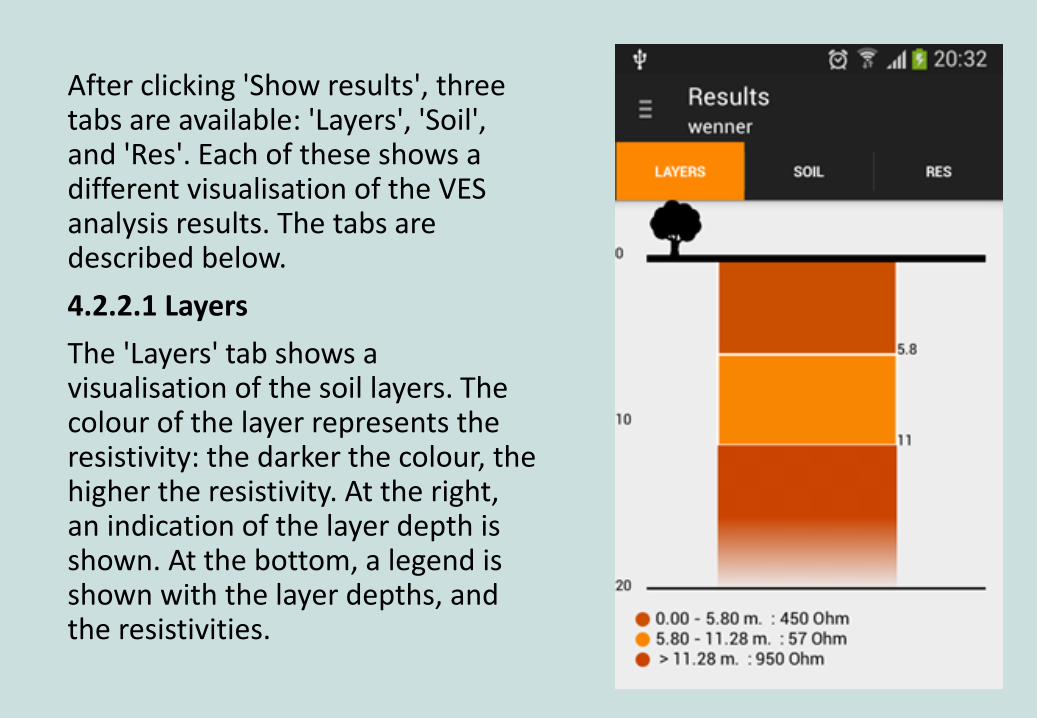
After clicking 'Show results', three tabs are available: 'Layers', 'Soil', and 'Res'. Each of these shows a different visualisation of the VES analysis results. The tabs are described below.
4.2.2.1 Layers
The 'Layers' tab shows a visualisation of the soil layers. The colour of the layer represents the resistivity: the darker the colour, the higher the resistivity. At the right, an indication of the layer depth is shown. At the bottom, a legend is shown with the layer depths, and the resistivities.
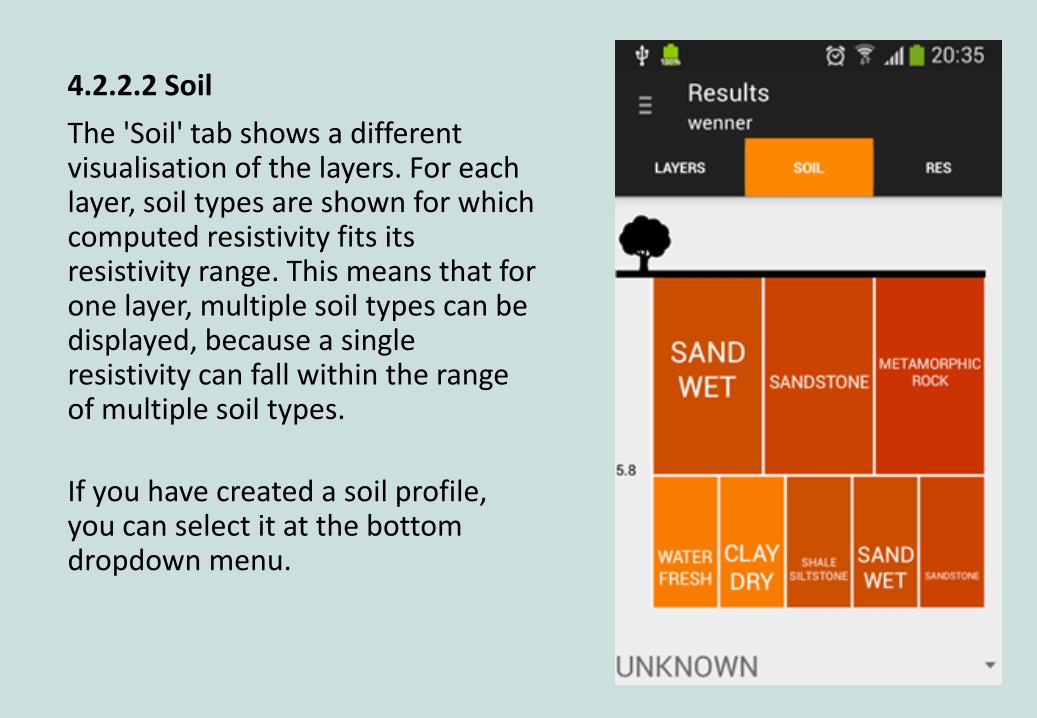
4.2.2.2 Soil
The 'Soil' tab shows a different visualisation of the layers. For each layer, soil types are shown for which computed resistivity fits its resistivity range. This means that for one layer, multiple soil types can be displayed, because a single resistivity can fall within the range of multiple soil types.
If you have created a soil profile, you can select it at the bottom dropdown menu.

4.2.2.3 Res
The 'Res' tab (resistivity) displays a chart which combines the VES measurements and the computed layer model. The blue dots represent the actual measurements. The red line is the resistivity of the computed model. The green line represents the resistivity values of the layers at different depths. The chart can be zoomed by pinching with two fingers.
Please note that the app does not show the exact soil layers and depths, but that interpretation by experts is required (see chapter E).
E. Advanced interpretation
This chapter provides some quick insights to be used by professionals to make sense of the data collected and archivedusing the low-cost resistivity kit and Bedrock app. This chapter isnot exhaustive and still under development. The lessons are basedon first field experiences, but will be complemented early 2017.
Please note that the experience of the expert doing the data interpretation is the key determinant for a quality VES analysis. The Bedrock app is a tool to help this interpretation and not a substitute to expert analyses.

E1. Relation of electrode spacing (a) and depth
The following pages visualise the measuring depth corresponding to the electrode spacing “a”. Three images show the same soil profile consisting of two layers: a top soil with a low resistivity (50 Ohm-m) and a second soil layer with a high resistivity (1000 Ohm-m). The electrode spacing “a” and thereby the measuring depth are increased each image. The orange bullet in the graph indicates the measured resistivity (apparent resistivity) for the particular electrode spacing.
It should be considered that the current flows through the soil like a bundle of lines. This is why the apparent resistivity indicates an average value for all soil layers that are traversed; rather than the resistivity of a particular soil layer at a specific depth.

Electrode spacing a = 10
In this image the deepest line of the current bundle just touches the second soil layer. This is where the chart starts to change its slope. The depth where the new soil layer starts is equal to “a” , in this case 10 m. The fact that the resistivity in the beginning of the chart is constant (horizontal), indicates that the top soil is homogenous for 10 meters with a resistivity of 50 Ohm-m.

Electrode spacing a = 20
When “a” increases the measuring depth increases as well. In this image a larger part of the current bundle flows through the second soil layer. Since the second soil layer has a resistivity that is higher than 50 Ohm-m the apparent resistivity increases.
When entering a soil layer with a much higher or lower resistivity; the chart usually goes up or down by 45 degrees. Ultimately (in the next page) the resistivity graph will show an asymptote, which means the slope will slowly reduce to zero degrees (horizontal line).

Electrode spacing a = 100
This image shows the same soil profile, but for again a larger electrode spacing and depth. The asymptote is reached because the depth has increased so much that the share of the current flowing through the first layer becomes negligible. The apparent resistivity at the asymptote indicates the real resistivity of the second soil layer (see chart: 1000 Ohm-m).

E2. Chart-based interpretationIt is recommended to base your interpretation on the chart primarily. The analysis made by the Bedrock app is only a tool to facilitate this interpretation (by showing the results of different mathematical models that can be compared).
• A change in the slope of the chart indicates the start of a new layer at a depth close to “a”.
• An exception to this rule is when the curve reaches an asymptote value. This does not indicate a new layer, but simply means that the measured resistivity is now fully determined by the deepest layer.
• If the asymptote is not fully reached, you can predict the resistivity by extrapolation. This value could also be used to lock the resistivity of the corresponding layer (see chapter D - 4.2.2). This is especially useful when you already have an idea of the resistivity because you have reached the asymptote during earlier soundings in the area.

F. Local calibrationOnce starting in a new area, it is important to collect data on the local hydrogeology before starting the soundings.
Step 1: Collect local data and decide: VES needed Yes/No
An analysis of geological maps, drilling logs, field observations and community consultation should be used to answer the followingquestions:
• What is the static water table?
• What is the depth to bedrock?
• What is the soil lithology? How does it vary within the area?
• What formations and resistivities can we expect?
Based on this one can decide whether a VES sounding is necessaryor not.

There is a high overlap in resistivities of different formations (seetable in chapter B). To narrow down the range of potential soiltypes and to verify the reliability of the planned soundings; the resistivity can be measured for a known soil profile.
Step 2: VES soundings at a well with known formations
Look for a well with an available drilling log or ask communitymembers to describe the soil formations (and depth) theyencountered while digging the well.
Now do a complete VES sounding and interpretation as describedin chapter C and D right next to the well. Try to link the measuredresistivities with the described soil/rock formations.
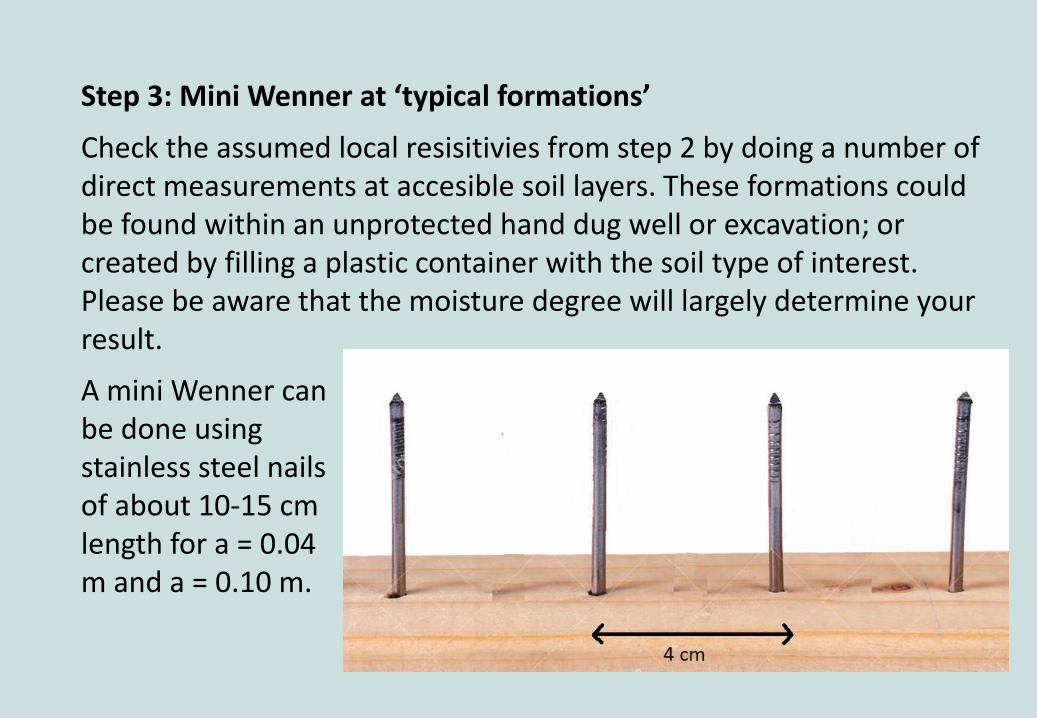
Step 3: Mini Wenner at ‘typical formations’
Check the assumed local resisitivies from step 2 by doing a number of direct measurements at accesible soil layers. These formations couldbe found within an unprotected hand dug well or excavation; or created by filling a plastic container with the soil type of interest. Please be aware that the moisture degree will largely determine yourresult.
A mini Wenner canbe done usingstainless steel nailsof about 10-15 cm length for a = 0.04 m and a = 0.10 m.
Mini Wenner procedure
1. Press the nails into the soil formation.
2. Do not use the invertor and VES box.
3. Connect the inner nails to the Volt meter.
4. Connect the current meter to outer nail A and to the negative pole of the car battery like displayed on the following page.
5. Take a zero measurement.
6. Connect outer nail B to the positive pole of the car battery. There will be current on the system directly!
7. Rapidly note the current and voltage and disconnect the cable at the positive pole of the battery.
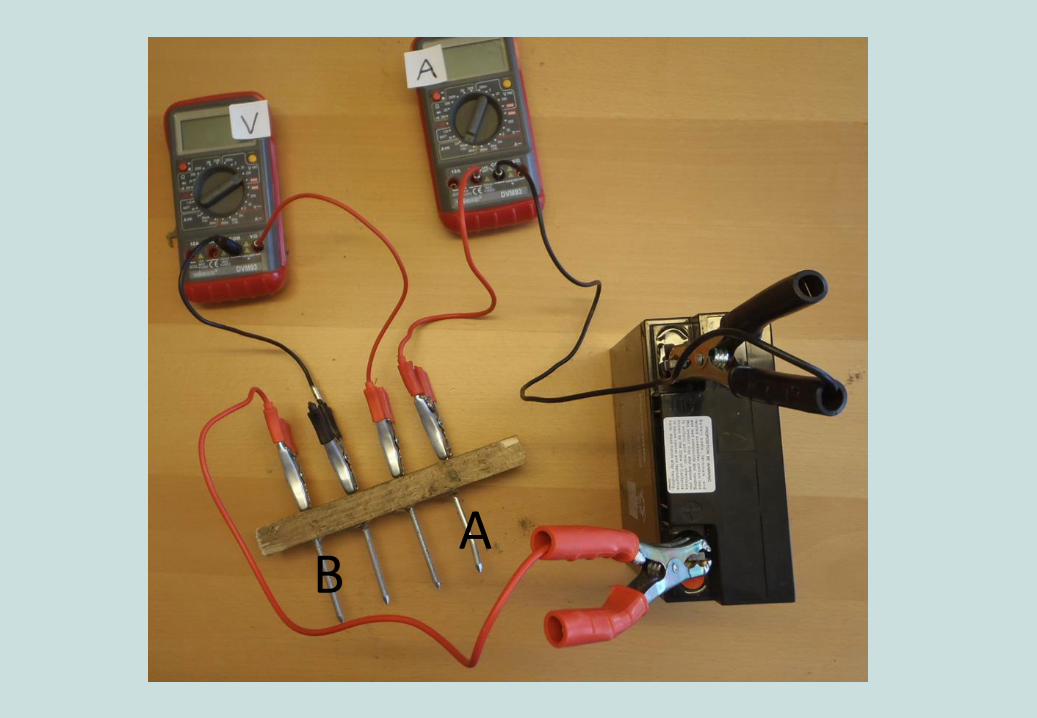
AB

Mini Wenner procedure
8. Open the Bedrock app and start a new sounding. Select Wenner and the Zero method.
9. In the ‘Edit’ screen: click the plus(+) button to add a = 0.04
10. Enter the measured voltage and current for a = 0.04.
11. The apperant resistivity (Res) displayed below is equal to the resistivity of the measured typical formation.
12. Repeat the procedure using an electrode spacing of 10 cm distance (a = 0.1). The Res should be more or less the same.
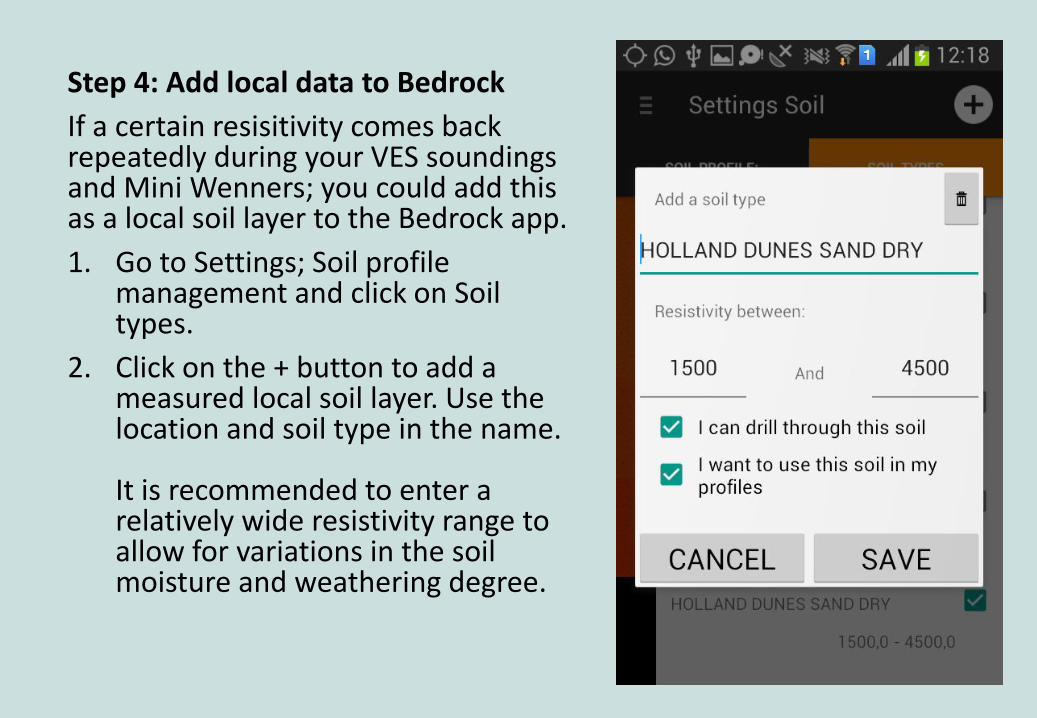
Step 4: Add local data to Bedrock
If a certain resisitivity comes back repeatedly during your VES soundings and Mini Wenners; you could add this as a local soil layer to the Bedrock app.
1. Go to Settings; Soil profile management and click on Soil types.
2. Click on the + button to add a measured local soil layer. Use the location and soil type in the name.
It is recommended to enter a relatively wide resistivity range to allow for variations in the soil moisture and weathering degree.
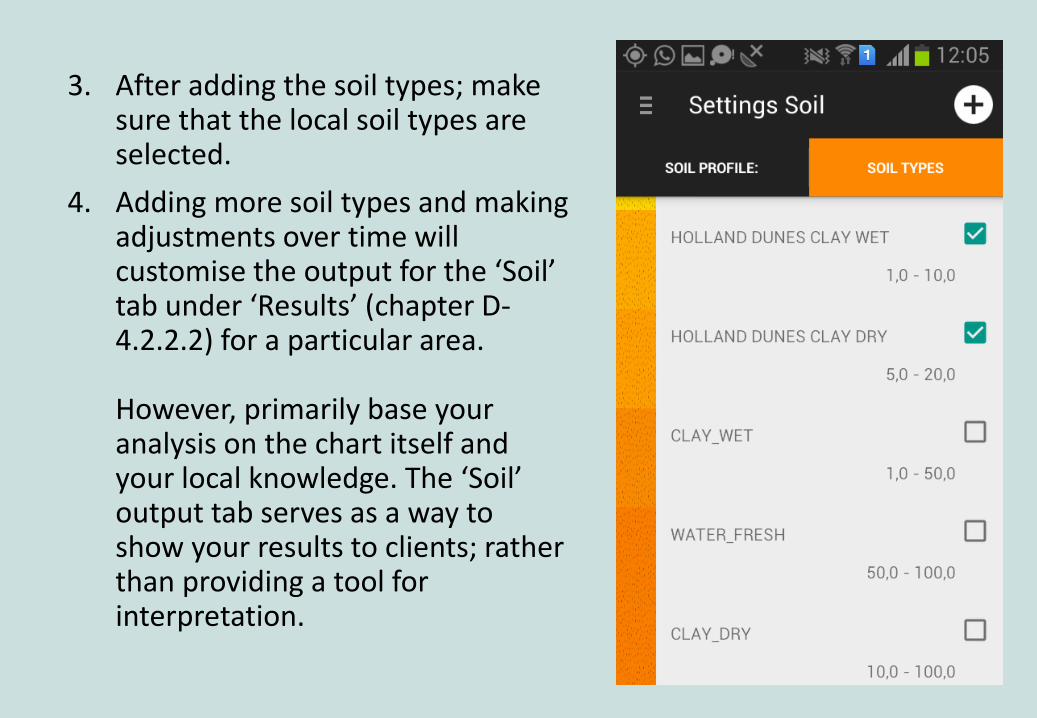
3. After adding the soil types; make sure that the local soil types are selected.
4. Adding more soil types and making adjustments over time will customise the output for the ‘Soil’ tab under ‘Results’ (chapter D-4.2.2.2) for a particular area.
However, primarily base your analysis on the chart itself and your local knowledge. The ‘Soil’ output tab serves as a way to show your results to clients; rather than providing a tool for interpretation.

G. Problem solving
This chapter details the identification and possible solutions for the most frequently encountered field problems:
A. Problems reading the multimeter values
B. Failure of the invertor (often expressed as a beeping signal)
C. Problems with the Bedrock app

There are a number of potential problems:
1. The multimeter shows -1 or 1
2. The values are not stable
3. The values are too low
1. The multimeter shows -1 or 1
This means the multimeter is set on the wrong scale. Keep in mind that the measured value should be smaller than the selected scale; but larger than the previous scale.
Example: the measured value is 500 mV. This is smaller than 2000 mV and larger than 200mV. Hence the 2000 mV scale is right.
A. Problems regarding the multimeter values

2. The values are not stable
The voltage values can change continously as a result of natural soil tensions and ‘induced polarisation’ processes. To minimise the resulting error there should not be more than a few seconds between the zero and current measurement.
If the value changes back and forth with large variations; there may be a connection problem. Use the resistance mode on the multimeter to check the connections in the circuit (see picture). Most multimeters release a sound signal when there is a connection.
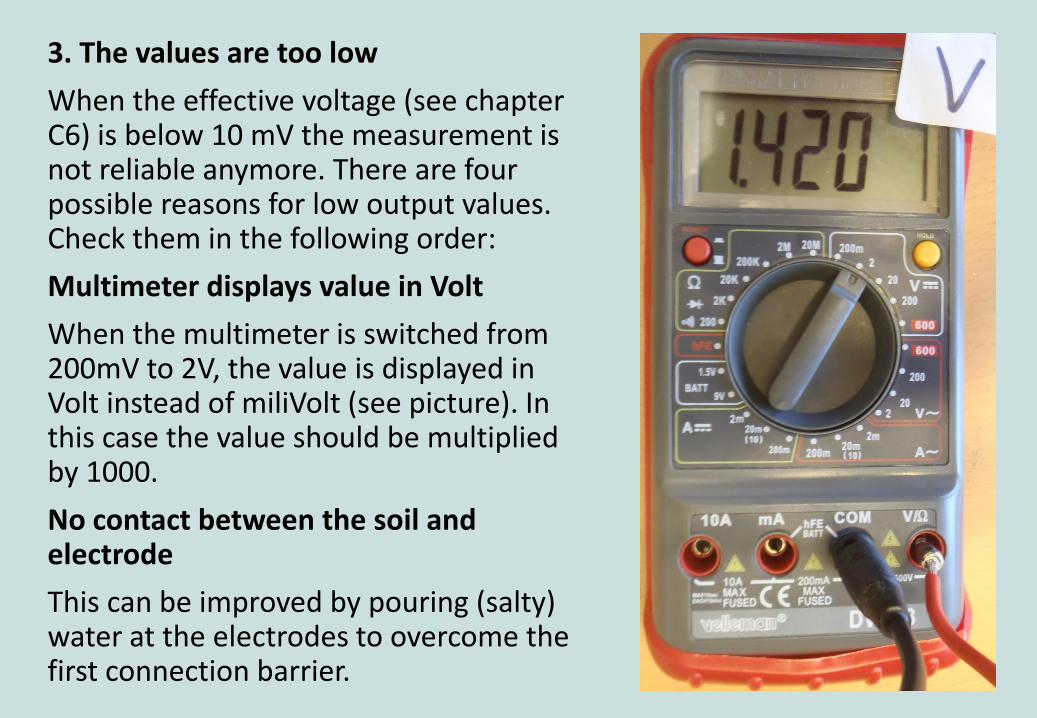
3. The values are too low
When the effective voltage (see chapter C6) is below 10 mV the measurement is not reliable anymore. There are four possible reasons for low output values. Check them in the following order:
Multimeter displays value in Volt
When the multimeter is switched from 200mV to 2V, the value is displayed in Volt instead of miliVolt (see picture). In this case the value should be multiplied by 1000.
No contact between the soil and electrode
This can be improved by pouring (salty) water at the electrodes to overcome the first connection barrier.

Low power output
Check the equipment to verify if the power output is sufficient:
1. Measure the output voltage and current of the VES box. If the values are around 250 Volt DC and 1.3 Amp DC the power output is right.
2. If the values are lower, measure the invertor output. This should be around 230 Volt AC.
3. Check the battery output. This should be about 12 Volt DC.

Working limit of the kit reached
When the distances (a) between the electrodes are large; the working limit of the kit can be approached. It is recommended to continue the measurements; but take into account that the values are less reliable if the effective voltage is below 10 mV.
After entering the data in the app: check if the chart if smooth. If the measurements with low effective voltage are outliers (not following the curve) they may be removed.

B: Failure of the invertor
The invertor can indicate a failure (for example by releasing an alarm sound) in case of overheating or a short circuit.
Overheating
Let the invertor cool down for a while. Make sure it is protected from the sun by placing it in a box or other cover.
Highly conductive soils
If the top soil is extremely conductive (very low resistivity) a large current could overload the invertor (and burn the 200 mA fuse of your multimeter). This often occurs in wet or clayey soils. If the soil is too conductive you should take out the invertor and do measurements using the battery-only circuit (see chapter C4).
Short circuit in equipment
If the invertor failure persists even when the electrical load is low (less than 200 mA measured during the sounding) you should ask an electrician to open the VES box and check the circuit.

C1: The Bedrock app does not work
If the Bedrock app stagnates or crashes; take step 1 and try again. In case this does not solve the problem: continue with the next step.
1. Restart your phone – try again
2. Delete the active sounding and start a new one – try again
3. Try to upload your soundings to the server first. Then delete and re-install the app – try again
4. Pose your question at [email protected]
Any suggestions for improvement are most welcome.

C2: Difficulty to get the GPS locationIt’s essential to capture the GPS location at the start of each sounding. If it takes too long to find the location, switch your phone off and on before starting a new sounding. You can also download the following application:
GPS Status & Toolbox
Download: https://play.google.com/store/apps/details?id=com.eclipsim.gpsstatus2
User manual: http://mobiwia.com/gpsstatus
The app will show whether your GPS works and improve its performance. The app is also a useful tool to capture your elevation (e.g. to compare the elevation of your sounding location and the location where you measured the static water level).

PRACTICA FoundationGeulweg 16
3356LB PapendrechtThe Netherlands
Tel. +31 786 150 125www.practica.org
www.facebook.com/practicafoundation