becle, s.a.b. de c.v. reports fourth quarter and … the fourth quarter of 2017, total volume growth...
TRANSCRIPT

BECLE, S.A.B. de C.V. Reports Fourth Quarter and Fiscal 2017 Financial Results
Mexico City, Mexico, February 27, 2018 /BUSINESSWIRE/ -- BECLE, S.A.B. de C.V. (“Cuervo”,
“BECLE” or the “Company”) (BMV: CUERVO) today announced financial results for the quarter
ended December 31, 2017.
All figures in this release are derived from the Interim Consolidated Financial Statements of the Company as of
December 31, 2017 and for the three-month and twelve-month periods then ended and are prepared in accordance
with International Accounting Standard 34 “Interim Financial Reporting” of the International Financial Reporting
Standard (IFRS), which have been published in the Bolsa Mexicana de Valores (BMV).
Fourth Quarter 2017 Highlights
• Net Sales increased 13.0% to P$8,338 million pesos;
• Volume increased 4.3%, with growth in all regions;
• Gross margin increased 280 basis points (bp) to 58.4%;
• Operating profit increased 31.7% to P$1,937 million pesos;
• EBITDA increased 25.2% to P$2,048 million pesos, and EBITDA margin increased 240
bp to 24.6%; and
• Consolidated net income increased 289.7% to P$2,452 million pesos, resulting in
earnings per share of P$0.68.
Full Year 2017 Highlights
• Net Sales increased 6.4% to P$25,958 million pesos;
• Volume increased 0.3%, with Mexico volumes growing 6.3%. Normalized for 2016 buy-in
resulted in a volume growth of 6.4%;
• Gross margin increased 280 bp to 62.1%;
• Operating profit increased 19.8% to P$6,736 million pesos;
• EBITDA increased 17.9% to P$7,161 million pesos, and EBITDA margin increased 270
bp to 27.6%; and
• Consolidated net income increased 50.7% to P$4,744 million pesos, resulting in
earnings per share of P$1.35.
All abovementioned increases and decreases have been determined in comparison to the corresponding period in the
preceding year.

Management Commentary
We generated strong fourth quarter volume and net sales growth of 4.3% and 13.0%, respectively,
against very strong growth in the prior year when sales were positively impacted by buy-in ahead
of a price increase. Tequila growth was robust across our family of brands and we continue to
enjoy accelerated growth across our premium brands that is driving higher average net sales per
case, both in tequila and across our other spirits brands. Margin performance was equally
noteworthy during the fourth quarter as we expanded gross margins and reported 25% EBITDA
growth. We celebrated many accomplishments during 2017, including our initial public offering
and our most recently announced acquisition of the Pendleton Whisky brand assets. We have
built a global spirts business with an attractive growth profile and the financial assets to further
expand our growth portfolio of brands.
Fourth Quarter 2017 Results
During the fourth quarter of 2017, total volume growth was 4.3% to 6.4 million nine-liter cases
driven by 0.9% growth in the United States and Canada, a 2.9% increase in sales volumes in
Mexico and a 28.5% increase in the Rest of World (RoW) region. Volume growth in the Mexico
benefited from strong growth in tequila and a successful holiday season. Volume increased in the
United States and Canada despite approximately 600,000 cases of estimated buy-in ahead of a
price increase on January 1, 2017.
Volume by Region 4Q17 (in 000s nine-liter cases)
REGION 4Q17 4Q16 (VAR.% YOY) 3Q17 (VAR.% QOQ)
US & CANADA 3,114 3,086 0.9% 2,688 15.8%
MEXICO 2,576 2,503 2.9% 1,479 74.2%
ROW 726 565 28.5% 537 35.3%
TOTAL 6,417 6,154 4.3% 4,704 36.4%
Net sales increased 13.0% to P$8,338 million pesos compared to the same period in 2016, driven
by the selective price increases, sales mix and volume growth in all regions. Net sales in the
United States and Canada increased 9.9% versus the same period last year, largely explained
increased average net selling price per case reflecting price increases and favorable mix toward
premium products, partially offset by foreign exchange rates vs. the prior year. In the same period,
Mexico net sales increased by 14.3% over the prior year period as a result of volume growth,
favorable mix and pricing. Net sales of the RoW increased by 47.8% over the fourth quarter of
2016.
Net Sales by Region 4Q17 (in MXN$ millions)
REGION 4Q17 4Q16 (VAR.% YOY) 3Q17 (VAR.% QOQ)
US & CANADA 4,903 4,460 9.9% 3,645 34.5%
MEXICO 2,461 2,154 14.3% 1,304 88.7%
ROW 1,134 767 47.8% 816 39.0%
Intercompany Adjustment (159) - nm - nm
TOTAL 8,338 7,380 13.0% 5,765 44.6%

Volume of Jose Cuervo increased 3.4% compared the same period in 2016 and represented
33.3% of total volume for the fourth quarter of 2017. The Company’s Other Tequila brands
represented 17.9% of total volume with volume increasing 18.8% compared to the prior year
period. The Company’s Other Spirits brands represented 21.8% of total volume in the period and
experienced and 7.0% increase in volume over the fourth quarter of last year. Volume of Non-
alcoholic and Other represented 17.4% of total volume and volume and decreased by 10.1%
compared to the prior year period. Volume of ready-to-drink (RTDs) represented 9.7% of total
volume and increased by 7.7% compared to the prior year period.
Volume by Category 4Q17 (in 000s nine-liter cases)
CATEGORY 4Q17 4Q16 (VAR.% YOY) 3Q17 (VAR.% QOQ)
JOSE CUERVO 2,136 2,065 3.4% 1,571 36.0%
OTHER TEQUILAS 1,146 964 18.8% 717 59.7%
OTHER SPIRITS 1,397 1,306 7.0% 860 62.5%
NON-ALCOHOLIC & OTHER 1,117 1,243 -10.1% 1,002 11.5%
RTD 621 576 7.7% 553 12.2%
TOTAL 6,417 6,154 4.3% 4,704 36.4%
Net Sales of Jose Cuervo increased 5.0% compared the same period in 2016 and represented
35.3% of total net sales for the fourth quarter of 2017. Net sales of the Company’s Other Tequila
brands increased 35.5% compared to the prior year period and represented 26.4% of total net
sales. The Company’s Other Spirits brands represented 23.0% of total net sales in the period and
reported a 23.6% increase in net sales compared to the fourth quarter last of year. Net sales of
Non-alcoholic and Other represented 10.8% of total net sales and reported a decrease in net
sales of 2.4% compared to the prior year period. Net sales of ready-to-drink (RTDs) represented
6.4% of total net sales and reported an increase of 11.7% compared to the prior year period.
Net sales by Category 4Q17 (in MXN$ millions)
CATEGORY 4Q17 4Q16 (VAR.% YOY) 3Q17 (VAR.% QOQ)
JOSE CUERVO 2,943 2,803 5.0% 2,115 39.1%
OTHER TEQUILAS 2,203 1,625 35.5% 1,333 65.2%
OTHER SPIRITS 1,918 1,552 23.6% 1,175 63.1%
NON-ALCOHOLIC & OTHER 903 926 -2.4% 733 23.2%
RTD 530 475 11.7% 407 30.2%
Intercompany Adjustment (159) - nm - nm
TOTAL 8,338 7,380 13.0% 5,765 44.6%
Gross profit during the fourth quarter of 2017 increased 18.7% over the same period in 2016 to
P$4,869 million pesos. Gross margin as a percent of sales was 58.4% for the fourth quarter of
2017 compared to 55.6% for the fourth quarter of 2016. Gross margin was positively impacted by
a favorable pricing effect traceable to US and Mexico price increases product mix and vertical

integration, partially offset by translation effect due to the stronger Mexican Peso vs. the US dollar
when compared to the prior year.
Advertising, marketing and promotion (AMP) decreased 10.9% to P$1,825 million pesos
compared to the fourth quarter of 2016. As a percentage of net sales, AMP decreased to 21.9%
from 27.8% in the prior year period. The decrease reflects planned timing of AMP spend and
strong growth in volume and net sales.
Operating profit during the fourth quarter of 2017 increased 31.7% to P$1,937 million pesos
compared to the same period last year. Operating margin as a percentage of sales increased to
23.2% as compared to 19.9% in the prior year period, reflecting increased gross margin, lower
AMP and distribution expense, partially offset by higher selling, general & administrative expenses
(SG&A), all as a percentage of net sales.
EBITDA in the fourth quarter of 2017 increased by 25.2% to P$2,048 million pesos compared to
P$1,636 million pesos during the fourth quarter of 2016.
Net Comprehensive Financing result was positive at P$660 million pesos during the fourth quarter
as a result of modest devaluation of the Mexican Peso vs. the US dollar during the quarter and
the Company’s net cash balance.
Consolidated net income in the fourth quarter of 2017 was P$2,452 million pesos, a 289.7%
increase compared to the prior year period. Consolidated net income in the fourth quarter was
benefited from favorable, non-cash, one-time tax impacts. These tax impacts, which represent a
net benefit of 766 million pesos, correspond to: a) Tax loss generated in Becle behind exchange
rate and inflation effects on cash position, b) The enactment of the U.S. tax reform, which resulted
in the re-valuation of the Company’s net deferred tax liability of U.S. affiliates, and c) Partial offset
from changes in the estimation of tax receivables. Earnings per share were P$0.68 in the fourth
quarter of 2017.
Full Year 2017 Results
During the full year of 2017, total volume growth was 0.3% to 20.5 million nine-liter cases,
reflecting a 6.3% increase in sales volumes in Mexico and a 15.1% increase in the Rest of World
(RoW) region, partially offset by a 4.9% decline in the United States and Canada as a result of
lower volumes during the first half of the year as a result of the January 1, 2017 price increase.
Volume by Region for Full Year 2017 (in 000s nine-liter cases)
REGION 2017 2016 (VAR.% YOY)
US & CANADA 11,844 12,451 -4.9%
MEXICO 6,355 5,981 6.3%
ROW 2,293 1,993 15.1%
TOTAL 20,492 20,424 0.3%
Net sales during the full year 2017 increased 6.4% to P$25,958 million pesos compared to the
same period in 2016, driven by volume growth and higher average net selling prices per case.
Net sales in United States and Canada increased 2.6% versus the same period last year, largely
explained by price increases and favorable sales mix, partially offset by the unfavorable effect of
foreign exchange. Mexico net sales increased by 15.3% over the prior year period as a result of

both volume growth and higher average net selling prices per case. Net sales of the RoW
increased by 18.6% over the full year of 2016.
Net Sales by Region for Full Year 2017 (in MXN$ millions)
REGION 2017 2016 (VAR.% YOY)
US & CANADA 16,974 16,545 2.6%
MEXICO 5,786 5,018 15.3%
ROW 3,358 2,832 18.6%
Intercompany Adjustment (159) - nm
TOTAL 25,958 24,396 6.4%
Volume of Jose Cuervo increased 1.7% compared the same period in 2016 and represented
32.8% of total volume for the full year of 2017. The Company’s Other Tequila brands represented
15.0% of total volume with volume increasing 9.0% compared to the prior year period. The
Company’s Other Spirits brands represented 18.3% of total volume in the period and experienced
a 0.9% decrease in volume over the full year of 2016. Volume of Non-alcoholic and Other
represented 20.9% of total volume and volume decreased by 3.8% compared to the prior year
period. Volume of ready-to-drink (RTDs) represented 13.0% of total volume and decreased by
3.2% compared to the prior year period.
Volume by Category for Full Year 2017 (in 000s nine-liter cases)
CATEGORY 2017 2016 (VAR.% YOY)
JOSE CUERVO 6,718 6,609 1.7%
OTHER TEQUILAS 3,067 2,815 9.0%
OTHER SPIRITS 3,752 3,787 -0.9%
NON-ALCOHOLIC & OTHER 4,285 4,455 -3.8%
RTD 2,669 2,758 -3.2%
TOTAL 20,492 20,424 0.3%
Net Sales of Jose Cuervo represented 36.6% of total net sales for the full year of 2017 and
reported an increase in net sales of 6.4% compared the same period in 2016. The Company’s
Other Tequila brands represented 22.7% of total net sales and increased net sales 18.6%
compared to the prior year period. The Company’s Other Spirits brands represented 20.1% of
total net sales in the period and reported a 2.2% increase in net sales compared to the full year
of 2016. Net sales of Non-alcoholic and Other represented 12.9% of total net sales and reported
an increase in net sales of 1.5% compared to the prior year period. Net sales of ready-to-drink
(RTDs) represented 8.4% of total net sales and reported an increase of 3.0% compared to the
prior year period.
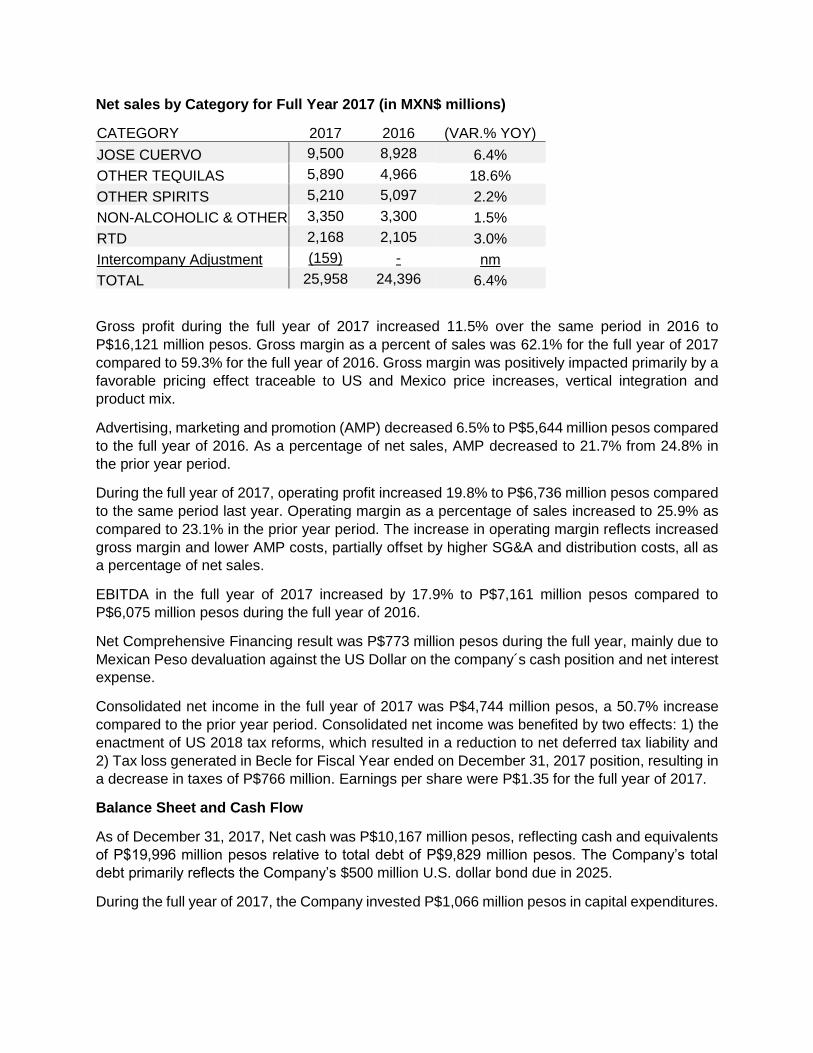
Net sales by Category for Full Year 2017 (in MXN$ millions)
CATEGORY 2017 2016 (VAR.% YOY)
JOSE CUERVO 9,500 8,928 6.4%
OTHER TEQUILAS 5,890 4,966 18.6%
OTHER SPIRITS 5,210 5,097 2.2%
NON-ALCOHOLIC & OTHER 3,350 3,300 1.5%
RTD 2,168 2,105 3.0%
Intercompany Adjustment (159) - nm
TOTAL 25,958 24,396 6.4%
Gross profit during the full year of 2017 increased 11.5% over the same period in 2016 to
P$16,121 million pesos. Gross margin as a percent of sales was 62.1% for the full year of 2017
compared to 59.3% for the full year of 2016. Gross margin was positively impacted primarily by a
favorable pricing effect traceable to US and Mexico price increases, vertical integration and
product mix.
Advertising, marketing and promotion (AMP) decreased 6.5% to P$5,644 million pesos compared
to the full year of 2016. As a percentage of net sales, AMP decreased to 21.7% from 24.8% in
the prior year period.
During the full year of 2017, operating profit increased 19.8% to P$6,736 million pesos compared
to the same period last year. Operating margin as a percentage of sales increased to 25.9% as
compared to 23.1% in the prior year period. The increase in operating margin reflects increased
gross margin and lower AMP costs, partially offset by higher SG&A and distribution costs, all as
a percentage of net sales.
EBITDA in the full year of 2017 increased by 17.9% to P$7,161 million pesos compared to
P$6,075 million pesos during the full year of 2016.
Net Comprehensive Financing result was P$773 million pesos during the full year, mainly due to
Mexican Peso devaluation against the US Dollar on the company´s cash position and net interest
expense.
Consolidated net income in the full year of 2017 was P$4,744 million pesos, a 50.7% increase
compared to the prior year period. Consolidated net income was benefited by two effects: 1) the
enactment of US 2018 tax reforms, which resulted in a reduction to net deferred tax liability and
2) Tax loss generated in Becle for Fiscal Year ended on December 31, 2017 position, resulting in
a decrease in taxes of P$766 million. Earnings per share were P$1.35 for the full year of 2017.
Balance Sheet and Cash Flow
As of December 31, 2017, Net cash was P$10,167 million pesos, reflecting cash and equivalents
of P$19,996 million pesos relative to total debt of P$9,829 million pesos. The Company’s total
debt primarily reflects the Company’s $500 million U.S. dollar bond due in 2025.
During the full year of 2017, the Company invested P$1,066 million pesos in capital expenditures.
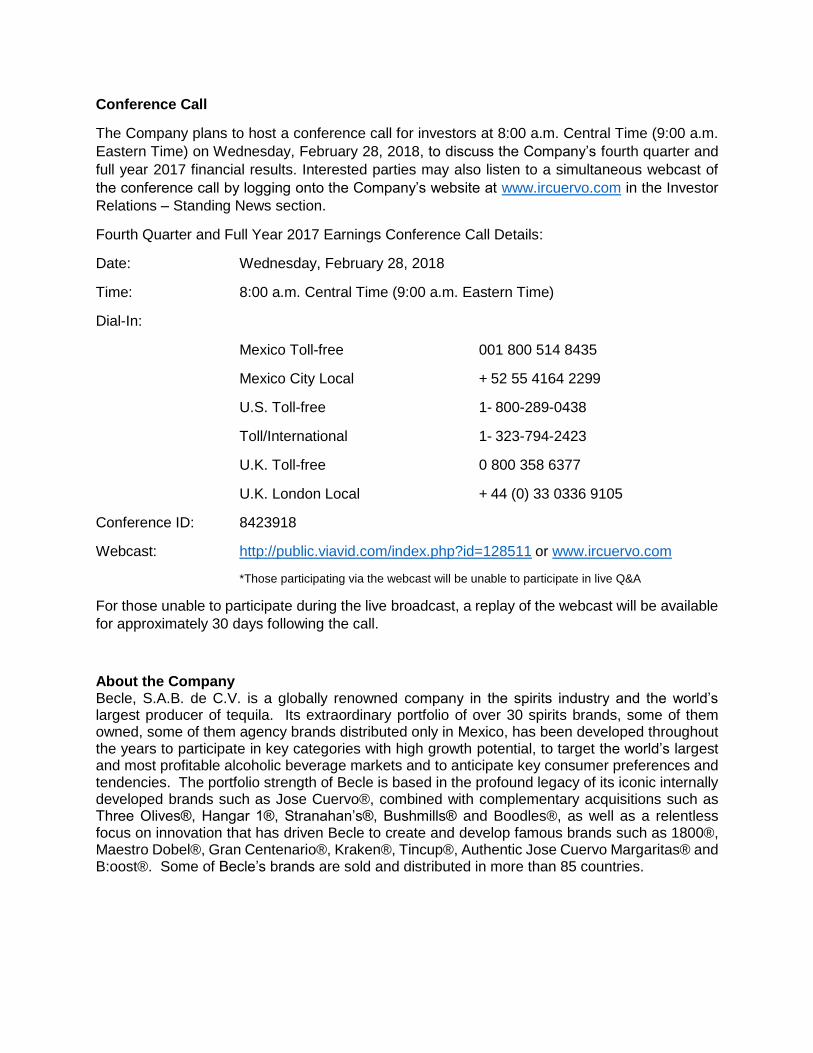
Conference Call
The Company plans to host a conference call for investors at 8:00 a.m. Central Time (9:00 a.m.
Eastern Time) on Wednesday, February 28, 2018, to discuss the Company’s fourth quarter and
full year 2017 financial results. Interested parties may also listen to a simultaneous webcast of
the conference call by logging onto the Company’s website at www.ircuervo.com in the Investor
Relations – Standing News section.
Fourth Quarter and Full Year 2017 Earnings Conference Call Details:
Date: Wednesday, February 28, 2018
Time: 8:00 a.m. Central Time (9:00 a.m. Eastern Time)
Dial-In:
Mexico Toll-free 001 800 514 8435
Mexico City Local + 52 55 4164 2299
U.S. Toll-free 1- 800-289-0438
Toll/International 1- 323-794-2423
U.K. Toll-free 0 800 358 6377
U.K. London Local + 44 (0) 33 0336 9105
Conference ID: 8423918
Webcast: http://public.viavid.com/index.php?id=128511 or www.ircuervo.com
*Those participating via the webcast will be unable to participate in live Q&A
For those unable to participate during the live broadcast, a replay of the webcast will be available
for approximately 30 days following the call.
About the Company Becle, S.A.B. de C.V. is a globally renowned company in the spirits industry and the world’s largest producer of tequila. Its extraordinary portfolio of over 30 spirits brands, some of them owned, some of them agency brands distributed only in Mexico, has been developed throughout the years to participate in key categories with high growth potential, to target the world’s largest and most profitable alcoholic beverage markets and to anticipate key consumer preferences and tendencies. The portfolio strength of Becle is based in the profound legacy of its iconic internally developed brands such as Jose Cuervo®, combined with complementary acquisitions such as Three Olives®, Hangar 1®, Stranahan’s®, Bushmills® and Boodles®, as well as a relentless focus on innovation that has driven Becle to create and develop famous brands such as 1800®, Maestro Dobel®, Gran Centenario®, Kraken®, Tincup®, Authentic Jose Cuervo Margaritas® and B:oost®. Some of Becle’s brands are sold and distributed in more than 85 countries.

EBITDA
EBITDA is a measure used in the Company’s financial analysis that are not recognized under
IFRS but are calculated from amounts that derive from the Company’s Financial Statements. We
calculate EBITDA as net income plus depreciation and amortization, income tax expense, and
interest expense, less interest income, plus foreign exchange loss (gain).
EBITDA is not a IFRS measure of liquidity or performance, nor is EBITDA recognized financial
measures under IFRS. We believe that EBITDA can be useful to facilitate comparisons of
operating performance between periods on a combined basis, but these metrics may be
calculated differently by other issuers. EBITDA should not be construed as alternatives to (i) net
income as an indicator of the Company’s operating performance or (ii) cash flow from operating
activities as a measure of the Company’s liquidity.
Disclaimer This press release contains certain forward-looking statements which are based on Becle’s
current expectations and observations. The information related to future performance contained
in this press release should be read jointly with the risks included in the “Risk Factors” section of
the Mexican prospectus filed with the Comisión Nacional Bancaria y de Valores (Mexican
National Banking and Securities Commission). This information, as well as future statements
made by Becle or by any of its legal representatives, either in writing or verbally, may vary
significantly from the actual results obtained. These forward-looking statements speak only as
of the date on which they are made, and no assurance can be made as to the actual results
obtained. Becle undertakes no obligation and does not intend to update or review any of such
forward-looking statements, whether as a result of new information, future developments or
other related events
Contacts:
Investor Relations Luis Carlos de Pablo [email protected] Gilberto Tonello [email protected] +52 55-5803-2954 ICR Investor Relations Scott Van Winkle [email protected] +1 617-956-6736 Media Carlos Humberto Suarez [email protected] +52 55-5258-7000 ICR Media Relations Anton Nicholas [email protected] +1 646-277-1255

Profit and Loss Statement
Fourth Quarter Ended
December 31, 2017
Fourth Quarter Ended
December 31, 2016
Year over Year
Variance
(Ps$ in millions, except per share amounts)
% of net
sales
% of net
sales $ %
Net Sales 8,338
7,380
958 13.0
Cost of goods 3,469 41.6
3,279 44.4
190 5.8
Gross profit 4,869 58.4
4,101 55.6
768 18.7
Advertising, marketing & promotion 1,825 21.9
2,049 27.8
(224) (10.9)
Distribution 302 3.6
183 2.5
119 64.8
Selling and administrative 757 9.1
521 7.1
235 45.1
Other (income) expenses, net 48 0.6
(123) -1.7
171 (139.2)
Operating profit 1,937 23.2
1,470 19.9
467 31.7
Net Comprehensive Financing Result (660) -7.9
425 5.8
(1,085) (255.5)
Equity Method 2 0.0
0 0.0
2 NM
Profit before tax 2,595 31.1
1,046 14.2
1,549 148.2
Total income taxes 143 1.7
417 5.6
(273) (65.6)
Consolidated net income 2,452 29.4
629 8.5
1,823 289.7
Non-controlling interest 3 0.0
0 0.0
NM NM
Net income to equity holders of the company 2,449 29.4
629 8.5
1,820 289.2
Depreciation & Amortization 111 166
EBITDA 2,048 24.6 1,636 22.2 412 25.2
Earnings per share 0.68
Shares (in millions) used in calculation of earnings per
share 3,593

Profit and Loss Statement
Twelve months Ended
December 31, 2017
Twelve months Ended
December 31, 2016
Year over Year
Variance
(Ps$ in millions, except per share amounts)
% of net
sales
% of net
sales $ %
Net Sales 25,958
24,396
1,562 6.4
Cost of goods 9,837 37.9
9,936 40.7
(99) (1.0)
Gross profit 16,121 62.1
14,460 59.3
1,661 11.5
Advertising, marketing & promotion 5,644 21.7
6,039 24.8
(395) (6.5)
Distribution 918 3.5
750 3.1
168 22.4
Selling and administrative 2,623 10.1
2,208 9.1
415 18.8
Other (income) expenses, net 201 0.8
(160) -0.7
362 (225.4)
Operating profit 6,736 25.9
5,624 23.1
1,112 19.8
Net Comprehensive Financing Result 773 3.0
936 3.8
(163) (17.4)
Equity Method 8 0.0
0 0.0
8 NM
Profit before tax 5,956 22.9
4,688 19.2
1,268 27.0
Total income taxes 1,211 4.7
1,540 6.3
(330) (21.4)
Consolidated net income 4,744 18.3
3,148 12.9
1,597 50.7
Non-controlling interest 4 0.0
0 0.0
NM NM
Net income to equity holders of the company 4,740 18.3
3,148 12.9
1,592 50.6
Depreciation & Amortization 425 451
EBITDA 7,161 27.6 6,075 24.9 1,085 17.9
Earnings per share 1.35
Shares (in millions) used in calculation of earnings per
share 3,515

Balance Sheet
(Ps$ in millions,) December 31, 2017
December 31, 2016
Assets
Cash and cash equivalents 19,996 5,128
Accounts receivable, net 7,260 6,396
Inventories, net 7,419 5,943
Other current assets 1,923 2,258
Total Current Assets 36,598 19,725
Non-current inventories 3,878 3,178
Property, plant and equipment, net 5,280 4,641
Intangible assets and trademarks, net 11,365 11,771
Goodwill 6,274 5,992
Other assets 593 380
Total Long-Term Assets 27,391 25,960
Total Assets 63,988 45,688
Liabilities & Stockholders' Equity
Current installment of notes payable to Banks 48 53
Trade accounts payable 2,106 2,407
Accruals 2,724 1,708
Other liabilities 847 288
Total current liabilities 5,726 4,457
Long term debt, excluding current interest payable 9,781 10,207
Environmental reserve 125 118
Other long-term liabilities 119 95
Deferred income taxes 1,707 2,759
Total Long-Term Liabilities 11,730 13,179
Total Liabilities 17,456 17,636
Total controlling interest 46,478 28,022
Non-controlling interest 54 30
Total Stockholders'’ Equity 46,532 28,052
Total Liabilities and Stockholders’ Equity 63,988 45,688

Cash Flow Statement
(Ps$ in millions,)
Twelve Months Ended
December 31, 2017
Twelve Months Ended
December 31, 2016
Operating Activities Income before income taxes: 5,955 4,688
Items relating to investing activities: Depreciation and amortization 425 451
Loss on sale of property, plant and equipment 44 17
Investment in associates (24) 30
Items relating to financing activities: Interest income (110) (49)
Interest expense 485 405
Subtotal 6,776 5,542
Changes in: Accounts receivable (863) (1,104)
Related parties 132 (266)
Other receivables 390 (628)
Inventories (2,176) (1,556)
Prepayments 4 (243)
Trade accounts payable (301) 632
Other assets (184) 80
Other liabilities 370 (510)
Accruals 1,016 554
Income taxes paid (2,264) (1,138)
Employee statutory profit (2) 5
Changes in direct employee benefits (5) 56
(3,883) (4,118)
Net cash provided by operating activities 2,893 1,424
Investing Activities Capital expenditures (1,066) (829)
Acquisition of intangible assets 0 (205)
Other Stockholders movements 1 0
Interest Collected 110 (142)
Proceeds from sale of joint ventures and trademarks 0 49
Income from sale of property, plant and equipment 4 0
Cash surplus to be applied in financing activities (951) (1,127)
Financing Activities
Dividends paid (2,600) (2,202)
Treasury Stock (1,948) 0
Cash inflow from increase in capital stock 1,722 1,206
Share premium 16,275 0
Interest paid (490) (362)
Net cash provided by financing activities 12,960 (1,357)
Net increase in cash and cash equivalents 14,901 (1,060)
Impacts due to the fx rate on cash (34) 2,049
Cash and cash equivalents: At beginning of the period 5,128 4,139
At end of period 19,996 5,128
