bear chaney ax - arkansasassessment.com · aacd is continuing to work with county assessors,...
TRANSCRIPT
Bear Chaney Director
STATE OF ARKANSAS ASSESSMENT COORDINATION DEPARTMENT
900 WEST CAPITOL AVE., SUITE 320 LITTLE ROCK, ARKANSAS 72201
PHONE (501) 324-9240
FAX (501) 324-9242
August 31, 2018 All,
The attached is the final report titled Recommendations for Improvement of Arkansas’ Oil and Gas Assessed Valuations as prepared by Resource Technologies Corporation (RTC) as required in Professional Services Contract #4600040158.
The report was commissioned as an independent, professional evaluation of our current processes in determining a fair and equitable valuation of the market value of oil and gas mineral rights as prescribed by the Arkansas Constitution.
This report contains evaluations and recommendations from RTC. No actions or decisions have been made regarding any changes or modifications mentioned in the report. AACD is continuing to work with county Assessors, Collectors, County Judges, school district representatives, industry partners, legislators and executive branch staff as to what, if any changes, modifications, or updates may be needed.
AACD will follow all procedures in regards to public meetings if and when any changes to our rules are proposed. If you have any questions about the report please contact our offices. Bear Chaney AACD Director Office (501)324-9100 [email protected]
Recommendations for Improvementof Arkansas’
Oil and Gas Assessed Valuations
Professional Services Contract #4600040158
Prepared For:
Bear Chaney, DirectorArkansas Assessment Coordination Department1614 West Third StreetLittle Rock, Arkansas 72201
Prepared By:
Jeffrey R. Kern, ASA, CMA, MRICSCertified General Appraiser (AR) CG-3341
David FalkensternProfessional Geologist
Resource Technologies CorporationPost Office Box 242State College, Pennsylvania 16804
Report Date: June 25, 2018
Resource Technologies Corporation www.resourcetec.com
TABLE OF CONTENTS
1.0 INTRODUCTION . . . . . . . . . . . . . . . . . . . . . . . . . . . . . . . . . . . . . . . . . . . . . . . . 11.1 Discounted Cash Flow Analysis as Basis for Market Value . . . . . . . . . . . 2
2.0 SUMMARY OF OIL AND GAS WELL VALUATION . . . . . . . . . . . . . . . . . . . . . . 82.1 Oil and Gas Taxes in the U.S. . . . . . . . . . . . . . . . . . . . . . . . . . . . . . . . . 132.2 Common Methodologies . . . . . . . . . . . . . . . . . . . . . . . . . . . . . . . . . . . . 132.3 Improvements to Arkansas Methodology . . . . . . . . . . . . . . . . . . . . . . . . 16
3.0 DIVISION ORDERS . . . . . . . . . . . . . . . . . . . . . . . . . . . . . . . . . . . . . . . . . . . . . 173.1 Oil and Gas Leasehold Interest . . . . . . . . . . . . . . . . . . . . . . . . . . . . . . . 17
4.0 AD VALOREM VALUATION OF GAS WELLS . . . . . . . . . . . . . . . . . . . . . . . . . 204.1 Income Stream Length . . . . . . . . . . . . . . . . . . . . . . . . . . . . . . . . . . . . . . 224.2 Gas Pricing. . . . . . . . . . . . . . . . . . . . . . . . . . . . . . . . . . . . . . . . . . . . . . . 234.3 Decline Factor . . . . . . . . . . . . . . . . . . . . . . . . . . . . . . . . . . . . . . . . . . . . 24
4.3.1 Fayetteville Shale . . . . . . . . . . . . . . . . . . . . . . . . . . . . . . . . . . . . 254.3.2 Arkoma Basin . . . . . . . . . . . . . . . . . . . . . . . . . . . . . . . . . . . . . . . 26
4.4 Expenses . . . . . . . . . . . . . . . . . . . . . . . . . . . . . . . . . . . . . . . . . . . . . . . . 28
5.0 AD VALOREM VALUATION OF OIL WELLS . . . . . . . . . . . . . . . . . . . . . . . . . . 295.1 Previous Method . . . . . . . . . . . . . . . . . . . . . . . . . . . . . . . . . . . . . . . . . . 325.2 Oil Pricing. . . . . . . . . . . . . . . . . . . . . . . . . . . . . . . . . . . . . . . . . . . . . . . . 335.3 Deductions . . . . . . . . . . . . . . . . . . . . . . . . . . . . . . . . . . . . . . . . . . . . . . . 355.4 Oil Decline Factor. . . . . . . . . . . . . . . . . . . . . . . . . . . . . . . . . . . . . . . . . . 37
6.0 BUSINESS EQUIPMENT USED IN THE PRODUCTION OF MINERALS . . . . 396.1 Minimum Equipment Value . . . . . . . . . . . . . . . . . . . . . . . . . . . . . . . . . . 41
APPENDIX A-1: Development of Oil and Gas Discount Rate. . . . . . . . . . . . . . . . . . . 50
Resource Technologies Corporation www.resourcetec.com
1.0 INTRODUCTION
Resource Technologies Corporation (RTC) was engaged by the ArkansasAssessment Coordination Department (ACD) to review and make recommendations forimprovement the procedures that the state uses to develop property tax values for activeminerals, this report specifically addresses oil and gas well valuation. The goal of therecommendations below is to make the system more market responsive, fair, and equitable
Tax assessment in Arkansas is conducted at the County level. The ACD publishesannual recommendations (in methods and values) to the counties. In general, the systemused is based on the income approach to value, wherein the taxable value of a mineral isbased on the estimated present worth of an expected future income stream. The Countiesassess royalty, working, and operator ownership interests. This procedure, in one form oranother, is used by other states, oil and natural gas companies, and banks and is the basisof most texts concerning the valuation of mineral deposits. Therefore, RTC is notrecommending a wholesale change in procedure but an improvement of the existingsystem in line with current staffing levels at the state and County assessment offices.
The income approach is intended to be market responsive, based on current prices,costs, up-to-date financial information, and contemporaneous production data. However,the Arkansas system was developed over the past 30 years for various minerals and hasnot been significantly updated since its inception. For example, the system for oil and gaswas developed in the mid 1980's and has not been updated since. The valuation of gaswells, however, only considers an income stream of one year. This needs to be improvedto be more in line with accepted present value methods.
Points of emphasis to the recommendations include:
• Valuation procedures should comply with accepted industry standards, taxingauthority requirements, as well as standards established by the InternationalAssociation of Assessing Officers
• State and County staff could continue the same general methodology (withACD publishing yearly valuation data), and current vendors updating anyvaluation database procedures.
• General data (production, commodity pricing, etc.) could be derived frompublic sources rather than relying on confidential industry reports.
This review is only the first step in the process to any changes to be undertaken byACD, as a series of stakeholder meeting will follow to develop any changes to the taxationmethod.
A public meeting was held on May 15, 2018 to present the findings of the initialreport dated March 13, 2018. This revised report includes suggestions based oncomments from that meeting. The most significant takeaways from the meeting are that:
• Industry participants would like an avenue to submit pertinent dataspecifically on pricing and expenses.
Recommendations for Improvement of Oil & Gas Assessed ValuationsJune 25, 2018 Page 1 of 53
Resource Technologies Corporation www.resourcetec.com
• County assessors need timely consistent standardized reporting from theindustry.
• Division orders are particularly burdensome to the assessors.• Future stakeholder meetings will be held to refine any taxation changes mad
by ACD
Future stakeholder meetings will address these procedures.
1.1 Discounted Cash Flow Analysis as Basis for Market Value
For tax assessment purposes, Arkansas requires all property to be valued at marketvalue. Discounted cash flow (DCF) is the most accepted method to value operating mineralproperties. All market participants (industry, investors, taxing authorities) use some formof discounted cash flow to value mineral income streams.
Typically, three approaches – cost, market, and income – are available to estimatethe value of any property. In one form or another, these approaches are based on the“principle of substitution”. That is, a purchaser of property would typically pay no more forone property than for another of similar utility.
Mineral properties, petroleum producing properties, mining operations, and relatedoperations, are purchased for the production of future income. Willing purchasers andbuyers assess the income potential of the property before consummating a transfer of theproperty. It is the object of an appraisal to mimic or model the behavior of the marketplace.
An oil or gas well is an income producing addition to a property. A yearly incomestream is generated in the future by the production and sale of oil/gas until the well isplugged/abandoned. The Income Approach to Valuation - capitalization or discountedcash flow of the net income that the well can produce is the appropriate method to valuethe well.
Depending upon circumstances and the scope of assignment, one or moretraditional approaches may not be appropriate or relevant to the assignment. In suchcases, a particular approach should be considered but may be excluded from the report,with explanatory comment by the appraiser.
Nearly every text and treatise concerning appraisals recognizes that the existing use(active oil or gas property) may very well be the Highest and Best Use for a property – themarket determines the needs and desires that cause properties to be put to specific uses. These documents all recognize the income approach as a valid approach to the appraisalof income producing properties – most state that the comparative sales technique is themost difficult to apply to income properties. All of these texts state succinctly that: incomeproducing properties (as oil and gas wells and related operating facilities) must beappraised by the income approach – as these properties serve only one purpose; theexploitation and depletion of the asset. Calculating the value of a well by discounted cashflow is an accepted method and, in one form or another, is used by other states, oil andnatural gas companies, and banks.
Recommendations for Improvement of Oil & Gas Assessed ValuationsJune 25, 2018 Page 2 of 53
Resource Technologies Corporation www.resourcetec.com
In Gentry and O’Neil,1 a basic text in mineral property appraisals, the authorsunequivocally put forward that: “. . . the preferred method for mining property valuation andthe one unanimously used in the commercial practice is the income approach.” The bookstates that:
“Because mines have limited operating horizons and because there are well-established marketsfor mineral commodities, the income approach is widely used in valuing mineral properties. Theapproach is used commonly by the mining industry in assessing investment rates of return anddetermining appropriate purchase prices for mines or mineral prospects.”
In discussing the comparable sales approach, Gentry and O’Neil put forward thefollowing:
“Although this method has been used extensively for estimating the value of residential andagricultural property values, it encounters serious practical problems when applied to miningtransactions.”
According to the “California Assessors’ Handbook,”2 the method best adapted tovaluing mineral producing properties is often an analytical one such as the total propertyor royalty technique because of the lack of sales data and the shortcomings of the costapproach. Concerning the comparative sales approach, the Handbook states that:
“Sales prices of mining property constitute the most reliable indicators of value (as they are with alltypes of property), providing they satisfy arms’ length conditions. It is seldom that we are blessedwith an ideal sale of a mining property, and when we are it will as often as not fail to lend itself to avalue conclusion on any other property because of differences in type of material, state ofdevelopment, etc.”
In the latest revision of the California Assessors’ Handbook, Assessment of MiningProperties, it is simply stated that:
“The properties that are the subject of this handbook are investment properties. They are bought andsold for the income they are capable of generating in the future. As such, they are appropriatelyvalued by the income approach.
The comparable sales method is an important appraisal tool for appraisers. However, the uniquenature of many mining properties makes it difficult to apply. Two mineral properties are seldom alike. Mines differ in ore, reserves, size, ore geology, mining depth, cost, ore benefaction, location, salaries,geologic occurrence, waste, markets, local requirements of government agencies, access, etc. Miningproperties can change in value rapidly so that a sale would only be valid for comparison purposesvery close to its actual sale date. Many mine sales are often part of a larger, more complex sale sothat it becomes difficult to extract data on a single property. Finally, it is rare to find sales ofcomparable mining properties.”
1Gentry, Donald W. Dr. and O’ Neil, Thomas J. Dr. Mine Investment Analysis, Society of Mining
Engineers, American Institute of Mining, Metallurgical, and Petroleum.
2Assessor’s Handbook: Valuation of Mines and Quarries, Assessment Standards Division, Property
Tax Department, California State Board of Equalization, January 1973, page 74 and March 1997.
Recommendations for Improvement of Oil & Gas Assessed ValuationsJune 25, 2018 Page 3 of 53
Resource Technologies Corporation www.resourcetec.com
California’s Assessors’ Handbook (566) for the Assessment of Petroleum Properties3
is comprehensive text that discusses oil and gas geology, industry, and production methodsbefore diving into the valuation of oil and gas properties. It describes the income andapproach and DCF as:
Value is a Function of Income: For the income approach to be appropriate, a property must be of a type that is commonly bought andsold on the basis of its income stream. The benefits that flow from the property must be expressedin terms of money.
Discounted Cash Flow Analysis: Discounted cash flow (DCF) analysis is a widely used “modern” form of capitalization that derives itsvalidity from one of the most “old fashioned” principles of appraisal: the concept of present value. Thisconcept asserts that present income is more desirable than future income, and that because investorsprefer immediate cash returns over future flows, they discount future payments to their present worth.
DCF analysis is defined as the analysis of cash flow projections for each period of time that theproperty produces income in order to compute the present value of property assuming a certain rateof return or to compute the internal rate of return indicated by serial cash flows.
In “How to determine the value of Oil and Gas Properties and optimizing theirvalues”4, Hamdy Rashed, discusses oil and gas valuation with an accounting standards andinvestment approach. He makes it clear that the income approach should be used forproducing properties:
Financial Accounting Standard No. 157 (FAS157) and International Financial Reporting Standard No.13 (IFRS 13) indicate to three approaches of valuation techniques; Income approach uses thediscounted cash flow which is one of the important techniques that is used as value measurement inoil and gas properties for development and production properties and may be reasonably andsufficiently reliable that can be categorized within Level 1 of fair value hierarchy due to availability ofmarket that provide quoted commodity of oil and gas. Market and cost approaches that can be usedfor exploration properties.
Valuation of Production and Development Properties:If Company intends to buy oil or gas properties, it needs to estimate cash that will flow in during thelife of the property. The first thing that needs to known is the proved reserves that is recoverable fromthe ground, and needs to know if there is any further initial investment needed after buying theproperties, the estimated lifting costs, type of the agreements that is held with landowners or hostgovernments, tax rate, recoverable and non-recoverable costs. All those factors help the Companyto estimate the cash flow. But estimating the cash flow is not the final stage, Company needs toconsider the time value for the money received over time which the monetary value of cash isdecreased due to decreasing the power of purchase. Therefore, the estimated cash flow should bediscounted at a specific rate that seller or buyer like to use it as an appropriate rate. Some companiesmay use weighted average capital costs (WACC), some companies use required rate of return, othersmay use inflation rate or free-risk rate. But the most appropriate rates are the first two rates. Afterdiscounting the cash flow, Companies will have a negotiation for the price that can be affected byother factors such as political and security risks, ability of production, fund needs and other factorsthat determine the power of buyer and seller in the negotiation. The more positive factors toward theseller, the more power the seller has to negotiate the price to their interest and vice versa.
3California’s Assessors’ Handbook (566); Assessment of Petroleum Properties, California State Board
of Equalization, August 1996, Reprinted January 2015, pages 5-8 through 5-11.
4“How to Determine the Value of Oil and Gas Properties and Optimizing Their Values.” Hamdy
Rashed, CMA, CAPM; Management and Financial Accounting in Oil and Gas Upstream Industry, January 21,2013.
Recommendations for Improvement of Oil & Gas Assessed ValuationsJune 25, 2018 Page 4 of 53
Resource Technologies Corporation www.resourcetec.com
The most recent publication by the International Association of Assessing Officers(IAAO), Property Assessment Valuation,5 states that the Hoskold method of capitalization(a modified version of the income approach) is “currently the best-known method for usewith mineral properties because it corresponds closely to the conditions that seem to existwhen investments are made on mineral deposits. As a mineral deposit is depleted, therecapture provision should provide a return of the investments, enabling the investor to buyanother mineral property when the first is depleted.”
According to Stermole and Stermole in Economic Evaluation and InvestmentDecision Methods6:
“Comparable sales often is a poor approach to valuation of natural resource properties. The valueof mineral, petroleum, and timber rights varies significantly with sizes of reserves, projected productprice at different future points in time related to production, and future salvage value of the assetsto name some of the significant parameters to be considered. Usually at least several of theseparameters differ significantly for different properties, making comparable sales a very poor approachto valuation of natural resource properties. Different size and quality of natural resource reservesaffects the timing and cost of production, which generally makes it imperative to go to discountedcash flow valuation of natural resource investments rather than trying to utilize the comparable salesapproach.”
Stermole and Stermole teach one of the basic classes in mineral property appraisaland valuation. The course is sponsored by the Colorado School of Mines, a world premiermining College. The book, Economic Evaluation and Investment Decision Methods, is inits fourteenth printing and is used by CSM and also numerous short courses to industryrepresentatives worldwide.
A mineral deposit has virtually no value if it cannot be economically (profitably)developed. The only appropriate analysis available to estimate a deposit’s (mineralproperties) value is to figure out if the deposit can be economically exploited. Generally,this requires analysis of:
• potential cash flows• previous cash flows on the property and similarly situated properties• actual and/or hypothetical royalties• market conditions• physical attributes of the deposit and the site.
In Mineral Deposit Evaluation, A.E. Annels, 19917, states succinctly that, “In all buta few exceptional cases, an adequate financial return from a mining project is the essentialcriterion which must be fulfilled before an affirmative decision to exploit is taken. ...The vastmajority of mineral exploitation projects are therefore undertaken for financial gain and the
5Property Assessment Handbook, Second Edition, International Association of Assessing Officers,
1996, (LOC # 96-075848), page 261.
6Stermole, Franklin J. and Stermole, John M., Economic Evaluation and Investment Decision Making,
Fourteenth Edition, Colorado School of Mines, Investment Evaluations Corporation, Golden, CO, 2014.
7Annels, Alwyn, E., Mineral Deposit Evaluation, Chapman and Hall, London, 1991, pages 306-322.
Recommendations for Improvement of Oil & Gas Assessed ValuationsJune 25, 2018 Page 5 of 53
Resource Technologies Corporation www.resourcetec.com
geological characteristics of the deposit are but one factor of many which collectivelydetermine a project’s profitability.” Annels lists the following techniques as applicable to thevaluation of mineral properties:
• return on capital employed• payback period• discounted cash flow – net present value• discounted cash flow – internal rate of return.
“Geologists include a broad array of materials in the definition of the word “mineral”8:
• metallic ores• nonmetallic industrial minerals• sand and gravel• common clay• petroleum and natural gas...”
Paschall9 goes on to state that: “. . . a mineral properties appraiser is first, last, andalways, a mineral industries economist.” Later in the article he states that: “The suspicionmay have arisen in the readers mind that only the income approach to value is seriouslyconsidered in appraising mineral properties. That suspicion is justified.” Paschall statesthat the only real use of sales information is to provide data necessary to characterize themarket and to develop income approach rates and schedules.
According to Stermole and Stermole in Economic Evaluation and InvestmentDecision Methods10:
“Comparable sales often is a poor approach to valuation of natural resource properties. The valueof mineral, petroleum, and timber rights varies significantly with sizes of reserves, projected productprice at different future points in time related to production, and future salvage value of the assets toname some of the significant parameters to be considered. Usually at least several of theseparameters differ significantly for different properties, making comparable sales a very poor approachto valuation of natural resource properties. Different size and quality of natural resource reservesaffects the timing and cost of production, which generally makes it imperative to go to discounted cashflow valuation of natural resource investments rather than trying to utilize the comparable salesapproach.”
8Paschall, Robert, ASA, The Appraisal of Mineral Producing Properties, ASA VALUATION, American
Society of Appraisers, 1974.
9Ibid.
10Stermole, Franklin J. and Stermole, John M., Economic Evaluation and Investment Decision Making,
Thirteenth Edition, Colorado School of Mines, Investment Evaluations Corporation, Golden, CO, 2012.
Recommendations for Improvement of Oil & Gas Assessed ValuationsJune 25, 2018 Page 6 of 53
Resource Technologies Corporation www.resourcetec.com
The essential factors to be considered in the valuation of a working income stream are listed below. The rates used to calculate the present value of the future cash flow arediscussed in the following sections.
• Projected number of years of production• Unit sale price of oil/gas• Projected annual production/decline rate• Cost to produce• Capitalization/discount rate.
In the following text, all these items are discussed with regards to valuing activeArkansans oil and gas properties.
Recommendations for Improvement of Oil & Gas Assessed ValuationsJune 25, 2018 Page 7 of 53
Resource Technologies Corporation www.resourcetec.com
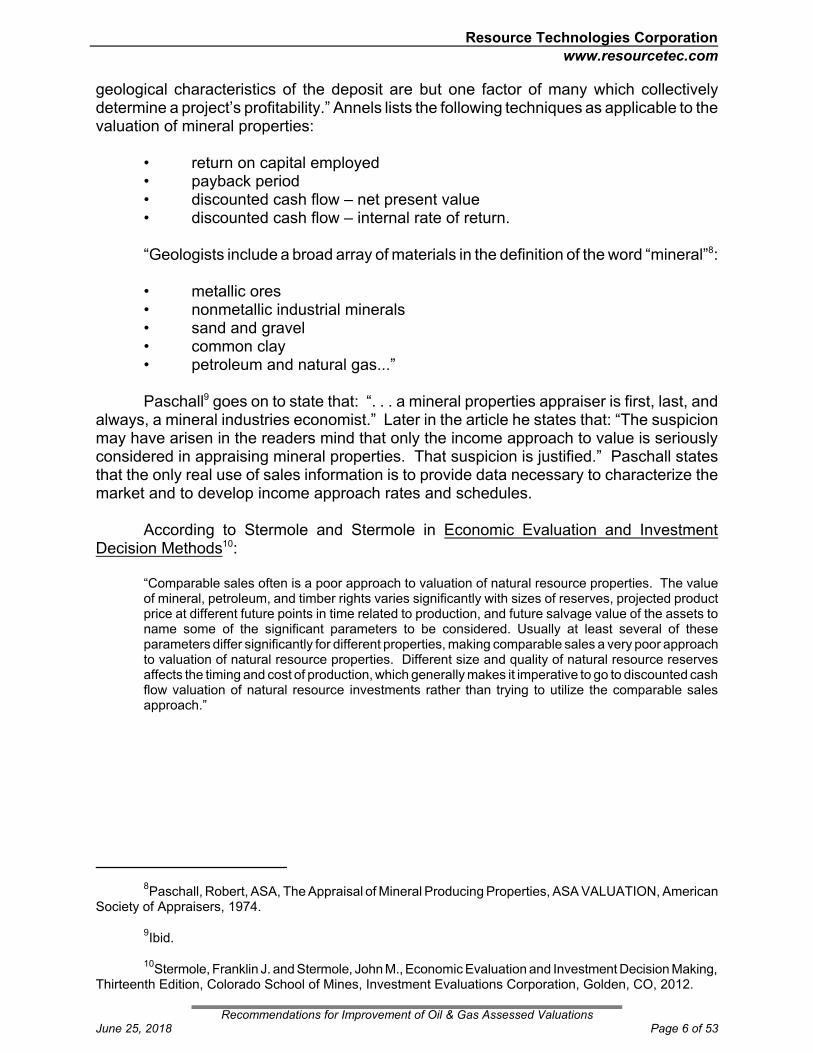
Exhibit 2.0-1: Oil and Gas Shale Plays (EIA)
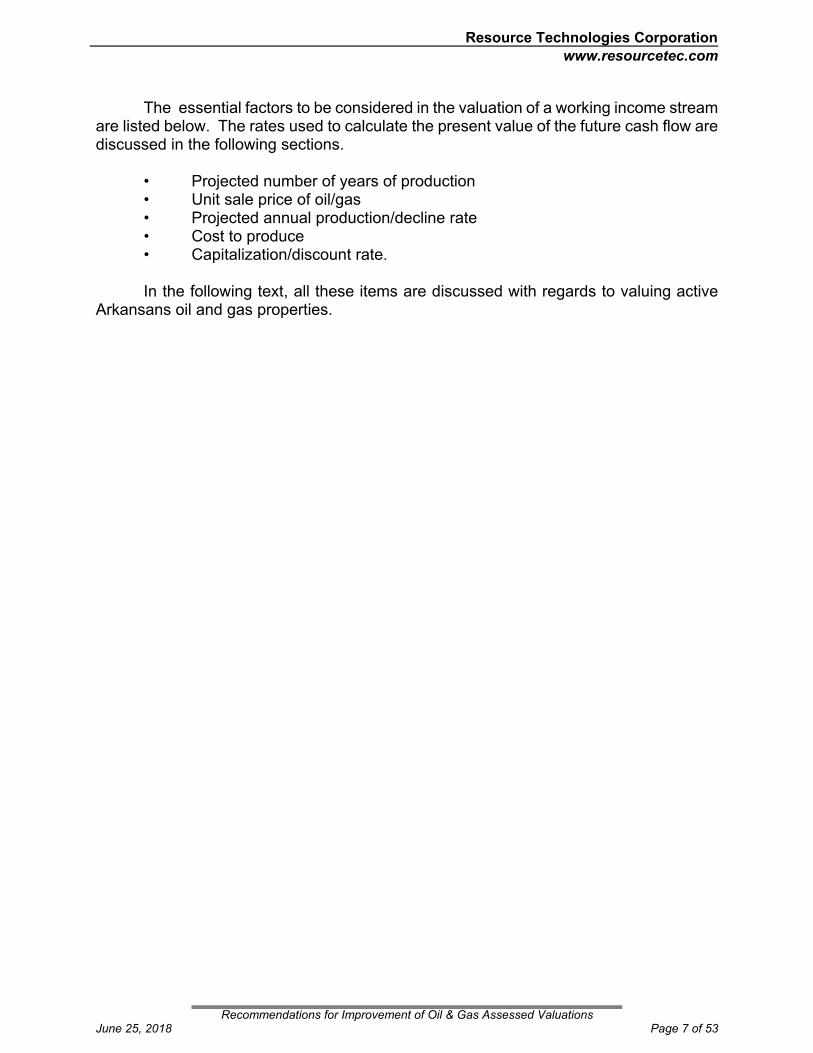
Exhibit 2.0-2: Natural Gas Production
2.0 SUMMARY OF OIL AND GAS WELL VALUATION
Oil and gas shale plays (see Exhibit 2.0-1) have revolutionized the energy industryover the past 10 years. The amount of oil and gas produced has disrupted U.S. electricitymarkets and global oil supplies. It has already led to a couple of oil and gas booms in ashort period of time. To put it simply, the U.S. has more natural gas than it knows what todo with.
The Fayetteville Shale, in north-central Arkansas, rapidly developedbetween years 2007-2010 but has seenan equally rapid a drop in productionrecently (see Exhibits 2.0-2 and 2.0-3). Despite experience from gas productionin the Arkoma Basin, the rapiddevelopment in the Fayetteville Shaleled to challenges on infrastructure,employment levels, and a steep learningcurve for area residents and Countyassessment offices about the oil and gasindustry.
Recommendations for Improvement of Oil & Gas Assessed ValuationsJune 25, 2018 Page 8 of 53
Resource Technologies Corporation www.resourcetec.com
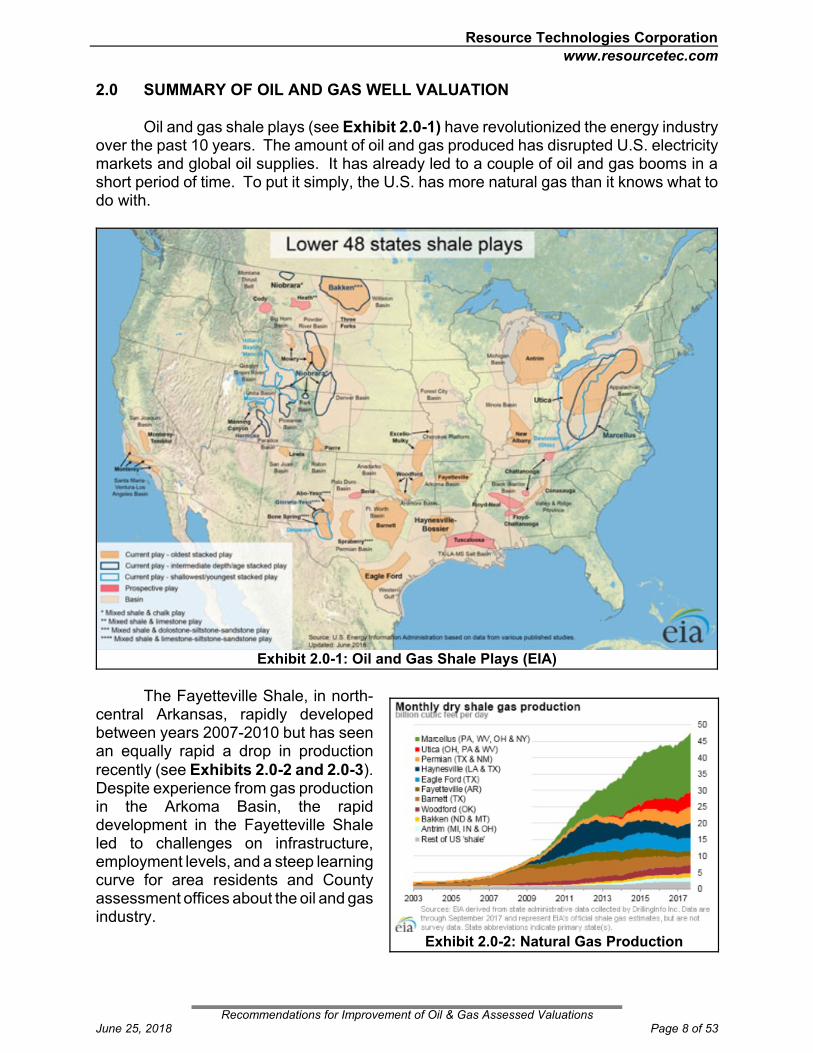
Exhibit 2.0-3: Gas Production (MMcf), Arkansas in Red (Texas scale on right)
Exhibit 2.0-4 shows the top five gas producers in Arkansas since 2014. Eventhough production has fallen every year, Southwestern Energy dominates the NorthernArkansas gas market. Exhibit 2.0-5 shows the assessed values in Northern Arkansassince 2014.
Exhibit 2.0-4: Top 5 Gas Producers (Mcf - AOGC)
Operator 2014 2015 2016 % of overallTotal 2016
SEECO, LLC (Southwestern Energy) 749,832,929 695,374,693 558,311,483 68.08%
XTO Energy, Inc. 156,570,116 138,762,901 116,416,724 14.19%
BHP Billiton Petroleum (Fayetteville), LLC 140,227,746 109,581,131 89,424,597 10.90%
Stephens Production Company 23,017,878 18,169,914 15,304,300 1.87%
Lime Rock Resources III-A, L.P. 13,422,693 12,164,932 11,411,040 1.39%
Exhibit 2.0-5: Northern Arkansas Assessed Values
County Name (Basin) 2014 2015 2016
Van Buren (Fayetteville) $194,920,240 $165,093,370 $145,395,798
Cleburne (Fayetteville) $114,052,275 $129,559,750 $131,601,358
Conway (Fayetteville) $138,124,097 $132,171,539 $126,782,242
White (Fayetteville) $129,160,450 $113,285,540 $108,966,540
Recommendations for Improvement of Oil & Gas Assessed ValuationsJune 25, 2018 Page 9 of 53
Resource Technologies Corporation www.resourcetec.com
Exhibit 2.0-5: Northern Arkansas Assessed Values
County Name (Basin) 2014 2015 2016
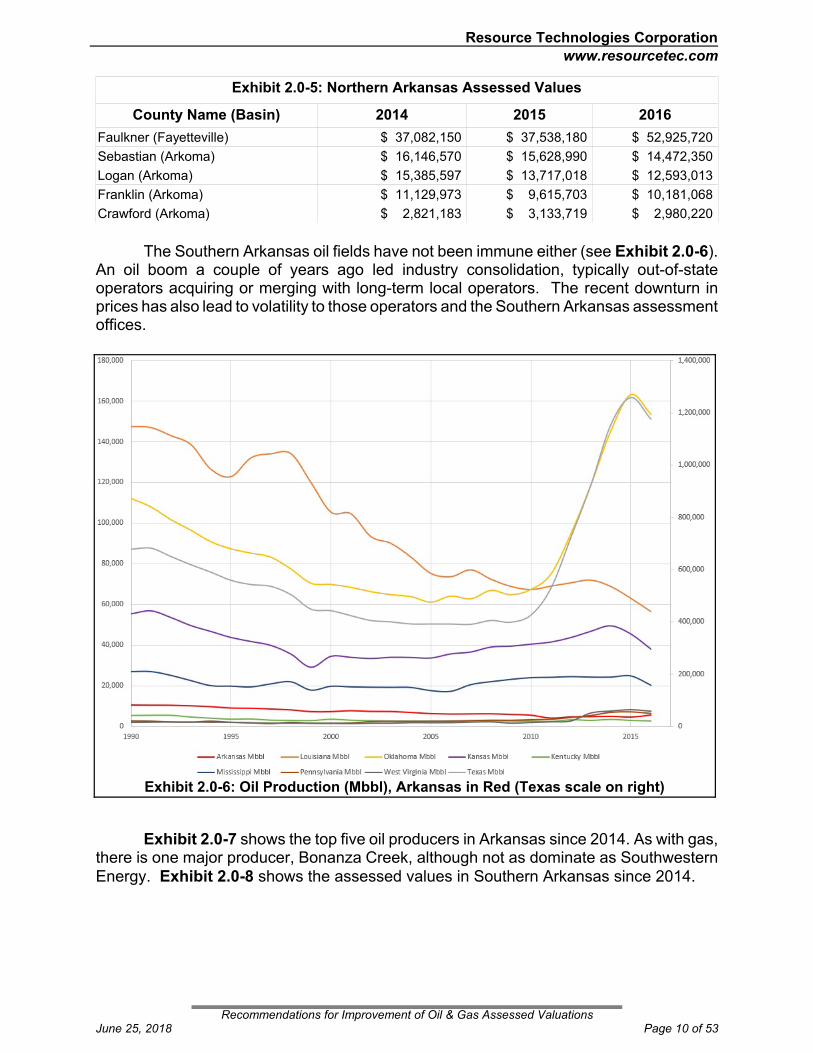
Exhibit 2.0-6: Oil Production (Mbbl), Arkansas in Red (Texas scale on right)
Faulkner (Fayetteville) $ 37,082,150 $ 37,538,180 $ 52,925,720
Sebastian (Arkoma) $ 16,146,570 $ 15,628,990 $ 14,472,350
Logan (Arkoma) $ 15,385,597 $ 13,717,018 $ 12,593,013
Franklin (Arkoma) $ 11,129,973 $ 9,615,703 $ 10,181,068
Crawford (Arkoma) $ 2,821,183 $ 3,133,719 $ 2,980,220
The Southern Arkansas oil fields have not been immune either (see Exhibit 2.0-6). An oil boom a couple of years ago led industry consolidation, typically out-of-stateoperators acquiring or merging with long-term local operators. The recent downturn inprices has also lead to volatility to those operators and the Southern Arkansas assessmentoffices.
Exhibit 2.0-7 shows the top five oil producers in Arkansas since 2014. As with gas,there is one major producer, Bonanza Creek, although not as dominate as SouthwesternEnergy. Exhibit 2.0-8 shows the assessed values in Southern Arkansas since 2014.
Recommendations for Improvement of Oil & Gas Assessed ValuationsJune 25, 2018 Page 10 of 53
Resource Technologies Corporation www.resourcetec.com
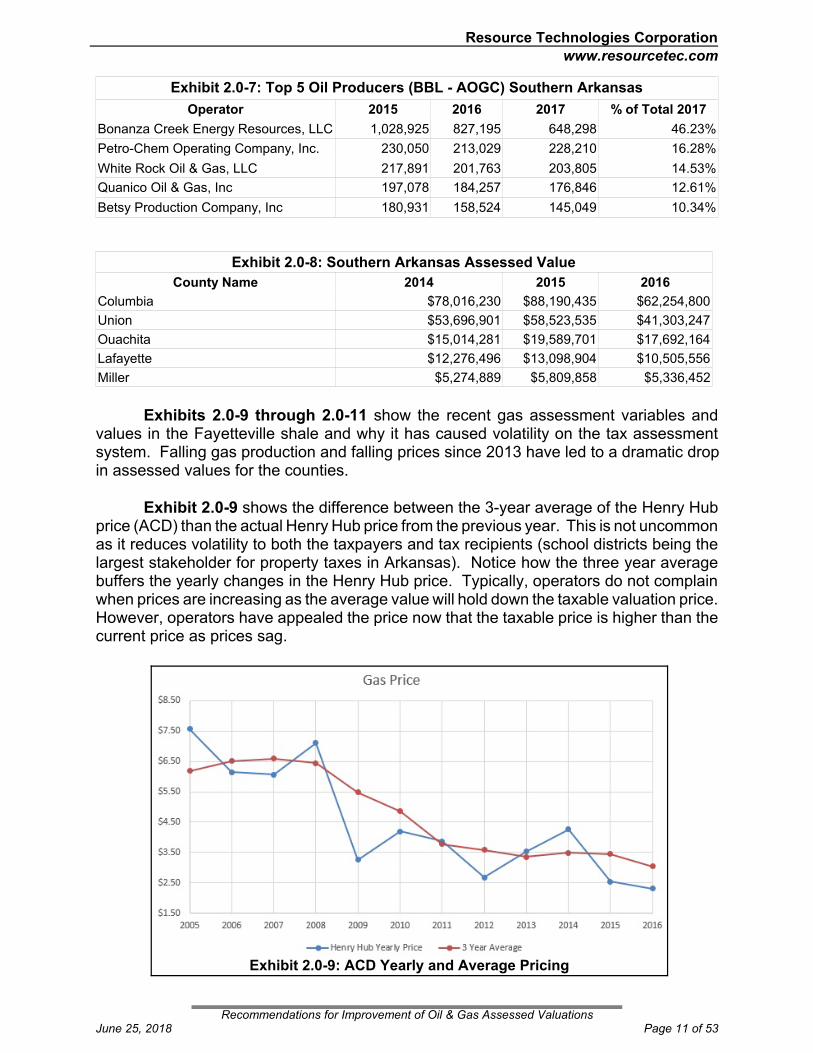
Exhibit 2.0-9: ACD Yearly and Average Pricing
Exhibit 2.0-7: Top 5 Oil Producers (BBL - AOGC) Southern Arkansas
Operator 2015 2016 2017 % of Total 2017
Bonanza Creek Energy Resources, LLC 1,028,925 827,195 648,298 46.23%
Petro-Chem Operating Company, Inc. 230,050 213,029 228,210 16.28%
White Rock Oil & Gas, LLC 217,891 201,763 203,805 14.53%
Quanico Oil & Gas, Inc 197,078 184,257 176,846 12.61%
Betsy Production Company, Inc 180,931 158,524 145,049 10.34%
Exhibit 2.0-8: Southern Arkansas Assessed Value
County Name 2014 2015 2016
Columbia $78,016,230 $88,190,435 $62,254,800
Union $53,696,901 $58,523,535 $41,303,247
Ouachita $15,014,281 $19,589,701 $17,692,164
Lafayette $12,276,496 $13,098,904 $10,505,556
Miller $5,274,889 $5,809,858 $5,336,452
Exhibits 2.0-9 through 2.0-11 show the recent gas assessment variables andvalues in the Fayetteville shale and why it has caused volatility on the tax assessmentsystem. Falling gas production and falling prices since 2013 have led to a dramatic dropin assessed values for the counties.
Exhibit 2.0-9 shows the difference between the 3-year average of the Henry Hubprice (ACD) than the actual Henry Hub price from the previous year. This is not uncommonas it reduces volatility to both the taxpayers and tax recipients (school districts being thelargest stakeholder for property taxes in Arkansas). Notice how the three year averagebuffers the yearly changes in the Henry Hub price. Typically, operators do not complainwhen prices are increasing as the average value will hold down the taxable valuation price. However, operators have appealed the price now that the taxable price is higher than thecurrent price as prices sag.
Recommendations for Improvement of Oil & Gas Assessed ValuationsJune 25, 2018 Page 11 of 53
Resource Technologies Corporation www.resourcetec.com
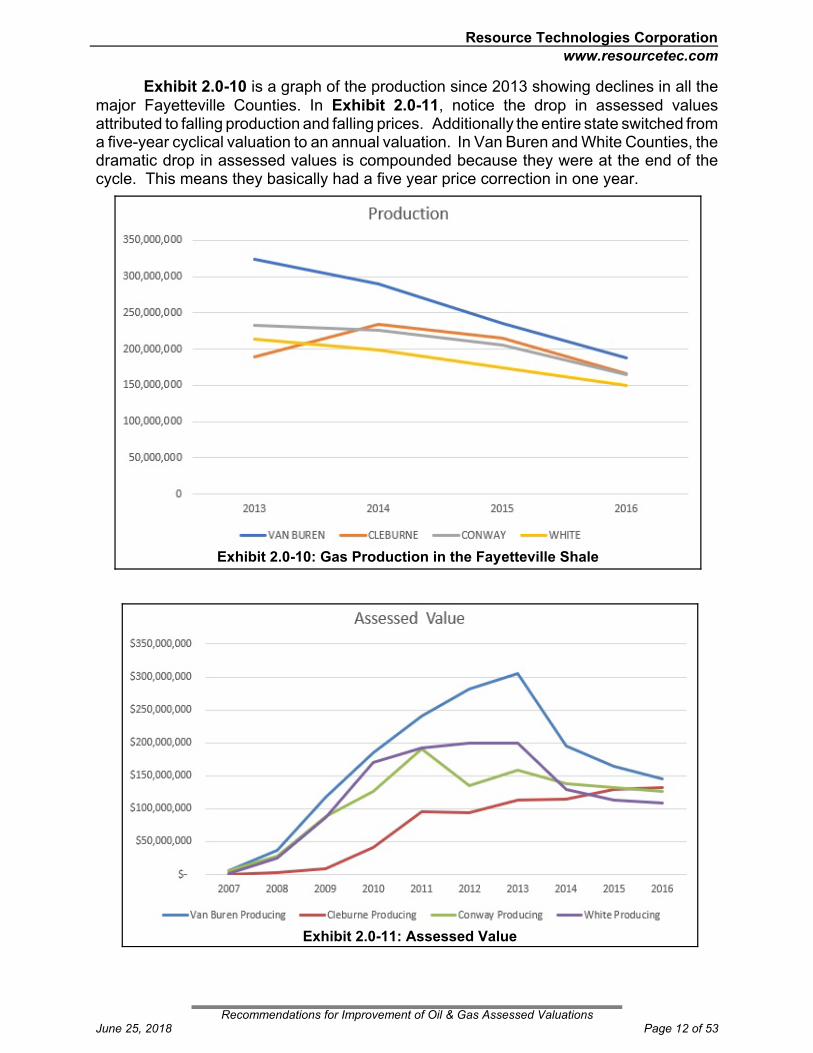
Exhibit 2.0-10: Gas Production in the Fayetteville Shale
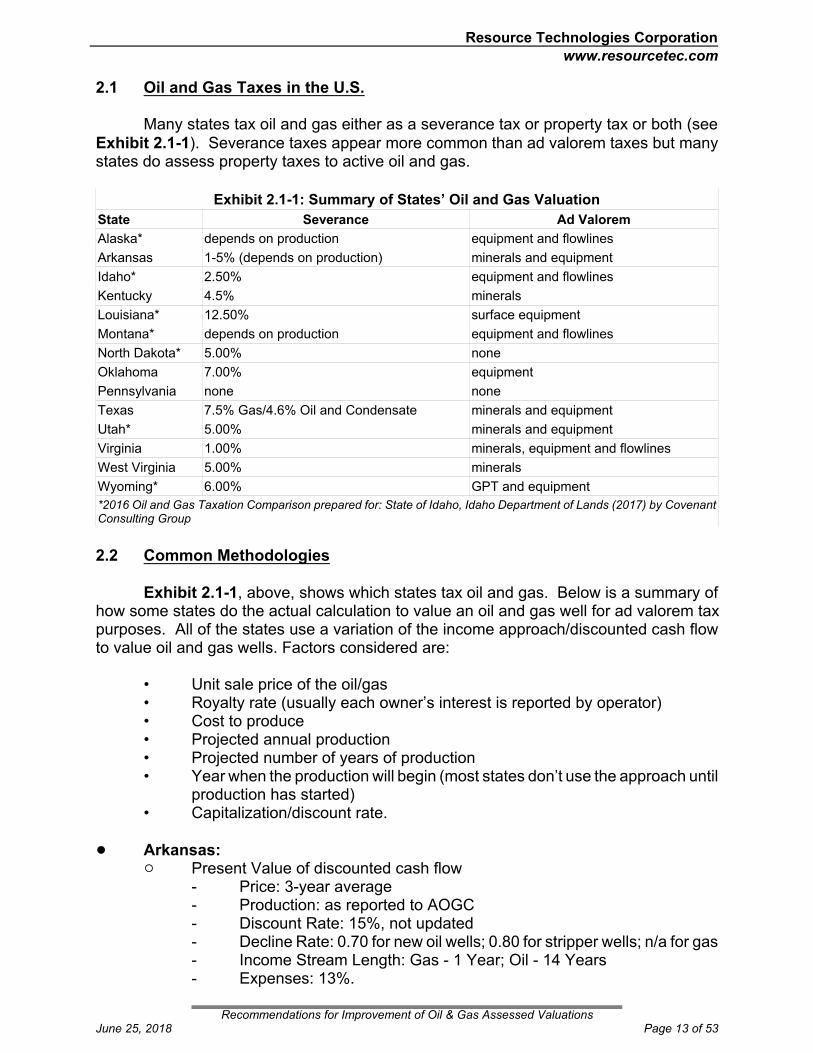
Exhibit 2.0-11: Assessed Value
Exhibit 2.0-10 is a graph of the production since 2013 showing declines in all themajor Fayetteville Counties. In Exhibit 2.0-11, notice the drop in assessed valuesattributed to falling production and falling prices. Additionally the entire state switched froma five-year cyclical valuation to an annual valuation. In Van Buren and White Counties, thedramatic drop in assessed values is compounded because they were at the end of thecycle. This means they basically had a five year price correction in one year.
Recommendations for Improvement of Oil & Gas Assessed ValuationsJune 25, 2018 Page 12 of 53
Resource Technologies Corporation www.resourcetec.com
2.1 Oil and Gas Taxes in the U.S.
Many states tax oil and gas either as a severance tax or property tax or both (seeExhibit 2.1-1). Severance taxes appear more common than ad valorem taxes but manystates do assess property taxes to active oil and gas.
Exhibit 2.1-1: Summary of States’ Oil and Gas Valuation
State Severance Ad Valorem
Alaska* depends on production equipment and flowlines
Arkansas 1-5% (depends on production) minerals and equipment
Idaho* 2.50% equipment and flowlines
Kentucky 4.5% minerals
Louisiana* 12.50% surface equipment
Montana* depends on production equipment and flowlines
North Dakota* 5.00% none
Oklahoma 7.00% equipment
Pennsylvania none none
Texas 7.5% Gas/4.6% Oil and Condensate minerals and equipment
Utah* 5.00% minerals and equipment
Virginia 1.00% minerals, equipment and flowlines
West Virginia 5.00% minerals
Wyoming* 6.00% GPT and equipment
*2016 Oil and Gas Taxation Comparison prepared for: State of Idaho, Idaho Department of Lands (2017) by CovenantConsulting Group
2.2 Common Methodologies
Exhibit 2.1-1, above, shows which states tax oil and gas. Below is a summary ofhow some states do the actual calculation to value an oil and gas well for ad valorem taxpurposes. All of the states use a variation of the income approach/discounted cash flowto value oil and gas wells. Factors considered are:
• Unit sale price of the oil/gas• Royalty rate (usually each owner’s interest is reported by operator)• Cost to produce• Projected annual production• Projected number of years of production• Year when the production will begin (most states don’t use the approach until
production has started)• Capitalization/discount rate.
! Arkansas:" Present Value of discounted cash flow
- Price: 3-year average- Production: as reported to AOGC- Discount Rate: 15%, not updated- Decline Rate: 0.70 for new oil wells; 0.80 for stripper wells; n/a for gas- Income Stream Length: Gas - 1 Year; Oil - 14 Years- Expenses: 13%.
Recommendations for Improvement of Oil & Gas Assessed ValuationsJune 25, 2018 Page 13 of 53
Resource Technologies Corporation www.resourcetec.com
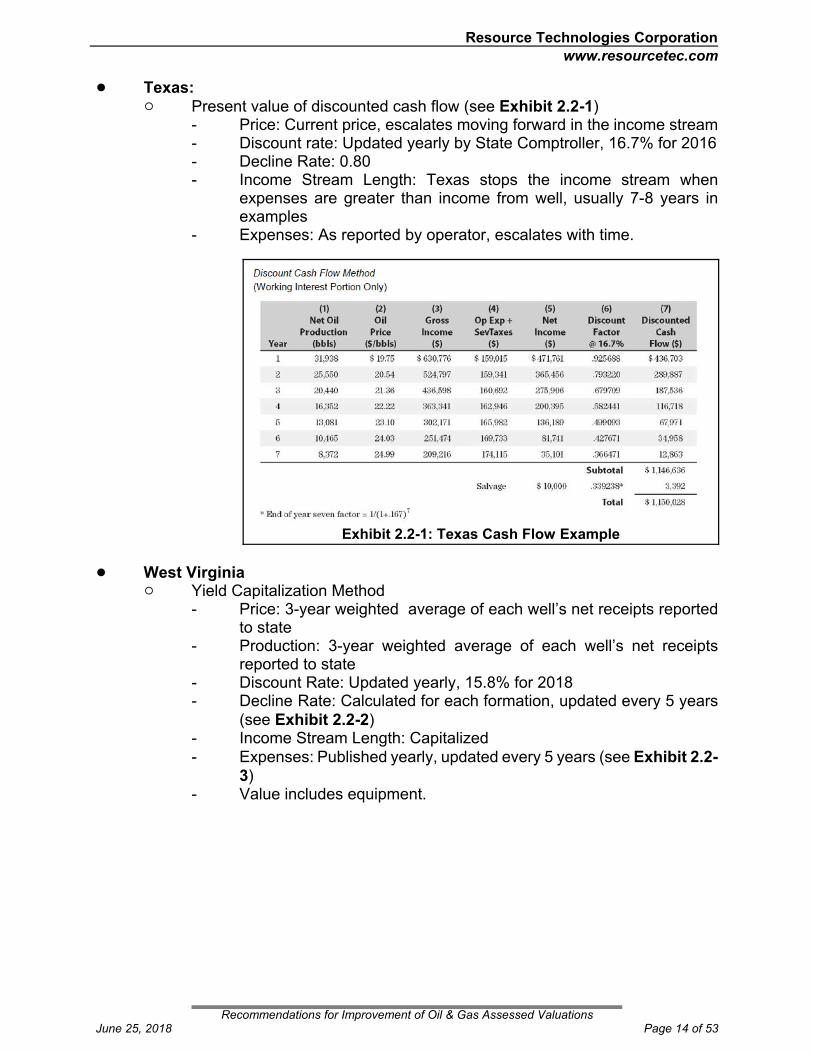
! Texas:" Present value of discounted cash flow (see Exhibit 2.2-1)
- Price: Current price, escalates moving forward in the income stream- Discount rate: Updated yearly by State Comptroller, 16.7% for 2016- Decline Rate: 0.80- Income Stream Length: Texas stops the income stream when
expenses are greater than income from well, usually 7-8 years inexamples
- Expenses: As reported by operator, escalates with time.
! West Virginia" Yield Capitalization Method
- Price: 3-year weighted average of each well’s net receipts reportedto state
- Production: 3-year weighted average of each well’s net receiptsreported to state
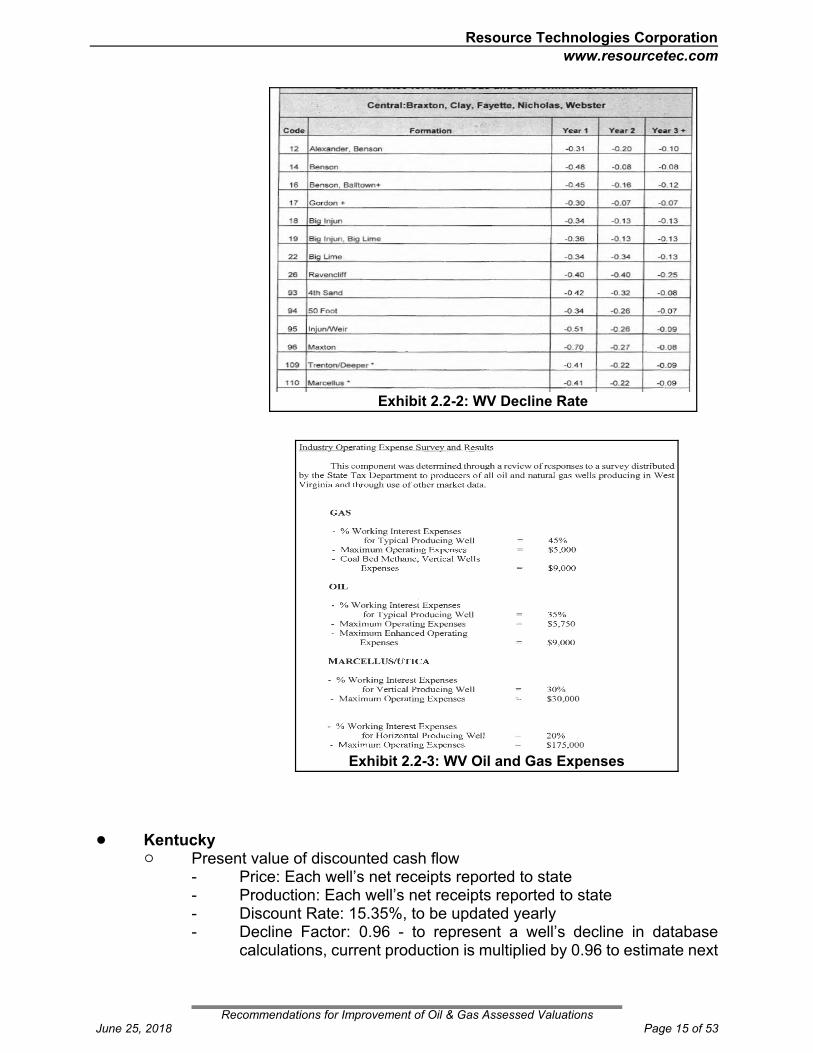
- Discount Rate: Updated yearly, 15.8% for 2018- Decline Rate: Calculated for each formation, updated every 5 years
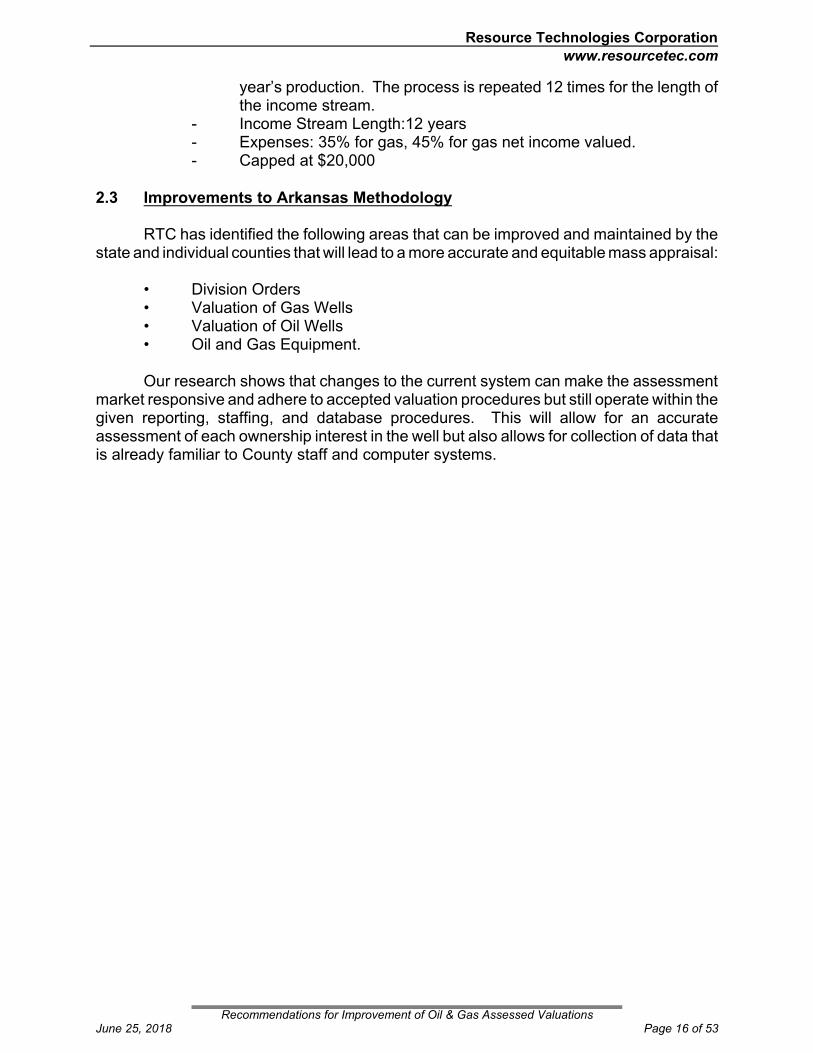
(see Exhibit 2.2-2)- Income Stream Length: Capitalized- Expenses: Published yearly, updated every 5 years (see Exhibit 2.2-
3)- Value includes equipment.
Exhibit 2.2-1: Texas Cash Flow Example
Recommendations for Improvement of Oil & Gas Assessed ValuationsJune 25, 2018 Page 14 of 53
Resource Technologies Corporation www.resourcetec.com
Exhibit 2.2-3: WV Oil and Gas Expenses
Exhibit 2.2-2: WV Decline Rate
! Kentucky" Present value of discounted cash flow
- Price: Each well’s net receipts reported to state - Production: Each well’s net receipts reported to state - Discount Rate: 15.35%, to be updated yearly- Decline Factor: 0.96 - to represent a well’s decline in database
calculations, current production is multiplied by 0.96 to estimate next
Recommendations for Improvement of Oil & Gas Assessed ValuationsJune 25, 2018 Page 15 of 53
Resource Technologies Corporation www.resourcetec.com
year’s production. The process is repeated 12 times for the length ofthe income stream.
- Income Stream Length:12 years- Expenses: 35% for gas, 45% for gas net income valued.- Capped at $20,000
2.3 Improvements to Arkansas Methodology
RTC has identified the following areas that can be improved and maintained by thestate and individual counties that will lead to a more accurate and equitable mass appraisal:
• Division Orders• Valuation of Gas Wells• Valuation of Oil Wells• Oil and Gas Equipment.
Our research shows that changes to the current system can make the assessmentmarket responsive and adhere to accepted valuation procedures but still operate within thegiven reporting, staffing, and database procedures. This will allow for an accurateassessment of each ownership interest in the well but also allows for collection of data thatis already familiar to County staff and computer systems.
Recommendations for Improvement of Oil & Gas Assessed ValuationsJune 25, 2018 Page 16 of 53
Resource Technologies Corporation www.resourcetec.com
3.0 DIVISION ORDERS
While not directly related to valuation, the delivery of division orders (partial interestownership) causes significant problems to County assessment staff. In fact, in interviewswith assessment offices, usually the entire session was spent discussing division orders.
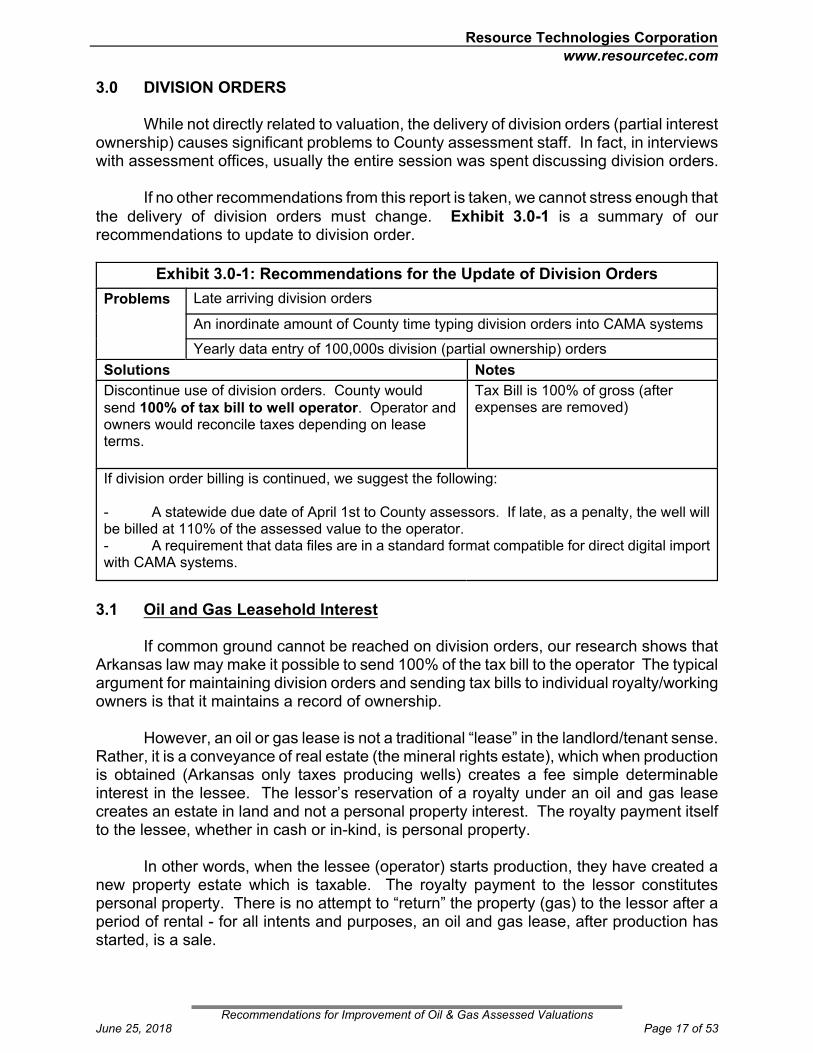
If no other recommendations from this report is taken, we cannot stress enough thatthe delivery of division orders must change. Exhibit 3.0-1 is a summary of ourrecommendations to update to division order.
Exhibit 3.0-1: Recommendations for the Update of Division Orders
Problems Late arriving division orders
An inordinate amount of County time typing division orders into CAMA systems
Yearly data entry of 100,000s division (partial ownership) orders
Solutions Notes
Discontinue use of division orders. County wouldsend 100% of tax bill to well operator. Operator andowners would reconcile taxes depending on leaseterms.
Tax Bill is 100% of gross (afterexpenses are removed)
If division order billing is continued, we suggest the following:
- A statewide due date of April 1st to County assessors. If late, as a penalty, the well willbe billed at 110% of the assessed value to the operator.- A requirement that data files are in a standard format compatible for direct digital importwith CAMA systems.
3.1 Oil and Gas Leasehold Interest
If common ground cannot be reached on division orders, our research shows thatArkansas law may make it possible to send 100% of the tax bill to the operator The typicalargument for maintaining division orders and sending tax bills to individual royalty/workingowners is that it maintains a record of ownership.
However, an oil or gas lease is not a traditional “lease” in the landlord/tenant sense. Rather, it is a conveyance of real estate (the mineral rights estate), which when productionis obtained (Arkansas only taxes producing wells) creates a fee simple determinableinterest in the lessee. The lessor’s reservation of a royalty under an oil and gas leasecreates an estate in land and not a personal property interest. The royalty payment itselfto the lessee, whether in cash or in-kind, is personal property.
In other words, when the lessee (operator) starts production, they have created anew property estate which is taxable. The royalty payment to the lessor constitutespersonal property. There is no attempt to “return” the property (gas) to the lessor after aperiod of rental - for all intents and purposes, an oil and gas lease, after production hasstarted, is a sale.
Recommendations for Improvement of Oil & Gas Assessed ValuationsJune 25, 2018 Page 17 of 53
Resource Technologies Corporation www.resourcetec.com
Leases have been considered a method of transfer of ownership by industry,courts, and financial institutions. Minerals are frequently severed (sold) apart from thefee estate of land as a mineral estate. Leases are bought and sold and used for basis formortgages. Case in point, Southwestern Energy recently issued a press release indicatingthey are “Actively pursue strategic alternatives for the Fayetteville Shale E&P and related midstream gathering assets;”11. This is interpreted to mean that Southwestern’s FayettevilleShale assets are on the market to be sold with a major portion of the assets being leasesheld by Southwestern Energy.
This has been the major tenant in coal, oil, and gas lease cases and theunderstanding in mortgages. This has been the finding of all the prior court decisions -- amineral lease is the sale of the mineral because the lease allows for the total depletion ofthe asset. Some leases may have special conditions restricting or limiting but most allowfor the total exhaustion of the asset - they are considered to be a sale. Arkansas case lawis in agreement with this view12:
LEASEHOLD INTERESTSThe rule in Arkansas, prior to 1982, was that a leasehold interest (that interest held by a lessee) wasin the nature of an easement. The Arkansas Supreme Court held in 1965 that an "oil and gas leasedoes not of itself constitute constructive severance of the two estates (surface and mineral), butconveys only an interest and easement in the land itself and no title passes until the oil and gas arereduced to possession." Garvan v. Kimsey, 239 Ark. 295, 297, 389 S.W.2d 870 (1965). Thus, thelessee has no title to the minerals until they are actually in his possession.
The Arkansas court seems to have abandoned the view that leases grant only an easement. In Hillardv. Stephens, 276 Ark. 545, 637 S.W.2d 581 (1982), in discussing a gas lease the court stated "Thegas lease constitutes a present sale of all the gas in place at the time such lease is executed; and asthe gas leaves the well head, the entire ownership thereof is in the lessee...."
Where the leasehold interest (working interest) in a common lease or mineral venture is owned bymultiple parties under a joint operating agreement, the designated operator has a "fiduciary duty" tothe non-operators. Texas Oil & Gas Corporation v. Hawkins Oil & Gas, Inc., 282 Ark. 268, 668 S.W.2d16 (1984). A fiduciary is a person who undertakes to act in the interest of another person. As afiduciary, the operator in an oil and gas prospect, has a duty of utmost fair dealing and good faith tothe non-operators. The operator may not act selfishly or in his own.
ROYALTY INTERESTIn Arkansas, as elsewhere, a royalty interest is a right to a share of the mineral produced accruingto the owner of the royalty. The royalty interest before production is part of the land and, therefore,subject to conveyance but becomes personal property when produced. Shreveport-EI Dorado PipeLine Co. v. Bennett, 172 Ark. 804, 290 S.W. 929 (1927). The royalty owner typically has no right toexplore or develop minerals, or to execute leases. A conveyance reserving to the grantor the right toexecute oil and gas leases and receive a bonus for execution generally creates a nonparticipatingroyalty interest in the grantee. In most instruments, it is entitled "Non-Participating Royalty Deed."
This means, for all intents and purposes, the execution of a gas lease is a sale. Arkansas does not tax non-producing mineral estates even if they are leased so all taxesare based on producing minerals. Therefore, we suggest removing the requirement to
11Southwestern Energy Announces Plans to Reposition Portfolio to Increase Shareholder Value;
News Release, February 8, 2018.
12The Arkansas Leasing Manual (2008) Charles A. Morgan, pg 8-9.
Recommendations for Improvement of Oil & Gas Assessed ValuationsJune 25, 2018 Page 18 of 53
Resource Technologies Corporation www.resourcetec.com
submit division orders. As the owner of the entire mineral estate, the tax burden is theproducer’s sole responsibility.
Recommendations for Improvement of Oil & Gas Assessed ValuationsJune 25, 2018 Page 19 of 53
Resource Technologies Corporation www.resourcetec.com
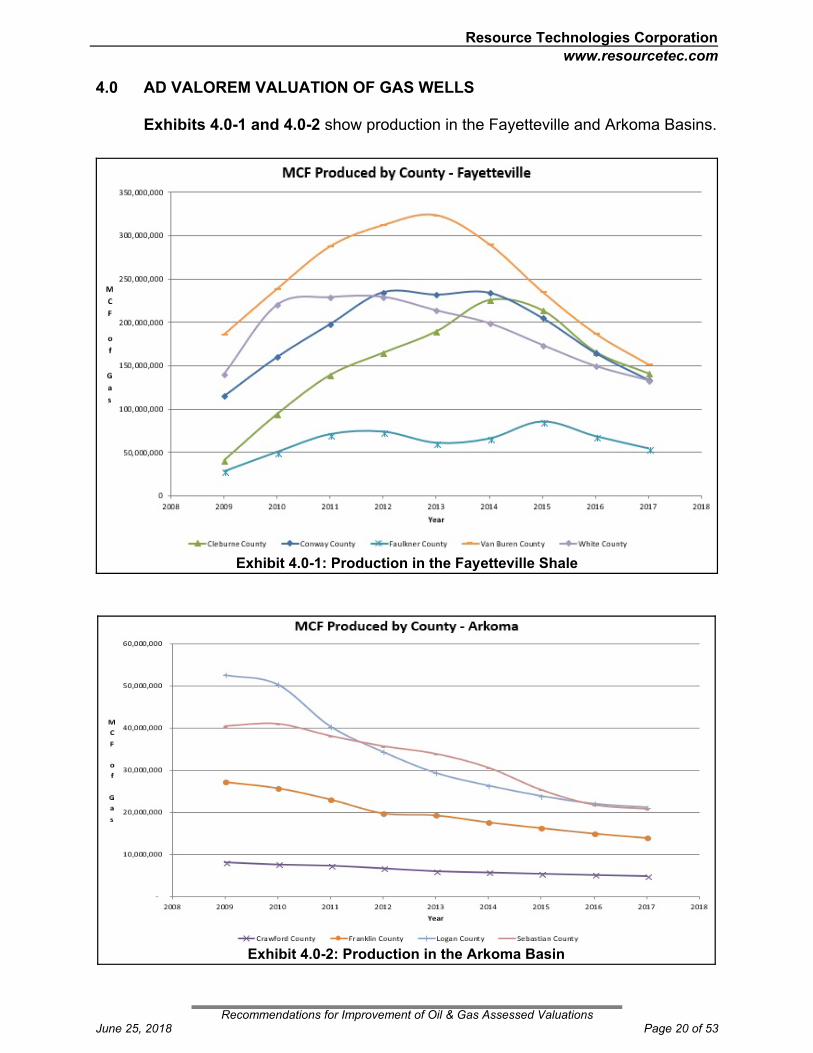
Exhibit 4.0-1: Production in the Fayetteville Shale
Exhibit 4.0-2: Production in the Arkoma Basin
4.0 AD VALOREM VALUATION OF GAS WELLS
Exhibits 4.0-1 and 4.0-2 show production in the Fayetteville and Arkoma Basins.
Recommendations for Improvement of Oil & Gas Assessed ValuationsJune 25, 2018 Page 20 of 53
Resource Technologies Corporation www.resourcetec.com
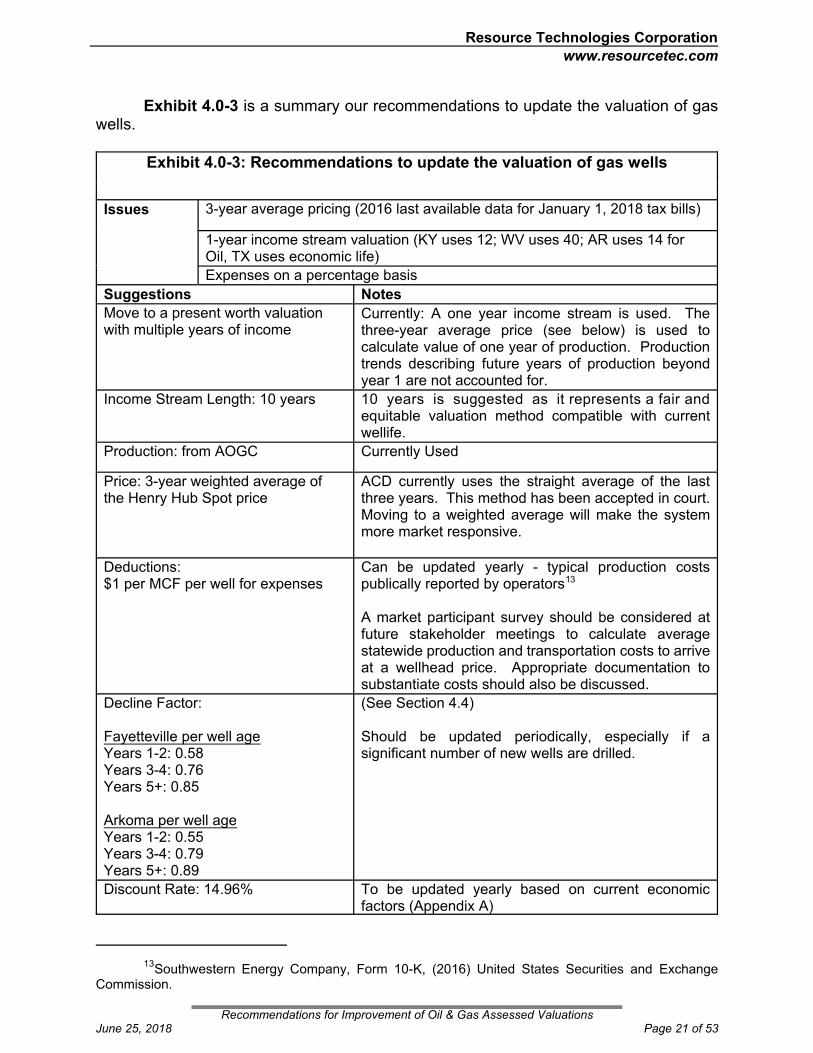
Exhibit 4.0-3 is a summary our recommendations to update the valuation of gaswells.
Exhibit 4.0-3: Recommendations to update the valuation of gas wells
Issues 3-year average pricing (2016 last available data for January 1, 2018 tax bills)
1-year income stream valuation (KY uses 12; WV uses 40; AR uses 14 forOil, TX uses economic life)
Expenses on a percentage basis
Suggestions Notes
Move to a present worth valuationwith multiple years of income
Currently: A one year income stream is used. Thethree-year average price (see below) is used tocalculate value of one year of production. Productiontrends describing future years of production beyondyear 1 are not accounted for.
Income Stream Length: 10 years 10 years is suggested as it represents a fair andequitable valuation method compatible with currentwellife.
Production: from AOGC Currently Used
Price: 3-year weighted average ofthe Henry Hub Spot price
ACD currently uses the straight average of the lastthree years. This method has been accepted in court. Moving to a weighted average will make the systemmore market responsive.
Deductions:$1 per MCF per well for expenses
Can be updated yearly - typical production costspublically reported by operators13
A market participant survey should be considered atfuture stakeholder meetings to calculate averagestatewide production and transportation costs to arriveat a wellhead price. Appropriate documentation tosubstantiate costs should also be discussed.
Decline Factor:
Fayetteville per well ageYears 1-2: 0.58Years 3-4: 0.76Years 5+: 0.85
Arkoma per well ageYears 1-2: 0.55Years 3-4: 0.79Years 5+: 0.89
(See Section 4.4)
Should be updated periodically, especially if asignificant number of new wells are drilled.
Discount Rate: 14.96% To be updated yearly based on current economicfactors (Appendix A)
13Southwestern Energy Company, Form 10-K, (2016) United States Securities and Exchange
Commission.
Recommendations for Improvement of Oil & Gas Assessed ValuationsJune 25, 2018 Page 21 of 53
Resource Technologies Corporation www.resourcetec.com
The discussions in the sections below explain how and why the recommendedvariables were chosen. While it is recognized that not every well will fit the model, for amass appraisal with over 13,000 active wells, these values represent a realistic, fair, andequitable method to arrive at the assessed value for the entire state. As a mass appraisal,there is no intention of providing site or well-specific evaluations. Some wells may endbefore 10 years and some may produce profitably for more than 10 years. Similarly, somewells will have a greater decline factor than 90% of the previous years’ productionespecially new wells allowed to flow at natural formation properties. However, most wells’production is influenced more by today’s current gas market rather than geologicalproperties.
4.1 Income Stream Length
It is well settled that a gas well should be valued considering multiple years ofdiscounted cash flow as a well will produce income until it is plugged. Traditionally, a gaswells’ life has been dictated by the natural decline of gas flow that the reservoir formationcan achieve. However, RTC and ACD have separately determined that most wells’production is influenced more by today’s current gas market rather than geologicalproperties and flow is limited by the operator (See Section 4.4).
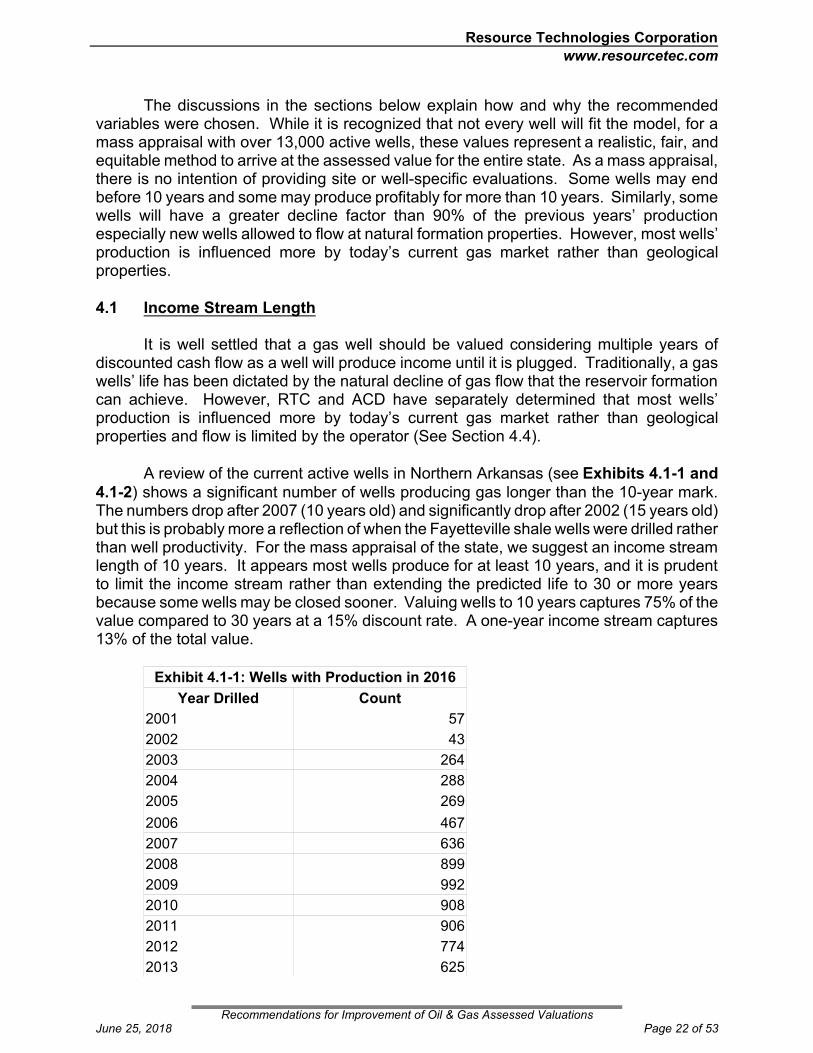
A review of the current active wells in Northern Arkansas (see Exhibits 4.1-1 and4.1-2) shows a significant number of wells producing gas longer than the 10-year mark. The numbers drop after 2007 (10 years old) and significantly drop after 2002 (15 years old)but this is probably more a reflection of when the Fayetteville shale wells were drilled ratherthan well productivity. For the mass appraisal of the state, we suggest an income streamlength of 10 years. It appears most wells produce for at least 10 years, and it is prudentto limit the income stream rather than extending the predicted life to 30 or more yearsbecause some wells may be closed sooner. Valuing wells to 10 years captures 75% of thevalue compared to 30 years at a 15% discount rate. A one-year income stream captures13% of the total value.
Exhibit 4.1-1: Wells with Production in 2016
Year Drilled Count
2001 57
2002 43
2003 264
2004 288
2005 269
2006 467
2007 636
2008 899
2009 992
2010 908
2011 906
2012 774
2013 625
Recommendations for Improvement of Oil & Gas Assessed ValuationsJune 25, 2018 Page 22 of 53
Resource Technologies Corporation www.resourcetec.com
Exhibit 4.2-1: Henry Hub Spot Price
2014 608
Exhibit 4.1-2: Wells Per Operator
OPERATOR Count
SEECO, Inc. (SWN) 3971
XTO Energy, Inc. 1874
BHP Billiton Petroleum (Fayetteville), LLC 954
Stephens Production Company 705
Forest Oil Corporation 482
Hanna Oil and Gas Company 210
Foundation Energy Management, LLC 210
Eagle Rock Mid-Continent Operating, LLC 100
It must be noted that every state’s method to value wells (a decline rate to an endof life), assumes no new production/reserves will come on line to replace the production.That is, only currently active production is valued in the overall income stream. Thismeans, after 10 years, the state is assumed to have no gas production - overall valuationis underestimated. However, valuing wells that are yet to be drilled is probably not withinthe realm of ad valorem taxation. It is a trade off because on the other hand since it isrecalculated every year all remaining wells are assumed to offer 10 years of remaining lifewhich may overestimate the value of some individual wells.
4.2 Gas Pricing
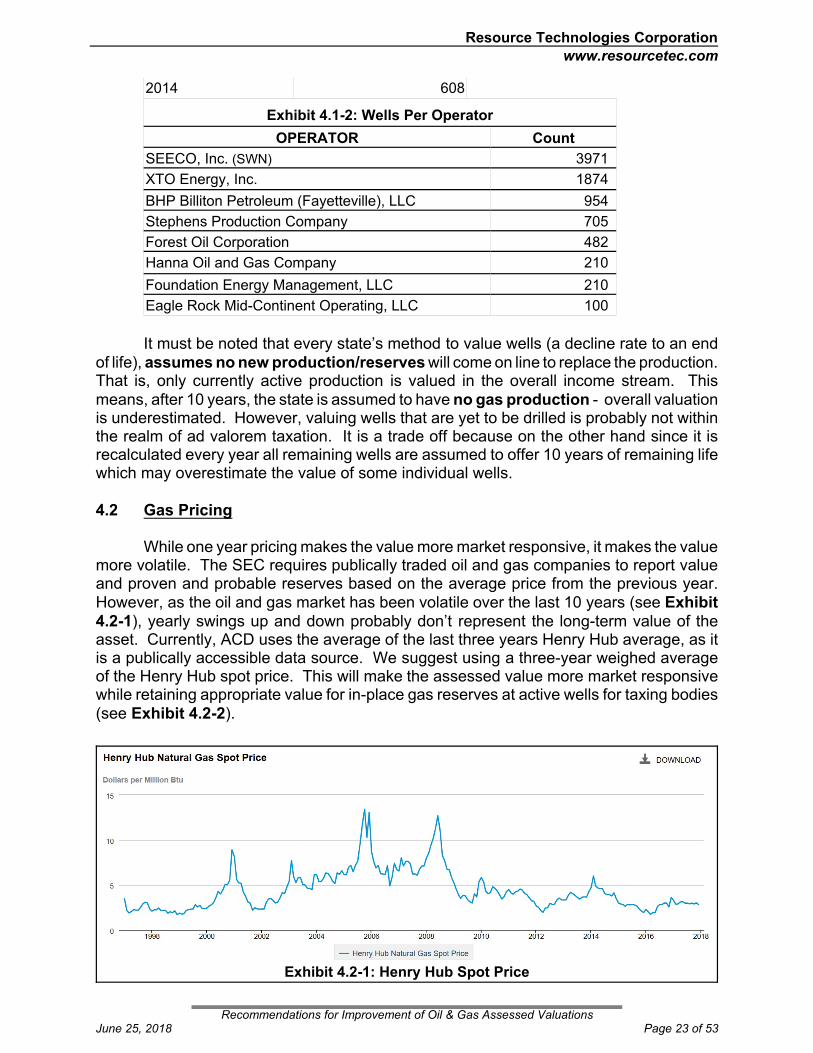
While one year pricing makes the value more market responsive, it makes the value more volatile. The SEC requires publically traded oil and gas companies to report valueand proven and probable reserves based on the average price from the previous year. However, as the oil and gas market has been volatile over the last 10 years (see Exhibit4.2-1), yearly swings up and down probably don’t represent the long-term value of theasset. Currently, ACD uses the average of the last three years Henry Hub average, as itis a publically accessible data source. We suggest using a three-year weighed averageof the Henry Hub spot price. This will make the assessed value more market responsivewhile retaining appropriate value for in-place gas reserves at active wells for taxing bodies(see Exhibit 4.2-2).
Recommendations for Improvement of Oil & Gas Assessed ValuationsJune 25, 2018 Page 23 of 53
Resource Technologies Corporation www.resourcetec.com
Exhibit 4.3-1: Most Common Decline Factor is 0.80-0.90
Exhibit 4.2-2: ACD Average Market Pricing (Tax Year 2017-2013)
Calendar Year Henry Hub AveragePrice
3 Year Average 3 Year Weighted Average(suggested)
2016 $2.31 $3.04 $2.71
2015 $2.54 $3.44 $3.28
2014 $4.26 $3.49 $3.75
2013 $3.53
2012 $2.67
4.3 Decline Factor
Throughout this report we refer to “Decline Factor”: this is the factor used to predictthe yearly decline of an oil or gas well. The Decline Factor is multiplied by previous years’production to estimate next year’s production. Most state taxing authorities use thismethod for calculation purposes. This differs slightly from the development of a “DeclineRate/Curve” traditionally used by the industry where a harmonic or hyperbolic decline curveis fitted to the natural formation characteristics of the reservoir. For the mass appraisal ofwells across an entire state, this difference is insignificant.
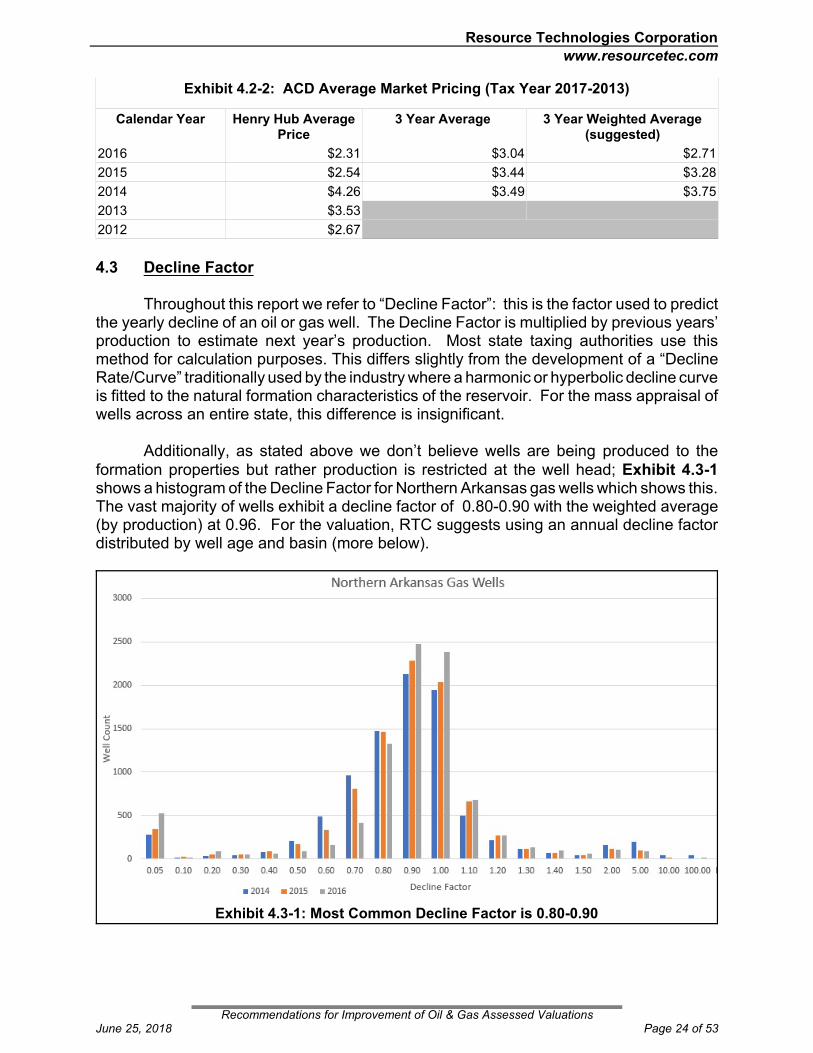
Additionally, as stated above we don’t believe wells are being produced to theformation properties but rather production is restricted at the well head; Exhibit 4.3-1shows a histogram of the Decline Factor for Northern Arkansas gas wells which shows this.The vast majority of wells exhibit a decline factor of 0.80-0.90 with the weighted average(by production) at 0.96. For the valuation, RTC suggests using an annual decline factor distributed by well age and basin (more below).
Recommendations for Improvement of Oil & Gas Assessed ValuationsJune 25, 2018 Page 24 of 53
Resource Technologies Corporation www.resourcetec.com
4.3.1 Fayetteville Shale
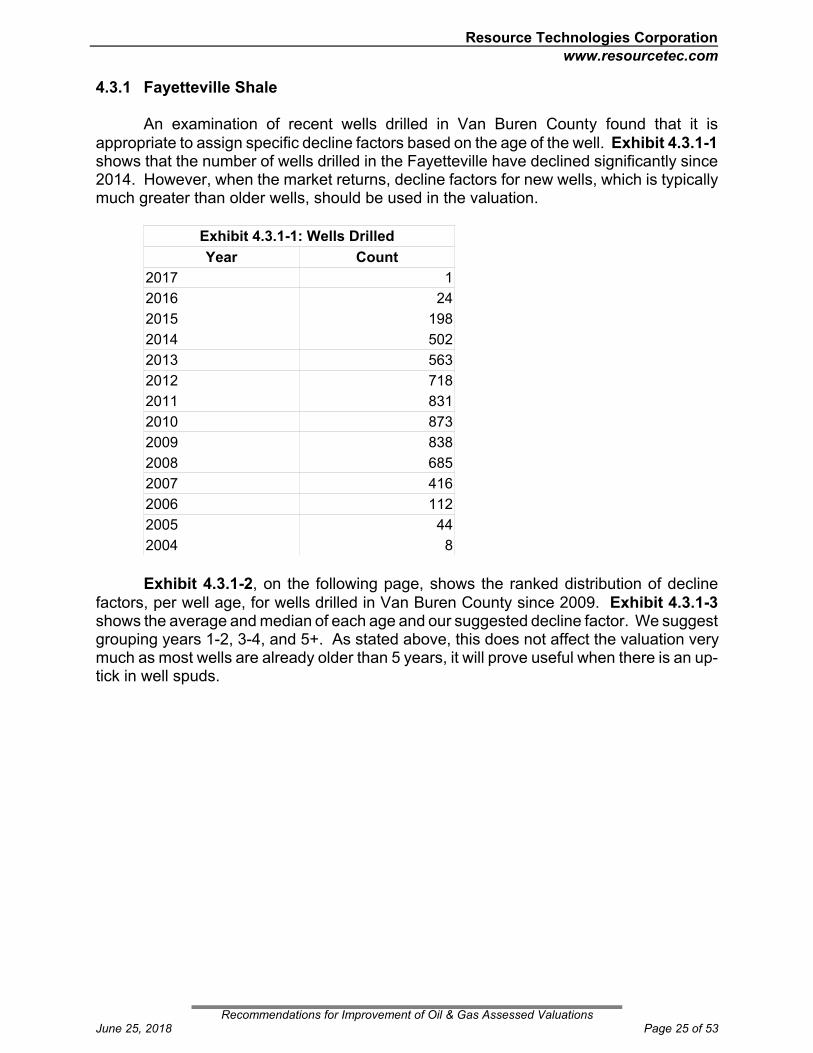
An examination of recent wells drilled in Van Buren County found that it isappropriate to assign specific decline factors based on the age of the well. Exhibit 4.3.1-1shows that the number of wells drilled in the Fayetteville have declined significantly since2014. However, when the market returns, decline factors for new wells, which is typicallymuch greater than older wells, should be used in the valuation.
Exhibit 4.3.1-1: Wells Drilled
Year Count
2017 1
2016 24
2015 198
2014 502
2013 563
2012 718
2011 831
2010 873
2009 838
2008 685
2007 416
2006 112
2005 44
2004 8
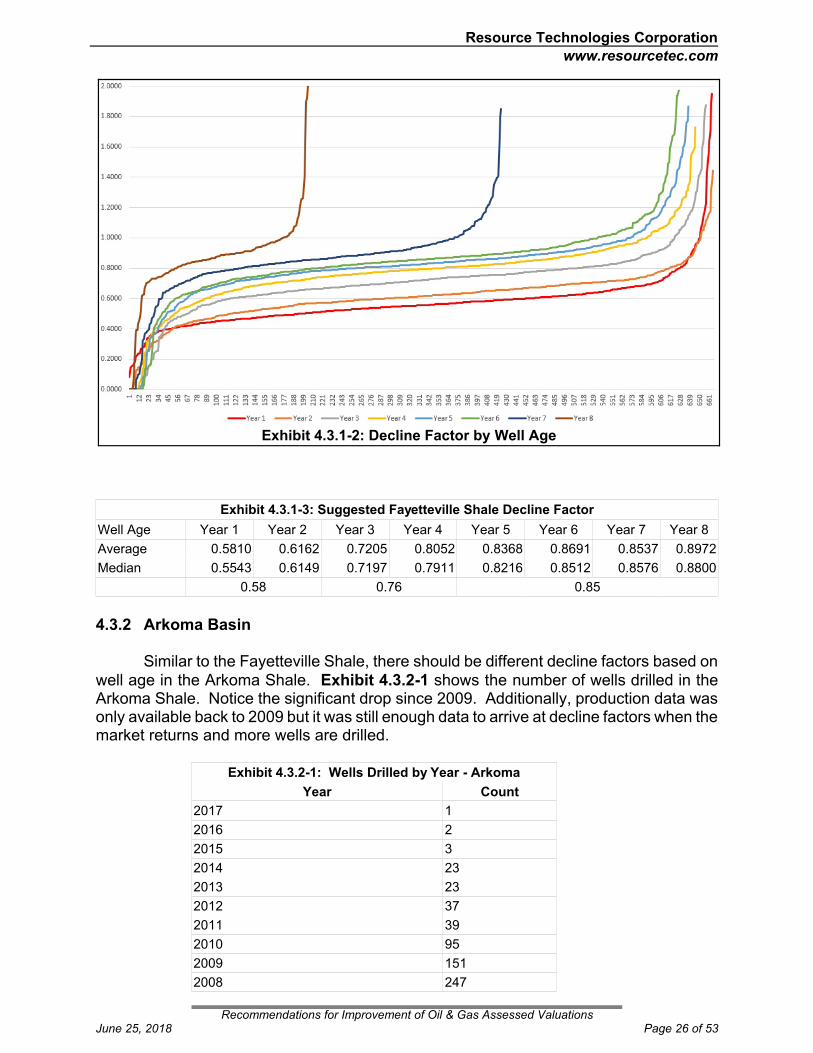
Exhibit 4.3.1-2, on the following page, shows the ranked distribution of declinefactors, per well age, for wells drilled in Van Buren County since 2009. Exhibit 4.3.1-3shows the average and median of each age and our suggested decline factor. We suggestgrouping years 1-2, 3-4, and 5+. As stated above, this does not affect the valuation verymuch as most wells are already older than 5 years, it will prove useful when there is an up-tick in well spuds.
Recommendations for Improvement of Oil & Gas Assessed ValuationsJune 25, 2018 Page 25 of 53
Resource Technologies Corporation www.resourcetec.com
Exhibit 4.3.1-2: Decline Factor by Well Age
Exhibit 4.3.1-3: Suggested Fayetteville Shale Decline Factor
Well Age Year 1 Year 2 Year 3 Year 4 Year 5 Year 6 Year 7 Year 8
Average 0.5810 0.6162 0.7205 0.8052 0.8368 0.8691 0.8537 0.8972
Median 0.5543 0.6149 0.7197 0.7911 0.8216 0.8512 0.8576 0.8800
0.58 0.76 0.85
4.3.2 Arkoma Basin
Similar to the Fayetteville Shale, there should be different decline factors based onwell age in the Arkoma Shale. Exhibit 4.3.2-1 shows the number of wells drilled in theArkoma Shale. Notice the significant drop since 2009. Additionally, production data wasonly available back to 2009 but it was still enough data to arrive at decline factors when themarket returns and more wells are drilled.
Exhibit 4.3.2-1: Wells Drilled by Year - Arkoma
Year Count
2017 1
2016 2
2015 3
2014 23
2013 23
2012 37
2011 39
2010 95
2009 151
2008 247
Recommendations for Improvement of Oil & Gas Assessed ValuationsJune 25, 2018 Page 26 of 53
Resource Technologies Corporation www.resourcetec.com
Exhibit 4.3.2-1: Wells Drilled by Year - Arkoma
Year Count
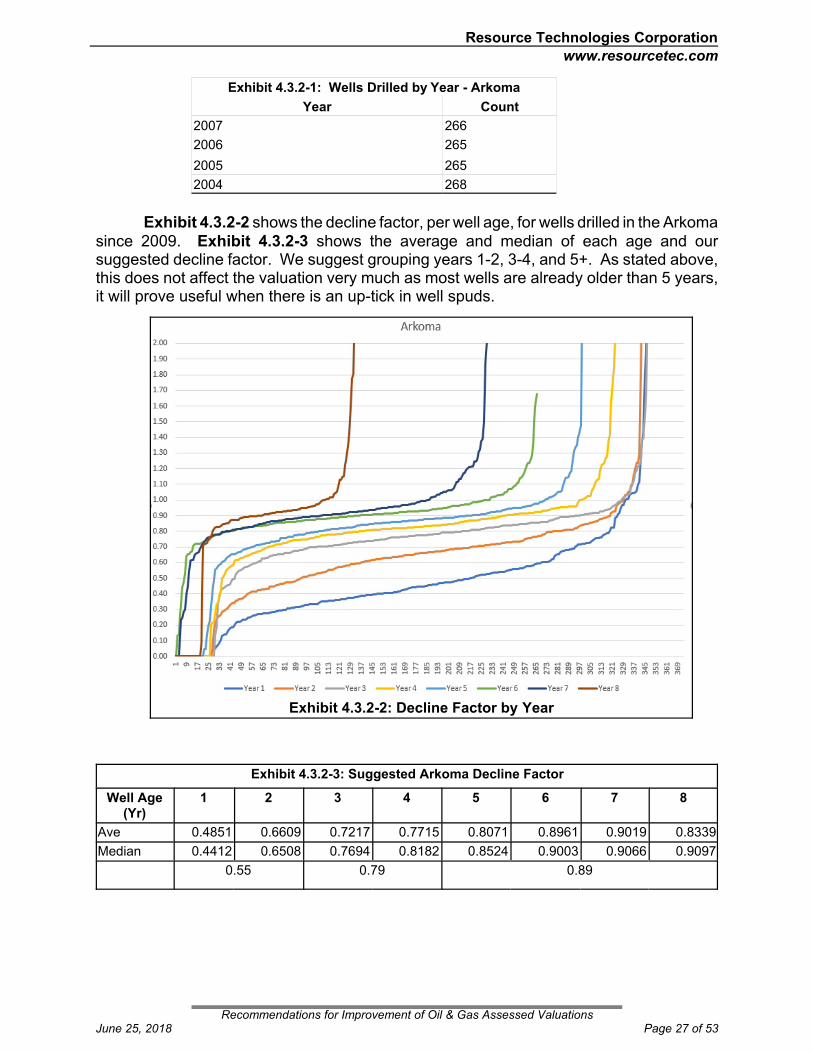
Exhibit 4.3.2-2: Decline Factor by Year
2007 266
2006 265
2005 265
2004 268
Exhibit 4.3.2-2 shows the decline factor, per well age, for wells drilled in the Arkomasince 2009. Exhibit 4.3.2-3 shows the average and median of each age and oursuggested decline factor. We suggest grouping years 1-2, 3-4, and 5+. As stated above,this does not affect the valuation very much as most wells are already older than 5 years,it will prove useful when there is an up-tick in well spuds.
Exhibit 4.3.2-3: Suggested Arkoma Decline Factor
Well Age(Yr)
1 2 3 4 5 6 7 8
Ave 0.4851 0.6609 0.7217 0.7715 0.8071 0.8961 0.9019 0.8339
Median 0.4412 0.6508 0.7694 0.8182 0.8524 0.9003 0.9066 0.9097
0.55 0.79 0.89
Recommendations for Improvement of Oil & Gas Assessed ValuationsJune 25, 2018 Page 27 of 53
Resource Technologies Corporation www.resourcetec.com
4.4 Expenses
Oil and gas wells require a minimum cost to operate. Generally, this ranges from$20,000 to $48,000 per year and depends on production level. Theoretically, wellsproducing less revenue than the minimum cost to operate are typically shut-in. Forexample, at $3.00/MCF, a well would have to produce a least 7,000 MCF to be profitable. However, a review of well production in Northern Arkansas show a full 14% of gas wellsare operating below this threshold. Therefore, we do not suggest that the State model theeconomic life of a well to closure but rather have the operator report when the well isclosed, or no production for the year.
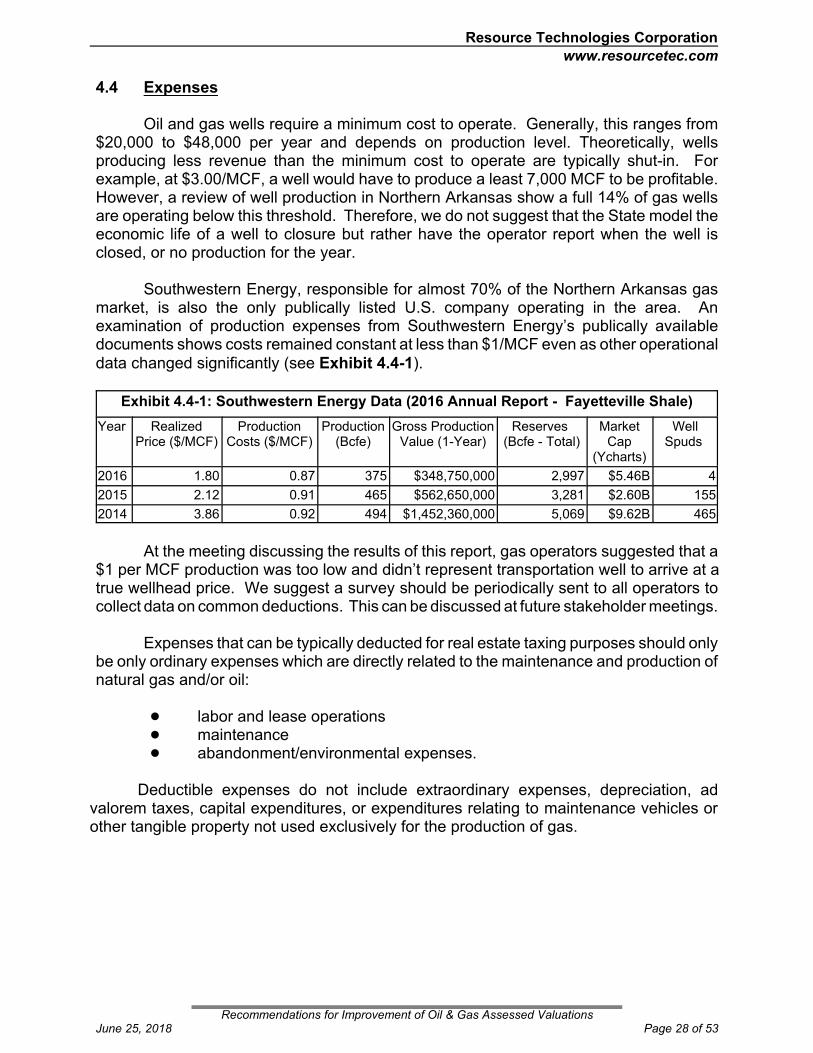
Southwestern Energy, responsible for almost 70% of the Northern Arkansas gasmarket, is also the only publically listed U.S. company operating in the area. Anexamination of production expenses from Southwestern Energy’s publically availabledocuments shows costs remained constant at less than $1/MCF even as other operationaldata changed significantly (see Exhibit 4.4-1).
Exhibit 4.4-1: Southwestern Energy Data (2016 Annual Report - Fayetteville Shale)
Year RealizedPrice ($/MCF)
ProductionCosts ($/MCF)
Production(Bcfe)
Gross ProductionValue (1-Year)
Reserves (Bcfe - Total)
MarketCap
(Ycharts)
WellSpuds
2016 1.80 0.87 375 $348,750,000 2,997 $5.46B 4
2015 2.12 0.91 465 $562,650,000 3,281 $2.60B 155
2014 3.86 0.92 494 $1,452,360,000 5,069 $9.62B 465
At the meeting discussing the results of this report, gas operators suggested that a$1 per MCF production was too low and didn’t represent transportation well to arrive at atrue wellhead price. We suggest a survey should be periodically sent to all operators tocollect data on common deductions. This can be discussed at future stakeholder meetings.
Expenses that can be typically deducted for real estate taxing purposes should only be only ordinary expenses which are directly related to the maintenance and production ofnatural gas and/or oil:
! labor and lease operations! maintenance! abandonment/environmental expenses.
Deductible expenses do not include extraordinary expenses, depreciation, advalorem taxes, capital expenditures, or expenditures relating to maintenance vehicles orother tangible property not used exclusively for the production of gas.
Recommendations for Improvement of Oil & Gas Assessed ValuationsJune 25, 2018 Page 28 of 53
Resource Technologies Corporation www.resourcetec.com
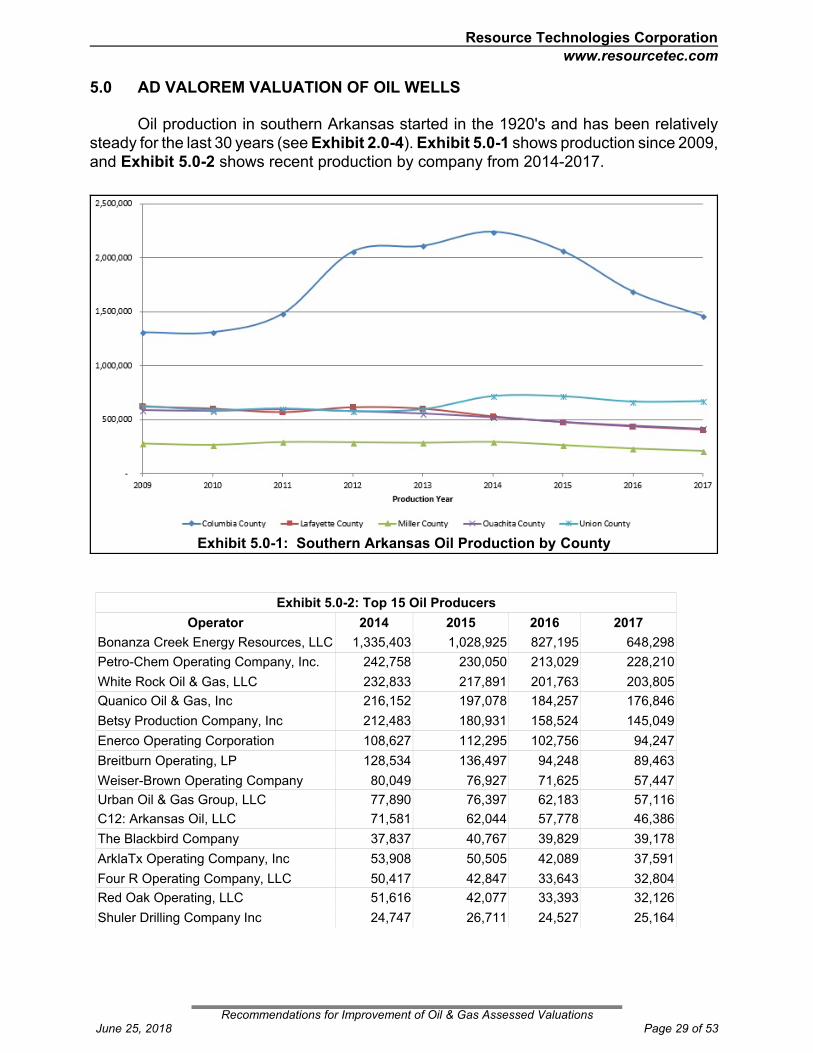
Exhibit 5.0-1: Southern Arkansas Oil Production by County
5.0 AD VALOREM VALUATION OF OIL WELLS
Oil production in southern Arkansas started in the 1920's and has been relativelysteady for the last 30 years (see Exhibit 2.0-4). Exhibit 5.0-1 shows production since 2009,and Exhibit 5.0-2 shows recent production by company from 2014-2017.
Exhibit 5.0-2: Top 15 Oil Producers
Operator 2014 2015 2016 2017
Bonanza Creek Energy Resources, LLC 1,335,403 1,028,925 827,195 648,298
Petro-Chem Operating Company, Inc. 242,758 230,050 213,029 228,210
White Rock Oil & Gas, LLC 232,833 217,891 201,763 203,805
Quanico Oil & Gas, Inc 216,152 197,078 184,257 176,846
Betsy Production Company, Inc 212,483 180,931 158,524 145,049
Enerco Operating Corporation 108,627 112,295 102,756 94,247
Breitburn Operating, LP 128,534 136,497 94,248 89,463
Weiser-Brown Operating Company 80,049 76,927 71,625 57,447
Urban Oil & Gas Group, LLC 77,890 76,397 62,183 57,116
C12: Arkansas Oil, LLC 71,581 62,044 57,778 46,386
The Blackbird Company 37,837 40,767 39,829 39,178
ArklaTx Operating Company, Inc 53,908 50,505 42,089 37,591
Four R Operating Company, LLC 50,417 42,847 33,643 32,804
Red Oak Operating, LLC 51,616 42,077 33,393 32,126
Shuler Drilling Company Inc 24,747 26,711 24,527 25,164
Recommendations for Improvement of Oil & Gas Assessed ValuationsJune 25, 2018 Page 29 of 53
Resource Technologies Corporation www.resourcetec.com
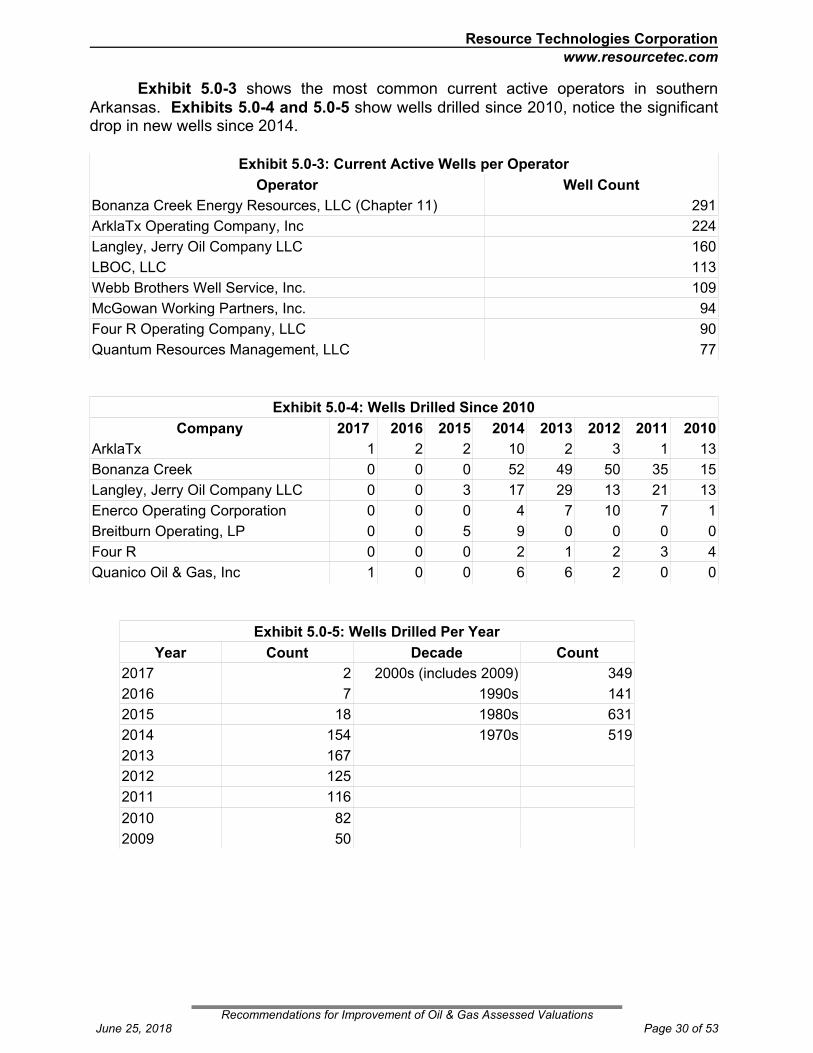
Exhibit 5.0-3 shows the most common current active operators in southernArkansas. Exhibits 5.0-4 and 5.0-5 show wells drilled since 2010, notice the significantdrop in new wells since 2014.
Exhibit 5.0-3: Current Active Wells per Operator
Operator Well Count
Bonanza Creek Energy Resources, LLC (Chapter 11) 291
ArklaTx Operating Company, Inc 224
Langley, Jerry Oil Company LLC 160
LBOC, LLC 113
Webb Brothers Well Service, Inc. 109
McGowan Working Partners, Inc. 94
Four R Operating Company, LLC 90
Quantum Resources Management, LLC 77
Exhibit 5.0-4: Wells Drilled Since 2010
Company 2017 2016 2015 2014 2013 2012 2011 2010
ArklaTx 1 2 2 10 2 3 1 13
Bonanza Creek 0 0 0 52 49 50 35 15
Langley, Jerry Oil Company LLC 0 0 3 17 29 13 21 13
Enerco Operating Corporation 0 0 0 4 7 10 7 1
Breitburn Operating, LP 0 0 5 9 0 0 0 0
Four R 0 0 0 2 1 2 3 4
Quanico Oil & Gas, Inc 1 0 0 6 6 2 0 0
Exhibit 5.0-5: Wells Drilled Per Year
Year Count Decade Count
2017 2 2000s (includes 2009) 349
2016 7 1990s 141
2015 18 1980s 631
2014 154 1970s 519
2013 167
2012 125
2011 116
2010 82
2009 50
Recommendations for Improvement of Oil & Gas Assessed ValuationsJune 25, 2018 Page 30 of 53
Resource Technologies Corporation www.resourcetec.com
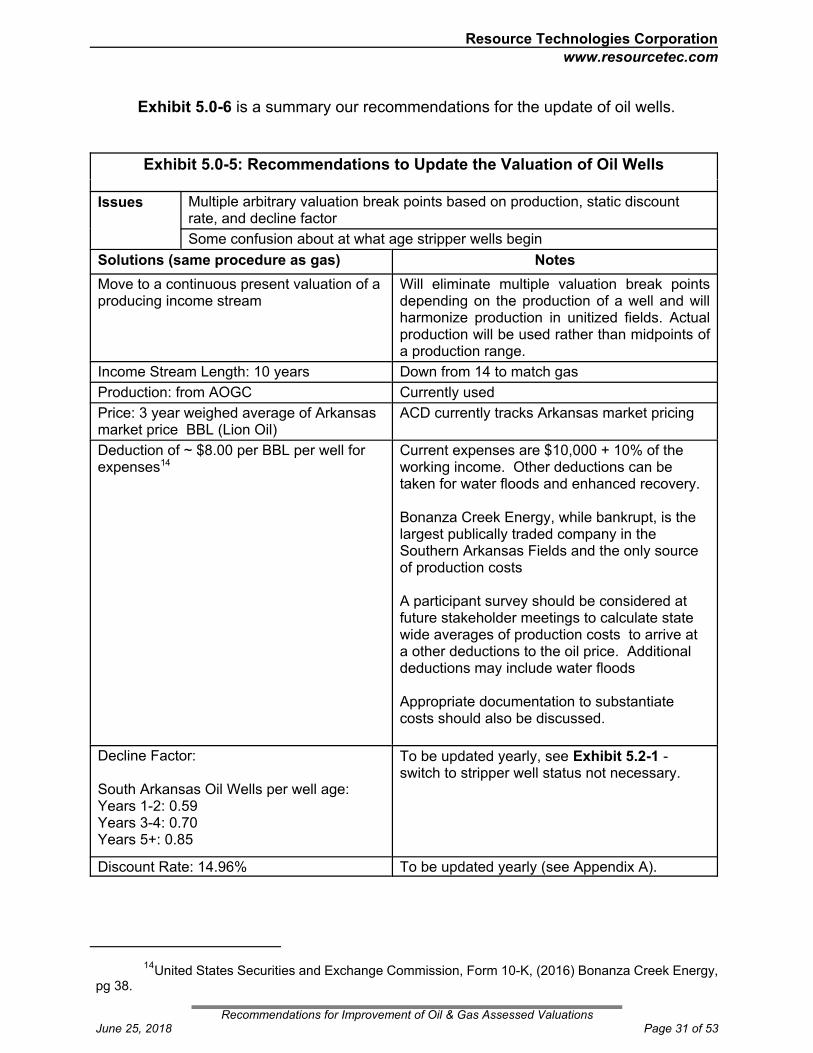
Exhibit 5.0-6 is a summary our recommendations for the update of oil wells.
Exhibit 5.0-5: Recommendations to Update the Valuation of Oil Wells
Issues Multiple arbitrary valuation break points based on production, static discountrate, and decline factor
Some confusion about at what age stripper wells begin
Solutions (same procedure as gas) Notes
Move to a continuous present valuation of aproducing income stream
Will eliminate multiple valuation break pointsdepending on the production of a well and willharmonize production in unitized fields. Actualproduction will be used rather than midpoints ofa production range.
Income Stream Length: 10 years Down from 14 to match gas
Production: from AOGC Currently used
Price: 3 year weighed average of Arkansasmarket price BBL (Lion Oil)
ACD currently tracks Arkansas market pricing
Deduction of ~ $8.00 per BBL per well forexpenses14
Current expenses are $10,000 + 10% of theworking income. Other deductions can betaken for water floods and enhanced recovery.
Bonanza Creek Energy, while bankrupt, is thelargest publically traded company in theSouthern Arkansas Fields and the only sourceof production costs
A participant survey should be considered atfuture stakeholder meetings to calculate statewide averages of production costs to arrive ata other deductions to the oil price. Additionaldeductions may include water floods
Appropriate documentation to substantiatecosts should also be discussed.
Decline Factor:
South Arkansas Oil Wells per well age:Years 1-2: 0.59Years 3-4: 0.70Years 5+: 0.85
To be updated yearly, see Exhibit 5.2-1 - switch to stripper well status not necessary.
Discount Rate: 14.96% To be updated yearly (see Appendix A).
14United States Securities and Exchange Commission, Form 10-K, (2016) Bonanza Creek Energy,
pg 38.
Recommendations for Improvement of Oil & Gas Assessed ValuationsJune 25, 2018 Page 31 of 53
Resource Technologies Corporation www.resourcetec.com
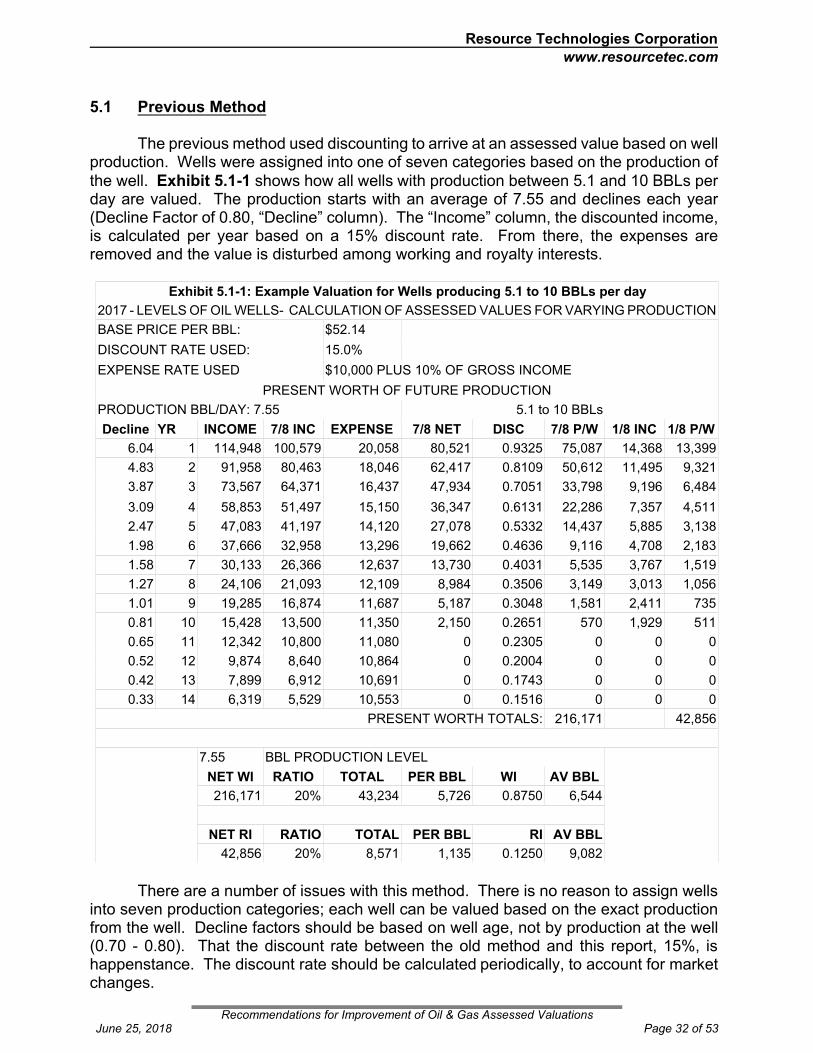
5.1 Previous Method
The previous method used discounting to arrive at an assessed value based on wellproduction. Wells were assigned into one of seven categories based on the production ofthe well. Exhibit 5.1-1 shows how all wells with production between 5.1 and 10 BBLs perday are valued. The production starts with an average of 7.55 and declines each year(Decline Factor of 0.80, “Decline” column). The “Income” column, the discounted income,is calculated per year based on a 15% discount rate. From there, the expenses areremoved and the value is disturbed among working and royalty interests.
Exhibit 5.1-1: Example Valuation for Wells producing 5.1 to 10 BBLs per day
2017 - LEVELS OF OIL WELLS- CALCULATION OF ASSESSED VALUES FOR VARYING PRODUCTION
BASE PRICE PER BBL: $52.14
DISCOUNT RATE USED: 15.0%
EXPENSE RATE USED $10,000 PLUS 10% OF GROSS INCOME
PRESENT WORTH OF FUTURE PRODUCTION
PRODUCTION BBL/DAY: 7.55 5.1 to 10 BBLs
Decline YR INCOME 7/8 INC EXPENSE 7/8 NET DISC 7/8 P/W 1/8 INC 1/8 P/W
6.04 1 114,948 100,579 20,058 80,521 0.9325 75,087 14,368 13,399
4.83 2 91,958 80,463 18,046 62,417 0.8109 50,612 11,495 9,321
3.87 3 73,567 64,371 16,437 47,934 0.7051 33,798 9,196 6,484
3.09 4 58,853 51,497 15,150 36,347 0.6131 22,286 7,357 4,511
2.47 5 47,083 41,197 14,120 27,078 0.5332 14,437 5,885 3,138
1.98 6 37,666 32,958 13,296 19,662 0.4636 9,116 4,708 2,183
1.58 7 30,133 26,366 12,637 13,730 0.4031 5,535 3,767 1,519
1.27 8 24,106 21,093 12,109 8,984 0.3506 3,149 3,013 1,056
1.01 9 19,285 16,874 11,687 5,187 0.3048 1,581 2,411 735
0.81 10 15,428 13,500 11,350 2,150 0.2651 570 1,929 511
0.65 11 12,342 10,800 11,080 0 0.2305 0 0 0
0.52 12 9,874 8,640 10,864 0 0.2004 0 0 0
0.42 13 7,899 6,912 10,691 0 0.1743 0 0 0
0.33 14 6,319 5,529 10,553 0 0.1516 0 0 0
PRESENT WORTH TOTALS: 216,171 42,856
7.55 BBL PRODUCTION LEVEL
NET WI RATIO TOTAL PER BBL WI AV BBL
216,171 20% 43,234 5,726 0.8750 6,544
NET RI RATIO TOTAL PER BBL RI AV BBL
42,856 20% 8,571 1,135 0.1250 9,082
There are a number of issues with this method. There is no reason to assign wellsinto seven production categories; each well can be valued based on the exact productionfrom the well. Decline factors should be based on well age, not by production at the well(0.70 - 0.80). That the discount rate between the old method and this report, 15%, ishappenstance. The discount rate should be calculated periodically, to account for marketchanges.
Recommendations for Improvement of Oil & Gas Assessed ValuationsJune 25, 2018 Page 32 of 53
Resource Technologies Corporation www.resourcetec.com
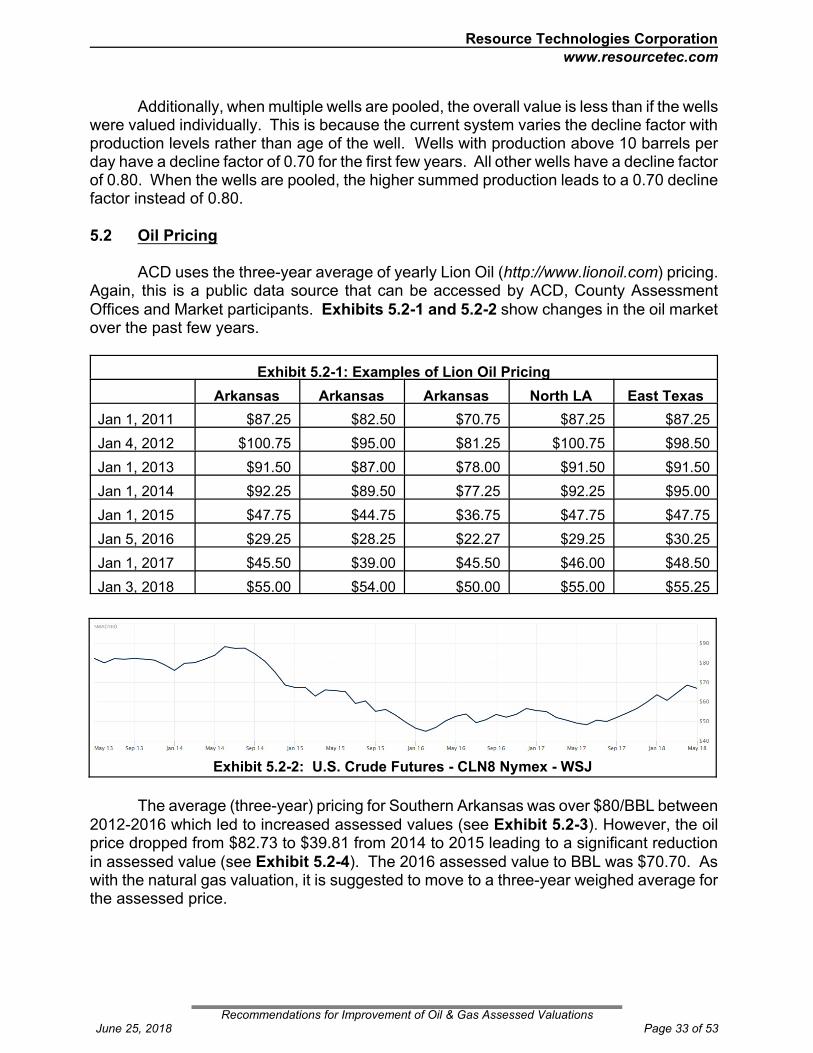
Exhibit 5.2-2: U.S. Crude Futures - CLN8 Nymex - WSJ
Additionally, when multiple wells are pooled, the overall value is less than if the wellswere valued individually. This is because the current system varies the decline factor withproduction levels rather than age of the well. Wells with production above 10 barrels perday have a decline factor of 0.70 for the first few years. All other wells have a decline factorof 0.80. When the wells are pooled, the higher summed production leads to a 0.70 declinefactor instead of 0.80.
5.2 Oil Pricing
ACD uses the three-year average of yearly Lion Oil (http://www.lionoil.com) pricing.Again, this is a public data source that can be accessed by ACD, County AssessmentOffices and Market participants. Exhibits 5.2-1 and 5.2-2 show changes in the oil marketover the past few years.
Exhibit 5.2-1: Examples of Lion Oil Pricing
Arkansas Arkansas Arkansas North LA East Texas
Jan 1, 2011 $87.25 $82.50 $70.75 $87.25 $87.25
Jan 4, 2012 $100.75 $95.00 $81.25 $100.75 $98.50
Jan 1, 2013 $91.50 $87.00 $78.00 $91.50 $91.50
Jan 1, 2014 $92.25 $89.50 $77.25 $92.25 $95.00
Jan 1, 2015 $47.75 $44.75 $36.75 $47.75 $47.75
Jan 5, 2016 $29.25 $28.25 $22.27 $29.25 $30.25
Jan 1, 2017 $45.50 $39.00 $45.50 $46.00 $48.50
Jan 3, 2018 $55.00 $54.00 $50.00 $55.00 $55.25
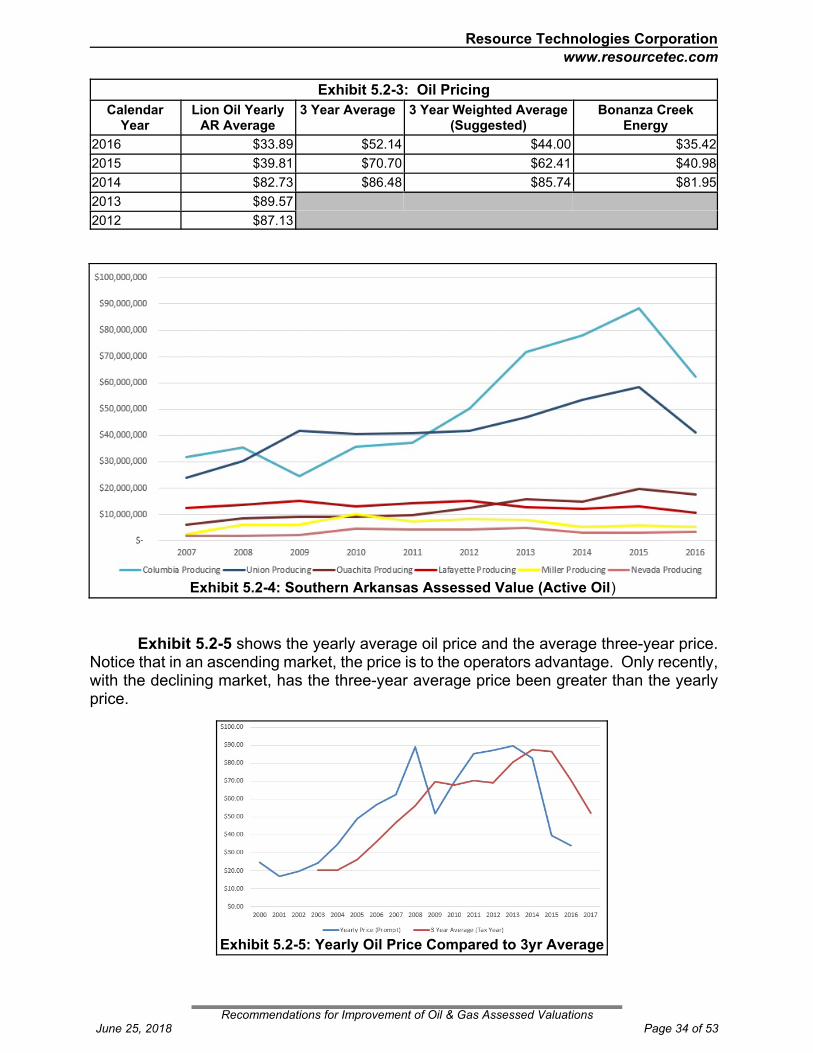
The average (three-year) pricing for Southern Arkansas was over $80/BBL between2012-2016 which led to increased assessed values (see Exhibit 5.2-3). However, the oilprice dropped from $82.73 to $39.81 from 2014 to 2015 leading to a significant reductionin assessed value (see Exhibit 5.2-4). The 2016 assessed value to BBL was $70.70. Aswith the natural gas valuation, it is suggested to move to a three-year weighed average forthe assessed price.
Recommendations for Improvement of Oil & Gas Assessed ValuationsJune 25, 2018 Page 33 of 53
Resource Technologies Corporation www.resourcetec.com
Exhibit 5.2-4: Southern Arkansas Assessed Value (Active Oil)
Exhibit 5.2-5: Yearly Oil Price Compared to 3yr Average
Exhibit 5.2-3: Oil Pricing
CalendarYear
Lion Oil YearlyAR Average
3 Year Average 3 Year Weighted Average(Suggested)
Bonanza CreekEnergy
2016 $33.89 $52.14 $44.00 $35.42
2015 $39.81 $70.70 $62.41 $40.98
2014 $82.73 $86.48 $85.74 $81.95
2013 $89.57
2012 $87.13
Exhibit 5.2-5 shows the yearly average oil price and the average three-year price. Notice that in an ascending market, the price is to the operators advantage. Only recently,with the declining market, has the three-year average price been greater than the yearlyprice.
Recommendations for Improvement of Oil & Gas Assessed ValuationsJune 25, 2018 Page 34 of 53
Resource Technologies Corporation www.resourcetec.com
5.3 Deductions
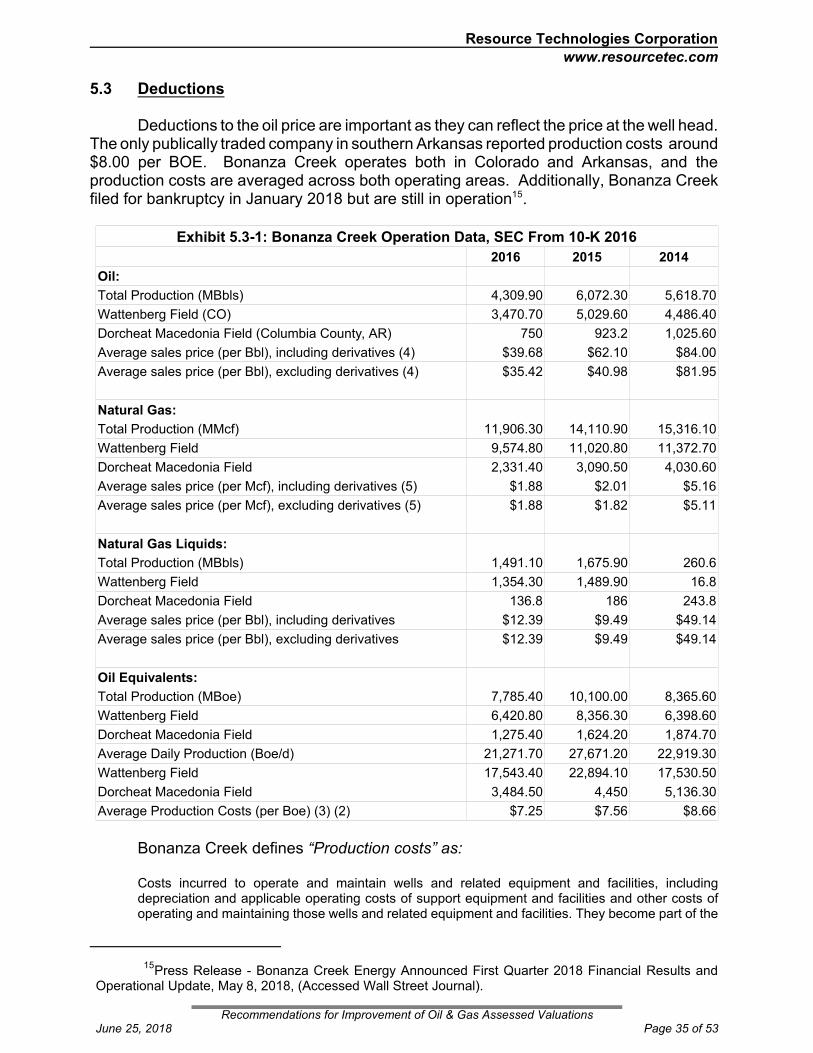
Deductions to the oil price are important as they can reflect the price at the well head. The only publically traded company in southern Arkansas reported production costs around$8.00 per BOE. Bonanza Creek operates both in Colorado and Arkansas, and theproduction costs are averaged across both operating areas. Additionally, Bonanza Creekfiled for bankruptcy in January 2018 but are still in operation15.
Exhibit 5.3-1: Bonanza Creek Operation Data, SEC From 10-K 2016
2016 2015 2014
Oil:
Total Production (MBbls) 4,309.90 6,072.30 5,618.70
Wattenberg Field (CO) 3,470.70 5,029.60 4,486.40
Dorcheat Macedonia Field (Columbia County, AR) 750 923.2 1,025.60
Average sales price (per Bbl), including derivatives (4) $39.68 $62.10 $84.00
Average sales price (per Bbl), excluding derivatives (4) $35.42 $40.98 $81.95
Natural Gas:
Total Production (MMcf) 11,906.30 14,110.90 15,316.10
Wattenberg Field 9,574.80 11,020.80 11,372.70
Dorcheat Macedonia Field 2,331.40 3,090.50 4,030.60
Average sales price (per Mcf), including derivatives (5) $1.88 $2.01 $5.16
Average sales price (per Mcf), excluding derivatives (5) $1.88 $1.82 $5.11
Natural Gas Liquids:
Total Production (MBbls) 1,491.10 1,675.90 260.6
Wattenberg Field 1,354.30 1,489.90 16.8
Dorcheat Macedonia Field 136.8 186 243.8
Average sales price (per Bbl), including derivatives $12.39 $9.49 $49.14
Average sales price (per Bbl), excluding derivatives $12.39 $9.49 $49.14
Oil Equivalents:
Total Production (MBoe) 7,785.40 10,100.00 8,365.60
Wattenberg Field 6,420.80 8,356.30 6,398.60
Dorcheat Macedonia Field 1,275.40 1,624.20 1,874.70
Average Daily Production (Boe/d) 21,271.70 27,671.20 22,919.30
Wattenberg Field 17,543.40 22,894.10 17,530.50
Dorcheat Macedonia Field 3,484.50 4,450 5,136.30
Average Production Costs (per Boe) (3) (2) $7.25 $7.56 $8.66
Bonanza Creek defines “Production costs” as:
Costs incurred to operate and maintain wells and related equipment and facilities, includingdepreciation and applicable operating costs of support equipment and facilities and other costs ofoperating and maintaining those wells and related equipment and facilities. They become part of the
15Press Release - Bonanza Creek Energy Announced First Quarter 2018 Financial Results and
Operational Update, May 8, 2018, (Accessed Wall Street Journal).
Recommendations for Improvement of Oil & Gas Assessed ValuationsJune 25, 2018 Page 35 of 53
Resource Technologies Corporation www.resourcetec.com
cost of oil and gas produced. Examples of production costs (sometimes called lifting costs) are (a)costs of labor to operate the wells and related equipment and facilities; (b) repairs and maintenance; © materials, supplies, and fuel consumed and supplies utilized in operating the wells and relatedequipment and facilities; (d) property taxes and insurance applicable to proved properties and wells
and related equipment and facilities; and (e) severance taxes.
A Wall Street Journal Survey16 from 2016 showed total expenditures over $20 per barrel, butproduction costs were only about a quarter of that, and actually less than what Bonanza Creekreported.
U.S. Shale U.S. Non Shale
Gross Taxes $6.42 $5.03
Capital Spending $7.56 $7.70
Production Costs $5.85 $5.15
SGA & Trans $3.52 $3.11
Total $23.35 $20.90
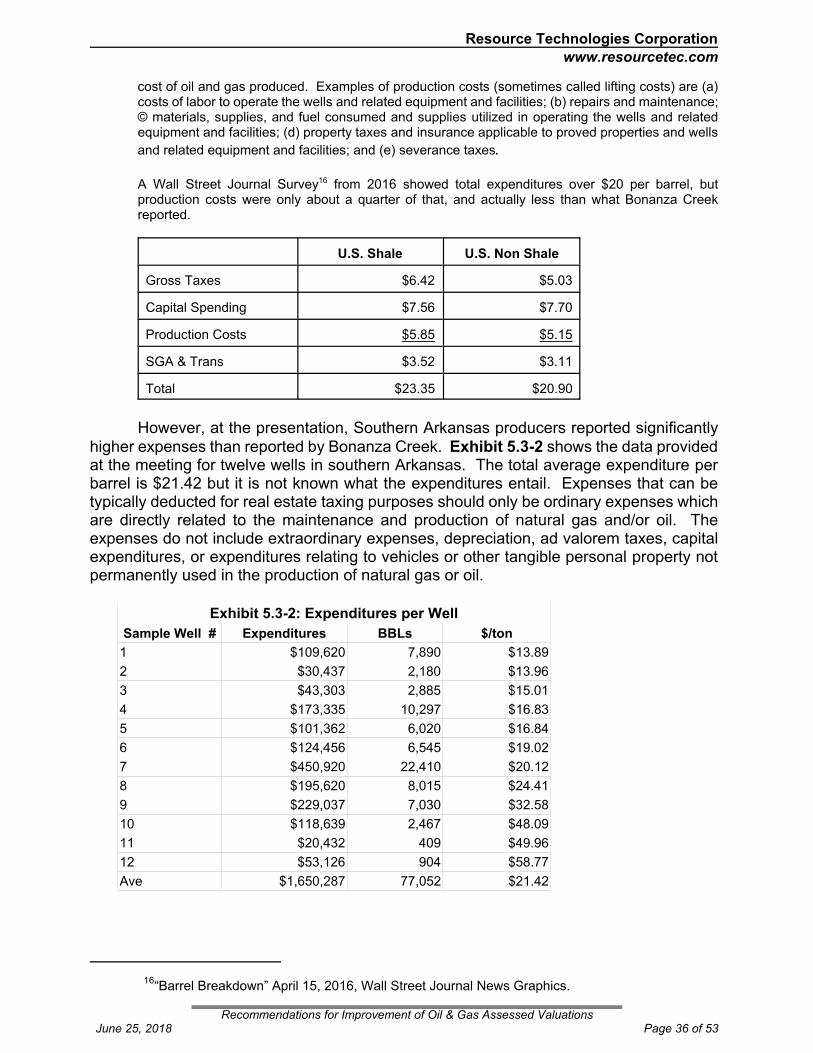
However, at the presentation, Southern Arkansas producers reported significantlyhigher expenses than reported by Bonanza Creek. Exhibit 5.3-2 shows the data providedat the meeting for twelve wells in southern Arkansas. The total average expenditure perbarrel is $21.42 but it is not known what the expenditures entail. Expenses that can betypically deducted for real estate taxing purposes should only be ordinary expenses whichare directly related to the maintenance and production of natural gas and/or oil. Theexpenses do not include extraordinary expenses, depreciation, ad valorem taxes, capitalexpenditures, or expenditures relating to vehicles or other tangible personal property notpermanently used in the production of natural gas or oil.
Exhibit 5.3-2: Expenditures per Well
Sample Well # Expenditures BBLs $/ton
1 $109,620 7,890 $13.89
2 $30,437 2,180 $13.96
3 $43,303 2,885 $15.01
4 $173,335 10,297 $16.83
5 $101,362 6,020 $16.84
6 $124,456 6,545 $19.02
7 $450,920 22,410 $20.12
8 $195,620 8,015 $24.41
9 $229,037 7,030 $32.58
10 $118,639 2,467 $48.09
11 $20,432 409 $49.96
12 $53,126 904 $58.77
Ave $1,650,287 77,052 $21.42
16“Barrel Breakdown” April 15, 2016, Wall Street Journal News Graphics.
Recommendations for Improvement of Oil & Gas Assessed ValuationsJune 25, 2018 Page 36 of 53
Resource Technologies Corporation www.resourcetec.com
Exhibit 5.4-1: Oil Decline Factor
There is a significant difference between $8 and $21 per barrel for a total deduction. The table above can serve as a starting point for future stakeholder meetings and the needfor operator data in the process. The expenses that operators should report still needs tobe discussed. Additional deductions may include water floods Appropriate documentationto substantiate costs should also be discussed.
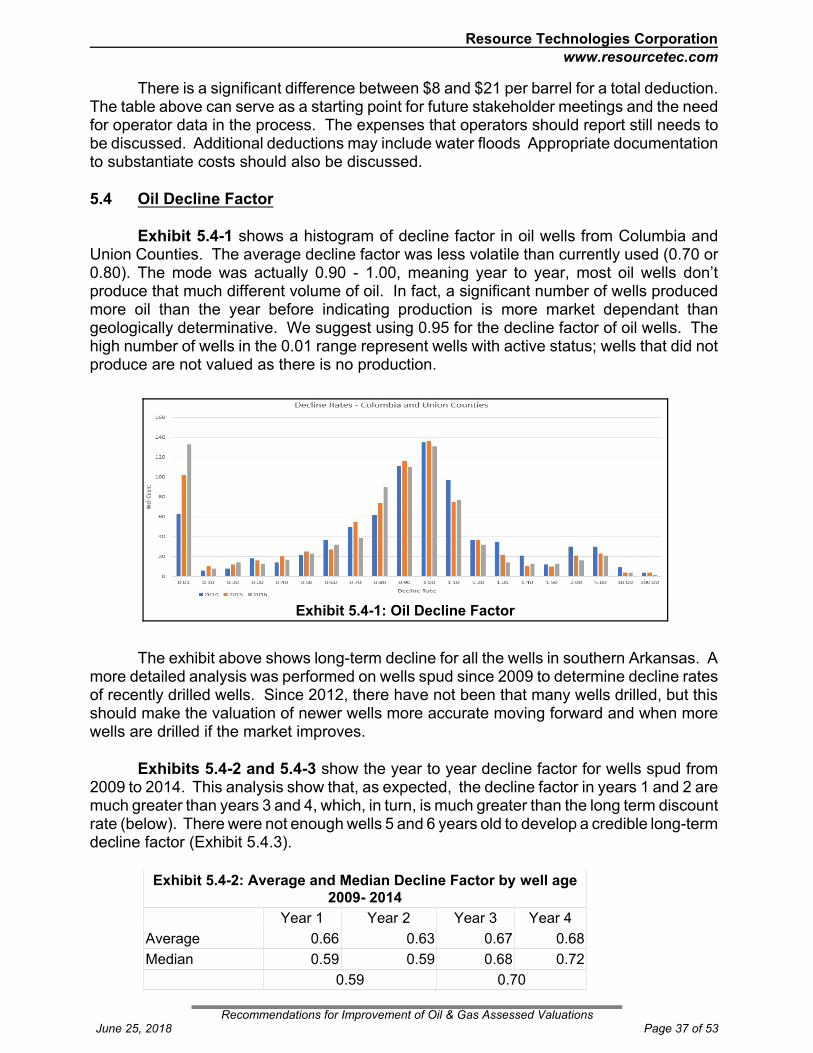
5.4 Oil Decline Factor
Exhibit 5.4-1 shows a histogram of decline factor in oil wells from Columbia andUnion Counties. The average decline factor was less volatile than currently used (0.70 or0.80). The mode was actually 0.90 - 1.00, meaning year to year, most oil wells don’tproduce that much different volume of oil. In fact, a significant number of wells producedmore oil than the year before indicating production is more market dependant thangeologically determinative. We suggest using 0.95 for the decline factor of oil wells. Thehigh number of wells in the 0.01 range represent wells with active status; wells that did notproduce are not valued as there is no production.
The exhibit above shows long-term decline for all the wells in southern Arkansas. Amore detailed analysis was performed on wells spud since 2009 to determine decline ratesof recently drilled wells. Since 2012, there have not been that many wells drilled, but thisshould make the valuation of newer wells more accurate moving forward and when morewells are drilled if the market improves.
Exhibits 5.4-2 and 5.4-3 show the year to year decline factor for wells spud from2009 to 2014. This analysis show that, as expected, the decline factor in years 1 and 2 aremuch greater than years 3 and 4, which, in turn, is much greater than the long term discountrate (below). There were not enough wells 5 and 6 years old to develop a credible long-termdecline factor (Exhibit 5.4.3).
Exhibit 5.4-2: Average and Median Decline Factor by well age2009- 2014
Year 1 Year 2 Year 3 Year 4
Average 0.66 0.63 0.67 0.68
Median 0.59 0.59 0.68 0.72
0.59 0.70
Recommendations for Improvement of Oil & Gas Assessed ValuationsJune 25, 2018 Page 37 of 53
Resource Technologies Corporation www.resourcetec.com
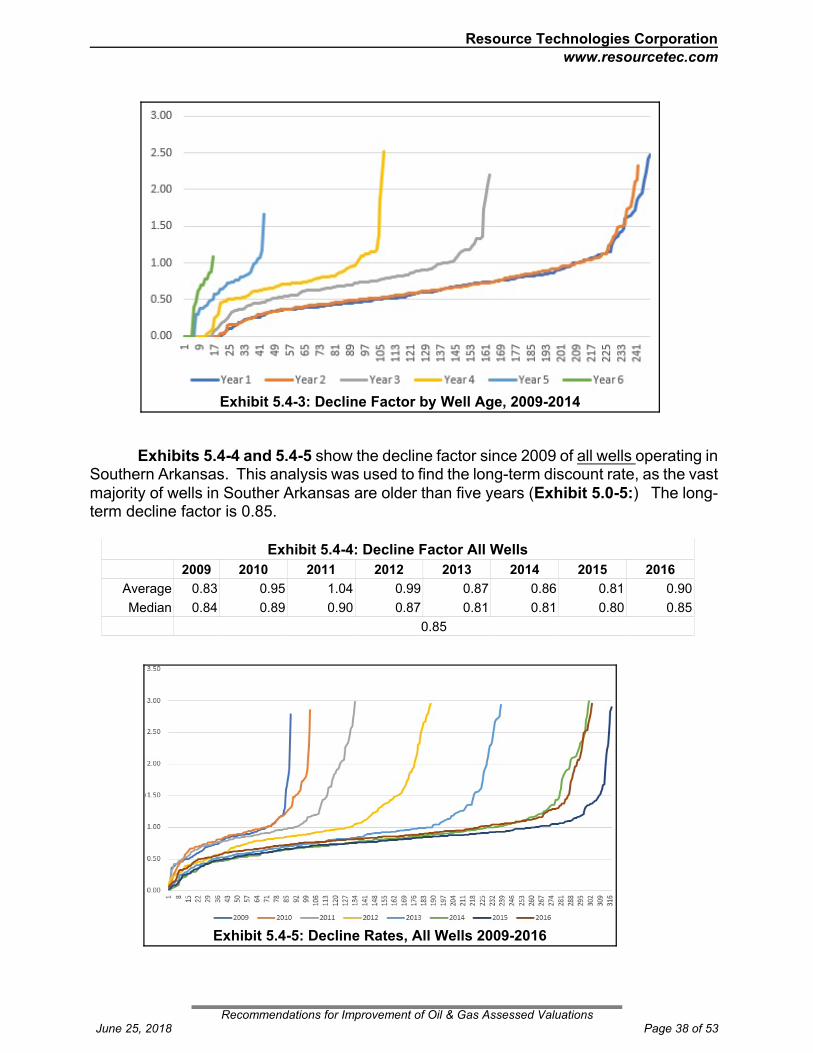
Exhibit 5.4-3: Decline Factor by Well Age, 2009-2014
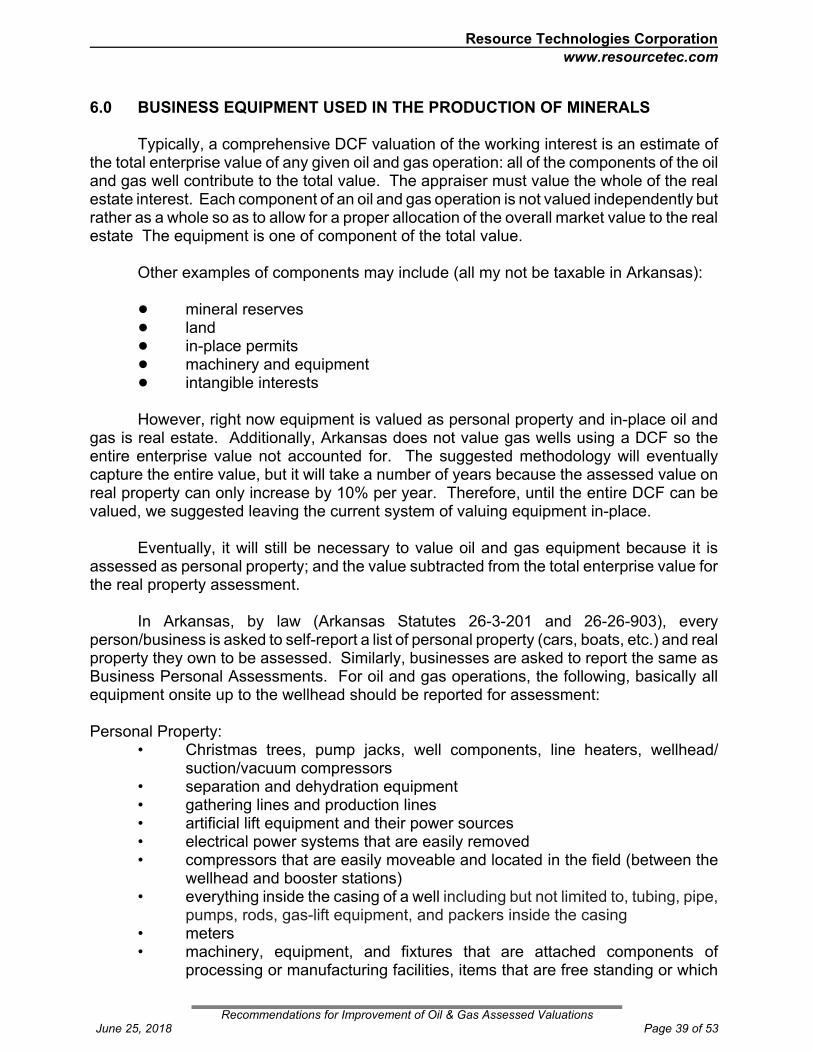
Exhibit 5.4-5: Decline Rates, All Wells 2009-2016
Exhibits 5.4-4 and 5.4-5 show the decline factor since 2009 of all wells operating inSouthern Arkansas. This analysis was used to find the long-term discount rate, as the vastmajority of wells in Souther Arkansas are older than five years (Exhibit 5.0-5:) The long-term decline factor is 0.85.
Exhibit 5.4-4: Decline Factor All Wells
2009 2010 2011 2012 2013 2014 2015 2016
Average 0.83 0.95 1.04 0.99 0.87 0.86 0.81 0.90
Median 0.84 0.89 0.90 0.87 0.81 0.81 0.80 0.85
0.85
Recommendations for Improvement of Oil & Gas Assessed ValuationsJune 25, 2018 Page 38 of 53
Resource Technologies Corporation www.resourcetec.com
6.0 BUSINESS EQUIPMENT USED IN THE PRODUCTION OF MINERALS
Typically, a comprehensive DCF valuation of the working interest is an estimate ofthe total enterprise value of any given oil and gas operation: all of the components of the oiland gas well contribute to the total value. The appraiser must value the whole of the realestate interest. Each component of an oil and gas operation is not valued independently butrather as a whole so as to allow for a proper allocation of the overall market value to the realestate The equipment is one of component of the total value.
Other examples of components may include (all my not be taxable in Arkansas):
! mineral reserves! land! in-place permits! machinery and equipment! intangible interests
However, right now equipment is valued as personal property and in-place oil andgas is real estate. Additionally, Arkansas does not value gas wells using a DCF so theentire enterprise value not accounted for. The suggested methodology will eventuallycapture the entire value, but it will take a number of years because the assessed value onreal property can only increase by 10% per year. Therefore, until the entire DCF can bevalued, we suggested leaving the current system of valuing equipment in-place.
Eventually, it will still be necessary to value oil and gas equipment because it isassessed as personal property; and the value subtracted from the total enterprise value forthe real property assessment.
In Arkansas, by law (Arkansas Statutes 26-3-201 and 26-26-903), everyperson/business is asked to self-report a list of personal property (cars, boats, etc.) and realproperty they own to be assessed. Similarly, businesses are asked to report the same asBusiness Personal Assessments. For oil and gas operations, the following, basically allequipment onsite up to the wellhead should be reported for assessment:
Personal Property:• Christmas trees, pump jacks, well components, line heaters, wellhead/
suction/vacuum compressors • separation and dehydration equipment • gathering lines and production lines• artificial lift equipment and their power sources• electrical power systems that are easily removed• compressors that are easily moveable and located in the field (between the
wellhead and booster stations)• everything inside the casing of a well including but not limited to, tubing, pipe,
pumps, rods, gas-lift equipment, and packers inside the casing• meters• machinery, equipment, and fixtures that are attached components of
processing or manufacturing facilities, items that are free standing or which
Recommendations for Improvement of Oil & Gas Assessed ValuationsJune 25, 2018 Page 39 of 53
Resource Technologies Corporation www.resourcetec.com
are bolted down but are readily removed without damage are tangiblepersonal property (TPP)
• compressors at compressor stations other than leased compressors,
Real Property:• pump stations, booster stations • storage facilities – tanks, standing alone or in batteries• casing (in place)• enhanced production-injection and recovery systems which cannot be moved,
intact• vapor recovery systems• production platforms with supports permanently embedded in the sea bed • water disposal systems (same guidelines as storage facilities)• gathering lines that are totally underground except for road or water crossings,
etc.• underground storage facilities.
Another good source to see all possible oil and gas equipment is from the ArkansasDepartment of Finance and Administration17.
Generally, the distinction between personal and real property is how easily theequipment can be moved18. Personal property is taxed in Arkansas (cars, boats, etc), andoil and gas personal property should be as well. Real property that adds value to overallproperty should be included in the ad valorem assessment of the whole parcel.
To assess the personal and real property equipment and fixtures assembled on anoil and gas site, ACD currently recommends County Assessors use Oklahoma’s BusinessPersonal Property Valuation Schedule for Petroleum. While the entire document is titled“personal property” some fixtures are better defined as real property (underground storagetanks, for example).
The Oklahoma document directly discusses storage tanks, piping, and compressors. It references other valuation sources (Hadco to value oil and gas production and explorationequipment19, Marshall and Swift for piping). These materials are competent andcomprehensive data sources and we see no reason to change this suggestion. Otherwise,the State/County would be spending time repeating their efforts while chasing the samesales data on a yearly basis.
As discussed above, oil and gas operators should report all equipment (real orpersonal) up to the wellhead. Past the wellhead, ACD suggests $1 foot valuation for wellcasing. We see no reason that the well casing should be treated differently than other realproperty onsite and should be listed by the operator to be taxed in accordance with 26-26-903. Casing is better suited to be valued as real property. Casing is mentioned in the
17 https://www.dfa.arkansas.gov/images/uploads/exciseTaxOffice/AllowableMarketingCosts.pdf
18Audit Procedures for Oil and Gas Well Servicing, Texas Comptroller of Public Accounts.
19 http://www.hadcointernational.com/
Recommendations for Improvement of Oil & Gas Assessed ValuationsJune 25, 2018 Page 40 of 53
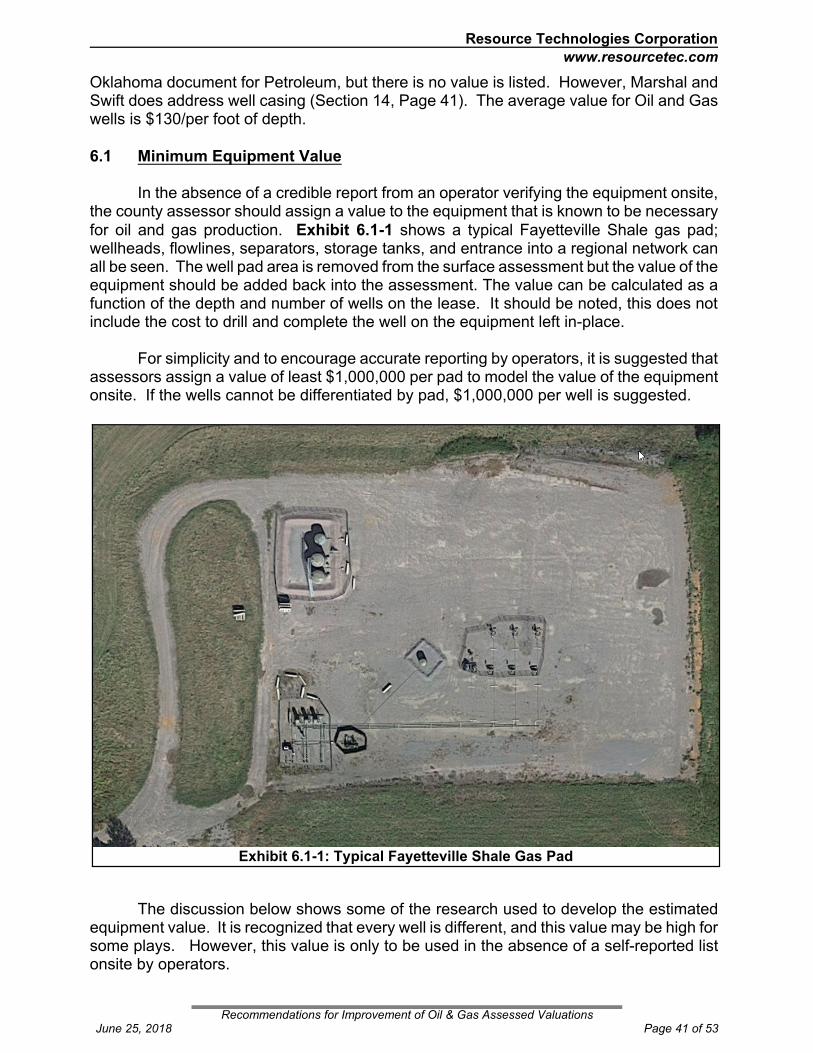
Resource Technologies Corporation www.resourcetec.com
Exhibit 6.1-1: Typical Fayetteville Shale Gas Pad
Oklahoma document for Petroleum, but there is no value is listed. However, Marshal andSwift does address well casing (Section 14, Page 41). The average value for Oil and Gaswells is $130/per foot of depth.
6.1 Minimum Equipment Value
In the absence of a credible report from an operator verifying the equipment onsite,the county assessor should assign a value to the equipment that is known to be necessaryfor oil and gas production. Exhibit 6.1-1 shows a typical Fayetteville Shale gas pad;wellheads, flowlines, separators, storage tanks, and entrance into a regional network canall be seen. The well pad area is removed from the surface assessment but the value of theequipment should be added back into the assessment. The value can be calculated as afunction of the depth and number of wells on the lease. It should be noted, this does notinclude the cost to drill and complete the well on the equipment left in-place.
For simplicity and to encourage accurate reporting by operators, it is suggested thatassessors assign a value of least $1,000,000 per pad to model the value of the equipmentonsite. If the wells cannot be differentiated by pad, $1,000,000 per well is suggested.
The discussion below shows some of the research used to develop the estimatedequipment value. It is recognized that every well is different, and this value may be high forsome plays. However, this value is only to be used in the absence of a self-reported listonsite by operators.
Recommendations for Improvement of Oil & Gas Assessed ValuationsJune 25, 2018 Page 41 of 53
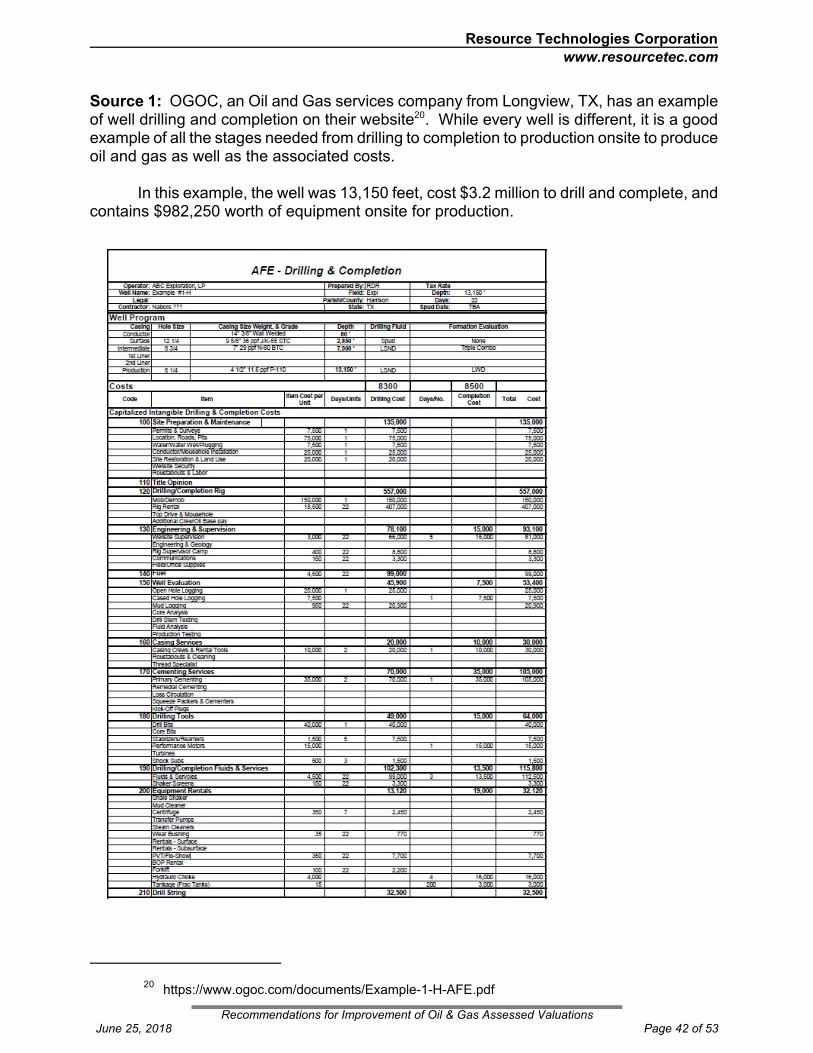
Resource Technologies Corporation www.resourcetec.com
Source 1: OGOC, an Oil and Gas services company from Longview, TX, has an exampleof well drilling and completion on their website20. While every well is different, it is a goodexample of all the stages needed from drilling to completion to production onsite to produceoil and gas as well as the associated costs.
In this example, the well was 13,150 feet, cost $3.2 million to drill and complete, andcontains $982,250 worth of equipment onsite for production.
20 https://www.ogoc.com/documents/Example-1-H-AFE.pdf
Recommendations for Improvement of Oil & Gas Assessed ValuationsJune 25, 2018 Page 42 of 53
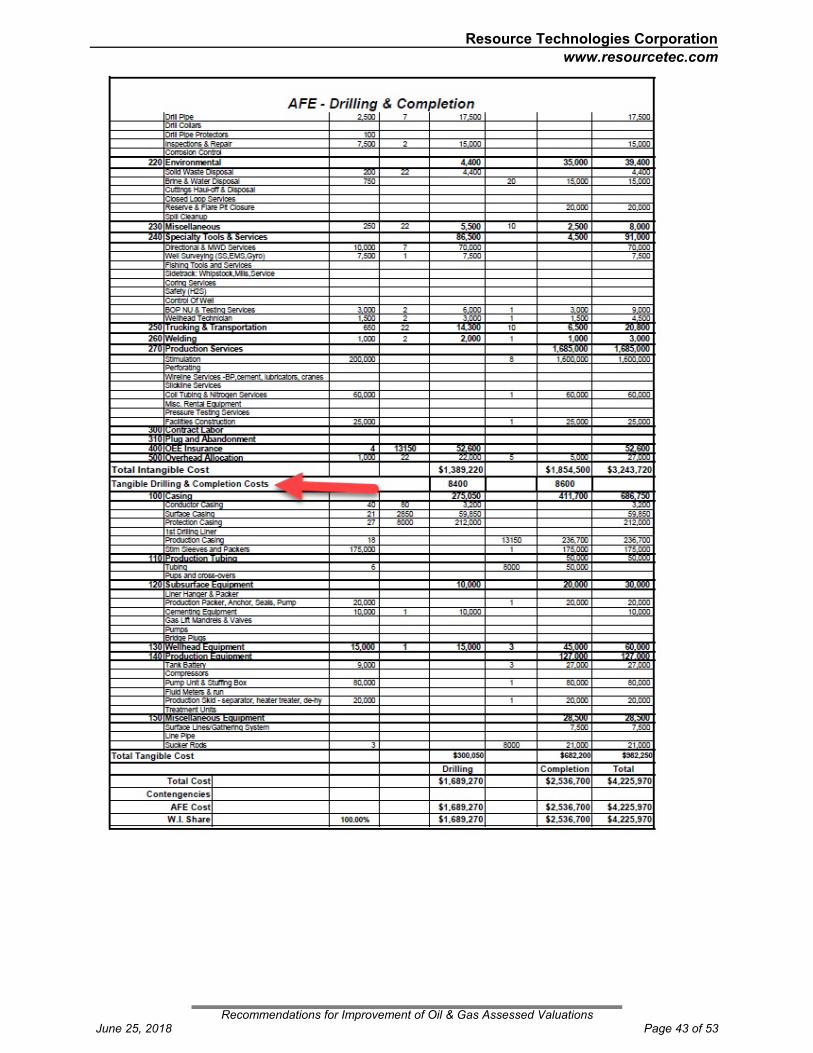
Resource Technologies Corporation www.resourcetec.com
Recommendations for Improvement of Oil & Gas Assessed ValuationsJune 25, 2018 Page 43 of 53
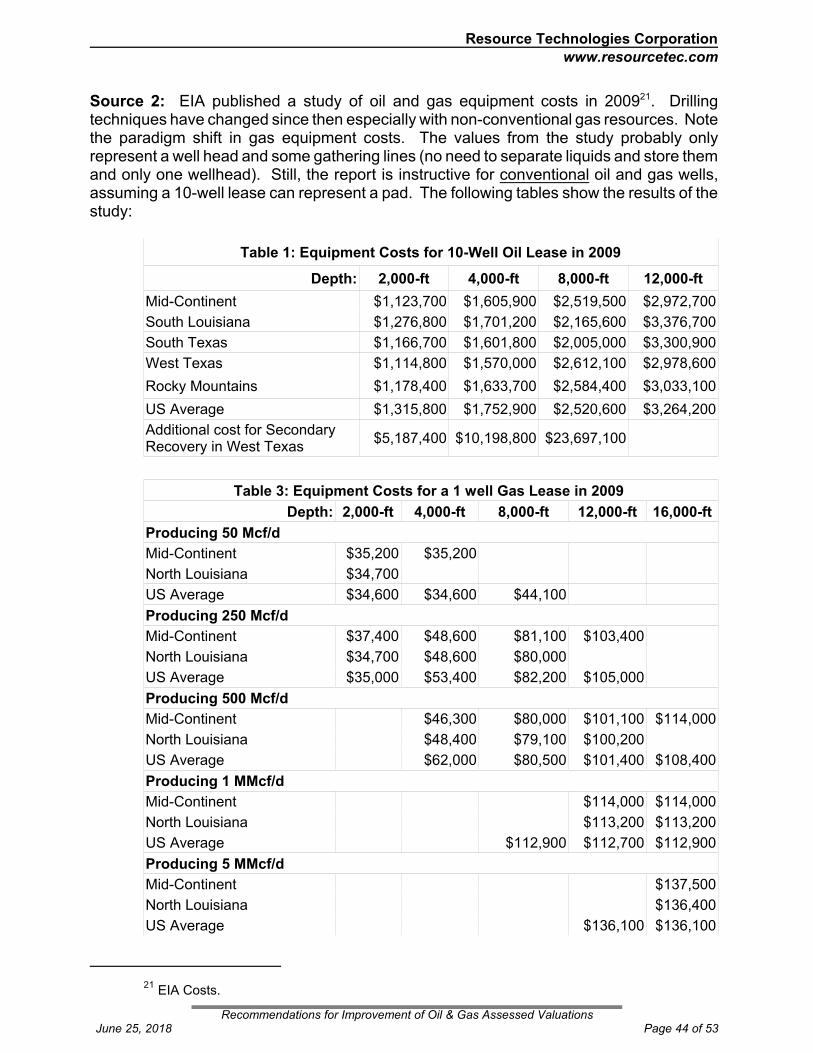
Resource Technologies Corporation www.resourcetec.com
Source 2: EIA published a study of oil and gas equipment costs in 200921. Drillingtechniques have changed since then especially with non-conventional gas resources. Notethe paradigm shift in gas equipment costs. The values from the study probably onlyrepresent a well head and some gathering lines (no need to separate liquids and store themand only one wellhead). Still, the report is instructive for conventional oil and gas wells,assuming a 10-well lease can represent a pad. The following tables show the results of thestudy:
Table 1: Equipment Costs for 10-Well Oil Lease in 2009
Depth: 2,000-ft 4,000-ft 8,000-ft 12,000-ft
Mid-Continent $1,123,700 $1,605,900 $2,519,500 $2,972,700
South Louisiana $1,276,800 $1,701,200 $2,165,600 $3,376,700
South Texas $1,166,700 $1,601,800 $2,005,000 $3,300,900
West Texas $1,114,800 $1,570,000 $2,612,100 $2,978,600
Rocky Mountains $1,178,400 $1,633,700 $2,584,400 $3,033,100
US Average $1,315,800 $1,752,900 $2,520,600 $3,264,200
Additional cost for SecondaryRecovery in West Texas
$5,187,400 $10,198,800 $23,697,100
Table 3: Equipment Costs for a 1 well Gas Lease in 2009
Depth: 2,000-ft 4,000-ft 8,000-ft 12,000-ft 16,000-ft
Producing 50 Mcf/d
Mid-Continent $35,200 $35,200
North Louisiana $34,700
US Average $34,600 $34,600 $44,100
Producing 250 Mcf/d
Mid-Continent $37,400 $48,600 $81,100 $103,400
North Louisiana $34,700 $48,600 $80,000
US Average $35,000 $53,400 $82,200 $105,000
Producing 500 Mcf/d
Mid-Continent $46,300 $80,000 $101,100 $114,000
North Louisiana $48,400 $79,100 $100,200
US Average $62,000 $80,500 $101,400 $108,400
Producing 1 MMcf/d
Mid-Continent $114,000 $114,000
North Louisiana $113,200 $113,200
US Average $112,900 $112,700 $112,900
Producing 5 MMcf/d
Mid-Continent $137,500
North Louisiana $136,400
US Average $136,100 $136,100
21 EIA Costs.
Recommendations for Improvement of Oil & Gas Assessed ValuationsJune 25, 2018 Page 44 of 53
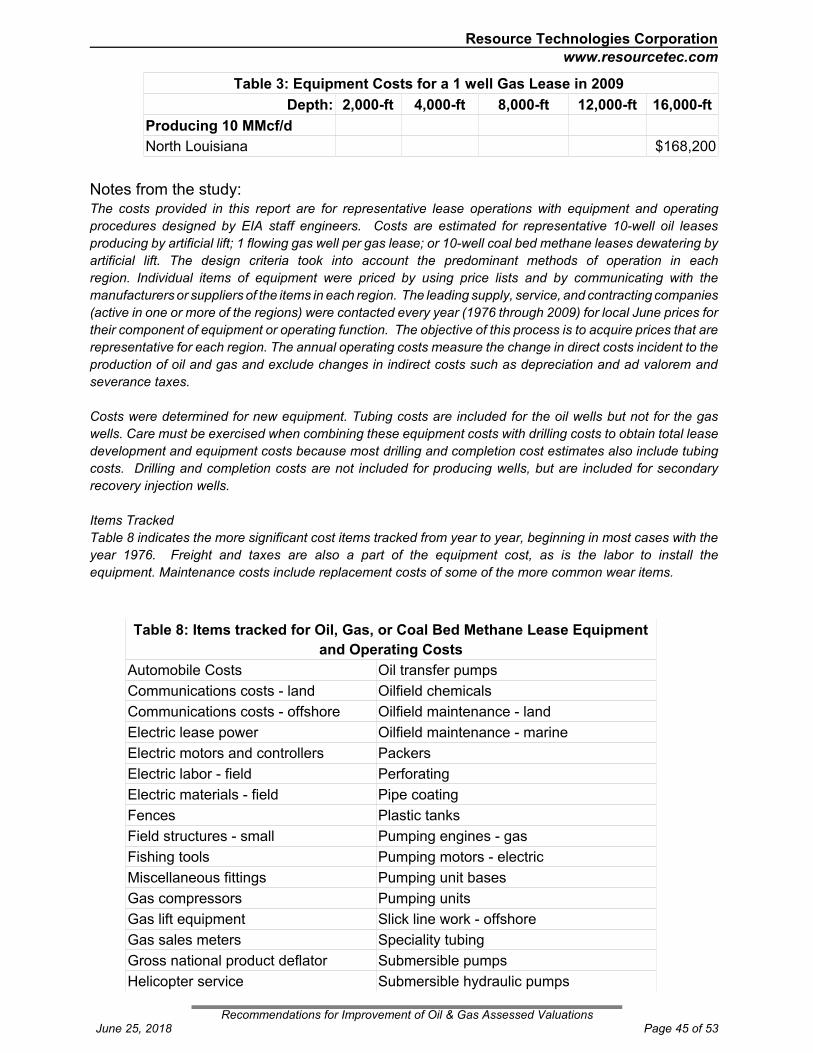
Resource Technologies Corporation www.resourcetec.com
Table 3: Equipment Costs for a 1 well Gas Lease in 2009
Depth: 2,000-ft 4,000-ft 8,000-ft 12,000-ft 16,000-ft
Producing 10 MMcf/d
North Louisiana $168,200
Notes from the study:The costs provided in this report are for representative lease operations with equipment and operating
procedures designed by EIA staff engineers. Costs are estimated for representative 10-well oil leases
producing by artificial lift; 1 flowing gas well per gas lease; or 10-well coal bed methane leases dewatering by
artificial lift. The design criteria took into account the predominant methods of operation in each
region. Individual items of equipment were priced by using price lists and by communicating with the
manufacturers or suppliers of the items in each region. The leading supply, service, and contracting companies
(active in one or more of the regions) were contacted every year (1976 through 2009) for local June prices for
their component of equipment or operating function. The objective of this process is to acquire prices that are
representative for each region. The annual operating costs measure the change in direct costs incident to the
production of oil and gas and exclude changes in indirect costs such as depreciation and ad valorem and
severance taxes.
Costs were determined for new equipment. Tubing costs are included for the oil wells but not for the gas
wells. Care must be exercised when combining these equipment costs with drilling costs to obtain total lease
development and equipment costs because most drilling and completion cost estimates also include tubing
costs. Drilling and completion costs are not included for producing wells, but are included for secondary
recovery injection wells.
Items Tracked
Table 8 indicates the more significant cost items tracked from year to year, beginning in most cases with the
year 1976. Freight and taxes are also a part of the equipment cost, as is the labor to install the
equipment. Maintenance costs include replacement costs of some of the more common wear items.
Table 8: Items tracked for Oil, Gas, or Coal Bed Methane Lease Equipment
and Operating Costs
Automobile Costs Oil transfer pumps
Communications costs - land Oilfield chemicals
Communications costs - offshore Oilfield maintenance - land
Electric lease power Oilfield maintenance - marine
Electric motors and controllers Packers
Electric labor - field Perforating
Electric materials - field Pipe coating
Fences Plastic tanks
Field structures - small Pumping engines - gas
Fishing tools Pumping motors - electric
Miscellaneous fittings Pumping unit bases
Gas compressors Pumping units
Gas lift equipment Slick line work - offshore
Gas sales meters Speciality tubing
Gross national product deflator Submersible pumps
Helicopter service Submersible hydraulic pumps
Recommendations for Improvement of Oil & Gas Assessed ValuationsJune 25, 2018 Page 45 of 53
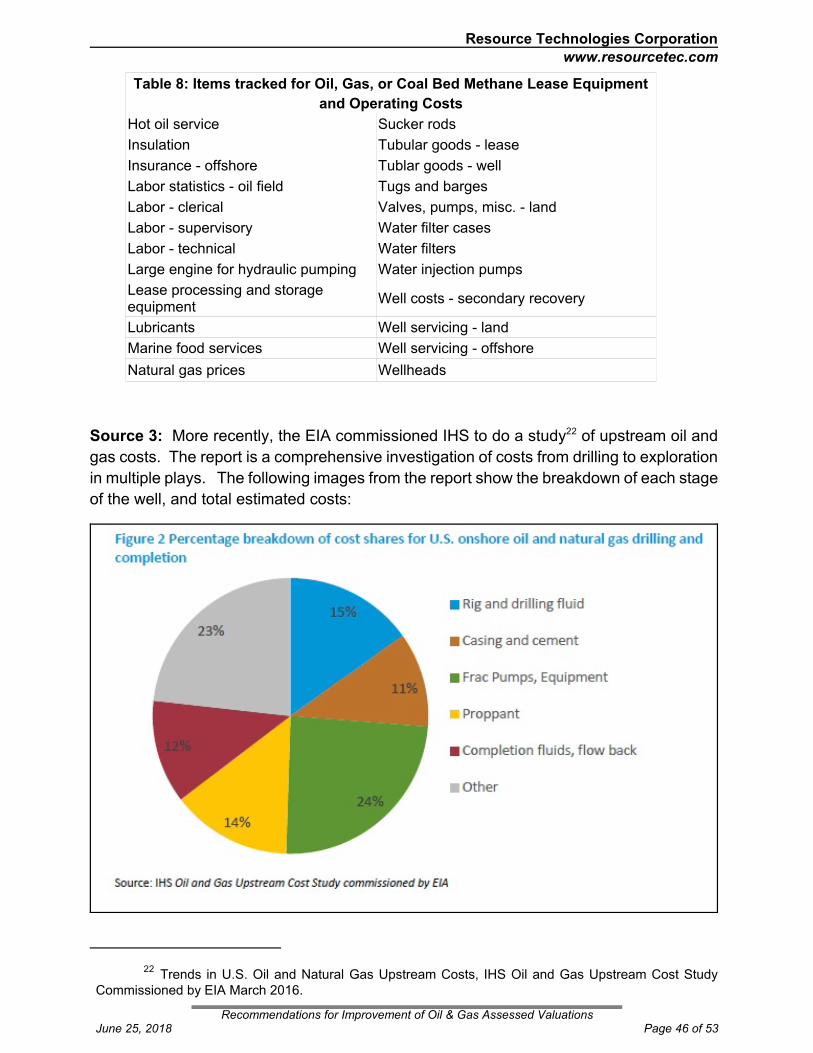
Resource Technologies Corporation www.resourcetec.com
Table 8: Items tracked for Oil, Gas, or Coal Bed Methane Lease Equipment
and Operating Costs
Hot oil service Sucker rods
Insulation Tubular goods - lease
Insurance - offshore Tublar goods - well
Labor statistics - oil field Tugs and barges
Labor - clerical Valves, pumps, misc. - land
Labor - supervisory Water filter cases
Labor - technical Water filters
Large engine for hydraulic pumping Water injection pumps
Lease processing and storageequipment
Well costs - secondary recovery
Lubricants Well servicing - land
Marine food services Well servicing - offshore
Natural gas prices Wellheads
Source 3: More recently, the EIA commissioned IHS to do a study22 of upstream oil and
gas costs. The report is a comprehensive investigation of costs from drilling to exploration
in multiple plays. The following images from the report show the breakdown of each stage
of the well, and total estimated costs:
22 Trends in U.S. Oil and Natural Gas Upstream Costs, IHS Oil and Gas Upstream Cost StudyCommissioned by EIA March 2016.
Recommendations for Improvement of Oil & Gas Assessed ValuationsJune 25, 2018 Page 46 of 53
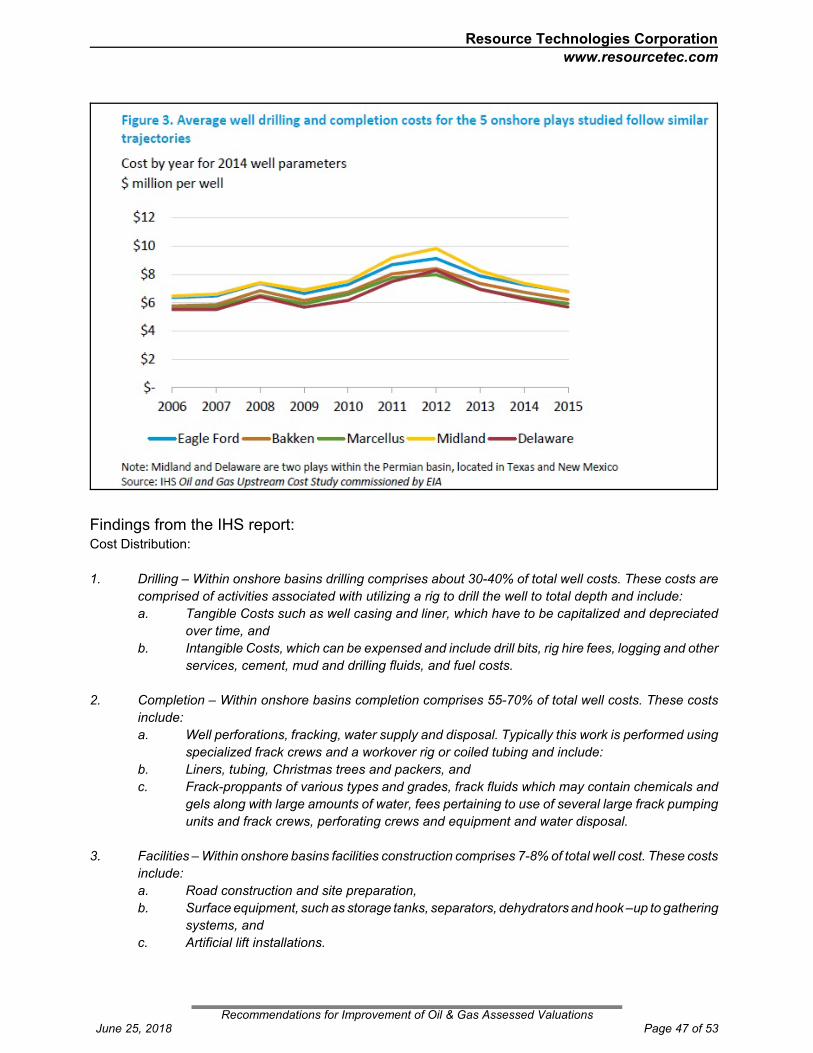
Resource Technologies Corporation www.resourcetec.com
Findings from the IHS report:Cost Distribution:
1. Drilling – Within onshore basins drilling comprises about 30-40% of total well costs. These costs are
comprised of activities associated with utilizing a rig to drill the well to total depth and include:
a. Tangible Costs such as well casing and liner, which have to be capitalized and depreciated
over time, and
b. Intangible Costs, which can be expensed and include drill bits, rig hire fees, logging and other
services, cement, mud and drilling fluids, and fuel costs.
2. Completion – Within onshore basins completion comprises 55-70% of total well costs. These costs
include:
a. Well perforations, fracking, water supply and disposal. Typically this work is performed using
specialized frack crews and a workover rig or coiled tubing and include:
b. Liners, tubing, Christmas trees and packers, and
c. Frack-proppants of various types and grades, frack fluids which may contain chemicals and
gels along with large amounts of water, fees pertaining to use of several large frack pumping
units and frack crews, perforating crews and equipment and water disposal.
3. Facilities – Within onshore basins facilities construction comprises 7-8% of total well cost. These costs
include:
a. Road construction and site preparation,
b. Surface equipment, such as storage tanks, separators, dehydrators and hook –up to gathering
systems, and
c. Artificial lift installations.
Recommendations for Improvement of Oil & Gas Assessed ValuationsJune 25, 2018 Page 47 of 53
Resource Technologies Corporation www.resourcetec.com
4. Operation – These comprise primarily the lease operating expenses. Costs can be highly variable,
depending on product, location, well size and well productivity. Typically, these costs include:
a. Fixed lease costs including artificial lift, well maintenance and minor workover activities. These
accrue over time, but are generally reported on a $/boe basis.
b. Variable operating costs to deliver oil and natural gas products to a purchase point or pricing
hub. Because the facilities for these services are owned by third party
c. midstream companies, the upstream producer generally pays a fee based on the volume of
oil or natural gas. These costs are measured by $/Mcf or MMbtu or $/bbl and include
gathering, processing, transport, and gas compression.
(1) Rig related costs are dependent on drilling efficiency, well depths, rig day rates, mud use and diesel
fuel rates. Rig day rates and diesel costs are related to larger market conditions and overall drilling
activity rather than well design. Rig related costs can range from $0.9 MM to $1.3 MM making up
12%to 19% of a well’s total cost.
(2) Casing costs are driven by the casing markets, often related to steel prices, the dimensions of the
well, and by the formations or pressures that affect the number of casing strings. Within a play, well
depths are often the most variable characteristic for casing with ranges of up to 5,000 feet. Operators
may also choose to run several casing strings to total depth or run a liner in lieu of the final casing
string. Casing costs can range from $0.6 MM to $1.2 MM, making up 9% to 15% of a well’s total cost.
(3) Frack pumping costs can be highly variable, but are dependent on horsepower needed and number
of frack stages. The amount of horsepower is determined by combining formation pressure, rock
hardness or brittleness and the maximum injection rate. Pumping pressure (which includes a safety
factor) must be higher than the formation pressure to fracture the rock. Higher pressure increases the
cost. The number of stages, which often correlates with lateral length, is important since this fracturing
process, with its associated horsepower and costs, must be repeated for each stage. These total costs
(for all stages) can range from $1.0 MM to $2.0 MM, making up 14% to 41% of a well’s total cost.
(4) Completion fluid costs are driven by water amounts, chemicals used and frack fluid type (such as
gel, cross-linked gel or slick water). The selection of fracking fluid type is mostly determined by play
production type, with oil plays primarily using gel and natural gas plays primarily using slick water.
Water sourcing costs are a function of regional conditions relating to surface access, aquifer resources
and climate conditions. Water disposal will normally be done by re-injection, evaporation from disposal
tanks, recycling or removal by truck or pipeline, each with an associated cost. Typically about 20-30
percent of the fluids flow back from the frack and require disposal. Operators typically include the first
30-60 days of flow back disposal in their capital costs. These costs can range from $0.3 MM to $1.2
MM making up 5% to 19% of well’s total cost.
(5) Proppant costs are determined by market rates for proppant, the relative mix of natural, coated and
artificial proppant and the total amount of proppant. Proppant transport from the sand mine or factory
to the well site and staging make up a large portion of the total proppant costs. Operators use more
proppant when selecting less costly proppant mixes, which are comprised of mostly natural sand as
opposed to artificial proppants. A higher mix of artificial proppants has often been used for very deep
wells experiencing high formation pressures. Overall the amount of proppant used per well is
increasing in every play. These costs can range from $0.8 MM to $1.8 MM making up to 6% to 25%
of the well’s total.
This report estimates costs at every stage of the well. The equipment that stays
onsite to maintain production is installed among the different stages, and is shown as
“tangible” costs. Assuming a typical well in an unconventional gas well now costs $6 million
Recommendations for Improvement of Oil & Gas Assessed ValuationsJune 25, 2018 Page 48 of 53
Resource Technologies Corporation www.resourcetec.com
to drill and complete, at least 1/6 of those costs are easily distributed to the tangible costs.
Again, oil and gas operators are required to report personally property at the will site.
The above research is intended to give an idea of the values placed in well pads. In the
absence of operator reported data, we suggest assigning a value of at least $1,000,000 per
pad which contain horizontal wells, and $250,000 for conventional vertical wells.
Recommendations for Improvement of Oil & Gas Assessed ValuationsJune 25, 2018 Page 49 of 53
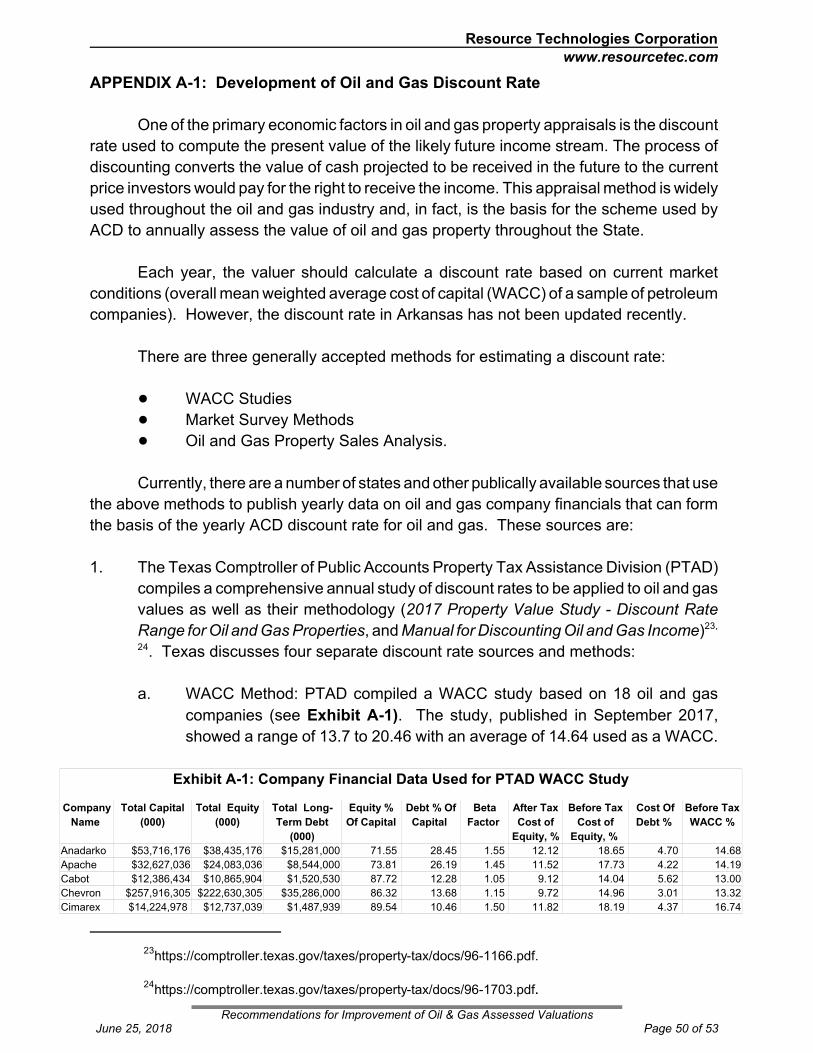
Resource Technologies Corporation www.resourcetec.com
APPENDIX A-1: Development of Oil and Gas Discount Rate
One of the primary economic factors in oil and gas property appraisals is the discount
rate used to compute the present value of the likely future income stream. The process of
discounting converts the value of cash projected to be received in the future to the current
price investors would pay for the right to receive the income. This appraisal method is widely
used throughout the oil and gas industry and, in fact, is the basis for the scheme used by
ACD to annually assess the value of oil and gas property throughout the State.
Each year, the valuer should calculate a discount rate based on current market
conditions (overall mean weighted average cost of capital (WACC) of a sample of petroleum
companies). However, the discount rate in Arkansas has not been updated recently.
There are three generally accepted methods for estimating a discount rate:
! WACC Studies
! Market Survey Methods
! Oil and Gas Property Sales Analysis.
Currently, there are a number of states and other publically available sources that use
the above methods to publish yearly data on oil and gas company financials that can form
the basis of the yearly ACD discount rate for oil and gas. These sources are:
1. The Texas Comptroller of Public Accounts Property Tax Assistance Division (PTAD)
compiles a comprehensive annual study of discount rates to be applied to oil and gas
values as well as their methodology (2017 Property Value Study - Discount Rate
Range for Oil and Gas Properties, and Manual for Discounting Oil and Gas Income)23,
24. Texas discusses four separate discount rate sources and methods:
a. WACC Method: PTAD compiled a WACC study based on 18 oil and gas
companies (see Exhibit A-1). The study, published in September 2017,
showed a range of 13.7 to 20.46 with an average of 14.64 used as a WACC.
Exhibit A-1: Company Financial Data Used for PTAD WACC Study
Company
Name
Total Capital
(000)
Total Equity
(000)
Total Long-
Term Debt
(000)
Equity %
Of Capital
Debt % Of
Capital
Beta
Factor
After Tax
Cost of
Equity, %
Before Tax
Cost of
Equity, %
Cost Of
Debt %
Before Tax
WACC %
Anadarko $53,716,176 $38,435,176 $15,281,000 71.55 28.45 1.55 12.12 18.65 4.70 14.68
Apache $32,627,036 $24,083,036 $8,544,000 73.81 26.19 1.45 11.52 17.73 4.22 14.19
Cabot $12,386,434 $10,865,904 $1,520,530 87.72 12.28 1.05 9.12 14.04 5.62 13.00
Chevron $257,916,305 $222,630,305 $35,286,000 86.32 13.68 1.15 9.72 14.96 3.01 13.32
Cimarex $14,224,978 $12,737,039 $1,487,939 89.54 10.46 1.50 11.82 18.19 4.37 16.74
23https://comptroller.texas.gov/taxes/property-tax/docs/96-1166.pdf.
24https://comptroller.texas.gov/taxes/property-tax/docs/96-1703.pdf.
Recommendations for Improvement of Oil & Gas Assessed ValuationsJune 25, 2018 Page 50 of 53
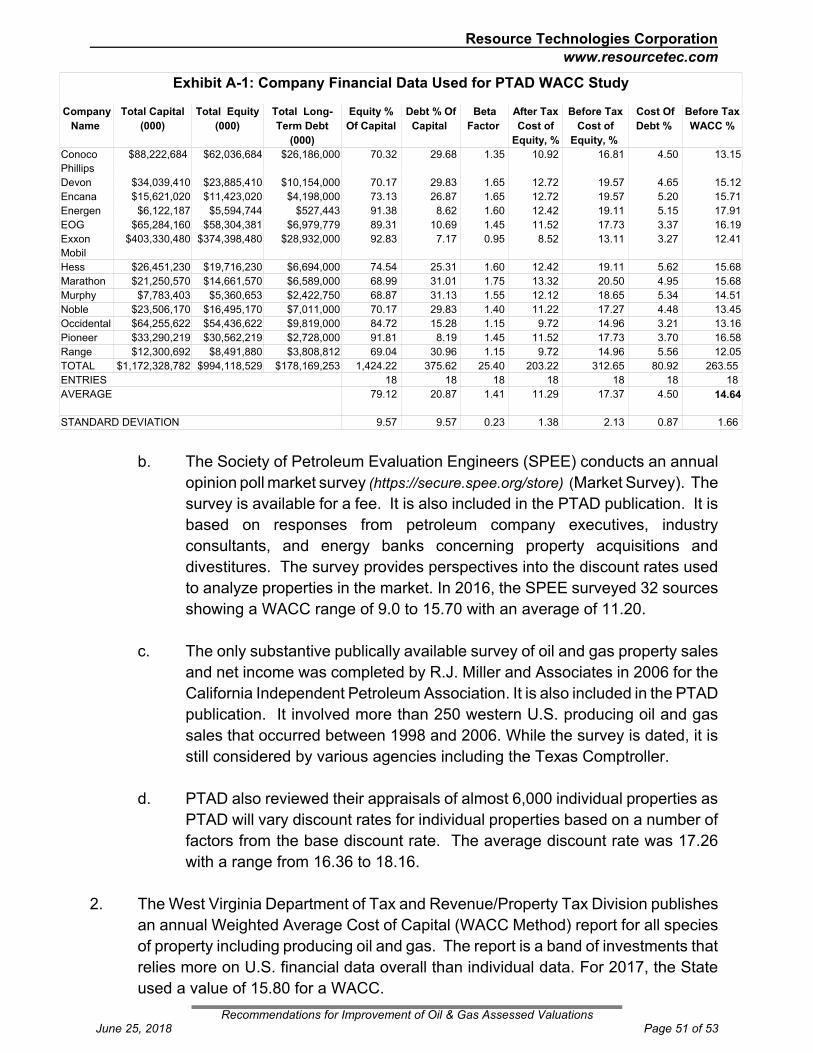
Resource Technologies Corporation www.resourcetec.com
Exhibit A-1: Company Financial Data Used for PTAD WACC Study
Company
Name
Total Capital
(000)
Total Equity
(000)
Total Long-
Term Debt
(000)
Equity %
Of Capital
Debt % Of
Capital
Beta
Factor
After Tax
Cost of
Equity, %
Before Tax
Cost of
Equity, %
Cost Of
Debt %
Before Tax
WACC %
Conoco
Phillips
$88,222,684 $62,036,684 $26,186,000 70.32 29.68 1.35 10.92 16.81 4.50 13.15
Devon $34,039,410 $23,885,410 $10,154,000 70.17 29.83 1.65 12.72 19.57 4.65 15.12
Encana $15,621,020 $11,423,020 $4,198,000 73.13 26.87 1.65 12.72 19.57 5.20 15.71
Energen $6,122,187 $5,594,744 $527,443 91.38 8.62 1.60 12.42 19.11 5.15 17.91
EOG $65,284,160 $58,304,381 $6,979,779 89.31 10.69 1.45 11.52 17.73 3.37 16.19
Exxon
Mobil
$403,330,480 $374,398,480 $28,932,000 92.83 7.17 0.95 8.52 13.11 3.27 12.41
Hess $26,451,230 $19,716,230 $6,694,000 74.54 25.31 1.60 12.42 19.11 5.62 15.68
Marathon $21,250,570 $14,661,570 $6,589,000 68.99 31.01 1.75 13.32 20.50 4.95 15.68
Murphy $7,783,403 $5,360,653 $2,422,750 68.87 31.13 1.55 12.12 18.65 5.34 14.51
Noble $23,506,170 $16,495,170 $7,011,000 70.17 29.83 1.40 11.22 17.27 4.48 13.45
Occidental $64,255,622 $54,436,622 $9,819,000 84.72 15.28 1.15 9.72 14.96 3.21 13.16
Pioneer $33,290,219 $30,562,219 $2,728,000 91.81 8.19 1.45 11.52 17.73 3.70 16.58
Range $12,300,692 $8,491,880 $3,808,812 69.04 30.96 1.15 9.72 14.96 5.56 12.05
TOTAL $1,172,328,782 $994,118,529 $178,169,253 1,424.22 375.62 25.40 203.22 312.65 80.92 263.55
ENTRIES 18 18 18 18 18 18 18
AVERAGE 79.12 20.87 1.41 11.29 17.37 4.50 14.64
STANDARD DEVIATION 9.57 9.57 0.23 1.38 2.13 0.87 1.66
b. The Society of Petroleum Evaluation Engineers (SPEE) conducts an annual
opinion poll market survey (https://secure.spee.org/store) (Market Survey). The
survey is available for a fee. It is also included in the PTAD publication. It is
based on responses from petroleum company executives, industry
consultants, and energy banks concerning property acquisitions and
divestitures. The survey provides perspectives into the discount rates used
to analyze properties in the market. In 2016, the SPEE surveyed 32 sources
showing a WACC range of 9.0 to 15.70 with an average of 11.20.
c. The only substantive publically available survey of oil and gas property sales
and net income was completed by R.J. Miller and Associates in 2006 for the
California Independent Petroleum Association. It is also included in the PTAD
publication. It involved more than 250 western U.S. producing oil and gas
sales that occurred between 1998 and 2006. While the survey is dated, it is
still considered by various agencies including the Texas Comptroller.
d. PTAD also reviewed their appraisals of almost 6,000 individual properties as
PTAD will vary discount rates for individual properties based on a number of
factors from the base discount rate. The average discount rate was 17.26
with a range from 16.36 to 18.16.
2. The West Virginia Department of Tax and Revenue/Property Tax Division publishes
an annual Weighted Average Cost of Capital (WACC Method) report for all species
of property including producing oil and gas. The report is a band of investments that
relies more on U.S. financial data overall than individual data. For 2017, the State
used a value of 15.80 for a WACC.
Recommendations for Improvement of Oil & Gas Assessed ValuationsJune 25, 2018 Page 51 of 53
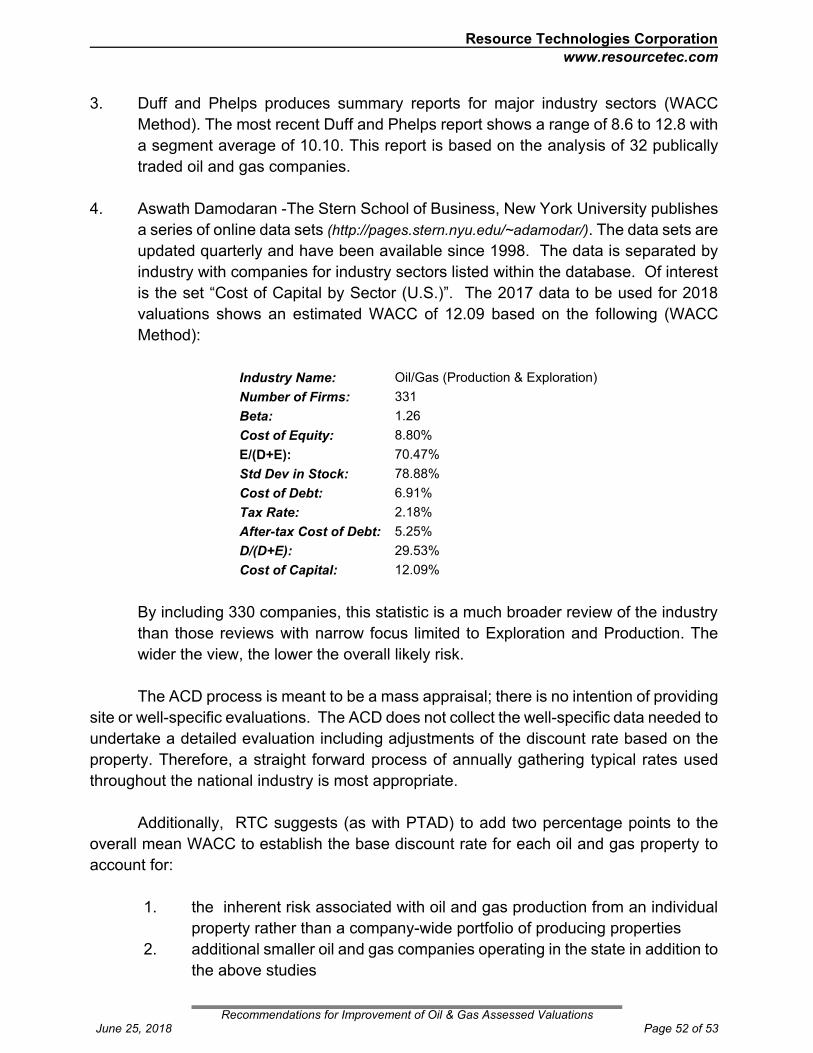
Resource Technologies Corporation www.resourcetec.com
3. Duff and Phelps produces summary reports for major industry sectors (WACC
Method). The most recent Duff and Phelps report shows a range of 8.6 to 12.8 with
a segment average of 10.10. This report is based on the analysis of 32 publically
traded oil and gas companies.
4. Aswath Damodaran -The Stern School of Business, New York University publishes
a series of online data sets (http://pages.stern.nyu.edu/~adamodar/). The data sets are
updated quarterly and have been available since 1998. The data is separated by
industry with companies for industry sectors listed within the database. Of interest
is the set “Cost of Capital by Sector (U.S.)”. The 2017 data to be used for 2018
valuations shows an estimated WACC of 12.09 based on the following (WACC
Method):
Industry Name: Oil/Gas (Production & Exploration)
Number of Firms: 331
Beta: 1.26
Cost of Equity: 8.80%
E/(D+E): 70.47%
Std Dev in Stock: 78.88%
Cost of Debt: 6.91%
Tax Rate: 2.18%
After-tax Cost of Debt: 5.25%
D/(D+E): 29.53%
Cost of Capital: 12.09%
By including 330 companies, this statistic is a much broader review of the industry
than those reviews with narrow focus limited to Exploration and Production. The
wider the view, the lower the overall likely risk.
The ACD process is meant to be a mass appraisal; there is no intention of providing
site or well-specific evaluations. The ACD does not collect the well-specific data needed to
undertake a detailed evaluation including adjustments of the discount rate based on the
property. Therefore, a straight forward process of annually gathering typical rates used
throughout the national industry is most appropriate.
Additionally, RTC suggests (as with PTAD) to add two percentage points to the
overall mean WACC to establish the base discount rate for each oil and gas property to
account for:
1. the inherent risk associated with oil and gas production from an individual
property rather than a company-wide portfolio of producing properties
2. additional smaller oil and gas companies operating in the state in addition to
the above studies
Recommendations for Improvement of Oil & Gas Assessed ValuationsJune 25, 2018 Page 52 of 53
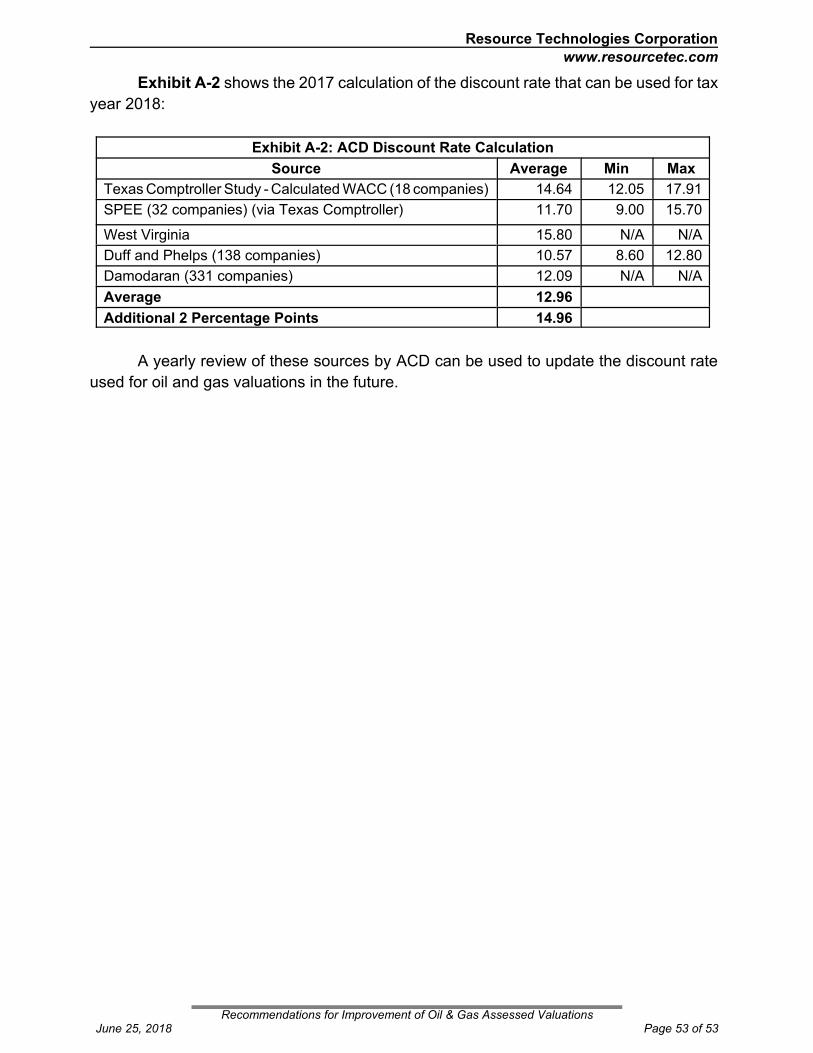
Resource Technologies Corporation www.resourcetec.com
Exhibit A-2 shows the 2017 calculation of the discount rate that can be used for tax
year 2018:
Exhibit A-2: ACD Discount Rate Calculation
Source Average Min Max
Texas Comptroller Study - Calculated WACC (18 companies) 14.64 12.05 17.91
SPEE (32 companies) (via Texas Comptroller) 11.70 9.00 15.70
West Virginia 15.80 N/A N/A
Duff and Phelps (138 companies) 10.57 8.60 12.80
Damodaran (331 companies) 12.09 N/A N/A
Average 12.96
Additional 2 Percentage Points 14.96
A yearly review of these sources by ACD can be used to update the discount rate
used for oil and gas valuations in the future.
Recommendations for Improvement of Oil & Gas Assessed ValuationsJune 25, 2018 Page 53 of 53