beans quality inspection using correlation-based granulometry · 1 beans quality inspection using...
TRANSCRIPT

1
Beans Quality Inspection Using Correlation-Based Granulometry
Sidnei Alves de Araújo1,2*, Jorge Henrique Pessota2 and Hae Yong Kim1
1Escola Politécnica, Universidade de São Paulo,
Av. Prof. Luciano Gualberto, tr. 3, 158, 05508-010, São Paulo, SP, Brazil.
2 Industrial Engineering Post-Graduation Program, Universidade Nove de Julho,
Av. Francisco Matarazzo, 612, Água Branca, 05001-100, São Paulo, SP, Brazil.
E-mails: [email protected], [email protected], [email protected]
*Corresponding author
Abstract
Bean constitutes, with rice, the staple diet of the Brazilian people. The quality control of
beans includes computing the percentages of different varieties present in a batch of beans.
The selling price of the batch depends on these percentages. In this work, we propose a
computer system for visual inspection of beans. We use “correlation-based multi-shape
granulometry” for the first time to spatially localize each grain in the image, together with
its size, eccentricity and rotation angle. Using this technique, our system localized correct-
ly 29,993 grains out of 30,000, even in images where many grains were “glued” together.
This is the main contribution of our work, because usually other systems fail to individual-
ize “glued” grains. Probably, the same technique can be used in many other agricultural
product inspection systems to segment seeds and grains. After segmenting the grains, the
system classifies each grain as one of the three most consumed varieties in Brazil, using a
technique based on k-means and k-NN algorithms. This module classified correctly 29,956
grains out of 29,993. These extremely high success rates indicate that proposed system can
actually be applied in automated inspection of beans.
Keywords: Beans, Granulometry, Classification, Visual Inspection, Computer Vision,
Pattern Recognition.

2
1. Introduction
1.1 Automated agricultural products inspection
The use of automated systems for inspection of agricultural products has increased
in recent decades. In the literature, there are many computational tools to control the quali-
ty of food and agricultural products. We can cite the quality inspection of fruits and vege-
tables (Blasco et al. 2009a, 2009b; Savakar and Anami, 2009; Mendoza and Aguilera,
2010; Liu et al., 2011; Savakar, 2012; Rodríguez-Pulido et al., 2013); analysis and classifi-
cation of seeds and grains (Kiliç et al., 2007; Venora et al., 2007; Carrillo and Peñaloza,
2009; Savakar and Anami, 2009; Venora et al., 2009; Aggarwal and Mohan, 2010; Anami
and Savakar, 2010; Laurent et al., 2010; Razavi et al., 2010; Patil et al., 2011; Gómez-
Sanchis et al., 2012, Stegmayer et al., 2013) and inspection of products of animal origin
(Ticay-Rivas et al., 2013; Saraswat and Arya, 2013).
Despite the increasing importance of automated processes, the usual method for
quality inspection of food and agricultural products continues to be the human inspection.
Manual inspection is a time-consuming and high-cost task. It is very difficult to standard-
ize the manual inspection (Kiliç et al., 2007). Moreover, the human detection capabilities
can be affected by environment and personal factors (Pesante-Santana and Woldstad, 2000;
Patil et al., 2011).
1.2 Bean inspection in Brazil
Bean is a legume rich in protein and energy. It constitutes, with rice, the staple diet
of the Brazilian people. The quality control of this product in Brazil follows a set of stand-
ards and procedures of the Brazilian Ministry of Agriculture, Livestock and Supply
(BMALS, 2011).
3
We describe briefly this procedure. A sample of 250g of a batch of beans is sepa-
rated for moisture analysis and another sample of 250g is separated for computing the
weight percentage of foreign matters, impurities and dead insects. The quality inspection
also looks for defective grains in the sample, such as broken, moldy, burned, crushed,
damaged by insects (chopped), sprouted, wrinkled, stained, discolored and damaged by
various other causes. The beans of groups I and II (the most consumed by the Brazilian
people) can have three ratings numbered 1 to 3, according to the quantities of defects.
The quality control also computes the percentage of grains of different groups,
classes and subclasses present in the sample. The group refers to the botanical species. In
Brazil, there are two major groups: Group I comprises the specie Phaseolus vulgaris and
Group II the specie Vigna unguiculata. In this work, we will deal only with the Group
I,that comprises the most consumed beans in Brazil.
A Group is subdivided into classes and subclasses according to the skin color of the
grains. Group I is subdivided into classes White, Black and Colored. The class White is
further subdivided into subclasses such as Brancão, Branca, Fradinho, etc. The class Col-
ored is further subdivided into subclasses such as Carioca, Mulatto, Canapu, Corujinha,
Azulão, Manteiga, Verde, Vinagre, etc.
In Group I, a batch of beans must contain no more than 3% of grains of non-
predominant class and no more than 10% of grains of non-predominant subclass. For ex-
ample, for a batch of beans to be labeled as Black, it must contain no more than 3% of
White or Colored grains. For a batch of beans to be labeled Carioca, it must contain no
more than 3% of White or Black grains, but it can contain up to 10% of Mulatto grains,
because Carioca and Mulatto are two subclasses of the same Colored class.
4
The classification of grains is so important that several institutions in Brazil offer
courses for grain classifiers, with a specific module for beans. For example, the link below
points to the announcement of a course for classifiers, offered by a university together with
the ministry of education1. Consequently, a computer vision system that counts automati-
cally the number of grains of different classes and subclasses is a very useful tool in prac-
tice.
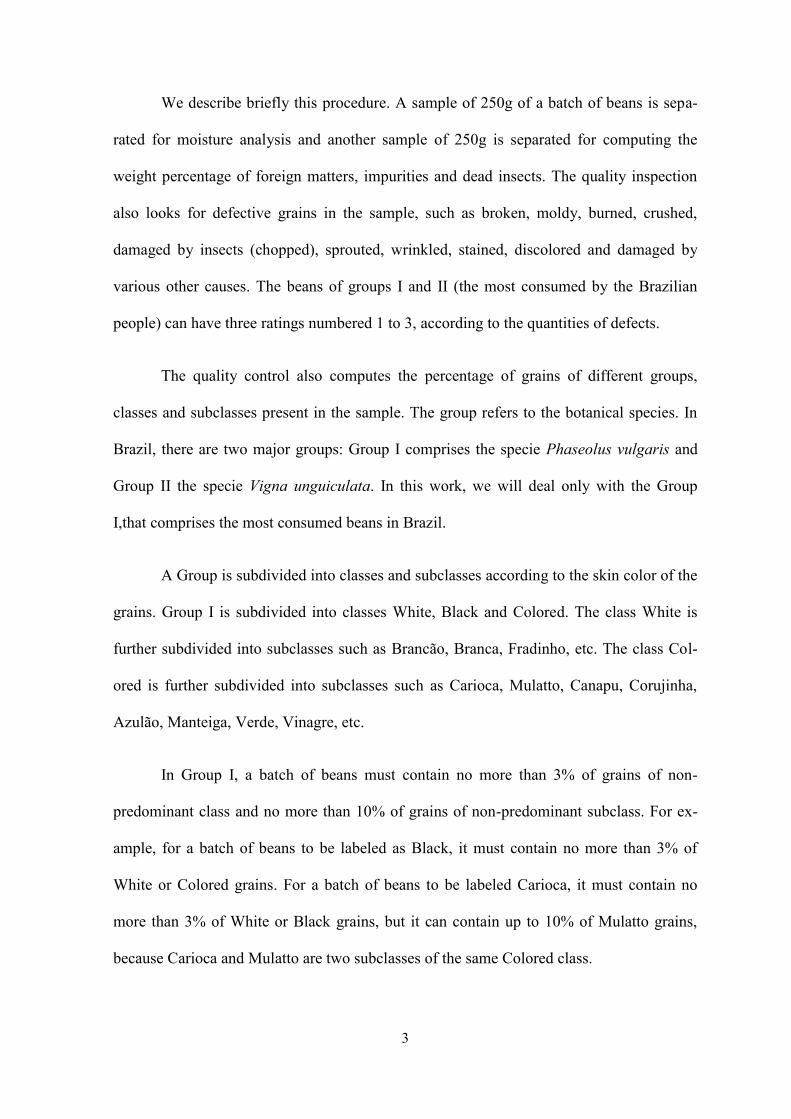
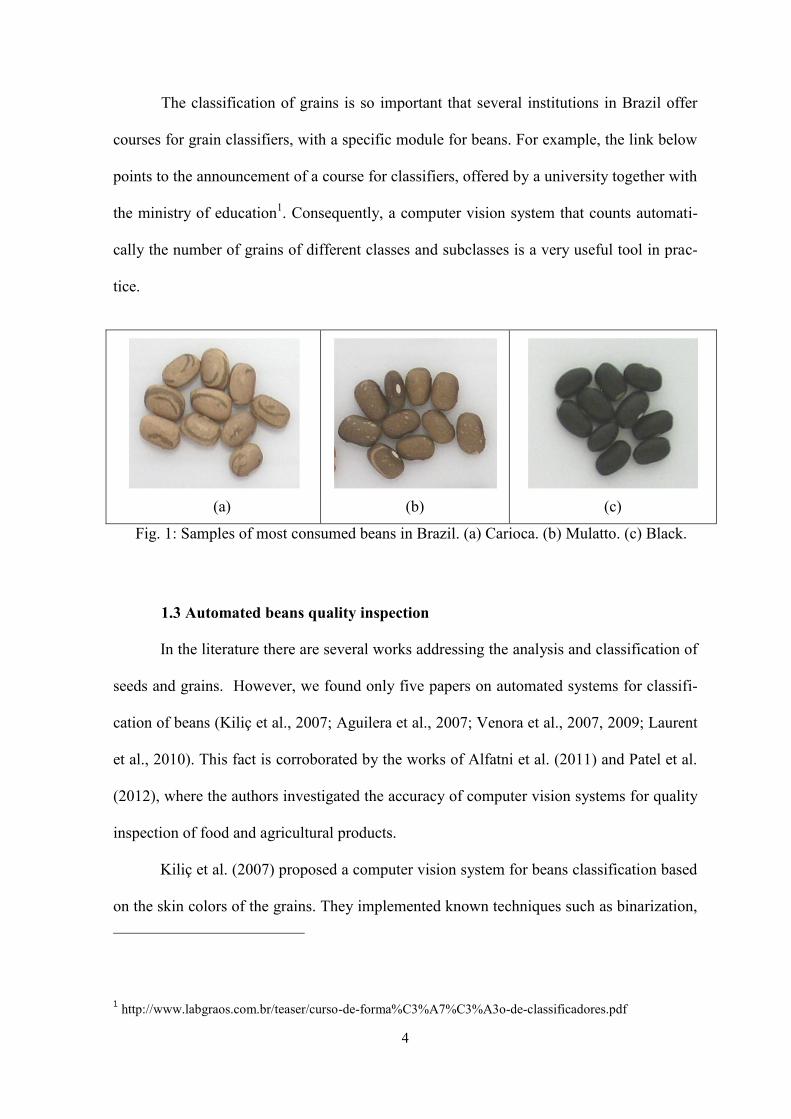
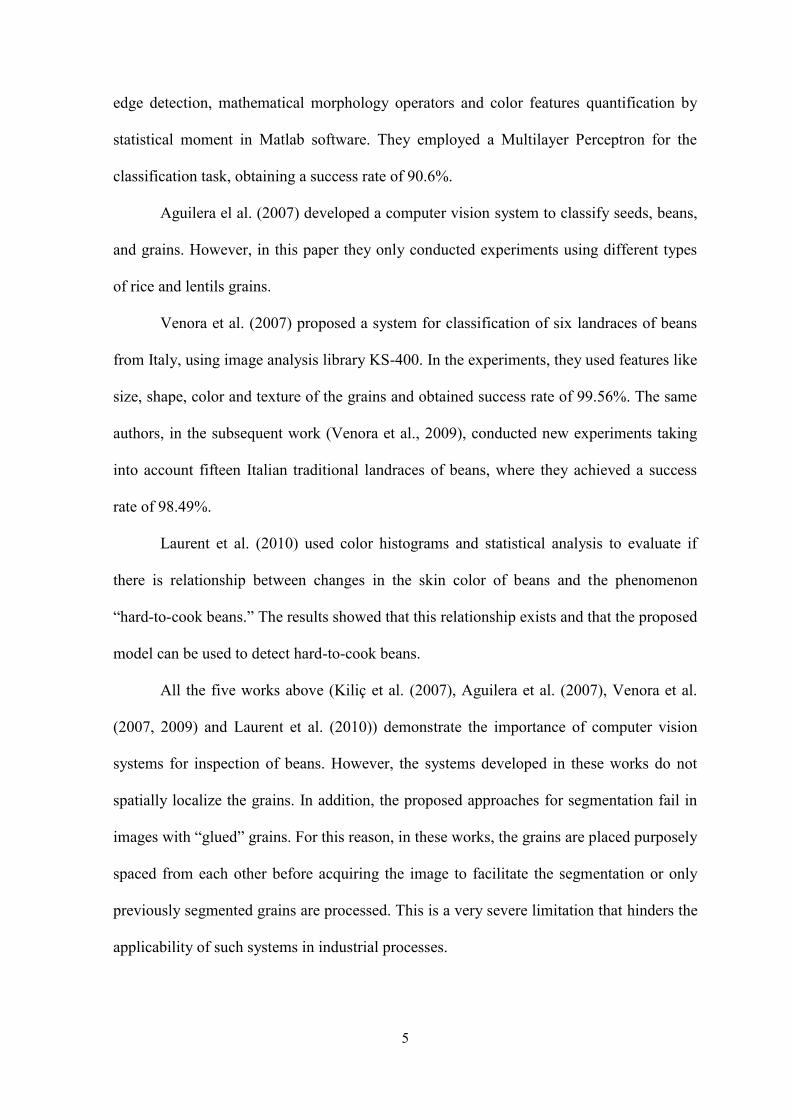
(a) (b) (c)
Fig. 1: Samples of most consumed beans in Brazil. (a) Carioca. (b) Mulatto. (c) Black.
1.3 Automated beans quality inspection
In the literature there are several works addressing the analysis and classification of
seeds and grains. However, we found only five papers on automated systems for classifi-
cation of beans (Kiliç et al., 2007; Aguilera et al., 2007; Venora et al., 2007, 2009; Laurent
et al., 2010). This fact is corroborated by the works of Alfatni et al. (2011) and Patel et al.
(2012), where the authors investigated the accuracy of computer vision systems for quality
inspection of food and agricultural products.
Kiliç et al. (2007) proposed a computer vision system for beans classification based
on the skin colors of the grains. They implemented known techniques such as binarization,
1 http://www.labgraos.com.br/teaser/curso-de-forma%C3%A7%C3%A3o-de-classificadores.pdf
5
edge detection, mathematical morphology operators and color features quantification by
statistical moment in Matlab software. They employed a Multilayer Perceptron for the
classification task, obtaining a success rate of 90.6%.
Aguilera el al. (2007) developed a computer vision system to classify seeds, beans,
and grains. However, in this paper they only conducted experiments using different types
of rice and lentils grains.
Venora et al. (2007) proposed a system for classification of six landraces of beans
from Italy, using image analysis library KS-400. In the experiments, they used features like
size, shape, color and texture of the grains and obtained success rate of 99.56%. The same
authors, in the subsequent work (Venora et al., 2009), conducted new experiments taking
into account fifteen Italian traditional landraces of beans, where they achieved a success
rate of 98.49%.
Laurent et al. (2010) used color histograms and statistical analysis to evaluate if
there is relationship between changes in the skin color of beans and the phenomenon
“hard-to-cook beans.” The results showed that this relationship exists and that the proposed
model can be used to detect hard-to-cook beans.
All the five works above (Kiliç et al. (2007), Aguilera et al. (2007), Venora et al.
(2007, 2009) and Laurent et al. (2010)) demonstrate the importance of computer vision
systems for inspection of beans. However, the systems developed in these works do not
spatially localize the grains. In addition, the proposed approaches for segmentation fail in
images with “glued” grains. For this reason, in these works, the grains are placed purposely
spaced from each other before acquiring the image to facilitate the segmentation or only
previously segmented grains are processed. This is a very severe limitation that hinders the
applicability of such systems in industrial processes.

6
1.4 The problem and main contributions
In this work, we propose a computer vision system that spatially localizes each
bean grain and classifies it as Carioca, Mulatto or Black (Fig. 1). This is a practical prob-
lem, because Carioca is the most consumed bean variety in Brazil, dominating 70% of
market share. The Black accounts for 20% of market share and all other varieties together
totalize 10% (Souza et al., 2013). Moreover, Black and Mulatto are the two non-
predominant grains most commonly found in batches of Carioca beans. As we said above,
a batch of beans only can be labeled as Carioca if it contains no more than 3% of Black
grains and 10% of Mulatto grains.
(a)
(b)
(c)
(d)
Fig. 2: The three modules of our computer vision system working in “sampling mode”. (a)
The acquired image. (b) Pixel color mapping to black (foreground) or white (background).
(c) Grain segmentation (correlation-based granulometry). (d) Grain classification.

7
The image acquisition system makes use of an input box that distributes spatially
and temporally the grains over a conveyor belt, a lamp with acrylic plate to illuminate uni-
formly the beans and a webcam. After the acquisition, a computer vision system processes
the acquired image (Fig. 2a). This system is composed of three modules. In the first mod-
ule, the image pixels are mapped to black (foreground), white (background) or different
shades of gray depending on the color of the pixel (Fig. 2b). In the second module, each
grain is segmented and spatially localized (Fig. 2c), using the correlation-based multi-
shape granulometry proposed by Kim et al. (2013). In the third step, each grain is classified
as Carioca, Mulatto or Black (Fig. 2d).
In our opinion, each of the three modules contains some scientific contribution.
However, we think that the main contribution of this paper lies in the second module where
we use correlation-based granulometry to single out each bean grains. This technique spa-
tially localizes each grain, together with its size, eccentricity and rotation angle, even if
some grains are glued together (Figs. 2b and 2c), overcoming the shortcoming of other
systems aimed at analyzing and classifying seeds and grains. We think that this technique
can be used in many other agricultural product inspection systems for segmenting seeds
and grains.
Once the grains are precisely localized, many features can be extracted in order to
classify them. In this work, we extract features only to classify the grains in three sub-
classes: Carioca, Mulatto and Black. As future works, we think that it is possible to auto-
matically detect many beans defects (broken, moldy, burned, crushed, chopped, sprouted,
wrinkled, stained, discolored, etc.), extracting other features.

8
2. Image Acquisition System
We built a low-cost prototype composed of a grain input box, a conveyor belt and
an image acquisition chamber, as showed in the schematic design (Fig. 3). The beans are
loaded in the input box, which spreads the grains in time and space. The dimensions of the
conveyor belt are 150cm x 25cm. The image acquisition chamber is covered by light-tight
paper to eliminate the influence of the external light. It contains a circular fluorescent lamp
with translucent acrylic plate for illuminating uniformly the beans and a Microsoft
LifeCam HD-5000 for acquiring the images. The velocity of the conveyor belt, the camera
and the lamp are controlled by the computer.
Fig. 3: Schematic design of the apparatus used in experiments: (1) table to support the
components; (2) step motor; (3) table to support the conveyor belt; (4) rollers; (5) support
bearings; (6) conveyor belt; (7) input box; (8) image acquisition chamber; (9) circular fluo-
rescent lamp; (10) camera.
Although the power consumption of the circular fluorescent lamp is low (15W), we
can eliminate it to save energy, using only the ambient light where the prototype is located,
and then enhance the acquired image using an appropriate techniques (e.g., Singh et al.
2014; Huang et al., 2013; Cheng et al., 2013; Ding et al., 2014.). However, this could cause

9
the loss of some details in the acquired image (e.g. thin streaks present in the grains), de-
creasing the robustness of the grain classification module.
The prototype (Fig. 4) can operate in two modes: sampling mode or continuous
mode. In both cases, the speed of the conveyor belt was approximately 0.02 m/s.
In the sampling mode, a small quantity of beans (for example, 100 grains) is placed
in the input box. In this mode, the exact quantities of each variety of beans are known be-
cause they were previously counted, making it possible to determine precisely the error
rate. The grains fall automatically from the input box on the conveyor belt, distributing
them in space and time. The conveyor belt transports the grains to the image acquisition
chamber where the image is acquired. The computer automatically determines the best
moment to take the photo.
Fig. 4: The apparatus used in the experiments and the interface of the proposed computer
vision system.

10
In continuous mode, the user can load up to 1kg of beans in the input box. The
grains automatically and continuously fall from the input box on the conveyor belt. The
conveyor belt transports the grains to the image acquisition chamber. The belt stops auto-
matically at the scheduled times for the image acquisition. In this mode, it is not possible to
determine the precise error rate of the system, because some grains are missed between
two consecutive photos. We prepared mixtures of beans with known proportions of each
grain variety. Our system determined experimentally these proportions in continuous
mode.
3. Computer Vision System
We propose a computer vision system to analyze batches of beans. It is composed
of three modules: pixel color mapping, grain segmentation and grain classification. We
describe each of them in details in following subsections.
3.1 Pixel color mapping
To facilitate the understanding of this module, we describe it twice: first we provide
a very simplified overview and then we describe it in details.
Simplified overview: The purpose of this module is to map each pixel of the ac-
quired image (Fig. 2a) to black (beans) or white (background, Fig. 2b). To do it, we use
supervised learning. We take some pixels of the beans (positive training data) and some
pixels of the background (negative training data). Then, given a pixel c to classify, we
search for the most similar color in the training set. We assign the pixel c to the class of the
pixel with the most similar color, that is, we use the nearest neighbor learning (1-NN).

11
Detailed description: The purpose of this module is to map each pixel of the ac-
quired image (Fig. 2a) to black if the pixel color is a typical color of beans (foreground),
and to white if the pixel color is a typical background color (Fig. 2b). When the system
cannot decide whether the pixel color is foreground or background, it maps the unknown
pixel to different shades of gray according to similarities to known foreground or back-
ground colors. This module prepares the acquired image for the grain segmentation in the
next module.
First, we extract manually from the sample images some background and bean col-
ors, assuring that almost all possible background colors as well as almost all colors of the
different varieties of the beans are well represented (Figs. 5a-5e). Let us denote the set of
all sample background colors as B and the set of all sample foreground colors as F. Let c
be the color of a pixel in the acquired image. Then, we use the following algorithm, based
on the k-nearest neighbor (k-NN) searching:
1) Find the sample background color bB most similar to c, that is,
),(),( cxdcbd , Bx , for some distance metric d defined in some color space. We use
the Euclidian distance in RGB space, because even this simple metric yields very low error
rates. Clearly, more sophisticated color difference metrics can also be used, such as the
Euclidean distance in the CIELAB space (Connolly and Fleiss, 1997).
2) Find the sample foreground color fB most similar to c, that is, ),(),( cxdcfd
, Fx .
3) Compute the output color s as the linear interpolation of the two distances
),(),(/),( cbdcfdcfds .
12
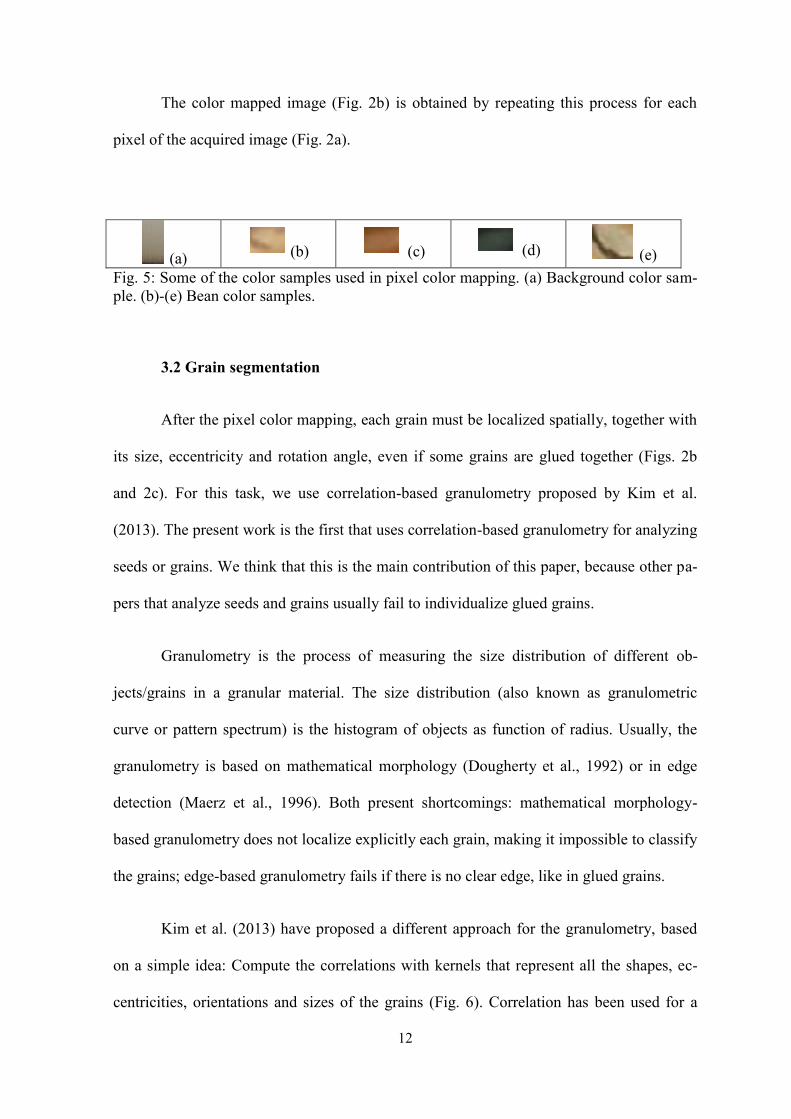
The color mapped image (Fig. 2b) is obtained by repeating this process for each
pixel of the acquired image (Fig. 2a).
(a) (b) (c) (d) (e)
Fig. 5: Some of the color samples used in pixel color mapping. (a) Background color sam-
ple. (b)-(e) Bean color samples.
3.2 Grain segmentation
After the pixel color mapping, each grain must be localized spatially, together with
its size, eccentricity and rotation angle, even if some grains are glued together (Figs. 2b
and 2c). For this task, we use correlation-based granulometry proposed by Kim et al.
(2013). The present work is the first that uses correlation-based granulometry for analyzing
seeds or grains. We think that this is the main contribution of this paper, because other pa-
pers that analyze seeds and grains usually fail to individualize glued grains.
Granulometry is the process of measuring the size distribution of different ob-
jects/grains in a granular material. The size distribution (also known as granulometric
curve or pattern spectrum) is the histogram of objects as function of radius. Usually, the
granulometry is based on mathematical morphology (Dougherty et al., 1992) or in edge
detection (Maerz et al., 1996). Both present shortcomings: mathematical morphology-
based granulometry does not localize explicitly each grain, making it impossible to classify
the grains; edge-based granulometry fails if there is no clear edge, like in glued grains.
Kim et al. (2013) have proposed a different approach for the granulometry, based
on a simple idea: Compute the correlations with kernels that represent all the shapes, ec-
centricities, orientations and sizes of the grains (Fig. 6). Correlation has been used for a

13
long time to find templates in images, in a process named template matching (Lewis,
1995). So, computing the correlations between the image and the kernels that represent all
possible shapes of beans corresponds to finding all these shapes in the image. The correla-
tion peaks represent the localizations of the grains. Unfortunately, this process detects
many false grains together with the true grains. To filter out the false detections, the peaks
with low correlation and peaks that have large intersections with other peaks are discarded.
We describe this process in more details below.
The discrete cross correlation between two real-valued images T and A is defined:
i j
jyixAjiTyxAyxTyxC ),(),(),(),(),( . (1)
In practice, images are defined only inside a rectangular domain. An image is considered to
be filled with zeros outside of its domain. It is well-known that cross correlation can be
efficiently computed using FFT (Fast Fourier Transform - see some textbook on image
processing for more details, for example, Gonzalez and Woods, 2002). In our case, we will
use cross correlation to find a (usually small) template image T inside a (usually large)
image to analyze A, an operation known as template matching, and this operation is accel-
erated using FFT.
Fig. 6 present the set of all n=162 kernels Ti used to localize the beans. We used el-
liptical kernels with three eccentricities, three scales, rotated in 18 angles. This set of ker-
nels contains all possible shapes of the beans. If you want (for example) find smaller
grains, smaller kernels should be included in the set. If you want to find (for example)
more elongated grains, kernels with higher eccentricity should be included in the set.

14
Fig. 6: Kernels used localize the grains.
In each kernel, the number of black pixels (with negative values) is nearly equal to
the number of white ones (with positive values). Gray pixels are zeros. Moreover, in each
kernel the sum of all negative pixels is -0.5 and the sum of all positive pixels is +0.5. As
the grayscales of the color mapped image A (Fig. 2b) ranges from 0 (black) to 1 (white),
the correlation image AT will range from -1 to +1. Let us denote the images resulting
from the cross correlation between the acquired image A and kernel Ti as Ci, that is:
niyxAyxTyxC ii 1),,(),(),( (5)
Let us define the pixelwise maximum of the correlation images as:
),(),(1
yxCMAXyxC i
n
i . (6)
A pixel (x, y) is a peak in C if it is greater than or equal to its eight spatial neighbor
pixels. Each peak ),( yxC possibly corresponds to a bean grain in A. The scale, eccentricity
and angle of the detected grain are given by the corresponding parameters of the kernel.
Unfortunately, this process detects many non-existing grains together with the real grains.
We filter out the false grains using two parameters chosen by the user:
The first parameter (0≤≤1) is the correlation threshold parameter. The peaks with
correlations lower than are discarded. In our initial experiment, we used =0.18.

15
The second parameter (0≤≤1) controls the allowed amount of intersection be-
tween the grains. If =0, the grains cannot intersect each other in the slightest. If =1, a
grain can lie completely inside another grain. In our application, we used =0.1, meaning
that up to 10% of the area of a bean can intersect another bean.
We initially chose the parameters and based on “common sense” and to mini-
mize errors in a small set of images. We then applied the segmentation using the chosen
parameters in the remaining images. The same procedure can be used to choose the appro-
priate parameters in a real application.
Our algorithm sorts and scans the correlation peaks in decreasing correlation order,
discarding a grain O1 with correlation c1 if there is some other grain O2 with correlation
12 cc that satisfies:
221 areaarea OOO (8)
Using this technique in the initial experiment with 100 images and 10,000 grains,
our system missed two grains, detected two grains as if they were a single grain, and de-
tected a nonexistent grain. Figure 7 depicts 3 out of these 4 errors.
If the grains are so glued together that the background becomes almost invisible
then our technique will fail to segment the grains. In this case, the color mapping module
will map almost all pixels to black. Clearly, it is impossible to segment an almost com-
pletely black image. However, the images depicted in this paper were obtained by an au-
tomated process, so it is possible to spread the grains mechanically as shown in our paper
or in an even more dispersed way.

16
(a)
(b)
Fig. 7: Our system missed two grains, detected two grains as if they were a single grain,
and detected a nonexistent grain, in the initial experiment searching for 10000 grains.
Three out of these four errors are depicted above.
3.3 Grain classification
After spatially localizing each grain, it must be classified as Carioca, Mulatto or
Black. We use as feature only the “predominant color” of each grain in the RGB color
space. Clearly, other features (as textures) can also be used. However, we did not test them
because even the chosen simple feature yielded the desired results. Our grain classification
module was designed only to classify the three varieties of beans according to the predom-
inant color. If the user wants to classify other types of grains, the proposed algorithm
should be appropriately adjusted.
Fig. 8a depicts a typical segmented Carioca bean. First, the outer pixels of the seg-
mented images are discarded, shrinking the elliptical kernel by 0.8, to assure that the seg-
mented bean does not contain any background color (Fig. 8b).
A segmented Black bean (Fig. 8c) can be easily recognized, because its predomi-
nant color is very different from the colors of Carioca or Mulatto beans. However, it is not
easy to distinguish a Carioca bean from a Mulatto bean. The predominant color of a Cario-

17
ca bean is beige but most Carioca grains have brown streaks (Fig. 8b). The dominant color
of a Mulatto bean is reddish brown (Fig 8d), but some grains may have streaks on beige.
The color of brown streaks of Carioca beans is very similar to the predominant color of
Mulatto bean and, sometimes, these streaks occupy a considerable area of the bean (Fig.
8e). Likewise, some parts of a Mulatto beans may have color very similar to the color of a
Carioca bean (Fig. 8f).
(a)
(b)
(c)
(d)
(e)
(f)
Fig. 8: Examples of segmented beans. (a) A typical Carioca bean. (b) The same bean, re-
moving the pixels located near the border. (c) A typical Black bean. (d) A typical Mulatto
bean. (e) An atypical Carioca bean with the brown streaks occupying most of the grain
area. (f) An atypical Mulatto bean with grayish brown color that resembles Carioca bean.
In general, a bean grain G may have one or two colors. The following algorithm de-
tects the two representative colors of the grain G. If these two colors are similar, we con-
clude that the grain G has only one color. If they are dissimilar, we take the lighter color as
the predominant color. First, we create the palette color set P with all colors that occur in
the grain G. Then, we separate P in two color sets C1 and C2 (so that 21 CCP ) using
the k-means algorithm, with k=2 (MacQueen, 1967). Let f1 and f2 be the relative frequen-
cies of C1 and C2, that is, 2111 ### CCCf and 2122 ### CCCf , where # indi-
cates the cardinality of the set. Let c1 and c2 be the geometric centers of C1 and C2. Let us
suppose, without loss of generality, that 21 ff . Then, the following algorithm is used to
determine the predominant color of the grain G:

18
If (f1>0.7) // More than 70% of pixels belong to C1.
then return c1; // The predominant color is c1.
else {
If (d(c1,c2)<0.225) // The two colors are similar.
then return f1*c1+f2*c2 // Calculate the weighted average.
else return lighterColor(c1,c2) // Take the lighter color.
}
As before, d( c1, c2 ) is the Euclidean distance in the RGB space. The parameters
0.7 and 0.225 were chosen experimentally to minimize the errors. This algorithm does:
1) Using the k-means algorithm, the pixels of the grain G are divided in classes C1 and
C2, with centers c1 and c2. Let us suppose that C1 is more frequent than C2.
2) If more than 70% of the pixels belong to C1, then c1 is chosen as the predominant
color.
3) Else if the colors c1 and c2 are similar, then probably the grain G has a single color
(as the grain in Fig. 8c). In this case, the weighted mean of colors c1 and c2 is cho-
sen as the predominant color.
4) Else (if the two colors c1 and c2 are dissimilar) the lighter color is chosen as the
predominant color, because the lighter color of a Carioca bean is very different
from the lighter color of a Mulatto bean.
After extracting the predominant color, it is necessary to classify the grain as Cari-
oca, Mulatto or Black. For this task, we use again the k-nearest neighbor searching. In the
initial experiment, we took 71 Carioca beans, 17 Mulatto beans and 15 black beans as the
training samples. Then, we computed their predominant colors. Given a grain G to be clas-
19
sified, we compute its predominant color and search for the sample grain S with the most
similar color. The test grain G receives the same classification as the grain S.
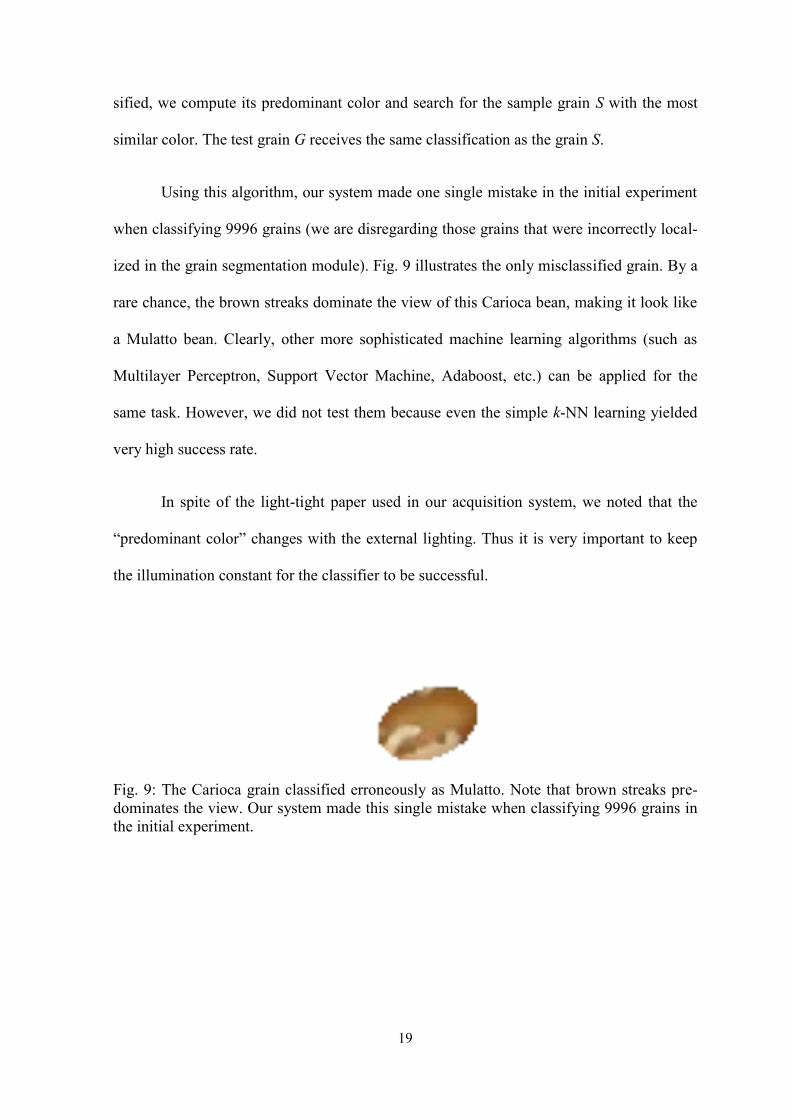
Using this algorithm, our system made one single mistake in the initial experiment
when classifying 9996 grains (we are disregarding those grains that were incorrectly local-
ized in the grain segmentation module). Fig. 9 illustrates the only misclassified grain. By a
rare chance, the brown streaks dominate the view of this Carioca bean, making it look like
a Mulatto bean. Clearly, other more sophisticated machine learning algorithms (such as
Multilayer Perceptron, Support Vector Machine, Adaboost, etc.) can be applied for the
same task. However, we did not test them because even the simple k-NN learning yielded
very high success rate.
In spite of the light-tight paper used in our acquisition system, we noted that the
“predominant color” changes with the external lighting. Thus it is very important to keep
the illumination constant for the classifier to be successful.
Fig. 9: The Carioca grain classified erroneously as Mulatto. Note that brown streaks pre-
dominates the view. Our system made this single mistake when classifying 9996 grains in
the initial experiment.

20
4. Initial experiment (sampling mode experiment 1)
The computer vision system proposed in this work was implemented in C/C++ us-
ing image processing and computer vision libraries Ceikeikon2 and OpenCV
3. In our ex-
periments, we took into account the three most consumed beans in Brazil: Carioca, Mulatto
and Black beans. We purposely “contaminated” batches of Carioca beans with Mulatto and
Black grains, because we wanted simulate the detection of non-predominant varieties in
batches of Carioca beans. We evaluated 100 images of beans, each one containing 100
grains. These images were divided into 10 subsets, according to the percentage of non-
predominant grains (Table 1).
Table 1: Image set used in the initial experiment.
Subset Total of images Number of Carioca
beans in each image
Number of Mulatto
beans in each image
Number of Black
beans in each image
1 10 100 0 0
2 10 95 5 0
3 10 95 0 5
4 10 90 5 5
5 10 85 10 5
6 10 85 5 10
7 10 80 10 10
8 10 85 15 0
9 10 85 0 15
10 10 70 15 15
Total 100 8700 650 650
The obtained results have already been described above. The system localized cor-
rectly 9996 out of 10000 grains and classified correctly 9995 out of 9996 grains.
2 Available at http://www.lps.usp.br/~hae/software/
3 Available at http://opencv.org/

21
In a Intel Core i7 2.2GHz computer, our system typically takes 18s to process an
image with 800×600 pixels (6s to map the pixel colors, 11s to segment the grains and 1s to
classify the grains), without using multi-threading or special optimization techniques.
5. More experiments
To assure that the results obtained in the initial experiment are reliable, we made
other experiments using other batches of beans, both in sampling and continuous modes.
We bought Carioca, Mulatto and Black beans from different trade brands, mixed them and
used the resulting mixtures in the experiments. We changed some parameters from the ini-
tial experiment, because the new parameters resulted in fewer errors:
a) In the grain segmentation, we changed the correlation threshold parameter from
=0.18 to =0.10.
b) In the grain classification, we changed the threshold used to decide whether two
colors are similar from 0.225 to 0.05.
We use these new parameters in all the following experiments.
5.1 Sampling mode experiment 2
In this experiment, we used similar number of the three varieties of beans. Table 2
shows the number of each variety of beans used in this experiment. We used the 300 beans
extracted from 3 images of this set as the training samples for the classification. There
were 3 segmentation errors (two missed beans and a bean that was detected as two) and 11
classification errors. In all misclassifications, a Mulatto bean was mistaken for a Carioca
bean or vice-versa. No misclassification involved Black beans.

22
Table 2: Number of beans varieties in sampling mode experiment 2.
Subset Total of images Number of Carioca
beans in each image
Number of Mulatto
beans in each image
Number of Black
beans in each image
1 10 20 20 60
2 10 20 60 20
3 10 60 20 20
4 10 40 40 20
5 10 40 20 40
6 10 20 40 40
7 10 30 30 40
8 10 30 40 30
9 10 40 30 30
10 10 34 33 33
Total 100 3340 3330 3330
5.2 Sampling mode experiment 3
In this experiment, we made a new image acquisition using new beans but using the
same number of the three varieties used in the initial experiment and described in Table 1.
There was no segmentation error. However, there were 25 classification errors. Again, no
misclassification involved Black beans. We used the 300 beans extracted from 3 images of
this set as the training samples for the classification.
5.3 Summary of sampling mode experiments
We made three experiments in sampling mode, each one with 10,000 beans. Our
system made 4+3 segmentation errors. Considering 2+2 false positives (FP) and 4+2 false
negatives (FN), we have recall rate (or true positive rate or hit rate):
%980.99)629993(29993)( FNTPTPrecall
and precision rate (or positive predictive value):
%987.99)429993(29993)( FPTPTPprecision .

23
It is also possible to compute other metrics. For example, F1 metric and Similarity
measure (Maddalena and Petrosino, 2008; Huang and Chen, 2014):
99.983%PrecisionRecall
PrecisionRecall21
F
99.967%4629993
29993Similarity
FPFNTP
TP
Our system made 1+11+25=37 classification errors when classifying 29,993 grains
(we are disregarding those grains that were incorrectly localized in the grain segmentation
module), yielding 99.877% of classification success rate outperforming the rates of 90.6%,
99.56% and 98.49% achieved by of Kiliç et al. (2007), Venora et al. (2007) and Venora et
al. (2009), respectively. However, we emphasize that the conditions of our experiments are
different from these works. The system made considerably more classification errors in
experiments 2 and 3 than in the initial experiment, probably because we used a mixture of
beans from many brands in experiments 2 and 3.
5.4 Continuous mode experiment 1
We prepared a mixture of 930 Carioca beans and 70 Black beans, loaded them in
the input box, turned on the image acquisition system and acquired the images in continu-
ous mode. We repeated the image acquisition process three times, using the same 1000
beans. In each acquisition, 9 or 10 images were acquired. Each acquisition process (acquir-
ing roughly 10 images with around 1000 beans) takes approximately 4.5 minutes. The total
number of grains obtained at each acquisition is less than 1000 because there is always a
“gap” between two consecutive photos. We processed these images, obtaining the results
listed in Table 3. For the beans classification, we used the same training samples used in

24
“sampling mode experiment 3”, removing the Mulatto beans (absent in this experiment).
The obtained percentages of the Black beans are very close to the true percentage (7%).
Table 3: Number of beans detected in continuous mode experiment 1.
Carioca Black Percentage of
Black Total
Acquisition 1 893 68 7.075% 961
Acquisition 2 914 69 7.019% 983
Acquisition 3 894 68 7.069% 962
Total 2701 205 7.054% 2906
5.5 Continuous mode experiment 2
We prepared a mixture of 400 Carioca, 300 Mulatto and 300 Black beans, loaded
them in the input box, turned on the image acquisition system and acquired the images in
continuous mode. We repeated the image acquisition process three times, using the same
1000 beans. We processed these images, obtaining the results listed in Table 4. The ob-
tained percentages are very close to the true ones (40%, 30% and 30%). For the beans clas-
sification, we used the same 300 training samples used in “sampling mode experiment 3”.
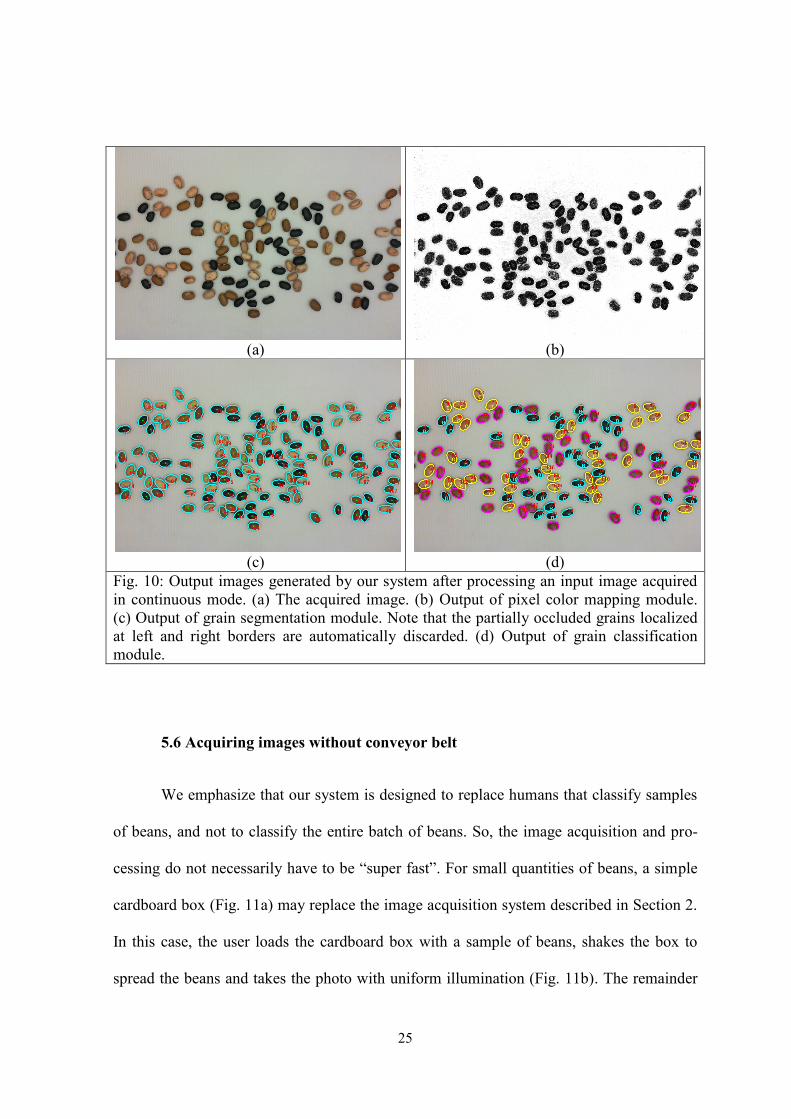
Figure 10 depicts the intermediary images generated by our system in continuous mode.
Note that the grain segmentation automatically discards the partially occluded grains local-
ized at left and right borders of the image.
Table 4: Number of beans detected in continuous mode experiment 2.
Carioca Mulatto Black Total
Acquisition 1 371 39.98% 280 30.17% 277 29.85% 928
Acquisition 2 372 41.24% 263 29.16% 267 29.60% 902
Acquisition 3 358 39.34% 281 30.88% 271 29.78% 910
Total 1103 40.26% 822 30.00% 815 29.74% 2740
25
(a)
(b)
(c)
(d)
Fig. 10: Output images generated by our system after processing an input image acquired
in continuous mode. (a) The acquired image. (b) Output of pixel color mapping module.
(c) Output of grain segmentation module. Note that the partially occluded grains localized
at left and right borders are automatically discarded. (d) Output of grain classification
module.
5.6 Acquiring images without conveyor belt
We emphasize that our system is designed to replace humans that classify samples
of beans, and not to classify the entire batch of beans. So, the image acquisition and pro-
cessing do not necessarily have to be “super fast”. For small quantities of beans, a simple
cardboard box (Fig. 11a) may replace the image acquisition system described in Section 2.
In this case, the user loads the cardboard box with a sample of beans, shakes the box to
spread the beans and takes the photo with uniform illumination (Fig. 11b). The remainder

26
of the processing is the same. Certainly, this process is much faster than counting manually
the three varieties of beans.
(a)
(b)
Fig. 11: For small quantities of beans, a simple cardboard box may replace the image ac-
quisition system.
5.7 Impurities
We describe in this subsection the behavior of the system in the presence of some
“impurities” (unexpected or expected). In all the experiments, we took photos with 34 Car-
ioca, 33 Mulatto, 33 Black beans and 5 “impurities”.
Corn grain: We acquired 10 images, each one with 5 corn grains. We processed
these images as usually. The system localized correctly 105 grains in all 10 images (both
beans and corns). Without feeding the classification module with the corn colors, it classi-
fied almost all corn grains as Carioca, because the Carioca color is the most similar to corn
color. Feeding the classification module with five corn grain samples, the system classified
correctly 41 corn grains and erred 9 (Fig. 12a).
Broken Carioca beans: We acquired 10 images, each one with 5 broken Carioca
beans. We processed these images as usually. The system localized correctly 105 beans in
all 10 images, even the broken ones. The system classified almost all broken Carioca
grains as Carioca. Feeding the classification module with five broken Carioca beans, the
27
system classified correctly only 15 broken Carioca grains (erred 35). We conclude that
broken Carioca beans can be easily localized, but cannot be distinguished from whole Car-
ioca beans by the classification module. It is necessary to include other features especially
designed to classify them.
Peas: We acquired 10 images, each one with 5 peas. We processed these images as
before. The system localized correctly 105 grains in all 10 images. Without feeding the
classification module with the pea colors, it classified almost all peas as Mulatto beans.
Feeding the classification module with five pea samples, the system classified correctly 45
peas grains and erred 5 (Fig. 12b).
Straw: We acquired 10 images, each one with 5 straws. We processed these images
as usually. The system localized many non-existing grains in each straw, detecting in aver-
age 112.1 grains in each image (Fig. 5c). Straw have color similar to beans. So, the pixel
color mapping module cannot distinguish between straw and bean.
Grass: We acquired 10 images, each one with 5 green grasses. Processing these
images as usually, the system localizes many non-existing grains in each grass (as in the
images contaminated by straws). In average, 106.5 grains were detected in each image.
However, as grass is green and none of the three varieties of beans is green, color mapping
module can map green color to background. Including some samples of grass in the set of
background colors, we detected in average 100.3 grains in each image. That is, the grass
was successfully ignored by the system (Fig. 12d).

28
(a) Image with 5 corn grains.
(b) Image with 5 peas.
(c) Image with 5 straws.
(d) Image with 5 grasses.
Fig. 12: The behavior of the system in the presence of different “impurities”.
6. Conclusion
In this work, we have presented a computer system for visual inspection of beans
that classifies them according to their skin colors. This system is composed of 3 modules:
pixel color mapping, grain segmentation and grain classification. In the color mapping
module, we have presented a technique based on k-NN learning that maps a pixel to differ-
ent shades of gray according to its similarity to “beans color” or “background color”. In the
grain segmentation module, we have used correlation-based granulometry to localize each
bean grain, together with its eccentricity, size and rotation angle. In our opinion, this is the
most important scientific contribution of this work. This technique yielded recall rate of
99.98% and precision rate of 99.99%. We think that this technique can be used in many
other agricultural product inspection systems to analyze seeds and grains. In grain classifi-

29
cation module, we have used k-means and k-NN to classify beans according to their pre-
dominant skin color, obtaining correct classification rate of 99.88%. These extremely high
rates show the robustness of the proposed system and indicate that it can be applied in an
industrial process for visual inspection of beans.
Acknowledgments
The authors would like to thank CAPES – Coordination for the Improvement of Higher
Education Personnel for the scholarship granted to J. H. Pessota; CNPq – Brazilian Na-
tional Research Council for the research scholarship granted to H. Y. Kim (Process
302917/ 2012-8) and FAPESP – São Paulo Research Foundation by financial support (Pro-
cess 2014/ 09194-5).
References
Aggarwal, A.K., Mohan, R., 2010. Aspect ratio analysis using image processing for
ricegrain quality. International Journal of Food Engineering, 6 (5), 114.
Aguilera, J.M., Cipriano, A., Eraña, M., Lillo, I., Mery, D., Soto, A., 2007. Computer Vi-
sion for Quality Control in Latin American Food Industry: a Case Study. In: Proceedings
of 7th Int. Conf. on Computer Vision: Workshop on Computer Vision Applications for
Developing Countries, Rio de Janeiro, 1–11.
Alfatni, M.S., Shariff, A.R.M., Abdullah, M.Z., Saeed, O.M.B., Ceesay, O.M., 2011. Re-
cent methods and techniques of external grading systems for agricultural crops quality in-
spection – review. International Journal of Food Engineering, 7 (3), 1–40.

30
Anami, B. S., Savakar, D. G., 2010. Influence of light, distance and size on recognition and
classification of food grains’ images. International Journal of Food Engineering, 6 (2), 1–
21.
Blasco, J., Aleixos, N., Cubero, S., Juste, F., Gómez-Sanchís, J., Alegre, V., Moltó, E.,
2009. Computer vision developments for the automatic inspection of fresh and processed
fruits. In: Proceedings of 1st International Workshop on Computer Image Analysis in Ag-
riculture held in Potsdam, Germany, 21–28.
Blasco, J., Cubero, S., Gómez-Sanchís, J., Mira, P., Moltó, E., 2009. Development of a
machine for the automatic sorting of pomegranate (Punica granatum) arils based on com-
puter vision. Journal of Food Engineering, 90 (1), 27–34.
BMALS – Brazilian Ministry of Agriculture, Livestock and Supply. Law nº 6.305, Decree
nº 93.563, of 11/11/86, normative instruction nº 12. Retrieved April 2011 from
http://ainfo.cnptia.embrapa.br/digital/bitstream/item/97404/1/comunicadotecnico-211.pdf.
Carrillo, E., Peñaloza, A.A., 2009. Artificial vision to assure coffee-Excelso beans quality.
In: Proceedings of the 2009 Euro American Conference on Telematics and Information
Systems: New Opportunities to increase Digital Citizenship, New York, USA.
Cheng, F., Huang, S., 2013. Efficient histogram modification using bilateral Bezier curve
for the contrast enhancement. IEEE Journal of Display Technology, 9 (1), 4450.
Connolly, C., Fleiss, T., 1997. A study of efficiency and accuracy in the transformation
from RGB to CIELAB color space. IEEE Trans. on Image Processing, 6 (7), 10461048.
Ding, X., Sun, L., Luo, Y., 2014. Shell histogram equalization of color images, Elsevier
Optik - International Journal for Light and Electron Optics, 125 (13), 33503354.
31
Dougherty, E. R., Newell J.T., Pelz, J.B., 1992. Morphological texture-based maximum-
likelihood pixel classification based on local granulometric moments. Pattern Recognition,
25 (10), 11811198.
Gómez-Sanchis, J., Martín-Guerrero, J.D., Soria-Olivas, E., Martínez-Sober, M., Magdale-
na-Benedito, R., Blasco, J., 2012. Detecting rottenness caused by Penicillium genus fungi
in citrus fruits using machine learning techniques. Expert Systems with Applications, 39
(1), 780785.
Gonzalez, R.C., Woods, R.E., 2002. Digital Image Processing, Second Edition, Prentice-
Hall.
Huang, S., Cheng, F., Chiu, Y., 2013. Efficient contrast enhancement using Adaptive
Gamma Correction with Weighting Distribution. IEEE Transactions on Image Processing,
22(3), 10321041.
Huang, S.C., Chen, B.H., 2014. Automatic moving object extraction through a real-world
variable-bandwidth network for traffic monitoring systems. IEEE Transactions on Industri-
al Electronics, 61 (4), 20992112.
Kiliç, K., Boyacl, I. H., Köksel, H., Küsmenoglu, I.A., 2007. Classification system for
beans using computer vision system and artificial neural networks. Journal of Food Engi-
neering, 78 (3), 897904.
Kim, H.Y., Maruta, R.H., Huanca, D.R., Salcedo, W.J., 2013. Correlation-based multi-
shape granulometry with application in porous silicon nanomaterial characterization. Jour-
nal of Porous Materials, 20 (2), 375385.
32
Laurent, B., Ousman, B., Dzudie, T., Carl, M.F.M., Emmanuel, T., 2010. Digital camera
images processing of hard-to-cook beans. Journal of Engineering and Technology Re-
search, 2 (9), 177188.
Lewis, J.P., 1995. Fast template matching, in Proc. Vision Interface, pp. 120-123.
Liu, J., Yang, W.W., Wang, Y., Rababah, T.M., Walker, L.T., 2011. Optimizing machine
vision based applications in agricultural products by artificial neural network. International
Journal of Food Engineering, 7 (3), 123.
MacQueen, J. B. 1967. Some methods for classification and analysis of multivariate obser-
vations. In: Proceedings of 5th Berkeley Symposium on Mathematical Statistics and Prob-
ability. University of California Press. 281–297.
Maddalena, L., Petrosino, A., 2008. A self-organizing approach to background subtraction
for visual surveillance applications, IEEE Trans. Image Processing, 17 (7), 1168-1177.
Maerz, N.H., Palangio, T.C., Franklin, J.A., 1996. WipFrag image based granulometry
system. In: Proceedings of the FRAGBLAST, 5th Workshop on Measurement of Blast
Fragmentation, Montreal, 9199.
Mendoza, F., Aguilera, J.M., 2010. Gloss measurements of raw agricultural products using
image analysis. Food Research International, 43 (1), 1826.
Patel, K.K., Kar, A., Jha, S.N., Khan, M.A., 2012. Machine vision system: a tool for quali-
ty inspection of food and agricultural products. Journal of Food Science and Technology,
49 (2), 123–141.
33
Patil, N.K., Yadahalli, R.M. Pujari, J., 2011. Comparison between HSV and YCbCr Color
Model Color-Texture based Classification of the Food Grains. International Journal of
Computer Applications, 34 (4), 51–57.
Pesante-Santana, J.A., Woldstad, J.C., 2000. The quality inspection task in modern manu-
facturing. In: International Encyclopedia of Ergonomics, W. Karwowski (ed.), Taylor and
Francis, London.
Razavi, S.M.A., Bostan, A., Rezaie, M., 2010. Image processing and physico-mechanical
properties of basil seed (Ocimum basilicum). Journal of Food Process Engineering, 33 (1),
5164.
Rodríguez-Pulido, F.J., Gordillo, B., González-Miret, M. L., Heredia, F.J., 2013. Analysis
of food appearance properties by computer vision applying ellipsoids to colour data. Com-
puters and Electronics in Agriculture, 99 108–115
Saraswat, M., Arya, K.V., 2013. Supervised leukocyte segmentation in tissue images using
multi-objective optimization technique. Engineering Applications of Artificial Intelligence,
Available online 5 October 2013. DOI: 10.1016/j.engappai.2013.09.010.
Savakar, D. G., 2012. Identification and classification of bulk fruits images using artificial
neural networks. International Journal of Engineering and Innovative Technology, 1, (3),
3640.
Savakar, D.G., Anami, B.S., 2009. Recognition and classification of food grains, fruits and
flowers using machine vision. International Journal of Food Engineering, 5 (4), 125.
Singh, K., Kapoor, R., 2014. Image enhancement using exposure based sub image histo-
gram equalization. Pattern Recognition Letters, 36 (15), 1014.
34
Souza, T.L.P.O., Pereira, H.S., Faria, L.C., Wendland, A., Costa, J.G.C., Abreu, A.F.B.,
Dias, J.L.C., Magaldi, M.C.S., Sousa, N.P., Peloso, M.J.D., Melo, L.C., 2013. Common
bean cultivars from Embrapa and partners available for 2013. Technical Statement, 211,
16. Retrieved December 2013 from
http://extranet.agricultura.gov.br/sislegis/action/detalhaAto.do?method=consultarLegislaca
oFederal.
Stegmayer, G., Milone, D.H., Garran, S., Burdyn, L., 2013. Automatic recognition of quar-
antine citrus diseases. Expert Systems with Applications, 40 (9), 35123517.
Ticay-Rivas, J.R., del Pozo-Baños, M., Eberhard, W.G., Alonso, J.B., Travieso, C. M.,
2013. Spider specie identification and verification based on pattern recognition of it cob-
web. Expert Systems with Applications, 40 (10), 42134225.
Venora, G., Grillo, O., Ravalli, C., Cremonini, R., 2009. Identification of Italian landraces
of bean (Phaseolus vulgaris L.) using an image analysis system. Scientia Horticulturae, 121
(4), 410418.
Venora, G., Grillo, O., Ravalli, C., Cremonini, R., Tuscany beans landraces, on-line identi-
fication from seeds inspection by image analysis and Linear Discriminant Analysis.
Agrochimica, 51 (4–5), 2007, 254–268.