be - eric · summary data for "behaior" subscale of piers,-harris self-concept scale,...
TRANSCRIPT

ED 110 187
AUTHORTITLE
DOCUMENT RESUME _
PS 007 982
Reynolds, Robert N.A Two-Year Evaluation of the Comparative Effects ofan Open Classroom .Instructional Program and a
0 Traditional Instructidnal Program.INSTITUTION Pennsylvania State.Depk.: of Education, Harrisburg.,
Bureau of Information Systems.'SPONS AGENCY National Inst. of Educa'eion (DHEW), Washington,
D.C.PUB DATE Feb 75 , ,%GRAFTNOTE
EDRS PRICEDESCRIPTORS
IDENTITIERS
ABSTRACT
NE-G-00-3-0190112p.; For related document, see ED 093 907
MF-$0.76 HC-$5.70 PLUS POSTAGEAchievement Gains; Basic Skills; ClassroomEnvironment; *CoRparative Analysis; *ElseeentaryEducation; Instru5tional Programs; *Open Education;*Program Evaluation; Self Concept; Student Attitudes;Teacher A-ttitudes; *Traditional Schools*Pennsylvania Department of Education
This study was a 2-year comparisop, of the effects ofopen,claSsroom versus traditional instruction on hildren'sself-concept, attitudes toward school and achievement of basicskills.'The 250 participants were stud,ents in grades 1-6 of twoelementary schoolp -- one utilizing an open classroomip,pproach andthe other a traditional approach. The measurement instruments usedincluded the Piers-Harris Self-Concept Scale and the PictorialSelf-Conp'ept Scale, the "Faces" Inventory, and the Stanford .
Achievement Test. Pretests on the ,three variables were' administeredin May and June.ot 1972 and posttest. s were administered in May andJune of 1974. In addition, data related to teacher attitudes an,d'classrooth environment and practices were collected and analyzed. Theresults of an ;analysis of covariance did not tprovide support .for any,concluive comprehensive statements concerning the relativeeffectiveness. of the open or the traditional instructional program.However, there was evidence to suggest that the open classroominstructional program effected positive changes in the affectiveareas of self-concept and attitude totiard school. Student's in bothinstructional programs performed equally well in the acHievement ofbasic skills. (JMB)
AA/
*********.**************************************************************Documents acquired bERIC include many informal unpublished
* materials not available from other sources. ERIC makes every effort ** to obtain the best copy available. nevertheless, items, of marginal *
* °reproducibility are often encountered and this affects the quality *
* of the microfiche and ,hardcopy reproductions EPIC makes available *
* via the ERIC Document Reproduction Service (EDRS). EDRS is not* responsible for the quality of the original document. Reprodudtions **zsuppliedby EDRS are the best that can be made frbm the original. *********45**********************************************.*************
ti

U S :DEOARTMENT OF HEALTH,EDUCATION & WEIrFARENATIONAL INSTITUTE OF
EDUCATIONTHIS DOCVENT HAS BEEN REPRODUCED,rEXACTLY AS RECEIVED FROMTHE PERSON OR ORAINIZATION ORIGINATING IT POINTS OF VIEW OR OPINIONSSTATED DO NOT NECESSARILY REPRE,SENT OFFICIAL NATIONAL INSTITUTE orEDUCATION POSITION OR POLICY
: Ar
a A1
O
.1
Q
o ,
C
Open Classroom/Traditional Education:
A Two-YearComparative 'Evaluation
Poorpsylvanlo DoPortmont of Ethical*: 1975
.9.6002
,

Sc
4
f.
O
A TWO-YEAR EVALUATION OF THECOMPARATIW EFFECTS OF AN
OPEN CLASSROOM INSTRUCTIONAL FOGRAMAND A TRADITIONAL INSTRUCTIONAL PROGRAM
by Robert N. ReynoldsEducational Research Assistant
Division of ResearchBureau of Information Systems
Pennsylvania Departmenteof EducationFebruary 1975
The project presented here was performed pursuant to Grantnumb. NE-G-00-3-0190 (Project No. 3-066) from the NationalInstitute of Education, U.S. Department of Health, Educationand Welfare. However, the opinions expressed here do notnecessarily reflect the position or policy of the National
4Instite of Education, and no official endorsement by theNational Institute of Education should be inferred.
9

A'
1
i
I
v
Commonwealth of PennsylvaniaMilton J. Shapp, Governor
.L...., _
...
Department of Educationv
., John C, Pittenger, SecretaryDArid W. Hornbeck, Executive Deputy
Bureau of Information SystemsSeon H. Cho, Director
DiVision of.Research____-)Robert B.Hayes, Directo
i LJT
.,.k.
/
I
Pennsylvania Department of Educa ion.Box §11
Y- Harrisburg, Pa. 1.26(j
I

ABSTRACT
In recent years there has been widespread criticism of the traditionalmode, of instruction infAlnertn public schools. Concurrently, there have beenattempts to replace th traditional organization and instructional patterns
psalternatives. Perhaps the-bost widely publicized and implemented of these alter-natives is open classi'oom education. The proponents of this type of innovativeprogram say that open classroom education will effect positive changes in children'sself-concepts, attitudes toward school and cognitive learning, but these claimshave'not been substantiated by empirical research evidence. This study, limitedto a comparison of one open school and one traditional school, was performed toempirically assess the claims of open classroom proponents.
Approximately 250 students in grades 1 through 6 of two elementary schools,one utilizing an open classroom instructional program and the other a traditionalinstructional program, comprised the sample in the two -year study which focused*.onthe assessment of the comparative effects of the two instructional programs uponthree student variables: (1) self- concept, (2) attitude toward school, and (3)achievement of basic skills. Measurement of these variables was accomplished bythe Use of the Piers-Harris Self-Concept ale and the Pictorial SW-Concept Scale,the "Faces" Inventory, and then Stanford Ac ievement Test. Pretests on the threevariables were administered in May and Jun of 1972; posttests were administered inMay and June of 1974. Analysis of covariance was used with this data. Inaddition, data related to teacher attitudes and classroom environment and practiceswas collected and analyzed.
The results of the study do not provide support for any conclusivecomprehensive statements concerning the relative effectiveness of the open or thetraditional instructional program. However, there was evidence to suggest that theopen classroom instructional program effected positive changes in the affective areasof self-concept and attitude toward school. Students in both instructional programsperformed equally well in'the achievement of basic skills.
a

TABLE OF CONTENTS
PAGE
ABSTRACT 'a iii
TABLE OF CONTENTS iv
LIST OF TABLES 1
CHAPTER I 1
INTRODUCTIONs t 1
Background of the StudyStatement of Objectives 3
Related Literature 4
CHAPTER II 8
PROCEDURESSampleDesign.
TreatmentsInstrumentation
'8
8
8
9
11
Data Gathering Procedures 13
Statistical Analysis 114
. ,
CHAPTER III 18
RESULTS 18
Self Concept 18
Attitude Toward Sch000l 23
Academic Achievement 30Teacher Attitudes 44_ 4/ 37
Classroom Observations 1,ss 37
CHAPTER IV 41
DISCUSSION-,,.SUMMARY AND RECOMMENDATIONS 41
Discussion of Findings 41
Summary. 42
Recommendations for Future Research 43
REFERENCES CITED 45
APPENDICES
,
.k 6

TABLE
1
2
3
4
5
6
LIST OF TABLES,
Summary Data for Pictorial Self- Concept Scale, Grade,1
Summary Data fpr;;Tictorial Self-Concept Scale, Grades 24-
Summary Data for Total Score of Piers-Harris Self-Cpncept Scale,
'
k .
PAGE
18
'
Grades 5-619
Summary Data for "Behaior" Subscale of Piers,-Harris Self-ConceptScale, Grades 5-6
203
Summary Data for "Sntellectual and School Status" Subscale ofPiers-Harris Self-Concept Scale, Grades 5-6 0
SummryJData for "Phyiical Appearance and At,tributes" Subscale of 'Piers-Harris Self-Concept Scale, Grades 5-6
21
\'.7 Summar Data for "Ankiety" Subscale of Piers-Harris Self-Concept
/ Scale, Grades 5-6 I
''.----\ ,
. . .
.r
Summary/Data for "Popularity" Subscale of Piers-Harris Self-Concept,Scale, Grades 5-6
'2f .
mmary Data, for "Happiness and Satisfaction" Subscale' ofers-HarrisbSelf-Concept Scale, Grades 5-6
10 Summary . ;ta
11
12
Summary Data
Summary Data
13 Summary DataGrades 3-6
for Analysis of "Paces" Inventory, Grade 1
, 22
23
fb Analysis of "Faces" Inventory, Grade 2 .24
for Total Score of "Faces" Inventory, Grades 3-6 25
for'"School Learning" Subscale of "Faces" Inventory,
1
25
14 Summary Data f or "Independent Sfudy" .Subscale of "F7a.ces Inventory,Grades 3-6
.15 Summary Data for !:School Climate" Subscale of "Faces" InventoryGrades 3-6
16 Summary Data for Days of Attendance, Grade 1
17 Summary Data
18 Summary Data
15 Responses to
26 "
27
for Days of Attendance,,Grades'2-327
for Days of Attendance, Grades 4-6 28
Selected Items from-SPOrting Hif !Parent Questionnaire 28
Selected Items from Sporting Hil Pupil QueStionnaire
21 ReSponses to 1974 Parent Questionnaire30,
22 Summary Data for Stanford Achievement Test, Grade 1 \21
20 Responses to29

TABLE
23 yummary Data for Stanford Achievement Test Grade 2
PAGE
32
24 Summary Dataqfor Stanford Achievement\Tept, Grade 3 33
25 Summary Data for Stanford Achievement Test, Grade 4 34
26 Summary Data for Stanfrod Achievement Test, Grade 5) 35
27 Summary Data for Stanfdrd Achievement Test, Grade 6- 36
' 28$, Experimental Teacher Attitudes 37 '
29 Summary Dati'for Comparison of Results of Teacher Attitude Analysis 37
30 Summary of Classroom Observation Data\_, 39
O
°,1
^
'via
4

CHAPTER I
INTRODUCTION
4
Backgrqund of the Study
James Welsh,, writing an,.introduction to,a description of, Pennsylvania'sEducational Quality Assessment program,-says that "public schooling in Americahistorically has been'shroudgd in faith and optimism. Until, less thin a decade ago,the prom4e and power of formal schooling were rarely questioned." (Welsh, 1971,p. 1) However, as Welsh indicates, the situatiOntnas changed during the past decade.The educational literature is replete with the recent writ4.ngs of a growing numberof authors, commissions, and committees which are sharply critical of the publiceducational system of this country. These,attacks and criticisms are too numerousto ignore and, taken together,constitute an indictment of traditional educationalpractices.
1 For instance, the National Education, Association's Center for the Studyof Instruction, in its staff report entitled Schools for the 70's, and Beyond: ACall to Action, criticizes the'traditional "uniform environment" of most classroomsby saying that it ".,:ultimately bores learners by aiming all instruction at anonexistent 'average' student." (Greenleaf, et.al., 1971, p. 49) John Holt soundsthe same chord by bluntly saying that "almost all children are bored in school."(Holt, 1970, p. 68)
Postman and Weingartner condepn'the irrelevant and boring nature of the"game" of schooling in a rather unique way:
The game is called "Let's Iltetend," and if its name werechiseled Into the front of every sch9o1 building in Americawe would at least have an honest announcement of what takesplace there. The game is basedon a series of pretenseswhich include: Let's pretend that you are not what you areand that this sort of work makes a difference to your lives;let'B'pretend that what boresyou is 'Important, and that themore you are hored, the more -important it. is; let's pretendthat there are certain things everyone must know, an7:1 thatboth the questions'and answers ,about them have been fixedfor all time; let's pretend that your intellectual compttencecan be judged on the basis of how well you4can play Let'sPretend.' (postman and Weingartner, 1969, p. 49) ,-A
Charles Silberman, one of the most' widely cited critics of traditionalAmeric an education, says:
...schools discourage students from developing the capacity tolearn by and for themselves; they make it impossible for a
youngster to take redponsibility for his owneducation, for theyare structured in such a way as to make students totally dependentupon the teachers. Whatever rhetoric they may subscribe to, most.
schools in practice define education as something teachers do Itoor for students, not something seudents.do to and for ttyemseives,with a teacher's-assistance. (Silberman,- 4970, p. 185)
Such criticisms are legion and could be dited endlessly. However, amore important concern is the question of how the quality of American educationcan be improved. An often encountered answer to thA question is,that educational
, 9
.0

t
G
systems should be less structured and more responsive to individual diversity. It
is said that schools should have "less formally structured ,classrooms lir whichthe student can develop more or less unhindered by demands for conformi y." (Averch,
et.al., 1971, p. 140) .
A-form of ,the "less structured classroom" which is receiving much attentAnat this time in America, especially at the,elementary level, is one that,has
variously been termed "British I fent School," "open education," "integrated day,""Leicestershire Plan," and "info al,classroom." (Barth, 1971)
Advocates of this type of instructional organization believe that theirprograms will result in children having more positive attitud s toward school.Because children's personal interests largely determine the ai tivities in,whichthey will be involved, they should not perceive school as boring or irrelevant.School should be an enjoyable, interesting place where rewarding and "fun"experiences occur. Further, the warm and trusting, environment of. the open,
classroom should assure that children will feel accepted, will not fear undue criticismand will be encouraged to attempt, and to succeed in, activities they are capable ofperforming. Scho4, then, should be perceived as a likeable place, not just a
tolerable place. (Rogers; 1969),.
.
Open education advocates also say that the children's attitude towardthaselves, their self-concept, is expected to become more positive for many of the
same teasons. The warm, supportive classroom environment is seen to be especiallyimportant in. this''iegard. Children should'quickly learn that they are accepted forwhat they are, not criticized, for being other than what they shoUld be. As theysucceed in pelf- initiated and'self-directed activities, they gain.a feeling ofconfidence. They see themse s as,Competent, self-reliant, autonomous individuals,capable of makini decisions and xercising responsibilities. In thiavway;-theydevelop a realistic and positive self-concept. (Rathbone, 1971
,.1
In addition io these affective considerations, the effects of the open'classroom may favorably influence cognitive achievements. Although there is littleemphasis upon rote memory and the learner's interests to a great extent dictatewhat is studied, ehelasl.c skills and knOwledge in reading, writing, mathematicsand other subject areas are expe&ed to be attained. (Rogers and Coe, 1971)
VThe attractiveness of these claims; combined with the dissatisfaction with
traditional forms of instruction as espoused.by-its many critics, has led to therapid and widespread implementation of open classroom instructional programs.Frank Brunetti, analyzing school architectural trends in 43 states, reports thatmore than.50 per cent of the 2,500 schools built in 1967, 1968 and 1969 were ofopen design. (Brunetti, 1971) The State of North 'Dakota has implemented an ongoing
:plan to retra.n all of its eleentar1 teachers In open methods. In Pennsylvania,alone, there are more than 40 open space buildings either opetating, under construc-,tiqn, or in the design phases. (Wei-Tier, 1972) Many other hchools-have adapted orare adapting open education philosophy and programs to existing buildings with
,Minor or no renovations.
A ever, assis often the case, this implementation of open classrooms 4
programs ha5'been carried out mainly as a result of a -"bandwagon" effect, withTittle just ificttion from research. As Lillian Katz says:
4
V .
:a,_ ,
Resons far such widespread interest, by now reaching proportiorlsOf a bandl4agon are no doubt many and varied...Certainly the -generaldissatisfaction with so-called traditional .(i.e. fdrmal)
c1
2

4
schooling and'the resulting readiness to 'try anything'may be working behind the groundswell. Possibly a long-standing AngTophilism contributes-to Americas receptivityto British develOpments as well. Notably,'a body of evidencethat open informal education is effective'is not available,and is not amola,the many causes of the spreading enthusiasm.(Katz, 1972, p. 3)
Roland Barth, a leading advocate of open education is more specific whenhe writes that "Despite the mass of information accumulating about open education,there is still no rigorous research concerning its effect upon the development ofchildren's thinking, attitudes and behavior as compared with the effects associatedwith more traditional forms of educations" (Barth, 1971, pp. 117-118). Walberg and
Thomas agree: ".I..There has'beenyery.little research and evaluation on openeducation, aside frpm testimonials by exponents and reporters." (Walberg andThomas, 1972, p. 197)
Thus, there is a definite need for evidence geerated from research andevaluation to support or refute the claims of the proponents of open classroomeducation. I' this instructional strategy is truly a.viabj.e alternativeto moreotraditional forms of instruction, this viability should be established by means ofobjective, empirical evidence derived from scientific research.
The purpose of this study was'to compare the effects of an open classroominstructional program with the effects of a traditional instructional yrogrhm in twoelementary schools in Manheim Central School District, Lancaster County,Pennsylvania,,
`during the 1972-73 and 1973-74 school years.'
Statement of Objectifies
The major objectiveriof the ,study was to attempt to answer the following
questions:
1. Is there a significant difference between the se'f- conceptof children involved in an open classroom instructional
-- program and those involved ina traditional program?
2. Is there a significant,difference between the attitudestoward school of children, involved in an open_clasSroominstructional program and those involved in a traditional
program?
we4. DoeS teatt:ing in an open classroom cause a change in teacher
attitudes toward child-centered policiesand practices,ineducation?
3. Is there a signifiNOVdiffereoce between the level ofachievement in basic skills of children involved in anopen classroom instructional progfam and those involvedin a traditional plogram? ,
5. What is the extent of the changes in clasSkoom environmentand practices resulting from continued experience with the ,open classroom?
// 3

Related Literature
Although Lillian Katz (1972) and Walberg and Thomas (1972) accuratelycharacterized the overall research situatic in the area of open education when they T
wrote of a lack of.a coherent body of research evidence(supporttng its effecth(reneas,the number of reports in the/literature concerning studies of.the.effectiveness ofopen education has increased rapidly as interest'in the approach, has increased. .
However,,_a strong theme of caution concerning the appropriateness of generalizing resulis expressed in mostfof these studies. Because of the flexibility and imprecisenessof open education programs and the "pilot" nature of many of the studies,-it isemphasized that general statements about t eNifects of open eddcation 'Should notbe made.
4
Though the original impetus for t e impleMentation of open education inAmerica came from the Britiph experience' h informal primary schools, it doesnot appear that evidence of clear-cut periority in cognit.ive achievement is
available for these schools. Dougla Pidgeon, after, reviewing relevant Englishstudies, says that'"Direct el0.dence of the efficlenc*of the newNBritiah-primaryschool, compared with the more traditional approach to primary education, iscurrently in short supply..." ;(Pidgeon, 1972, 31) Joseph Featherstone, beingmore specific aboUt the same subject, says that
...on measurable achievement in cony ntiona1 tests, childrenin formal classes do slightly better than Children in informalclasses. Uniformly, the differences e slight. The greatestare in mechanical arithmetic, and.the east in reading.(Featherstone, 1972, p. 40)
Featherstone goes on to say that this difference can' be explained by the fact thatformal classroom childien have more experience in taking formal tests than thosein informal classrooms. Further, he reports that there is some evidence to show thatthe differences tend to "iron out" in later j,choOl years.
, 11
The Canadian and American studies reported in the literature generally donot indicate any meaningful pattern of results. Some of the studir indicate thatstudents in conventional or traditional schools do better on standardized achievementtests than comparable students in open situations.
. ., '
Al,
1, 4
'PT $ ....,
Jack Sackett,r
f9r instance, found that, compared on the basis, of the IowaTests of Basic Skills, childreq in an open space school achieved' significantly lowerthan the compatison groups irom both a self- contained school andia departmentalizedschool.. (Sackett, 1971) Moodie, in his study of approximately 370 Canadianchildren, found that when children from open plan and traditional elementary classes,were compar)ed on the basis of Gates-MacGinitie Reading Test'scores during 7th grade,the results indicated that the open school students attained lower scores than thestudents from the more't.raiilitional classes. Surprisingly, however; When the samegroups of students were tested 14 months later, .the differences were no longerevident. (Moodie, ,1971). McRae, in an almost i entical study sith another sample .
Of 70 student's, reported very similar findings. (McRae, 1970)"4 )
,.
_ ..
, ......
X A larger number of thestudies concerning cognitive achievement indicatesthat there is,essentially no difrence in the achievement of traditional and openschool students. Tuckman, et.al., report,that A comparative study of achievementof 30 classrooms of students, 16 from open schools and 14'from traditional schools,in grades 1 through 5 resulted in no discernible pattern Of differences. ;Althoughseveral of the 16 difference.c-omparisons performed using results of California
( 4
.1 lick a. 1

AChlevement Tess revealed significant differences between the groups, these couldnot reasonably be described as program effects. "Overall, it was.concludedthatstandardized achievement was-unaffected by the 4witch to open classroom; it wasneither improved no retarded." (Tuckman, et.al., 1973, p. 9)
More positively, Charles Killaugh's report of a three-year longitudinalstudy indicates that st9dents from schools with open programs scored significantlyhigher on cognitive ad'hievement measures than students from traditional'programschools. Killough's evenly divided sample of approximately 270 elementary studentst4as. randomly selected and given a preteSt and yearly posttest for three years. At -
the end of the'second year, the open program students,had significantly higher meanscores in arithmetic reasoning, arithmetic concepts, arithmetic computation, readingcomprehension and vocabulary.' Killough reports that differences were maintainedthrough the third year of the study. (Killough, 1971)
The results of these Studieslare somewhat contradictory, but it appear'sthat'open edUcation programs have not been demonstrated to be either clearlyinferior or superior tutraditional education prograMs in.relation to their effectsupon children's cognitive achievement. The present situation is summarized ratherconcisely by Frank Stetz in his American Educational Research Associatiopaper:
To date, very fel...7 large scale endeavors to assess studetitachievement in open education have been completed. Studieswhich have been done have not shown the increased gains overmore traditional programs-which was hoped for. (Stetz, 1974)
6a
4 , Since the claims of the proponents of open education emphasize resultsin affective areas, a good number of the studies in the literature deal with thesetypds of variables.
4
The self-conceptlof children is one of the primary affective variablesthat open education advocates believe will bq positively 'affected by participationin open instructional programs. "Thus, a gooenumber-bf the studies in the literaturehas addressed the question of whether involvement in open education program resultsin improved self-concept.
One of the earlier reports in the literature concerns a comparative studyof self.- concept of elementary students in a traditional school and an experimental,open school. Purkey, Graves and Zellner administered the Coopersmith Self=EsteemInventory to 414 experimental pupils in grades 3, 4, 5 and 6 and 525 pupils in thesame grades in the traditional school in order to investigate two hypotheses:
1. Pupils enrolled in the experimental school will evid.ence
greater self-esteem than pupils enrolled in the comparisonschool.
2. As grade level increases, measured differences in self-esteem between the.two groups of pupils will increase.(Purkey, Graves and Zellner, 1970)
The first hypdthesip was -supported at the .001 leveljOf significance.The second was also supported, since differences between the schools at each gradelevel were sig4ificantot the .01/level and. the magnitude of differences increasedas the grade level in ,esed. These resvlts'are quite encouraging, although theirvalidity is some weakened by the "static group" nature of the design. 'Althoughthe authors make a strong case for the equivalency of the two schools in relation
O

to nontreatment variables; such matching is generally suspect.
Heimgartner also finds support for the contention that open educationprograms will have a more positive effect upon children's self-concept than
traditional prqgrams. In a comparison of 46 elementary students, approximatelyevenly divided between a traditiohal school and an open school, on the basis ofscores on the Self-Social Symbol Tasks and the Children's Self-Social Constructs'
Test, he found that during the course of a year the open school group had experienced
-increase in self-esteem while the traditional group showed.a slight loss. --\"
(Heimgartner, 1972)
Wilson, Stuckey and Langevin conducted a study which further supports the
effectiveness of open educationN.program They compared 104 grade 5 and 6 pupils
in two open schools with 59 grade 6 pupils from two traditional schools on 'the
basis of a semantic differential questionnaire with the following six concepts:/ books, learning, teacher, I, school, and school last year. The results of their
analysis led them to conclude that "the results generally confirm the claims thatpupils in open plan schools have better attitudes toward school and toward
themselves." (Wilson, Stuckey and Langevin, 1972, p. 117)
Other studies investigating the relationship of open education and pupilself-concept have not been as supportive of the claims for open education as those
cited above. Kohler, (1973) on the basis of the Sear'.s Self-Concept Inventory,compared 126 children from 9 to 12 years old from three open schools with156 children in the same age - groups from three traditional schools. He also
attempted to relate the degree of openness of the schools, as measured by theWalberg-Thomas scale described earlier herein, to the variable of self-concept.His findings indicated that there was no difference between the self-concept of
students in the two types of schools on the total score or any of the five subscale
scores. FuiJther, he found no significant correlation between degree-of openness and
,self-concept.
Ruedi and West also report finding no difference between the self-concepts
of open and traditional groups. After examining the results of Gordon's How I
See Myself Scale for children froth the two schools:ehey concluded that "the idea
that students in an open environment school would be higher in-self-concept....wasnot demonstrated." '(Ruedi and West, 1972, p. 10) They strongly emphasize, hOwever,
the limitations of their study, the primary one.being a sample size .of 27.
The improvement of children's attitude toward school 'is also a major
affective objective of open education, advocates, since enjoyment in school and thelearning situation is assumed,to be the primary motivational factor which influences
elementary children. Logically, given the comparative freedom of choice and lackof obtrusive structure in open programs, it would appear the children's attitudestoward school should be positively affected by involvement in open instructional
programs. The studies in the literature lend support Vb this impression.
o The study reported by Wilson, Stuckey and Lailgevin, described in detail
earlier, indicates that the experimental, open school children responded to thesemantic differential concept "school" more positively than the traditional students.As the authors say, "In all cases, the attitude of the open plan pupils was more
positive than the controls. School is more active, potent, and likeable." (Wilson,
Stuckey and Langevin, 1972, p. 117) The study by Tuckman, et.al., also describedearlier, reported similar findings concerning attitude toward school. The
comparisons made between open and traditional pupils indicated that, as measured bythe School Sentiment Index, the open classroom students had more poSitive attitudes
6
4

a. toward school. This difference was noted in bot the primary and intermediate grades.
(Tuckman, et.al., 1973)
A study performed in Ontario, Canada al&) supports the contention thatthere is a strong relationship between open programs and positive attitudes toward
school. (Halton County Board of Education, 1969) Observational techniques andadministration of questionnaires in both an open and a traditional school led tothe conclusion that the attitude toward school of the open school students was more
positive than that of the tradj.tional school students. Interestingly, it was alsoreported that.school attendance was higher in the open school group. This was beenAs an unobtrusive, reflection of a more positive attitude toward school..
As has been stated, the literature concdrning the effects of open educationprograms ohchildren does not provide conclusive evidence of either its success or
its failure. However, two rethee strong impressips emerge from a review of such
literature. First,'it appears tenable to say at this time.that there is littleevidence to indicate that there are veriously negative effects which can be attributed
to open instructional programs. Given the relative recency of the implementation ofmost'-,',open programs, this situation is encouraging.
The second strong impression gained from review of the literature on openeducation is that there is a de finite need for more studies in this area. Overall,
the literature indicates that a determination of the comparative effectiveness ofopen education programs has not been made and there is an oftenstated desire formore research to make such a determination possible.
7
6
tr

CHAPTER.II
PROCEDURES
Included in'this chapter 'are six sections. The first section describesthe characteristics of the sample involved in the study. ;The second considers thedesign of the study. The third majo# section describes the instructional programsused in the comparison and experimental schools, with emphasis upon the openclassroom program: The next section presents descriptions of the instruments used .
in the study, with reliability and validity information emph4ited. Finally,`procedures utilized in data gathering and statistical an4ysh 'are presented in_thelast two sections of the chapter.
Sample
The study was conducted in Manheim Central School District, LancasterCounty, Pennsylvania, and involved two similar elementary schools. Sporting HillElementary School was the experimental school, having been remodeled during the summer'of 1972 to facilitate the implementation'of an open classroom instructional program.White Oak Elementary School was the comparison school. The two schools, in termsof physical plant, are very similar since both were built from the same set ofarchitectural plans approximately 20 years ago. Both schools havsix regularteachers, one teacher's aide and approximately 150 students in grades 1 to 6. Bothserve rural populations living on farms or in very small town#.
A major dissimilarity in the two schools.in the study which shouldbe pointed out is that during the 1972-73 year Sporting Hill, the open classroomschool, had six student teachers in the fall semester and another six in the springsemester from Millersville state College. During the 1973 -74 year, Sporting Hillhad four student teachers in the first. semester and two during the second. WhiteOak, on the other hand, did not. have any, student teachers during either of theseyears.
Design
The design used in the study was a modification of the NonequivalentContrk Group Design as described by Stanley and Campbell. (1966, pp. 47-50)Because of the usual administrative constraints, neither random assignment ofstudents to treatments nor random assignment Of school to treatment was possible.
However, except for the - designed openness of the experimental school,the two schools are quite similar in terms of physical plant, Timber of grades,classes per grade and experience of teachers. Because both are neighborhood schoolsdrawing pupils from very similar types of families and residential areas, it isbelieved that there was no inherent bias in terms of socioeconomic status or abilitylevel of students. Thus, except for the type of instructional program, theexperimental and comparison students were felt to be equivalent. Accordingly, thestatistical unit of measurement used was the individual student scores. The designof the analysis used in the study generally may be pictured as follows, where 0is observations or measurements and X is experimental treatments.
Schools May 1972Sporting Hill 0White Oak 0
X
May 19740 'A.0
r8
.) 11 it
Treatments
Comparison Treatment. The comparison treatment was basically a typical self-contained classroom typeiof instructional program with designated time periods forthe normal subject 'matter areas.
Experimental Trea(ment. The experimental treatment was an open classroominstructional program based on a model designed and implemented by the personnelof the Educational ,pevelopment Center at Millersville State College, Millersville,Pennsylvania.. This method of open glassroom instruction emphasizes the followingcomponents (as described in the brochure distributed by Millersville State College):
a. Team TeachingTeam teaching is planning, working and evaluating together inorder to provide the best possible learning experience foryoungsters. Planning and evaluating are the key factors ofteam teaching. Without these elements, team teaching cannotfunction effectively. Teachers must'freely communicatewith each member of the team. Teams should be designed so thatthe strengths and interest of each team member are used to theirgreatest potential.
b: Individual zationIndividual zation means teaching a child at his present level ofachievement. It can mean instruction to a large group, instructiontd a small group, and in some instances a one-to-one situation.Individualized instruction means humanizing, personalizing, andcaring for each child as a human being. It means recognizing andbuilding.on each child's capabilities and limitations. It meansmaking each child feel he is important and has something tocontribute.
c Nongradedness
Nongradedness eliminates the traditional labels of 1st grade, 2ndgr de, etc. Children move through the various basic skills withoutth constraints of, grade levels. Each-child can move at his own ratethout the constant fear of failure. This is made possible through
revised grouping procedures. Multiaged groups are developed at theprimary and intermediate levels. This type of grouping allows forinteraction between children of different ages and abilities--interaction that knocks down the barriers that normally separate ourchildren--barriers that allow a child to get some perspective of hisgrowth, and development in relation to other people.
d. Continuous Progress
This system of curricular organization places a child in a levelthat reflects his educational development through a sequence ofle4tning skills. Each child's placement is determined through theuse of diagnostic tests and instruments and controlled by arecord - keeping system. The major emphasis of such a system isflexibility.
e. Unified Media
Unified media is an integral part of the program in whichinstructional and other services related to print, nonprint,audio-visual media, manipulative devices, and "hands on"
.1 0 6
9

activities and materials are administered in a single, unifiedprogram.
A typical learning day was as follows.
7:50 - Opening Exercises
The opening exercises of the school day usually find all the children' i6 their home base. At this time lunch count is taken, beginning. exercises are
conducted, the daily schedule is discussed and special activities are arranged.Occasionally, when a child or group of children have completed a major projectthey wish to share with the other children, the complete unit (primary or intermediate)will come together to observe. Generally, though, this time of day is used as a sortof launching pad from which the day's activities flow. .
.8:15 9:45 Language Arts
During this time, such areas as spelling, creative writing, speaking, ,
dramatics, English and reading are covered. .Within each unit the group is determinedby evaluation of the child's progress and may, and often does, cut across grade levels(1, 2, 3 for the primary unit and 4, 5, 6 for the intermediate). Here children mightbe taught by large-group instruction for a new skill, small group instruction for areview of a previously taught skill, or by themselves on individually prescribedtasks. Children work and progress at their own rates. The child is constantlyreevaluated inall the language arts area and reassigned to different groups andteachers, depending on his progress. The major emphasis at all times is uponindividualization of instruction based on each child's unique set of abilities andneeds.'
9:45 10:45 Math
Again, the groupings and assignments to teachers are based upon children'slevel of achievement rather than upon age of grade level. Thebeginnings of classwill find the teacher and children making plans for math that day. Problemsare exchanged for later solutidrs. TheKe might be instruction to the whole group ona new concept. Times may be posted for small group meetings. And, those children,who are capable of working on their own are allowed to go their own way.
11:00 12:00 Lunch
The lunch hour is aNinte0a1 part of the day, In that it allows time forchildren to romp freely, exercise with games organized and decided upon by thechildren and teacher, and pursue interests, initiated in the classroom, that thechildren might not otherwise find time for during the regular school day.
12:00 2:15 Social Studies and. Science
The social studies-science block of time in the afternoon provides a greatmany opportunities for the children and teacher to discuss, develop and explore thetremendous variety of interests of the children. Learning centers, work packets,committee work and individual research work are a'-few facets of the learning processthat can be seen here.
Large groups are gathered for instruction in a concept new to most of thechildren. Small groups are organized for review work, setting new courses, forevaluation of progress, etc. And, as always, the individual child can be seen
10

pursuing his,or her own interests at his or her own rate of speed. The teacher,in this setting, becomes a consultant, a helper, a guide, a diagnostician--facilitatorof learning.
A key element in the Sporting Hill Elementary School instructional, programis the system of individual contracts between teacher and child. This system, usedin varying degrees in all the subject areas, is seen as a major way of individualizinginstruction and allowing the learner to initiate and guide, and be responsible for,his or her own activities.
Under the contract system, children confer individually with their teachersand agree to master within a given period of time a certain skill or 'perform a certainamount of work, such a$ preparing and giving a report, understanding a scientificconcept,. solving a certain number of math problems, or reading a book. Each of thesix regular teachers in the school is responsible for working out contracts withapprbximately 25 children. Each teacher is responsible to make certain that eachdhild covers certain subject areas such reading, math,and science. These contracts,depending upon the nature Of the child, vary in complexity and time and can be asshort as two or three hours or as long as two weeks. Within certain limits,determined by the teacher's assessment of the child's need, the individual learner_can 'decide the type of contract he or she will enter into,'thus exercising someinfluence over his or her own activities.
Instrumentation
Self-Concept. Assessment of the comparative effects of the instructional pro-grams upon the self-concept of children s accomplished by the Administration ofthe Pictorial Self-Concept Scale (gra:1,es 1 through 4) and the Piers-Harris Children'sSelf-Concept Scale (grades 5 and 6). Both instruments were based upon the theoreticaldefinition of self-concept proposed by Jersild. (1952)
The Pictorial Self-Concept Scale developed by Bolea, Felker and Barnes(1971) consists of 50 cartoon-like picture cards (Appendix A-1). The children sortthe cards into one Of three piles (distinguished by three larger, differentlycolored background sheets), according to whether the figure designated by a star islike him/her, sometimes like him/her, or not like him/her at all. Cards on which thecegtra gure is a female are used with girls and cards on which the central figure is ama are used with boys. A split-half relillbility of .85 with 1,813 subjects isreported by the developers. In addition, they cite six studies which provideevidence of the validity of the instrument, one of which is g correlation between
scores on their instrument and the Piers-Harris instrument (r = .42', N = 63elementary pupils, significant at less than .01 level).
The Piers-Harris Children's Self-Concept Scale (Appendix A-2) was foundto.evidence internal consistency reliability, both split-half and a K-R 21, of .90-with two separate administrations to 6th grade pupils and one administration to 3rdgrade,pupils. Test-retest reliability after four months for pupils in grades 3, 5and 6 was reported to be .71 or higher. Five studies which support the validity ofthe instrument are reported in the test manual. (Piers and Harris, 1969)
In addition to these two instruments,, two of the items on thequestionnaire administered in May-1974 (Appendix D-2) to the parents of the openclassoom school asked for the parents' perception of their child's self-concept.The responses to these items were used in the assessment of this variable_
Attitude Toward School. Assesment of the comparative effects of the programs
11

upon the children's attitudes toward school was accomplished by the administrationof the "Faces" test (Appendix A73), an attitude inventory developed by personnelin the Division of Research of the Pennsylvania Department of Education andMillersville State College to evaluate the 1971 and 1972 "Summer Happenings."(Anttonen, 1972)
Based on a factor analysis of findings gathered with a longer form of theinstrument during the 1971 "Summer Happening" by George Brehman,.Division ofResearch, Bureau of Information Systems, PDE, the "Faces" instrument yields a totalscore and scores on three factors: (1) attitude toward school climate, (2) attitudetoward independent study and (3) attitude toward school learning. (Brehman, 1972)Analysis of the instrument basedon the June 1972 pretest of 256 students shows aninternal consistency reliability (coefficient alpha) of .82 for the total score.Analysis for the same sample shows coefficient alpha reliabilities for the factorsof: (1) attitude toward school climate--.80, (2) attitude toward independent study--.62 and (3) attitude toward school learning--.66. Both total scores and factorscores are included in the statistical analysis.
In addition to the "Faces" instrument, two other measures of attitudetoward school were used. The first of these was a record of days of attendance,with the expectation that more positive attitudes toward school would be reflectedin a lower rate of absence.
In addition, during'january 197a the students at Sporting Hill Schooland their parents were requested to complete questionnaires (Appendix D-1) withqueries concerning their feelings about the open classroom school. F rther, asecond parent questionnaire (Appendix D-2) was administered during Ma 1974.The responses were seen as being reflective of. attitude toward school.
Academic Achievement. The Stanford Achievement Test battery was used toassess the comparative attainment of basic skills. Split-half reliabilities forthe subtests included in'the battery for grades 1 through 6 are all .71 or higher
. with most of them being above .85.
Teacher Attitudes. Teacher attitudes were measured by Lindgren and Patton's"Opinnionnaire on Attitudes Toward Education." (Shaw and Wright, 1967) Essentially,the instrument measures teacher attitudes toward the desirability of usingauthoritarian methods and the desirability of subject-matter-centeredness versuslearner or child-centeredness. A corrected split-half reliability of'.82 has beenreported for the questionnaire (Appendix A-4), along withjqur studies supportingits validity.
-".%
The major reason for the use of this instrument was to attempt to discoverany change in teachers' attitudes which might be produced as a result of theirinvolvement in the program. It would appear that their perception of the valueand success of the innovative program would be reflected in their responses to thequestionnaires, thus providing further evidence for determining the program'seffectiveness.
Classroom' environment and practices. Assessment of this area was accomplishedthrough use of an observation rating scale (Appendix.' A-5) developed by theEducational Development Center, Inc., Newton, Massachusetts. (Walberg and Thomas,1972) Originally created for use as a research tool, the instrument has shown thatit can reliably discriminate between "traditional" and "open" classrooms.
The most apprppriate use of the instrument, according to its developers,
12
It fl 1,

is as a sutvey instrument in a school system' which is beginning,to experiment withopen education.' It is suggested that the instrument be used to gather baselinedata against which future data Collected with the instrument can be compared. This
-/suggestion was adhered to and.in this way the changes in classroom practices andenvironment in both schools were assessed.
A,f uxrther use of the instrument was to determine if there wasAdifferencein the 4egree-of "openness" between the classroom environment and practices of theopen cla'ssi"oom school and those of the kraditional school.
Data Gathering Procedures
Pretests on the "Faces" inventory and the self-concept instruments wereadministered during the latter part of May and the .first week of June 1972.' The"Faces" inventoryas administered in late May by district personnel for their ownevaluation purpoSeS, so rather than duplicate the testing, the results of their'administration Were used in this study.,
0The self-concept instrument for grades 1 through 4 (Pictorial Self-
Concept Scale) was agminiStered to all the.pupils in the study by, the principalinvestigator. In all'case4, administration took place ie the normal classroomenvironmen,;owith the regular classroom teacher assisting the principal investigator.
The self-concept-instrument for grades 5 and 6 (Piers-Harris Self-ConceptScale) was administered to their classes by the regular classroom teachers. The pre-test administration of both these instruments took place during the morning. of June1972 iu the comparison school and the morning of June 6 in the experimental school.
The teacher attitude opinionnaires were given at the time of the gelf-concept testing to the principals of the two schools in stamped, addressed envelopesfor distribution to the teachers, who completed and mailed them to the investigator.
The IQ scores on the Otis-Lennon Mental Ability which were used as thecovariate in the achievement segment of the analysis for grades 2 through 6 wereavailable in the district files. In bases where more than one scpremas available,the score received on theImost recent administration was used.
The posttest administration of the "Faces" inventory aZid the two self-concept instruments followed essentially the same procedures as those used duringpretesting. The only major difference was that formal Written directions foradministration and sample items were prepared and used with the "Faces" inventory,which were administered by the individual classroom teachers. These were administeredduring the week of 'May 20-24, 1974. The two self-concept instruments wereadministered in the same manner by the same people who had one the pretesting withthe experimental school tested during, the morning of May 2 , t974; and the comparisonschool during" the morning of May 23, 1974%
Once again, the teacher attitude questionnaires were given to the twoprincipals for distribution and were later completed and mailed by the individualteachers to thv investightor.
The Stanford Achievement Test was administered by the individual classroomteachers during the week of May 6-10, 1974. They were asked to adhere to thesuggestions given in the manual of administration directions prepared by the testpublished. All the teachers involved in the study had prior experience in theadministration of achievement test batteries.
1:3
,1 9 6 1
-'
The clhsiroom Observation data used to assess the comparative degree of, openness ofthe'two instructional programs was collected at periodic intervals
,:_,-, ,thrdighout the two school-years.- 'During the first, year, the first observation _was`perfsrmea,approxiMately a month &Ler the start
Durinstart of the school year and the remaining
lb. five at approximately'six-week intervals thereafter. the second .year, eielt,sets of observations were Performed at approximately equa intervals. Thus each ,-
classroom in the two schools, there was a series of 14 ervations,,,, - 9
"-- :Although the openness of the Sporting Hill building dia not allow the
clear-cut delineation of classroom groups that was provided by the,self-containedclassroom arrangement oftheWhite Oak building: it was possible during each of the, -- ,
14 observation days, to observe ,each teacher in the experimental school interacting -'
a,4-with a class-sized group. It was in this type of situation thatthe,observation,
rating scales were completed. '
t--- .,
The attendance data used as a measure of attitude toward school were secured ,'from the district's official attendance registers for the 1971-72 and the 1'1)73174
- school years., The parent and pupil questionnaire data were taken.Eromquestionnairesadministered by district .personnel during January.1973 and May 1974.
. :-
Statistical Analysis 6
The basic statistical method used to compare the first year results of thetwo programs was analysis of covariance. For the "Faces" inventory of attitudetoward school and the two self-concept instruments, the scords,on the pretests' ,
administered in June 1972 were used as covariates of'the scores on the same instrumentsadministeied as posttests in May 1974. Since it was not possible to adMiniiter theStanford Achievement Tesein June 1972, IQ scores on the Otis-Lennon Mental AbilityTest were used as a covariate on the. scores of the Stanford Achievement Tests,administered in May 1974. Otis-Lennon IQ scores for nearly all the students inthe sample were-available in the districts files. The days of attendance data used,as covariate and criterion were secured from the district's official attendtnceregisters:
In order to increase the accuracy of the covariance analyses performed, atechnique suggested by Andrew Porter '(1971, pp. 17-20) was utilized. ThiS technique,.in Porter's words, "substitutes an estimated true score covariable for the observedfallibly measufed covariable and then employs classical ANOVA procedures. (Porter,p. 17) Essentially, the procedure requires that individual covariate scores beadjusted onthe basis of the reliability of the covariate instrument,by use of thefollowing formula;
where
A
Ti = + p (X - ).3 xx, 13 J
A
Tij
is the "true score"
X 4 is the mean of the covariate
pxx is reliability of the covariate
Xij
is an observed score
14
1 " 2 1
14.

The following example illustrates 'the technique.' If the
reliability of a covariate is .90, the group mean is 100 and a pupil received anobserved score of 85 on the covariate, -then his/her "true score" would be derivedas follows:
A
Tij = 100 + .90 (85 100)
A
Tij
= 100 + X90 (-15)
A
Tij
= 100 - 13.5.
A
Tij = 86.5
The,effect of this procedure is to bring the extreme scores in a group.closer to the mean of the group, thereby reducing the variability of the group'sScores. Consequently, it is more difficult to obtain espurious Significantdifference when the covariance analysis is performed.. In this study, all covariatescores, with the exception of days of attendance, where the adjustment was notrelevant, were adjusted by the use of the above procedure.
Where possible, the analyses of covariance were performed in factorialdesigns using experimental treatment andograde level as the factors involved. Therewere several readons for this, the major one being economy. With subscale as well astotal scores being' analyzed the number of separatt analyses would have been weklover 100 had individualsubtcale-by-grade-level analyses been performed. Furthdr,had this large number of independent comparisons been performed, it is possible thatseveral would have been significant by chance alone, thus complicating interpretationof results. In addition, the ineormation gained concerning grade level differences,.although secondary to the primary comparison involved in the treatment factor, i.e.,open classroom program vs. traditional provam, is felt to be of value. Finally, itis possible, by the use of this design, to assess the statistical significance of thpinteraction of grade level and treatment program, further information felt"I of k-value.
The self-concept segment of the statistical analysis was perfdrmed by the useof a 2 x 2 factorial\for grades 5 and 6. Since thdre was no'pretest available for grade1, a simple analysis of variance wasused to compare the posttests of the two groupsat that level. ,
The analysis for the grades 1-4 consisted only of a total score comparisonbetween the two. treatments since the Pictorial Self-Concept Scale yields only a single,overall score. The analysis for grades 5 and 6 included a comparison of six subscalescores as well as a total score.
The attitude-toward-school sekment of the statistical analysis involved thecomparison of two measures, the primary one being the "Faces" inventory: The analysisof this instrument was performed through the use of a 2 x 4 factorial design withgrades S'to 6 included.
Again, there was no pretest data for grade 1, so a simple analysis of varianceon the posttests was performed. The grade 2 analysis was completed with a one-wayanalysis of covariance. For some reason, possibly a testing anomaly or a lackof understanding on the students' part, the internal consistency reliability of

,s-. ,
the "Faces- inventory obtained in the 1972 pretest with these grluns was unsatis actory;
so the administration of the instrument)could not validly be used as ovari. e.
Thus, data obtained ih a May 1973 testing with"the "Faces" inv_en f s used as a
covariate, in the analysis of this4grade's data: ,1S.,
/ .
The analysis of the 'Faces" instrument .for all grades involved comparisons
of three subscale scores and a total'score. -41.1
The second measure which was involved in the attitude-towatd-schOok segmentof the-Statistical analysis was days of attendance. Here again, grade 1 was analyzed
separately via- one-way analysis of covariance. Since only-one-year data were
available for this grade.and-two-Tyear data were available for the other five grades,
it was felt that it' should be analyzed independently. The other grades were
analyzed in two factorials, a 2 x 2 for grades 2 and 3 and a x 3 Tor grades 4-6.
In thetacademic aohieVement segment oflthe data analysis, factorial analyses
were not performed. Because grade-leVel scopes on the Stanford Achievement Tests
were used as criterion measures but 'were npt available for use as the covariate,. _
IQ scores were used. This resulted in a situation where the covariate IQ scoresfor all six,,grades were expressed on an identical scale, but the criterion gradelevel scares were expressed'on'a different scale for each of the six grades. This
meant that different grade levels could not be included ip.a factorial analysis of
covariance, ithout a transformation of either the IQ or Oade level scores to allowfor an accurate computation of the correlation between the covariate and criterion
measures:-
Such a transformation was felt to be impractical, so the achievement data,
with the exception of 1st grade, was analyzed on a grade-by-grade basis withanalysis off Covariance. Because IQ scores were not available for the 1st grade 1pupils in the study, tht 1st grade anal is consisted of simple analyses of variance
of the scores on the Stanford Achiev ent Tests: a
,:11 1st grade, the results on the six, subscales of the Primary'I Battery
were analyzed. In 2nd and 3rd grades the results of the seven subscales in thePrimary,II1Battery were analyzed, in 4th grade',the results of the eight subscales
it the Intermediate, I Partial Battery were analyzed and in 5th and 6th grades theresult. Wthe seven subscales in the Intermediate II Partial Battery were compared.
.
Problems caused resignation and transfer of teachers required that
some adjuS6igts be made in the original plan Or the analysis of the teacherattitudinal data. 'During the first year of thestall, both the experimental andcomparison schools lost one. teacher. During th' second year of the study, theexperimental school lost another and the compar son school lost two more, so that
at the end,of the second year of the study, the perimental school had four of the
six original teachers while the comparison school,had only three of six. Because of
this situation, it was felt best to limit the statistical analysis to that teacherattitudipal data gathered during the first year of the study. This data includ d
pretests completed in June 1972 and first-year posttests completed in May 1973. 4
This first-year data were analyzed in two ways. First, an analysis of
variance was,performed on the experimental teachers' scores from pre- to post- to.determine if there had been a change in their attitudes during the course of theyear. Second, an analysis of covariance was performed to compare the attitudes ofthe teachers in the experimental school with those of the teachers in the comparison
16

Teacher attitudinal data gathered at the 'end of the second year of thestudy was used for basically descriptive purfses.
..-
The classroom obs ervation data was analyzed, in two wad, 'First, a s..
repeated measures analysis of variance was performed on the results fo'r each of theschools separately in order to determine ,if the degree. of openness of .theirinstructional programs changed during-the course of the study. Second, the meansfOf the'14 observations for each of the individUal classrooms were computed and -used im an analysii of variance to determine if there was .i'signifjcant difference
, . in the degree of openness of the instructional programs of t4he*two schools., .
17
4.
1

C
4
1%!,
.
'are'in the same order as ehe questionA to be addressed in the study are listed on,
..Page 3. Beause of the large number of separate analyses petformed, the ,
,.
analysis of variance,and covariance source tables are not included in the text.They' are .shown ih Appendix B. 4.._,
.
A. Self-Concept . /
' 1. Grade,1.
, . .
Table 1 shows the summary infOrmation for the May 1974 administratpn of the`'Pictorial Self- Concept Scale. As the F-ratio included in the lilleb indicates,tha analysis of varianbe revealed no difference between the two ups.
- .CHAPTER III
- RESULTS
The format of th hapter is arranged so that the topics. of discussicin
liABLE
SUMMARY DATA FOR PICTORIALSW-CONCEPT- SGALE .
GRADE 1
Open
ClassroomSchool
TraditionalSchool
Number of Subjects,
Mean ;7.Standard DeviationF-Ratio
s.
, 17
62.525::40
A':40 13
24
63.226.36
2. Grades 2-4
TABLE 2SUMMARY DATARIIIRJICTORIAL SELF-CONCEPT SCALE
GRADES 2-4
Grade
Numberof
SubjectsPretestMean
Pretest. Standard ,,Posttest
Deviation Mean
Posttest
Standard 11/4
Deviation
AdjustedPosttestMean
OPEN CLASSROOM SCHOOL2 9 ,,--- 58.72 , 9.67 64.41 6.74 -63.643 14 L. 63.63 4.79 65.30 10.45 65.23 .
4 21 67.02 5.32 6*:61 12.06 '62.02
_,- r Y., 41'
TRADITIONAL SCHOOL2 18 59.69 6.15 ,63.32 11.50 k 62.693 16 65.68 ' 6.30 ' 64.46 11.99 ) 64:674 22 67.77 2.34 6,6.00 4.15
S66.52
F-Test ' ' F-RatioTreatment (Open vs.
4Traditional) 0.16
Grade (2 vs. 3 vs.'4) ( . 0.11Treatment xGrade' 0.83
18
a
kr.
,

k
Table 2 includes the summary information for the,prer- and posttest
administrations of the Pictorel-Self-Concept Scale and the F-ratiosgenerated by-the analysis of covariance.
0
As is evident, the analysis showed no significant difference between theopen classroom and tradition'al treatment groUps or among 2nd, 3rd and 4t4grades, and no significant interaction between treatment and grade level.
3 Graaes and 6`
TABLE 3SUMMARY DATA FOR TOTAL SCORE OF PIERS-HARRIS SELF-CONCEPT SCALE
. .
GRADES 5-6
Number Pretest Posttest, Adjustedof Pretest Standard Posttest Standard Posttest
Grade Subjects Mean ° Deviation Kean Deviation Mean.. , OPEN CLASSROOM gtiloOL
5 lg 54.28 11.79 61.44 12.37 62.736 . 25 58.96 10.25 61.12
TRADITIONAL SCHOOL
8.59'-,
59.49
5 23 57.35 10.68 58.57 10.27 57.946 25 54.28 12.94 53.72 13.74 55.00
F-Test F-RatioTreatMent (Open vs.,Traditional) 6.05*Grade (5 vs. 6) 2.69Treatment x Grade 0.01
*Significant beyond .05 level
Table 3 includes the summary information of the total score for the pre-and posttests administrations of the Piers-Harris Self-Coacept Scale.
The results of the total score analysis show that for the treatment comparison,. open classroom program vs. traditional program, there was a difference
favoring the open classroom program which was statistically significantbeyond the .05 level. Neither the interaction nor grade level analyses
. .showed significant differences.
EXamination of the pre- and posttest means indicate that the two traditionalgroups received essentially the same mean scores on the pre- and posttestadministrations while the two open classroom groupS, particularly the 5thgrade group, showed a positive gain over the two-year period between thepre- and posttest administrations.
Tables 4 through 9 list for the six subscales of the Piers-Harris Self-Concept Scale the summary information of the pre- and postteSt administrations.
4
19
' \0f 7
1

TABLE 4SUMMARY DATA FOR "BEHAVIOR" SUBSCALE OF PIERS4tAkRIS SELF - CONCEPT SCALE
GRADES 5-6
Grade
Numberof.'
Subjects
PretestPretest Standard Posttest
Mean Deviation MeanOPEN CLASSROOM SCHOOL
Posttest Adjusted'Standard Posttest
Deviation Mean
-5 18 13.28 2.97 15.61 .2.48 16.54
6 25 15.64 2.60 15.20 2.60 15.01
1:ZADITiONAL SCHOOL5 23 ' 15.4340° 2.33 15.48 2.63 15.39'6 25 14.64 3.25 14.80 3.06 . 15.08
F-Test
Treatment (Open vs. Traditional)Grade (5 vs. fi)
reatment x Grade
F-Ratio
1,13,
3.22
1.36
TABLE 5SUMMARY DATA FOR "INTELLECTUAL AND SCHOOL STATUS"
SUBSCALE OF PIERS-HARRIS SELF-CONCEPT SCALEGRADES 5-6
Numberof
Grade Subjects
PretestPretest Standard PosttestMean Deviation Mean
OPEIrCLASSROOM_ScH001,
PosttestStandardDeviation
AdjustPostt.6s
Mean
5 18 1043 3.40 13.06 3.56 13.676 25 112.92' 2.89 120.72 3.47 12.74
TRADILISZ4 SCHOOL5 23 11.09 2.98 12.35 '12.826 25 10.84 2.98 10.04
.3.27k4.23 10.65
F-TestTreatment (Open vs. Traditional)Grade (5 vs. 6)Tredtment x Gr'ade
F Ratio4.44*4.95*0.79
*Significant beyond .05 level
20
44

TABLE 6 ,
SUMMARY DATA FOR ,"PHYSICAL APPEARANCE AND ATTRIBUTES"SUBSCALE OF PIERS-HARRIS SELF-CONCEPT SCALE
GRADES 5-6
Number Pretest Posttest Adjusted
of Pretest Standard Posttest Standard Posttest
Grade Subjects Mean Deviation Mean Deviation Mean
\ OPEN CLASSROOM SCHOOL
5 18 6.50 1.92 8.39 2.55 8.-30
6 25 6.92 1.98
v
8.12 2.67 _ 7.78
TRADITIONAL SCHOOL5 23 6.30 2.23 7.44 2.68 7.46
6 25 5.68 2.97 . 5.80 3.71 6.19
F-Test F-Ratio
Treatment (Open vs. Traditional) 4.58*
Grade (5 vs. 6) 2.54
Treatment x Grade 0.44
*Significant beyond .05 level
TABLE 7SUMMARY DATA FOR "ANXIETY" SUBSCALEOF PIERS HARRIS SELF-CONCEPT SCALE
GRADES 5 -6'
Number Pretest Posttest Adjusted
of , Pretest Standard Posttest Standard Posttest
Grade Subjects Mean Deviation. Mean Deviation Mean
5 18
6 25
NOPI
23
25
OPEN CLASSROOM SCHOOL8.78 1.26 9.50 2.36. 9.64
9.64 1.63 10.08 1.87 9.68
TRADITIONAL SCHOOL8.91 2.07 8.87 2.36 8.93
8.60 2.00 8.48 . 2.55 8.73
F-Test J F-RatioTreatment (Open vs. Traditional) - 3.77
Grade (5 vs. 6)- 0.03
TFeatment x Grade 0.07'
21

TABLE '8
SUMMARY DATA FOR "POPULARITY" SUBSCALEOF PIERS-HARRIS SELF-CONCEPT SCALE
GRADES 5-6
Number Pretest Posttest Adjusted
of Pretest Standard Posttest Standard Posttest
Grade. Subjects Mean Deviation Mean - Deviation MeanOPEN CLASSROOM SCHOOL
5 18 6.72 2.56 -... 8.11 3.56 8.47
6 25 8.32 2.46 8.44 42:06 7.92
TRADITIONAL SCHOOL
5 23 7.30 1.92 8.09 3.07 8.13
6 25 6.96 3.02 6.60 3.54 6.83
F-Test F-Ratio
Treatment (Open vs Traditional) 1.50
Grade (5 vs. 6) 2.43
Treatment x Grade 0:40
TABLE 9
SUMMARY DATA FOR "HAPPINESS AND SATISFACTION"SUBSCALE OF PIERS-HARRIS SELF-CONCEPT SCALE
GRADES 5=6
Grade
Numberof
Subtes
Pretest
Pretest Standard Posttest
Mean Deviation Mean
PosttestStandard
Deviation
AdjustedPosttestMean
OPEN CLASSROOM SCHOOL18 1.02 7.06 2.10 7.24
6 25 7.48 1.01 7.88 1.27 7.76
TRADITIONAL SCHOOL
5 23 7.83 1.19 7.52 1.59 7.12
6 25 6.88 1.88 6.88 2.35 7.24
F-Test F-Ratio _
Treatment (Oioen vs. TraditiOnal) 0.93
'` Grade (5 vs. 6) 0.98--
Treatment x Grade 0.39
0
22
cd

Examination of the results of the subscale analyses indicate that there was
a significant treatment difference on two subscales, "Intellectual and
School Status" and "Physical Appearance and Attributes," and both favored
the open classroom program. Further,,the grade level difference on the
"Intellectual and School.Status" was significant, with the grade 5 groups
scoring higher than the grade 6 groups.
The responses, to the two items on the May 1974 paient questionnaire
co4cerning aspects of self-concept were essentially noncommittal, since
the majority of parents used the "undecided" category. In response to
the statement, "My child's self-image (how he feels about himself) has
improved because of the 'open classroom' school," 51 per cent of the
parents said they were "undecided," while 38 par cent said "yes" and
. 11 per cent said ".io." In response to the statement, "Because of theopen classroom' school, I notice that my child has more self-controlnow than before," 49 per cent of the parents said they were "undecided"
while 27 per cent said "yes" and 24 per cent said "no."
B. Attitude'Toward School1. Faces Inventory
a. Grade 1Table 10 presents the summary information for the May 1974 administration
of the "Faces" inventory in grade 1.
TABLE 10SITHHARY DATA FOR ANALYSIS OF "FACES" INVENTORY
GRADE 1
"School "Independent "School
Learning" Study" Climate"
Total Score ,Subscale Subscale Subscale
Open Open Open Open
Class- Tradi- Class- Tradi- Class- Tradi- Class- Tradi-
room tional room tional . room tional room tional
School School School .School School School School School
Number of 19 25 19 25 19 25 19 , 25.--
SubjectsMean 44.78 48.00 18.53 17.20 9.95 12.60 16.84 18.20
Standard 7.04 5.90 5.47 3.45 2.32 1.73 2.77 2.31
DeviationF-Ratio 2.70 0.97 18.88** 3.14
**Significant beyond .01 level
Of the four analyses completed, only one showed a statistically
significant difference. The difference, on the "Independent Study"
subscale, favored the traditional. program students.
b. Grade 2Table-11 shows the summary information for the pre- and posttestadministration of the "Faces" inventory and the F-ratios produced in
the analysis of covariance.
23
' n f
TABLE 11SUMMARY DATA FOR ANALYSIS OF "FACES" INVENTORY
GRADE 2
"School "Independent "School
Learning" Study" Climate"
Total Seore Subscale S bscgle Subscale
OpenClass-roomSchool
Tradi-tional
School
Open
Class-roomSchool
,
Traditional
School
Op n
Class-roomSchool
Tradi-tionalSchool
OpenClass-roomSchool
Tradi-
tional
School
-.umber of 15 20 15 20 15 20 15 20
SubjectsPretest 46.93 45.95 17.00 16.15 10.87 10.75 18.67 18.90
MeanPretest 4.54
-..3.85 2.10 2.82 1.60 1.71 1.35 1.37
StandardDeviationPosttest <1.53 47.30 15.13 16.40 10.33 12.25 16.07 18.15
X,anlt,
Posttest 3:.'96 6.89 2.36 ».54 1.72 2.10 1.28 2.64
StandardL,e..1.,ation
Adjusted 41.50 47.33 14.96 16.53 10.31 9 12,27 16.11 18.12
Posttest
MeanF-Ratic 8.51**' 1.51 9.02** 7.36*
Agignificant beyond .05 level**Significant beyond .01 level
Three of the four analyses performed at this grade le\lel res;Ilted insignificant differences favoring the traditional group. Orly the"School Learning" subscale analysis showed no significant differencebetween the two groups.
c. Grades 3-6Tables 12 through 15 present the summary information for the totalscore and three subscales of the "Faces" inventory in grades 3-6.
A
For none of these four analyses does the treatment comparison resultin a significant difference betteen the open classroom program andthe traditional-program. There is, however, a significant grade leveldifference shown in three of the four analyses.
Examination of the adIntted means of the groups involved suggests thatthe major reason for this difference is the relatively low adjustedmeans of the grade 3 'group in the traditional school. Further, it seemsapparent that the relatively low adjusted means for-this group were aresulftof the rather dramatic decrease in the mean score from pre- topost-1if this group. For example, the mean of the total score droppedfrom 50.41 to 40.7/ which was almost a full 10-pointdecline on ascale with a possible range of 60 and a standard deviation ofapproximately 6. While any attempt to expln this situation isspeculative, the possibility of a spuriously h pretest score
2

TABLE 12
SUMMARY DATA FOR TOTAL SCORE OF "FACES" INVENTORY
GRADES 3-6/
Grade
Numberof
SubjectsPretestMean
PretestStandard PosttestDeviation Mean
Posttest
StandardDeviation
,Adjusted
PosttestMean
OPEN CLASSROOM SCHOOL3 14 44.50 5.57 ..\ 40.93 6.55 40.394 20 41.45 4.76 \ 40..25 4.63 41.67
5 19 46.05. 5.17 41.47 6.01 39.93'
6 23 41.52 4.98 39.87 7.03 41.25
TRADITIONAL SCHOOL3 17 50.41 6.16 40.71 7.07 36.364 23 , 41.17 5.81 40.48 3.55 42.07
5 23 43.96 5.38 41.70 5.54 41.50
6 24 42.46 3.83 42.04 6.19 42.81
F-TestTreatment (Open vs. Traditional) 0.02
Grade (3 vs. 4 vs. 5 vs. 6) 3.58*
Treatment Grade 2.42
*Significant beyond .05 level
'TABLE 13
SUMMARY DATA FOR "SCHOOL LEARNING" SUBSCALEOF ,"FACES" INVENTORY
GRADES 3-6
.\
Grade
Numberof
SubjectsPretestMean
PretestStandardDeviation
PosttestMean
q PosttestStandardDeviation
AdjustedPosttestMean
OPEN, CLASSROOM SCHOOL3 14 16.71 3.56 13.93 3.15 12.324 20 11.90 2.29 11.85 2.76 12.89
5 19 14.74 2.96 11.68 2.77' 11.16
6 23 11.74 2.24 11.61 3.14 12.74
TRADITIONAL SCHOOL3 17 17.94 3.87 13.12
.3.41 10.83
4 23 12.83 2.86 11.26 1.91 11.79
5 23 13.30 2.79 11.96 2.46 12.23
6 24 13.35 2.10 12.92 3.22 13.17
F-Test F-RatioTreatment (Open vs. Traditional) 0.51
Grade (3 vs. 4 -s. 5 vs. 6) 2.39
Treatment x Grade 2.41
25
TABLE 14
SUMMARY DATA FOR "INDEPENDENT STUDY" SUBSCALEOF "FACES" INVENTORY
GRADES 3-6
.4"
Gradeof
lubiectsPretestMean
PretestStandard.. PosttestDeviation Mean
PosttestA
Standard
Deviation
Adju.Sted
PosttestMean
OPEN CLASSROOM SCHOOL3 14 10.43 1.74 10.57 : 2.14 11.424 20 12.40 1.39 11.40 2.46 11.28
19 11.95- 1.31 12.21 2.23 12.316 23 12.00 1.17 12.39 1.80 12.46
TRADITIONAL SCHOOL3 17 13.35 0.93 11.47 2.15 10.884 23 12.17 1.27 12.91 1.81 12.90
( 5 23 12.39 1.31 12.61 1.83 12.496 24 12.04 1.12 12.75 1.98, 12.81
b
F-Test F-RatioTreatment (Open vs:Traditional) 1.51Grade (3 vs. 4 vs. 5 vs. 6) 3.91**Treatment x Grade 1.84
**Significant beyond .01 level
TABLE 15SUMMARY DATA FOR "SCHOOL CLIMATE" SUBSCALE
OF "FACES" INVENTORYGRADES 3-6
Grade
Numberof
SubjectsPretestMean
PretestStandard PosttestDeviation Mean
PosttestStandard
Deviation
AdjustedPosttestMean
e OPEN CLASSROOM SCHOOL3 14 17.79 1.42 16.43 2.79 15.814 20. 17.10 1.59 17.00 1.89 16.815 19 19.21 1.23 17.58 2.09 16.0A6 .23 .17.91 1.76 15.87 3.11 15.18
TRADITIONAL SCHOOL3 17 18.88 1.50 16.12 v 2.71 14.834 23 16.04 1.97 16.30 2.01 16.775 23 18.00 1 2 17.13 2.42 16.386
...
24 16.96 1 7 16.38 2.65 16.28
F-Test F-RatioTreatment (Open ys. Traditional) 0.06Grade (3 vs. 4 vs. 5 vs. 6) 2.78*
Treatment x Grade 130
*Significant beyond .05 level
26

.f +04 1
ito.
for this group is difficult oidigsbunt,. especially since the actualposttest score for the groupil..approximately the same as the otherseven groups in the analy,Sis:'
2. Days of Attendancea. Grade 1
Table 16 shows that there was no significant difference between the daysof attendance of the two grade 1 groups. '
TABLE 16SUMMARY DATA FOR DAYS OF ATTENDANCE
GRADE 1
Open
ClassroomSchool
TraditionalSchool
I
Number of Subjects 13 19Pretest Mean 173.15 173.79Pretest Standard Deviation 4.02 3.08Posttest Mean 178.04 177.45Posttest Standard Deviation 2.02 2.05Adjusted Posttest Mean 178.06 177.43F-Ratio 0.69
b. Grades 2 and 3Table 17 shows that or grades 2 and 3 there was no significantdifference between t days of attendance of the open program andtraditional groups, none between the grades, and no significantinteraction between the treatment and grade factors.
TABLE 17SUMMARY DATA FOR DAYS OF ATTENDANCE
GRADES 2-3
4- Number Pretest Posttest Adjustedk
of Pretest Standard Posttest Standard PosttestGrade Subjects Mean Deviation Mean . Deviation Mean
OPEN CLASSROOM SCHOOL2 12 177.17 2.54 178.07 1.61 177.923 13 174.46 2.87 177.92 2.06 177.92
TRADITIONAL SCHOOL2 19 172.05 7.49 ,177.24 2.78 177.383 17 175.00 4.20 177.91 2.36 .177.88
F-Test F-RatioTreatment (Open vs. Traditional) :0.18
Grade (2 vs. 3) 0.00Treatment x Grade 0.18
c. Grades 4-6Table 18 presents the summary information for the days of attendanceanalysis in grades 4-6.
27
o o 5

43
TABLE 18
SUMMARY DATE, FOR DAYS OF ATTENDANCE
GRADES 4-6
t
Gade
Numberof
Subjects
PretestPretest Standard PosttestMean Deviation Mean
PosttestStandardDeviation
AdjustedPosttestMean
OPEN CLASSROOM SCHOOL'4 . 21 169.64 1 9.58 178.13, 1.6 '1.78.83
* . 5 18 , -,174.81 4.62 177.56 . 2.33 177.176 23 174.76 5.97 178.24 1.81 178.24
TRADITIONAL SCHOOL4 24 , 172.04 6,04 175.94 "3.84 , 176.115 24 173'.40 7,96 176.71 5.00 176.606 25 173.96 5.74 177.50 2.22 177.28
F-Test F-RatioTreatmen0:(Open vs. Traditional) 6.61*Grade (4 vs. 5 vs. 6) , 0.57Treatment x Grade 1.97
4*Significant beyond .05 level
The analysis of covariance indicates that there was a significantdifference between the two groups in their days of school attendance.This difference, significant beyond the 105 level, favored the openclassroom program.' V 4
3. Parent and Pupil Questionnairesa. First -Year Results
)Tables
19 and 20 give responses to selected questions from a parentquestionnaire and a pu il questionnaire designed by district personneland administered during January 1973 to the parents and pupils of theopen classroom school. (Only those items which address a general feelingor attitude toward school are included in these tables; the completequestionnaires are shown in Appendix D.)
TABLE 19RESPONSES TO SELECTED ITEMS FROMSPORTING HILL PARENT QUESTIONNAIRE*
Did ycitir child ever comment'that he did not want'to attend sc ool before this yerZYes 37.6 per cent No 62.4 per ent
Did your child ever comment that he did not want to attend school this school year?Yes 16.1 per cent No 83.9 per cent
My.child seems to like this school and enjoys the program.Yes 96.6 per cent No 9.0 per centNd ResponSe. 2.4 per cent
*Tabulation. based upon 122 returned questionnaires.
'28
3

TABLE 20RESPONSES TO SELECTED ITEMS FROM
SPORTING HILL PUPIL QUESTIONNAIRE* .
How do you compare Sporting Hill School this year to last year's school?
88 per cent a. This year is more interesting3 per cent b. This year is less. interesting
_der cent c. It is the samed. No response
How often did you feel as though you didn't want to come to school last year?
26 per cent *a. NeVei41 per cent b. Sometimes19 per cent c. Often
13 per cent d. Always1 per cent e. No response
How often did you feel as though you didn't want to come to school this year?
70 per cent a. Never 5 per cent c. Often20 per cent b. Sometimes 5 per cent d. Always
*The tabulation of responses was based'upon completed questionnaires from 133 pupilsin grades 1 thiough 6.
The tabulation of the items in the two tables indicate that 88 per centof the pupils in the'open classroom school find the school more interesting thantheir school of the previous year. The responses of the parents reinforce this, as96.6 per cent of the parents indicate that their children like the school and enjoythe program.
Further, both the parent and pupil responses to the items concerning'desire'to attend school indicate that the children's feelings toward attend-ing school improved after the introduction of the open classroom program intheir school.
The percentage of parents who said their children did not want to attendschool declined from 37.6 per cent for past years to 16.1 per cent in thefirst .year of the program, a drop of 21.5 per cent.
The pupil responses indicate this change indieeling even more strongly. Thepercentage of children who indicated"they never felt likenot attendingschool increased from 27 per cent to 70 per cent. The percentage of
4 children who often or always felt that they did not want to attend schooldecreased from 32 per cent to 10 per cent.
.b. Second-Year ResultsTable 21 shows the responses of parents of pupils in the open classroomschool to selected items of a questionnaire administered near the end ofthe 1913-74 school year. (The complete questionnaire is shown in Appendix D.)
I 29
0
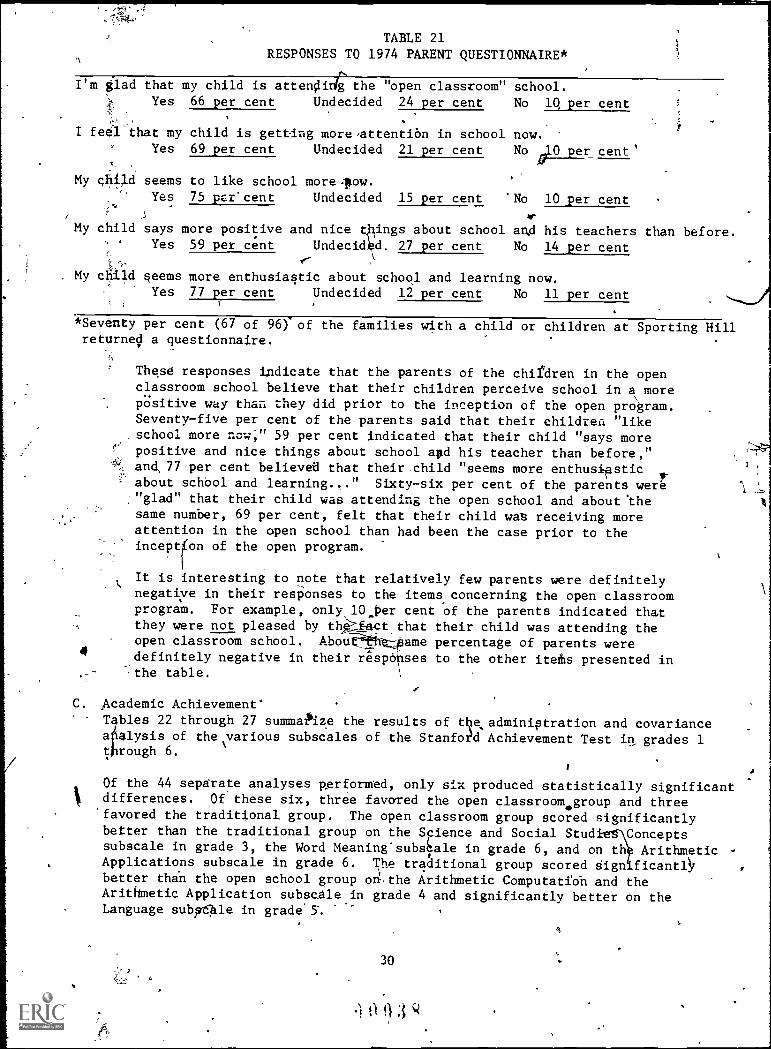
TABLE 21RESPONSES TO 1974 PARENT QUESTIONNAIRE*
I'm -glad that my child is attencli g the "open classroom" school.Yes 66 per cent Undecided 24 per cent No 10 per cent
I feel that my child is getting more,attention in school now.Yes 69 per cent Undecided 21 per cent No 44_per cent'
A
My child seems to like school more.wow.Yes 75 par*cent Undecided 15 per cent 'No 10 per cent
My child says more positive and nice t ings about school and his teachers than before.Yes 59 per cent Undecid d. 27 per cent No 14 per cent
. My child seems more enthusiastic about school and learning now.Yes 77 per cent Undecided 12 per cent No 11 per cent
*Seventy per cent (67 of 96)' of the families with a child or children at Sporting Hillreturned a questionnaire.
These responses indicate that the parents of the chifdren in the openclassroom school believe that their children perceive school in a more,positive way than they did prior to the inception of the open program.Seventy-five per cent of the parents said that their children "like
. school more now," 59 per cent indicated that their child "says morepositive and nice things about school altd his teacher than before,"and, 77 per cent believee that their,child "seems more enthusiasticabout school and learning.,." Sixty-six per cent of the parents were"glad" that their child was attending the open school and about thesame number, 69 per cent, felt that their child wat receiving moreattention in the open school than had been the case prior to theinception of the open program.
t
It is interesting to note that relatively few parents were definitelynegatiye in their responses to the items concerning the open classroomprogram. For example, only 10 per cent of the parents indicated thatthey were not pleased by thi-;factthat their child was attending theopen classroom school. AboUipame percentage of parents were
4definitely negative in their respOnses to the other items presented inthe table. \
C. Academic Achievement" .
T bles 22 through 27 summaPize the results of tkesadminiptration and covariancea alysis of thevarious subscales of the Stanfod Achievement Test in_ grades 1t rough 6.
i A
Of the 44 separate analyses performed, only six produced statistically significantdifferences. Of these six, three favored the open classroom.group and three'favored the traditional group. The open classroom group scored significantlybetter than the traditional group on the Science and Social Stud Conceptssubscale in grade 3, the Word Meaning'subs6le in grade 6, and on th Arithmetic -
Applications subscale in grade 6. The traditional group scored Sign ficantljbetter thin the open school group oxi,the Arithmetic Computatioh and theArithmetic Application subscalein grade 4 and significantly better on theLanguage subp4le in grade' 5.
30

TABLE 22
SUMMARY DATA FOR STANFORD ACHIEVEMENT TEST
GRADE 1
SUBSCALE
WORD READING
PARAGRAPH MEANING
VOCABULARY
SPELLING
WORD STUDY SKILLS
ARITHMETIC
Open
Open
Class-
Tradi-
Class-
Tradi-
room
tional
room
tional
School
School
School
School
19
25
19
25
-'''`4
Open
Class-
room
School
Tradi-
tional'-
School
Open
Class-
room
School
.,
Tradi-
tional
School
Open
Class-
room
School
Tradi-
tional
School
Open
Class-
room .-
School
Tradi-
tional
School
Number of
19
25
19
25
19
25
19
25
Subjects
Mean Grade
2.12
2.46
1.85
2.11
2:53
2.34
2.12
2.52
Level. Score
V -
Standard
.71
.51
0.86
0.45
0.70
.0.56
0.88
0.66
Deviation
F-Ratio
3.36
1.69
0.92
2.98'
2.64
iip 3.54
2.36
s,,
2.62
,----1,-..,
1.64
1.49
, 0.60
0.74

w
4
.
TABLE 23
a,
SUMMARY DATA FOR STANFORD ACHIEVEMENT TEST
GRADE 2
-
f
SUBSCALE
41.
SCIENCE AND
PARAGRAPH
SOCAL STUDIES
WORD STUDY
ARIfHMETIC
ARITHMETIC
WORD MEANING
MEANING
CONCEPTS
SPELLING
SKILLS
LANUTGE
COMPUTATION
CONCEPTS
Open
'
Open
Open
Open
Open
Open
Open
Open
Class-
Tradl-
room
0.onal,
School
School
Class-Tradi-
room
tional
School
School
Class-Tradi-
room
tional
School
School
Class-
room
School
Tradi-
tional
School
Class-Tradi-
room
tional
School
School
Class-
room
School
Tradi-,
tional
School
C2 ass -
Tradi-
room
tional
.School
School
Class-Tradi-
room
tional
School
School
Number
of Subjects
15
25
r15
25
15
25
15
25
15
25
15
25
15
25
15
25
Covariate
109.60
103.72
109.60
103.72'
109.60
101/72
109.60
103.72
109.60
103.72
109.60
103.72
109.60
103.72
109.60
103.72
(IQ) Mean
ea
Mean Grade
3.32
2.82
3.06
.!.73
3.37
3.10
3.12
2.93
3.95
3.78
3.21
3.35
2.65
2.28
3.21
2.73
Level Score
Adjusted'
3.36
3.95
3.07
3.44
2.58
.2.32
3.05
2.82
3.11
2.95
2.86
2.85
3.21
3.20
2.95
3.03
Mean
F-Ratio
0.53
0.00
0.00
0.09
0.51
2.42
2.04
0.91

C
TABLE 24
SUMMARY DATA FOR STANFORDACHIEVEMENT TEST
'GRADE 3
Number
of Subjects
Covariate
(IQ) Mean
Adjusted
Mean
F-Ratio
SCIENCE AND
PARAGRAPH
SOCIAL STUDIES
WORD MEANING
MEANING
CONCEPTS
Open
Open
Open
-
Class-
Tradi- Class-
Tradi-
Class-
Tradi-
room
tional
room
tional
room
tional
School
School
School
School
School
School
16
19
16
19
16
19
100.81
113.00
100.81
113.00
100.81
113.00
3.37
3.50
3.92
3.55
4.37
3.54
0.16
0.97
6.90*
SUBSCALB
WORD STUDY
SPELLING
'SKILLS
Open
Class-
room
School
Tradi-
tional
-School
Open
Class7
room
School
Tradi-
tional-
School
16
19
16
1'9
Or*
ARITHMETIC
LANGUAGE
COMPUTATION
ARITHMETIC
CONCEPTS
Open
Open
Open
Class- Tradi- 11Class-
Tradi-
Class-
Tradi-
room
tional
room
tional
room
tional
School
School
School
School
School
School
16
19
16
19
16
19
100.81
113.00
100.81
113.00
100:81
113.00
100.81' 113.00
100.81
113.00
.3.86
3.62
5.10
4.34
3.56
3.14
3.37
3.35
4.69
4.18
0.29
2.15
...
2.22
0.00
1.91
*Significant beydnd .05 level
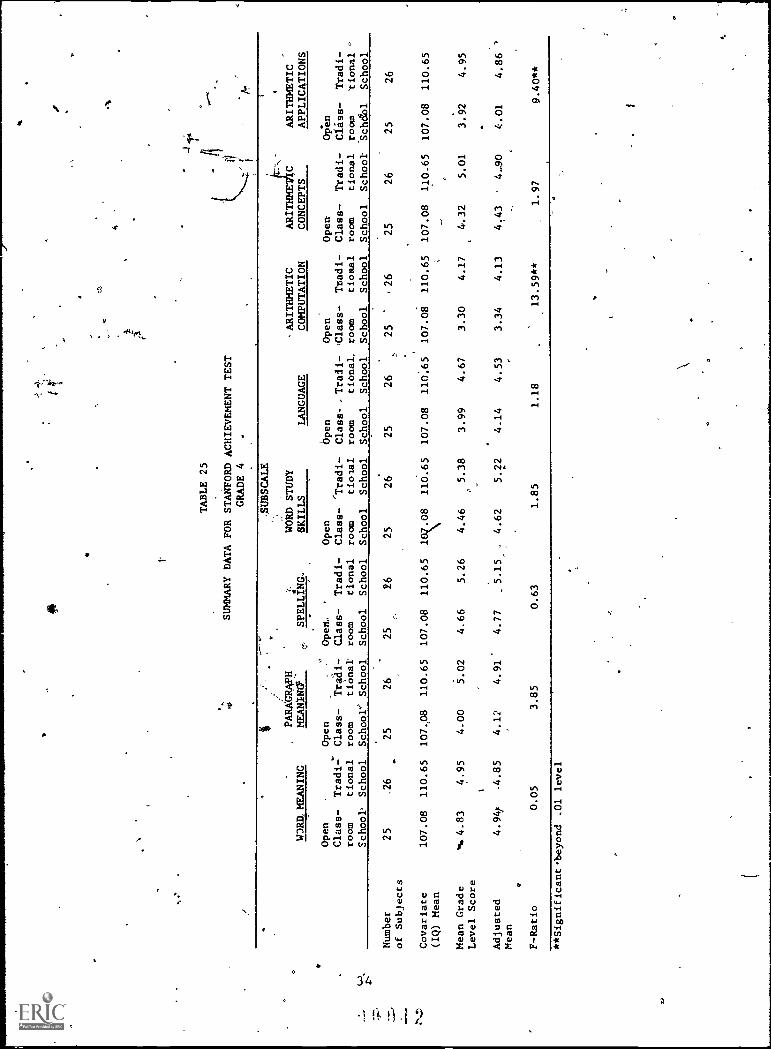
TABLE 25
SUMMARY DATA FOR STANFORD ACHIEVEMENT TEST
GRADE 4
.
at.
PARAGRAPH
WORD. MEANING
MEANING'"
Open
Class-
room
School
Tradi-
clonal
School
Open
Class-
Tradi-
room
clonal
School's School
SPELLING.
-'
Open,
Class-
Tradi-
room
tional
School
School
.,SUBSCALE
.-
WORD STUDY
SKILLS
Open
Class-
room
School
ciolal
School
LANGUAGE
open
Class- .
room
ti6nal,
School
School
-ARITHMETIC
ARITHMETV
ARITHMETIC
COMPUTATION
CONCEPTS
APPLICATIONS
Open
Class- Tradi-
room
clonal
School
School
Open
Class-
room
School
OPen
Tradi-
Class-
clonal
room
School
Schtika
Tradi-
tional
School
Number
of Subjects
Covariate
(IQ) Mean
Mean Grade
Level Score
Adjusted
Mean
F -Ratio
25
.26
25
26
25
26
25
26
25
26
25
-
,26
25
26
25
26
107.08
110.65
10748
110.65
107.08
110.65 1008 110.65
107.08
110.65
107.08
110.65
107.08
110.65
107.08
110.65
*1.4.83
4.95
4.00
5.02
4.66
5.26
4.46
5.38
3.99
4.12
4.91
4.77
.5.15
,4.62
5.22
4.14
0.05
3.85
0.63
1.85
4.941
4.85
1.18
4.67
3.30
4.17
4.32
5.01
4.53
3.34
4.13
4.43
'
4.90
13.59 **
1.97
3.92
4.01
4.95
4.86 '
9.40**
* *Significant.beyond .01 level

°
TABLE 2t
SUMMARY DATA FOR STANFORD ACHIEVEMENT TEST
GRADE 5
PARAGRAPH
WORD MEANING
MEANING
SPELLING--
SUBSCALE
.
ARITHMETIC
ARITHMETIC
-ARITHMETIC
LANGUAGE
COMPUTATION
CONCEPTS
APPLICATIONS
Open
Open
Open
Open
Open
Open
Open
Class-
Tradi-
Class-
Tradi-
Cliss
Tradi-
Class-
Tradi-
Class-
Tradi-
Class-
Tradi-
Tradi-
room
tional
room
tional
room
tional
room
'tional
room
tional
room
tional
room
tional
L.)
School
School
School
School
School
School
School
School
School
Schpol
School
School
School-
School
,
vi,
Number
22
30
22
30
22
30
22
30
22
30\)
22
30,
22
30
of Subjects
Covariate
101.82
105.97
101.82
105.97
101.82
105.97
101.82
105.97
101.82
105.97
101.82
105.97
101.82
105.97
-.:=...
(IQ) Mean
'
Cw
AD
..-
Mean Grade
5.72
6.21
5.35
5.59
5:26
6.71
4.60
5.64
4.53
4.87
5.30
5.72
5.20
5.64
Level Score
Adjusted
5.95
il
6.05
5.57
5.43
5.48
6.000
4.83
5.48
4.61
4.81
5.41
5.62
5.34
5.53
Mean
F -Ratio
0.14
0.30
.2.05
5.62*
0.66
0.86
0.58
*Significant beyond .05 level

1,0
TABLE 27
SUMMARY DATA FOR STANFORD ACHIEVEMENT TEST
GRADE 6
WORD MEANING
PARAGRAPH
MEANING
SPELLING
SUBSCALE.
LANGUAGE
ARITHMETIC
COMPUTATION
ARITHMETIC
CONCEPTS
ARITHMETIC
APPLICATIONS
Open
Class-
room
School
.
Tradl-
tional
School
Open
Class-
room
School
Tradt-
ttonal
School
Open
Class-
room
School
Tradi-
tional
School
Open
Class-
room
School
Tradi-
tional
School
Open
Class-
room
School
Trad i-
tional
School
Open
Class-
room
School
Tradi-
tional
School
Open
Class
room
School
Tradi-
tional
School
Numoer
of Subjects
Covariate
(IQ) Mean
Mean Grade
Level Score
Adjusted
Mean
F-Ratio
27
104.11
6.64
6.52
29
101.83
5.66
5.7/
5.55*
27
104.11
6.01
5.90
29
101.83
---) 5.98
6.07
0.35
27
104.11
6.79
. N..62
4
29
101.83
6:20
.
6.35
0.39
27
29
104.11
101.83
6.11
5.34
5.46,' 5.98
3:31
'N,4627
104.11
5.67
5.60
29
101.83
5.71
5.77
0.32
27
104.11
6.34
6.26
29
101.83
6.1.9
6.27
0.00
27
104.11
7.12
7.02
29
101.83
5.84
5.93
8.52**
*Significant
**Significant
beyond .05
beyond .01
level
level
4

Teacher Attitudes .
'Tables 28 and 29 summarize the analyses performed using the data from the 1972pretest scores and the 1973 posttest scores on the'"Opinionnaire on AttitudesToward Education." (As indicated previously, because of the loss of subjectsthis segment of the analysis was limited to first-year data.)
TABLE 28
EXPERIMENTAL TEACHER ATTITUDES* -
Number
of Mean StandardSubjects Score Deviation F-Ratio
Pretest 5 206---
Posttest 5 212
10.86
4.641,29
*One of the six teachers in the experimental school left during the 1972-73 schoolyear. Therefore, only the scores of the five remaining teachers were included inthis analysis.
?ABLE 29SUMMARY DATA FOR COMPARISON OF
RESULTS OF TEACHER ATTITUDE ANALYSIS*
Open ClassroomTeachers
TraditionalTeachers
Number of subjects 5
Pretest Mean 206.00 203.6Pretest Standard Deviation 10.86 8.93Posttest Mean 212.00 208.6Posttest Standard Deviation 4.64 6.91Adjusted Posttest Mean 211.83 208.77F-Ratio 0.62
*Both the open classroom and traditional schools had a teacher resign during the1972-7 school year. Thus, this comparison was made using the scores of the fiveremaiding teachers in each school.
As Table 28 shoys, there was no statistically significant difference between themean pretest sco'te and the mean 1973 posttest score of the experimental teachers.Further, a t-test (t = .69) comparing the 1972 pretest mean and the 1974 posttestmean of the four experimental teachers involved in both years of the studyshowed this difference to be nonsignificant.
Table 29 summarizes the results of the covariance comparing the attitude scoreof the open classroom teachers and the traditional teachers in the study.Again,, there was no significant difference between the two groups.
E. Classroom Observations
Table 30 presents the mean observation scores for the series of the 14 observationsconducted in each of the classrooms in the two schools during the course of thestudy. The accompanying graph is a visual representcion of the same data.
37
=15

180
170
160
150
140
130
120
110
100
90
GRAPH OF CLASSROOM OBSERVATION DATA
Open Clasnroom School
A
Traditional Classroom School
12
14
56
1972-71
78
810
11
12
13
14
OBSERVATION NUMBER
1973-74

TABLE 30SUMMARY OF CLASSROOM OBSERVATION DATA
ObservationNumber
TraditionalSchool
Open ClassroomSchool
1
2
3
4
5
6
up.:
98
120
116
131
140
142
157
128
154
148
141162
7 132 171
8 128 161
9 130 165
10 139 160
11 g 145 162
12 142 149
13 136 369
14 158 167
Overall -Mean 131 . 157
F-Ratio for Repeated 8.93** 30.63**
Measures ANOVA
**Slgnificant beyond .01 level
As is evident,, both instructional programs experienced changes in their degree
of openness during the course of the study. The repeated measures analyses ofvariance performed on the observational data (F-ratios are shown in Table 30)show that these changes were statistically significant in both schools.
The series of means and the graph indicate that the instructional programs inboth schools became more open over the course of the study, with much of thischange occurring during the first year of the study. The observations for the
second year indicate that both programs were relatively stable in their degreeof openness during the second year.
William Donny, who performed the series efeobservations in both schools, describesthem in the following way:
Observations of the experimental and control schoos throughout thestudy indicated that the schools varied from observation toobservation in their degree of methodological openness of convention-
ality.
The expehmental school chose to launch its new program during thefirst days of school with enthusiastic effort to operate successfully
the rather free, fluid, individualized open processes. Added to the
pressures of this ambitious beginning was the constant flow of visitors
that were hosted, and the considerable number of after school workhours needed to sustain this new demanding multiprocess educational
method. During intervals when new learning stations and procedureswere being installed, the open school faculty reverled at times tosimpler large group conventional methods and were rated accordingly.Large variations in degree of openness occurred from period to period
39
11

during the first year although an overall 'increase did occur. .
Perhaps due to publicity released about the experimental school as well
as the physical proximity of the two, the control school increasingly
adopted techniques of openness during most of the first year, but within
the framework of their established practices. The result was a fairly
consistent trend to greater openness with time but leveling off toward
the end of the first year. The differences between the two groups
would have been greater if the conventional school had not changed
markedly in degree of openness contrary to what is expected of a true
control.
As a result of these -trends tie positicTrrof the two schoolsbecame at times very similar witt.k regard to openness as measured
by the observation instruments However, near the end of the first
year, while the control school turned back to a more conventional
educational process, the experimental school appeared to have foundthe-degree of openness suited to its needs and began to operate t
the new program with confidence and aplomb. Observations carried
out in the succeeding year.tended, to clarify further this situation.
These observations indicated that the open school retained its status
with regard to degree of openness, while the conventional schoolmaintained a relatively more conventional methodological position.
The above described movement ,...g the comparison school toward onness and the
fluctuation in the degree of openness of the experimental school mean that,not surprisingly, the ideal comparison between strictly and continually
delineated "traditional" and "open" instructional programs was not possible.It suggests that the absence of any consistent diffeF?hce between the students
of the two schools might be at least partially explained as resulting fromthe fact that the two instructional programs were not really very different.
However, although the difference between the two programs was not as great
as might have been desire,: that difference was significant.
An anlysis of variance comparing the two schoolson the basis of the means
of the 14 observations for individual classrooms produced an F-ratio of
63.43 which is significant beyond the .61 level. (ANOVA source table is
shown in Appendix B.) So, even though the varying diffe ces between the
two instructional programs might have diluted any differ al effect which
instruction program "openness" might have exerted uppn students, the fact
remains that the two programs were rated as being significantly different
on the'instrument which quantified this variable. Because of this, it does
not seem probable that the absgme of student differences between the rwo
schools can be totally attributed to program similarity.
I4(),
mjoe,)is
C

CHASTER IV'
DISCUSSION SUMMARY, AND RECOMMENDATIONS
As stated in Chapter I, the purpose of this study was to gather evidencerelated to five basic questions. The first section of this chapter restates thesequestions and briefly discusses the findings and conclusions which relate-to them.The second section of the chapter is a general summary of the study and the thirdsection presents recommendations for future research.
Discussion of Findings
Question 1: Is there a significant difference between the self-concept of childreninvolved in an open classroom instructional program and those involvedin a traditional program?
The results of the self-concept segment of the study are somewhat mixed.The analyses of the Pictorial Self-Concept Scale for grades 1-4 indicate no realdifferences between the scores of the students of the two programs.
The analyses of the Piers-Harris Children's Self-Concept Scale for grades5 and 6, on the other hand, resulted in significant differences favoring the openclassroom students on total score and on the "Intellectual and School Status" and"Physical Appearance and Attributes" subscales. Thus, there is some evidence tosuggest that, at least for the students in the intermediate grades, involvementin the open classroom program resulted in a positive change in self-concept.
An alternative explanation for this difference favoring the open classroomstudents which must-be considered is that it was the result of teacher differences:'Since there was only one teacher per grade for each treatment, it is not possible tototally eliminate this alternative explanation. However, the fact that the study wasconducted over a two-year period weakens somewhat the argument for this explanationof the difference, since the students involved were exposed to more than one teacherduring the study. Further, an examination of the pre- and posttest means of thegroups in the three analyses which resulted in significant differences favoring theopen classroom program shows that while the two traditional groups and the two openclassroom groups scored at about the same level on the pretest administration, thetraditional groups remained at the same level while the open classroom groups showeda positive gain over the two years.
Thus, it appears reasonable to tentatively conclude that the open classroomtreatment exercised a positive, differential effect upon the grade 5 and 6 studentsin the area of self-concept.
Question 2: Is Fhere a significant difference between the attitudes toward schoolof children involved in an open classroom instructional program andthose involved in a traditional program?
The evidence relating to this question s also somewhat mixed. The analysesperformed with the "Faces" inventory data show tha in grade 1, the traditionalstudents scored significantly higher onthe "Independent Study" subscale than theoperikclassroom'students, that in grade 2 the traditional students scored significantlyhigher on the total score and on the "Independent Study" and "School Climate"subscales than the open classroom students, but that in the other analyses for thesegrades and in all the analyses Tor'grades 3-6. there were no significant treatmentdifferetices favoring either the open classroom or the traditional students.
41
0 /1 9

The days of attendance analyses for grade'l'and grades 2-3-showed nosignificant difference between the two programs. However, the analysis for grades4-6 resulted in a significant difference favoring the open classroom treatment.,
lie data collected with the pupil, and parent questionnaires at the open.classroom school indicates an improvement, in attitude toward school after theimplementatIbil of the open classroom program. A large majoriV88'per cent) ofthe students felt that the open program was more interesting t an the previOus oneand a large number of students (42,per cent) indicated a positive change-In theirdesire to attend school. The responses of parents on their questionnaires reinforcedthese student responses.
Overall, then, the results of the attitude-toward School segment of thestudents do not provide a clear-cut answer to question number two. However, theredoes appear to be sufficient evidence to,suggest that the open classroom programpositively influenced the attitudes toward school of the children involved.
Question 3: Is there a significant difference between the level of achievement inbasic skills of children involved in an open classroom instructional
\oe
- program and those involved in a traditional instructional program?
The data collected with the Stanford Achievement Tests indicates ratherclearly that there was no difference between the two instructional programs inrelation to their effect upon student achievement of basic skills. Only six of the44 separate analyses performed resulted in statistically significant differences.Of these six, three favored the traditional group'and three favored the open classroomgroup. ,So, it appears that the answer to the basic skills question is "no."
Question 4: Does teaching in an open classroom,cause a change in teacher attitudestoward child-centered policies and practices in education?
The results of the analysis of the-teacher attitudeopiniOnnaird indicatethat no significant change in the attitudes of the open classroom teachers occurredduring the course of the study. This finding is encouraging, since it indicatesthat actual, prolonged experience with open classroom procedures did not change thepositive attitudes the teachers held toward the value of policies and Practiceswhich are basic components of the open education philosophy. eQuestion 5: What are the extent of the changessin classroom envi.Knment and practices
which result ftom continued experience with the open classroom?
Analysis of the classroom observation data indicates, that there were,statistically, significant changes in the classroom environment and practices duringthe course of the study, particularly during the first year. The obtervation ratingscale results, teachers' comments, and observer's reactions indicate that, as wouldbe expected during the first year of a rather significant changeover, there werefluctuations in practices as the open classroom teachers searched for the mostappropriate and successful mode of operation. The second7year observation dataindicate that a relatively stable mode of operation was arrived at and maintained.Overall, the degree of openness increased from the beginning of the study to theend, indicating an apparent satisfaction with the success of the open classroom'program. %-
Summary
Because of the relatively limited scope of the study and the lack of anyobservable strong differential effects, the results of the Study do not provide any
42
! i) fl 5 0

conclusive or readily generalizable information about the relative eseffectiveness of
open classroom or traditional instructional programs. Nevertheless', the results are
encouraging from several standpoints.
First .of all, there are indications that in the affective areas of self-concept and attitude toward school the open classroom program did exert a positive
effect upon the students involved. This finding lends tentative support to.theclaims of the proponents of open education who believe that their mode of instruction
will have its more significant effects in'this area.
Also, the level of achievement of basic skill's by the students in the open
program was essentially the same as that of those in the traditional program. Since
there generally is more overt emphasis placed upon such attainment in traditionalinstructional programs than in open ms, this finding"Is revealing.
Finally, the observation and questionnaire data indicate that the openprogram is now running smoothly, that it is well accepted by students and parentsand that the teachers, have retained their initial enthusiasm for the program after
Continued experience with it. This is encouraging since it indicates that the
program has probably passed through the "bandwagon" phase, beyond which so many
innovative programs have not proceeded.
Over, I then, it appears that the study described herein, while not pro-
viding conclu e evidence concerning the relative effectiveness of the open or
traditional nstructional programs, indicates that the open classroom program wassuccessfully implemented and achieved some positive results.
Recommendations for Future Research
The experience gained in this study indicates that there are threeprimary needs' which can be met by future research and evaluation in the area of
open classroom education.
1 There is a,need for longitudinal studies in which the long-termeffects of exposure tQ open classroom education programs can be
assessed. The pupil characteristics which open education proponentshope to affect do not appear to be ones which can be significantlyaltered over a short period of time. Such attributes as self-concept,
attitude toward learning and level of cognitive functioningtheoretically are formed over a period of years and to expect achange in such fundamental characteristics in one or two years isprobably unrealistic. Studies which measure these variables overseveral years should provide a more sound evaluation of openeducation than the typical one- or two-year study.
2, There is also a strong need for more wide-ranging, large-scaleevaluations of the effects of open education. The flexibilityinherent in open educat4on instructional programs makesgeneralizing of results)from a specific classroom or school avery tenuous venture. However, while it is understandable that openptNograms will differ from one locale to another, it does not appearunreasonable to expect that fundamental common components' will be
preient in almost all open programs. Results of studies whichinclude several schools with Varied open programs would appearto be more generalizable, since,the components common to openprograms would be more reasonable causes of results than the host
43
4.

of specific characteristics which might affect the results of one a,,
program. a
3. There is a need for evaluation which focuses on variables which are notenormally assessed in program comparison studies. The proponents ofopen education believe that the major impact of their programs willbe reflected in changes in such areas as g1rents creativity,motivation, self-direction, social awareness, and higher-ordercognitive learning. However, for reasons such as nonexistence ofinstruments and constraints upon time and money, these variablesare often not included in major prograth comparison ttudies. If open.
clastrow education is to be thoroughly revaluated, studiesincorporating these variables will be=-Thitessary.
1
44

REFERENCES CITED
Anttonen, Ralph. "An Examination of Teacher and Student Ault* Changes as They
RelaLc to a Summer Happening Experience," Millersville, Pennsylvania: unpublishedmanuscript, Educational Development Center, Millersville State College, 1972.
Averch, Hakity,and others. How Effective is Schooling: A Critical Review atvSynthesis of Research Findings. 'Santa Monica, California: The Rand Corporov,1971.
Barth, Roland S. "Open Education: Assumptions About Children's Learning," Open
Education: The Informal Classroom, ed. Charles H. Rathbone. New York: Citation
Press, 1971, pp. 116-137.
Bolea, Angela S., Donald R. Felker and Margaret D. Barnes. "A Pictorial Self- onceptfor Children in K-4." Journal of Educational Measurement, VII (1971), 223-2 4.
Brehman, George. "Factor Analysis Findings for the Faces Inventory Used in the
Millersville Summer HappenAg Program." Unpublished manuscript, PennsylvaniaDepartment of Education; 1972.
Brunetti, Frank. Open Space: A Status Report. Stanford University, School Planning
Laborato6, 1971.
Campbell, Donald T. and Julian C. Stanley. Experimental and Quasi-Experimental
Designs for Research. Chicago: Rand McNally and Company, 1966.a
Featherstone, Joseph. Informal Schools in ritian Today: An-Introduction. NewroYork Citation Press, 1972.
Greenleaf, Warren T., and others. Schools for the 70's and Beyond: A Call to Action.
Washington, D.C.: National Education Association, 1971.
Halton County Board of Education, West Education Centre. Fi Report. Oakville,
Ontario: Evaluation Committee of the Innovators Council, 1969.
Heimgartner, Norman LJ A Comparative Stully of Self-Concept: Open Space Versus Self-
Contained Classroom, Research Study Number 4. Greely,9Colorado: University of
Northern Colorado, 1972.
Holt, John. What I Do On Monday. New York: E. P. Dutton and Company, 1970.
Jersild, A. T. In Search of Self. New York& Bureau of Publications, Teachers
College, Columbia University, 1952.
Katz, Lillian. Research on Open Education: Problems and Issues. Urbana, Illinois:
Eric Clearinghouse on Early Childhood Education, 1972.
Killough, Charles K. An Analysis of the Longitudinal Effects That a NongradedElementary Program, Conducted in an Open Spade School, Had on Cognitive Achievement
of Pupils. Houston University, Texas: Bureau of Educational Research and
Services, 1971.
71,
Kohler, Terence. "A Comparison of Open and Traditional Education: Conditions That
Promote Self-Concept," (Paper presented at annual meeting of American EducationalResearch Associatiori, February 25-Maich 1, 1973, New Orleans, Louisiana, 1-2)
45
n

1
Ruedi, Jane and Charles West. Pupil Self-Concept in an "Open" School and In a"Traditional" School, Research Report. Urbana, Illinois: University of Illinois,1972.
McRae, B. C. The Effect of Open-Area InstrutVion on Reading Achievement, ResearchReport 70-23. Vancouver: Board of School trdstees, Department of Research andSpecial Services, 1970.
Moodie, Allan G. A Survey of Reading Achievement in a Secondary School PoResearch Report 71-03. Vancouver: Board of School Trustees, Department ofPlanning and Evaluation, 1971.
Pidgeon, Dougl-hs'A. Informal Schools in Britain Today; Evaluation of Achievement.New York: Citation Press, 1972. -
Piers, Ellen V. and Dale B. Harris. Manual for the Piers-Harris Children's Self-Concept Scales. Nashville, Tennessee: Counselor Recordings ind Tests, 1969.
Postman, Neil and C. Weingartner eaching as a Subversive Activit . New York:Delacorte, 1969,4
Purkay, William W., William Graves and Mary Zenner. "S'elf-Perceptions of Pupilsin an Elementary School," The elementary School Journal, LXXI(December 1970); 166-171.
Rathbone, Charles. "The Open Classroom: Underlying Premises," e Urban Review,V (September 1971), 4-0.
Rogers, Vincent R. "English and American Primary Schools," Phi el Kappan, LI(October 1969), 71-75.
Rogers, Vincent R., and John Coe. -"Primary Education in England: An Interview withJohn Coe by VinLent R. Rogers," Phi Delta Kappan, LII (May 1971), 534-538.
Sackett, John. "A Comparison of Self-Concept Mid Achievement of Sixth Grade Studentsin an Open Space School, Self-Contr0..n.eL School and Departmentalized School,"Dissertation Abstracts (November 1971), 2372-A.
tolo,
tn.Shaw,- Marvin E. and Jack M. Wright. Scales for the Measurement ofAttitudes. NewYork: McGraw Hill, Inc., 1967, pp. 80-83.
Silberman, Charles. Crisis in the Classroom. New York: Vintage Books, 1970.
Stetz, Frank P. "Toward Better Assessment of Student Achievement in InformalEducational Settings." Paper presented at the American Educational ResearchAssociation Convention, April 1974, Chicago, Illinois.,
Tuckman, Bruce W., and others. "Evaluating the Open Classroom." Paper presented atthe American Educational Research Asqrciatien Convention, February 25-March 11973, New Orleans, Louisiana.
Walberg, Herbert J. and Susan C. Thomas. "Open Education: An Operational Definitionand Validation in Great Britian and United States." .American Educational ResearchJournal, IX (Spring 1972), 197-2081.
-1/
Warner, Jeannette.' Directory of Open Space Facilities in Pennsylvania. PennsylvaniaDepartment of Education: Bureau of General and Academic Education, 19/2.
Welsh, James. Pennsylvania Looks at its Schools: Educational Quality Assessment.Pennsylvania Department of Education: Bureau of Educational Quality Assessment,1971.
Wilson, F. S., T. Stuckey and R. Langevin. "Are Pupils in the Open Ilan School'Different?" The Journal of Educational Research, LXVI (N9yember 197A), 115-118.
r '
C
47
'141 5

APPENDICES
PAGE
APPNDIX A 49
Saiiile Items from Pictorial Self-Concept ,Scare 49The Piers - Harris Children's Self-Concept Scale i 50
-.!'Faces" ,,,Inventor . 52--.
Opinionnaire on Attitudes Toward Education 55.
Observation Rating Scale 59
APPENDIX B s 62
Source Tables for Self-ConceptAnabiges , 62Source Tables fdrAttitudeTtPli.Td tchool Analyses 66Source Tables for Basic Skills Analyses
APPENDIX C 90
APPENDIX D 92
APPENDIX E
-Parent Questionnaire Responses-1974
Correlations Between Covariate and Criterion for Analyses
90
7
Pup Response to Open Concept Evaluation-1973 95
Parent Response to Open Concept Evaluation-1973 92
of Covariance
5
d
88Source Tables for Classroom Observation Analyses 88
%
71Source Tables for Teacher Attitude Analyses
Pupil
97
Correlation Matrices--Grades 1-6 98
r , 4.
48

APPENDIX A-41'
Sample Items from Pictorial Self-Concept Scale-
\
. It.
1I
i3.

APPENDIX A-2
The Piers-Harris Children's Self-Concept Scale
Here are a set of statements. Some of.them are true'of you and so you willcircle the yes. Some are not true of you and so you will circle the no.Answer every question even if some are-hard to decide, but do not circleboth yes and no. Remember, circle the yea if the statement is generallylike you, or circle the no if the statement is generally not like you.There are no right or wrong answers. Only you can tell us how you feel.about yourself, so we' hope you will mark the way you really feel inside.
1. My classmates make fun of me yes no2. I am a happy person yes no3. It is haltfor me to make friends yes no4. I am often sad yes no5.. I am smart yes no6. I am shy yes no7. I get nervous when the teacher calls on me yes no8. My looks bother me yes no9. When I grow up, I will be an important person yes no10. I get worried ;then we have tests in school yes no11. I am unpopular .............. . . . ..... yes no12. I am well behaved ih school . . . T
"7 -1 yes no13. ,It io usually my fault when something goes wrong yes no14. I cause trouble to my family yes no15. I am strong . yes no16. I have good ideas yes no17. I am an important member- of my family yes no18. I usually want my own way yes no19. I am good at.making things w th my hands yes no20. I give up easily yes no21. I am good in my school work yes no22. I do many bad things . yes no23. I can draw well r yes no24. I am good in music yes no25. I behave badly at home yes no26. I am slow in finishing my school work yes no27. I am an important member of my class yes no28. I 'am nervous yes no29. I have pretty eyes yea no30. I can give a good report is front of the class yes no31. In school I am a dreamer yes no32. I pick on my brother(s) and sister(s) yes no33. My friends like my ideas yes no34.' I often get into trouble . yes no35. I am obedignt at home yes.no36. I am lucky yes no37. I worry a lot yes no38. My parents expect too much of me yes no39. I like being the way I am yes no40. I feel left out of things 'yes no
50
1

APPENDIX A -? (Continued)
41. I have nice hair yeaj_no42. I often volunteer in school
*ar no43. I wish I mere different yea no44. I sleep well at night yes 'no45. I hate school yep no,146. I am among the last to be chosen for games yes no7. I am sick a lot yea no
.-
48. I am often mean to other people yes no49'. My classmates in school think I have good ideas yes no50. I am unhappy yes no51. I have many friends . yes no52. I am cheerful yea no53. I .1 dumb about most things yes no54. I am good looking yea no55. I have lots of pep yes no56. I get into a lot of fights yes no57. I am popular with boys yes no58. People pick on me yes no59. My family is disappointed in me yes no60. I have a pleasant face yes no61. When I try to make something, everything seems to go wrong yea no62. I am picked on at home yes no63. I am a leader in games and sports .. -yes no64. I am clumsy yea no65. In games and sports, I watch instead of, pla' yes no66. I forget what I learn yes no67. I am easy to get along with . . yes no68. I lose my temper easily' , yes no69. I am popular with girls .' . . .1 .. : . . , yes no ..70. I am a gocctireader yes no '71. I would rather work. alone than with-a. 0itoup yes no72. I like my brother (sister) - yes ac73. I have a good figure yes no4. I am often afraid . yes no
75. I am always dropping or breaking things r , . . .. yes no76. I can be trusted yes no77. I am different from other people yes no78. I think bad thoughts yea no79. I cry easily . yes no80. I am a'good person yes no
51 ,
o 9

Age
Grade
ID Code
APPENDIX A-3
"FACES" Inventory
Name
School
Date
)1. This is how I feel when I come to school.
2. I feel like this when the teacher tells we to do something all by syselfwithout any help.
3. This is how I would feel if I coulego to school for the rest of and life.
4. I feel like this"when someone does not follow the rules.\
5. I feel like this when I work alone.
6. I feel like this when I have a lot of school work to do.
52

Appendix A-3 (Continued)
7. I feel like this about going to summer school.
8. I feel like this when I work on a project by myself.
>`\\\11
q. This is ow I feel about-going back to school after a vacation.
10. This is how I feel when I talk to my teachers:
11. I feel like this about studying alone.4
F
12. This is how I feel on days when I can't go to school.
13. I feel this way about teachers.
1.)
4
-4"
53

Appendix A-3 (Continued)
14. I feel this way about reading a book by myself.
15. This is how I would feel if we could have school on Saturday, too.
4
16. This is how I feel about sch6o Tstrules.
17. I feel this way when the .teacher asks me questions.
4
18. This is how I feel when it's time to go home from school.
19. I feel like this when I go to the media center (library).
20. This is how I feel about my school building.
6 h 2
."
5.4

APPENDIX AL4
Name School
DateOPINIONNAIRE ON ATTITUDES TOWARD EDUCATION
Below are a number of statements about which teachers may have differ-ent opinions. Please indicate what your opinion of each statement is bycircling the appropriate number after each statement.
0
>,.-.100adE4.1 09
E
Cn 6
wE
4
W1:3..-4'u4A
WWW0000
A
>NW.--4 W00 WC 00
0id 0
Ca A
1. Bi3ys and girls who are delinquent are, when all. is said and done, basically good
2. If boys and girls are to do an adequate job oflearning in school, their needs for love mustbe met
3. It is appropriate for teachers to require an addi-tional assignment from a pupil who misbehaves inclass
4. Haw a student feels about what he learns is asimportant as what he learns
5. The way to handle a pupil who tells lies is tothreaten to punish him
6. The high school who is not interested inhaving dates should be commended
7. Education has failed unless it has helped boys andgirls to understand and to express their ownfeclings and experiences
8. You should tell a child who masturbates that itleads to ruined health
9. The classroom experiences that are the mosthelpful to boys and girls are the ones wherein
q they can express themselves cj.eatively
10.E All children should be encouraged to aim at thehighest academic goals
11. The child who bites his nails should be shamed.
12. Children outgrow early emotional experiences asthey ddo shoes and clothes
13. What boys and girls become as adults is moreclosely related to the experiences they havewith each other than it is to mastery of
1 2 3 4 5
1 2 3 4 5
1 2 3 4 5
1 2 3 4 5
1 2 3 4 5
1 2 3 4 5
1 2 3 4 5
1 2 3 4 5
1 2 3 4 5
1 2 3 4 5
1 2 3 4 5
1 2 3 4 -"--5
specific subject matter 1 2 1 4 5
55

14_, It is more important for students to learn to worktogether cooperatively than it is fOr them tolearn how to compete
r-100
WWaiS
WWO000W
1
V .VVW
V
W00
m.9.4
a
>14)01'
CO WOWWm4Jt.
4-1n
1 2 3 4 5
15. Some pupils are just naturally stubborn . 1 2 3 4 5A
16. Students shourd4e.permitted to disagree withthe teacher ."'.1F;Ar
17. It is better for a girl to be shy and timid1than "boy crazy" 44
1 2 3 -4,\ 5
18. Boys and girls should learn that most of life's )problems have several possible solutions and notjust one "correct" one
1 2 3 4 5
19. The first signs of delinquency n a pupil shouldbe received by a tightening of iscipline andmore restrictions
1 2 3 4
1 2 3 4 5
20. The newer methods of education tend to standardiiechildren's behavior
1 2 3 4 5
21. Most boys and girls who present exteme cases of"problem behavior" are doing the best they can toget along with other people
1 2 3 4 5
22. An activity to be educationally valuable shouldtrain reasoning and memory in general
1 2 3 4 5
23. It is more important for a child to have faithoin himself than it is for him to be obedient.
. . 1 2 3 4 5
24. Being grouped according to ability damagesself-confidence of many boys and girls 1 2 3 (4 5
25. Criticism of children by teachers is moreeffective for obtaining the desired behavior
.
than criticism of children by others of theirawn age
1 2 3 4 5
s26. All questions a studentpsks should berecognized and consider&
1 2 ..3 4
27. The pupil who isn't making good grades shouldIbe told to study harder
1 2 3 4 5
28. Children should not be permitted to talkwithout the permission of the teacher 1 2 3 4 5
5)

29. A student who will not,do his work should behelped in every way possible
30. Boys and girls in the elementary school shouldbe promoted regardless of whether they havecompleted the work for their grade or not
31. The teacher should lower grades for misconductin class
32. A teacher should permit a great deal of latitudein the way he permits boys and girls to address him.
33. It is a good idea to tell a pupil that he can,succeed in any type of work if he works hard.
.
34. Students will tolerate errors and even occasionalinjustices in a teacher who, tkey feel, likesand understands them
35. A teacher should accept the deficiencies and short-.comings of a student, as well as his good points.
.
36. 'Each time a pupil lies his 76ftthment should beincreased
37. Boys and girls can learn proper discipline only Nif they are given sufficient freedom
38. If a teacher keeps school conditiots exactly thesame and gives all pupils an equal opportunityto respond, he has done all he can do
39. If a child constantly performs.for attention, theteacher should see to it that he gets no attention.
40. Dishonesty is a more serious personality character-istic han unsocialness
41. A great deal of misbehavior probled behaviorresults rom fear and guilt
42. The teac er's first responsibility in all casesof misco duct isto loCate and punish the offender.
43. It is bets r for boys and girls to talk about thethings that bother them than to try to forget them.
44. Most p ils need some of the natural meannesstaken out of them
57
i. a) . CU.-1CU .-4 V00 14 W14C W W W C W
14 14 1400 0 1
4..)4
,-400 09 +.4CO C C A A cn cz
1 2 3 4 5
1 2 3 4 5
1 2 3 ( 4 5
1 2 3 4 5
1 2 3 4 5
1 2 1 4 5
1 2 3 4 5
1 2 3 4 5
1 2 3 4 5
1 2 3 4 5
1 2 3 4
1 2 3 4 5
1 2 3 4 5
1 2 3' 4
1 2 3 4 5
1 2 3 4 54.

45. It is more important for boys and girls to be likedand accepted by their friends than it is for themto get along with their teachers
46. Teachers should answer chitbren's questions aboutsex frankly and, if possible, without show ofembarrassment
47. When a pupil obeys all the rules of the school, onecan be sure he is developing moral character. . . .
48. When a teacher is told something in confidence bya child, he should keep the matter just as confi-dential AS though it were entrusted to him by anadult
49. Since a person memorizes best during chil4hOod,that period should be regarded as a time to storeup facts for later use
50. Students should play a very active part in formu-lating the rules for the classroom and the school.
58
w > ww 4-I 411
14 00 $.0
00 0 000 o 0(0 M
4.1 4.1A M A
1' 2 3 4 5
1 2 3 4 5
1 2 3 4 5
1 2 3 4 5
1 2 3 4 5
1 2 3 4 5

APPENDIX A-5
ID School
1. Classroom
2. Teacher
3. - Observer
OBSERVATION RATING SCALE
4.1 ,1s1 w
aw w' 4J wu 0 1-$ 0 0 C.)O CP 41 +4 00 W 0o , (,, w w a 0 w
171 IV ..5d '4 w w o VIC/.14 0W 'c3 0 W W +40 W
4-4Ww 3,,-+ $ 8 co 411
1. Texts and materials'are supplied in class setsso that all children may have their own. 1 2 3 414
2. Each child has a space for his persdnal storageand the major part of the classroom is orginizedfor common use. 1 2 3 4
3. 'Materials are kept out of the way until theyare distributed or used under the teacher'sdirection. 1
3 4
4. Many different activities go on simultaneously. 1 2 3
5. Childrenlre expected to do their own workwithout getting-help from other children. 3 4
6. Manipulative materials are supplied in greatdiversity and range, with little replication. 1 2 3, 4
7. Day is divided in large block''s of timewithin which children,' with the teacher's help,determine their nWn routine.
8. Children work individually and in small group?at various activities.
1 2 3 4
1 2 3 4
9. Boo re supplied in diversity and profusion(including reference, children's literature). 1 2 3 4
10. Children are not supposed to move about theroom without asking permission. 1 2 3 '4'
11. Desks are arranged so that every child can seethe blackboard or teacher from his desk. 1 2 3 , 4
12. The environment includes materials developedby the teacher. 1 2. 3 4
59
7,
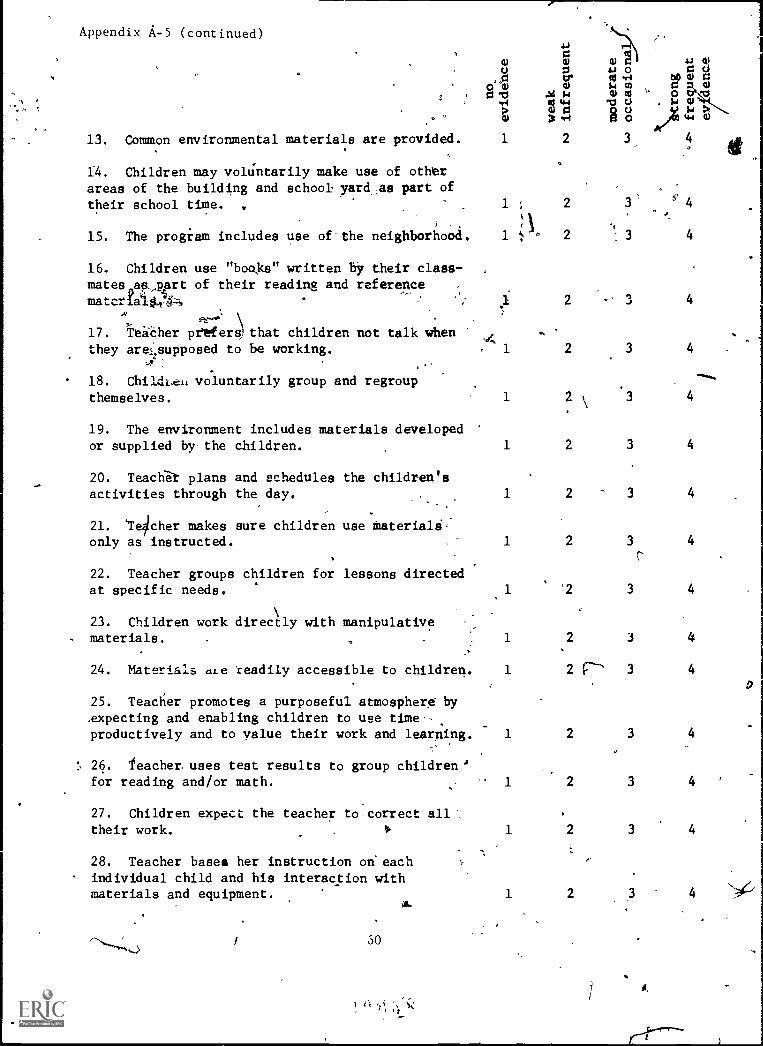
Appendix A-5 (continued)
S ,
'13. Common environmental materials are provided.
14. Children may voltintarily make use of other
areas of the building and school yard,as part oftheir school time. .
15. The progiam includes use of'the neighborhood.
16. Children use "boOs" written by their class-matesas,vrt of their reading and referencematcriail
17. YeiCher prefers, that children not talk whenthey aresupposed to be working.
18. Chilsii.eL, vol untarily group and regroup
themselves.
19. The environment includes materials developedor supplied by-the children.
20. Teacbe't plans and schedules the children's
activities through the day., .
21. I4cher makes sure children use materialsonly as instructed.
22. Teacher groups children for lessons directedat specific needs.
23. Children work directly with manipulativematerials. , :
24. Materials aLe readily accessible to children.
25. 'teacher promotes a purposeful atmosphere by
,expecting and enabling children to use time--
4J
00
o
W114-1
W
1
1 ;
0crW
...% $4
1 444, o21 V4
2
2
1 2
2
V.
1 2
1 2 \
1 2
1 2
1 2
1 2
1 2
1 2 r-
4
J 4
3 4
3 4
3 4
3 4
3 4
t"
3 4
3 4
3 4
productively and to value their work and learning. 1 2 3 4
26. leacher. uses test results to group children'for reading and/or math. - 1 2 3 4
27. Children expect the teacher to correct alltheir work. w 1 2 3 4
28. Teacher bases her instruction on eachindividual child and his interaction withmaterials and equipment.
30
1 k '
1 2 4

00Appendix A-5 (continued)
0
29. Teacher gives children tests to find out what
they know.
30. The emotional climate is warm and accepting.
31. The work children do is divided into subject
matter areas.
32. The teacher's lesions and assignments are
given to the class as a whole.
33. To,obtain diagnostic information, the teacherclosely observes the Specific work or concern of a
child and asks immediate, experiencebased questions.
34. Teacher bases her instruction on curriculumguides ,or text books for the grade level she
teaches.
35. Teacher keeps notes and writes individualhistories of each child's intellectual, emotional,physical development.
36. Teacher has children for a period of just one
year. .
37. The class operates within clear guidelinesmade explicit.
38. Teacher takes care of dealing with conflictsand dii3ruptive.behavior without involving 'the group.
39. Children's activities, products, and ideas arereflected abundantly about the classroom.
40. The teacher 'is in.
charge.
- 4 4
41. Before suggesting any extension or redirectionof activity, teacher gives diagnostic attention Cothe particular child and his particular activity.
42. The children spontaneously look at arid discuss
each other's work.<
43. Teacher\ uses. tests toevaluate children and rate
them in comparison to their peers.
44. Teacher uses the assistance of someone in asupportive, advisory capacity.
61
9
wU0Cl
44
0)
0wocrClp
0 4-1W 03 'r4
0w 0.1- om 44-1P 0W 00 U0 U0 o
4. w0 uWW 00 0 Cl0 04,0
P Cl -1-4
.4-4 P >CO 4-1 0.1
1 2 3 4
1 2 3 4
1 2 3 . 4
1 2 3
1 2 3
1 2 3 4
1 2 3 4
IP"
1 2 3 4
1 2 3
1 2 3 4
1 2 3 4.
/I( 2 3 4
1 2 .3 4
1 2 3 4
1 2 3 4
1 2 3 4
Appendix A-D (continued)
W
0 W0'0r4>w
0W
W.-SL W
2 =4Di 'r4
W
W000
(00
MCO
00o
41 W
0 00 Ce T1IA W *44., 1...
(0 4.1 (u ,
\45. Teacher tries to keep all children within her ,
)
sight so that she can make sure they are doing whatthey are supposed to do.
46. Teacher 'has helpful colleagues with whom shediscusses teaching.
47. Teacher keeps a collection of each child's workfor use in evaluating his development.
48.4""Teacher views evaluation as information toguide her instruction and provisioning for theckassroom.1
49. Academic achievement is the teacher's toppriority for.the children.
50. Children are,.deeply involved in what they aredoing.
62
! 7 0
a
1 2
1 2
1 2
1 2
2
1 2
4
3 4
3 4
3
3 4
3 4
3 4
a

ANALYSIS OF VARIANCE FORPICTORIAL SELF-CONCEPT SCALE
GRADE 1
Source SS MS DF
4Treatment 4.91 4.91 1 0.13Error . 1469.50 37.68 39
TOTAL 1474.41 40
ANALYSIS OF COVARIANCE FORPICTORIAL SELF - CONCEPT. SCALE
GRADES 2-4
Source SS . MSS DF
Treatment 15.94 4.5.94 1 0.16Grade 22.88 * -11.44 2 0.11Treatment x Grade 169.69 -84.85 ,- 2 , 0.83Within 9464.69' 101.77 93 ..--it
TOTAL 9763.20 98
ANALYSIS OF COVARIANCE FORTOTAL SCORE OF PIERS-HARRIS CHIL6RENTS.SELF-CONCEPT SCALE
GRADES 5-6
Source SS MS DF
Treatment 480.06 480.06 1 6.07 *`Grade 212.56 ik 212.56 1 2.69Treatment x Grade 0.38 iii.; 0.38 1 0.00Within 6807.06 79.15 86
TOTAL 7500.06 89'
63

F a
ANALYSIS OF COVARIANCE FOR "ANXIETY"SUBSCALE OF PIERS-HARRIS SELF-CONCEPT SCALE
GRADES 5 -6
Source SS MS DF
Treatment 15.19 15.19 1 3.77Grade 0.13 0.13 1 0.03Treatment x Grade 0.29 0.29 1 0.07Within 346.51 4.03 86
TOTAL 362.12 89
ANALYSIS OF COVARIANCE FOR "POPULARITY"SUBSCALE OF PIERS-HARRIS SELF-CONCEPT SCALE
GRADES 54
Source SS MS DF
TreatmentGrade .
Treatment x GradeWithin
TOTAL'
4
.
11.5018:673.07
659.78
''
lk
11.5018.673.077.67
4
1
1
1
86
89
1.50
2.43
014.0
,693.02
ANALYSIS OF- COVARIANCE FOR "HAPPINESSAND SATISFACTION" SUBSCALE OF PIERS-HARRIS SELF-CONCEPT SCALE
GRADES 5-6
Source SS MS DF
Treatment 2.19 2.19 1 0.93Grade 2.29 2.29 1 0.98Treatment x Grade 0.92 0.92 1 0.39Within 201.37 2.34 86
TOTAL 206.77
64

aANALYSIS OF COVARIANCE FOR
"BEHAVIOR" SUBSCALE OF PIERS-HARRIS CHILDREN'S SELF-CONCEPT SCALEGRADES 5-6
Sours SS MS DF
Treatment 6.43 6.43 1-
1.13Grade 18.32 18.32 1 3.22Treatment x Grade 7.72 7.72 1 . 1.36Within 489.52 5.69 86 -11
TOTAL 521.9 8,9 t
ANALYSIS OF COVARIANCE FOR "INTELLECTUAL AND SCHOOL STATUSSUBSCALE OF PIERS-HARRIS CHILDREX'S SELF-CONCEPT SCALE
GRADES 5-6
Source SS MS DF
.47.96 47.96Treatment 47 1 4.44*Grade 53.45 1 53.45 1 4.95*,'Treatment x ar-aEl- 8.55 8.55 1 0.79Within 928.84 10.80 86
TOTAL 1038.80 , 89
ANALYSIS OF COVARIANCE FOR "PHYSICAL APPEARANCEAND AFTRIBUTES" SUBSCALE OF PIERS-HARRIS CHILDREN'S SELF-CONCEPT SCALE
GRADES 5-6
Source SS MS DF
Treatment
GradeTreatmentWithin
.
x Grade `
TOTAL
;
32.06
17.743.09
601.62
32.06
17.74
3.097.00
1
1
1
86
89
4.58*
2.540.44
654.51
65

ANALYSIS OF VARIANCE FORTOTAL SCORE OF "FACES" INVENTORY
GRADE 1
Source SS MS BF
N,
Treatment 111.28 111.28 1 2.70Error 1729.16 41.17 42
TOTAL 1840.44 43
ANALYSIS OF VARIANCE FOR "SCHOOLLEARNING" SUBSCALE OF "FACES" INVENTORY
GRADE 1 4
Source SS MS DF
TreatmentError
(311.99 '18.99. 1
24.74 19.64 42
TOTAL 843.73 43
0.97
ANALYSIS OF VARIANCE FOR"INDEPENDENT STUDY" 'SUBSCALE OF "FACES" INVENTORY
GRADE 1
Source q SS MS DF
Treatment 75.96 75.96 1Error 168.95 4.02 42
TOTAL 244.91 43
.18.88**
66

ANALYSIS OF VARIANCE FOR
"SCHOOL CLIMATE" SUBSCALE OF "FACES" INVENTORYGRADE 1
Source SS MS
TreatmentError
TOTAL
19.91266.53
19.01
6.35-
286.44
DF F
1 3.1442
43
\:\ -K.
ANALYSIS OF COVARIANCE FOR TOTALSCORE OF "FACES" INVENTORY
GRADE 2
Source SS MS
Treatment 286.63 286.63Error 1077.97 33.69
TOTAL 1364.60
DF
1
32
33
8.51**
ANALYSIS OF COVARIANCE FOR "SCHOOLLEARNING" SUBSCALE OF "FACES" INVENTORY
GRADE 2\
Source SS MS DF
Treatmenterror
2Y.
440.06
TOTAL 460.79.
20.73
13.751 1.5132
33
67
9 11
,01

ANALYSIS OF COVARIANCE FOR "INDEPENDENTSTUDY" SUBSCALE OF "FACES" INVENTORY
GRADE 2
Source SS MS
Treatment 32.67 32.67
Etror 115.94 3.62
DF
1 9.02**32 *
TOTAL 4448.61 33
I
ANALYSIS OF COVARIANCE FOR "SCHOOL CLIHATE"
SUBSCALE OF "FACES" INVENTORYGRADE 2
Source SS MS DF
Treatment 34.31 34.31 1 7.36*
Error 149.18 4.66 32
TOTAL 183.49 331
ANALYSIS OF COVARIANCE FOR TOTAL-SCORE OF "FACES" INVENTORY
GRADES 3-6
Source SS b, MS DF
TreatmentGrade.,
TreatmentWithin
0.44 0.44 1 0.02
250.25 83.42 3 3.57*
x Grade 169.75 56.58 3 2.42
. 3599.88 . 23.38 154
TOTAL 4020.32 161
--68
".

.0"
ANALYSIS OF COVARIANCE FOR "SCHOOLLEARNING" SUBSCALE OF "FACES" INVENTORY
GRADES 3-6
Source SS MS DF.
Treatment Z 2.94 2.94 1 0.51Grade 41.52 13.84 3- , 2.39Treatment x Grade 42.04 14.01 - 3 2.42Within 892.90 5.79 154 ,
TOTAL 979.40eir.
161
4.9
ANALYSIS OF COVARIANCE FOR "INDEPENDENT STUDY"SUBSCALE OF "FACES" INVENTORY
GRADES 3-6
Source SS MS DF. F
TreatmentGradeTreatmentWithin
x 'Grad
(TOTAL 654.30
5.734.4.6
20.88
583.23
5.73 1 1.5114.82 3
e 3.91**6.96
3 1.843.79 154
161
ANALYSIS OF COVARIANCE FOR "SCHOOL CLIMATE"SUBSCALE OF "FACES" INVENTORY
GRADES 3-6
Source
TreatmentGrade '
I-Treatment x G _deWithin
TOTAL
,SS M$ i F
0.33 0.33 1 0.0643.38 14.46 3 2.78*20.35 6.78 3 1.:30
800.66 5.20 154
864.72 161
69
ANALYSIS OF COVARIANCEFOR DAYS .OF ATTENDANCE
GRADE 1 t
Source SS MS b DF
. .Treatment 3.01 3.01 1 , 0.69Error 127.08 -4.38 29
`4.
TOTAL 130.09 30
ANALYSIS OF COVARIANCE FOR DAYS OF ATTENDANCEGRADES 2-3
Source SS MS DF
Treatment 1.00 1.00 1 0.18Grade 0.00 MO 1 0.00Treatment x Grade 1.00 1.00 , A. 0.18Within 304.00 5.42 56
TOTAL 306.00 59
ANALYSIS OF COVARIANCE FOR DAYS OF ATTENDANCEGRADES 4-6
Source SS MS DF
Treatment 52.00 N......0..° 52.00 1, .6.61k,Grade 9.00 4.50 2 0.5,7,Treatment x Grade 31.00 15.50 2. '1.97.Within 1007.00 7.87 128
TOTAL 1099.00 133
70
11, I .,(

.ANALYSIS OF VARIANCE FOR "WORD READING"SUBSCALE OF STANFORD ACHIEVEMENT TEST
GRADE 1
Source a SS MS DF
Treatment 1.21 1.21 1 3.36Error y 15615 .36 42
TOTAL 16.36 43
ANALYSIS OF VARIANCE FOR "PARAGRAPH MEANING"SUBSCALE OF STANFO ACHIEVEMENT TEST
GRADE
Source SS MS DF
TreatmentError
-0.7318.21
0.73 1
0.43 42
TOTAL 18,.91 43
1.69
ANALYSIS OF VARIANCE FOR "VOCABULARY"SUBStALE'OF STANFORD ACHIEVEMENT TEST
GRADE 1
Source SS MS DF
Treatment 0.36 0.36 1
Error 16.30 0.38 42
TOTAL 16A6 43
171 11111-k

ANALYSIS OF VARIANCE FOR "SPELLING"SUBSCALE OF STANFORD ACHIEVEMENT TEST
GRADE 1
Sourceo SS MS DF
Treatment 1.73 1.73 1
Error 24.38 0.58 42
TOTAL 26.11 43
- 2.98
ANALYSIS OF VARIANCE FOR "WORD STUDY SKILLS"SUBSCALE OF STANFORD AGHT7EMENT TEST
. GRADE 1 '
Source SS MS DF
;
Treatment 8.81 8.81- 1 3.63Error - 102,02 2.43 42
TOTAL 110.83 43
ANALYSIS OF VARIANCE FOR "ARITHMETIC"SUBSCALE OF STANFORD A4CHIEVEMENT TEST
GRADE 1
Source SS MS DF
TreatmentError
TOTAL
.0.7319.75
20.48
0.730.47
1
42
43
1.56
72

ANALYSIS OF COVARIANCE FOR "WORD MEANING"SUBSCALE OF STANFORD ACHIEVEMENT TEST
GRADE 2".
Source SS MS R DF
TreatmentError
0.22 0.22 1 0.5315.65 0.42 37
TOTAL 15:87 38
ANALYSIS OF COVARIANCE FOR "PARAGRAPH MEANING"SUBSCATtE OF STANFORD ACHIEVEMENT TEST
GRADE 2
Source SS MS DF
TreatmentError 23.37 0.63
. .
37
TOTAL 23.37 ,A.
38''---0
0.00 0.00 1 000
ANALYSIS OF COVARIANCE FOR "SCIENCE AND SOCIAL STUDIES CONCEPTS"SUBSCALE OF STANFORD ACHIEVEMENT TEST
GRADE 2
Source SS MS DF
Treatment 0.00 0.00 1Error 16.49 0.45 37
TOTAL 16.49 38
0.00
73
ANALYSIS OF COVARIANCE FOR "SPELLING"SUBSCALE OF STANFORD ACHIEVEMENT` TEST
GRADE 2
Source SS MS
Treatment 0.06 0.06Error 23.36 0.63
a.DF
1 0.0937
TOTAL 23.42 Th 38\
ANALYSIS OF COVARIANCE FOR "WORD STUDY SKILLS"SUBSCALE OF STANFORD ACHIEVEMENT TEST
,GRADE 2
Source SS MS DF
TreatmentError
0.78
56.560.78
1.53
1
37
TOTAL 57.34 38
ANALYSISOF COVARIANCE FOR "LANGUAGE"SUBSCALE OF STANFORD ACHIEVEMENT TEST
GRADE 2
Source
TreatmentError
SS MS DF
1.2018.36
TOTAL 19.56
1.20
0.50
a
1 ). ,t 2..42
37
74
ANALYSIS OF COVARIANCE FOR "ARITHMETIC COMPUTATION"SUBSCALE OF STANFORD ACHIEVEMENT TEST.
GRADE 2
Source.
SS MS DF4
TreatmentError
TOTAL
0.57
10.260.57
0.281
37
38
2.42
10.834
ANALYSIS OF COVARIANCE FOR "ARITHMETIC CONCEPTS"SUBSCALE OF STANFORD ACHIEVEMENT TEST
GRADE 2
Source SS MS DF
Treatment 0.45 0%45 1. 0.91
Error 18.07 0.49' 37
TOTAL 18.52 38
ti
0
I
A,
75
K, 3ti

ANALYSIS OF COVARIANCE FOR "WORD MEANING"SUBSCALE OF STANFORD ACHIEVEMENT TEST
'GRADE 3
7
Source SS MS DF F
Treatment :0.11 0.11' 1 0.16Erfor 21.32 0.67 32
TOTAL .21.43 33
ANALYSIS OF COVARIANCE FOR "PARAGRAPH MEANING"SUBSCALE OF STANFORD ACHIEVEMENT TEST
GRADE 3
Source SS MS DF F
4Treatment . 0.94 0.94 1Error 31.02 0.97 32 0.97
I
TOTAL 31.96 33
ANALYSIS OF COVARIANCE FOR "SCIENCE AN SOCIAL STU1IES CONCEPTS"SUBSCALE OF STANFORD A EVEMENT TEST
GRADE 3
Source SS
vMS DF F
Treatment 4.71 4.71 . 1Error -# 21.85 ° 0.03 ^- 32
TOTAL 26.56\
33
6,90*
o
76
.1'

ANALYSIS OF COVARIANCE FOR "SPELLING"SUBSCALE OF STANFORD ACHIEVEMENT TEST
GRADE 3
Source SS MS DF
Treatment 0.35 0.35-Error 38.79 1.21
1
32
TOTAL 39.14 33
0:29
ANALYSIS OF COVARIANCE FOR "WORD STUDY SKILLS"SUBSCALE OF STANFORD ACHIEVEMENT TEST
GRADE 3
Source SS 'MS, DF
TreatmentError
3.98(
59.173.98
1:851
32
TOTAL 63.15 33
2.15
ANALYSIS OFCOVARIANCE FOR "LANGUAGE"SUBSCALE. OP STANFORD ACHIEVEMENT TEST
GRADE 3
Source SS MS DF
T,rea tment
Error
0
1.23 1.231' '2.12
17.72 0.55 32
:TOTAL 18.95 33
I-
77

F ANALYSIS OF COVARIANCE FOR "ARITHMETIC COMPUTATION"SUBSCALE OF STANFORD ACHIEVEMENT TEST
GRADE 3
Source SS MS \ DF
Treatment ------b:oo 0.00 1 0.00
Error 12.67 0.40 32
TOTAL 12.67 33
ANALYSIS OF COVARIANCE FOR "ARITHMETIC CONCEPTS"SUBSCALE OF STANFORD ACHIEVEMENT TEST
GRADE 3
Source SS MS DF
Treatment .1.80 1.80 1 1.91
Error 30.20 0.94 32
TOTAL 32.00.\ 33
vr
I
78
ii1;
`-

ANALYSIS OF COVARIANCE FOR "WORD MEANING"SUBSCALE OF STANFORD ACHIEVEMENT TEST
GRADE 4
Source MS DF
Treatment:Error
0.11 0.11 1 0.05106.21 2.21 48
TOTAL , 106.32 49
ANALYSIS0i COVARIANCE FOR "PARAGRAPH MEANING"SUBSCALE OF STANFORD ACHIEVEMENT TEST
GRADE 4
Source.`' -' SS MS DF
Treatment 7.67 7.67 1 3.85Error 95.54 1.99 48
TOTAL 103.21 49
1'
ANALYSIS OF COVARIANCE FOR "SPELLING"SUSCALE OF STANFORD AWEVENENT ThST
Source SS' DF
TreatmentError,
1.77
135.34
TOTAL : 137.11
1.77 12.82 48
49 eat
0.63
79,
!)
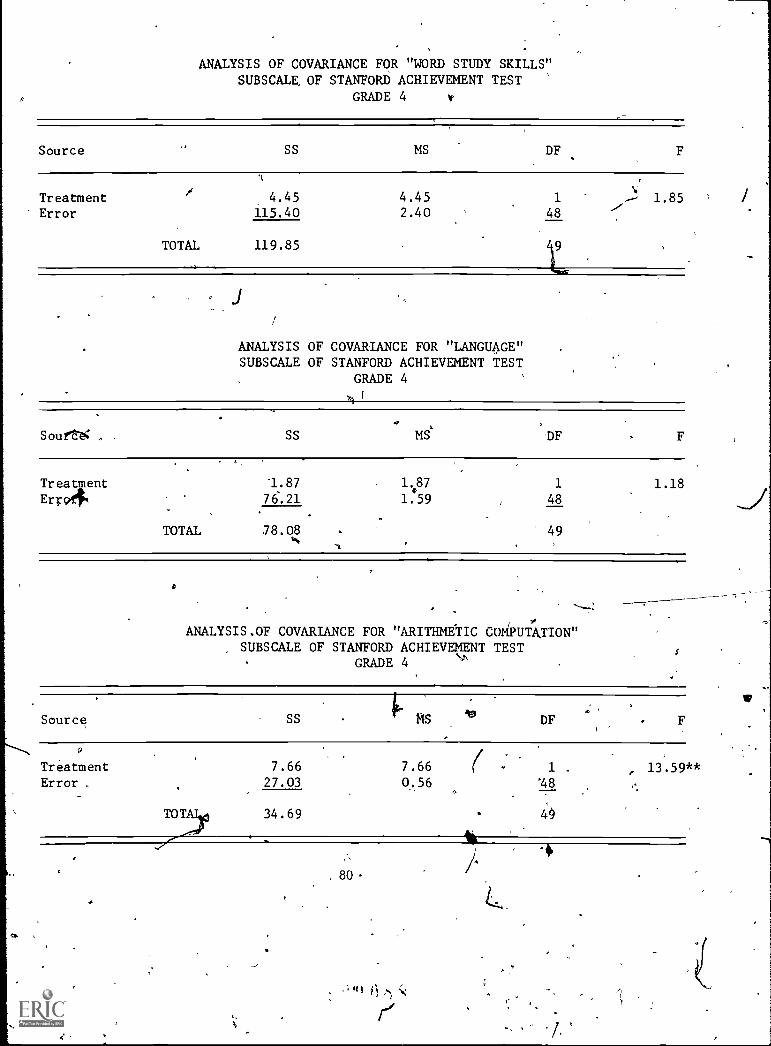
ANALYSIS OF COVARIANCE FOR "WORD STUDY SKILLS"SUBSCALE, OF STANFORD ACHIEVEMENT TEST
GRADE 4
Source SS MS DF F
Treatment/ 4.45 4.45 1 ,--- 1.85
Error 115.40 2.40 48.,
TOTAL 119.85 49 ,
ANALYSIS OF COVARIANCE FOR "LANGUAGE"SUBSCALE OF STANFORD ACHIEVEMENT TEST
GRADE 4
S011ftg
Ari
SS MS DF
Treatment '1.87 1.,87 1
Erroll( 76.21 1.59 48
TOTAL .78.08 49
1.18
ANALYSIS.OF COVARIANCE FOR "ARITHMETIC COMPUTATION"SUBSCALE OF STANFORD ACHIEVEMENT TEST
NI\GRADE 4
Sourc SS DF F
TreatmentError
7.6627.03
7.66 ( 1 . 13.59 **
0.56 *480
TOT' 34.69 49
80-

ANALYSIS-OF COVARIATE FOR "ARITHMETIC CONCEPTS"SUBSCALE OF STANFORD ACHIEVEMENT TEST
GRADE 4
Source SS. MS DF
we!
Treatment 2.70 2.70 1 1.97Error 65.80 , 1.37 48
TOTAL 68.504
'49
ANALYSIS OF COVARIANCE FOR "ARITHMETIC APPLICATIONS"SUBSCALE OF STANFORD ACHIEVEMENT TEST'
GRADE 4
Source SS DF
Treatment 8.89 8.89 1 9.40**Error
.. 45.40 0.95 48
PrilTAL 54.29 49
81

ANALYSIS OF COVARIANCE FOR "WORD MEANING"SUBSCALE OF STANFORD ACHIEVEMENT TEST
GRADE 5
Source SS FMS DF
TreatmentError
0.12 .12
44.27
TOTAL 44.39
90 3 49
50
0.14'
v
'ANALYSIS OFtCOVARIANCE FOR "PARAGRAPH MEANING"SUBSCALE OF STANFORD ACHIEVEMENT TEST
GRADE 5
Source
,, .
, V,SS . 'MS 4) DF F
,..ta
IN Treatment--Error
\zu
k0.28 -0.28' 1 0.30
45.57 0.93 49
45.85 50
4
a
,
ANALYSIS OF COVARIANCE FOW"§PELLING"SUBSCALE OF. STANFORD ACHIEVEMENT TEST
GRADE,5
Source
fiP°
TreatmentError
SS MS DF
e
/
3:36 3.3680.26 / 1.64ss
TOTAL 83.62d
1
49
50
2.05
as
7T,
4
4 u

ANALYSIS OF COVARIANCE FOR "LANGUAGE"SUBSCALE OF. STANFORD ACHIEVEMENT TEST
GRADE 5
Source SS MS . DF F
Treatment 5.25 5.25 1 5.62*Error 45.77 0.95 49
TOTAL 51.02 50
ANALYSIS OF COVARIANCE FOR "ARITHMETIC COMPUTATION"SUBSCALE OF STANFORD ACHIEVEMENT TEST
'GRADE 5
Source SS MS DF
Treatment- 0.47 0.47 1 0:6hError 34.73 0.71 49
TOTAL 35.19 50
ANALYSIS OP"COVARIANCE FOR "ARITHMETIC APPLICATIONS"SUBSCALE OF STANFORD ACHIEVEMENT TEST
GRADE 5
Source MS ,DF
TreatmentError
TOTAL
0.47
39.910.47
0.811
49
50
'0.58
40.38
83
J1OA
4
5)-

ANALYSIS OF COVARIANCE FOR "ARITHMETIC CONCEPTS"SUBSCALE OF STANFORD, ACHIEVEMENT TEST
GRADE 5
Iss DFSource
Treatment 0.46 0.46 0.86Error
s-
26.36 0.54 49
TOTAL 26.36 50
"tk
-
O
84
ti
O
a
P.
ss
4
4

.
.
,
.
ct,
.
.,
.-
'I
- .
c.
.
ANALYST OF COVARIANCE FOR "WORD MEANING"
SUBSCALE OFSTANFORDCWIEVEMENT TEST.
GRADE 6 "'"..
. - ,
.
.
..
.
'
.
1
.
Source.
) ,
SS MS DF, ( F
%
TreatmentError
.
.
7.93 7.0 175.78 -" 1.43 53
.
6
5..55*
.
TOTAL 81.71 54.
-
, .
.
.
.
.
.,.
ANALYSIS OF COVARIANCE FOR "PARAGRAPH MEANING"' SUBSCALE OF STANFORD ACHIEVEMENT TEST
GRADE 6.....
Source.
_ _ SS --A MS _ DF % F
.
,
Treatment.Error
Aiwa'
. '
0.50 ,''' 0050 176.58 1.44 53
0.35
,
7,'"
r
-----,..
TOTAL.
77.08 54,
..
4<
,
.
ANALYSIS OF COVARIANCE FOR "SPELLING"SUBSCALE OF STANFORD ACHIEVEMENT TEST
GRADE- 1
,
!,
.
-t.
4
Source.
,
SS MS - ° DF '
I
,
4
F
TreatmentError.
.
6,
0.98 .98 1. ,,. 133.20
i
2.51 53
.
.
y
--'0.39
.
(
. 54TOTAL 134.18
-I. 1Yl
1
.
,!'I
.
i
. .'. .
. *' '
.
7 v. .
5 \a
.
'
a .
°.
,
,t,
1..t,` sri 11 '.f 3
......
Ii
.
..
.
.
)
.

01,
ANALYSIS OF COVARIANCE F0R "LANGUAGE"SUBSCALE OF STANFORD ACHIEVEMENT TEST
GRADE 6-
Source SS MS DF F
A
Treatment 3.75 3.75 1. 3.31
Error 60.06 1.13. 53
TOTAL 63.81 54
ANALYSIS OF COVARIANCE FOR "ARITHMETIC COMPUTATIOO
/I
SUBSCALE OF STANFORD ACHIEVEMENT TESTGRADE 6
Source SS MS
Treatment 0.40 0.0 1
4Error 66.27 1.25 53
TOTAL 66.67 * 54
0.32
st
ANALYSIS OF COVARIANCE FOR "ARITHMETIC CONCEPTS"SUBSCALE OF STANFORD ACHIEVEMENT TEST
GRADE 6
Source SS - MS DF
Treatment 0.00 0.00 1 0.00Error 76.06 1.44 53
TOTAL 76.06 54
86 4
0
c
AN.
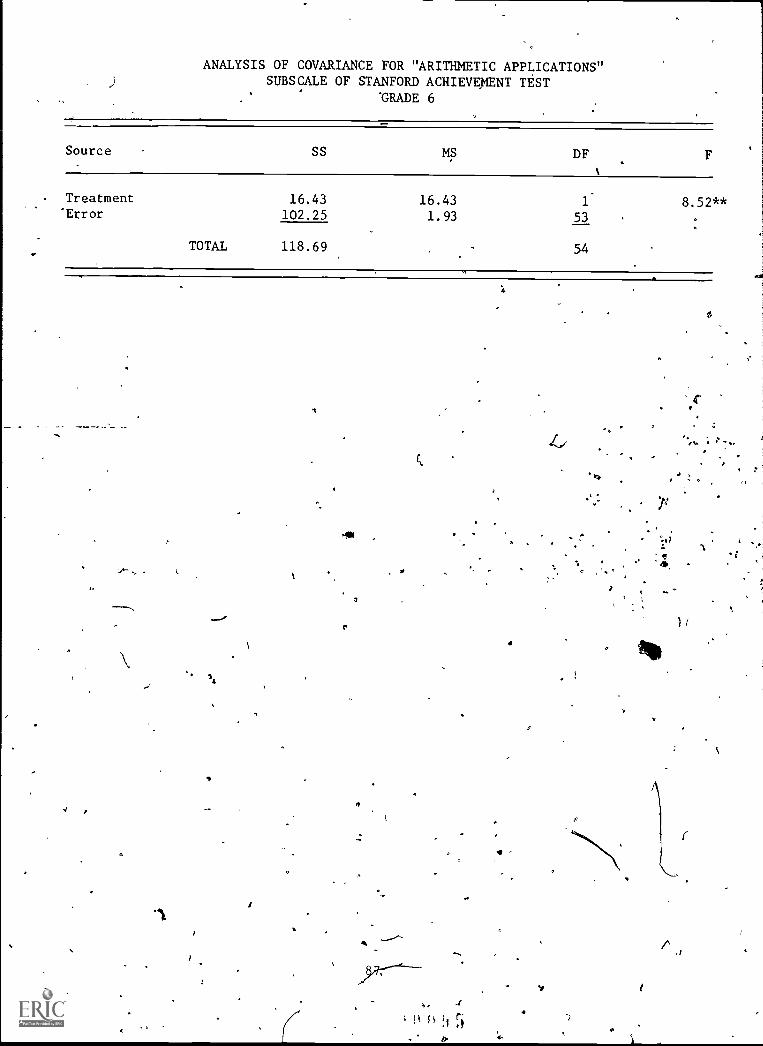
ANALYSIS OF COVARIANCE FOR "ARITHMETIC APPLICATIONS"SUBSCALE OF STANFORD ACHIEVEMENT TEST
'GRADE 6
Source SS MS DF F
Treatment 16.43 16.43 1- 8.52**'Error 102.25 1.93 53
TOTAL 118.69 54
,
A
w, 4:S CS !I
..
44
C
0
,rt. * "

ANA IS OF VARIANCE FOR PRE- AND POSTTESTCORES OF EXPERIMENTAL TEACHERS ON
"OPI IQNNAIRE ON ATTITUDES TOWARD EDUCATION"
Source SS MS DF F
Between 90.00Error 558.00
TOTAL 648.00
90.0069.75
1 1.29
ANALYSIS OF COVARIANCE FOR TEACHERSCORES ON "OPINIONNAIRE ON ATTITUDES TOWARD EDUCATION"
Sourcer
°
1
SS MS
BetweenError
23.10261.84
TOTAL 284.9
23.1037.41
DF4
1
7
8
F
0.62.
'REPEATED MEASURES ANALYSIS OFVARIANCE FOR OPEN CLASSROOM SCHOOL OBSERVATION DATA
Spurce', ,r3 SS 'MS DF
z,,
F
SubjectsTreatment(Observations)
Error
1,261
10,788
252.20 5
829.84 la 30.63**
1'761 27.09 t 65
TOE L 13:810 183
.4)
88
a
ti

...
t
)
4
0
\

REPEATED MEASURES ANALYSIS OFVARIANCE FOR COMPARISON SCHOOL CLASSROOM OBSERVATION DATA
Source SS MS DF
SubjectsTreatment
(Observations)Error' .
TOTAL
3,03812,360
6,917
607.60
950.76
106.41
5.13
65
83
8.93**
22,315
ANALYSIS OF VARIANCE-FOR
CLASSROOM OBSERVATION DATA
.
Source SS MS DF.
BetweenError
TOTAL
1950.78307.53
1950.7830.75
1
10
411
63.43**
2258.31 -
4
tfb
89
e
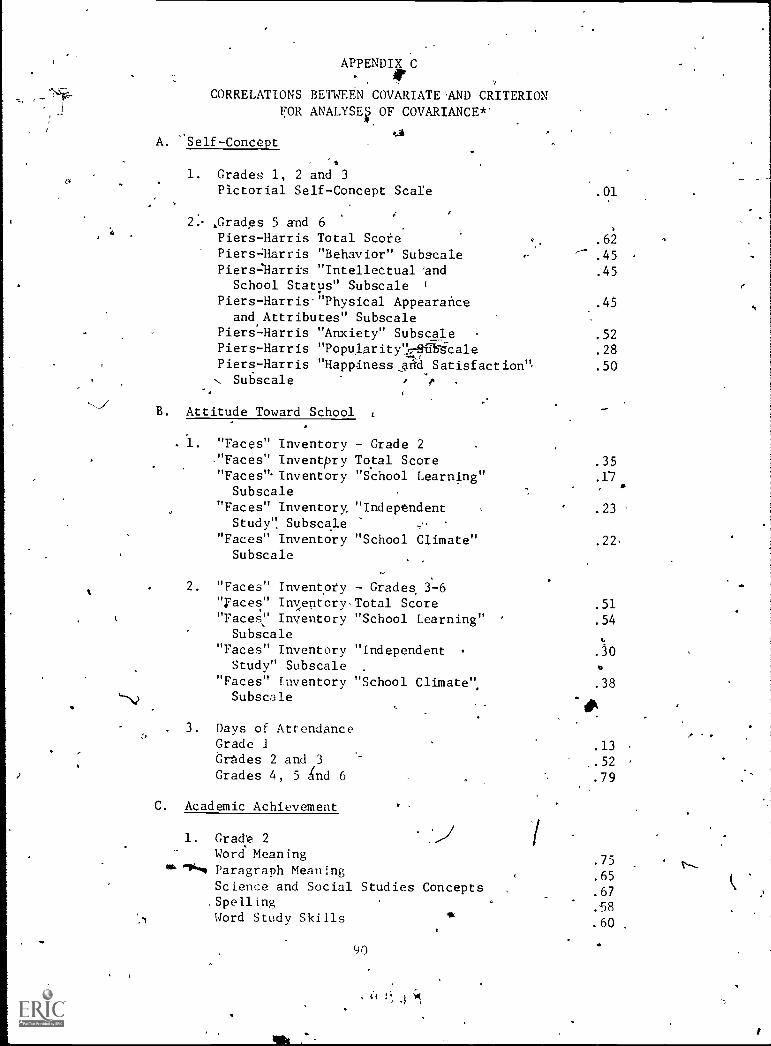
APPENDIX C
CORRELATIONS BETWEEN COVARIATE'AND CRITERIONFOR ANALYSES OF COVARIANCE*"
A. Self-Concept
1. Grades 1, 2 and 3Pictorial Self-Concept Scare
21. ,Grades 5 and 6Piers-Harris Total ScoiePiers4larris "Behavior" SubscalePiers2Harris "Intellectual 'and
School Status" SubscalePiers-Harris-"Physical Appearance
and, Attributes" SubscalePiers-Harris "Anxiety" SubscalePiers-Harris "Popu/arity",c6154-cale
Piers-Harris "Happiness and Satisfaction'',Subscale
B. Attitude Toward School
. 1. "Faces" Inventory"Faces" Inventpry"Faces'". Inventory
Subscale"Faces" InventoryStudy" Subscale
"Faces" InventorySubscale
- Grade 2Total Score"School Learning"
"Indeptndent,"
"School Climate"
2. "Faces" Inventory - Grades 3-6"Faces" Inventory-Total Score"Faces Inventory "School Learning"Subscale
"Faces" Inventory "IndependentStudy" Subscale
"Faces" Inventory "School Climate",Subscale
3. Days of AttendanceGrade lGrades 2 and 3Grades 4, 5 And 6
C. Academic Achievement
1. Grad 2
Word Meaning°Ili**. Paragraph Meaning
Science and Social Studies Concepts,SpellingWord Study Skills
90
c{,
1
.62
.45
.45
.45
.52
.28
.50
.35
.17
.23
.22-
.51
.54
.38
.13
..52
.79
.75
.65
.67
.58
.60
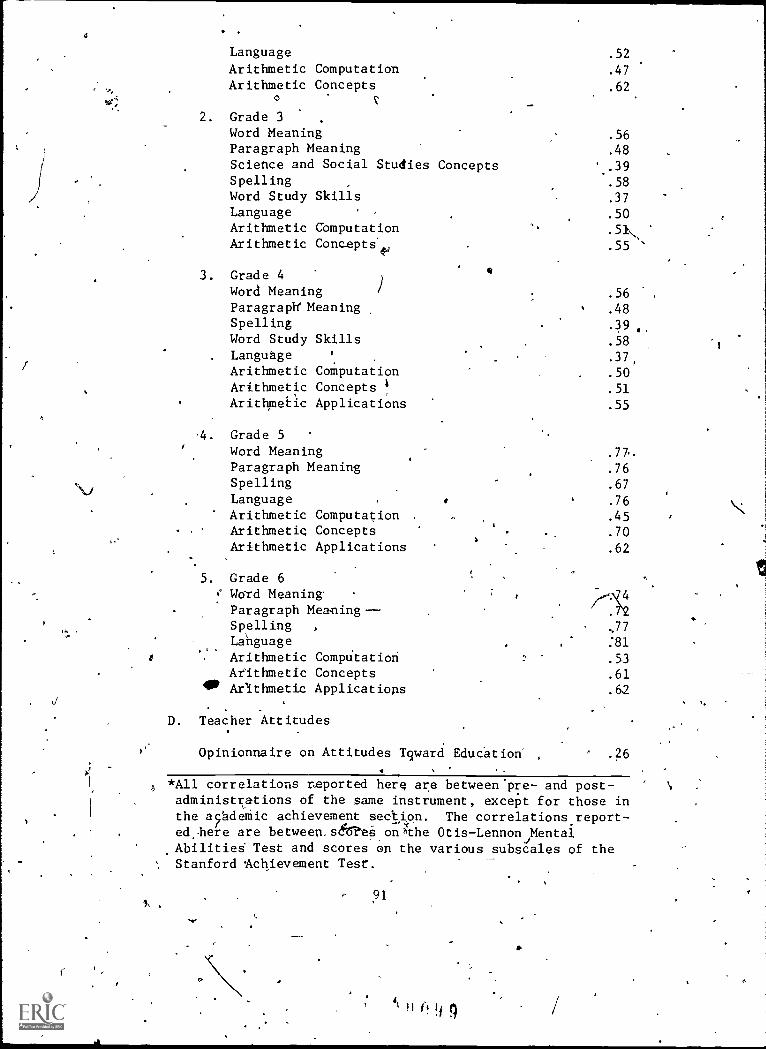
Language 52Arithmetic Computation .47
Arithmetic Concepts 62
2. Grade 3Word Meaning .56Paragraph Meaning .48
Science and Social Studies Concepts .39Spelling .58Word Study Skills .37
Language , .50Arithmetic ComputationArithmetic Concepts, .55
3. Grade 4 e
Word Meaning ) .56Paragraph' Meaning , .48Spelling . ..Word Study Skills 58
. Language 1 .37,.
Arithmetic Computation .50Arithmetic Concepts ! .51Arithmetic Applications .55
4. Grade 5Word MeaningParagraph MeaningSpellingLanguageArithmetic Computation ,
Arithmetic ConceptsArithmetic Applications
5. Grade 6Word MeaningParagraph Meaning--Spelling ,
LanguageArithmetic ComputationAtithmetic ConceptsArithmetic Applications
D. Teacher Attitudes
.76
.67
.76
.45
.70
.62
.77
:81
.53
.61
.62
Opinionnaire on Attitudes Tgward Education , .26
*All correlations reported here are between'pre- and post-administrations of the same instrument, except for those inthe apdernic achievement section. The correlations report-ed -here are between.seV?ee on;the Otis-Lennon Mental
.AbilitieS Test and scores on the various subscales of theStanford Achievement Test.
sr'
4tfi
.1

APPENDIX D
RESPONSES TO PARENT AND PUPIL QUESTIONNAIRES
Given at Sporting Hill School -,January 1973tr
Parent Response to Open Concept Evaluation
Participants - 122 parents returned the questionnaire
.1. My child seemed to adjust to the new "open" program.
60.5 per cent a. Immediately* 27.2 per cent b. After the first week.12.3 per cent q." Gradually.
a. Never
. ,
Did your child ever comment that he did not want to attendschool before this year?
37.6 per cent a: Yes 62.4 per cent b. No
3. Did your child ever comment that he did not want to attendschool this school year?
ft
16.1 per cent a. Yes 83.9 per cent b. No '
4. Are you pleased with the "open" Program?
85.3 per cent a. Yes11.9 ,per cent b. No
2%8 per 'centl c. No Response
5. Do'you feel the program is realistic?
83.5 per cent a. Yes ;
9.1 per cent b. No
7.4 per cent c. No Response
6. My Rylld seems to like this school and oys the.program.
',06.6 per cent a. Ye;,
.9 per cent b. No
,2.5 per Lend c. No Response
"7. Would You suggest having some of the activities of this school- incorporated into other schools of this district?
72.6 per cent a. Yes11;0 per cent b. 'No16.4 per cent c. 'NO Response
92A
it 1 ;',q)

a
. APPENDIX D(continued)
8. Does your child seem to accept the responsibility of workingon his own?
84.6 per cent a. Yes8.1 per cent b. No7.3 per cent c. No Response
9. Ddes too much independent time to do school work in a classroomor school hinder a child's academic progress?
22.1 per cent a. Yes61.4 per cent b. No16.5 per cent c. No Response
10: Is your child's interest at heart by the teachers as a result'of the "open" program at Sporting Hill?
76.7 per cent a. Yes6.0 per cent b. No
18.3 per cent c. No Response
11. Did you obtain satisfaction from the Progress Report procedureused to report the progress of your child?
75.6 per cent a: Yes17.1 per cent b. No7.3 per cent c. No'Response.
.
12. My child likes the following things about Sporting Hill:(Recorded are the number of instances the general topic wasmentioned.)
'Ns
44 a. "Movin-&-Groovin"30 b. the informal atmosphere of the school and staff members29 c. Teachers:24 d. "Everything:19 e. To be given the respdnsibility of doing independent work16 f. Carpet!11 g. Individualized instruction11- h. Learning stations9. i. Doing contracts in various subjects
13. '-My child dislikes Sporting Hill because of the gollowing reasons:
5 a. Lack of individual desks4 b. Hav,ing tubs to keep belongings in4 c. Student teachers leaving3 d. Bus problems3 e. Mr.'Balmer leaving
93
APPENDIX D(continued)
14. Please feel free to make any other comments about the "open"program as you have seen in this year at Sporting Hill.
15 a. A wonderful program! -{5 b. The program provides a better opportunity for social
adjustment and. opportunity to assume responsibilities.5 c. Indi.vidual differences are accepted.5 d. The staff works hard.5 e. The informal atmosphere is looked upon as a negative
,tharacteristic.5 f. aetter discipline ispfded.
15. Would you be willing to make your thoughts public about the"open" program?
42 a. Yes52 b. No
35 c. No Response
60 In favor of the program12 Not in-favor of the prbgram41 No Response6 Not sure at this time.
94 .
71'

APPENDIX D(continued)
Given at Sporting Hill School - January 1973
Pupil Response to Open Concept Evaluation
Participants -_133 pupils in Grades 1-6
1. How do you compare Sporting Hill School this year to last year'sschool?
88 per cent a.
3 per cent b.
8 per'cent c.
1 per cent di.
This'year-is more interestingThis year is less interestingIt is the sameNo response
2., Hpw often did you feel as though ybu didn't want to tome toschool this year?
26 per cent a. Never41 per cent b. Sometimes19 per cent c. Often13 per cent d. Always1 per cent e. No response
3. How often did you feel as though you didn't want to comeoschool this year?
70 per cent a. Never20 per cent b. Sometimes5 per tent c. Often
5 per cent d. Always
4. Do you, enjoy the freedom of this school?
97 per cent a. Yes" 3 per.cent b. No
5. Do you want this school to contiih4 e as it is now?
97 per cent a. Yes,. 3 per cent b. No,
6.- Do you think other schools in this school district should be likethis sphool?
77 per.cent a: Yes20 per dent b. No3 per cent c. No response
7. I like this school because:(Recorded are the number o -instances-5he general topic wasmentioned .5-.
68 a. "Movin-and-Groovin"
0 3
95
t
APPENDIX D.(continued)
.. . .
53 b. The freedom to move from area'to area in doing work.46 c. The teachers 'are nice.
'37 d. Carpet: /36 e. Doing contracts in various subjects and the free use
of time after the contracts are. completed.:
32 f. Individualized instruction and to be able to work at
one's own speed. - 1
21: g. In doing school work it still is fun.18 h. Math (individualized and contracted)16 i. Reading - Language Arts (individualized and contracted)14 j. Having many audio-visual materials avail-able for use.
8. I dislike this school because:(Recorded are the number of instances the &petal topic was mentioned.)
, A .
52 a: Nothing (Either the'word "nothing" was written orco
there was no response.) 4
23 b. Doot like carrying the tubs, and the tubs are notsubstantial.
.10 c. Sometimes too noisy9 d. Wbuid like to have own desk6' e. Bus problerhs-
f. Teachers leaving5 g. Dislike science5 h. Teachers leaving room. (All related to the head teacher
being, called out.),,.
9. Make any other suggestion or comment about this school you wish..0(Recorded are the number of instances e gerieral topic was
C---mentioned.),. .--,
8 a. "Movin-and-Groovin" should '. be longer.
7 b. Have more recesses or hat longer recesses.7' c. Favorable comments about; eachers or staff members6 d. We like it or We love,5 e. Would like to have bet tubs
4 f. Like the carpet'arTet ,,
4 g. Would like to have; owOesks3 h. Like ThIsday's.early0smissal3 i. Like contracts3 j. Wish they could at itt the hall.
, ,,
-a
1'
46
'4*

ti RESPONSES TO QUESTIONNAIRE ADMINISTERED /6 PARENTSOF SPORTING HILL STUDENTS INAY 1974*.
1. I'm glad that my child s attending the "open classroom" school.
4Yes 65.67 per cent U dee,ided 23.88 per cent No 10.44 per cent
2. ..I feel that my child is getting more attention in school now.
Ares 68.66 per cent Undecided, 20.90 pen cent No 10.45 per cent
. My child seems, to like school more now.
,Yes 75.38 per cent Undecided 15.38 per cent No 9.23 per cent
. My child says moresositile and'nice things about school and his teachersthan before.
Yes 58.73 per cent Undecided 26.98 per cent No 14.28 per cent
My child seems more enthusiastic about school and learningnow.
Yes 76.56 percent Undsecided 12.50 per cent No 10.94 per cent
0
6. My child's self-image (how he feels about himself) has improved because ofthe "open classroom" school.
.Yes 38.10 per cent Undecided 50.79 per cent No 11.11 per cent'
7. Oecause of the "open classroom" school, I notice that. My child has moreself - control than before.
Yes 26.98 per cent . Undecided 49.21 per cent ' No 23.81 per cent
*69.70 per cent (67. Of 96) of the families with a, child or children at,SportingHill returned a questionnaire.
f
11,
1.
) 97,
1
4
1%.
a-
'APPENDIX E
CORRELATION-MATRICES-0 ES, 1-6*
sP
With one exception, IQ scores, individual 1974 posttest scores,were used t com te
the correlatiQns reported herein. The'IQ scores used were those attained y students
on the most recent administration of.the Otis-Lennon Mental. Ability Test.
it ;

0
CORRELATIONS AMONG GRADE 1 VARIABLES
(N: 32-44)
,
.
12
3-
45
'
67
8
_
910
11
1 2 3 4 5 6
.
Word Reading
.
Paragraph Meaning
Vocabulary
Spelling
Word Study Skills -
_
Arithmetic
-
83*
57*
86*
89*
53*
29*
2437*
41*
-15
-13
49*
80*
-52*
81*
58*
48*
47*.
32*
14
.27
-02
38*
25
43*- 17
-01
-22
-16
07
89*
55*
29*
29*
36*
42*.
-0904
.
.
66*,
20 30* *
38-;,:
-04.
-05
07.
13
35*
23
10
-,32
-
"05
,
--,
47* .39*
80*
55*
17
31*
25
01
.
82*
'30*
-06
-
33*
12
.
11
7 8 910
Faces--Sch9o1 Learn
Faces--Independent
dy
Faces--School Climate
Faces--Total Score
11
12
Pictorial Self - Concept Scale
Days of Attendance
'
-`Significant' beyond ..05 level
Variables:
12
'Cognitive Achievement
Attitude Toward School
Self-Concept
Days of Attendance

4
CORRELATIONS AMONG GRADE 2 VARIABLES
(N: 27-40)
kf
a
--- 1
23
45
67
89
10
11
12
. 13
14
1
f
Otis-Lennon (IQ)
75*
65*
67*
58*
s, 60*
52*
47*
62*
01
02
-19
-0613
-,12
'
79*
59*
83*
68*
56*
'49*
70*
02
-06
-03'
L-61,2
12 13
60*
84*
-71*
48*
52*
63
14
-01
-04..
07
-08
-05
48*
45*
26
38*
49*
10
-03
-211
-03°
03
-15
. 66*
60*
57*
44*
45*
63*
51*
10
30
07
26
00
12
69
30
-04
11
02.-15
20*
39*
-0920
-17
-05
/-15
-06
.
..
57*
17
03
-1505
01
LO5
16
0214
15
07
20
.
-
07 64*
87*
244'
30
'"
>>
.
24
47*
18
-06
.
. 84*
43*
52*
.
.
, 37
35*
56*
2 3 4
.5 6 7 8 9
Word Meaning
Paragraph Meaning
Science a-
Social Studies4Concepts
Spelling
..
Wbrd Study Skills
.
Language-)
Arithmeti:&Computation
Arithmetic Concepts
10
11
12
13
FaCes--School Learning
N
Faces--Independent Study
_FacesSchool Climate
Faces- -Total Score
4
14
15
Pictorial Self-Concept Scale
Days of At dance
44''*Significant beyond 05 4evel;-
1.
I
°Variables:
1IQ
)r-
2- 9
Cognitive Achievement
10-13
Attitude Toward School
14
Self-Concept,
V.
40
15
Days of Attendance
.-
.
0.0
1
kte

0 1-
1
CORRELATIONS AMONG GRADE 3 VARIABLES
(N: 28-31)
I
12
31.
45
67,
10
11
12
klj
14
,Otis-Lennon (IQ)
.
.
60*
61*
81*
47.k- 42*
45* ,63*
'58*
62*
55* .67*
.57*
51*
65*
61*
01
01
07
504
-'06
-21
'01
-07
.23
48*
00
-10
53);e
67*
7a*
78*
41,-
67*
21
-09
r02 0738*
-06
Z6
38*
38*
27 44*
-09
-29
-17
-21 04
-12
..
.
,
,-
78*
.-
74*
85*
73*- 50* 53*
.
62*
68*.77*
.68*
12
44* 4114-t19
05
20 26 18
07
05
-07
18
21
-32
-07
10
37* 34 -19
,01
36
Lt,
34
00
11
-20
-10 -09
-28
12
29 80*
90*
2221
,..
36*
61*
0005"
91*
-02 ,
'23
.
. 10
21
18
2Word Meaning
)
3Paragraph Meaning
4Science and Social Studies Concepts
5gelling
6W50 Study Skills
7Language
8'Arithbetic Computation
9 -Arithimetic Concepts
1CL Faces--School Learning
11'
Faces--Independent Study.
12 .Faces--School Climate'
13
Faces--Total Score
.
14
PictoriAl Self-Concept Scale
15
Days of Attendance
_
j
*Significant beyond .05 level
Variables: 2''
1IQ
2 - 9
Cognitive Achievement
10-13
Attitude Toward School
14
Self-Concept
15
Days of AttAndance

......
.1.1
1111
1111
1111
1111
NO
MM
INIM
MIII
IIIIII
III11
1111
111
CORRELAITONS Wilbi\IGGRADE 4 VARIABLES
.
12
3-4
.
56
78
910
11
12
lj
14
Otis-Lennon (IQ)
.
2Word Meaning
56*
3]'aragraph.Meaning
.
48*
82*
,'
.
4Spelling
39*
80*
80*
.
5Word Study Skills
.
58*
78*
83*
71*
,
1
6Language
37*
51*
57*
53*
59*
.
7Arithmetiic Computation
50*
64*
63*
56*
73*
64*
8Arithmetic Concepts
51*
52*(
65*
53*
75*
66*
69*,
9Arithmetic Applications
5.5P
76*
77*
70*
80*
55*
71*
64*
..
10
Faces--School Learning
,-04
-14
-09
-20
00
-06
'04
09
-C3
11
Faces--Independent Study
33*
40
28*
13
32*
30*
25
22
37*
-04
12.
Faces--School Climate
09
21
-Q2
16
19
11
03
01
21
25
29*
.
13
Faces--TOtal Score
20
23
09
04
26
18
16
17
28*
62*
63*
74*
.
14
Pictorial Self-Concept Scale
07
14
26
14
19
21
08
30*
24
18
Og
18
22S
15
Days of Attendance
04
-12
-21
-16
-17
-20
-21
-32*
-03
11
-06
08
07
-03
*Significant beyond .05 level
Variables:
1IQ
2 - 9
Cognitive Achievement
10-13
Attitude Toward School''
14
.Self-Concept
15
.Days of Attendance

CORRELATIONS AMONG GRADE 5 VARIABLES'
(N: 41 -55)
-
12
34
56
.
78
'
9'
10
17-
11
12
13
14
15
16
17
18
19
1Otis-Lennon '(IQ)
.
, ,
77*
76* 73*,
67* 61*'67*
76* 62* 68*
46* 39* 48*
70* 55* 61*
62* 56* 66*
23
26
34*
.27
40* 27
27
28* 40*
30* 37* 41*
32* 24
16
36* 29* 29*
22
22.
04
-08 -05 -23
-
35*419
15
.02
10 -05
35* 24
25
25
16
12
61*
44* 55*
54* 74* 43*
38* 65* 45*
43* 22
20
33* 32* 25
28* 30* 35
42* 33* 32
02
23
19.
26
31* 36
-02
21
05
-30*-14 -,09
094
16
01
-33*-06
07
12
32* 36*
25
as .06
t
sit
72*
21
16
26
24
49*
14
16
56* 49*
25
22
88* 75*
27* 36* 07
22
26
39* 20
17
21
24
12
25
-04 -04 -24
li
36* 31-1=97
07
-13
05 -11
11
29* 53* 12
23
16 -04
00 -02
--)
82*
30* 22
30* 27*
28* 24
03 -08
06
01
20- 05
24
22
-12 -06
i
73*
85* 56*
66* 22
67* 31*
72* 28*
70* 50*
-05 -10
. 63*
55*
57*
51*
-07
45*
69*
32*
-14
(
--e--
39*
46* 5
32*-26
-16
'2
Word Meaning
3Paragraph Meaning
4Spelling
.,
5.
Language
.
'6\ Arithmetic Computation
7 \Arithmetic Concepts
8Arithmetic Applications
,
9Faces--School Learning
10
Faces -- Independent Study
11
Faces--School Climate
.
12
Faces--Total Score
13
Piers-Harris Total Score
14,
Behavior
--
15
Intalectual and School Status
16
Phyytdal Appearance
17
Anxiety
.
18
Popularity
19
Happiness
20
Days of Attendance
-
C.
*Significant beyond .05 level
1
2- 8
9-12
-..
13-19 20
IQ
Cognitive Achievement
Attitude Toward School
Self-Concept
Days of Attendance

CORRELATIONS AMONG GRADE 6 VARIABLES
(N: 41,-55)
12
34
56
78
910 IR
11
12
13
14
15
, 16
17
18
.19
1Otis-Lennon (IQ)
74*
73*
77*
81*
54*
61*
63*
-06
.-2
-01
-07 22
07 34*
Ll
19
0723
10
79*
80*
83*
41*
59*
63*
-07
-24
-06
-13 23
09 34*
19
-20
10
15
-02
73*
72*
50*
67*
67*
03
-21
.
00
-05 15
07 29*
12
05
-03 06
-08
88*
60* 66*
60* 63*
67* 73*
-05
06
-23 -13'
4
-10
07
-13
02
05-16
00
05
14,°26
-01
03
08.
20
-1C..':02
07
12
07
08
58*
62* 75
38* 07
07 -20
23
01
30*-. 02
20
16
20
05
20
31*
G7
17
17
16
-17- 00
16
09
05
04
05
-07 02
0025
07 43*
24
25
090704
.
38*
69*
90*
07 24
14
-09
-07
-20
-10 08
38*
64*
25
01
30*
37*
20
-15
-0100
o
88*
33* 25
40* 30*
31* 29*
01
07
12
08
03 -04
22
04
09
08
70*
87*
76*
75*
81*
61;:5,
06
>
56*
25
31*
42*
34*
13
74*
57*
67*
32
00
58*
73*-'64*
34* 58*
-02'16
47*
06
. .
10
2 3 4 _ 6 7 8
Word Meaning
.
Paragraph Meaning
tpelling
Language
Arithmetic Computation
ArithmetiC Concepts
ArIthmetic A )lications
1
9
10
11
12
Faces--School Learning
.
Faces -- Independent Study
Faces -- School Climate
Faces--Total Score
13
14
15
16
17
18
19
Piers-Harris Total Score
Behavior
Intellectual and School Status
Physical Appearance
Anxiety
Popularity
Ha.piness
.
y
20
Days of Attendance
*Significant beyond .05 level
s.
t
so.
Variables:.
1IQ
2- 8
Cognitive Achieverdent
9-12
Attitude Toward School
13-19
Self-Concept
20
Days of Attendance