bctc factbook 2012 2013 - bluegrass community and ... factbook 2012 – 2013 b l u e g r a s s c o m...
TRANSCRIPT

2
BCTC Factbook
2012 – 2013
B l u e g r a s s C o m m u n i t y & T e c h n i c a l C o l l e g e
O f f i c e o f I n s t i t u t i o n a l P l a n n i n g , R e s e a r c h , & E f f e c t i v e n e s s
1 6 4 O p p o r t u n i t y W a y , N - 1 2 1
L e x i n g t o n , K Y 4 0 5 1 1
8 5 9 . 2 4 6 . 6 6 2 6

2
Table of Contents
Introduction ........................................................................................................................................................................ 3
Enrollment .......................................................................................................................................................................... 4
Fall Enrollment ......................................................................................................................................................... 5
Fall 2012 Enrollment Overview ................................................................................................................... 5
Fall Enrollment Trends (2008-2012) ........................................................................................................... 9
Spring Enrollment ..................................................................................................................................................... 23
Spring 2013 Enrollment Overview .............................................................................................................. 23
Spring Enrollment Trends (2009-2013) ....................................................................................................... 26
Academic Year (12-Month) Enrollment ................................................................................................................... 39
2012-2013 Academic Year Enrollment Overview ....................................................................................... 39
Academic Year Enrollment Trends (2008-2009 – 2012-2013) ................................................................... 41
Credentials .......................................................................................................................................................................... 51
Total Credentials Awarded (2008-2009 Acad. Year – 2012-2013 Acad. Year) ....................................................... 52
Credentials Awarded by Race/Ethnicity (2008-2009 Acad. Year – 2012-2013 Acad. Year) ................................... 53
Credentials Awarded by Gender (2008-2009 Acad. Year – 2012-2013 Acad. Year)............................................... 60
Credentials Awarded by Program (2008-2009 Acad. Year – 2012-2013 Acad. Year)............................................. 66
Credential Earners by Home County (2008-2009 Acad. Year – 2012-2013 Acad. Year) ........................................ 74
Retention ............................................................................................................................................................................. 77
Fall to Spring Retention Trends ................................................................................................................................ 78
Fall to Spring Retention – All Students and First-Time Freshmen (2008-2013) ......................................... 78
Fall to Spring Retention by Race/Ethnicity (2008-2013) ............................................................................ 79
Fall to Spring Retention by Gender (2008-2013) ........................................................................................ 79
Fall to Fall Retention Trends .................................................................................................................................... 80
Fall to Fall Retention – All Students and First-Time Freshmen (2007-2012) ............................................. 80
Fall to Fall Retention by Race/Ethnicity (2007-2012) ................................................................................. 81
Fall to Fall Retention by Gender (2007-2012) ............................................................................................. 81
Transfer ............................................................................................................................................................................... 82
Transferring to BCTC (First-Time Transfer Students) ............................................................................................. 83
Fall Transfer-In Trends (2008-2012) ........................................................................................................... 83
Spring Transfer-In Trends (2009-2013) ....................................................................................................... 84
Academic Year Transfer-In Trends (2008-2009 – 2012-2013) ................................................................... 84
Transferring from BCTC to Four-Year Institution (in Kentucky) ............................................................................ 85
Percentage of BCTC Students Transferring to Four-Year Institution ......................................................... 85
Labor Force & Demographics ............................................................................................................................................ 86
Definitions & Calculations ................................................................................................................................................. 92
Appendix: Crosswalk of CIP Codes to Academic Plans .................................................................................................... 94

*Will be updated to reflect Fall 2012 information when IPEDS data are released.
3
The 2012-2013 BCTC Factbook is your guide to the people of Bluegrass Community &
Technical College. Inside you will find information about student enrollment, completion, retention, and
transfer for the 2012-2013 academic year, as well as trends over the previous five years. Information is
also provided describing the faculty and staff of BCTC (as of Fall 2011*).
Data are disaggregated throughout the Factbook, allowing for group comparisons and better
enabling users to evaluate the progress of specific BCTC initiatives. In an effort to make the Factbook as
user-friendly as possible, complex data are presented in the form of simple tables, charts, and graphs.
Unless indicated otherwise, counts and calculations were performed using unduplicated data, meaning
each student is counted only once.
If you are unable to find the information you are looking for, try exploring the KCTCS Factbook,
which can be found at: http://www.kctcs.edu/en/About_KCTCS/KCTCS_Factbook.aspx.
If you would like more information about the contents of this Factbook, please contact
Alan Lawson ([email protected]) or Mary Forbes ([email protected])
in BCTC’s Office of Institutional Planning, Research, and Effectiveness.

*Will be updated to reflect Fall 2012 information when IPEDS data are released.
3
Enrollment
Fall Enrollment
Fall 2012 Enrollment Overview
Fall Enrollment Trends (2008-2012)
Spring Enrollment
Spring 2013 Enrollment Overview
Spring Enrollment Trends (2009-2013)
Academic Year (12-Month) Enrollment
2012-2013 Academic Year Enrollment Overview
Academic Year Enrollment Trends (2008-2009 – 2012-2013)

Source: CPE Official Data 1FTE (Full-Time Equivalent) calculated using CPE definition (total credit hours / 15). 2Headcounts by location only include students taking classes in-person (includes hybrid classes, online classes were excluded). Counts are duplicated, so a student may
be counted more than once if attending classes at more than one location. 3Includes the District of Columbia.
5
Fall 2012 Enrollment Overview
Enrollment and FTE1
Total Enrollment 13,265
Online Enrollment 8,024
FTE1
8,184
In-Person Enrollment by Location (Duplicated)2
Location N
Cooper 5,643
Leestown 1,915
Regency 582
Danville 959
Lawrenceburg 814
Winchester 757
Enrollment by Academic Load
Academic Load N %
Full-Time 6,073 45.8%
Part-Time 7,192 54.2%
Total 13,265 -
Enrollment by Classification
Classification N %
Freshman 7,851 59.2%
Sophomore 3,784 28.5%
Non-Degree 619 4.7%
High School 1,011 7.6%
Auditor 0 0.0%
Total 13,265 -
Enrollment by Gender
Gender N %
Female 7,778 58.6%
Male 5,440 41.0%
Unknown 47 0.4%
Total 13,265 -
Enrollment by Race/Ethnicity
Race/Ethnicity N %
American Indian 79 0.6%
Asian 210 1.6%
African American 1,695 12.8%
Hispanic 497 3.7%
Native Hawaiian 20 0.2%
Non-Resident Alien 121 0.9%
Two or More Races 161 1.2%
Unknown 245 1.8%
White 10,237 77.2%
Total 13,265 -
Average Age of Students (Years) 26.5
Countries Represented by BCTC
Students 42
U.S. States Represented by BCTC
Students3 36
Kentucky Counties Represented by
BCTC Students 118

Source: CPE Official Data 1Kentucky counties not represented include Elliot and Hickman.
6
Fall 2012 Enrollment by Kentucky County
Kentucky County Count Kentucky County Count Kentucky County Count Kentucky County Count
Fayette 4,973 Laurel 40 Fleming 12 Owsley 5
Jessamine 736 Boyd 38 Bullitt 11 Clinton 4
Scott 724 Floyd 37 Morgan 11 Green 4
Clark 691 Nicholas 31 Russell 11 McCreary 4
Franklin 608 Bath 30 Carroll 10 Trigg 4
Anderson 504 Campbell 30 Carter 10 Allen 3
Boyle 445 Owen 30 Gallatin 10 Breckinridge 3
Madison 444 Perry 29 Henry 10 Lewis 3
Mercer 389 Christian 25 Knott 10 Livingston 3
Woodford 389 Bell 24 Larue 10 Logan 3
Lincoln 273 Menifee 24 Warren 10 Robertson 3
Garrard 234 Greenup 23 Breathitt 9 Union 3
Jefferson 229 Henderson 22 Jackson 9 Ballard 2
Bourbon 208 Rowan 22 Pendleton 9 Barren 2
Powell 171 Grant 21 Muhlenberg 8 Hancock 2
Montgomery 161 Lee 21 Ohio 8 Monroe 2
Marion 111 Rockcastle 20 Wolfe 8 Bracken 1
Estill 95 McCracken 19 Grayson 7 Butler 1
Harrison 79 Meade 19 Martin 7 Carlisle 1
Washington 75 Spencer 18 Adair 6 Crittenden 1
Shelby 65 Knox 17 Calloway 6 Cumberland 1
Daviess 64 Johnson 16 Graves 6 Fulton 1
Nelson 62 Wayne 16 Trimble 6 Leslie 1
Pulaski 57 Harlan 15 Caldwell 5 McLean 1
Casey 54 Hopkins 15 Edmonson 5 Metcalfe 1
Kenton 53 Mason 15 Hart 5 Simpson 1
Hardin 52 Letcher 14 Lawrence 5 Todd 1
Pike 52 Taylor 14 Lyon 5 Webster 1
Boone 44 Whitley 14 Magoffin 5 Total Kentucky Counties
Represented1 = 118 Oldham 44 Clay 12 Marshall 5

Source: CPE Official Data
Map created by Rick Jones using MAC GIS Cartographica.
7

Source: CPE Official Data
8
Top 25 Kentucky Feeder High Schools in Fall 2012
Kentucky High School Count Kentucky High School Count
Lafayette Senior High School 234 Boyle County High School 58
Paul Laurence Dunbar High School 210 Garrard County High School 46
Henry Clay High School 198 Western Hills High School 44
Tates Creek Senior High School 198 Madison Central High School 40
Bryan Station Senior High School 183 Bourbon County High School 38
Scott County Senior High School 154 Lincoln County High School 38
George Rogers Clark High School 135 Marion County High School 37
Anderson County High School 132 Powell County High School 35
Woodford County High School 85 Danville High School 34
Mercer County High School 83 Montgomery County High School 29
West Jessamine High School 79 Madison Southern High School 21
Franklin County High School 75 Harrison County High School 20
East Jessamine High School 63
BCTC Students Earning a GED 379
BCTC Students Attending an Out of
State High School 224
BCTC Students Attending Home
School 46
Source: CPE Official Data 1FTE (Full-Time Equivalent) calculated using CPE definition (total credit hours / 15).
9
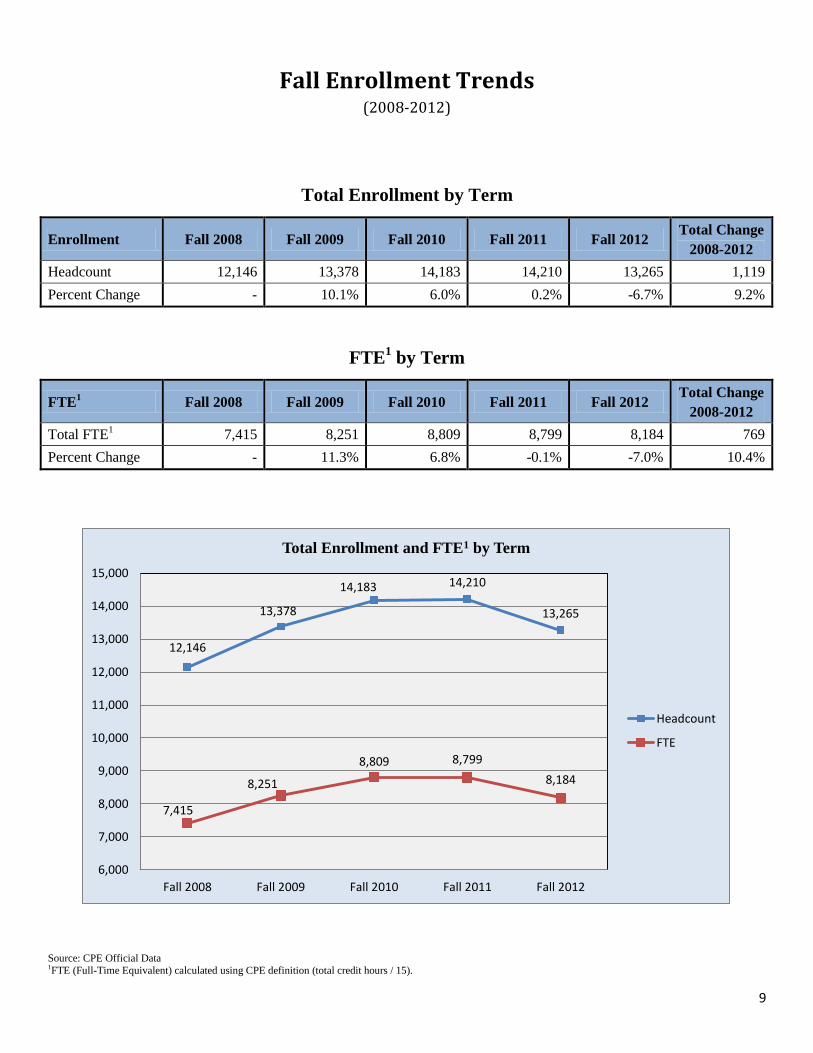
Fall Enrollment Trends (2008-2012)
Total Enrollment by Term
Enrollment Fall 2008 Fall 2009 Fall 2010 Fall 2011 Fall 2012 Total Change
2008-2012
Headcount 12,146 13,378 14,183 14,210 13,265 1,119
Percent Change - 10.1% 6.0% 0.2% -6.7% 9.2%
FTE1 by Term
FTE1 Fall 2008 Fall 2009 Fall 2010 Fall 2011 Fall 2012
Total Change
2008-2012
Total FTE1
7,415 8,251 8,809 8,799 8,184 769
Percent Change - 11.3% 6.8% -0.1% -7.0% 10.4%
12,146
13,378
14,183 14,210
13,265
7,415
8,251
8,809 8,799
8,184
6,000
7,000
8,000
9,000
10,000
11,000
12,000
13,000
14,000
15,000
Fall 2008 Fall 2009 Fall 2010 Fall 2011 Fall 2012
Total Enrollment and FTE1 by Term
Headcount
FTE

Source: CPE Official Data 1Headcounts by location include only students taking classes in-person (includes hybrid classes, online classes were excluded). Counts are duplicated, so a student may be counted more than once if attending classes at more than one location. 2Enrollment data by location are not reliable prior to Fall 2010. As such, they are not presented in this Factbook.
10
Online Enrollment by Term
Enrollment Fall 2008 Fall 2009 Fall 2010 Fall 2011 Fall 2012 Total Change
2008-2012
Headcount 5,527 6,021 7,224 8,220 8,024 2,497
Percent Change - 8.9% 20.0% 13.8% -2.4% 45.2%
In-Person Enrollment by Location (Duplicated)1
Location Fall 20102
Fall 2011 Fall 2012 Percent Change
2010-2012
Cooper 6,619 6,210 5,643 -14.7%
Leestown 2,151 2,092 1,915 -11.0%
Regency 1,197 886 582 -51.4%
Danville 1,192 1,040 959 -19.5%
Lawrenceburg 1,127 1,051 814 -27.8%
Winchester 729 805 757 3.8%
5,527
6,021
7,224
8,220 8,024
4,000
5,000
6,000
7,000
8,000
9,000
10,000
Fall 2008 Fall 2009 Fall 2010 Fall 2011 Fall 2012
Online Enrollment by Term

Source: CPE Official Data 1Headcounts by location include only students taking classes in-person (includes hybrid classes, online classes were excluded). Counts are duplicated, so a student may be counted more than once if attending classes at more
than one location.
*Enrollment data by location are not reliable prior to Fall 2010. As such, they are not presented in this Factbook.
11
0
1,000
2,000
3,000
4,000
5,000
6,000
7,000
Cooper Leestown Regency Danville Lawrenceburg Winchester
In-Person Enrollment by Location (Duplicated)1
Fall 2010*
Fall 2011
Fall 2012

Source: CPE Official Data
12
Total Enrollment by Academic Load
Academic
Load
Fall 2008 Fall 2009 Fall 2010 Fall 2011 Fall 2012
N % N % N % N % N %
Full-Time 5,892 48.5% 6,450 48.2% 6,965 49.1% 6,729 47.4% 6,073 45.8%
Part-Time 6,254 51.5% 6,928 51.8% 7,218 50.9% 7,481 52.6% 7,192 54.2%
Total 12,146 - 13,378 - 14,183 - 14,210 - 13,265 -
5,892
6,450
6,965
6,729
6,073
6,254
6,928
7,218
7,481
7,192
5,000
5,500
6,000
6,500
7,000
7,500
8,000
Fall 2008 Fall 2009 Fall 2010 Fall 2011 Fall 2012
Total Enrollment by Academic Load
Full-Time
Part-Time

Source: CPE Official Data 1The “Other” category includes students classified as “Auditor” or “Post-Baccalaureate.”
N/A = Due to restructuring of the race/ethnicity categories, not all are applicable across terms.
13
Total Enrollment by Classification
Student
Classification
Fall 2008 Fall 2009 Fall 2010 Fall 2011 Fall 2012
N % N % N % N % N %
Freshman 6,898 56.8% 8,011 59.9% 8,460 59.6% 8,399 59.1% 7,851 59.2%
Sophomore 3,224 26.5% 3,427 25.6% 3,727 26.3% 4,035 28.4% 3,784 28.5%
Non-Degree 1,282 10.6% 1,026 7.7% 1,057 7.5% 645 4.5% 619 4.7%
High School 678 5.6% 910 6.8% 938 6.6% 1,129 7.9% 1,011 7.6%
Other1
64 0.5% 4 0.0% 1 0.0% 2 0.0% 0 0.0%
Total 12,146 - 13,378 - 14,183 - 14,210 - 13,265 -
Total Enrollment by Race/Ethnicity
Race/Ethnicity Fall 2008 Fall 2009 Fall 2010 Fall 2011 Fall 2012
N % N % N % N % N %
American Indian 42 0.3% 40 0.3% 39 0.3% 41 0.3% 79 0.6%
Asian 159 1.3% 179 1.3% 193 1.4% 206 1.4% 210 1.6%
African American 1,417 11.7% 1,812 13.5% 1,922 13.6% 1,846 13.0% 1,695 12.8%
Hispanic 261 2.1% 288 2.2% 349 2.5% 438 3.1% 497 3.7%
Native Hawaiian N/A N/A N/A N/A 13 0.1% 19 0.1% 20 0.2%
Non-Resident Alien 72 0.6% 48 0.4% 20 0.1% 66 0.5% 121 0.9%
Two or More Races N/A N/A N/A N/A 187 1.3% 231 1.6% 161 1.2%
Unknown 515 4.2% 379 2.8% 460 3.2% 248 1.7% 245 1.8%
White 9,680 79.7% 10,632 79.5% 11,000 77.6% 11,115 78.2% 10,237 77.2%
Total 12,146 - 13,378 - 14,183 - 14,210 - 13,265 -

Source: CPE Official Data
14
Total Enrollment by Gender
Gender Fall 2008 Fall 2009 Fall 2010 Fall 2011 Fall 2012
N % N % N % N % N %
Female 6,848 56.4% 7,828 58.5% 8,339 58.8% 8,335 58.7% 7,778 58.6%
Male 5,297 43.6% 5,549 41.5% 5,826 41.1% 5,867 41.3% 5,440 41.0%
Unknown 1 0.0% 1 0.0% 18 0.1% 8 0.1% 47 0.4%
Total 12,146 - 13,378 - 14,183 - 14,210 - 13,265 -
6,848
7,828
8,339 8,335
7,778
5,297 5,549
5,826 5,867
5,440
4,000
4,500
5,000
5,500
6,000
6,500
7,000
7,500
8,000
8,500
9,000
Fall 2008 Fall 2009 Fall 2010 Fall 2011 Fall 2012
Enrollment by Gender
Female
Male

Source: CPE Official Data 1All data were updated for the 2012-2013 Factbook; CPE Official Data are now used for all terms.
15
Enrollment of First-Time Freshmen by Term
Enrollment Fall 2008 Fall 2009 Fall 2010 Fall 2011 Fall 2012 Total Change
2008-2012
Headcount 2,530 2,814 2,552 2,805 2,677 147
Percent Change - 11.2% -9.3% 9.9% -4.6% 5.8%
Dual Credit/Dual Enrollment1 Students by Term
Enrollment Fall 2008 Fall 2009 Fall 2010 Fall 2011 Fall 2012 Total Change
2008-2012
Headcount 678 910 938 1,129 1,011 333
Percent Change - 34.2% 3.1% 20.4% -10.5% 49.1%
2,530
2,814
2,552
2,805
2,677
2,000
2,250
2,500
2,750
3,000
Fall 2008 Fall 2009 Fall 2010 Fall 2011 Fall 2012
Enrollment of First-Time Freshmen by Term
678
910 938
1,129
1,011
400
650
900
1,150
1,400
Fall 2008 Fall 2009 Fall 2010 Fall 2011 Fall 2012
Dual Credit/Dual Enrollment Students by Term

Source: CPE Official Data 1A crosswalk of CIP codes to academic plans is provided in the Appendix.
16
Enrollment by Program (CIP1) – Top 10 Programs with Highest Enrollment
Fall 2008
Program (CIP Title) Enrollment
Undecided 2,881
Liberal Arts and Sciences/Liberal Studies 2,080
Non-credential 1,965
Nursing (RN Training) 1,478
Licensed Practical/Vocational Nurse Training 462
Medical Radiologic Technology/Science v Radiation Therapist 400
Executive Assistant/Executive Secretary 298
Dental Hygiene/Hygienist 248
Business Administration and Management 220
Data Processing and Data Processing Technology/Technician 200
Fall 2009
Program (CIP Title) Enrollment
Undecided 3,147
Liberal Arts and Sciences/Liberal Studies 2,226
Non-credential 1,940
Nursing (RN Training) 1,813
Licensed Practical/Vocational Nurse Training 499
Medical Radiologic Technology/Science v Radiation Therapist 403
Executive Assistant/Executive Secretary 318
Dental Hygiene/Hygienist 273
Business Administration and Management 266
Data Processing and Data Processing Technology/Technician 260
Source: CPE Official Data 1A crosswalk of CIP codes to academic plans is provided in the Appendix.
17
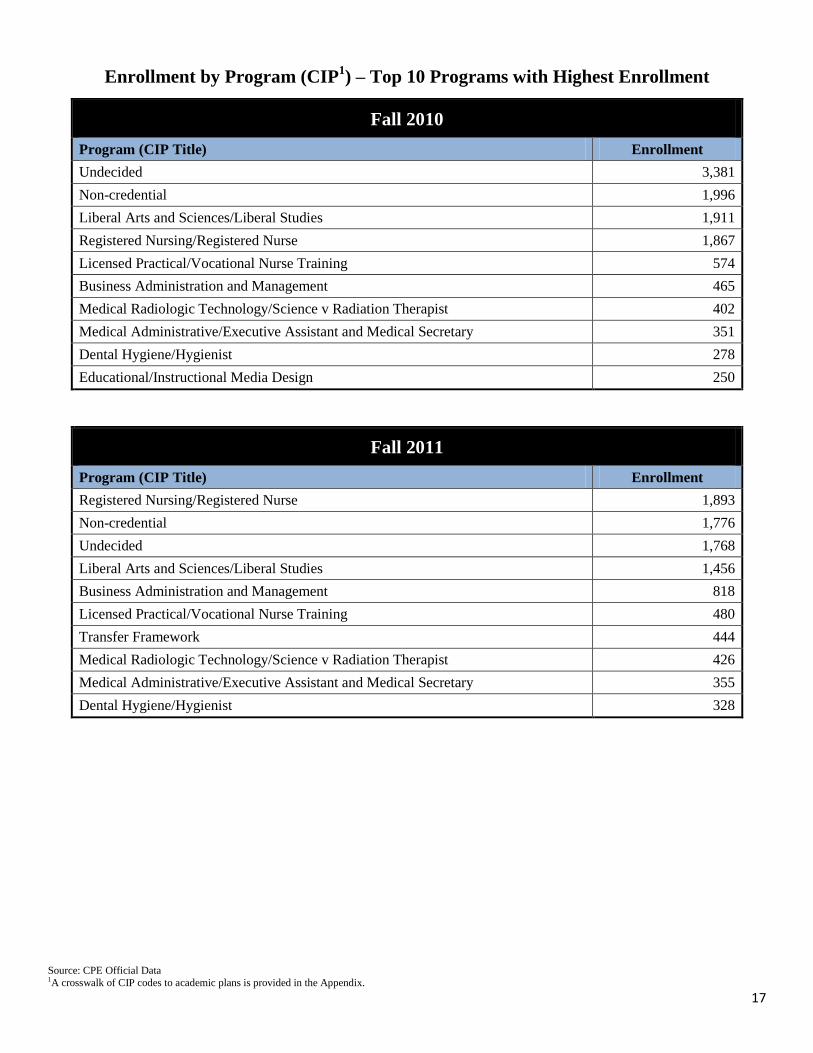
Enrollment by Program (CIP1) – Top 10 Programs with Highest Enrollment
Fall 2010
Program (CIP Title) Enrollment
Undecided 3,381
Non-credential 1,996
Liberal Arts and Sciences/Liberal Studies 1,911
Registered Nursing/Registered Nurse 1,867
Licensed Practical/Vocational Nurse Training 574
Business Administration and Management 465
Medical Radiologic Technology/Science v Radiation Therapist 402
Medical Administrative/Executive Assistant and Medical Secretary 351
Dental Hygiene/Hygienist 278
Educational/Instructional Media Design 250
Fall 2011
Program (CIP Title) Enrollment
Registered Nursing/Registered Nurse 1,893
Non-credential 1,776
Undecided 1,768
Liberal Arts and Sciences/Liberal Studies 1,456
Business Administration and Management 818
Licensed Practical/Vocational Nurse Training 480
Transfer Framework 444
Medical Radiologic Technology/Science v Radiation Therapist 426
Medical Administrative/Executive Assistant and Medical Secretary 355
Dental Hygiene/Hygienist 328

Source: CPE Official Data 1A crosswalk of CIP codes to academic plans is provided in the Appendix.
18
Enrollment by Program (CIP1) – Top 10 Programs with Highest Enrollment
Fall 2012
Program (CIP Title) Enrollment
Liberal Arts and Sciences/Liberal Studies 4,614
Non-credential 1,630
Undecided 1,108
Registered Nursing/Registered Nurse 819
Business Administration and Management 777
Medical Administrative/Executive Assistant and Medical Secretary 311
Licensed Practical/Vocational Nurse Training 295
Medical Radiologic Technology/Science v Radiation Therapist 242
Computer and Information Sciences 238
Dental Hygiene/Hygienist 232

Source: CPE Official Data 1A crosswalk of CIP codes to academic plans is provided in the Appendix.
19
Enrollment by Program (CIP1) – All Programs
Program (CIP Title) Fall 2008 Fall 2009 Fall 2010 Fall 2011 Fall 2012
Administrative Assistant and Secretarial Science 1 2
Aesthetician/Esthetician and Skin Care Specialist 12 21 20 15 15
American History (United States) 25
Applied Horticulture/Horticultural Operations 24 21 7 1 2
Architectural Drafting and Architectural CAD/CADD 103 74 75 66 105
Autobody/Collision and Repair Technology/Technician 27 28 23 28 28
Automobile/Automotive Mechanics Technology/Technician 64 80 91 85 71
Biology Technician/Biotechnology Laboratory Technician 5 21 42
Biology/Biological Sciences 85 3
Building/Property Maintenance and Management 3 3
Business Administration and Management 220 266 465 818 777
Business/Commerce 131 6
Carpentry/Carpenter 56 57 55 48 53
Cartography 1 4 6
Chemistry 20
Child Care Provider/Assistant 142 166 178 179 185
Cinematography and Film/Video Production 12 8 20 15 23
Civil Engineering Technology/Technician 26 20 44 42 64
Clinical/Medical Laboratory Technician 11 13 10 3 5
Communications Technology/Technician 10
Computer and Information Sciences 45 61 150 202 238
Computer Installation and Repair Technology/Technician 2
Cosmetology/Cosmetologist 50 63 64 59 49
Criminal Justice/Law Enforcement Administration 213 231
Data Processing and Data Processing Technology/Technician 200 260 240 194 161
Dental Hygiene/Hygienist 248 273 278 328 232
Source: CPE Official Data 1A crosswalk of CIP codes to academic plans is provided in the Appendix.
20
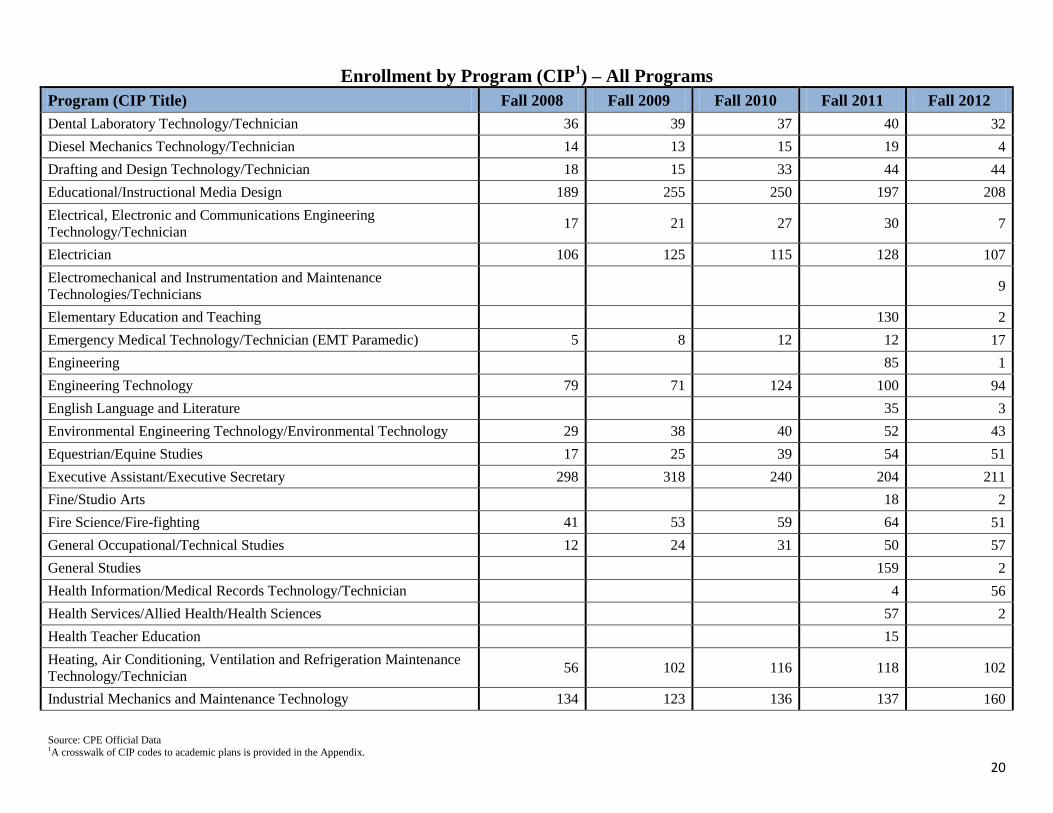
Enrollment by Program (CIP1) – All Programs
Program (CIP Title) Fall 2008 Fall 2009 Fall 2010 Fall 2011 Fall 2012
Dental Laboratory Technology/Technician 36 39 37 40 32
Diesel Mechanics Technology/Technician 14 13 15 19 4
Drafting and Design Technology/Technician 18 15 33 44 44
Educational/Instructional Media Design 189 255 250 197 208
Electrical, Electronic and Communications Engineering
Technology/Technician 17 21 27 30 7
Electrician 106 125 115 128 107
Electromechanical and Instrumentation and Maintenance
Technologies/Technicians 9
Elementary Education and Teaching 130 2
Emergency Medical Technology/Technician (EMT Paramedic) 5 8 12 12 17
Engineering 85 1
Engineering Technology 79 71 124 100 94
English Language and Literature 35 3
Environmental Engineering Technology/Environmental Technology 29 38 40 52 43
Equestrian/Equine Studies 17 25 39 54 51
Executive Assistant/Executive Secretary 298 318 240 204 211
Fine/Studio Arts 18 2
Fire Science/Fire-fighting 41 53 59 64 51
General Occupational/Technical Studies 12 24 31 50 57
General Studies 159 2
Health Information/Medical Records Technology/Technician 4 56
Health Services/Allied Health/Health Sciences 57 2
Health Teacher Education 15
Heating, Air Conditioning, Ventilation and Refrigeration Maintenance
Technology/Technician 56 102 116 118 102
Industrial Mechanics and Maintenance Technology 134 123 136 137 160

Source: CPE Official Data 1A crosswalk of CIP codes to academic plans is provided in the Appendix.
21
Enrollment by Program (CIP1) – All Programs
Program (CIP Title) Fall 2008 Fall 2009 Fall 2010 Fall 2011 Fall 2012
Junior High/Intermediate/Middle School Education and Teaching 39 3
Liberal Arts and Sciences/Liberal Studies 2,080 2,226 1,911 1,456 4,614
Licensed Practical/Vocational Nurse Training 462 499 574 480 295
Machine Shop Technology/Assistant 45 35 37 47 51
Mason/Masonry 25 19 9 2
Mathematics 14
Medical Administrative/Executive Assistant and Medical Secretary 148 227 351 355 311
Medical Radiologic Technology/Science v Radiation Therapist 400 403 402 426 242
Medical/Clinical Assistant 67 103 135 155 116
Non-credential 1,965 1,940 1,996 1,776 1,630
Nuclear Medical Technology/Technologist 38 47 48 51 24
Nursing (RN Training) 1,478 1,813 1 2
Pharmacy Technician/Assistant 36 1
Physical Sciences 10
Political Science and Government 26 2
Psychology 137 3
Real Estate 3 6 5
Registered Nursing/Registered Nurse 1,867 1,893 819
Respiratory Care Therapy/Therapist 43 74 101 108 56
Rhetoric and Composition 5
Securities Services Administration/Management 49 4 1 12 3
Security and Protective Services 2 36 37 24
Small Engine Mechanics and Repair Technology/Technician 2 1 1
Social Sciences 8
Social Work 53 53 172 322 222
Sociology 19

Source: CPE Official Data 1A crosswalk of CIP codes to academic plans is provided in the Appendix.
22
Enrollment by Program (CIP1) – All Programs
Program (CIP Title) Fall 2008 Fall 2009 Fall 2010 Fall 2011 Fall 2012
Special Education and Teaching 20 1
Speech Communication and Rhetoric 57 4
Surgical Technology/Technologist 50 66 67 89 63
Transfer Framework 444 12
Undecided 2,881 3,147 3,381 1,768 1,108
Welding Technology/Welder 68 79 84 75 73

Source: CPE Official Data 1FTE (Full-Time Equivalent) calculated using CPE definition (total credit hours / 15). 2Headcounts by location include only students taking classes in-person (includes hybrid classes, online classes were excluded). Counts are duplicated, so a student may
be counted more than once if attending classes at more than one location. 3Includes the District of Columbia.
23
Spring 2013 Enrollment Overview
Enrollment and FTE1
Total Enrollment 11,785
Online Enrollment 7,623
FTE1
7,216
In-Person Enrollment by Location (Duplicated)2
Location N
Cooper 4,984
Leestown 1,724
Regency 403
Danville 810
Lawrenceburg 670
Winchester 625
Enrollment by Academic Load
Academic Load N %
Full-Time 5,128 43.5%
Part-Time 6,657 56.5%
Total 11,785 -
Enrollment by Classification
Classification N %
Freshman 5,231 44.4%
Sophomore 5,104 43.3%
Non-Degree 663 5.6%
High School 786 6.7%
Auditor 1 0.0%
Total 11,785 -
Enrollment by Gender
Gender N %
Female 6,951 59.0%
Male 4,834 41.0%
Unknown 0 0.0%
Total 11,785 -
Enrollment by Race/Ethnicity
Race/Ethnicity N %
American Indian 56 0.5%
Asian 203 1.7%
African American 1,420 12.0%
Hispanic 412 3.5%
Native Hawaiian 16 0.1%
Non-Resident Alien 136 1.2%
Two or More Races 182 1.5%
Unknown 219 1.9%
White 9,141 77.6%
Total 11,785 -
Average Age of Students (Years) 27.9
Countries Represented by BCTC
Students 43
U.S. States Represented by BCTC
Students3 35
Kentucky Counties Represented by
BCTC Students 113

Source: CPE Official Data 1Kentucky counties not represented include Butler, Carlisle, Crittenden, Elliot, Hickman, Metcalfe, and Simpson.
24
Spring 2013 Enrollment by Kentucky County
Kentucky County Count Kentucky County Count Kentucky County Count Kentucky County Count
Fayette 4,453 Floyd 37 Morgan 12 Bracken 3
Jessamine 658 Casey 35 Spencer 12 Breathitt 3
Scott 641 Bath 33 Taylor 12 Clinton 3
Clark 591 Laurel 31 Wayne 11 McCreary 3
Franklin 520 Boyd 30 Henry 10 Muhlenberg 3
Anderson 411 Nicholas 25 Carter 9 Owsley 3
Madison 386 Perry 25 Clay 9 Robertson 3
Boyle 380 Grant 24 Carroll 8 Trigg 3
Mercer 352 Owen 23 Jackson 8 Trimble 3
Woodford 313 Rowan 21 Knott 8 Webster 3
Lincoln 250 Christian 20 Larue 8 Allen 2
Garrard 216 Greenup 19 Lawrence 8 Barren 2
Jefferson 215 Campbell 17 Martin 8 Caldwell 2
Bourbon 181 Knox 17 Ohio 8 Livingston 2
Montgomery 150 McCracken 17 Calloway 7 Logan 2
Powell 144 Meade 17 Warren 7 McLean 2
Marion 95 Menifee 17 Wolfe 7 Monroe 2
Estill 83 Rockcastle 17 Gallatin 6 Todd 2
Harrison 83 Hopkins 16 Graves 6 Union 2
Washington 65 Bell 15 Grayson 6 Ballard 1
Shelby 63 Harlan 15 Pendleton 6 Cumberland 1
Nelson 54 Lee 15 Russell 6 Edmonson 1
Pulaski 53 Henderson 14 Breckinridge 5 Fulton 1
Kenton 47 Johnson 14 Green 5 Hancock 1
Pike 47 Whitley 14 Lyon 5 Leslie 1
Hardin 46 Bullitt 13 Magoffin 5 Lewis 1
Daviess 44 Fleming 13 Hart 4 Total Kentucky Counties
Represented1 = 113
Boone 43 Letcher 12 Marshall 4
Oldham 40 Mason 12 Adair 3

Source: CPE Official Data
25
Top 25 Kentucky Feeder High Schools in Spring 2013*
Kentucky High School Count Kentucky High School Count
BCTC Students Earning a GED*
BCTC Students Attending an Out of
State High School*
BCTC Students Attending Home
School*
*Data not available for Spring 2013 due to a data load error at the system level.

Source: CPE Official Data 1FTE (Full-Time Equivalent) calculated using CPE definition (total credit hours / 15).
26
Spring Enrollment Trends (2009-2013)
Total Enrollment by Term
Enrollment Spring 2009 Spring 2010 Spring 2011 Spring 2012 Spring 2013 Total Change
2009-2013
Headcount 11,238 12,784 13,331 12,631 11,785 547
Percent Change - 13.8% 4.3% -5.3% -6.7% 4.9%
FTE1 by Term
FTE1 Spring 2009 Spring 2010 Spring 2011 Spring 2012 Spring 2013
Total Change
2009-2013
Total FTE1
7,113 8,166 8,221 7,774 7,216 103
Percent Change - 14.8% 0.7% -5.4% -7.2% 1.4%
11,238
12,784 13,331
12,631
11,785
7,113
8,166 8,221 7,774
7,216
5,000
6,000
7,000
8,000
9,000
10,000
11,000
12,000
13,000
14,000
15,000
Spring 2009 Spring 2010 Spring 2011 Spring 2012 Spring 2013
Total Enrollment and FTE1 by Term
Headcount
FTE

Source: CPE Official Data 1Headcounts by location include only students taking classes in-person (includes hybrid classes, online classes were excluded). Counts are duplicated, so a student may be counted more than once if attending classes at more than one location. 2Enrollment data by location are not reliable prior to Fall 2010. As such, they are not presented in this Factbook.
27
Online Enrollment by Term
Enrollment Spring 2009 Spring 2010 Spring 2011 Spring 2012 Spring 2013 Total Change
2009-2013
Headcount 5,773 6,450 7,716 8,102 7,623 1,850
Percent Change - 11.7% 19.6% 5.0% -5.9% 32.0%
In-Person Enrollment by Location (Duplicated)1
Location Spring 20112
Spring 2012 Spring 2013 Percent Change
2011-2013
Cooper 6,162 5,479 4,984 -19.1%
Leestown 2,123 1,872 1,724 -18.8%
Regency 976 620 403 -58.7%
Danville 938 880 810 -13.6%
Lawrenceburg 962 912 670 -30.4%
Winchester 744 656 625 -16.0%
5,773
6,450
7,716
8,102
7,623
3,000
4,000
5,000
6,000
7,000
8,000
9,000
Spring 2009 Spring 2010 Spring 2011 Spring 2012 Spring 2013
Online Enrollment by Term

Source: CPE Official Data 1Headcounts by location include only students taking classes in-person (includes hybrid classes, online classes were excluded). Counts are duplicated, so a student may be counted more than once if attending classes at more
than one location.
*Enrollment data by location are not reliable prior to Fall 2010. As such, they are not presented in this Factbook.
28
0
1,000
2,000
3,000
4,000
5,000
6,000
7,000
Cooper Leestown Regency Danville Lawrenceburg Winchester
In-Person Enrollment by Location (Duplicated)1
Spring 2011*
Spring 2012
Spring 2013

Source: CPE Official Data
29
Total Enrollment by Academic Load
Academic
Load
Spring 2009 Spring 2010 Spring 2011 Spring 2012 Spring 2013
N % N % N % N % N %
Full-Time 5,479 48.8% 6,371 49.8% 6,123 45.9% 5,632 44.6% 5,128 43.5%
Part-Time 5,759 51.2% 6,413 50.2% 7,208 54.1% 6,999 55.4% 6,657 56.5%
Total 11,238 - 12,784 - 13,331 - 12,631 - 11,785 -
5,479
6,371
6,123
5,632
5,128
5,759
6,413
7,208
6,999
6,657
4,000
4,500
5,000
5,500
6,000
6,500
7,000
7,500
Spring 2009 Spring 2010 Spring 2011 Spring 2012 Spring 2013
Total Enrollment by Academic Load
Full-Time
Part-Time

Source: CPE Official Data
N/A = Due to restructuring of the race/ethnicity categories, not all are applicable across terms.
30
Total Enrollment by Race/Ethnicity
Race/Ethnicity Spring 2009 Spring 2010 Spring 2011 Spring 2012 Spring 2013
N % N % N % N % N %
American Indian 36 0.3% 41 0.3% 30 0.2% 37 0.3% 56 0.5%
Asian 158 1.4% 179 1.4% 185 1.4% 187 1.5% 203 1.7%
African American 1,403 12.5% 1,794 14.0% 1,810 13.6% 1,551 12.3% 1,420 12.0%
Hispanic 251 2.2% 264 2.1% 369 2.8% 411 3.3% 412 3.5%
Native Hawaiian N/A N/A N/A N/A 16 0.1% 17 0.1% 16 0.1%
Non-Resident Alien 63 0.6% 38 0.3% 20 0.2% 74 0.6% 136 1.2%
Two or More Races N/A N/A N/A N/A 203 1.5% 159 1.3% 182 1.5%
Unknown 364 3.2% 503 3.9% 372 2.8% 185 1.5% 219 1.9%
White 8,963 79.8% 9,965 77.9% 10,326 77.5% 10,010 79.2% 9,141 77.6%
Total 11,238 - 12,784 - 13,331 - 12,631 - 11,785 -
Total Enrollment by Gender
Gender Spring 2009 Spring 2010 Spring 2011 Spring 2012 Spring 2013
N % N % N % N % N %
Female 6,552 58.3% 7,578 59.3% 7,919 59.4% 7,438 58.9% 6,951 59.0%
Male 4,682 41.7% 5,200 40.7% 5,412 40.6% 5,187 41.1% 4,834 41.0%
Unknown 4 0.0% 6 0.0% 0 0.0% 6 0.0% 0 0.0%
Total 11,238 - 12,784 - 13,331 - 12,631 - 11,785 -

Source: CPE Official Data
31
Enrollment of First-Time Freshmen by Term
Enrollment Spring 2009 Spring 2010 Spring 2011 Spring 2012 Spring 2013 Total Change
2009-2013
Headcount 935 1,170 1,137 1,009 928 -7
Percent Change - 25.1% -2.8% -11.3% -8.0% -0.7%
6,552
7,578
7,919
7,438
6,951
4,682
5,200 5,412
5,187
4,834
4,000
4,500
5,000
5,500
6,000
6,500
7,000
7,500
8,000
8,500
Spring 2009 Spring 2010 Spring 2011 Spring 2012 Spring 2013
Enrollment by Gender
Female
Male
935
1,170 1,137
1,009 928
500
750
1,000
1,250
1,500
Spring 2009 Spring 2010 Spring 2011 Spring 2012 Spring 2013
Enrollment of First-Time Freshmen by Term
Sources: CPE Official Data 1All data were updated for the 2012-2013 Factbook; CPE Official Data are now used for all terms. 2A crosswalk of CIP codes to academic plans is provided in the Appendix.
32
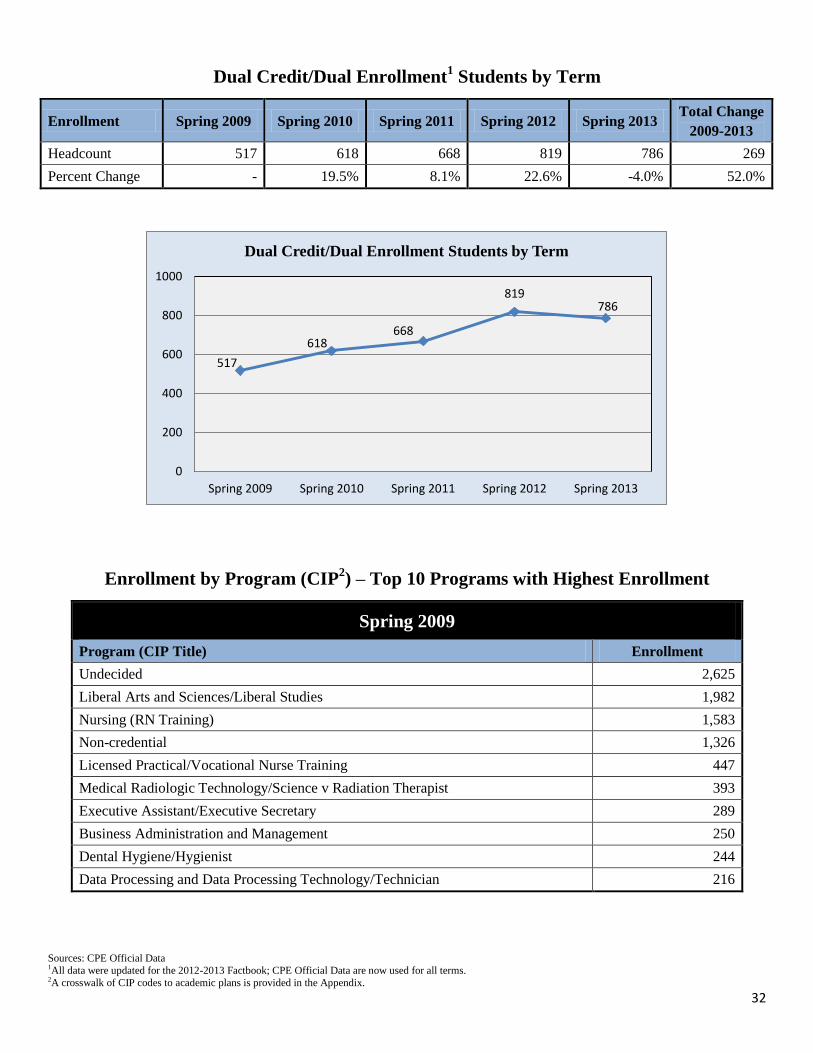
Dual Credit/Dual Enrollment1 Students by Term
Enrollment Spring 2009 Spring 2010 Spring 2011 Spring 2012 Spring 2013 Total Change
2009-2013
Headcount 517 618 668 819 786 269
Percent Change - 19.5% 8.1% 22.6% -4.0% 52.0%
Enrollment by Program (CIP2) – Top 10 Programs with Highest Enrollment
Spring 2009
Program (CIP Title) Enrollment
Undecided 2,625
Liberal Arts and Sciences/Liberal Studies 1,982
Nursing (RN Training) 1,583
Non-credential 1,326
Licensed Practical/Vocational Nurse Training 447
Medical Radiologic Technology/Science v Radiation Therapist 393
Executive Assistant/Executive Secretary 289
Business Administration and Management 250
Dental Hygiene/Hygienist 244
Data Processing and Data Processing Technology/Technician 216
517
618 668
819 786
0
200
400
600
800
1000
Spring 2009 Spring 2010 Spring 2011 Spring 2012 Spring 2013
Dual Credit/Dual Enrollment Students by Term

Source: CPE Official Data
*The CIP Title is missing for 786 students in Spring 2011. As a result, these data may underestimate the true number of students in each program. 1A crosswalk of CIP codes to academic plans is provided in the Appendix.
33
Enrollment by Program (CIP1) – Top 10 Programs with Highest Enrollment
Spring 2010
Program (CIP Title) Enrollment
Undecided 3,001
Liberal Arts and Sciences/Liberal Studies 1,998
Nursing (RN Training) 1,805
Non-credential 1,346
Licensed Practical/Vocational Nurse Training 569
Medical Radiologic Technology/Science v Radiation Therapist 415
Business Administration and Management 362
Medical Administrative/Executive Assistant and Medical Secretary 303
Educational/Instructional Media Design 267
Executive Assistant/Executive Secretary 253
Spring 2011*
Program (CIP Title) Enrollment
Undecided 2,853
Registered Nursing/Registered Nurse 1,823
Non-credential 1,634
Liberal Arts and Sciences/Liberal Studies 936
Business Administration and Management 647
Licensed Practical/Vocational Nurse Training 539
Medical Radiologic Technology/Science v Radiation Therapist 405
Medical Administrative/Executive Assistant and Medical Secretary 338
Dental Hygiene/Hygienist 292
Social Work 269

Source: CPE Official Data 1A crosswalk of CIP codes to academic plans is provided in the Appendix.
34
Enrollment by Program (CIP1) – Top 10 Programs with Highest Enrollment
Spring 2012
Program (CIP Title) Enrollment
Liberal Arts and Sciences/Liberal Studies 1,966
Registered Nursing/Registered Nurse 1,606
Non-credential 1,468
Undecided 1,016
Business Administration and Management 710
Transfer Framework 442
Licensed Practical/Vocational Nurse Training 377
Social Work 316
Medical Administrative/Executive Assistant and Medical Secretary 314
Medical Radiologic Technology/Science v Radiation Therapist 312
Spring 2013
Program (CIP Title) Enrollment
Liberal Arts and Sciences/Liberal Studies 4,214
Non-credential 1,450
Undecided 860
Registered Nursing/Registered Nurse 696
Business Administration and Management 694
Licensed Practical/Vocational Nurse Training 278
Medical Administrative/Executive Assistant and Medical Secretary 268
Computer and Information Sciences 244
Criminal Justice/Law Enforcement Administration 216
Medical Radiologic Technology/Science v Radiation Therapist 213

Source: CPE Official Data
*The CIP Title is missing for 786 students in Spring 2011. As such, these data may underestimate the true number of students in each program. 1A crosswalk of CIP codes to academic plans is provided in the Appendix.
35
Enrollment by Program (CIP1) – All Programs
Program (CIP Title) Spring 2009 Spring 2010 Spring 2011* Spring 2012 Spring 2013
Administrative Assistant and Secretarial Science 1
Aesthetician/Esthetician and Skin Care Specialist 14 19 19 18 14
American History (United States) 23
Applied Horticulture/Horticultural Operations 18 15 4 1 2
Architectural Drafting and Architectural CAD/CADD 93 75 66 67 94
Associate in Fine Arts 11
Autobody/Collision and Repair Technology/Technician 27 27 32 24 17
Automobile/Automotive Mechanics Technology/Technician 62 67 64 69 50
Biology Technician/Biotechnology Laboratory Technician 8 17 43
Biology/Biological Sciences 82 2
Building/Property Maintenance and Management 2 3 3
Business Administration and Management 250 362 647 710 694
Business/Commerce 115 4
Carpentry/Carpenter 63 62 51 51 37
Cartography 1 2 5 1
Chemistry 26
Child Care Provider/Assistant 154 174 181 164 165
Cinematography and Film/Video Production 18 15 19 13 13
Civil Engineering Technology/Technician 18 30 48 36 72
Clinical/Medical Laboratory Technician 8 18 5 2 7
Communications Technology/Technician 1 1
Computer and Information Sciences 50 92 177 175 244
Cosmetology/Cosmetologist 53 68 58 51 39
Criminal Justice/Law Enforcement Administration 74 201 216
Data Processing and Data Processing Technology/Technician 216 250 190 218 102

Source: CPE Official Data
*The CIP Title is missing for 786 students in Spring 2011. As such, these data may underestimate the true number of students in each program. 1A crosswalk of CIP codes to academic plans is provided in the Appendix.
36
Enrollment by Program (CIP1) – All Programs
Program (CIP Title) Spring 2009 Spring 2010 Spring 2011* Spring 2012 Spring 2013
Dental Hygiene/Hygienist 244 250 292 285 191
Dental Laboratory Technology/Technician 38 42 32 35 29
Diesel Mechanics Technology/Technician 10 15 12 12 1
Drafting and Design Technology/Technician 14 23 31 32 35
Educational/Instructional Media Design 189 267 211 171 178
Electrical, Electronic and Communications Engineering
Technology/Technician 19 16 36 12 4
Electrician 99 112 108 99 102
Electromechanical and Instrumentation and Maintenance
Technologies/Technicians 11
Elementary Education and Teaching 110 2
Emergency Medical Technology/Technician (EMT Paramedic) 4 10 13 14 10
Engineering 97 1
Engineering Technology 69 81 114 84 90
English Language and Literature 35 2
Environmental Engineering Technology/Environmental Technology 31 51 53 36 39
Equestrian/Equine Studies 16 19 41 44 43
Executive Assistant/Executive Secretary 289 253 240 221 190
Fine/Studio Arts 2 16 1
Fire Science/Fire-fighting 31 57 70 53 52
General Occupational/Technical Studies 19 33 30 47 57
General Studies 143 1
Health Information/Medical Records Technology/Technician 19 49
Health Services/Allied Health/Health Sciences 37 56 1
Health Teacher Education 12
Heating, Air Conditioning, Ventilation and Refrigeration Maintenance
Technology/Technician 79 115 120 116 91

Source: CPE Official Data
*The CIP Title is missing for 786 students in Spring 2011. As such, these data may underestimate the true number of students in each program. 1A crosswalk of CIP codes to academic plans is provided in the Appendix.
37
Enrollment by Program (CIP1) – All Programs
Program (CIP Title) Spring 2009 Spring 2010 Spring 2011* Spring 2012 Spring 2013
Industrial Mechanics and Maintenance Technology 122 127 120 135 152
Junior High/Intermediate/Middle School Education and Teaching 34 1
Liberal Arts and Sciences/Liberal Studies 1,982 1,998 936 1,966 4,214
Licensed Practical/Vocational Nurse Training 447 569 539 377 278
Machine Shop Technology/Assistant 45 33 39 47 56
Mason/Masonry 17 16 4 1
Mathematics 11
Medical Administrative/Executive Assistant and Medical Secretary 153 303 338 314 268
Medical Radiologic Technology/Science v Radiation Therapist 393 415 405 312 213
Medical/Clinical Assistant 74 126 145 145 106
Non-credential 1,326 1,346 1,634 1,468 1,450
Nuclear Medical Technology/Technologist 44 55 46 36 31
Nursing (RN Training) 1,583 1,805 4
Pharmacy Technician/Assistant 9 43 1
Physical Sciences 9
Political Science and Government 33 2
Psychology 119 2
Real Estate 1 4 4
Registered Nursing/Registered Nurse 1,823 1,606 696
Respiratory Care Therapy/Therapist 52 88 107 100 74
Rhetoric and Composition 5
Securities Services Administration/Management 17 9 1 2
Security and Protective Services 1 11 36 32 11
Small Engine Mechanics and Repair Technology/Technician 1 1
Social Sciences 7
Social Work 45 98 269 316 213
Source: CPE Official Data
*The CIP Title is missing for 786 students in Spring 2011. As such, these data may underestimate the true number of students in each program. 1A crosswalk of CIP codes to academic plans is provided in the Appendix.
38
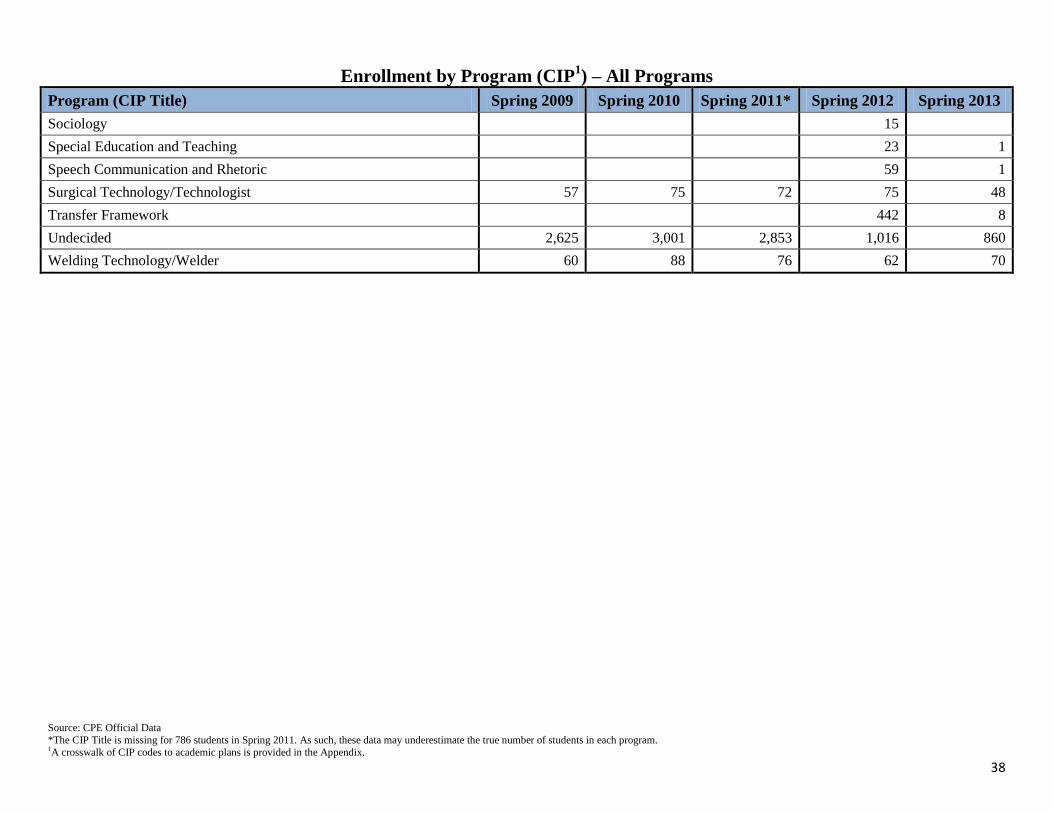
Enrollment by Program (CIP1) – All Programs
Program (CIP Title) Spring 2009 Spring 2010 Spring 2011* Spring 2012 Spring 2013
Sociology 15
Special Education and Teaching 23 1
Speech Communication and Rhetoric 59 1
Surgical Technology/Technologist 57 75 72 75 48
Transfer Framework 442 8
Undecided 2,625 3,001 2,853 1,016 860
Welding Technology/Welder 60 88 76 62 70

Source: CPE Official Data; KCTCS Unofficial Database (used for enrollment by location only) 1Headcounts by location include only students taking classes in-person (includes hybrid classes, online classes were excluded). Counts are duplicated, so a student may be counted more than once if attending classes at more than one location. 2Due to data entry errors in PeopleSoft for Summer 2012, data are not available for Native Hawaiian students for the 2012-2013 academic year. 3A crosswalk of CIP codes to academic plans is provided in the Appendix.
39
2012-2013 Academic Year Enrollment Overview
Total Enrollment
Total Enrollment 17,788
Online Enrollment 15,264
First-Time Freshmen
4,053
In-Person Enrollment by Location (Duplicated)1
Location N
Cooper 7,718
Leestown 2,983
Regency 858
Danville 1,275
Lawrenceburg 1,252
Winchester 1,026
Enrollment by Race/Ethnicity
Race/Ethnicity N %
American Indian 94 0.5%
Asian 296 1.7%
African American 2,279 12.8%
Hispanic 624 3.5%
Native Hawaiian2
Unknown Unknown
Non-Resident Alien 187 1.1%
Two or More Races 237 1.3%
Unknown 476 2.7%
White 13,595 76.4%
Total 17,788 -
Enrollment by Gender
Gender N %
Female 10,339 58.1%
Male 7,404 41.6%
Unknown 45 0.3%
Total 17,788 -
Top 10 Programs (CIP3) by Enrollment
Program (CIP Title) N
Liberal Arts and Sciences/Liberal Studies 6,126
Non-credential 2,951
Undecided 1,612
Registered Nursing/Registered Nurse 1,174
Business Administration and Management 1,090
Licensed Practical/Vocational Nurse Training 435
Medical Administrative/Executive Assistant
and Medical Secretary 419
Computer and Information Sciences 368
Medical Radiologic Technology/Science v
Radiation Therapist 342
Social Work 336

Source: CPE Official Data
40
Top 25 Kentucky Feeder High Schools in the 2012-2013 Academic Year*
Kentucky High School Count Kentucky High School Count
BCTC Students Earning a GED*
BCTC Students Attending an Out of
State High School*
BCTC Students Attending Home
School*
*Data not available for 2012-2013 academic year due to a data load
error at the system level for Spring 2013.

Source: CPE Official Data
41
Academic Year Enrollment Trends (2008-2009 Academic Year – 2012-2013 Academic Year)
Total Enrollment by Academic Year
Enrollment 2008-2009
Acad. Year
2009-2010
Acad. Year
2010-2011
Acad. Year
2011-2012
Acad. Year
2012-2013
Acad. Year
Total 5-Year
Change
Headcount 16,969 18,598 19,258 19,188 17,788 819
Percent Change - 9.6% 3.5% -0.4% -7.3% 4.8%
16,969
18,598
19,258 19,188
17,788
14,000
15,000
16,000
17,000
18,000
19,000
20,000
21,000
22,000
2008-2009Acad. Year
2009-2010Acad. Year
2010-2011Acad. Year
2011-2012Acad. Year
2012-2013Acad. Year
Total Enrollment by Academic Year

Source: CPE Official Data
42
Online Enrollment by Academic Year
Enrollment 2008-2009
Acad. Year
2009-2010
Acad. Year
2010-2011
Acad. Year
2011-2012
Acad. Year
2012-2013
Acad. Year
Total 5-Year
Change
Headcount 10,815 12,137 14,644 16,071 15,264 4,449
Percent Change - 12.2% 20.7% 9.7% -5.0% 41.1%
Enrollment of First-Time Freshmen by Academic Year
Enrollment 2008-2009
Acad. Year
2009-2010
Acad. Year
2010-2011
Acad. Year
2011-2012
Acad. Year
2012-2013
Acad. Year
Total 5-Year
Change
Headcount 3,873 4,413 4,164 4,186 4,053 180
Percent Change - 13.9% -5.6% 0.5% -3.2% 4.6%
10,815 12,137
14,644 16,071
15,264
5,000
7,000
9,000
11,000
13,000
15,000
17,000
19,000
2008-2009Acad. Year
2009-2010Acad. Year
2010-2011Acad. Year
2011-2012Acad. Year
2012-2013Acad. Year
Online Enrollment by Academic Year
3,873
4,413
4,164 4,186 4,053
3,000
3,500
4,000
4,500
5,000
2008-2009Acad. Year
2009-2010Acad. Year
2010-2011Acad. Year
2011-2012Acad. Year
2012-2013Acad. Year
Enrollment of First-Time Freshmen by Academic Year
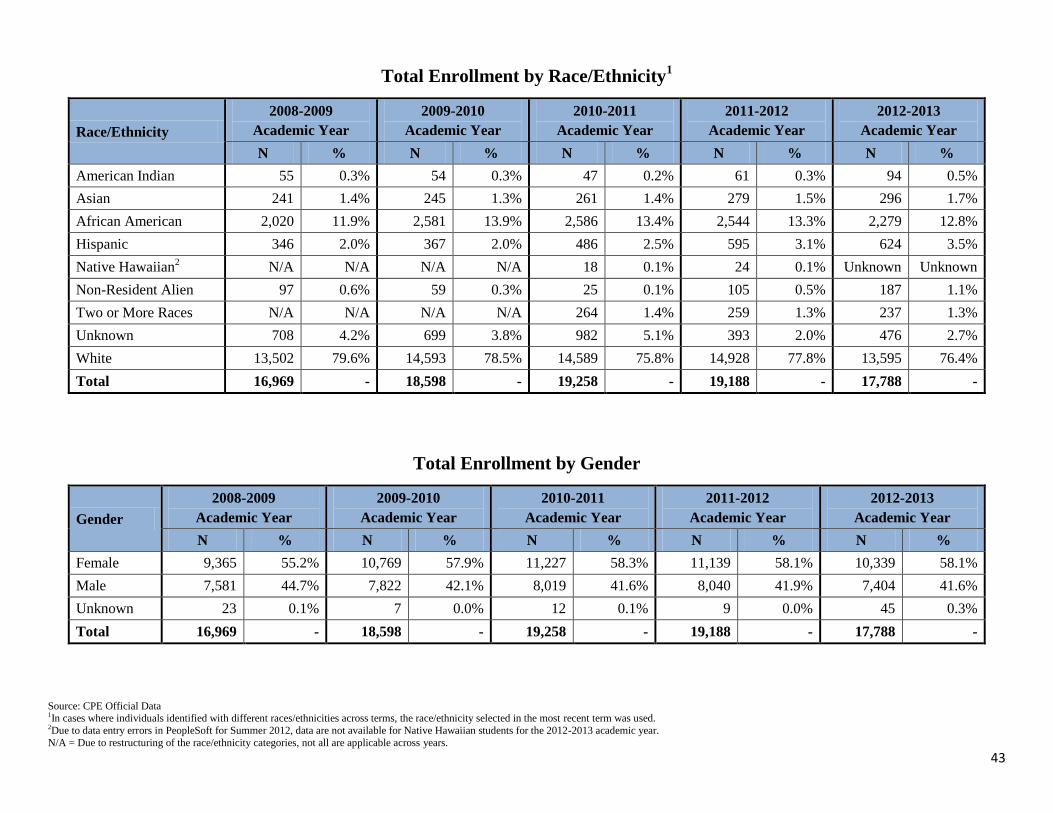
Source: CPE Official Data 1In cases where individuals identified with different races/ethnicities across terms, the race/ethnicity selected in the most recent term was used. 2Due to data entry errors in PeopleSoft for Summer 2012, data are not available for Native Hawaiian students for the 2012-2013 academic year.
N/A = Due to restructuring of the race/ethnicity categories, not all are applicable across years.
43
Total Enrollment by Race/Ethnicity1
Race/Ethnicity
2008-2009
Academic Year
2009-2010
Academic Year
2010-2011
Academic Year
2011-2012
Academic Year
2012-2013
Academic Year
N % N % N % N % N %
American Indian 55 0.3% 54 0.3% 47 0.2% 61 0.3% 94 0.5%
Asian 241 1.4% 245 1.3% 261 1.4% 279 1.5% 296 1.7%
African American 2,020 11.9% 2,581 13.9% 2,586 13.4% 2,544 13.3% 2,279 12.8%
Hispanic 346 2.0% 367 2.0% 486 2.5% 595 3.1% 624 3.5%
Native Hawaiian2
N/A N/A N/A N/A 18 0.1% 24 0.1% Unknown Unknown
Non-Resident Alien 97 0.6% 59 0.3% 25 0.1% 105 0.5% 187 1.1%
Two or More Races N/A N/A N/A N/A 264 1.4% 259 1.3% 237 1.3%
Unknown 708 4.2% 699 3.8% 982 5.1% 393 2.0% 476 2.7%
White 13,502 79.6% 14,593 78.5% 14,589 75.8% 14,928 77.8% 13,595 76.4%
Total 16,969 - 18,598 - 19,258 - 19,188 - 17,788 -
Total Enrollment by Gender
Gender
2008-2009
Academic Year
2009-2010
Academic Year
2010-2011
Academic Year
2011-2012
Academic Year
2012-2013
Academic Year
N % N % N % N % N %
Female 9,365 55.2% 10,769 57.9% 11,227 58.3% 11,139 58.1% 10,339 58.1%
Male 7,581 44.7% 7,822 42.1% 8,019 41.6% 8,040 41.9% 7,404 41.6%
Unknown 23 0.1% 7 0.0% 12 0.1% 9 0.0% 45 0.3%
Total 16,969 - 18,598 - 19,258 - 19,188 - 17,788 -

Source: CPE Official Data 1A crosswalk of CIP codes to academic plans is provided in the Appendix.
44
Enrollment by Program (CIP1) – Top 10 Programs with Highest Enrollment
2008-2009 Academic Year
Program (CIP Title) Enrollment
Undecided 3,916
Non-credential 3,578
Liberal Arts and Sciences/Liberal Studies 2,880
Nursing (RN Training) 2,042
Licensed Practical/Vocational Nurse Training 683
Medical Radiologic Technology/Science v Radiation Therapist 520
Executive Assistant/Executive Secretary 406
Business Administration and Management 345
Dental Hygiene/Hygienist 338
Data Processing and Data Processing Technology/Technician 281
9,365
10,769
11,227 11,139
10,339
7,581 7,822
8,019 8,040
7,404
5,000
6,000
7,000
8,000
9,000
10,000
11,000
12,000
2008-2009Acad. Year
2009-2010Acad. Year
2010-2011Acad. Year
2011-2012Acad. Year
2012-2013Acad. Year
Enrollment by Gender
Female
Male

Source: CPE Official Data
*The CIP Title is missing for 786 students in Spring 2011. As a result, these data may underestimate the true number of students in each program. 1A crosswalk of CIP codes to academic plans is provided in the Appendix.
45
Enrollment by Program (CIP1) – Top 10 Programs with Highest Enrollment
2009-2010 Academic Year
Program (CIP Title) Enrollment
Undecided 4,392
Non-credential 3,395
Liberal Arts and Sciences/Liberal Studies 2,873
Nursing (RN Training) 2,457
Licensed Practical/Vocational Nurse Training 793
Medical Radiologic Technology/Science v Radiation Therapist 551
Business Administration and Management 466
Executive Assistant/Executive Secretary 384
Medical Administrative/Executive Assistant and Medical Secretary 370
Educational/Instructional Media Design 354
2010-2011 Academic Year*
Program (CIP Title) Enrollment
Undecided 4,405
Non-credential 3,565
Liberal Arts and Sciences/Liberal Studies 2,438
Registered Nursing/Registered Nurse 2,361
Licensed Practical/Vocational Nurse Training 952
Business Administration and Management 823
Nursing (RN Training) 724
Medical Radiologic Technology/Science v Radiation Therapist 551
Medical Administrative/Executive Assistant and Medical Secretary 441
Dental Hygiene/Hygienist 374

Source: CPE Official Data 1A crosswalk of CIP codes to academic plans is provided in the Appendix.
46
Enrollment by Program (CIP1) – Top 10 Programs with Highest Enrollment
2011-2012 Academic Year
Program (CIP Title) Enrollment
Non-credential 3,123
Undecided 2,583
Registered Nursing/Registered Nurse 2,557
Liberal Arts and Sciences/Liberal Studies 2,516
Business Administration and Management 1,140
Transfer Framework 656
Licensed Practical/Vocational Nurse Training 641
Medical Radiologic Technology/Science v Radiation Therapist 524
Medical Administrative/Executive Assistant and Medical Secretary 480
Social Work 479
2012-2013 Academic Year
Program (CIP Title) Enrollment
Liberal Arts and Sciences/Liberal Studies 6,126
Non-credential 2,951
Undecided 1,612
Registered Nursing/Registered Nurse 1,174
Business Administration and Management 1,090
Licensed Practical/Vocational Nurse Training 435
Medical Administrative/Executive Assistant and Medical Secretary 419
Computer and Information Sciences 368
Medical Radiologic Technology/Science v Radiation Therapist 342
Social Work 336

Source: CPE Official Data
*The CIP Title is missing for 786 students in Spring 2011. As a result, these data may underestimate the true number of students in each program. 1A crosswalk of CIP codes to academic plans is provided in the Appendix.
47
Enrollment by Program (CIP1) – All Programs
Program (CIP Title) 2008-2009
Acad. Year
2009-2010
Acad. Year
2010-2011
Acad. Year*
2011-2012
Acad. Year
2012-2013
Acad. Year
Administrative Assistant and Secretarial Science 1 2
Aesthetician/Esthetician and Skin Care Specialist 17 27 31 22 18
American History (United States) 38 2
Applied Horticulture/Horticultural Operations 45 38 11 3 4
Architectural Drafting and Architectural CAD/CADD 122 94 98 96 140
Associate in Fine Arts 11
Autobody/Collision and Repair Technology/Technician 39 36 40 38 36
Automobile/Automotive Mechanics Technology/Technician 74 100 113 118 93
Biology Technician/Biotechnology Laboratory Technician 10 34 59
Biology/Biological Sciences 128 4
Building/Property Maintenance and Management 2 5 5
Business Administration and Management 345 466 823 1,140 1,090
Business/Commerce 191 9
Carpentry/Carpenter 89 107 73 74 70
Cartography 1 3 7 6
Chemistry 33 1
Child Care Provider/Assistant 211 256 258 246 265
Cinematography and Film/Video Production 24 19 28 21 26
Civil Engineering Technology/Technician 30 37 64 56 99
Clinical/Medical Laboratory Technician 20 28 17 6 11
Communications Technology/Technician 1 1 11
Computer and Information Sciences 72 122 249 287 368
Computer Installation and Repair Technology/Technician 2
Cosmetology/Cosmetologist 66 85 92 79 65

Source: CPE Official Data
*The CIP Title is missing for 786 students in Spring 2011. As a result, these data may underestimate the true number of students in each program. 1A crosswalk of CIP codes to academic plans is provided in the Appendix.
48
Enrollment by Program (CIP1) – All Programs
Program (CIP Title) 2008-2009
Acad. Year
2009-2010
Acad. Year
2010-2011
Acad. Year*
2011-2012
Acad. Year
2012-2013
Acad. Year
Criminal Justice/Law Enforcement Administration 74 324 331
Data Processing and Data Processing Technology/Technician 281 334 295 302 175
Dental Hygiene/Hygienist 338 346 374 425 306
Dental Laboratory Technology/Technician 44 51 45 52 39
Diesel Mechanics Technology/Technician 15 22 16 23 9
Drafting and Design Technology/Technician 21 27 43 56 59
Educational/Instructional Media Design 250 354 332 271 289
Electrical, Electronic and Communications Engineering
Technology/Technician 24 27 44 33 8
Electrician 147 173 162 172 154
Electromechanical and Instrumentation and Maintenance
Technologies/Technicians 16
Elementary Education and Teaching 179 2
Emergency Medical Technology/Technician (EMT Paramedic) 9 16 25 18 21
Engineering 135 2
Engineering Technology 101 115 152 135 141
English Language and Literature 53 3
Environmental Engineering Technology/Environmental Technology 38 64 60 60 60
Equestrian/Equine Studies 22 32 59 73 63
Executive Assistant/Executive Secretary 406 384 337 294 282
Fine/Studio Arts 2 29 2
Fire Science/Fire-fighting 59 82 91 88 73
General Occupational/Technical Studies 23 46 47 74 84
General Studies 220 3

Source: CPE Official Data
*The CIP Title is missing for 786 students in Spring 2011. As a result, these data may underestimate the true number of students in each program. 1A crosswalk of CIP codes to academic plans is provided in the Appendix.
49
Enrollment by Program (CIP1) – All Programs
Program (CIP Title) 2008-2009
Acad. Year
2009-2010
Acad. Year
2010-2011
Acad. Year*
2011-2012
Acad. Year
2012-2013
Acad. Year
Health Information/Medical Records Technology/Technician 20 84
Health Services/Allied Health/Health Sciences 37 95 2
Health Teacher Education 18
Heating, Air Conditioning, Ventilation and Refrigeration Maintenance
Technology/Technician 100 158 156 171 141
Industrial Mechanics and Maintenance Technology 178 181 181 203 203
Junior High/Intermediate/Middle School Education and Teaching 46 3
Liberal Arts and Sciences/Liberal Studies 2,880 2,873 2,438 2,516 6,126
Licensed Practical/Vocational Nurse Training 683 793 952 641 435
Machine Shop Technology/Assistant 65 48 57 65 70
Mason/Masonry 36 47 12 3 1
Mathematics 21
Medical Administrative/Executive Assistant and Medical Secretary 218 370 441 480 419
Medical Radiologic Technology/Science v Radiation Therapist 520 551 551 524 342
Medical/Clinical Assistant 107 167 192 247 171
Non-credential 3,578 3,395 3,565 3,123 2,951
Nuclear Medical Technology/Technologist 54 66 65 62 37
Nursing (RN Training) 2,042 2,457 724 2
Pharmacy Technician/Assistant 9 56 1
Physical Sciences 14 1
Political Science and Government 42 2
Psychology 199 5
Real Estate 4 9 9
Registered Nursing/Registered Nurse 2,361 2,557 1,174

Source: CPE Official Data
*The CIP Title is missing for 786 students in Spring 2011. As a result, these data may underestimate the true number of students in each program. 1A crosswalk of CIP codes to academic plans is provided in the Appendix.
50
Enrollment by Program (CIP1) – All Programs
Program (CIP Title) 2008-2009
Acad. Year
2009-2010
Acad. Year
2010-2011
Acad. Year*
2011-2012
Acad. Year
2012-2013
Acad. Year
Respiratory Care Therapy/Therapist 71 109 145 152 102
Rhetoric and Composition 7
Securities Services Administration/Management 66 19 1 13 4
Security and Protective Services 1 13 49 49 33
Small Engine Mechanics and Repair Technology/Technician 2 1 2
Social Sciences 10
Social Work 67 122 332 479 336
Sociology 28
Special Education and Teaching 31 1
Speech Communication and Rhetoric 83 5
Surgical Technology/Technologist 90 116 116 148 93
Transfer Framework 656 20
Undecided 3,916 4,392 4,405 2,583 1,612
Welding Technology/Welder 94 114 106 96 109

51
Credentials
2008-2009 Academic Year – 2012-2013 Academic Year
Total Credentials Awarded
Credentials Awarded by Race/Ethnicity
Credentials Awarded by Gender
Credentials Awarded by Program (CIP)
Credentials Earned by Home County

Source: CPE Official Data
*Students are counted more than once if they earned multiple credentials in the same academic year or more than one credential across academic years.
52
Total Credentials Awarded (2008-2009 Academic Year – 2012-2013 Academic Year)
Total Credentials Awarded by Academic Year (Duplicated)*
Type of
Credential
2008-2009
Acad. Year
2009-2010
Acad. Year
2010-2011
Acad. Year
2011-2012
Acad. Year
2012-2013
Acad. Year
Total 5-Year
Change
Associate Degrees 1,055 1,029 1,138 1,287 1,276 221 (20.9%)
Certificates 1,764 1,843 2,140 1,882 1,747 -17 (-1.0%)
Diplomas 342 331 416 401 366 24 (7.0%)
Total 3,161 3,203 3,694 3,570 3,389 228 (7.2%)
1,055 1,029 1,138
1,287 1,276
1,764 1,843
2,140
1,882 1,747
342 331 416 401 366
3,161 3,203
3,694 3,570
3,389
0
500
1,000
1,500
2,000
2,500
3,000
3,500
4,000
4,500
2008-2009Acad. Year
2009-2010Acad. Year
2010-2011Acad. Year
2011-2012Acad. Year
2012-2013Acad. Year
Total Credentials Awarded by Academic Year (Duplicated)*
AssociateDegrees
Certificates
Diplomas
Total

Source: CPE Official Data
*Students are counted more than once if they earned multiple credentials in the same academic year or more than one credential across academic years.
N/A = Due to restructuring of the race/ethnicity categories, not all are applicable across years.
53
Credentials Awarded by Race/Ethnicity (2008-2009 Academic Year – 2012-2013 Academic Year)
Total Credentials Awarded by Race/Ethnicity (Duplicated)*
Race/Ethnicity
2008-2009
Acad. Year
2009-2010
Acad. Year
2010-2011
Acad. Year
2011-2012
Acad. Year
2012-2013
Acad. Year
N % N % N % N % N %
American Indian 5 0.2% 2 0.1% 13 0.4% 15 0.4% 6 0.2%
Asian 26 0.8% 28 0.9% 32 0.9% 31 0.9% 31 0.9%
African American 287 9.1% 355 11.1% 365 9.9% 319 8.9% 283 8.4%
Hispanic 53 1.7% 49 1.5% 50 1.4% 80 2.2% 84 2.5%
Native Hawaiian N/A N/A N/A N/A N/A N/A 2 0.1% 8 0.2%
Non-Resident Alien 20 0.6% 21 0.7% 11 0.3% 13 0.4% 11 0.3%
Two or More Races N/A N/A N/A N/A N/A N/A 38 1.1% 41 1.2%
Unknown 159 5.0% 174 5.4% 67 1.8% 43 1.2% 23 0.7%
White 2,611 82.6% 2,574 80.4% 3,156 85.4% 3,029 84.8% 2,902 85.6%
Total 3,161 - 3,203 - 3,694 - 3,570 - 3,389 -

Source: CPE Official Data
*Students are counted more than once if they earned multiple credentials in the same academic year or more than one credential across academic years.
54
Percentage of Total Credentials Awarded by Race/Ethnicity (Duplicated)*
0.2% 0.8%
9.1%
1.7%
0.6%
5.0%
82.6%
2008-2009 Academic Year
American Indian
Asian
African American
Hispanic
Non-Resident Alien
Unknown
White
0.1%
0.9%
11.1% 1.5%
0.7%
5.4%
80.4%
2009-2010 Academic Year
American Indian
Asian
African American
Hispanic
Non-Resident Alien
Unknown
White

Source: CPE Official Data
*Students are counted more than once if they earned multiple credentials in the same academic year or more than one credential across academic years.
55
Percentage of Total Credentials Awarded by Race/Ethnicity (Duplicated)*
0.4% 0.9%
9.9%
1.4% 0.3%
1.8%
85.4%
2010-2011 Academic Year
American Indian
Asian
African American
Hispanic
Non-Resident Alien
Unknown
White
0.4% 0.9%
8.9%
2.2% 0.4%
1.2%
84.8%
0.1%
1.1% 2011-2012 Academic Year
American Indian
Asian
African American
Hispanic
Non-Resident Alien
Unknown
White
Native Hawaiian
Two or More Races
Source: CPE Official Data
*Students are counted more than once if they earned multiple credentials in the same academic year or more than one credential across academic years.
56
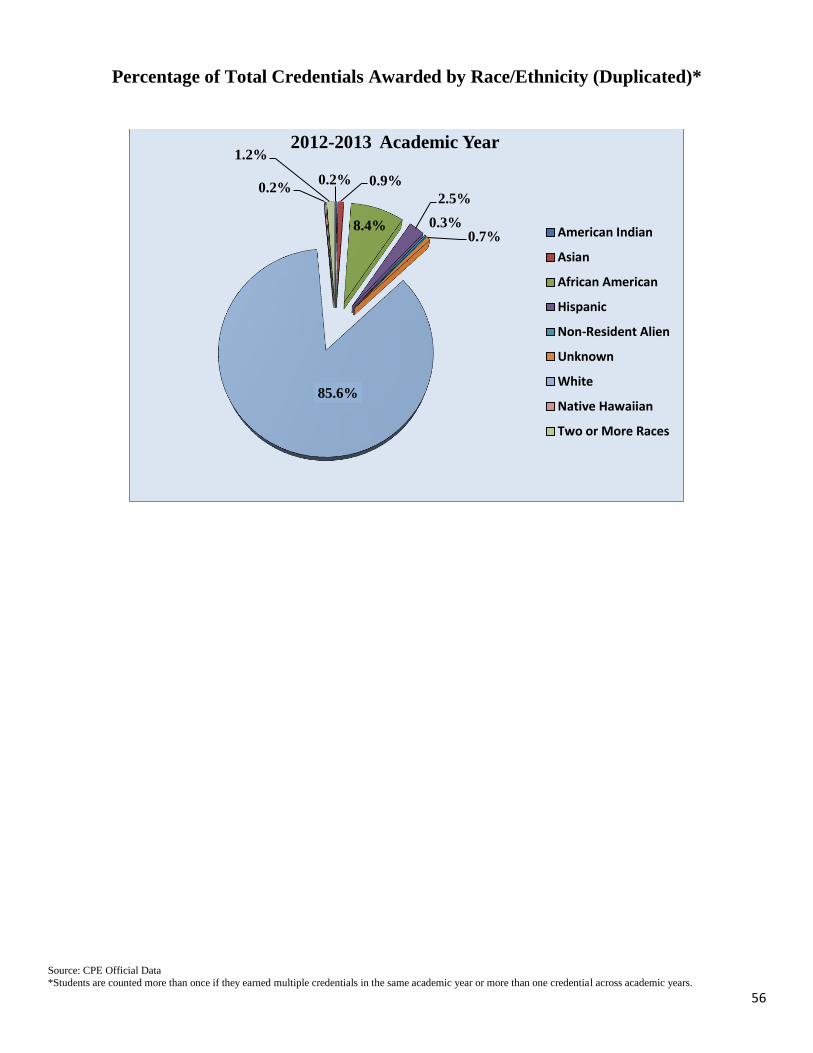
Percentage of Total Credentials Awarded by Race/Ethnicity (Duplicated)*
0.2% 0.9%
8.4%
2.5%
0.3% 0.7%
85.6%
0.2%
1.2% 2012-2013 Academic Year
American Indian
Asian
African American
Hispanic
Non-Resident Alien
Unknown
White
Native Hawaiian
Two or More Races

Source: CPE Official Data
*Students are counted more than once if they earned multiple credentials in the same academic year or more than one credential across academic years.
N/A = Due to restructuring of the race/ethnicity categories, not all are applicable across years.
57
Associate Degrees Awarded by Race/Ethnicity (Duplicated)*
Race/Ethnicity
2008-2009
Acad. Year
2009-2010
Acad. Year
2010-2011
Acad. Year
2011-2012
Acad. Year
2012-2013
Acad. Year
N % N % N % N % N %
American Indian 4 0.4% 1 0.1% 4 0.4% 4 0.3% 1 0.1%
Asian 13 1.2% 13 1.3% 15 1.3% 19 1.5% 19 1.5%
African American 86 8.2% 80 7.8% 94 8.3% 101 7.8% 105 8.2%
Hispanic 17 1.6% 12 1.2% 13 1.1% 40 3.1% 39 3.1%
Native Hawaiian N/A N/A N/A N/A N/A N/A 1 0.1% 4 0.3%
Non-Resident Alien 8 0.8% 10 1.0% 8 0.7% 9 0.7% 2 0.2%
Two or More Races N/A N/A N/A N/A N/A N/A 15 1.2% 12 0.9%
Unknown 45 4.3% 51 5.0% 31 2.7% 12 0.9% 13 1.0%
White 882 83.6% 862 83.8% 973 85.5% 1,086 84.4% 1,081 84.7%
Total 1,055 - 1,029 - 1,138 - 1,287 - 1,276 -

Source: CPE Official Data
*Students are counted more than once if they earned multiple credentials in the same academic year or more than one credential across academic years.
N/A = Due to restructuring of the race/ethnicity categories, not all are applicable across years.
58
Certificates Awarded by Race/Ethnicity (Duplicated)*
Race/Ethnicity
2008-2009
Acad. Year
2009-2010
Acad. Year
2010-2011
Acad. Year
2011-2012
Acad. Year
2012-2013
Acad. Year
N % N % N % N % N %
American Indian 0 0.0% 1 0.1% 7 0.3% 9 0.5% 5 0.3%
Asian 11 0.6% 14 0.8% 15 0.7% 8 0.4% 8 0.5%
African American 173 9.8% 236 12.8% 224 10.5% 186 9.9% 152 8.7%
Hispanic 31 1.8% 36 2.0% 32 1.5% 32 1.7% 40 2.3%
Native Hawaiian N/A N/A N/A N/A N/A N/A 0 0.0% 4 0.2%
Non-Resident Alien 3 0.2% 8 0.4% 3 0.1% 4 0.2% 8 0.5%
Two or More Races N/A N/A N/A N/A N/A N/A 19 1.0% 27 1.5%
Unknown 96 5.4% 101 5.5% 29 1.4% 28 1.5% 10 0.6%
White 1,450 82.2% 1,447 78.5% 1,830 85.5% 1,596 84.8% 1,493 85.5%
Total 1,764 - 1,843 - 2,140 - 1,882 - 1,747 -

Source: CPE Official Data
*Students are counted more than once if they earned multiple credentials in the same academic year or more than one credential across academic years.
N/A = Due to restructuring of the race/ethnicity categories, not all are applicable across years.
59
Diplomas Awarded by Race/Ethnicity (Duplicated)*
Race/Ethnicity
2008-2009
Acad. Year
2009-2010
Acad. Year
2010-2011
Acad. Year
2011-2012
Acad. Year
2012-2013
Acad. Year
N % N % N % N % N %
American Indian 1 0.3% 0 0.0% 2 0.5% 2 0.5% 0 0.0%
Asian 2 0.6% 1 0.3% 2 0.5% 4 1.0% 4 1.1%
African American 28 8.2% 39 11.8% 47 11.3% 32 8.0% 26 7.1%
Hispanic 5 1.5% 1 0.3% 5 1.2% 8 2.0% 5 1.4%
Native Hawaiian N/A N/A N/A N/A N/A N/A 1 0.2% 0 0.0%
Non-Resident Alien 9 2.6% 3 0.9% 0 0.0% 0 0.0% 1 0.3%
Two or More Races N/A N/A N/A N/A N/A N/A 4 1.0% 2 0.5%
Unknown 18 5.3% 22 6.6% 7 1.7% 3 0.7% 0 0.0%
White 279 81.6% 265 80.1% 353 84.9% 347 86.5% 328 89.6%
Total 342 - 331 - 416 - 401 - 366 -
Source: CPE Official Data
*Students are counted more than once if they earned multiple credentials in the same academic year or more than one credential across academic years.
60
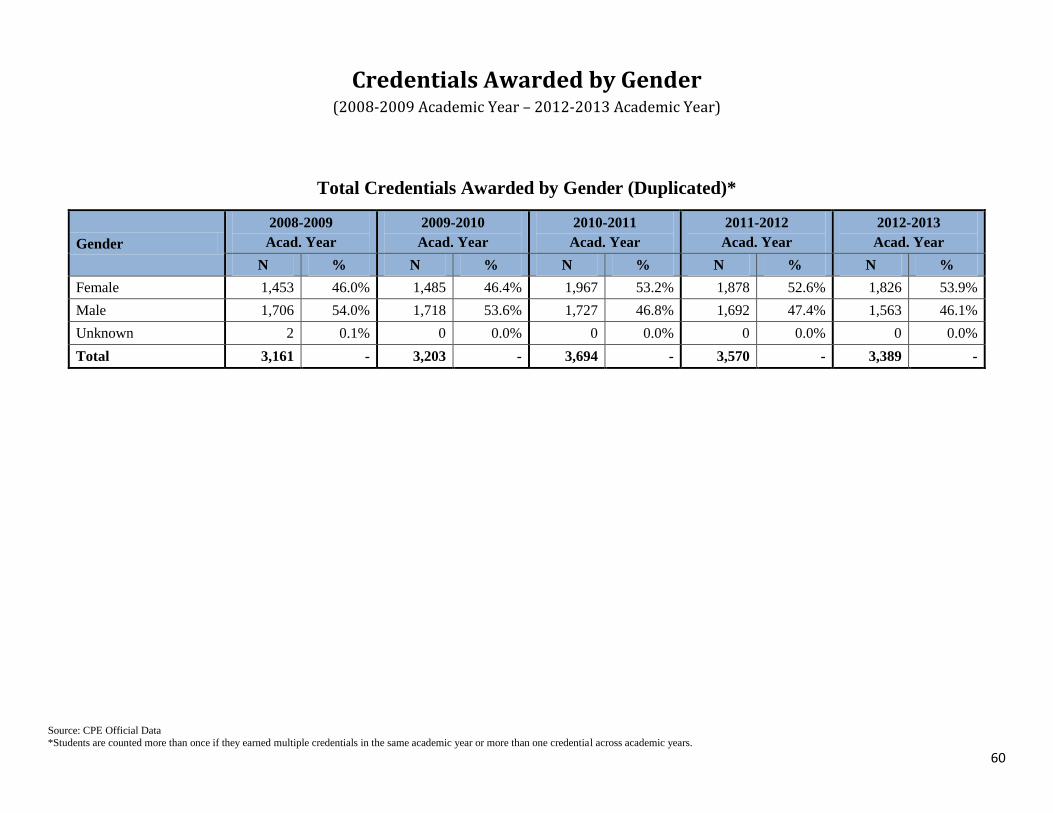
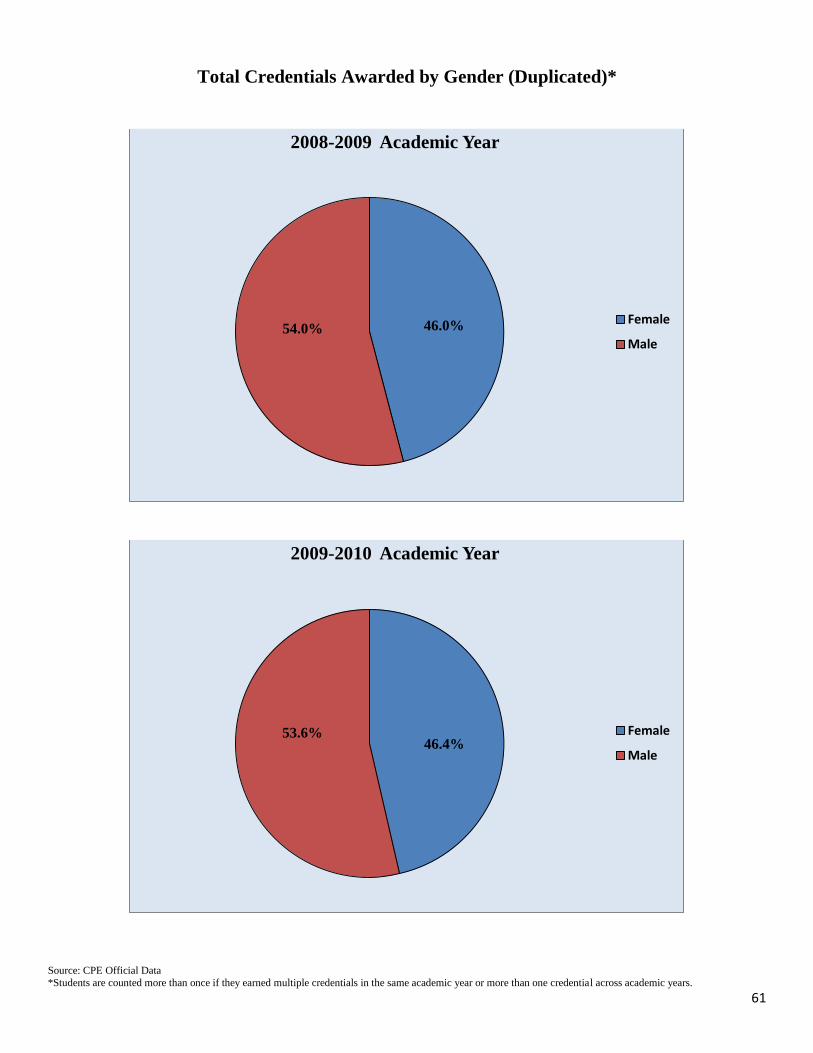
Credentials Awarded by Gender (2008-2009 Academic Year – 2012-2013 Academic Year)
Total Credentials Awarded by Gender (Duplicated)*
Gender
2008-2009
Acad. Year
2009-2010
Acad. Year
2010-2011
Acad. Year
2011-2012
Acad. Year
2012-2013
Acad. Year
N % N % N % N % N %
Female 1,453 46.0% 1,485 46.4% 1,967 53.2% 1,878 52.6% 1,826 53.9%
Male 1,706 54.0% 1,718 53.6% 1,727 46.8% 1,692 47.4% 1,563 46.1%
Unknown 2 0.1% 0 0.0% 0 0.0% 0 0.0% 0 0.0%
Total 3,161 - 3,203 - 3,694 - 3,570 - 3,389 -
Source: CPE Official Data
*Students are counted more than once if they earned multiple credentials in the same academic year or more than one credential across academic years.
61
Total Credentials Awarded by Gender (Duplicated)*
46.0% 54.0%
2008-2009 Academic Year
Female
Male
46.4% 53.6%
2009-2010 Academic Year
Female
Male

Source: CPE Official Data
*Students are counted more than once if they earned multiple credentials in the same academic year or more than one credential across academic years.
62
Total Credentials Awarded by Gender (Duplicated)*
53.2%
46.8%
2010-2011 Academic Year
Female
Male
52.6%
47.4%
2011-2012 Academic Year
Female
Male

Source: CPE Official Data
*Students are counted more than once if they earned multiple credentials in the same academic year or more than one credential across academic years.
63
Total Credentials Awarded by Gender (Duplicated)*
53.9%
46.1%
2012-2013 Academic Year
Female
Male

Source: CPE Official Data *Students are counted more than once if they earned multiple credentials in the same academic year or more than one credential across academic years.
64
Associate Degrees Awarded by Gender (Duplicated)*
Gender
2008-2009
Acad. Year
2009-2010
Acad. Year
2010-2011
Acad. Year
2011-2012
Acad. Year
2012-2013
Acad. Year
N % N % N % N % N %
Female 640 60.7% 612 59.5% 684 60.1% 762 59.2% 781 61.2%
Male 414 39.2% 417 40.5% 454 39.9% 525 40.8% 495 38.8%
Unknown 1 0.1% 0 0.0% 0 0.0% 0 0.0% 0 0.0%
Total 1,055 - 1,029 - 1,138 - 1,287 - 1,276 -
Certificates Awarded by Gender (Duplicated)*
Gender
2008-2009
Acad. Year
2009-2010
Acad. Year
2010-2011
Acad. Year
2011-2012
Acad. Year
2012-2013
Acad. Year
N % N % N % N % N %
Female 644 36.5% 695 37.7% 1,037 48.5% 898 47.7% 823 47.1%
Male 1,119 63.4% 1,148 62.3% 1,103 51.5% 984 52.3% 924 52.9%
Unknown 1 0.1% 0 0.0% 0 0.0% 0 0.0% 0 0.0%
Total 1,764 - 1,843 - 2,140 - 1,882 - 1,747 -
Source: CPE Official Data *Students are counted more than once if they earned multiple credentials in the same academic year or more than one credential across academic years.
65
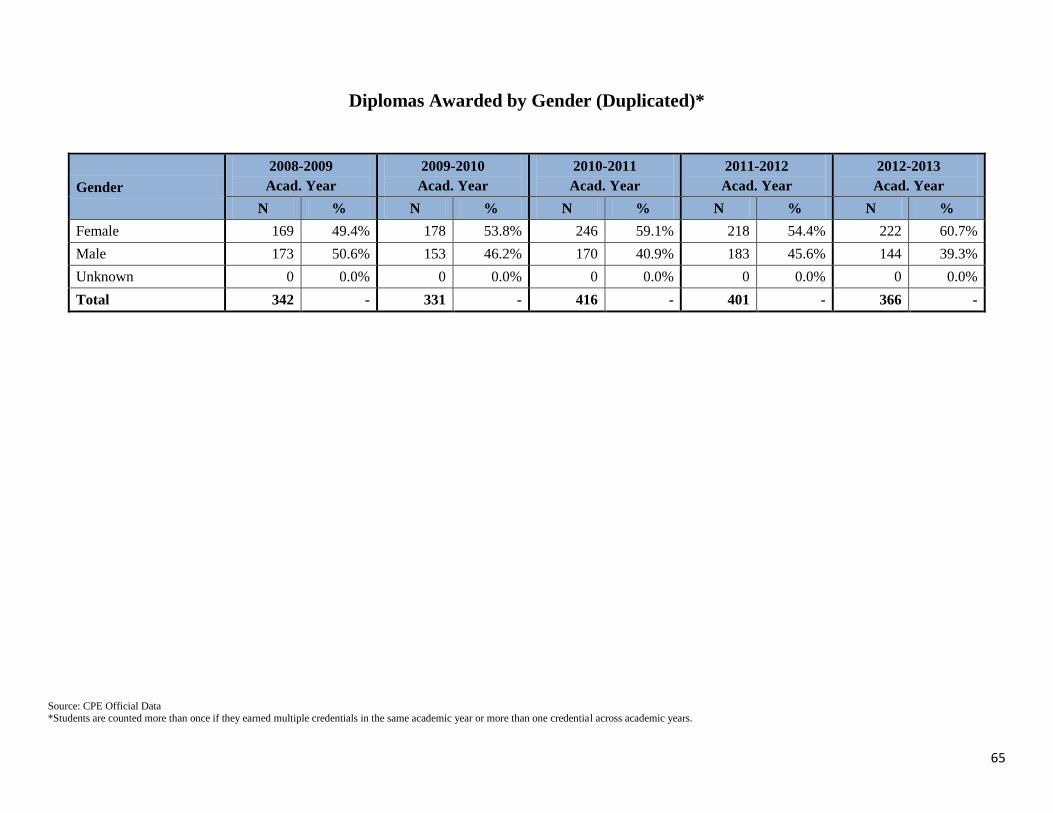
Diplomas Awarded by Gender (Duplicated)*
Gender
2008-2009
Acad. Year
2009-2010
Acad. Year
2010-2011
Acad. Year
2011-2012
Acad. Year
2012-2013
Acad. Year
N % N % N % N % N %
Female 169 49.4% 178 53.8% 246 59.1% 218 54.4% 222 60.7%
Male 173 50.6% 153 46.2% 170 40.9% 183 45.6% 144 39.3%
Unknown 0 0.0% 0 0.0% 0 0.0% 0 0.0% 0 0.0%
Total 342 - 331 - 416 - 401 - 366 -

Source: CPE Official Data 1A crosswalk of CIP codes to academic plans is provided in the Appendix. *Students are counted more than once if they earned multiple credentials in the same academic year or more than one credential across academic years.
66
Credentials Awarded by Program (CIP) (2008-2009 Academic Year – 2012-2013 Academic Year)
Total Credentials Awarded by Program (CIP1) – All Programs*
Program (CIP Title) 2008-2009
Acad. Year
2009-2010
Acad. Year
2010-2011
Acad. Year
2011-2012
Acad. Year
2012-2013
Acad. Year
Aesthetician/Esthetician and Skin Care Specialist 13 14 11
Applied Horticulture/Horticultural Operations 16 30 21
Architectural Drafting and Architectural CAD/CADD 12 14 9 13 7
Associate in Fine Arts 3
Autobody/Collision and Repair Technology/Technician 7 30 14 30 18
Automobile/Automotive Mechanics Technology/Technician 105 69 63 44 71
Biology Technician/Biotechnology Laboratory Technician 8 19 22 23
Biology/Biological Sciences 1
Business Administration and Management 57 59 43 41 31
Business/Commerce 1
Carpentry/Carpenter 173 207 64 48 47
Cartography 3 2 1 8 5
Child Care Provider/Assistant 107 68 121 67 102
Cinematography and Film/Video Production 14 14 14 9 9
Civil Engineering Technology/Technician 4 3 7 10
Clinical/Medical Laboratory Technician 16 16 17 6 10
Computer and Information Sciences 9 7 8 9 57
Computer Installation and Repair Technology/Technician 2
Cosmetology/Cosmetologist 8 15 21 19 9

Source: CPE Official Data 1A crosswalk of CIP codes to academic plans is provided in the Appendix. *Students are counted more than once if they earned multiple credentials in the same academic year or more than one credential across academic years.
67
Total Credentials Awarded by Program (CIP1) – All Programs*
Program (CIP Title) 2008-2009
Acad. Year
2009-2010
Acad. Year
2010-2011
Acad. Year
2011-2012
Acad. Year
2012-2013
Acad. Year
Criminal Justice/Law Enforcement Administration 5 3
Data Processing and Data Processing Technology/Technician 44 34 63 93 22
Dental Hygiene/Hygienist 39 54 56 38 55
Dental Laboratory Technology/Technician 27 18 12 8 18
Diesel Mechanics Technology/Technician 9 5 3 15 7
Drafting and Design Technology/Technician 4 3 35 15 21
Educational/Instructional Media Design 8 14 22 15 8
Electrical, Electronic and Communications Engineering
Technology/Technician 1 2
Electrician 282 242 283 262 184
Elementary Education and Teaching 1
Emergency Medical Technology/Technician (EMT Paramedic) 2 1 1
Engineering Technology 272 247 273 257 197
Environmental Engineering Technology/Environmental Technology 5 15 8 7 9
Equestrian/Equine Studies 5 6 8 5
Executive Assistant/Executive Secretary 156 143 352 321 222
Fire Science/Fire-fighting 4 7 3 9 11
General Occupational/Technical Studies 68 58 53 64 55
General Studies 1
Heating, Air Conditioning, Ventilation and Refrigeration Maintenance
Technology/Technician 31 47 79 60 57
Industrial Mechanics and Maintenance Technology 142 179 184 224 144
Liberal Arts and Sciences/Liberal Studies 459 467 540 652 698
Licensed Practical/Vocational Nurse Training 403 496 506 507 524
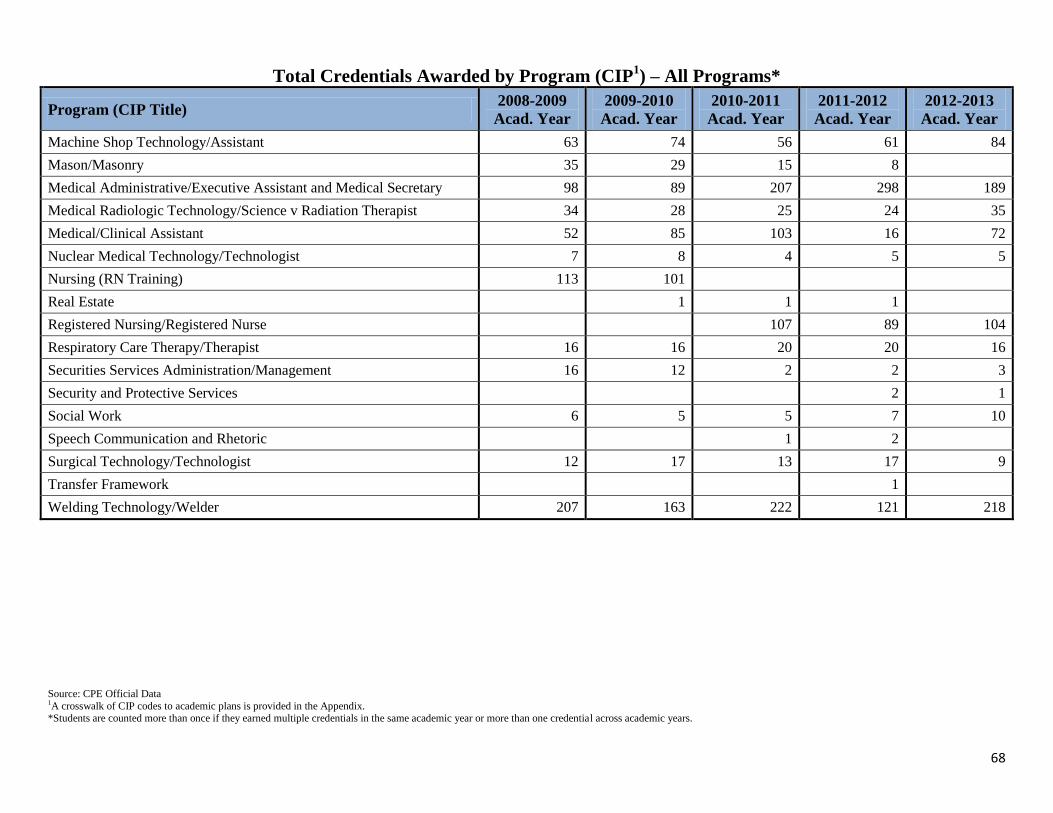
Source: CPE Official Data 1A crosswalk of CIP codes to academic plans is provided in the Appendix. *Students are counted more than once if they earned multiple credentials in the same academic year or more than one credential across academic years.
68
Total Credentials Awarded by Program (CIP1) – All Programs*
Program (CIP Title) 2008-2009
Acad. Year
2009-2010
Acad. Year
2010-2011
Acad. Year
2011-2012
Acad. Year
2012-2013
Acad. Year
Machine Shop Technology/Assistant 63 74 56 61 84
Mason/Masonry 35 29 15 8
Medical Administrative/Executive Assistant and Medical Secretary 98 89 207 298 189
Medical Radiologic Technology/Science v Radiation Therapist 34 28 25 24 35
Medical/Clinical Assistant 52 85 103 16 72
Nuclear Medical Technology/Technologist 7 8 4 5 5
Nursing (RN Training) 113 101
Real Estate 1 1 1
Registered Nursing/Registered Nurse 107 89 104
Respiratory Care Therapy/Therapist 16 16 20 20 16
Securities Services Administration/Management 16 12 2 2 3
Security and Protective Services 2 1
Social Work 6 5 5 7 10
Speech Communication and Rhetoric 1 2
Surgical Technology/Technologist 12 17 13 17 9
Transfer Framework 1
Welding Technology/Welder 207 163 222 121 218

Source: CPE Official Data 1A crosswalk of CIP codes to academic plans is provided in the Appendix. *Students are counted more than once if they earned multiple credentials in the same academic year or more than one credential across academic years.
69
Associate Degrees Awarded by Program (CIP1) – All Programs*
Program (CIP Title) 2008-2009
Acad. Year
2009-2010
Acad. Year
2010-2011
Acad. Year
2011-2012
Acad. Year
2012-2013
Acad. Year
Architectural Drafting and Architectural CAD/CADD 12 14 9 13 7
Associate in Fine Arts 3
Automobile/Automotive Mechanics Technology/Technician 6 5 4
Biology Technician/Biotechnology Laboratory Technician 3 8
Biology/Biological Sciences 1
Business Administration and Management 57 55 41 41 31
Business/Commerce 1
Carpentry/Carpenter 8 5 9 5 3
Child Care Provider/Assistant 10 6 8 13 10
Civil Engineering Technology/Technician 4 3 7 10
Computer and Information Sciences 3 1 4 21
Criminal Justice/Law Enforcement Administration 5 3
Data Processing and Data Processing Technology/Technician 29 23 36 31 6
Dental Hygiene/Hygienist 19 25 24 22 25
Dental Laboratory Technology/Technician 14 9 5 4 8
Drafting and Design Technology/Technician 1 7 3 5
Educational/Instructional Media Design 6 10 16 11 6
Electrical, Electronic and Communications Engineering
Technology/Technician 1 2
Electrician 34 26 34 34 28
Elementary Education and Teaching 1
Engineering Technology 21 23 16 20 20
Environmental Engineering Technology/Environmental Technology 5 15 8 7 9
Equestrian/Equine Studies 4 4 3 2

Source: CPE Official Data 1A crosswalk of CIP codes to academic plans is provided in the Appendix. *Students are counted more than once if they earned multiple credentials in the same academic year or more than one credential across academic years.
70
Associate Degrees Awarded by Program (CIP1) – All Programs*
Program (CIP Title) 2008-2009
Acad. Year
2009-2010
Acad. Year
2010-2011
Acad. Year
2011-2012
Acad. Year
2012-2013
Acad. Year
Executive Assistant/Executive Secretary 43 31 39 33 37
Fire Science/Fire-fighting 4 7 3 7 6
General Occupational/Technical Studies 68 58 53 64 55
General Studies 1
Heating, Air Conditioning, Ventilation and Refrigeration Maintenance
Technology/Technician 2 5 13 8 7
Industrial Mechanics and Maintenance Technology 32 38 33 55 33
Liberal Arts and Sciences/Liberal Studies 459 467 540 652 698
Machine Shop Technology/Assistant 6 7 4 2 7
Medical Administrative/Executive Assistant and Medical Secretary 29 15 31 60 40
Medical Radiologic Technology/Science v Radiation Therapist 34 28 25 24 35
Medical/Clinical Assistant 15 19 15 11
Nuclear Medical Technology/Technologist 7 8 4 5 5
Nursing (RN Training) 113 101
Registered Nursing/Registered Nurse 107 89 104
Respiratory Care Therapy/Therapist 10 12 14 14 12
Security and Protective Services 2 1
Social Work 5 5 5 7 10
Speech Communication and Rhetoric 1 2
Surgical Technology/Technologist 8 13 7 12 5
Transfer Framework 1
Welding Technology/Welder 6 8 8 5

Source: CPE Official Data 1A crosswalk of CIP codes to academic plans is provided in the Appendix. *Students are counted more than once if they earned multiple credentials in the same academic year or more than one credential across academic years.
71
Certificates Awarded by Program (CIP1) – All Programs*
Program (CIP Title) 2008-2009
Acad. Year
2009-2010
Acad. Year
2010-2011
Acad. Year
2011-2012
Acad. Year
2012-2013
Acad. Year
Aesthetician/Esthetician and Skin Care Specialist 13 14 11
Applied Horticulture/Horticultural Operations 11 27 15
Autobody/Collision and Repair Technology/Technician 5 30 12 27 16
Automobile/Automotive Mechanics Technology/Technician 93 69 55 36 71
Biology Technician/Biotechnology Laboratory Technician 8 19 19 15
Business Administration and Management 4 2
Carpentry/Carpenter 149 192 45 37 40
Cartography 3 2 1 8 5
Child Care Provider/Assistant 97 62 110 51 83
Cinematography and Film/Video Production 14 14 14 9 9
Clinical/Medical Laboratory Technician 16 16 17 6 10
Computer and Information Sciences 6 6 4 9 36
Cosmetology/Cosmetologist 6 8 12 10 7
Data Processing and Data Processing Technology/Technician 15 11 27 62 16
Dental Laboratory Technology/Technician 13 9 7 4 10
Diesel Mechanics Technology/Technician 9 5 3 15 7
Drafting and Design Technology/Technician 3 1 22 9 12
Educational/Instructional Media Design 2 4 6 4 2
Electrician 210 190 218 199 130
Emergency Medical Technology/Technician (EMT Paramedic) 2 1 1
Engineering Technology 212 184 226 195 141
Equestrian/Equine Studies 2 5 2
Executive Assistant/Executive Secretary 92 102 267 261 164
Fire Science/Fire-fighting 2 4

Source: CPE Official Data 1A crosswalk of CIP codes to academic plans is provided in the Appendix. *Students are counted more than once if they earned multiple credentials in the same academic year or more than one credential across academic years.
72
Certificates Awarded by Program (CIP1) – All Programs*
Program (CIP Title) 2008-2009
Acad. Year
2009-2010
Acad. Year
2010-2011
Acad. Year
2011-2012
Acad. Year
2012-2013
Acad. Year
Heating, Air Conditioning, Ventilation and Refrigeration Maintenance
Technology/Technician 23 34 51 39 39
Industrial Mechanics and Maintenance Technology 80 102 114 112 78
Licensed Practical/Vocational Nurse Training 305 391 427 413 433
Machine Shop Technology/Assistant 42 57 44 54 60
Mason/Masonry 28 22 10 6
Medical Administrative/Executive Assistant and Medical Secretary 58 65 120 158 97
Medical/Clinical Assistant 40 52 63 1 46
Real Estate 1 1 1
Respiratory Care Therapy/Therapist 6 4 6 6 4
Securities Services Administration/Management 16 12 2 2 3
Social Work 1
Welding Technology/Welder 194 159 204 110 206

Source: CPE Official Data 1A crosswalk of CIP codes to academic plans is provided in the Appendix. *Students are counted more than once if they earned multiple credentials in the same academic year or more than one credential across academic years.
73
Diplomas Awarded by Program (CIP1) – All Programs*
Program (CIP Title) 2008-2009
Acad. Year
2009-2010
Acad. Year
2010-2011
Acad. Year
2011-2012
Acad. Year
2012-2013
Acad. Year
Applied Horticulture/Horticultural Operations 5 3 6
Autobody/Collision and Repair Technology/Technician 2 2 3 2
Automobile/Automotive Mechanics Technology/Technician 6 3 4
Carpentry/Carpenter 16 10 10 6 4
Child Care Provider/Assistant 3 3 9
Computer Installation and Repair Technology/Technician 2
Cosmetology/Cosmetologist 2 7 9 9 2
Dental Hygiene/Hygienist 20 29 32 16 30
Drafting and Design Technology/Technician 1 1 6 3 4
Electrician 38 26 31 29 26
Engineering Technology 39 40 31 42 36
Equestrian/Equine Studies 1 1
Executive Assistant/Executive Secretary 21 10 46 27 21
Fire Science/Fire-fighting 1
Heating, Air Conditioning, Ventilation and Refrigeration Maintenance
Technology/Technician 6 8 15 13 11
Industrial Mechanics and Maintenance Technology 30 39 37 57 33
Licensed Practical/Vocational Nurse Training 98 105 79 94 91
Machine Shop Technology/Assistant 15 10 8 5 17
Mason/Masonry 7 7 5 2
Medical Administrative/Executive Assistant and Medical Secretary 11 9 56 80 52
Medical/Clinical Assistant 12 18 21 15
Surgical Technology/Technologist 4 4 6 5 4
Welding Technology/Welder 7 4 10 3 7

Source: CPE Official Data *Students are counted more than once if they earned multiple credentials in the same academic year or more than one credential across academic years.
74
Credentials Earned by Home County (2008-2009 Academic Year – 2012-2013 Academic Year)
Top 25 Kentucky Counties Producing BCTC Credential Earners*
2008-2009 Academic Year
Kentucky County Count Kentucky County Count
Fayette 1,064 Marion 54
Boyle 234 Woodford 51
Franklin 167 Bourbon 43
Anderson 166 Powell 30
Jessamine 150 Jefferson 25
Scott 142 Montgomery 23
Mercer 136 Shelby 23
Clark 97 Floyd 19
Washington 83 Green 17
Harrison 70 Perry 17
Madison 66 McCracken 16
Lincoln 63 Pulaski 15
Garrard 56
2009-2010 Academic Year
Kentucky County Count Kentucky County Count
Fayette 1,046 Washington 63
Boyle 196 Powell 55
Scott 164 Jefferson 50
Mercer 125 Garrard 47
Clark 122 Harrison 44
Jessamine 120 Daviess 30
Franklin 119 Laurel 23
Anderson 108 Perry 22
Marion 105 Pulaski 22
Bourbon 83 Casey 21
Madison 82 Boyd 20
Lincoln 72 Montgomery 18
Woodford 71

Source: CPE Official Data *Students are counted more than once if they earned multiple credentials in the same academic year or more than one credential across academic years.
75
Top 25 Kentucky Counties Producing BCTC Credential Earners*
2010-2011 Academic Year
Kentucky County Count Kentucky County Count
Fayette 1,161 Washington 72
Scott 221 Bourbon 70
Anderson 213 Harrison 57
Clark 177 Estill 52
Franklin 175 Garrard 50
Marion 151 Jefferson 46
Boyle 135 Montgomery 38
Madison 127 Casey 30
Mercer 120 Union 23
Jessamine 118 Rockcastle 21
Woodford 90 Nelson 20
Lincoln 86 Gallatin 19
Powell 86
2011-2012 Academic Year
Kentucky County Count Kentucky County Count
Fayette 1,136 Lincoln 81
Clark 199 Powell 71
Scott 192 Washington 54
Franklin 178 Estill 51
Jessamine 150 Montgomery 40
Boyle 146 Owen 38
Madison 133 Jefferson 36
Mercer 110 Harrison 35
Marion 108 Pulaski 31
Woodford 103 Shelby 23
Anderson 101 Bath 21
Garrard 93 Daviess 20
Bourbon 88
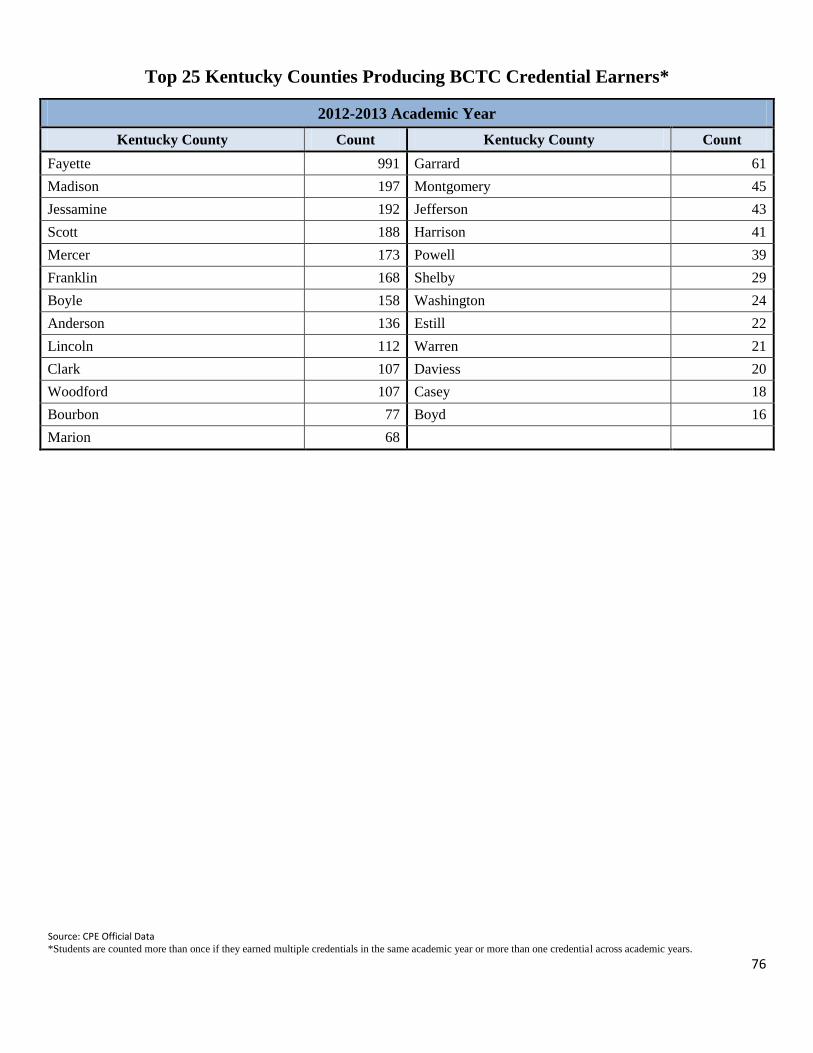
Source: CPE Official Data *Students are counted more than once if they earned multiple credentials in the same academic year or more than one credential across academic years.
76
Top 25 Kentucky Counties Producing BCTC Credential Earners*
2012-2013 Academic Year
Kentucky County Count Kentucky County Count
Fayette 991 Garrard 61
Madison 197 Montgomery 45
Jessamine 192 Jefferson 43
Scott 188 Harrison 41
Mercer 173 Powell 39
Franklin 168 Shelby 29
Boyle 158 Washington 24
Anderson 136 Estill 22
Lincoln 112 Warren 21
Clark 107 Daviess 20
Woodford 107 Casey 18
Bourbon 77 Boyd 16
Marion 68

77
Retention
Fall to Spring Retention Trends
Fall to Spring Retention – All Students and First-Time Freshmen (2008-2013)
Fall to Spring Retention by Race/Ethnicity (2008-2013)
Fall to Spring Retention by Gender (2008-2013)
Fall to Fall Retention Trends
Fall to Fall Retention – All Students and First-Time Freshmen (2007-2012)
Fall to Fall Retention by Race/Ethnicity (2007-2012)
Fall to Fall Retention by Gender (2007-2012)

Source: CPE Official Data
Fall to spring retention rates were calculated by taking the percentage of all BCTC students enrolled in the fall that returned the following spring. Graduates were
accounted for in calculations, but transfer students were not. As such, percentages may underestimate the true fall to spring retention rates of BCTC students. 1All BCTC students were included in calculations regardless of classification (e.g., freshmen, sophomore, etc.) and academic load (i.e., full-time, part-time). The “full-
time, first-time” inclusion criteria often used by other institutions does not accurately depict the majority of BCTC students, and thus was not adopted by the creators of
this Factbook. As a result, retention rates reported here may differ from those reported by external agencies (e.g., IPEDS).
78
Fall to Spring Retention Trends
Fall to Spring Retention – All Students and First-Time Freshmen
Fall to Spring
Retention Rate (%)
Fall 2008 to
Spring 2009
Fall 2009 to
Spring 2010
Fall 2010 to
Spring 2011
Fall 2011 to
Spring 2012
Fall 2012 to
Spring 2013
All Students1
69.0% 69.4% 70.7% 67.2% 68.6%
First-Time Freshmen 61.9% 69.9% 71.7% 68.5% 67.0%
69.0%
69.4% 70.7%
67.2%
68.6%
61.9%
69.9%
71.7%
68.5%
67.0%
50.0%
55.0%
60.0%
65.0%
70.0%
75.0%
80.0%
Fall 2008 toSpring 2009
Fall 2009 toSpring 2010
Fall 2010 toSpring 2011
Fall 2011 toSpring 2012
Fall 2012 toSpring 2013
Fall to Spring Retention - All Students and First-Time Freshmen
All Students
First-TimeFreshmen

Source: CPE Official Data Fall to spring retention rates were calculated by taking the percentage of all BCTC students enrolled in the fall that returned the following spring. Graduates were
accounted for in calculations, but transfer students were not. As such, percentages may underestimate the true fall to spring retention rates of BCTC students.
N/A = Due to restructuring of the race/ethnicity categories, not all are applicable across terms.
79
Fall to Spring Retention by Race/Ethnicity
Race/Ethnicity Fall 2008 to
Spring 2009
Fall 2009 to
Spring 2010
Fall 2010 to
Spring 2011
Fall 2011 to
Spring 2012
Fall 2012 to
Spring 2013
American Indian 65.9% 65.0% 67.6% 50.0% 62.8%
Asian 64.9% 72.6% 79.6% 70.0% 73.3%
African American 71.4% 66.9% 69.6% 60.1% 63.2%
Hispanic 76.0% 70.7% 76.6% 70.0% 67.1%
Native Hawaiian N/A N/A 84.6% 72.2% 75.0%
Non-Resident Alien 69.12% 76.1% 70.0% 69.7% 74.2%
Two or More Races N/A N/A 71.1% 64.5% 73.8%
White 69.4% 69.2% 72.1% 69.1% 70.2%
All Students 69.0 69.4% 70.7% 67.2% 68.6%
Fall to Spring Retention by Gender
Gender Fall 2008 to
Spring 2009
Fall 2009 to
Spring 2010
Fall 2010 to
Spring 2011
Fall 2011 to
Spring 2012
Fall 2012 to
Spring 2013
Female 74.5% 71.9% 73.3% 69.2% 71.1%
Male 61.9% 66.0% 67.2% 64.5% 65.8%
All Students 69.0 69.4% 70.7% 67.2% 68.6%
74.5%
71.9%
73.3%
69.2%
71.1%
61.9%
66.0% 67.2%
64.5% 65.8%
69.0% 69.4% 70.7%
67.2%
68.6%
55.0%
60.0%
65.0%
70.0%
75.0%
80.0%
Fall 2008 toSpring 2009
Fall 2009 toSpring 2010
Fall 2010 toSpring 2011
Fall 2011 toSpring 2012
Fall 2012 toSpring 2013
Fall to Spring Retention by Gender
Female
Male
All Students
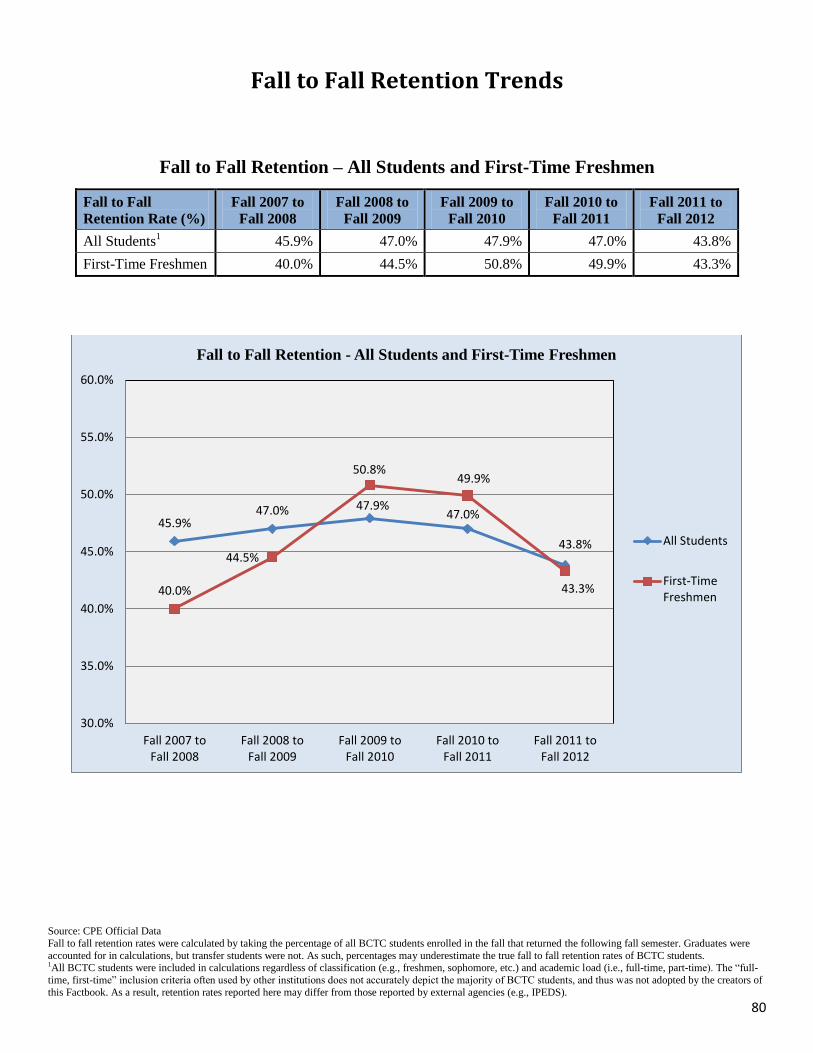
Source: CPE Official Data
Fall to fall retention rates were calculated by taking the percentage of all BCTC students enrolled in the fall that returned the following fall semester. Graduates were
accounted for in calculations, but transfer students were not. As such, percentages may underestimate the true fall to fall retention rates of BCTC students. 1All BCTC students were included in calculations regardless of classification (e.g., freshmen, sophomore, etc.) and academic load (i.e., full-time, part-time). The “full-
time, first-time” inclusion criteria often used by other institutions does not accurately depict the majority of BCTC students, and thus was not adopted by the creators of
this Factbook. As a result, retention rates reported here may differ from those reported by external agencies (e.g., IPEDS).
80
Fall to Fall Retention Trends
Fall to Fall Retention – All Students and First-Time Freshmen
Fall to Fall
Retention Rate (%)
Fall 2007 to
Fall 2008
Fall 2008 to
Fall 2009
Fall 2009 to
Fall 2010
Fall 2010 to
Fall 2011
Fall 2011 to
Fall 2012
All Students1
45.9% 47.0% 47.9% 47.0% 43.8%
First-Time Freshmen 40.0% 44.5% 50.8% 49.9% 43.3%
45.9% 47.0% 47.9%
47.0%
43.8%
40.0%
44.5%
50.8% 49.9%
43.3%
30.0%
35.0%
40.0%
45.0%
50.0%
55.0%
60.0%
Fall 2007 toFall 2008
Fall 2008 toFall 2009
Fall 2009 toFall 2010
Fall 2010 toFall 2011
Fall 2011 toFall 2012
Fall to Fall Retention - All Students and First-Time Freshmen
All Students
First-TimeFreshmen

Source: CPE Official Data Fall to fall retention rates were calculated by taking the percentage of all BCTC students enrolled in the fall that returned the following fall semester. Graduates were
accounted for in calculations, but transfer students were not. As such, percentages may underestimate the true fall to fall retention rates of BCTC students.
N/A = Due to restructuring of the race/ethnicity categories, not all are applicable across terms.
81
Fall to Fall Retention by Race/Ethnicity
Race/Ethnicity Fall 2007 to
Fall 2008
Fall 2008 to
Fall 2009
Fall 2009 to
Fall 2010
Fall 2010 to
Fall 2011
Fall 2011 to
Fall 2012
American Indian 40.0% 36.8% 42.1% 47.1% 48.7%
Asian 50.0% 41.9% 54.4% 51.7% 46.8%
African American 41.4% 45.7% 45.8% 43.1% 36.5%
Hispanic 38.0% 52.2% 51.1% 51.5% 53.6%
Native Hawaiian N/A N/A N/A 66.7% 46.7%
Non-Resident Alien 31.6% 53.7% 43.2% 42.9% 49.2%
Two or More Races N/A N/A N/A 48.7% 35.4%
White 48.0% 47.9% 48.3% 48.4% 45.2%
All Students 45.9% 47.0% 47.9% 47.0% 43.8%
Fall to Fall Retention by Gender
Gender Fall 2007 to
Fall 2008
Fall 2008 to
Fall 2009
Fall 2009 to
Fall 2010
Fall 2010 to
Fall 2011
Fall 2011 to
Fall 2012
Female 50.7% 51.9% 51.0% 50.2% 46.1%
Male 40.1% 40.8% 43.7% 42.6% 40.8%
All Students 45.9% 47.0% 47.9% 47.0% 43.8%
50.7% 51.9%
51.0% 50.2%
46.1%
40.1% 40.8%
43.7% 42.6%
40.8%
45.9% 47.0%
47.9% 47.0%
43.8%
35.0%
40.0%
45.0%
50.0%
55.0%
Fall 2007 toFall 2008
Fall 2008 toFall 2009
Fall 2009 toFall 2010
Fall 2010 toFall 2011
Fall 2011 toFall 2012
Fall to Fall Retention by Gender
Female
Male
All Students
82
Transfer
Transferring to BCTC (First-Time Transfer Students)
Fall Transfer-In Trends (2008-2012)
Spring Transfer-In Trends (2009-2013)
Academic Year Transfer-In Trends (2008-2009 – 2012-2013)
Transferring from BCTC to Four-Year Institution (In Kentucky)
Percentage of BCTC Students Transferring to Four-Year Institution

Source: CPE Official Data
83
Transferring to BCTC (First-Time Transfer Students)
Fall Transfer-In Trends
Transfer-In Fall 2008 Fall 2009 Fall 2010 Fall 2011 Fall 2012 Total Change
2008-2012
Headcount 576 726 658 796 789 213
Percent Change - 26.0% -9.4% 21.0% -0.9% 37.0%
576
726
658
796 789
450
500
550
600
650
700
750
800
850
Fall 2008 Fall 2009 Fall 2010 Fall 2011 Fall 2012
Fall Transfer-In Trends
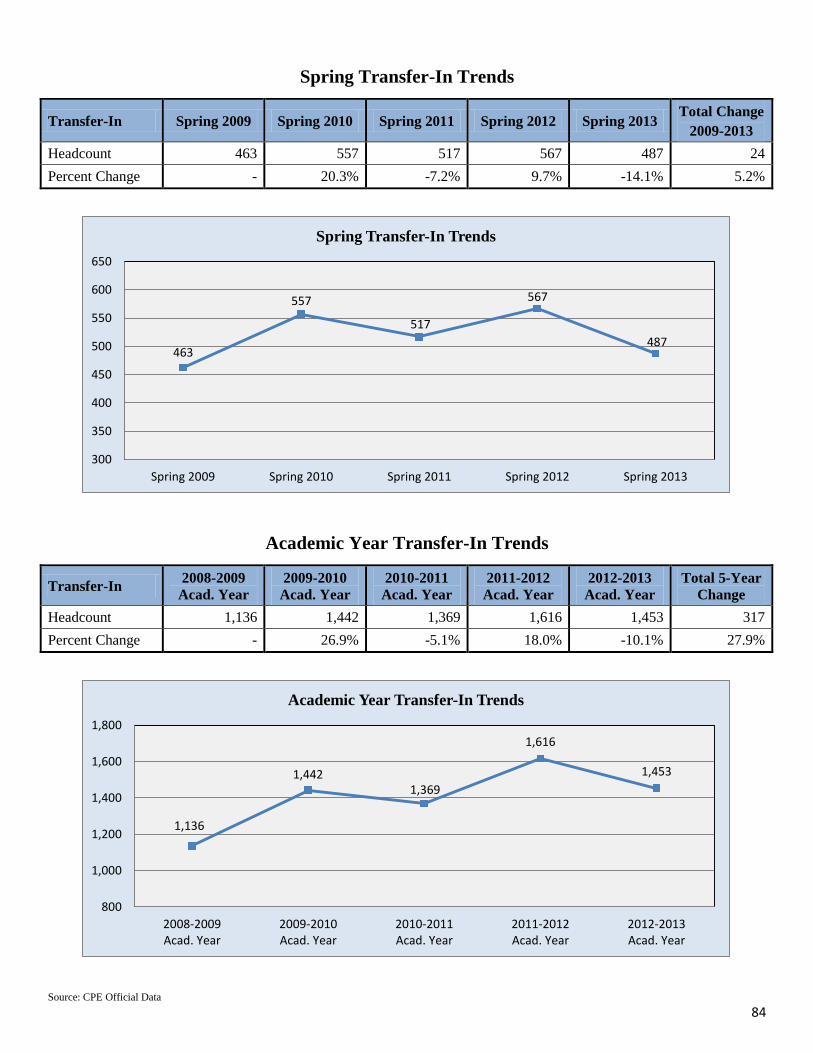
Source: CPE Official Data
84
Spring Transfer-In Trends
Transfer-In Spring 2009 Spring 2010 Spring 2011 Spring 2012 Spring 2013 Total Change
2009-2013
Headcount 463 557 517 567 487 24
Percent Change - 20.3% -7.2% 9.7% -14.1% 5.2%
Academic Year Transfer-In Trends
Transfer-In 2008-2009
Acad. Year
2009-2010
Acad. Year
2010-2011
Acad. Year
2011-2012
Acad. Year
2012-2013
Acad. Year
Total 5-Year
Change
Headcount 1,136 1,442 1,369 1,616 1,453 317
Percent Change - 26.9% -5.1% 18.0% -10.1% 27.9%
463
557
517
567
487
300
350
400
450
500
550
600
650
Spring 2009 Spring 2010 Spring 2011 Spring 2012 Spring 2013
Spring Transfer-In Trends
1,136
1,442 1,369
1,616
1,453
800
1,000
1,200
1,400
1,600
1,800
2008-2009Acad. Year
2009-2010Acad. Year
2010-2011Acad. Year
2011-2012Acad. Year
2012-2013Acad. Year
Academic Year Transfer-In Trends

Source: KCTCS Fact Book 2011-2012 (Office of Research and Policy Analysis) 1Percentages represent the proportion of BCTC students with more than 10 (non-developmental) credit hours at KCTCS transferring to a four-year Kentucky college or institution, where they then complete 10 or more (non-developmental) credit hours within eight years.
85
Transferring from BCTC to Four-Year Institution
(In Kentucky)
Percentage of BCTC Students Transferring to Four-Year Institution1
Transfer-Out 2008-2009
Acad. Year
2009-2010
Acad. Year
Percent Transferring 29.1% 26.5%
Data have not been updated for 2010-2011 and 2011-2012 academic years.
86
Labor Force & Demographics
BCTC Faculty & Staff Overview – Fall 2011
All BCTC Employees by Full/Part-Time Status, Race/Ethnicity, and Gender
BCTC Faculty – Fall 2011
BCTC Faculty by Full/Part-Time (Adjunct) Status and Race/Ethnicity
BCTC Faculty by Full/Part-Time (Adjunct) Status and Gender
BCTC Staff – Fall 2011
BCTC Staff by Full/Part-Time Status and Race/Ethnicity
BCTC Staff by Full/Part-Time Status and Gender
BCTC Staff by Full/Part-Time Status and Primary Function/Occupational Activity
BCTC Staff by Gender and Primary Function/Occupational Activity
BCTC Staff by Race/Ethnicity and Primary Function/Occupational Activity

Source: IPEDS Data Center (Fall 2011)
*Will be updated to reflect Fall 2012 information when IPEDS data are released.
87
BCTC Faculty & Staff Overview – Fall 2011*
All BCTC Employees by Full/Part-Time Status
All BCTC Employees by Full/Part-Time Status and Race/Ethnicity
Race/Ethnicity Full-Time Part-Time Total # of
Employees
% of Total
Employees
American Indian/Alaska Native 4 5 9 0.7%
Asian 2 21 23 1.7%
Black or African American 64 45 109 8.1%
Hispanic or Latino 5 6 11 0.8%
Native Hawaiian or Other Pacific Islander 1 2 3 0.2%
White 412 656 1,068 79.5%
Two or More Races 4 1 5 0.4%
Race/Ethnicity Unknown 5 100 105 7.8%
Nonresidential Alien 1 9 10 0.7%
Total 498 845 1,343 -
All BCTC Employees by Full/Part-Time Status and Gender
Gender Full-Time Part-Time Total # of
Employees
% of Total
Employees
Female 307 492 799 59.5%
Male 191 353 544 40.5%
Total 498 845 1,343 -
236 262
696
149
932
411
0
100
200
300
400
500
600
700
800
900
1,000
Faculty Staff
Full-Time
Part-Time
Total
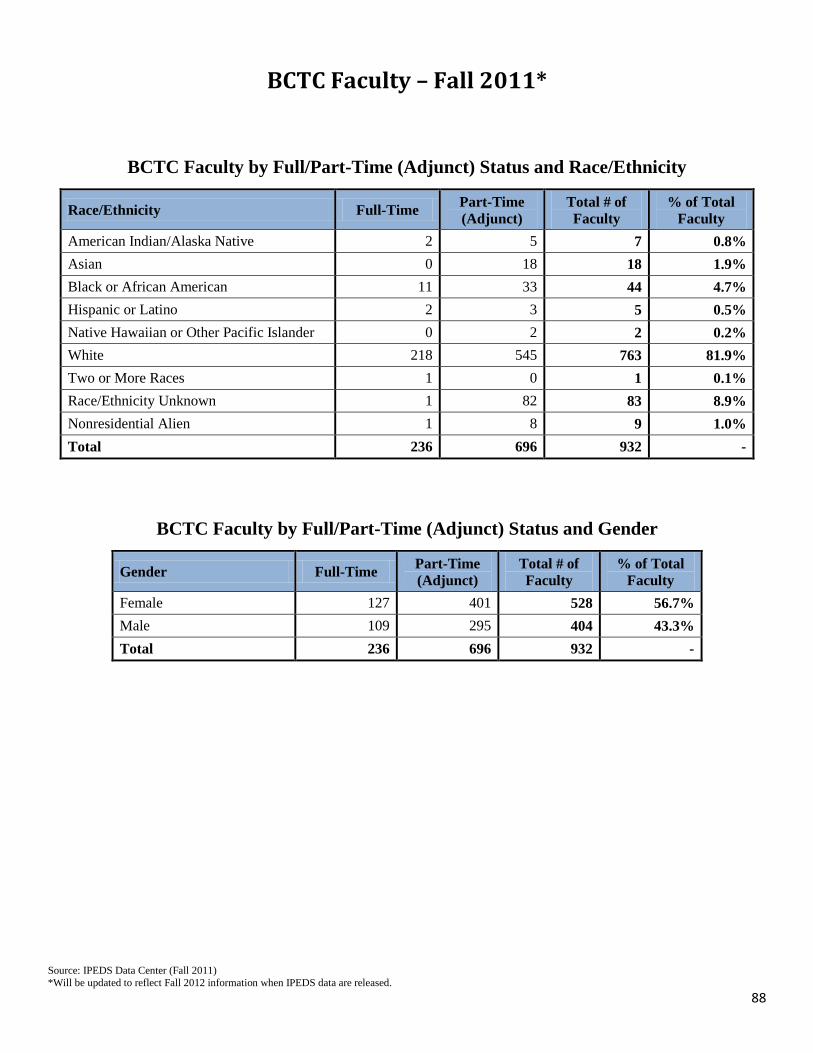
Source: IPEDS Data Center (Fall 2011)
*Will be updated to reflect Fall 2012 information when IPEDS data are released.
88
BCTC Faculty – Fall 2011*
BCTC Faculty by Full/Part-Time (Adjunct) Status and Race/Ethnicity
Race/Ethnicity Full-Time Part-Time
(Adjunct)
Total # of
Faculty
% of Total
Faculty
American Indian/Alaska Native 2 5 7 0.8%
Asian 0 18 18 1.9%
Black or African American 11 33 44 4.7%
Hispanic or Latino 2 3 5 0.5%
Native Hawaiian or Other Pacific Islander 0 2 2 0.2%
White 218 545 763 81.9%
Two or More Races 1 0 1 0.1%
Race/Ethnicity Unknown 1 82 83 8.9%
Nonresidential Alien 1 8 9 1.0%
Total 236 696 932 -
BCTC Faculty by Full/Part-Time (Adjunct) Status and Gender
Gender Full-Time Part-Time
(Adjunct)
Total # of
Faculty
% of Total
Faculty
Female 127 401 528 56.7%
Male 109 295 404 43.3%
Total 236 696 932 -

Source: IPEDS Data Center (Fall 2011)
*Will be updated to reflect Fall 2012 information when IPEDS data are released.
89
BCTC Staff – Fall 2011*
BCTC Staff by Full/Part-Time Status and Race/Ethnicity
Race/Ethnicity Full-Time Part-Time Total # of
Staff
% of Total
Staff
American Indian/Alaska Native 2 0 2 0.5%
Asian 2 3 5 1.2%
Black or African American 53 12 65 15.8%
Hispanic or Latino 3 3 6 1.5%
Native Hawaiian or Other Pacific Islander 1 0 1 0.2%
White 194 111 305 74.2%
Two or More Races 3 1 4 1.0%
Race/Ethnicity Unknown 4 18 22 5.4%
Nonresidential Alien 0 1 1 0.2%
Total 262 149 411 -
BCTC Staff by Full/Part-Time Status and Gender
Gender Full-Time Part-Time Total # of
Staff
% of Total
Staff
Female 180 91 271 65.9%
Male 82 58 140 34.1%
Total 262 149 411 -

Source: IPEDS Data Center (Fall 2011)
*Will be updated to reflect Fall 2012 information when IPEDS data are released.
90
BCTC Staff by Full/Part-Time Status and Primary Function/Occupational Activity*
Primary Function/Occupational
Activity
Full-Time Part-Time Total
N % N % N %
Executive/Administrative and Managerial 23 8.8% 0 0.0% 23 5.6%
Other Professionals 118 45.0% 46 30.9% 164 39.9%
Technical and Paraprofessionals 10 3.8% 0 0.0% 10 2.4%
Clerical and Secretarial 79 30.2% 103 69.1% 182 44.3%
Service/Maintenance 32 12.2% 0 0.0% 32 7.8%
Total 262 - 149 - 411 -
BCTC Staff by Gender and Primary Function/Occupational Activity*
Primary Function/Occupational Activity Female Male
N % N %
Executive/Administrative and Managerial 8 5.7% 15 5.5%
Other Professionals 53 37.9% 111 41.0%
Technical and Paraprofessionals 8 5.7% 2 0.7%
Clerical and Secretarial 46 32.9% 136 50.2%
Service/Maintenance 25 17.9% 7 2.6%
Total 140 - 271 -

Source: IPEDS Data Center (Fall 2011)
*Will be updated to reflect Fall 2012 information when IPEDS data are released.
91
BCTC Staff by Race/Ethnicity and Primary Function/Occupational Activity*
Primary Function/
Occupational Activity
Executive/Admin.
and Managerial Other Professionals
Technical and
Paraprofessionals
Clerical and
Secretarial
Service/
Maintenance
N % N % N % N % N %
American
Indian/Alaska Native 0 0.0% 0 0.0% 0 0.0% 2 1.1% 0 0.0%
Asian 0 0.0% 3 1.8% 0 0.0% 2 1.1% 0 0.0%
Black or African
American 3 13.0% 26 15.9% 1 10.0% 24 13.2% 11 34.4%
Hispanic or Latino 0 0.0% 1 0.6% 0 0.0% 4 2.2% 1 3.1%
Native Hawaiian or
Other Pacific Islander 1 4.3% 0 0.0% 0 0.0% 0 0.0% 0 0.0%
White 18 78.3% 126 76.8% 8 80.0% 133 73.1% 20 62.5%
Two or More Races 0 0.0% 2 1.2% 1 10.0% 1 0.5% 0 0.0%
Race/Ethnicity
Unknown 1 4.3% 6 3.7% 0 0.0% 15 8.2% 0 0.0%
Nonresidential Alien 0 0.0% 0 0.0% 0 0.0% 1 0.5% 0 0.0%
Total 23 - 164 - 10 - 182 - 32 -

92
Definitions & Calculations
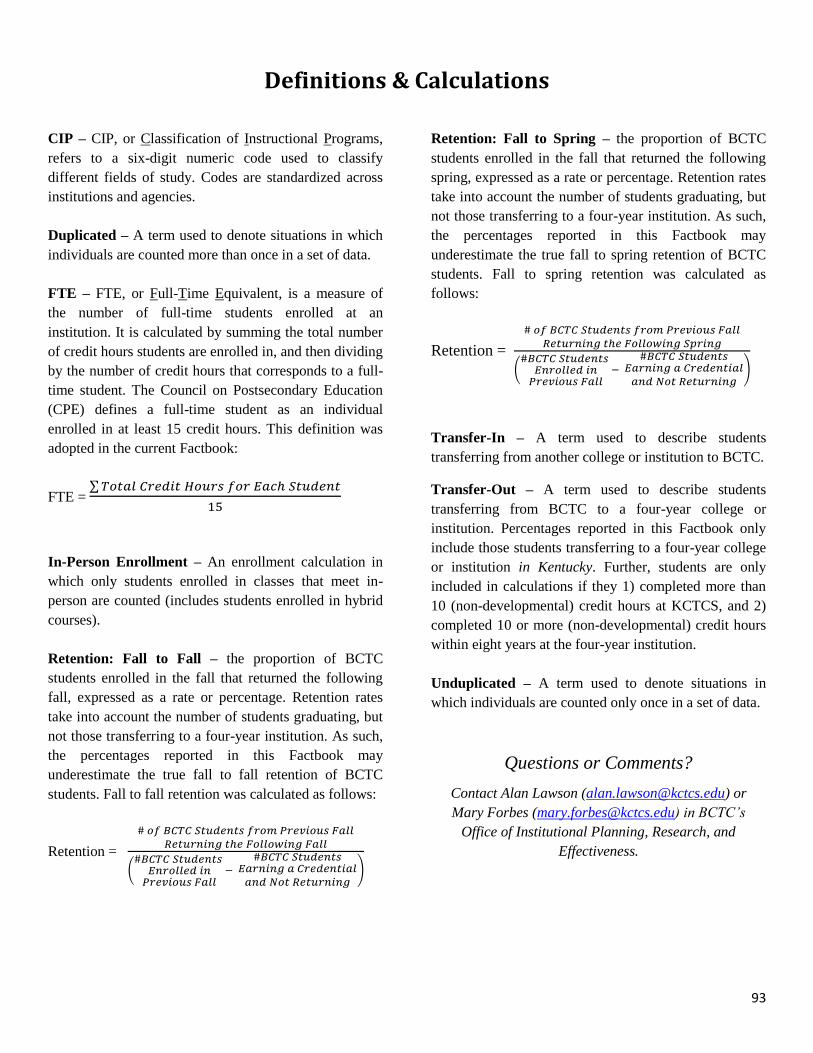
93
Definitions & Calculations
CIP – CIP, or Classification of Instructional Programs,
refers to a six-digit numeric code used to classify
different fields of study. Codes are standardized across
institutions and agencies.
Duplicated – A term used to denote situations in which
individuals are counted more than once in a set of data.
FTE – FTE, or Full-Time Equivalent, is a measure of
the number of full-time students enrolled at an
institution. It is calculated by summing the total number
of credit hours students are enrolled in, and then dividing
by the number of credit hours that corresponds to a full-
time student. The Council on Postsecondary Education
(CPE) defines a full-time student as an individual
enrolled in at least 15 credit hours. This definition was
adopted in the current Factbook:
FTE = ∑
In-Person Enrollment – An enrollment calculation in
which only students enrolled in classes that meet in-
person are counted (includes students enrolled in hybrid
courses).
Retention: Fall to Fall – the proportion of BCTC
students enrolled in the fall that returned the following
fall, expressed as a rate or percentage. Retention rates
take into account the number of students graduating, but
not those transferring to a four-year institution. As such,
the percentages reported in this Factbook may
underestimate the true fall to fall retention of BCTC
students. Fall to fall retention was calculated as follows:
Retention =
(
)
Retention: Fall to Spring – the proportion of BCTC
students enrolled in the fall that returned the following
spring, expressed as a rate or percentage. Retention rates
take into account the number of students graduating, but
not those transferring to a four-year institution. As such,
the percentages reported in this Factbook may
underestimate the true fall to spring retention of BCTC
students. Fall to spring retention was calculated as
follows:
Retention =
(
)
Transfer-In – A term used to describe students
transferring from another college or institution to BCTC.
Transfer-Out – A term used to describe students
transferring from BCTC to a four-year college or
institution. Percentages reported in this Factbook only
include those students transferring to a four-year college
or institution in Kentucky. Further, students are only
included in calculations if they 1) completed more than
10 (non-developmental) credit hours at KCTCS, and 2)
completed 10 or more (non-developmental) credit hours
within eight years at the four-year institution.
Unduplicated – A term used to denote situations in
which individuals are counted only once in a set of data.
Questions or Comments?
Contact Alan Lawson ([email protected]) or
Mary Forbes ([email protected]) in BCTC’s
Office of Institutional Planning, Research, and
Effectiveness.
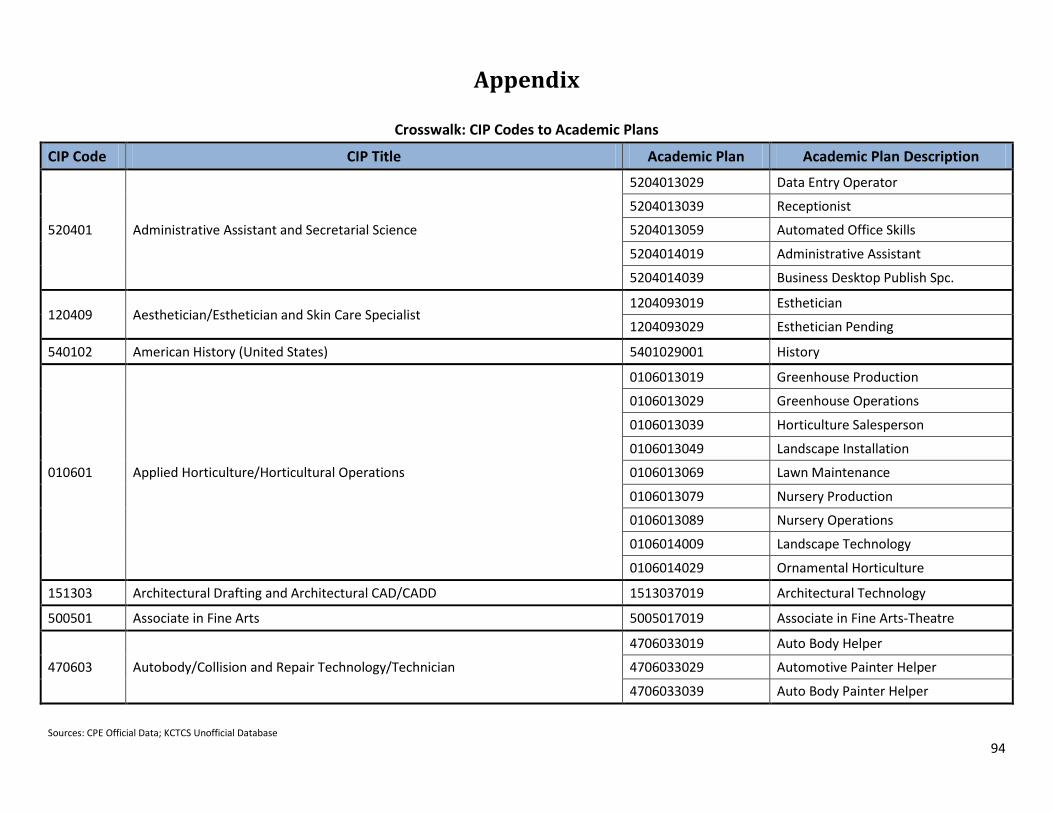
Sources: CPE Official Data; KCTCS Unofficial Database
94
Appendix
Crosswalk: CIP Codes to Academic Plans
CIP Code CIP Title Academic Plan Academic Plan Description
520401 Administrative Assistant and Secretarial Science
5204013029 Data Entry Operator
5204013039 Receptionist
5204013059 Automated Office Skills
5204014019 Administrative Assistant
5204014039 Business Desktop Publish Spc.
120409 Aesthetician/Esthetician and Skin Care Specialist 1204093019 Esthetician
1204093029 Esthetician Pending
540102 American History (United States) 5401029001 History
010601 Applied Horticulture/Horticultural Operations
0106013019 Greenhouse Production
0106013029 Greenhouse Operations
0106013039 Horticulture Salesperson
0106013049 Landscape Installation
0106013069 Lawn Maintenance
0106013079 Nursery Production
0106013089 Nursery Operations
0106014009 Landscape Technology
0106014029 Ornamental Horticulture
151303 Architectural Drafting and Architectural CAD/CADD 1513037019 Architectural Technology
500501 Associate in Fine Arts 5005017019 Associate in Fine Arts-Theatre
470603 Autobody/Collision and Repair Technology/Technician
4706033019 Auto Body Helper
4706033029 Automotive Painter Helper
4706033039 Auto Body Painter Helper

Sources: CPE Official Data; KCTCS Unofficial Database
95
Crosswalk: CIP Codes to Academic Plans
CIP Code CIP Title Academic Plan Academic Plan Description
470603 Autobody/Collision and Repair Technology/Technician
4706033049 Automotive Painter
4706033109 Collision Repairer
4706033119 Automotive Painter
4706034019 Collision Repair Technician
4706034029 Collision Repair Tech Pending
470604 Automobile/Automotive Mechanics Technology/Technician
4706043019 Automotive Air Condition Mech
4706043039 Automotive Electrician
4706043059 Manual Tran & Drive Train Tech
4706043069 Brake Repairer
4706043079 Automatic Trans/Transaxle Tech
4706043089 Engine Repairer
4706043099 Front End Mechanic
4706043109 Tune Up Mechanic
4706044019 Automotive Technician
4706044039 Automotive Technician Pending
4706047019 Automotive Technology
4706047029 Automotive Technology Pending
410101 Biology Technician/Biotechnology Laboratory Technician
4101013020 Basic Biotechnician
4101013030 Advanced Biotechnician
4101017029 Biotechnology Laboratory Tech
4101013040 Biotech Laboratory Assistant
4101017019 Biotechnology
260101 Biology/Biological Sciences 2601019001 Biology/Botany
460401 Building/Property Maintenance and Management 4604013019 Building Maintenance
520201 Business Administration and Management 5202013119 Accounting
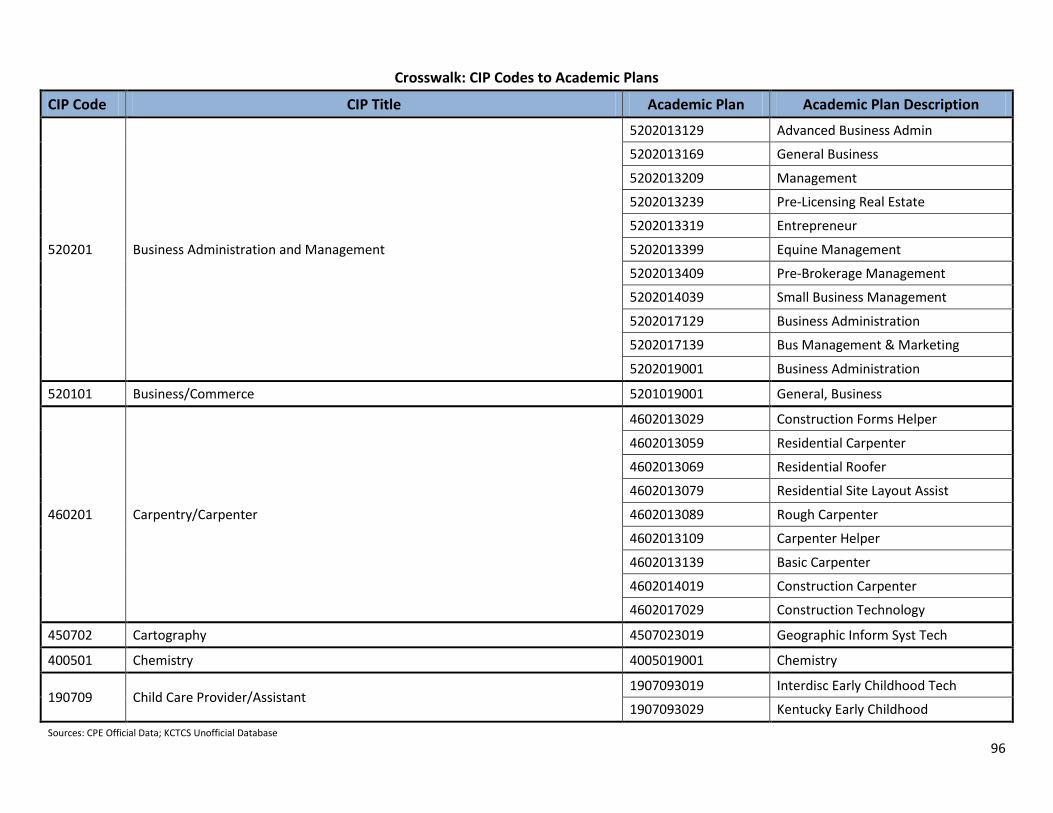
Sources: CPE Official Data; KCTCS Unofficial Database
96
Crosswalk: CIP Codes to Academic Plans
CIP Code CIP Title Academic Plan Academic Plan Description
520201 Business Administration and Management
5202013129 Advanced Business Admin
5202013169 General Business
5202013209 Management
5202013239 Pre-Licensing Real Estate
5202013319 Entrepreneur
5202013399 Equine Management
5202013409 Pre-Brokerage Management
5202014039 Small Business Management
5202017129 Business Administration
5202017139 Bus Management & Marketing
5202019001 Business Administration
520101 Business/Commerce 5201019001 General, Business
460201 Carpentry/Carpenter
4602013029 Construction Forms Helper
4602013059 Residential Carpenter
4602013069 Residential Roofer
4602013079 Residential Site Layout Assist
4602013089 Rough Carpenter
4602013109 Carpenter Helper
4602013139 Basic Carpenter
4602014019 Construction Carpenter
4602017029 Construction Technology
450702 Cartography 4507023019 Geographic Inform Syst Tech
400501 Chemistry 4005019001 Chemistry
190709 Child Care Provider/Assistant 1907093019 Interdisc Early Childhood Tech
1907093029 Kentucky Early Childhood

Sources: CPE Official Data; KCTCS Unofficial Database
97
Crosswalk: CIP Codes to Academic Plans
CIP Code CIP Title Academic Plan Academic Plan Description
190709 Child Care Provider/Assistant
1907093039 Child Care Assistant
1907093049 KY Child Care Provider
1907093059 Early Childhood Administrator
1907093069 School Age Child Care
1907094019 Interdisc Early Childhood Educ
1907097019 Interdisc Early Childhood Educ
1907097029 Interdisc Early Chldhd Ed Pend
1907097039 Early Childhood Education
500602 Cinematography and Film/Video Production 5006023019 Filmmaking: Script to Screen
150201 Civil Engineering Technology/Technician 1502017019 Civil Engineering Technology
511004 Clinical/Medical Laboratory Technician
5110043019 Phlebotomist
5110043029 Physicians Office Laboratory
5110043039 Phlebotomy/Healthcare Worker
5110043059 Phlebotomist Pending
5110043069 Phlebotomist/HlthCare PND
100105 Communications Technology/Technician 1001053049 Multimedia -- Comm Art
110101 Computer and Information Sciences
1101013019 Networking Microsoft 2K Basic
1101013029 Cisco Networking Basic
1101013039 Information Tech Fundamentals
1101013049 A+ Certification
1101013069 Cisco Networking Enhanced
1101013089 Database Admin- Basic Oracle
1101013099 Web/Database Admin Oracle Trck
1101013109 Databse Admin Enhanced Mcrosft
1101013119 Web/Database Adm Microsoft Trk

Sources: CPE Official Data; KCTCS Unofficial Database
98
Crosswalk: CIP Codes to Academic Plans
CIP Code CIP Title Academic Plan Academic Plan Description
110101 Computer and Information Sciences
1101013129 Electronic Commerce
1101013139 Computer Programming
1101013149 Computer Support Specialist
1101013169 Web Site Developer
1101013189 Cisco Networking Professional
1101013199 Microsoft Networking MCSA
1101013219 Information Security
1101013229 Microsoft Networking MCSE
1101013289 Computer Technician
1101013299 Productivity Software Spcialst
1101013309 CIT Fundamentals
1101013319 Computer Tech Basic
1101013329 Computer Support Technician
1101013339 Information Security Specialist
1101013349 Microsoft Network Administrator
1101013359 CISCO Networking Associate
1101013369 Network Technologies Specialist
1101013379 CISCO Networking Enhanced
1101013389 A+
1101013399 Net +
1101013409 Security +
1101013419 Microsoft Enterprise Adm
1101013439 Web Programming
1101017079 Information Technology
1101017089 Computer and Information Tech

Sources: CPE Official Data; KCTCS Unofficial Database
99
Crosswalk: CIP Codes to Academic Plans
CIP Code CIP Title Academic Plan Academic Plan Description
110101 Computer and Information Sciences 1101019001 Information Technology/CIS
470104 Computer Installation and Repair Technology/Technician 4701044029 Electronic Computer Network Tech
4701044039 Electronics Computer Tech
120401 Cosmetology/Cosmetologist
1204013039 Cosmetologist
1204014019 Cosmetologist
1204014029 Cosmetology Pending
1204034009 Cosmetologist
430103 Criminal Justice/Law Enforcement Administration
4301033019 Computer Forensics
4301033029 Criminal Justice Core
4301033049 Law Enforcement
4301037039 Criminal Justice
4301039001 Criminal Justice
110301 Data Processing and Data Processing Technology/Technician
1103013019 Basic Computer Skills
1103013049 Computer Technician
1103013059 Database Specialist
1103013069 Internet Technology Specialist
1103013099 Programming Specialist
1103013109 Networking Specialist
1103017039 Computer Information Tech
510602 Dental Hygiene/Hygienist
5106024019 Dental Assisting (Integrated)
5106024029 Dental Assisting (Int) Pending
5106027019 Dental Hygiene
5106027029 Dental Hygiene Pending
5106027030 Dental Hygiene (Int) Pending
5106029001 Pre Dental

Sources: CPE Official Data; KCTCS Unofficial Database
100
Crosswalk: CIP Codes to Academic Plans
CIP Code CIP Title Academic Plan Academic Plan Description
510603 Dental Laboratory Technology/Technician
5106033019 Dental Laboratory Technology
5106037019 Dental Laboratory Technology
5106037029 Dental Lab Technology Pending
470605 Diesel Mechanics Technology/Technician
4706053079 Diesel Engine Mechanic
4706053089 Heavy Duty Drive Train Mech
4706053179 Diesel SteeringSuspension Mech
151301 Drafting and Design Technology/Technician
1513013019 Computer Assisted Drafter
1513013039 Drafter Assistant
1513013049 Civil Drafter
1513013059 Computer Assisted Drafter
1513013069 Detailer
1513013079 Drafter Assistant
1513014019 Architectural Drafter
1513014029 Mechanical Drafter
1513014039 Computer Aided Drafting
1513014049 Computer Aided Drafting/Design
1513017029 Computer Aided Drafting/Design
131501 Educational/Instructional Media Design
1315013019 Paraeducator
1315017019 Education
1315019001 Preschool Education
150303 Electrical, Electronic and Communications Engineering Technology/Technician 1503037019 Engineering Technology - Elect
460302 Electrician
4603023029 Electrician Construction
4603023039 Electrician Trainee Level I
4603023049 Residential Electricity I
4603023059 Electrician Trainee Level II

Sources: CPE Official Data; KCTCS Unofficial Database
101
Crosswalk: CIP Codes to Academic Plans
CIP Code CIP Title Academic Plan Academic Plan Description
460302 Electrician
4603023069 Residential Electricity II
4603023079 Electrical Motor Cont. Level I
4603023089 Electrical Motor Cont Level II
4603023099 Voice & Data Wiring Inst Lvl I
4603023119 Voice & Data Wiring Technician
4603024019 Construction Electrician
4603024039 Industrial Electrician
4603024049 Electrical Technology
4603027039 Electrical Technology
150499 Electromechanical and Instrumentation and Maintenance Technologies/Technicians
1504993099 Alternative Energy
131202 Elementary Education and Teaching 1312029001 Elementary Education
510904 Emergency Medical Technology/Technician (EMT Paramedic) 5109042010 Emergency Medical Technician
5109043020 Paramedic Technology
140101 Engineering 1401019001 Pre Engineering
150000 Engineering Technology
1500003019 Automation Technician I
1500003029 Computer Maintenance Tech
1500003039 Communications Technician
1500003049 Maintenance Technician I
1500003059 Maintenance Technician
1500003069 Electronics Technician
1500003079 Electronics Technician I
1500003089 Electronics Tester
1500003099 Robotics & Automation Tech
1500003129 Industrial Electronics Tech I
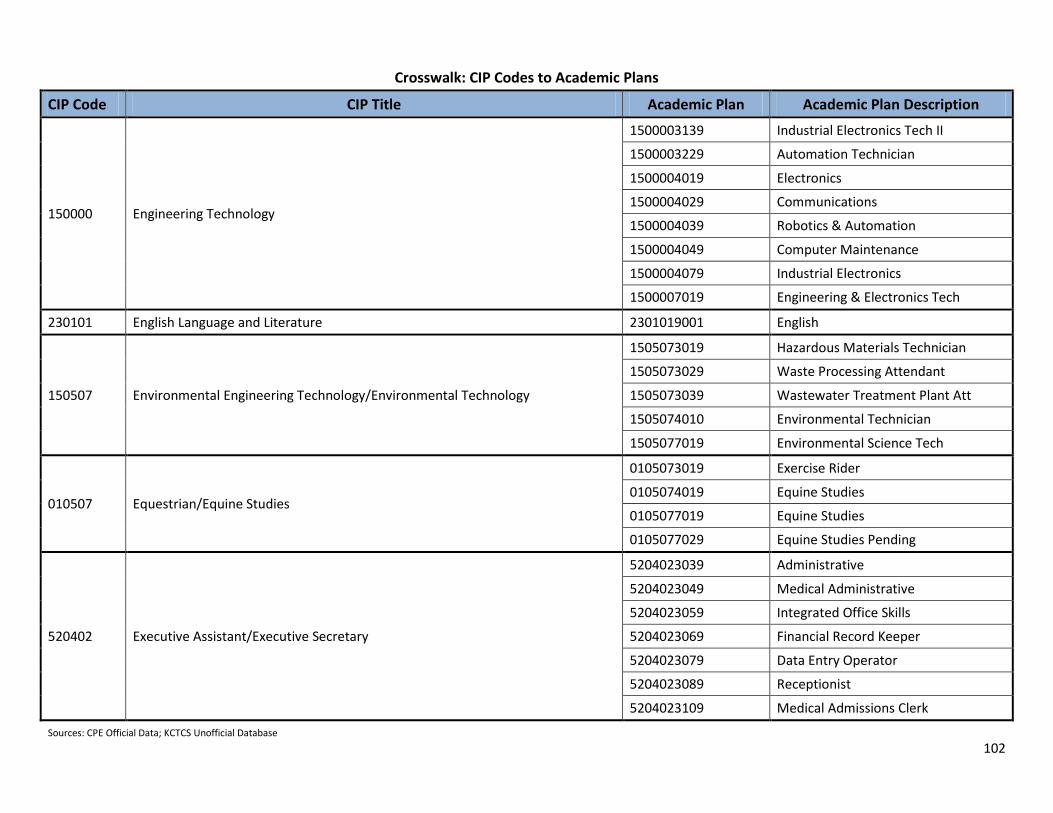
Sources: CPE Official Data; KCTCS Unofficial Database
102
Crosswalk: CIP Codes to Academic Plans
CIP Code CIP Title Academic Plan Academic Plan Description
150000 Engineering Technology
1500003139 Industrial Electronics Tech II
1500003229 Automation Technician
1500004019 Electronics
1500004029 Communications
1500004039 Robotics & Automation
1500004049 Computer Maintenance
1500004079 Industrial Electronics
1500007019 Engineering & Electronics Tech
230101 English Language and Literature 2301019001 English
150507 Environmental Engineering Technology/Environmental Technology
1505073019 Hazardous Materials Technician
1505073029 Waste Processing Attendant
1505073039 Wastewater Treatment Plant Att
1505074010 Environmental Technician
1505077019 Environmental Science Tech
010507 Equestrian/Equine Studies
0105073019 Exercise Rider
0105074019 Equine Studies
0105077019 Equine Studies
0105077029 Equine Studies Pending
520402 Executive Assistant/Executive Secretary
5204023039 Administrative
5204023049 Medical Administrative
5204023059 Integrated Office Skills
5204023069 Financial Record Keeper
5204023079 Data Entry Operator
5204023089 Receptionist
5204023109 Medical Admissions Clerk

Sources: CPE Official Data; KCTCS Unofficial Database
103
Crosswalk: CIP Codes to Academic Plans
CIP Code CIP Title Academic Plan Academic Plan Description
520402 Executive Assistant/Executive Secretary
5204023119 Basic Business Presentation
5204023129 Financial Assistant Clerk
5204023139 Financial Assistant Trainee
5204023159 Library Information Technology
5204023199 Medical Coding
5204023209 Medical Transcriptionist
5204023239 Graphic Design
5204023249 Web Design
5204024019 Administrative Assistant
5204024029 Desktop Publishing Specialist
5204024039 Office Assistant
5204024049 Financial Assistant
5204024059 Legal Office Assistant
5204024069 Medical Office Assistant
5204027039 Office Systems Technology
5204027049 Information Mgmt & Design
500702 Fine/Studio Arts 5007029001 Art/Art History/ Fine Art
430203 Fire Science/Fire-fighting
4302033019 Basic Firefighter
4302033029 Advanced Firefighter
4302033039 Fire Officer
4302034039 Fire Chief
4302037019 Fire Science Technology
No CIP Code
General Occupational/Technical Studies 3099997017 Gen Occupational Tech Studies
240102 General Studies 2401029001 General Humanities

Sources: CPE Official Data; KCTCS Unofficial Database
104
Crosswalk: CIP Codes to Academic Plans
CIP Code CIP Title Academic Plan Academic Plan Description
510707 Health Information/Medical Records Technology/Technician
5107073019 Medical Records Coding
5107073039 Release of Data Specialist
5107077019 Health Information Technology
510000 Health Services/Allied Health/Health Sciences 5100009001 General, Allied Health
5100007019 Health Science Technology
131307 Health Teacher Education 1313079001 Education, General
470201 Heating, Air Conditioning, Ventilation and Refrigeration Maintenance Technology/Technician
4702013029 Domestic Air Cond & Furnace
4702013039 Environmental Control Sys Serv
4702013059 Refrigeration Mechanic
4702013069 Environmental Syst Repair Help
4702014009 Heat Ventilation Air Cond Mech
4702017019 Air Conditioning Technology
4702017029 Air Conditioning Tech Pending
470303 Industrial Mechanics and Maintenance Technology
4703033019 Industrial Maint Electrician Hlp
4703033039 Industry Maint Machinist Hlpr
4703033119 Ind Main Machinists Mechanic
4703033129 Fluid Power Mechanic
4703033139 Industrial Maint Mech Lvl I
4703033149 Industrial Maint Mech Lvl II
4703033159 Industrial Mainten Electr Mech
4703033169 Electrohydraulic Technician
4703034019 Industrial Maintenance Tech
4703034039 Industrial Maint Tech (INT)
4703034049 Industrial Maintenance Tech
4703037019 Industrial Maintenance Tech

Sources: CPE Official Data; KCTCS Unofficial Database
105
Crosswalk: CIP Codes to Academic Plans
CIP Code CIP Title Academic Plan Academic Plan Description
470303 Industrial Mechanics and Maintenance Technology 4703038029 Industrial Maintenance Tech
131203 Junior High/Intermediate/Middle School Education and Teaching 1312039001 Middle School Education
240101 Liberal Arts and Sciences/Liberal Studies1
2401011010 HS General Education
2401015000 Associate in Arts
2401016000 Associate in Science
2401019000 Liberal Arts & Science/Lib. St
2401029000 General Studies
2401999000 Humanities and Social Sciences
513901 Licensed Practical/Vocational Nurse Training
5139012020 Medicaid Nurse Aide
5139012030 Kentucky Medication Aide
5139012040 Kentucky Medication Aide
5139014009 Practical Nurse(Acad/Career)
5139014019 Practical Nurse Pending
5139014029 Practical Nurse Pending
5139014039 Practical Nurse
480503 Machine Shop Technology/Assistant
4805033039 Exploratory Machining
4805033099 Exploratory Machining
4805033109 Machine Tool Operator I
4805033119 Machine Tool Operator II
4805033129 CNC Operator
4805033130 Tool and Die Apprentice
4805033169 Exploratory Machining I
4805033189 CNC Machining & Waterjet Tech
4805033199 Exploratory Machining I
4805034019 CNC Machinist Apprentice

Sources: CPE Official Data; KCTCS Unofficial Database
106
Crosswalk: CIP Codes to Academic Plans
CIP Code CIP Title Academic Plan Academic Plan Description
480503 Machine Shop Technology/Assistant
4805034069 CNC Machinist
4805034079 Machinist
4805037019 Comp Manufacturing & Machining
460101 Mason/Masonry
4601013019 Bricklayer Trainee
4601013029 Bricklayer Helper
4601013039 Construction Bricklayer
4601013049 Stone Mason
4601014019 Construction Mason
270101 Mathematics 2701019001 Mathematics
510716 Medical Administrative/Executive Assistant and Medical Secretary
5107163079 Medical Coding
5107163089 Medical Transcriptionist
5107164069 Medical Records Specialist
5107163019 Medical Unit Coordinator
5107163029 Hospital Admissions Specialist
5107163039 Medical Office Trainee
5107163049 Medical Receptionist
5107164019 Medical Administrative Asst
5107164029 Medical Insurance Coding
5107164039 Medical Office Assistant
5107164049 Medical Records Clerk
5107164059 Medical Transcriptionist
5107167019 Medical Information Technology
510907 Medical Radiologic Technology/Science v Radiation Therapist
5109074009 Radiologic Technologist
5109074019 Radiologic Technology Pending
5109074029 Radiographer

Sources: CPE Official Data; KCTCS Unofficial Database
107
Crosswalk: CIP Codes to Academic Plans
CIP Code CIP Title Academic Plan Academic Plan Description
510907 Medical Radiologic Technology/Science v Radiation Therapist
5109077019 Radiography Pending
5109077029 Radiography
5109077039 Radiography
5109077049 Radiography Pending
510801 Medical/Clinical Assistant
5108013029 Medical Office Admin Asst
5108013049 Medical Office Insur Bill/Code
5108013059 Medical Office Clinical Assist
5108013069 Medical Office Admin Asst
5108014009 Medical Assistant
5108014019 Medical Assistant Pending
5108014020 Medical Assisting (INT)
5108014039 Medical Assisting (Int) Pend
5108017029 Medical Assisting
5108013139 Medical Office Limited Rad
900000 Non-credential2
9001000000 Non Credential
9002000000 Non Credential - Workforce
9003000000 Non Credential - High School
510905 Nuclear Medical Technology/Technologist
5109057019 Nuclear Medicine Technology
5109057029 Nucl Med/Molec Imaging Pending
5109057039 Nuclear Med & Molec Imag Tech
5109059001 Radiography
511601 Nursing (RN Training)
5116017009 Nursing
5116017019 Nursing Pending (ADN)
5116017029 Nursing
5116017039 Nursing Pending

Sources: CPE Official Data; KCTCS Unofficial Database
108
Crosswalk: CIP Codes to Academic Plans
CIP Code CIP Title Academic Plan Academic Plan Description
510805 Pharmacy Technician/Assistant 5108059001 Pre Pharmacy
400101 Physical Sciences 4001019001 General, Life Natural Science
451001 Political Science and Government 4510019001 Political Science
420101 Psychology 4201019001 Psychology
521501 Real Estate 5215013029 Real Estate Pre-Licensing
513801 Registered Nursing/Registered Nurse
5138017019 Nursing Pending (ADN)
5138017029 Nursing
5138017039 Nursing Pending
5138017059 Nursing Career Mobility Pnd
5138017079 Nursing INT Program Pending
5138019001 Pre Nursing
510908 Respiratory Care Therapy/Therapist
5109083049 Electrocardiographic & Cardiac
5109083069 Polysomnographic Technologist
5109083079 Polysomnographic Tech Pending
5109087049 Adv Practice Respira Therapist
5109087059 Adv Practi Resp Therap Pending
5109087069 Respiratory Care
5109087079 Respiratory Care Pending
231304 Rhetoric and Composition 2313049001 Theater
430112 Securities Services Administration/Management
4301123010 Security Management Coordinator
4301123020 Antiterror Phys Security Spec
4301123040 Safe and Lock Technician
439999 Security and Protective Services 4399993019 Homeland Secur/Emerg Mgmt Spec
4399997019 Homeland Sec/Emergency Mgmt

Sources: CPE Official Data; KCTCS Unofficial Database
109
Crosswalk: CIP Codes to Academic Plans
CIP Code CIP Title Academic Plan Academic Plan Description
470606 Small Engine Mechanics and Repair Technology/Technician
4706063019 Engine Technician
4706063069 Two Cycle Engine Specialist
4706064039 Motorcycle Technician
4706064059 Small Engine Technician
450101 Social Sciences 4501019001 General, Social Behavioral Sci
440701 Social Work
4407013029 Youth Care Work
4407013039 Direct Support Work
4407017000 Human Services
4407019001 Social Work
451101 Sociology 4511019001 Sociology
131001 Special Education and Teaching 1310019001 Special Education
090101 Speech Communication and Rhetoric 0901019001 Communications
510909 Surgical Technology/Technologist
5109094009 Surgical Technologist Pending
5109094019 Surgical Technologist
5109097019 Surgical Technology
Multiple Transfer Framework Multiple Transfer Framework
000100 Undecided 0001000000 Undecided
0001000010 Undecided Transfer
480508 Welding Technology/Welder
4805083029 ARC Welder
4805083039 Gas Welder
4805083059 Production Line Welder
4805083089 AWS Nat'l Skill Stand Level I
4805083099 ARC Cutter
4805083109 Pipeline Welder

Sources: CPE Official Data; KCTCS Unofficial Database
110
Crosswalk: CIP Codes to Academic Plans
CIP Code CIP Title Academic Plan Academic Plan Description
480508 Welding Technology/Welder
4805083119 Tack Welder
4805083129 Welder Helper
4805083139 Shielded Metal Arc Welder
4805083149 Gas Metal Arc Welder
4805083159 Gas Tungsten Arc Welder
4805084019 Combination Welder
4805084029 Combination Welder
4805087019 Welding Technology
4805087029 Welding Tech PND
4805088029 Welding Technology 1The academic plans listed do not include those corresponding to transfer framework (only applies to Liberal Arts and Sciences/Liberal Studies CIP Code). 2Does not include academic plans specific to high school students (only applies to Non-Credential CIP Code).