bcps systems for literacy development in the early … · bcps systems for literacy development in...
TRANSCRIPT
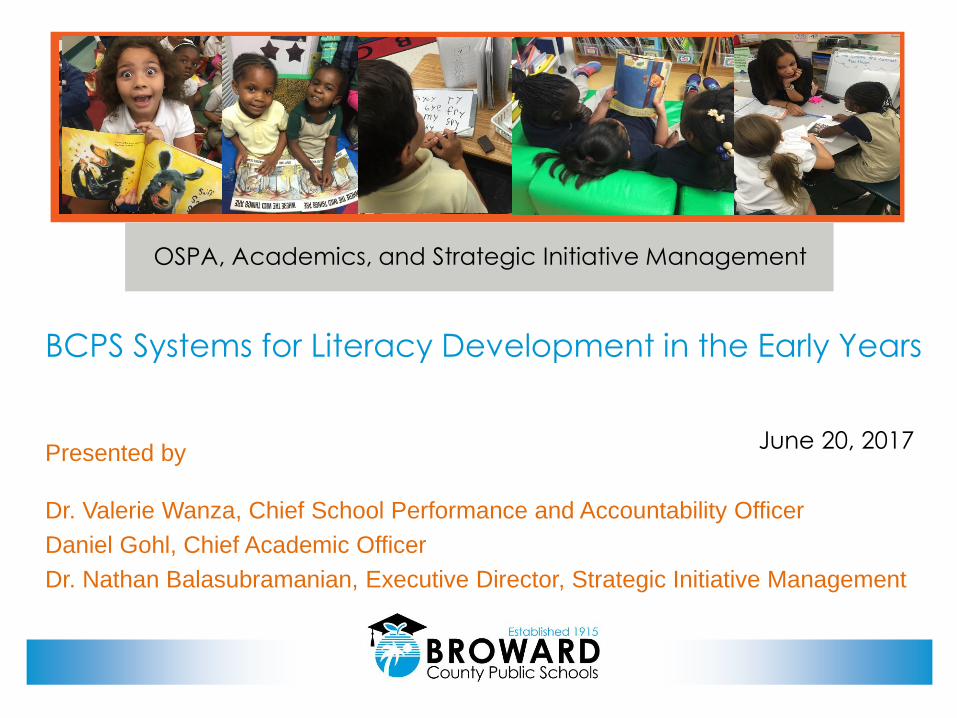
BCPS Systems for Literacy Development in the Early Years
Presented by
Dr. Valerie Wanza, Chief School Performance and Accountability Officer
Daniel Gohl, Chief Academic Officer
Dr. Nathan Balasubramanian, Executive Director, Strategic Initiative Management
OSPA, Academics, and Strategic Initiative Management
June 20, 2017
Why are we here?
BROWARD COUNTY PUBLIC SCHOOLS SYSTEMS FOR ENSURING LITERACY DEVELOPMENT IN THE EARLY YEARS
Students need to be independent readers early in their
educational life in order to
demonstrate mastery of English Language Arts (ELA)
standards
Our expectation continues to be:
Practitioners and leaders
worked diligently to
know where students were and
responded to their needs
This work needs to be sustained
2
Ensuring Literacy Development in Early Years
Today We Will Address:
• Why, How, What?
• Early Literacy Portfolio: Project Scorecards
• Grade 3 FSA (ELA) and BAS Data
• Focus on ALL students (ELL, ESE, GT, etc.)
• Accomplishments, Lessons Learned, and
Next Steps
3BROWARD COUNTY PUBLIC SCHOOLS SYSTEMS FOR ENSURING LITERACY DEVELOPMENT IN THE EARLY YEARS
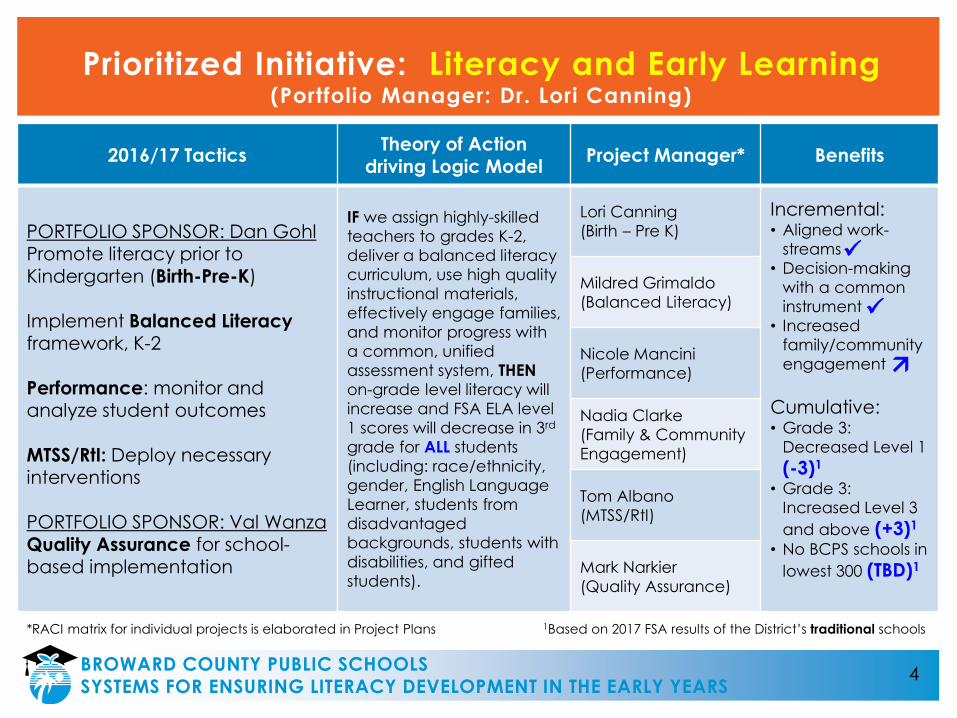
Prioritized Initiative: Literacy and Early Learning(Portfolio Manager: Dr. Lori Canning)
2016/17 TacticsTheory of Action
driving Logic ModelProject Manager* Benefits
PORTFOLIO SPONSOR: Dan Gohl Promote literacy prior to Kindergarten (Birth-Pre-K)
Implement Balanced Literacy framework, K-2
Performance: monitor and analyze student outcomes
MTSS/RtI: Deploy necessary interventions
PORTFOLIO SPONSOR: Val Wanza
Quality Assurance for school-based implementation
IF we assign highly-skilled
teachers to grades K-2,
deliver a balanced literacy
curriculum, use high quality
instructional materials,
effectively engage families,
and monitor progress with
a common, unified
assessment system, THEN
on-grade level literacy will
increase and FSA ELA level
1 scores will decrease in 3rd
grade for ALL students
(including: race/ethnicity,
gender, English Language
Learner, students from
disadvantaged
backgrounds, students with
disabilities, and gifted
students).
Lori Canning
(Birth – Pre K)
Incremental:• Aligned work-
streams
• Decision-making
with a common
instrument
• Increased
family/community
engagement
Cumulative:• Grade 3:
Decreased Level 1
(-3)1
• Grade 3:
Increased Level 3
and above (+3)1
• No BCPS schools in
lowest 300 (TBD)1
Mildred Grimaldo
(Balanced Literacy)
Nicole Mancini
(Performance)
Nadia Clarke
(Family & Community
Engagement)
Tom Albano
(MTSS/RtI)
Mark Narkier
(Quality Assurance)
*RACI matrix for individual projects is elaborated in Project Plans 1Based on 2017 FSA results of the District’s traditional schools
4BROWARD COUNTY PUBLIC SCHOOLS SYSTEMS FOR ENSURING LITERACY DEVELOPMENT IN THE EARLY YEARS
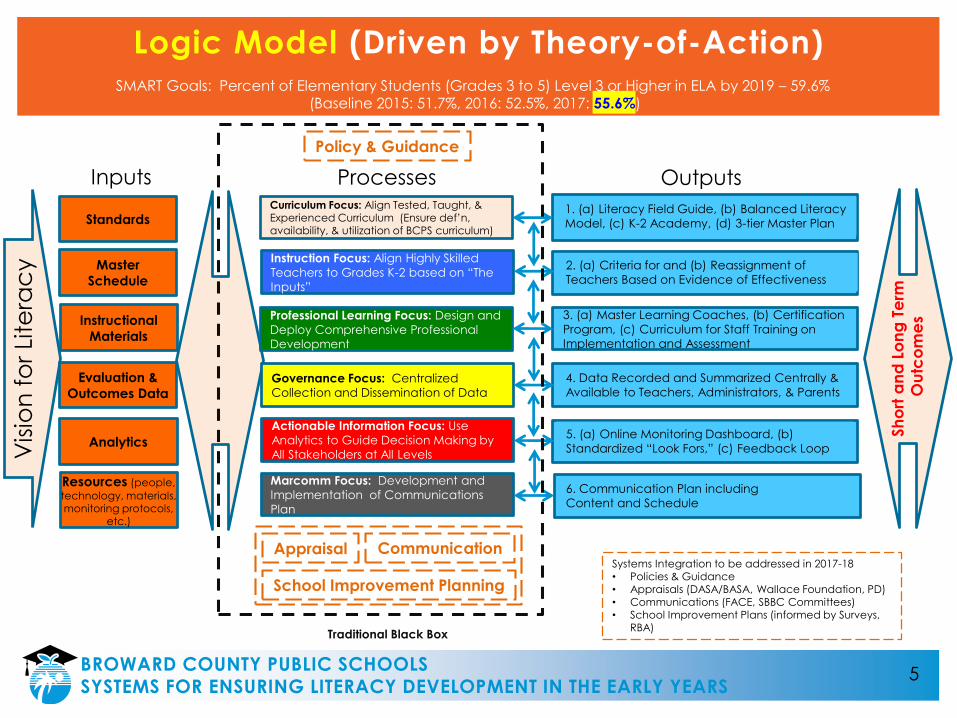
Logic Model (Driven by Theory-of-Action)SMART Goals: Percent of Elementary Students (Grades 3 to 5) Level 3 or Higher in ELA by 2019 – 59.6%
(Baseline 2015: 51.7%, 2016: 52.5%, 2017: 55.6%)
Traditional Black Box
Curriculum Focus: Align Tested, Taught, & Experienced Curriculum (Ensure def’n, availability, & utilization of BCPS curriculum)
Instruction Focus: Align Highly Skilled
Teachers to Grades K-2 based on “The
Inputs”
Professional Learning Focus: Design and
Deploy Comprehensive Professional
Development
Governance Focus: Centralized
Collection and Dissemination of Data
1. (a) Literacy Field Guide, (b) Balanced Literacy
Model, (c) K-2 Academy, (d) 3-tier Master Plan
2. (a) Criteria for and (b) Reassignment of
Teachers Based on Evidence of Effectiveness
3. (a) Master Learning Coaches, (b) Certification
Program, (c) Curriculum for Staff Training on
Implementation and Assessment
4. Data Recorded and Summarized Centrally &
Available to Teachers, Administrators, & Parents
Processes
Actionable Information Focus: Use
Analytics to Guide Decision Making by
All Stakeholders at All Levels
Marcomm Focus: Development and
Implementation of Communications
Plan
5. (a) Online Monitoring Dashboard, (b)
Standardized “Look Fors,” (c) Feedback Loop
6. Communication Plan including
Content and Schedule
Inputs Outputs
Sh
ort
an
d L
on
g T
erm
Ou
tco
me
s
Vis
ion
fo
r Li
tera
cy
Standards
Master
Schedule
Instructional
Materials
Evaluation &
Outcomes Data
Analytics
Resources (people,
technology, materials, monitoring protocols,
etc.)
Policy & Guidance
Appraisal Communication
School Improvement Planning
Systems Integration to be addressed in 2017-18• Policies & Guidance• Appraisals (DASA/BASA, Wallace Foundation, PD)• Communications (FACE, SBBC Committees)• School Improvement Plans (informed by Surveys,
RBA)
5BROWARD COUNTY PUBLIC SCHOOLS SYSTEMS FOR ENSURING LITERACY DEVELOPMENT IN THE EARLY YEARS
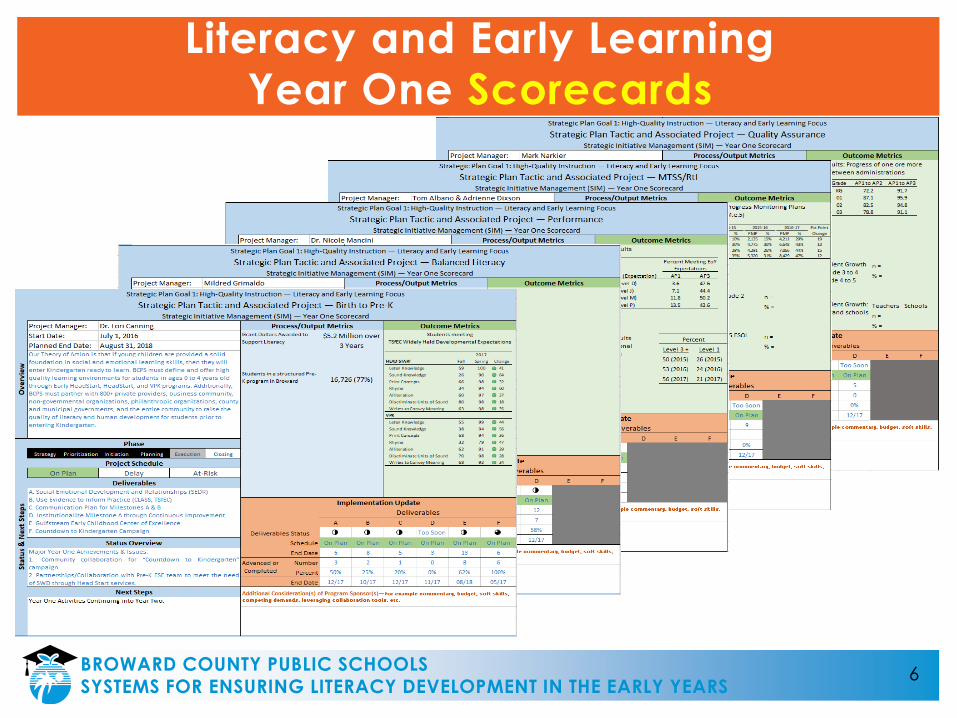
Literacy and Early Learning
Year One Scorecards
6BROWARD COUNTY PUBLIC SCHOOLS SYSTEMS FOR ENSURING LITERACY DEVELOPMENT IN THE EARLY YEARS
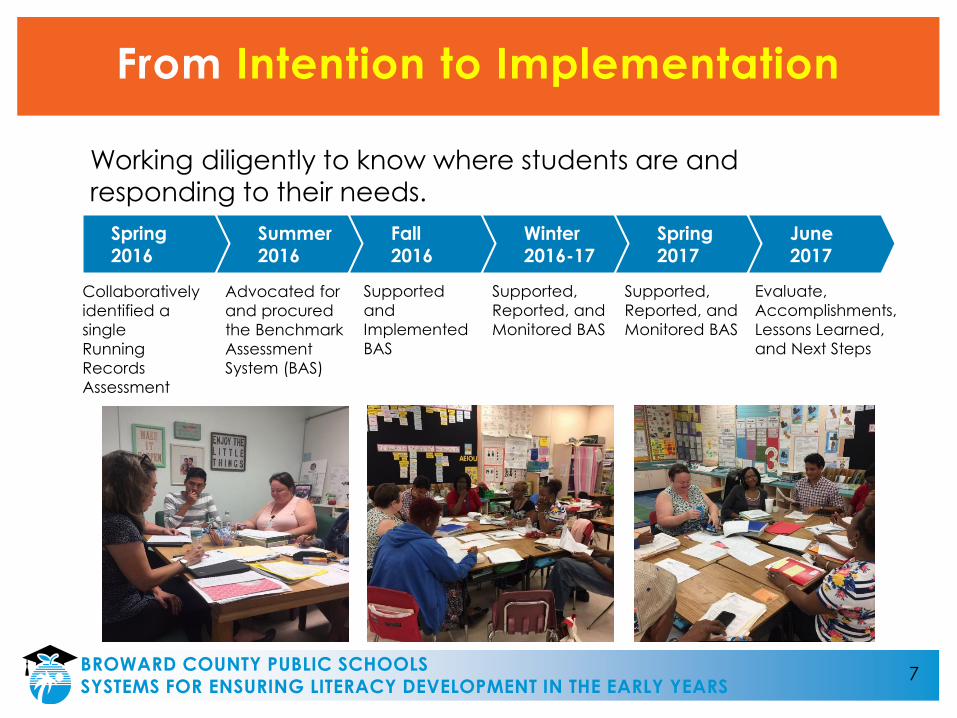
From Intention to Implementation
Spring 2016
Summer 2016
Fall 2016
Winter 2016-17
Spring 2017
June 2017
Collaboratively
identified a
single
Running
Records
Assessment
Advocated for
and procured
the Benchmark
Assessment
System (BAS)
Supported
and
Implemented
BAS
Supported,
Reported, and
Monitored BAS
Supported,
Reported, and
Monitored BAS
Evaluate,
Accomplishments,
Lessons Learned,
and Next Steps
Working diligently to know where students are and
responding to their needs.
7BROWARD COUNTY PUBLIC SCHOOLS SYSTEMS FOR ENSURING LITERACY DEVELOPMENT IN THE EARLY YEARS
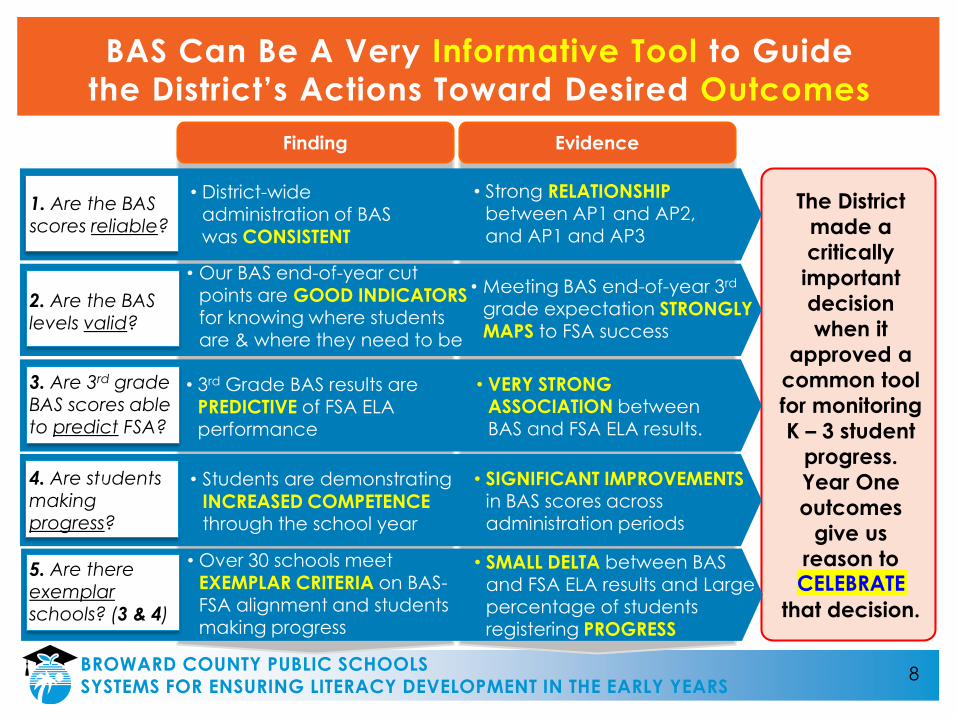
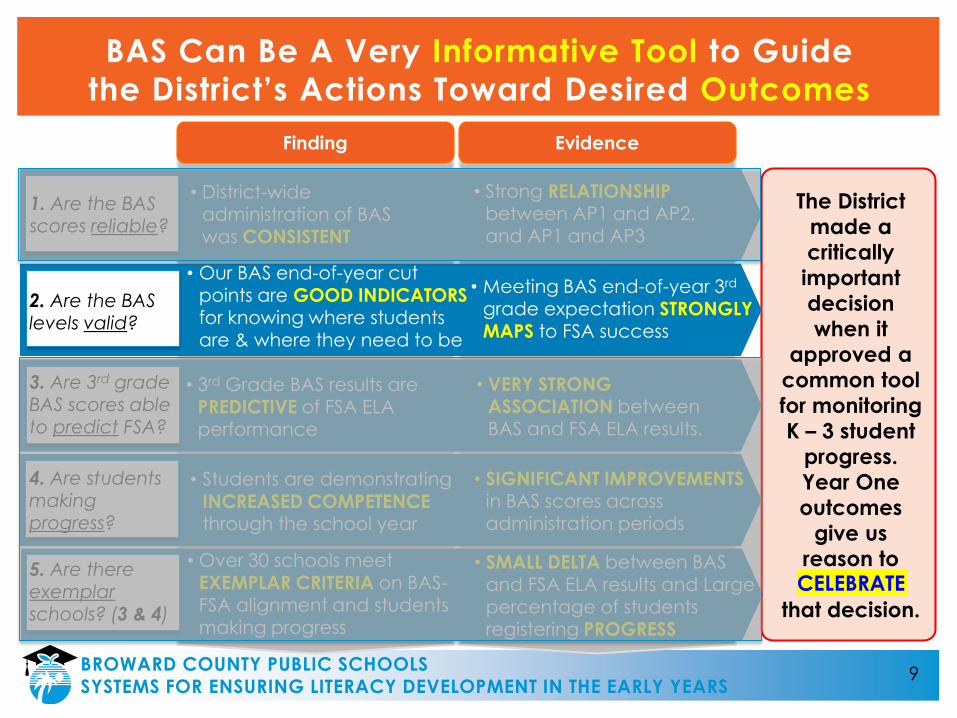
Evidence
The District
made a
critically
important
decision
when it
approved a
common tool
for monitoring
K – 3 student
progress.
Year One
outcomes
give us
reason to
CELEBRATE
that decision.
Finding
• text
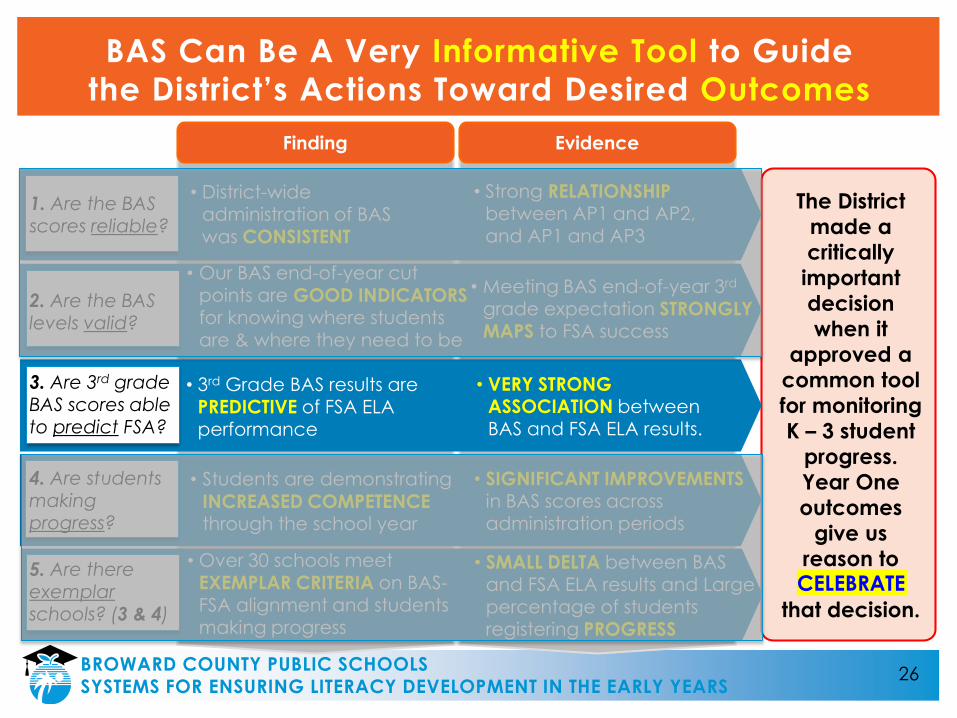
BAS Can Be A Very Informative Tool to Guide
the District’s Actions Toward Desired Outcomes
• District-wide administration of BAS was CONSISTENT
• Strong RELATIONSHIPbetween AP1 and AP2, and AP1 and AP3
• 3rd Grade BAS results are PREDICTIVE of FSA ELA
performance
• VERY STRONG ASSOCIATION between BAS and FSA ELA results.
• Our BAS end-of-year cut points are GOOD INDICATORSfor knowing where students are & where they need to be
• Meeting BAS end-of-year 3rd
grade expectation STRONGLY
MAPS to FSA success
• Students are demonstrating
INCREASED COMPETENCE through the school year
• SIGNIFICANT IMPROVEMENTSin BAS scores across administration periods
• Over 30 schools meet EXEMPLAR CRITERIA on BAS-FSA alignment and students making progress
• SMALL DELTA between BAS and FSA ELA results and Large percentage of students registering PROGRESS
1. Are the BAS scores reliable?
3. Are 3rd grade BAS scores able to predict FSA?
2. Are the BAS levels valid?
4. Are students making progress?
5. Are there exemplarschools? (3 & 4)
CELEBRATE
8BROWARD COUNTY PUBLIC SCHOOLS SYSTEMS FOR ENSURING LITERACY DEVELOPMENT IN THE EARLY YEARS
Evidence
The District
made a
critically
important
decision
when it
approved a
common tool
for monitoring
K – 3 student
progress.
Year One
outcomes
give us
reason to
CELEBRATE
that decision.
Finding
• text
BAS Can Be A Very Informative Tool to Guide
the District’s Actions Toward Desired Outcomes
• District-wide administration of BAS was CONSISTENT
• Strong RELATIONSHIPbetween AP1 and AP2, and AP1 and AP3
• 3rd Grade BAS results are PREDICTIVE of FSA ELA
performance
• VERY STRONG ASSOCIATION between BAS and FSA ELA results.
• Our BAS end-of-year cut points are GOOD INDICATORSfor knowing where students are & where they need to be
• Meeting BAS end-of-year 3rd
grade expectation STRONGLY
MAPS to FSA success
• Students are demonstrating
INCREASED COMPETENCE through the school year
• SIGNIFICANT IMPROVEMENTSin BAS scores across administration periods
• Over 30 schools meet EXEMPLAR CRITERIA on BAS-FSA alignment and students making progress
• SMALL DELTA between BAS and FSA ELA results and Large percentage of students registering PROGRESS
1. Are the BAS scores reliable?
3. Are 3rd grade BAS scores able to predict FSA?
2. Are the BAS levels valid?
4. Are students making progress?
5. Are there exemplarschools? (3 & 4)
CELEBRATE
9BROWARD COUNTY PUBLIC SCHOOLS SYSTEMS FOR ENSURING LITERACY DEVELOPMENT IN THE EARLY YEARS
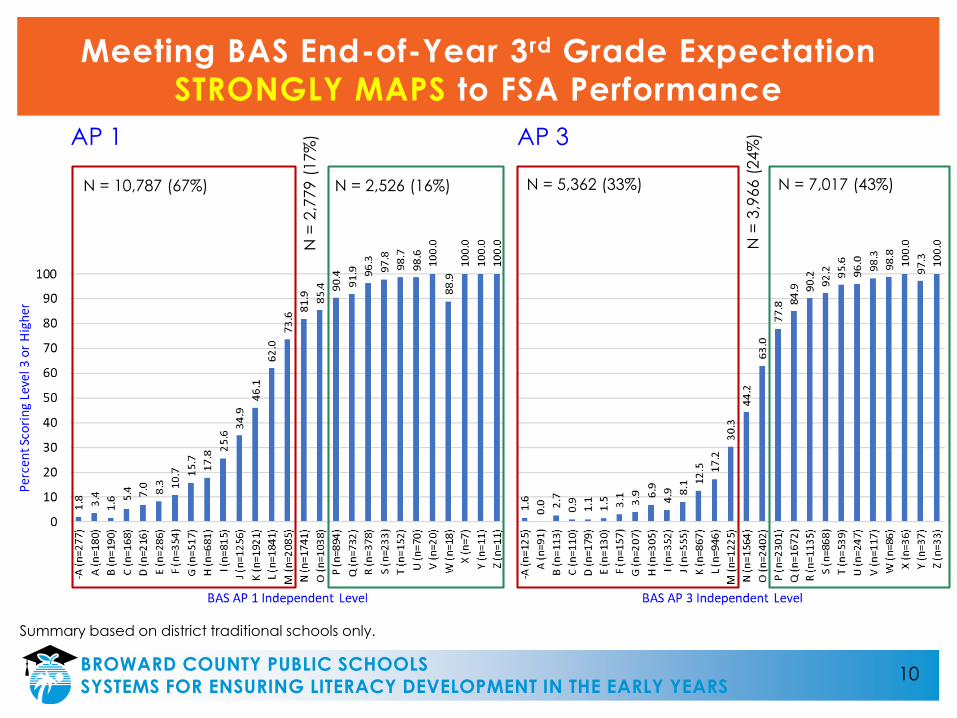
Meeting BAS End-of-Year 3rd Grade Expectation
STRONGLY MAPS to FSA Performance
Summary based on district traditional schools only.
N = 10,787 (67%) N = 2,526 (16%)
N =
2,7
79 (
17%
)AP 1 AP 3
N = 5,362 (33%) N = 7,017 (43%)
N =
3,9
66 (
24%
)
10BROWARD COUNTY PUBLIC SCHOOLS SYSTEMS FOR ENSURING LITERACY DEVELOPMENT IN THE EARLY YEARS
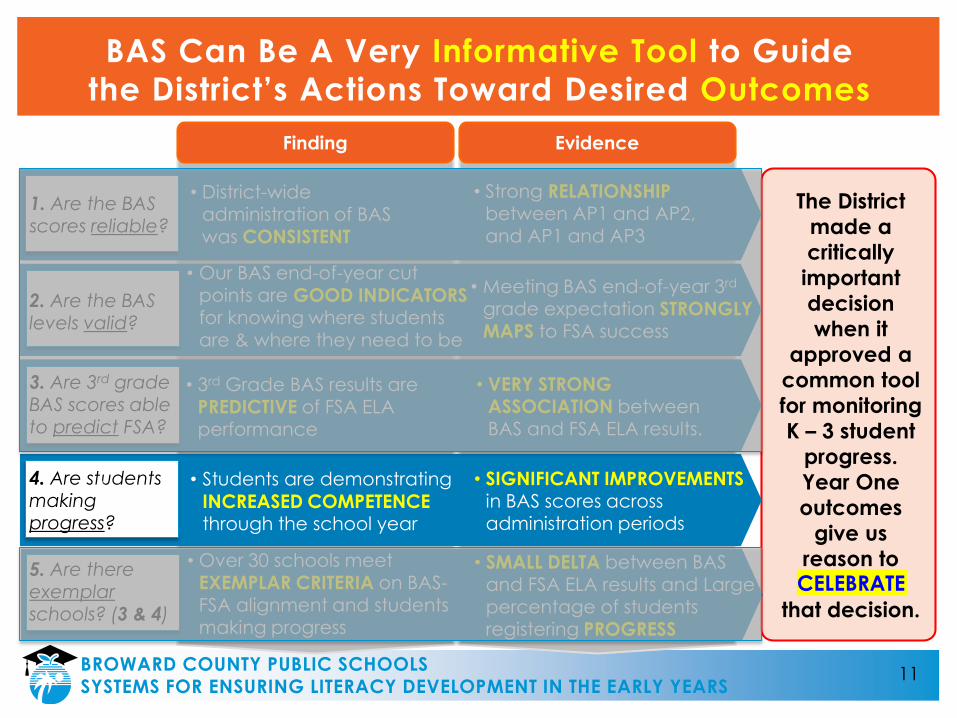
Evidence
The District
made a
critically
important
decision
when it
approved a
common tool
for monitoring
K – 3 student
progress.
Year One
outcomes
give us
reason to
CELEBRATE
that decision.
Finding
• text
BAS Can Be A Very Informative Tool to Guide
the District’s Actions Toward Desired Outcomes
• District-wide administration of BAS was CONSISTENT
• Strong RELATIONSHIPbetween AP1 and AP2, and AP1 and AP3
• 3rd Grade BAS results are PREDICTIVE of FSA ELA
performance
• VERY STRONG ASSOCIATION between BAS and FSA ELA results.
• Our BAS end-of-year cut points are GOOD INDICATORSfor knowing where students are & where they need to be
• Meeting BAS end-of-year 3rd
grade expectation STRONGLY
MAPS to FSA success
• Students are demonstrating
INCREASED COMPETENCE through the school year
• SIGNIFICANT IMPROVEMENTSin BAS scores across administration periods
• Over 30 schools meet EXEMPLAR CRITERIA on BAS-FSA alignment and students making progress
• SMALL DELTA between BAS and FSA ELA results and Large percentage of students registering PROGRESS
1. Are the BAS scores reliable?
3. Are 3rd grade BAS scores able to predict FSA?
2. Are the BAS levels valid?
4. Are students making progress?
5. Are there exemplarschools? (3 & 4)
CELEBRATE
11BROWARD COUNTY PUBLIC SCHOOLS SYSTEMS FOR ENSURING LITERACY DEVELOPMENT IN THE EARLY YEARS
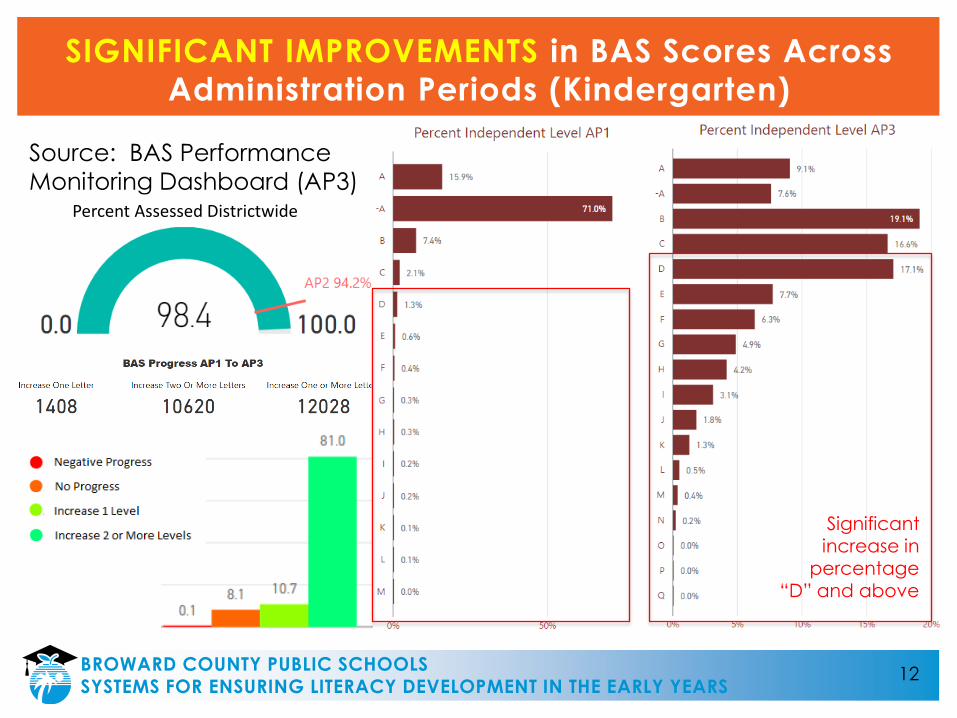
SIGNIFICANT IMPROVEMENTS in BAS Scores Across
Administration Periods (Kindergarten)
Source: BAS Performance
Monitoring Dashboard (AP3)
Significant increase in
percentage “D” and above
12BROWARD COUNTY PUBLIC SCHOOLS SYSTEMS FOR ENSURING LITERACY DEVELOPMENT IN THE EARLY YEARS
Percent Assessed Districtwide
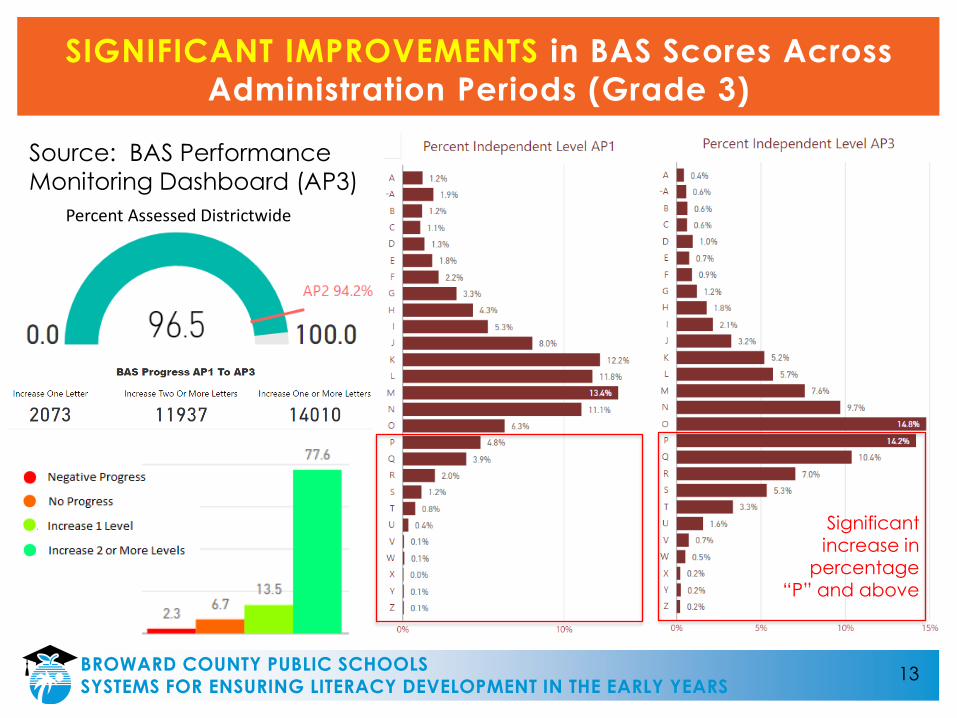
SIGNIFICANT IMPROVEMENTS in BAS Scores Across
Administration Periods (Grade 3)
Source: BAS Performance
Monitoring Dashboard (AP3)
Significant increase in
percentage “P” and above
13BROWARD COUNTY PUBLIC SCHOOLS SYSTEMS FOR ENSURING LITERACY DEVELOPMENT IN THE EARLY YEARS
Percent Assessed Districtwide
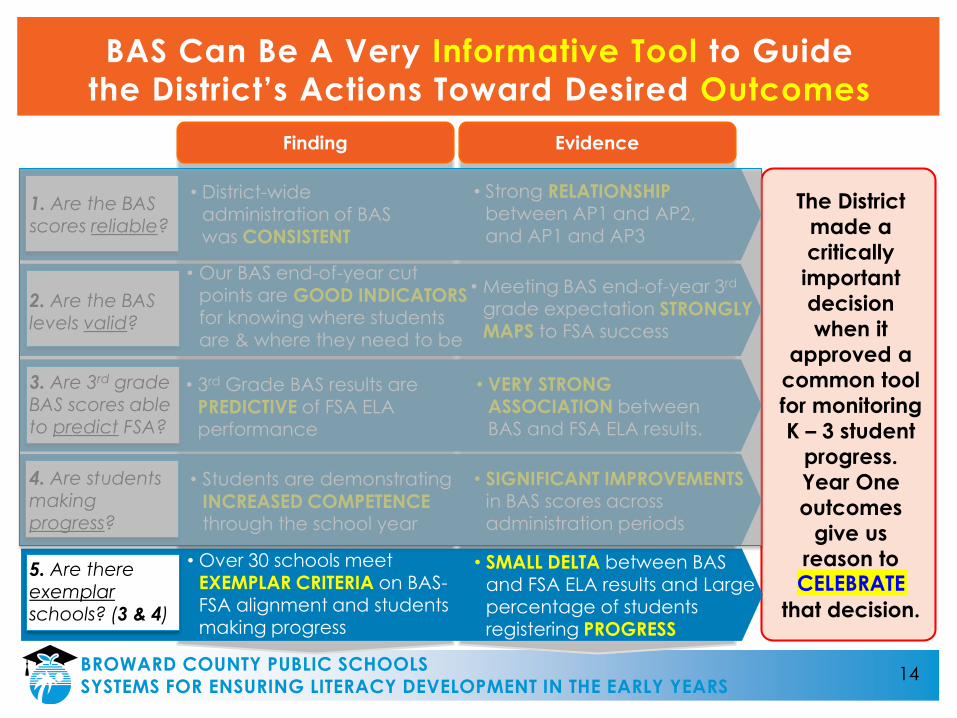
Evidence
The District
made a
critically
important
decision
when it
approved a
common tool
for monitoring
K – 3 student
progress.
Year One
outcomes
give us
reason to
CELEBRATE
that decision.
Finding
• text
BAS Can Be A Very Informative Tool to Guide
the District’s Actions Toward Desired Outcomes
• District-wide administration of BAS was CONSISTENT
• Strong RELATIONSHIPbetween AP1 and AP2, and AP1 and AP3
• 3rd Grade BAS results are PREDICTIVE of FSA ELA
performance
• VERY STRONG ASSOCIATION between BAS and FSA ELA results.
• Our BAS end-of-year cut points are GOOD INDICATORSfor knowing where students are & where they need to be
• Meeting BAS end-of-year 3rd
grade expectation STRONGLY
MAPS to FSA success
• Students are demonstrating
INCREASED COMPETENCE through the school year
• SIGNIFICANT IMPROVEMENTSin BAS scores across administration periods
• Over 30 schools meet EXEMPLAR CRITERIA on BAS-FSA alignment and students making progress
• SMALL DELTA between BAS and FSA ELA results and Large percentage of students registering PROGRESS
1. Are the BAS scores reliable?
3. Are 3rd grade BAS scores able to predict FSA?
2. Are the BAS levels valid?
4. Are students making progress?
5. Are there exemplarschools? (3 & 4)
CELEBRATE
14BROWARD COUNTY PUBLIC SCHOOLS SYSTEMS FOR ENSURING LITERACY DEVELOPMENT IN THE EARLY YEARS
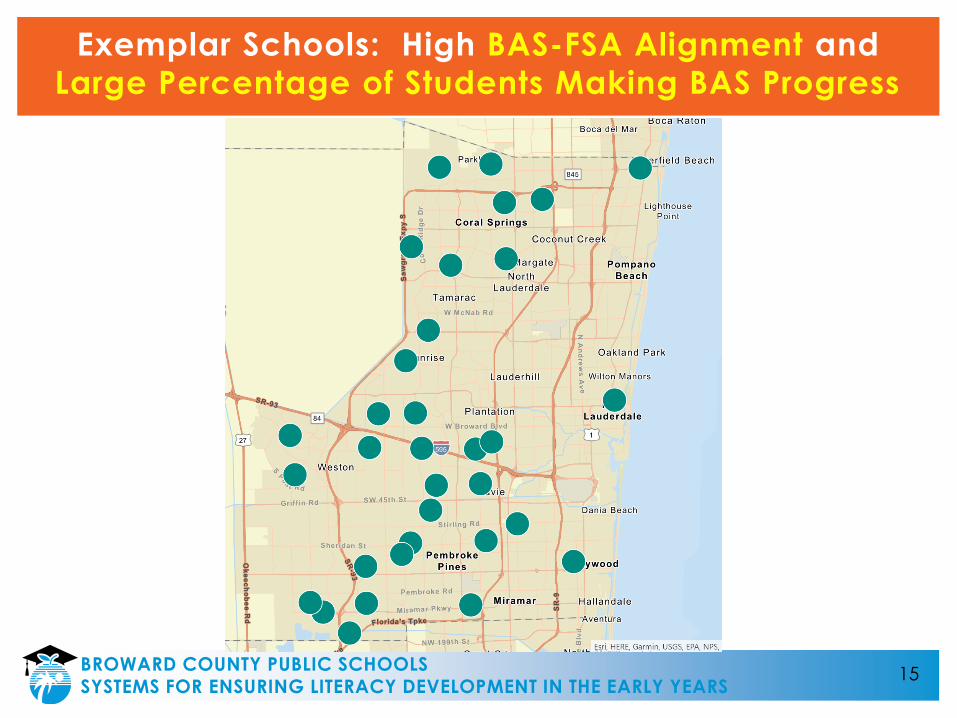
Exemplar Schools: High BAS-FSA Alignment and
Large Percentage of Students Making BAS Progress
15BROWARD COUNTY PUBLIC SCHOOLS SYSTEMS FOR ENSURING LITERACY DEVELOPMENT IN THE EARLY YEARS
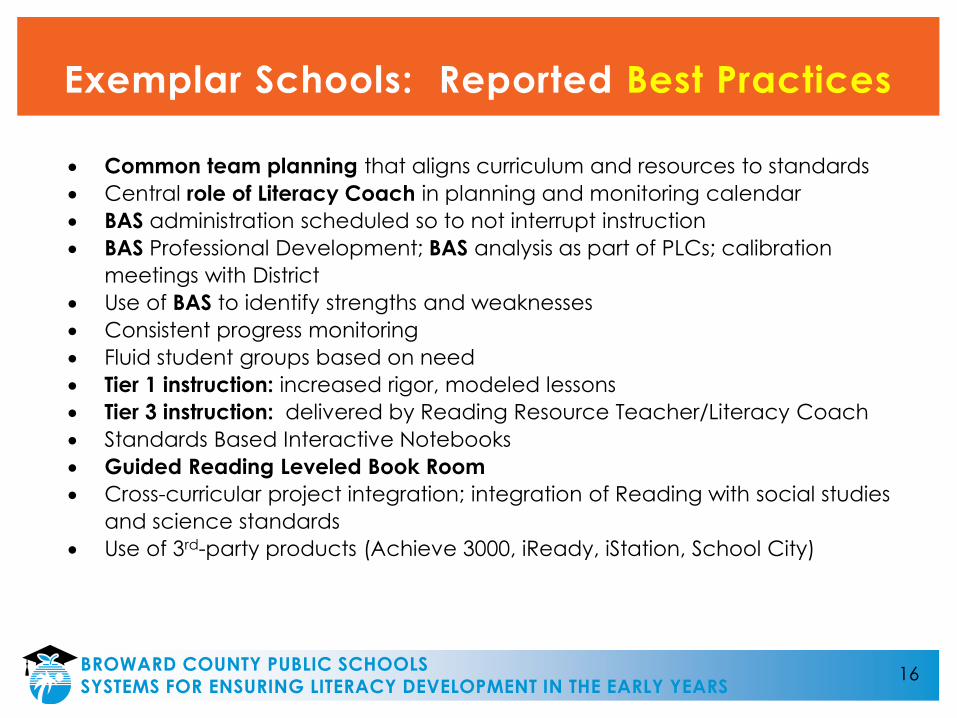
Exemplar Schools: Reported Best Practices
16BROWARD COUNTY PUBLIC SCHOOLS SYSTEMS FOR ENSURING LITERACY DEVELOPMENT IN THE EARLY YEARS
Common team planning that aligns curriculum and resources to standards
Central role of Literacy Coach in planning and monitoring calendar
BAS administration scheduled so to not interrupt instruction
BAS Professional Development; BAS analysis as part of PLCs; calibration
meetings with District
Use of BAS to identify strengths and weaknesses
Consistent progress monitoring
Fluid student groups based on need
Tier 1 instruction: increased rigor, modeled lessons
Tier 3 instruction: delivered by Reading Resource Teacher/Literacy Coach
Standards Based Interactive Notebooks
Guided Reading Leveled Book Room
Cross-curricular project integration; integration of Reading with social studies
and science standards
Use of 3rd-party products (Achieve 3000, iReady, iStation, School City)
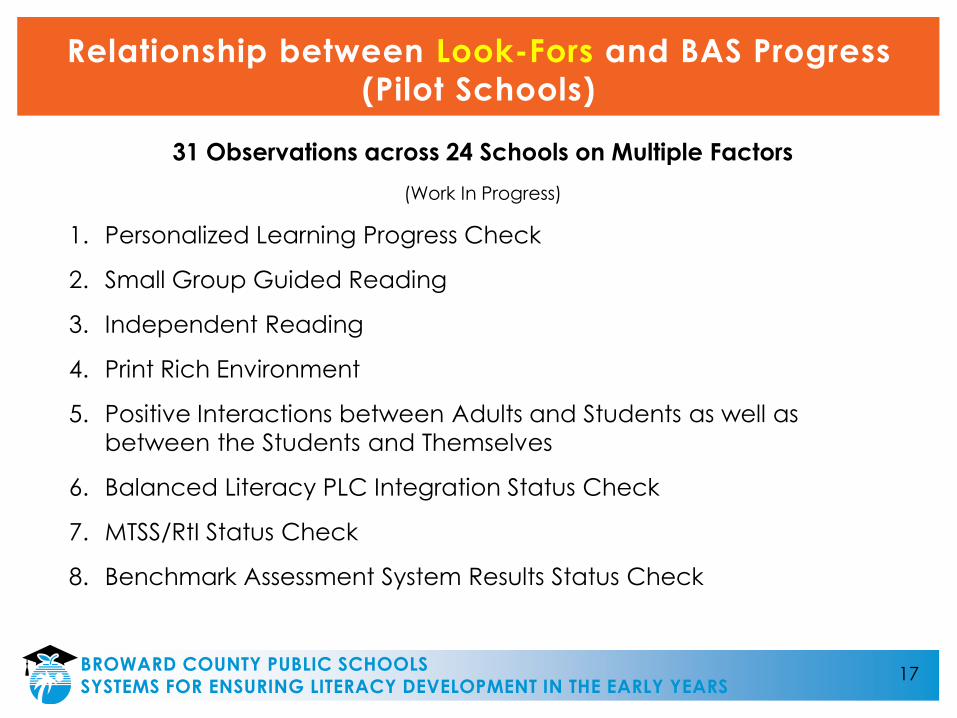
Relationship between Look-Fors and BAS Progress
(Pilot Schools)
31 Observations across 24 Schools on Multiple Factors
(Work In Progress)
1. Personalized Learning Progress Check
2. Small Group Guided Reading
3. Independent Reading
4. Print Rich Environment
5. Positive Interactions between Adults and Students as well as
between the Students and Themselves
6. Balanced Literacy PLC Integration Status Check
7. MTSS/RtI Status Check
8. Benchmark Assessment System Results Status Check
17BROWARD COUNTY PUBLIC SCHOOLS SYSTEMS FOR ENSURING LITERACY DEVELOPMENT IN THE EARLY YEARS
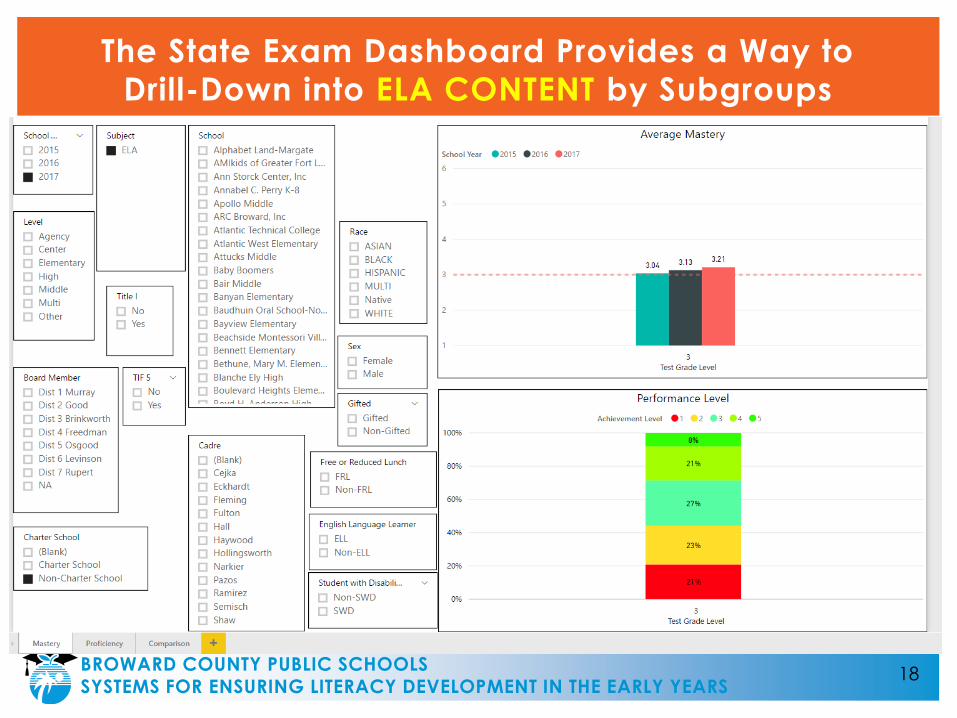
The State Exam Dashboard Provides a Way to
Drill-Down into ELA CONTENT by Subgroups
18BROWARD COUNTY PUBLIC SCHOOLS SYSTEMS FOR ENSURING LITERACY DEVELOPMENT IN THE EARLY YEARS
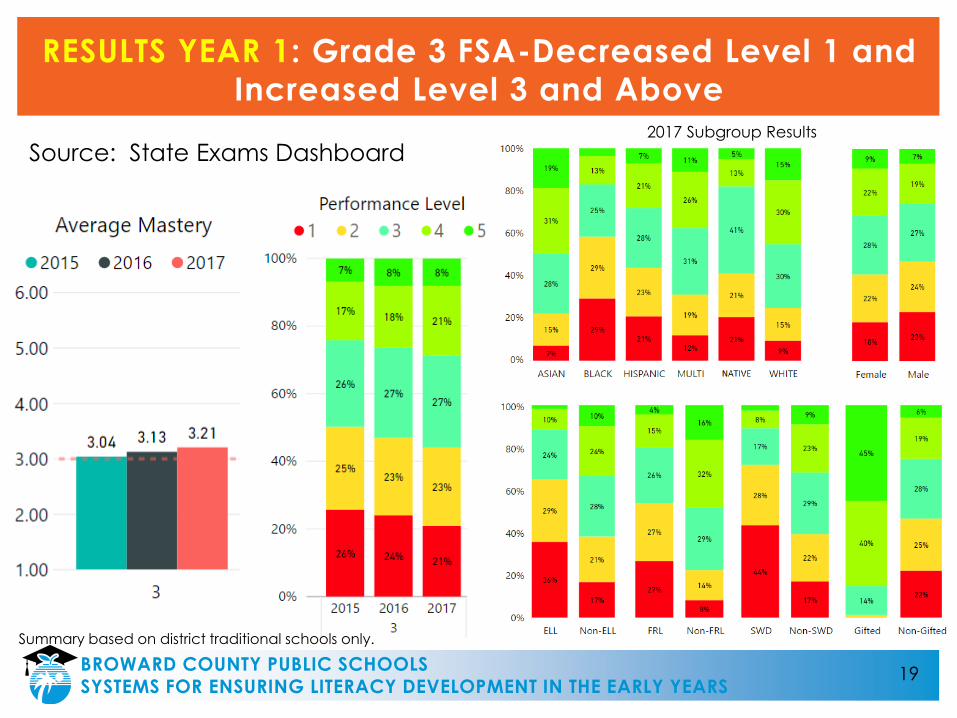
RESULTS YEAR 1: Grade 3 FSA-Decreased Level 1 and
Increased Level 3 and Above
Source: State Exams Dashboard2017 Subgroup Results
Summary based on district traditional schools only.
19BROWARD COUNTY PUBLIC SCHOOLS SYSTEMS FOR ENSURING LITERACY DEVELOPMENT IN THE EARLY YEARS
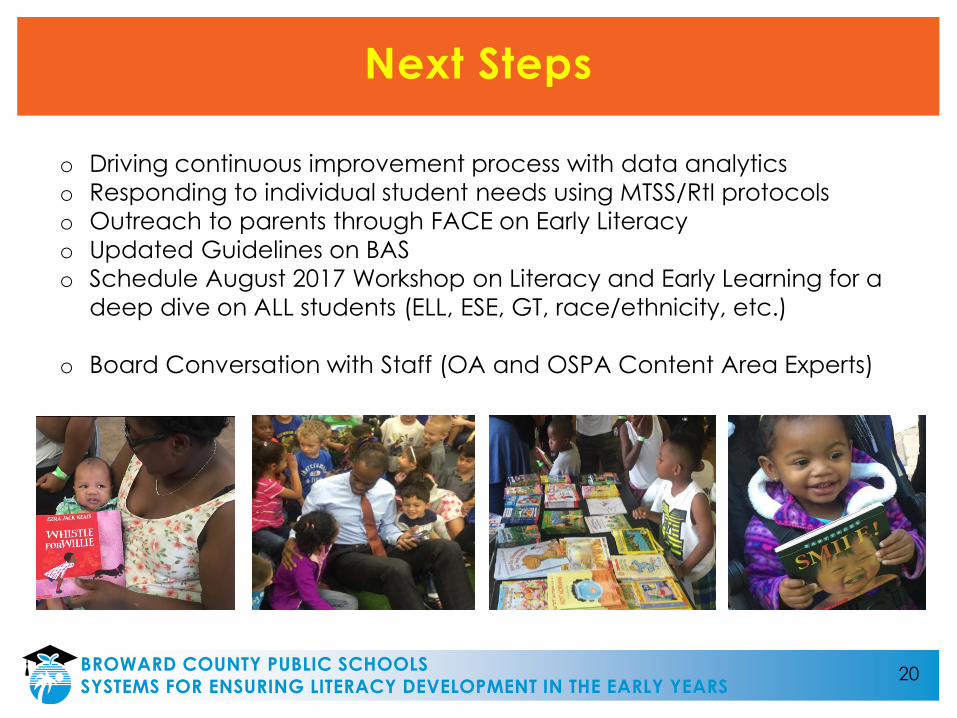
Next Steps
o Driving continuous improvement process with data analytics
o Responding to individual student needs using MTSS/RtI protocols
o Outreach to parents through FACE on Early Literacy
o Updated Guidelines on BAS
o Schedule August 2017 Workshop on Literacy and Early Learning for a
deep dive on ALL students (ELL, ESE, GT, race/ethnicity, etc.)
o Board Conversation with Staff (OA and OSPA Content Area Experts)
20BROWARD COUNTY PUBLIC SCHOOLS SYSTEMS FOR ENSURING LITERACY DEVELOPMENT IN THE EARLY YEARS
21BROWARD COUNTY PUBLIC SCHOOLS SYSTEMS FOR ENSURING LITERACY DEVELOPMENT IN THE EARLY YEARS
THE SCHOOL BOARD OF
BROWARD COUNTY, FLORIDAAbby M. Freedman, Chair
District 4
Nora Rupert, Vice ChairDistrict 7
Donna P. KornCountywide At-Large, Seat 8
Robin BartlemanCountywide At-Large, Seat 9
Ann MurrayDistrict 1
Patricia GoodDistrict 2
Heather P. BrinkworthDistrict 3
Dr. Rosalind OsgoodDistrict 5
Laurie Rich LevinsonDistrict 6
22BROWARD COUNTY PUBLIC SCHOOLS SYSTEMS FOR ENSURING LITERACY DEVELOPMENT IN THE EARLY YEARS
Appendix
Evidence
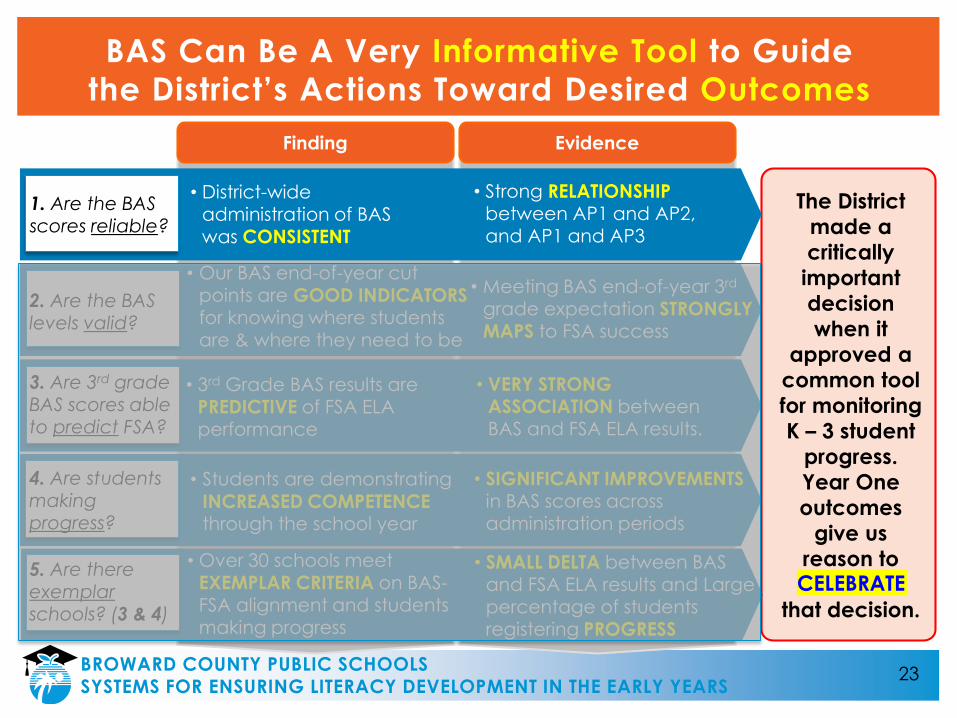
The District
made a
critically
important
decision
when it
approved a
common tool
for monitoring
K – 3 student
progress.
Year One
outcomes
give us
reason to
CELEBRATE
that decision.
Finding
• text
BAS Can Be A Very Informative Tool to Guide
the District’s Actions Toward Desired Outcomes
• District-wide administration of BAS was CONSISTENT
• Strong RELATIONSHIPbetween AP1 and AP2, and AP1 and AP3
• 3rd Grade BAS results are PREDICTIVE of FSA ELA
performance
• VERY STRONG ASSOCIATION between BAS and FSA ELA results.
• Our BAS end-of-year cut points are GOOD INDICATORSfor knowing where students are & where they need to be
• Meeting BAS end-of-year 3rd
grade expectation STRONGLY
MAPS to FSA success
• Students are demonstrating
INCREASED COMPETENCE through the school year
• SIGNIFICANT IMPROVEMENTSin BAS scores across administration periods
• Over 30 schools meet EXEMPLAR CRITERIA on BAS-FSA alignment and students making progress
• SMALL DELTA between BAS and FSA ELA results and Large percentage of students registering PROGRESS
1. Are the BAS scores reliable?
3. Are 3rd grade BAS scores able to predict FSA?
2. Are the BAS levels valid?
4. Are students making progress?
5. Are there exemplarschools? (3 & 4)
CELEBRATE
23BROWARD COUNTY PUBLIC SCHOOLS SYSTEMS FOR ENSURING LITERACY DEVELOPMENT IN THE EARLY YEARS
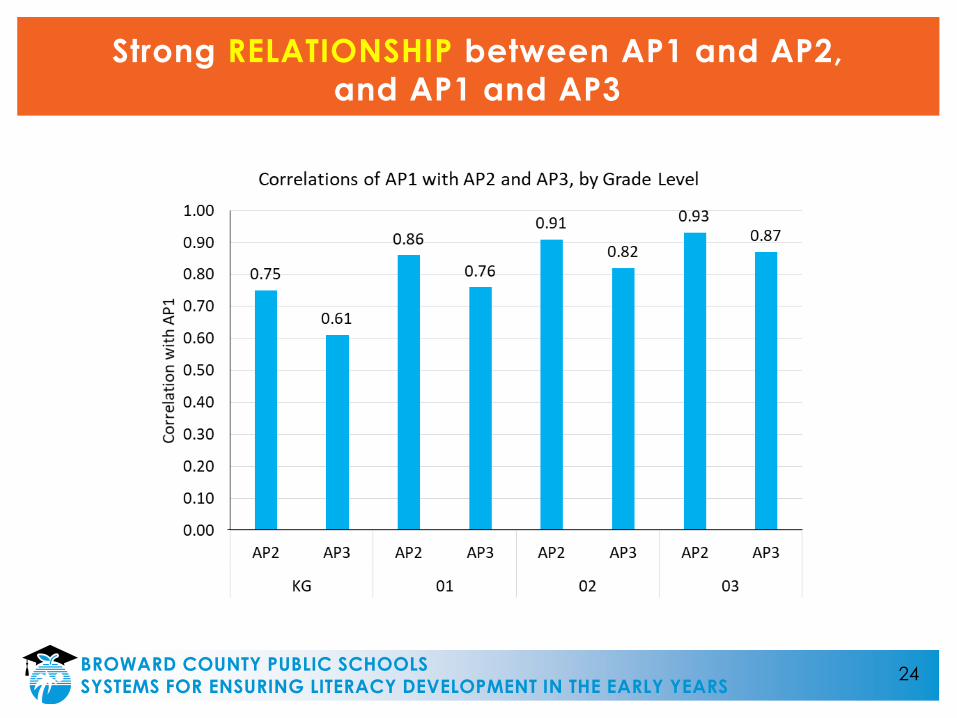
Strong RELATIONSHIP between AP1 and AP2,
and AP1 and AP3
24BROWARD COUNTY PUBLIC SCHOOLS SYSTEMS FOR ENSURING LITERACY DEVELOPMENT IN THE EARLY YEARS
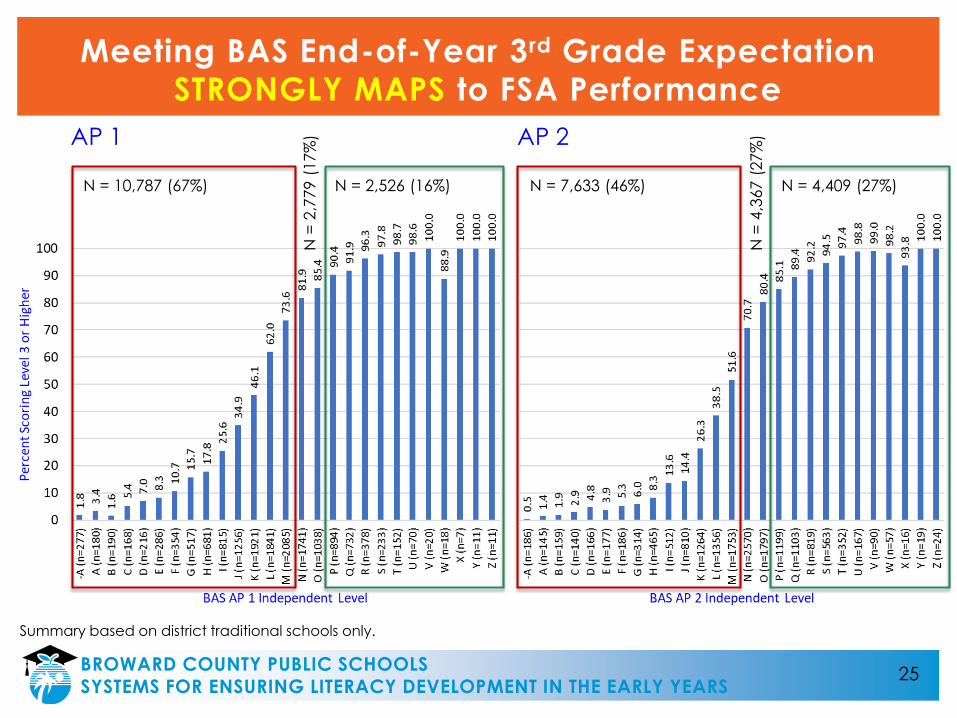
Meeting BAS End-of-Year 3rd Grade Expectation
STRONGLY MAPS to FSA Performance
Summary based on district traditional schools only.
N = 10,787 (67%) N = 2,526 (16%)
N =
2,7
79 (
17%
)
N = 7,633 (46%) N = 4,409 (27%)
N =
4,3
67 (
27%
)AP 1 AP 2
25BROWARD COUNTY PUBLIC SCHOOLS SYSTEMS FOR ENSURING LITERACY DEVELOPMENT IN THE EARLY YEARS
Evidence
The District
made a
critically
important
decision
when it
approved a
common tool
for monitoring
K – 3 student
progress.
Year One
outcomes
give us
reason to
CELEBRATE
that decision.
Finding
• text
BAS Can Be A Very Informative Tool to Guide
the District’s Actions Toward Desired Outcomes
• District-wide administration of BAS was CONSISTENT
• Strong RELATIONSHIPbetween AP1 and AP2, and AP1 and AP3
• 3rd Grade BAS results are PREDICTIVE of FSA ELA
performance
• VERY STRONG ASSOCIATION between BAS and FSA ELA results.
• Our BAS end-of-year cut points are GOOD INDICATORSfor knowing where students are & where they need to be
• Meeting BAS end-of-year 3rd
grade expectation STRONGLY
MAPS to FSA success
• Students are demonstrating
INCREASED COMPETENCE through the school year
• SIGNIFICANT IMPROVEMENTSin BAS scores across administration periods
• Over 30 schools meet EXEMPLAR CRITERIA on BAS-FSA alignment and students making progress
• SMALL DELTA between BAS and FSA ELA results and Large percentage of students registering PROGRESS
1. Are the BAS scores reliable?
3. Are 3rd grade BAS scores able to predict FSA?
2. Are the BAS levels valid?
4. Are students making progress?
5. Are there exemplarschools? (3 & 4)
CELEBRATE
26BROWARD COUNTY PUBLIC SCHOOLS SYSTEMS FOR ENSURING LITERACY DEVELOPMENT IN THE EARLY YEARS
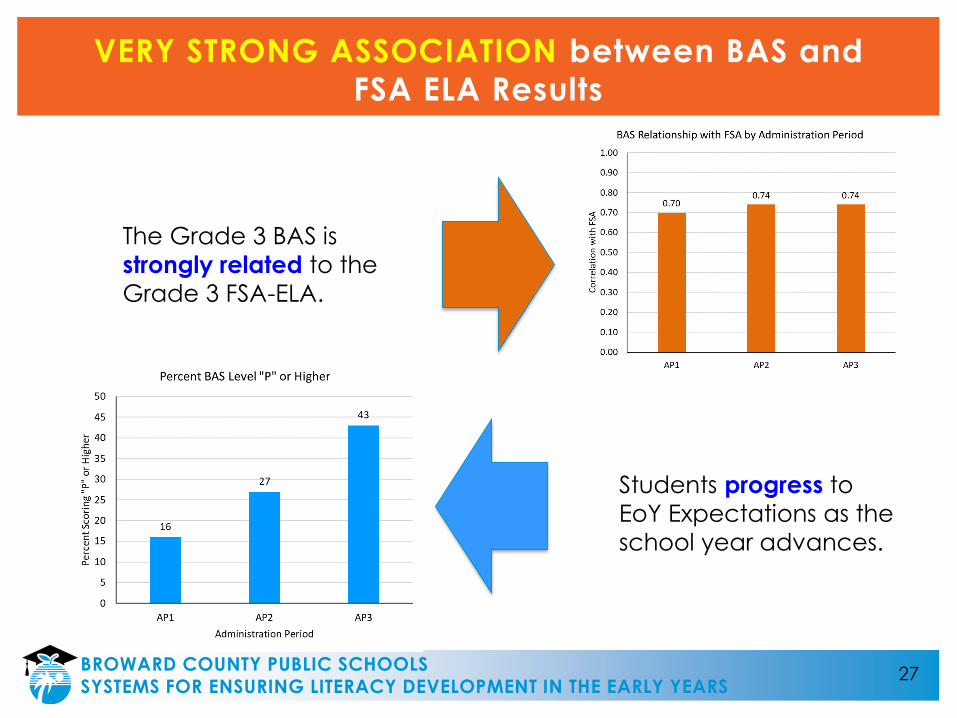
VERY STRONG ASSOCIATION between BAS and
FSA ELA Results
The Grade 3 BAS is
strongly related to the
Grade 3 FSA-ELA.
Students progress to
EoY Expectations as the
school year advances.
27BROWARD COUNTY PUBLIC SCHOOLS SYSTEMS FOR ENSURING LITERACY DEVELOPMENT IN THE EARLY YEARS
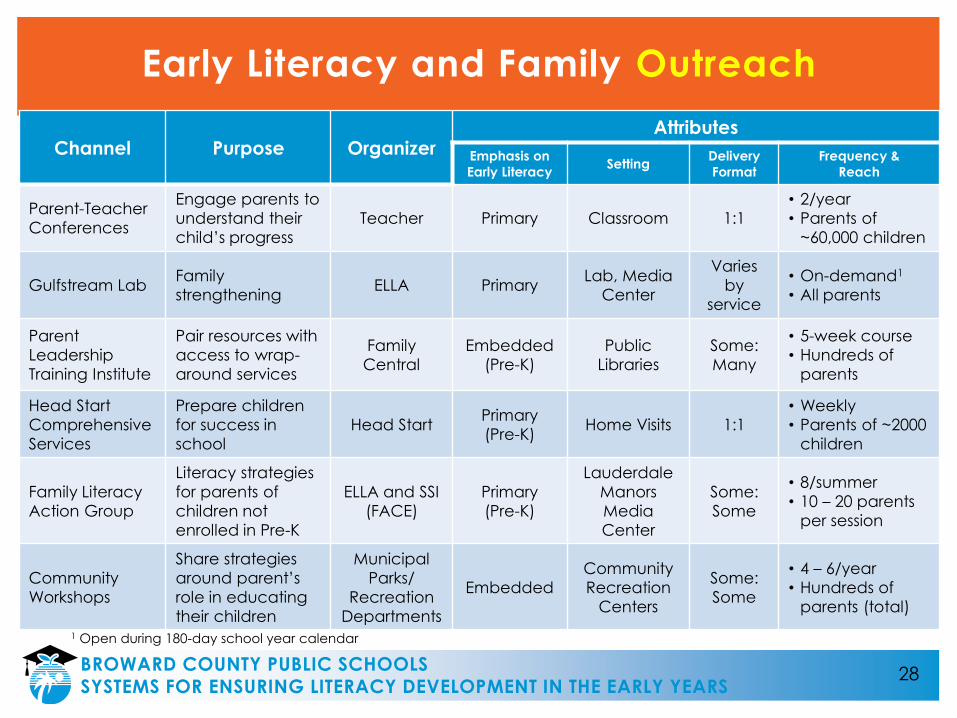
Early Literacy and Family Outreach
Channel Purpose OrganizerAttributes
Emphasis on
Early LiteracySetting
Delivery
Format
Frequency &
Reach
Parent-Teacher
Conferences
Engage parents to
understand their
child’s progress
Teacher Primary Classroom 1:1
• 2/year
• Parents of
~60,000 children
Gulfstream LabFamily
strengtheningELLA Primary
Lab, Media
Center
Varies
by
service
• On-demand1
• All parents
Parent
Leadership
Training Institute
Pair resources with
access to wrap-
around services
Family
Central
Embedded
(Pre-K)
Public
Libraries
Some:
Many
• 5-week course
• Hundreds of
parents
Head Start
Comprehensive
Services
Prepare children
for success in
school
Head StartPrimary
(Pre-K)Home Visits 1:1
• Weekly
• Parents of ~2000
children
Family Literacy
Action Group
Literacy strategies
for parents of
children not
enrolled in Pre-K
ELLA and SSI
(FACE)
Primary
(Pre-K)
Lauderdale
Manors
Media
Center
Some:
Some
• 8/summer
• 10 – 20 parents
per session
Community
Workshops
Share strategies
around parent’s
role in educating
their children
Municipal
Parks/
Recreation
Departments
Embedded
Community
Recreation
Centers
Some:
Some
• 4 – 6/year
• Hundreds of
parents (total)
1 Open during 180-day school year calendar
28BROWARD COUNTY PUBLIC SCHOOLS SYSTEMS FOR ENSURING LITERACY DEVELOPMENT IN THE EARLY YEARS
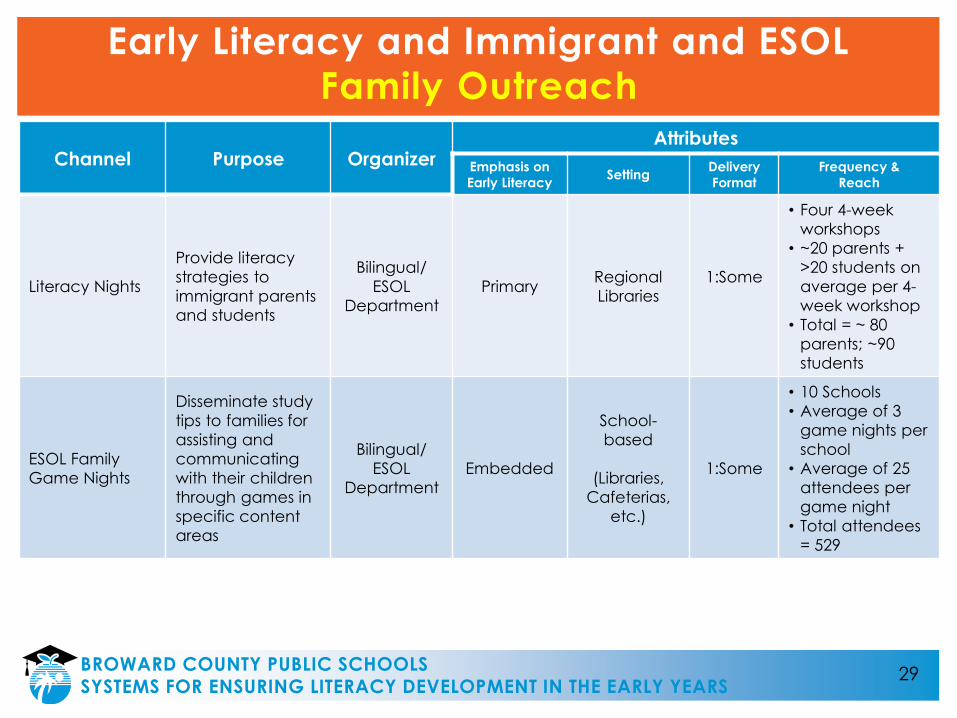
Early Literacy and Immigrant and ESOL
Family Outreach
Channel Purpose OrganizerAttributes
Emphasis on
Early LiteracySetting
Delivery
Format
Frequency &
Reach
Literacy Nights
Provide literacy
strategies to
immigrant parents
and students
Bilingual/
ESOL
Department
PrimaryRegional
Libraries
1:Some
• Four 4-week
workshops
• ~20 parents +
>20 students on
average per 4-
week workshop
• Total = ~ 80
parents; ~90
students
ESOL Family
Game Nights
Disseminate study
tips to families for
assisting and
communicating
with their children
through games in
specific content
areas
Bilingual/
ESOL
Department
Embedded
School-
based
(Libraries,
Cafeterias,
etc.)
1:Some
• 10 Schools
• Average of 3
game nights per
school
• Average of 25
attendees per
game night
• Total attendees
= 529
29BROWARD COUNTY PUBLIC SCHOOLS SYSTEMS FOR ENSURING LITERACY DEVELOPMENT IN THE EARLY YEARS
30
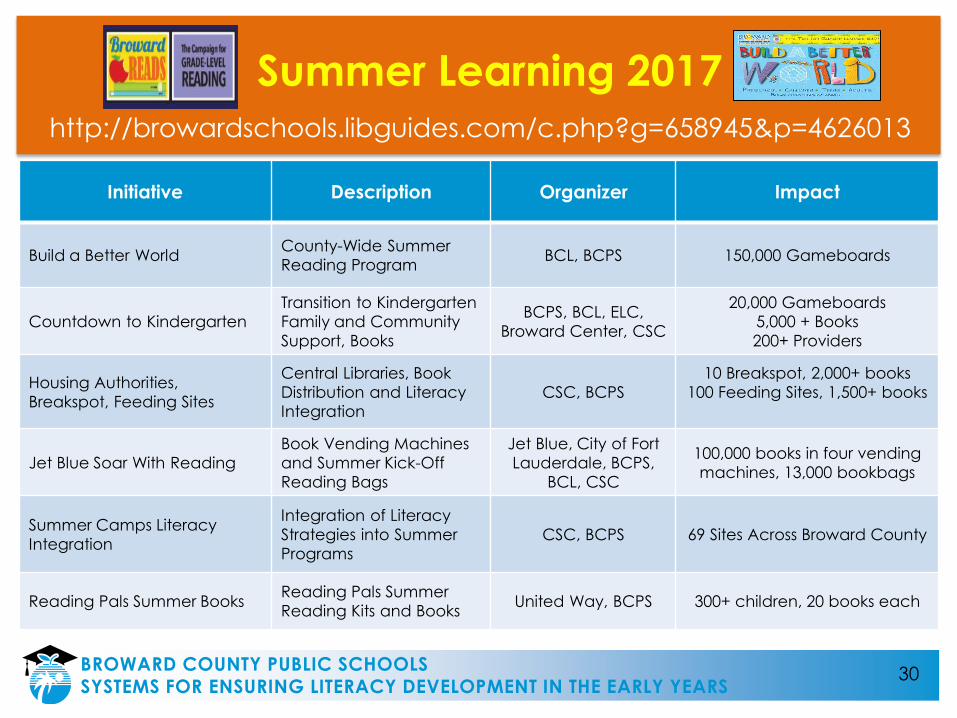
Summer Learning 2017
Initiative Description Organizer Impact
Build a Better WorldCounty-Wide Summer
Reading Program BCL, BCPS 150,000 Gameboards
Countdown to Kindergarten
Transition to Kindergarten
Family and Community
Support, Books
BCPS, BCL, ELC,
Broward Center, CSC
20,000 Gameboards
5,000 + Books
200+ Providers
Housing Authorities,
Breakspot, Feeding Sites
Central Libraries, Book
Distribution and Literacy
Integration
CSC, BCPS
10 Breakspot, 2,000+ books
100 Feeding Sites, 1,500+ books
Jet Blue Soar With Reading
Book Vending Machines
and Summer Kick-Off
Reading Bags
Jet Blue, City of Fort
Lauderdale, BCPS,
BCL, CSC
100,000 books in four vending
machines, 13,000 bookbags
Summer Camps Literacy
Integration
Integration of Literacy
Strategies into Summer
Programs
CSC, BCPS 69 Sites Across Broward County
Reading Pals Summer BooksReading Pals Summer
Reading Kits and BooksUnited Way, BCPS 300+ children, 20 books each
Summer Learning 2017
http://browardschools.libguides.com/c.php?g=658945&p=4626013
BROWARD COUNTY PUBLIC SCHOOLS SYSTEMS FOR ENSURING LITERACY DEVELOPMENT IN THE EARLY YEARS
31
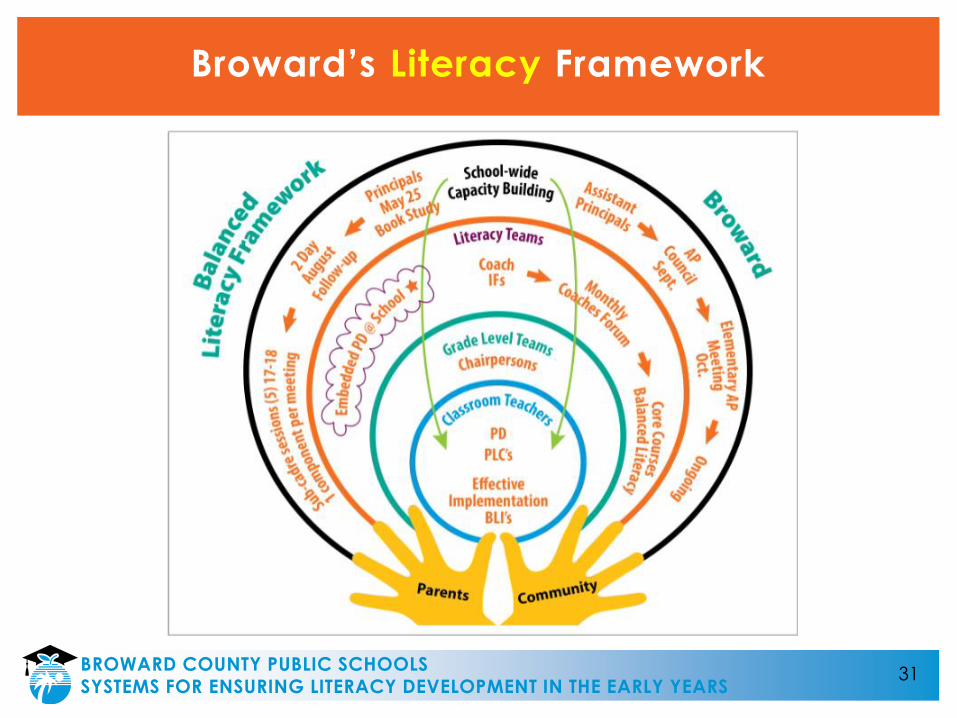
Broward’s Literacy Framework
BROWARD COUNTY PUBLIC SCHOOLS SYSTEMS FOR ENSURING LITERACY DEVELOPMENT IN THE EARLY YEARS
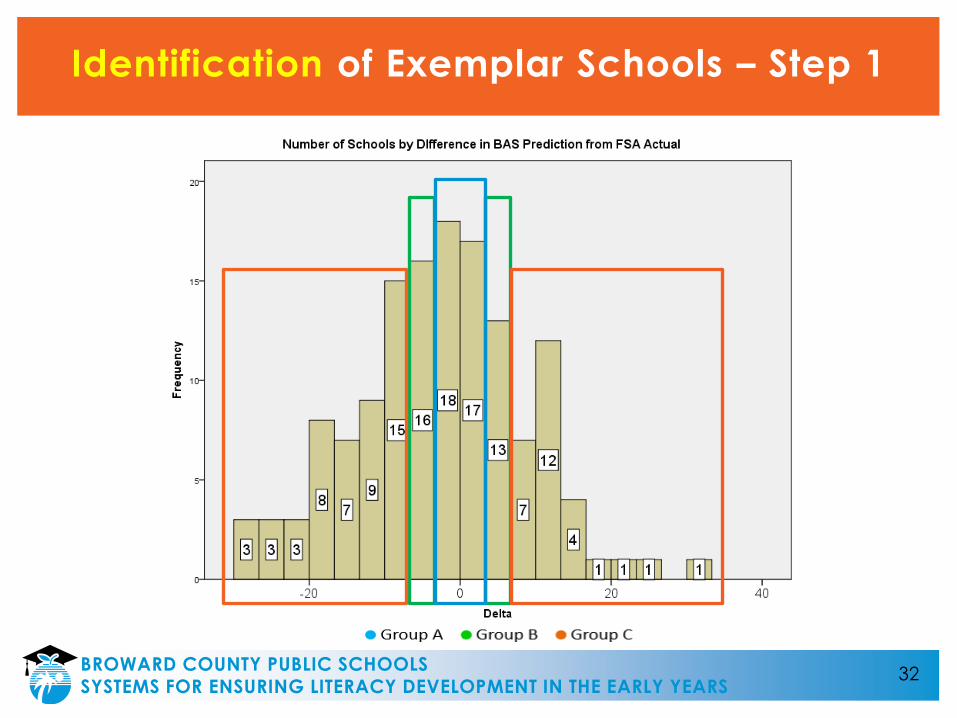
Identification of Exemplar Schools – Step 1
32BROWARD COUNTY PUBLIC SCHOOLS SYSTEMS FOR ENSURING LITERACY DEVELOPMENT IN THE EARLY YEARS
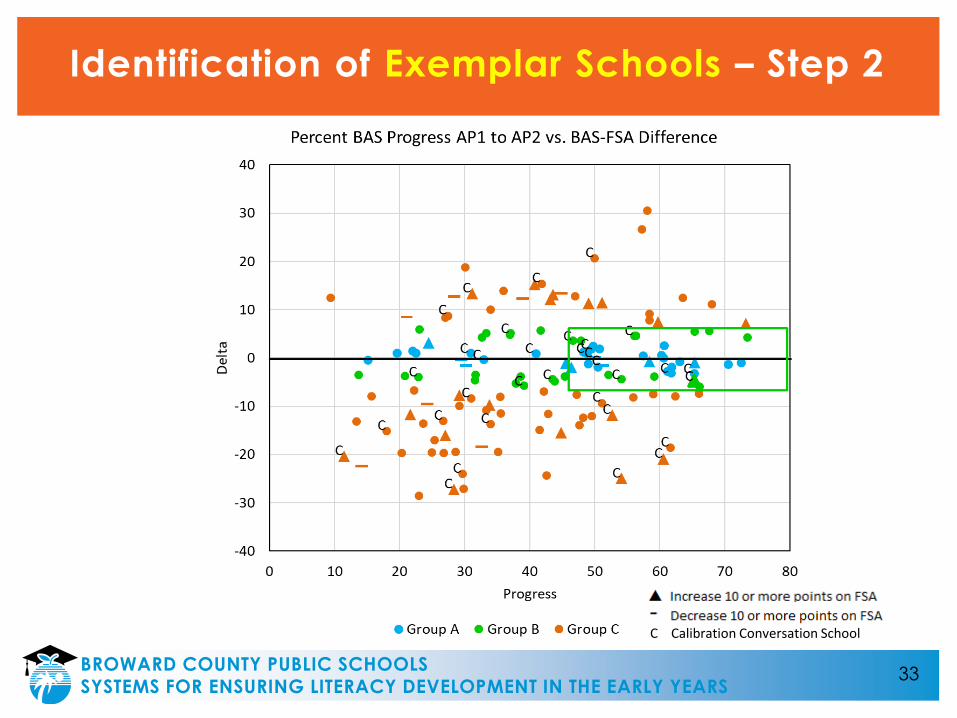
Identification of Exemplar Schools – Step 2
33BROWARD COUNTY PUBLIC SCHOOLS SYSTEMS FOR ENSURING LITERACY DEVELOPMENT IN THE EARLY YEARS
C Calibration Conversation School
34BROWARD COUNTY PUBLIC SCHOOLS SYSTEMS FOR ENSURING LITERACY DEVELOPMENT IN THE EARLY YEARS
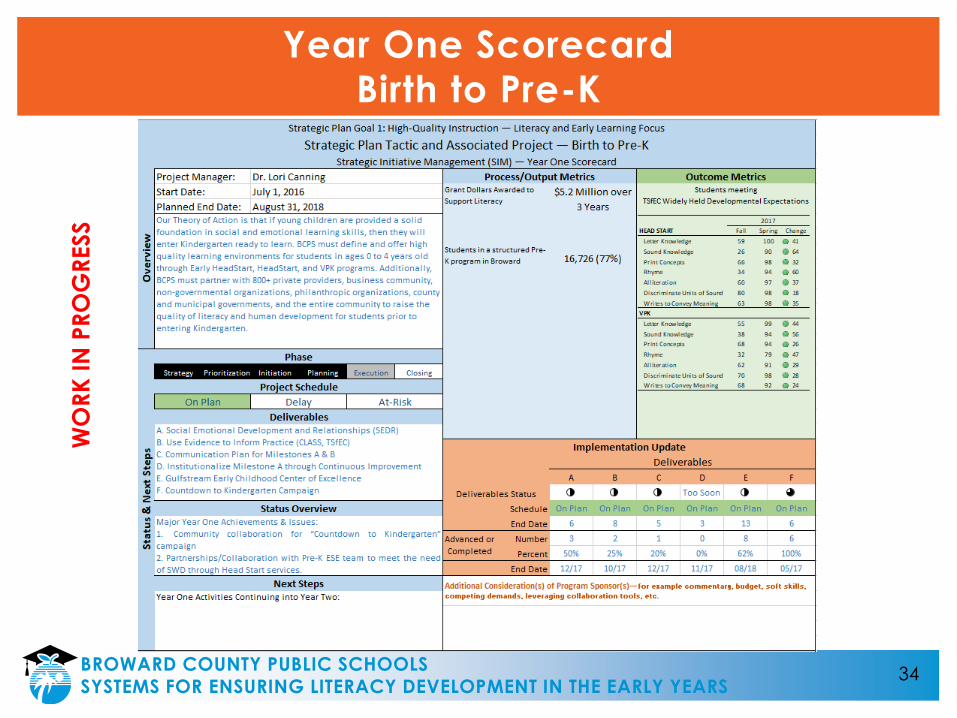
Year One Scorecard
Birth to Pre-KW
OR
K I
N P
RO
GR
ESS
35BROWARD COUNTY PUBLIC SCHOOLS SYSTEMS FOR ENSURING LITERACY DEVELOPMENT IN THE EARLY YEARS
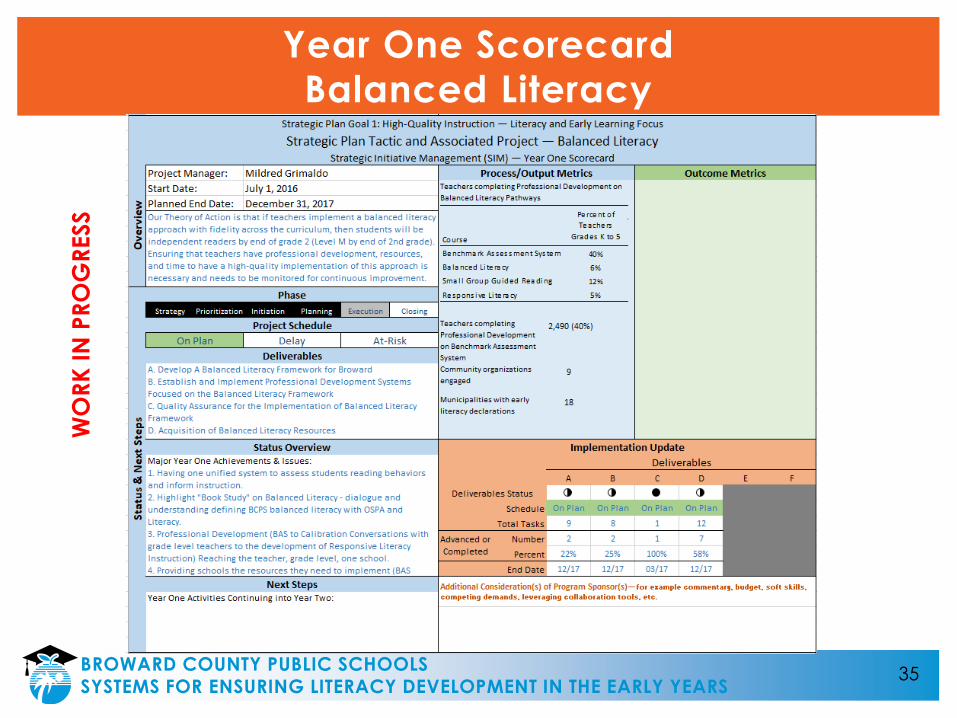
Year One Scorecard
Balanced LiteracyW
OR
K I
N P
RO
GR
ESS
36BROWARD COUNTY PUBLIC SCHOOLS SYSTEMS FOR ENSURING LITERACY DEVELOPMENT IN THE EARLY YEARS
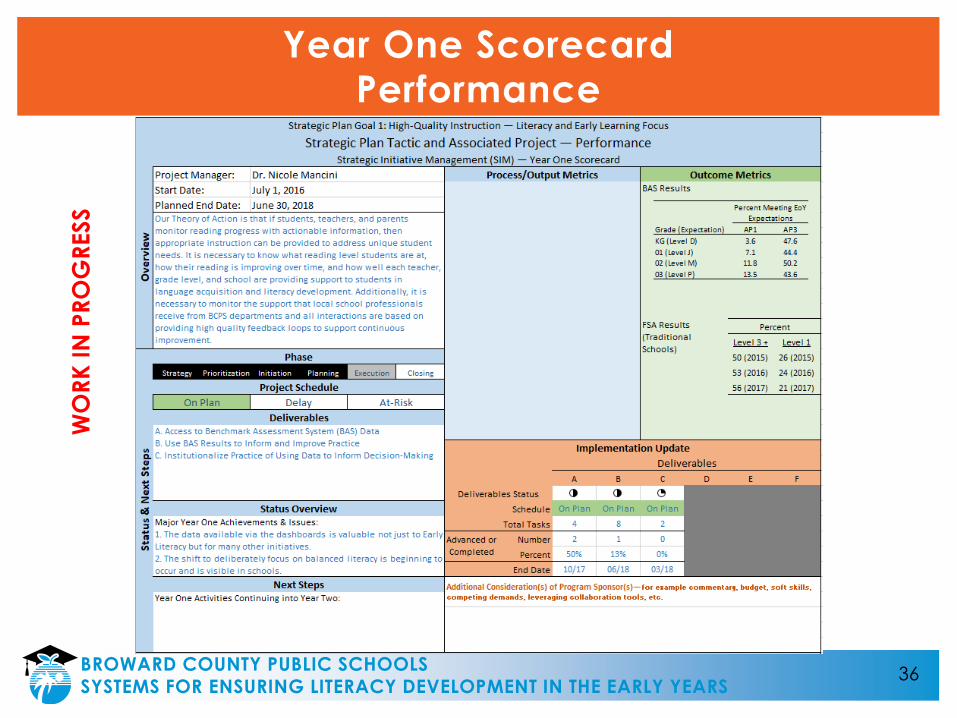
Year One Scorecard
PerformanceW
OR
K I
N P
RO
GR
ESS
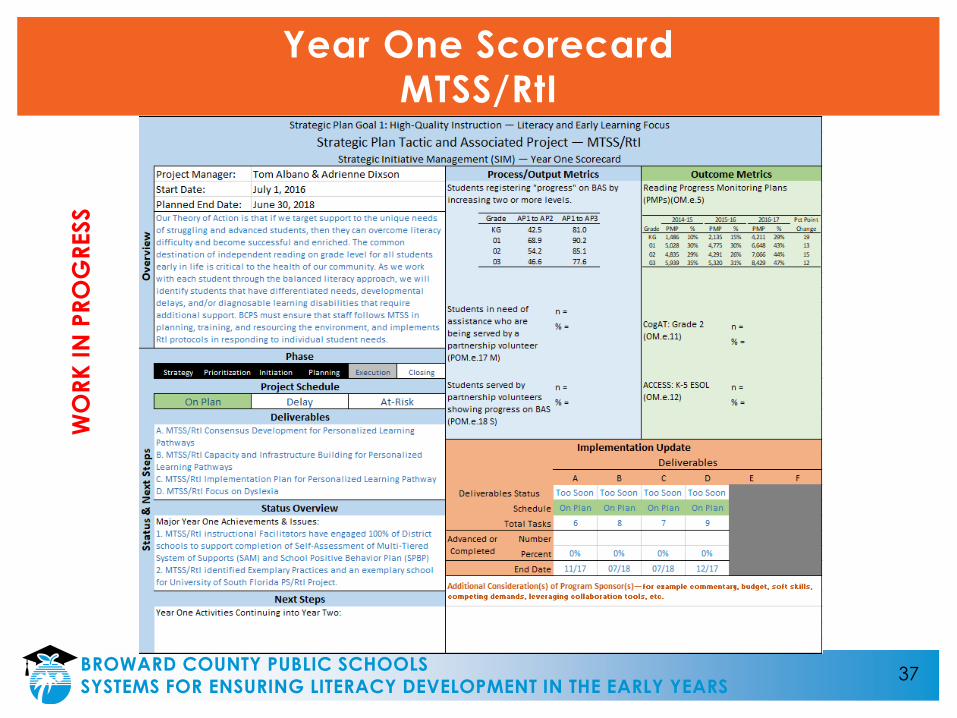
37BROWARD COUNTY PUBLIC SCHOOLS SYSTEMS FOR ENSURING LITERACY DEVELOPMENT IN THE EARLY YEARS
Year One Scorecard
MTSS/RtIW
OR
K I
N P
RO
GR
ESS
38BROWARD COUNTY PUBLIC SCHOOLS SYSTEMS FOR ENSURING LITERACY DEVELOPMENT IN THE EARLY YEARS
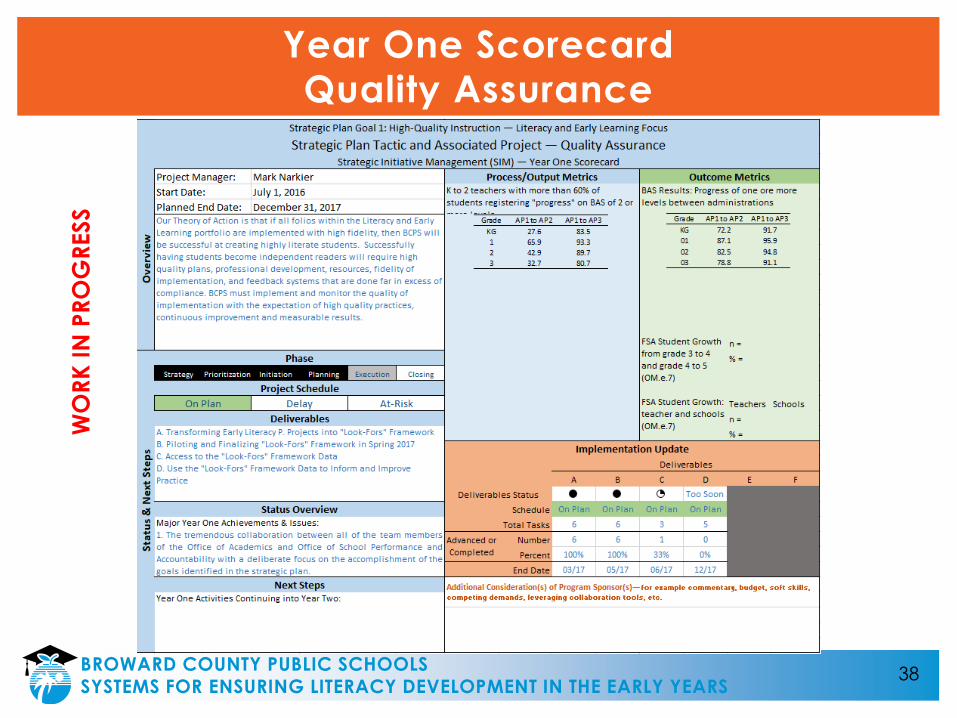
Year One Scorecard
Quality AssuranceW
OR
K I
N P
RO
GR
ESS
39BROWARD COUNTY PUBLIC SCHOOLS SYSTEMS FOR ENSURING LITERACY DEVELOPMENT IN THE EARLY YEARS
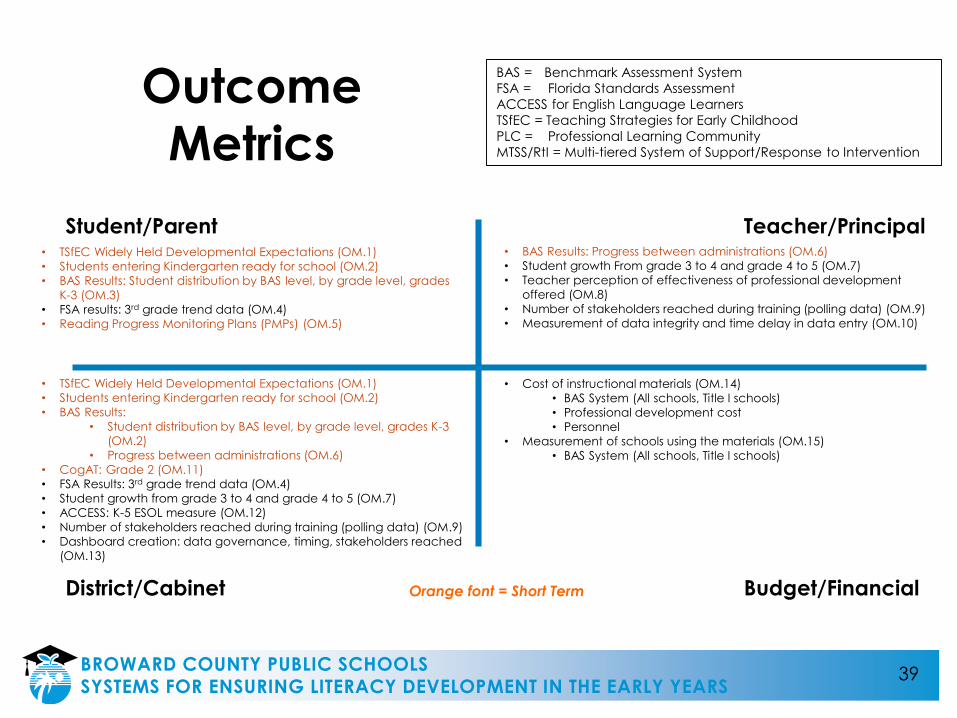
Outcome
Metrics
Student/Parent
District/Cabinet
Teacher/Principal
Budget/FinancialOrange font = Short Term
• TSfEC Widely Held Developmental Expectations (OM.1)
• Students entering Kindergarten ready for school (OM.2)
• BAS Results:
• Student distribution by BAS level, by grade level, grades K-3
(OM.2)
• Progress between administrations (OM.6)
• CogAT: Grade 2 (OM.11)
• FSA Results: 3rd grade trend data (OM.4)
• Student growth from grade 3 to 4 and grade 4 to 5 (OM.7)
• ACCESS: K-5 ESOL measure (OM.12)
• Number of stakeholders reached during training (polling data) (OM.9)
• Dashboard creation: data governance, timing, stakeholders reached
(OM.13)
• TSfEC Widely Held Developmental Expectations (OM.1)
• Students entering Kindergarten ready for school (OM.2)
• BAS Results: Student distribution by BAS level, by grade level, grades
K-3 (OM.3)
• FSA results: 3rd grade trend data (OM.4)
• Reading Progress Monitoring Plans (PMPs) (OM.5)
• BAS Results: Progress between administrations (OM.6)
• Student growth From grade 3 to 4 and grade 4 to 5 (OM.7)
• Teacher perception of effectiveness of professional development
offered (OM.8)
• Number of stakeholders reached during training (polling data) (OM.9)
• Measurement of data integrity and time delay in data entry (OM.10)
• Cost of instructional materials (OM.14)
• BAS System (All schools, Title I schools)
• Professional development cost
• Personnel
• Measurement of schools using the materials (OM.15)
• BAS System (All schools, Title I schools)
BAS = Benchmark Assessment System
FSA = Florida Standards Assessment
ACCESS for English Language Learners
TSfEC = Teaching Strategies for Early Childhood
PLC = Professional Learning Community
MTSS/RtI = Multi-tiered System of Support/Response to Intervention
40BROWARD COUNTY PUBLIC SCHOOLS SYSTEMS FOR ENSURING LITERACY DEVELOPMENT IN THE EARLY YEARS
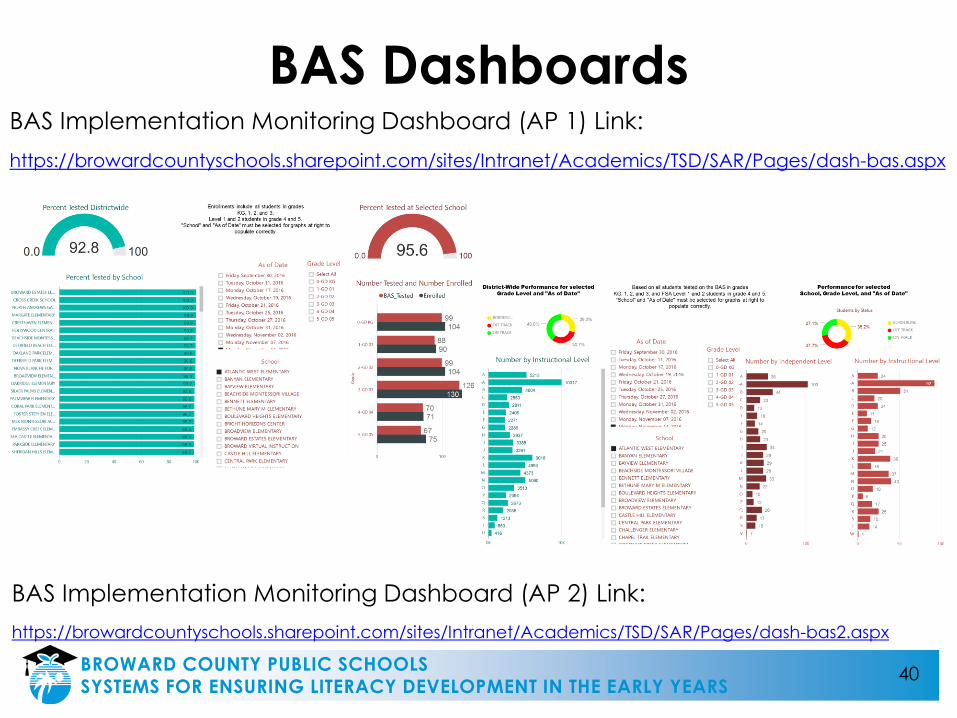
BAS DashboardsBAS Implementation Monitoring Dashboard (AP 1) Link:
https://browardcountyschools.sharepoint.com/sites/Intranet/Academics/TSD/SAR/Pages/dash-bas.aspx
BAS Implementation Monitoring Dashboard (AP 2) Link:
https://browardcountyschools.sharepoint.com/sites/Intranet/Academics/TSD/SAR/Pages/dash-bas2.aspx
41BROWARD COUNTY PUBLIC SCHOOLS SYSTEMS FOR ENSURING LITERACY DEVELOPMENT IN THE EARLY YEARS
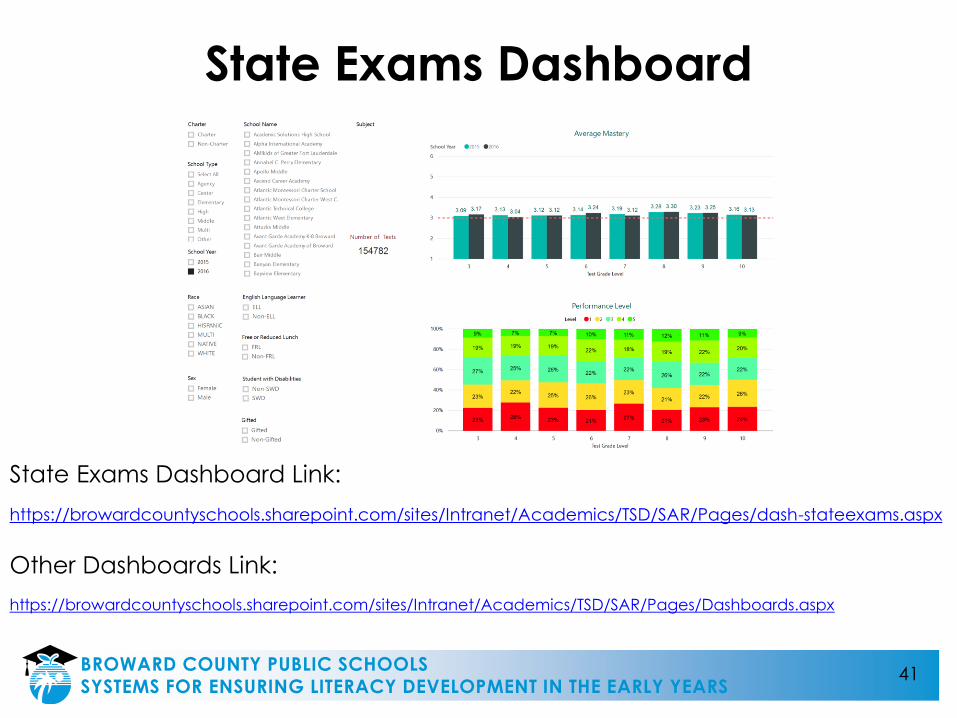
State Exams Dashboard
State Exams Dashboard Link:
https://browardcountyschools.sharepoint.com/sites/Intranet/Academics/TSD/SAR/Pages/dash-stateexams.aspx
Other Dashboards Link:
https://browardcountyschools.sharepoint.com/sites/Intranet/Academics/TSD/SAR/Pages/Dashboards.aspx
Abby M. Freedman, Chair
Nora Rupert, Vice Chair
Robin Bartleman
Heather P. Brinkworth
Patricia Good
Donna P. Korn
Laurie Rich Levinson
Ann Murray
Dr. Rosalind Osgood
Robert W. Runcie, Superintendent of Schools
The School Board of Broward County, Florida, prohibits any policy or procedure which results in discrimination on the
basis of age, color, disability, gender identity, gender expression, national origin, marital status, race, religion, sex or
sexual orientation. Individuals who wish to file a discrimination and/or harassment complaint may call the Director, Equal
Educational Opportunities/ADA Compliance Department at 754-321-2150 or Teletype Machine TTY 754-321-2158.
Individuals with disabilities requesting accommodations under the Americans with Disabilities Act Amendments Act of
2008, (ADAAA) may call Equal Educational Opportunities/ADA Compliance Department at 754-321-2150 or Teletype
Machine (TYY) 754-321-2158.
42
THE SCHOOL BOARD OF
BROWARD COUNTY, FLORIDA
BROWARD COUNTY PUBLIC SCHOOLS SYSTEMS FOR ENSURING LITERACY DEVELOPMENT IN THE EARLY YEARS