bcg matrix of nestle
DESCRIPTION
bcg matrixTRANSCRIPT

BCG MATRIX OF NESTLE MCOM-ISEM-1
CHAPTER NO: 1
INTRODUCTION
NM COLLEGE OF COMMERCE AND ECONOMICS 1

BCG MATRIX OF NESTLE MCOM-ISEM-1
1.1 BACKGROUND
In a well diversified business, there are mainly units with different profitability.
Similarly, in a business there may be many products in different segment, and a business has to
do a “portfolio analysis” of various units it is handling and wide product range.
BCG growth share matrix developed by Boston consulting group of USA and popularly
known as BCG matrix takes a two dimensional view: market growth rate and relative market
share. Each dimension is divided in to two degrees: high and low.
HISTORY
In the 1970s, BCG’s experience-curve work led to an insight that had a significant impact
on business thinking. If rapid growth in market share was as important as the curve suggested,
then the usual approach to resource allocation- in which each business unit funded its own
growth- seemed a recipe for failure.
Businesses with low market share but high growth potential would never generate enough
cash to win the race down the experience curve. Those with high market share but few chances
for growth would generate far more cash than they could use productively.
BCG developed a simple conceptual framework, named the growth share matrix, to help
corporate managers determine when they should consider using profits from “cash cow”
businesses to fund growth in other businesses.
So great was the initial success of BCG matrix that for the greater part of two decades it
became the standard approach to capital allocation in multi-sector, multi-segment companies.
“Star, Dogs, Cash Cows and Question Marks” have become firmly embedded in the language of
business.
Although the more sophisticated capital markets and competitive landscape of the late
1980s and 1990s make the growth share matrix less central, it continues to be used as a primer in
the principles of portfolio management.
NM COLLEGE OF COMMERCE AND ECONOMICS 2

BCG MATRIX OF NESTLE MCOM-ISEM-1
The growth share matrix, BCG matrix (Boston consulting group analysis) is a chart that
had been created by Bruce Henderson for the Boston consulting group in 1970 to help
corporation with analyzing their business units or product lines. This help the company allocate
resources and is used as an analytical tool in brand marketing, product management, strategic
management and portfolio analysis.
NM COLLEGE OF COMMERCE AND ECONOMICS 3
BCG MATRIX OF NESTLE MCOM-ISEM-1
1.2 DATA COLLECTION
Sample of study:-
The sample for this study consisted of 15 respondents. The selected respondents in the age group
of 15-55 years belonged to varied employment, gender and income groups. Convenient sampling
technique was applied in selecting respondents as sample.
Data source:-
The study is based on primary and secondary data.
1) Primary data:-
A self-designed questionnaire consists of first and second part, which deals with the respondent’s
perception, was used for the purpose of primary data collection.
2) Secondary data:-
Secondary data have been collected from the different books and websites.
3) Data analysis:-
The data collected from various sources have been analyzed by using the techniques of
simple percentages, averages etc.
NM COLLEGE OF COMMERCE AND ECONOMICS 4

BCG MATRIX OF NESTLE MCOM-ISEM-1
CHAPTER NO: 2
CONCEPTUAL FRAMEWORK
NM COLLEGE OF COMMERCE AND ECONOMICS 5

BCG MATRIX OF NESTLE MCOM-ISEM-1
2.1 NESTLE INDIA AND BCG MATRIX
•With headquarters at Vevey, Switzerland and established in 1866, Nestle has growth today to be
the world’s biggest food and beverages company.
•Established in the strong foundation of growth through innovation and renovation, the company
is known today by its several strong brands which are dominating the markets the world over.
•Nestle India is a subsidiary of Nestle S.A. of Switzerland. With six factories and a large number
of co-packers.
• Nestle India is a vibrant company offering a number of products in the Indian market. In the
first nine months of 2010, it achieved strong growth of around 21%
•A number of brands are offered by the company in the country of which while some have
already established a strong hold, many others exhibit enormous prospects to dominate the
market and are only waiting for a favourable opportunity or appropriate and sizeable promotional
campaign by the company
With headquarters at Vevey, Switzerland and established in 1866, Nestle has growth
today to be the world’s biggest food and beverages company.
Established in the strong foundation of growth through innovation and renovation, the
company is known today by its several strong brands which are dominating the markets
the world over.
Nestle India is a subsidiary of Nestle S.A. of Switzerland. With six factories and a large
number of co-packers.
NM COLLEGE OF COMMERCE AND ECONOMICS 6
BCG MATRIX OF NESTLE MCOM-ISEM-1
Nestle India is a vibrant company offering a number of products in the Indian market. In
the first nine months of 2010, it achieved strong growth of around 21% .
A number of brands are offered by the company in the country of which while some have
already established a strong hold, many others exhibit enormous prospects to dominate
the market and are only waiting for a favorable opportunity or appropriate and sizeable
promotional campaign by the company
NESTLE INDIA LIMITED
Riding on the growth of its power brands, Nestle has extended its dominance in food
business in India as well.
However, a number of its brands require a repositioning.
The present exercise is an attempt to analyze the position of the different brand offered
by Nestle India.
BCG matrix of Nestle and all the different brands offered by Nestle in India have been
analyzed along with a critical insight and also specific suggestion have been made
therein.
NM COLLEGE OF COMMERCE AND ECONOMICS 7

BCG MATRIX OF NESTLE MCOM-ISEM-1
2.2 NESTLE BRANDS
2.3 BCG MATRIX
The beauty of BCG Matrix, a Matrix developed by a group known as Boston Consulting
Group, USA, is that it seeks to place the different products of an organization in different
grids such as to analyze them in a comparative manner in terms of profitability or in
terms of
(a) Percentage growth in sales and
(b) Market share position, to be exact. Thus
It gives an opportunity of self assessment to the organization to reassess its product
positioning and come out with alternative solution if the original placement of the
products in the market does not meet the desired level of growth.
NM COLLEGE OF COMMERCE AND ECONOMICS 8
BCG MATRIX OF NESTLE MCOM-ISEM-1
These classes have a different meaning attached to them and can be represented on the
matrix .
BCG MATRIX EXPLAINED:
Thus, when all the products of the company are put in four cells (thus it actually provides an
opportunity to reassess the entire position of the company in terms of all the products it offers to
the market), the market standing of the company can be analyzed in four different classes
namely, stars, cash cows, dogs and question marks.3 Each of these classes have a different
meaning attached to them and can be represented on the matrix .
NM COLLEGE OF COMMERCE AND ECONOMICS 9

BCG MATRIX OF NESTLE MCOM-ISEM-1
STARS:-
Businesses which have high growth rate and high market share are called stars. Such
businesses generate as well as use large amount of cash. The stars generate high profits
and represent the best investment opportunities for growth. This cell corresponds closely
to the growth phase of the product life cycle (PLC).The stars are market leaders and are
usually able to generate cash to maintain their high market share. When their market
growth rate slows, the stars become cash cows.
The main features of stars are:
High industry growth rate
High market share
The strategy for stars may be growth strategy. The firm may undertake various activities such
as:
NM COLLEGE OF COMMERCE AND ECONOMICS 10

BCG MATRIX OF NESTLE MCOM-ISEM-1
R & D to introduce better
Effective after-sale-service to enhance customer loyalty
Appropriate promotion-mix (publicity, advertising, sales promotion)
EXAMPLE OF STAR PRODUCTS OF NESTLE: -
NESCAFE
CASH COWS:-
The business with low growth rate and high market share are classified in the quadrant.
High market share leads to high generation of cash and profits. The low rate of growth of
the business implies that the cash demand for the business be low. Thus cash cow normal
generates cash surplus. Cows can be milked for cash to help to provide cash required for
running other diverse operations of the company. Cash cows provide financial bases for
the company. These businesses which generate large amount of cash but their rate of
growth is slow. In terms of PLC, these are generally mature businesses which are reaping
the benefits of the experience curve. Cash cows are often former stars and can be
valuable in a portfolio because they can be ‘milked’ to provide cash for other riskier and
struggling business.
The main features of cash cows are:
Low industry growth
High market share
The company may adopt stability strategy, various activities may be undertaken such as:
Retentive advertising to maintain customer loyalty.
Guarantees and warranties depending upon the nature of product
Introduction of new models or designs including, smaller packages to generate more
sales.
EXAMPLE OF CASH COW PRODUCTS OF NESTLE: -
caralac
NM COLLEGE OF COMMERCE AND ECONOMICS 11

BCG MATRIX OF NESTLE MCOM-ISEM-1
QUESTION MARK:-
Question marks are businesses with low market share but businesses have high growth
rate. Because of their high growth, the cash requirement is high, but due to their low
market share, the cash generated is low. As the business growth rate is high, the strategic
option would be to invest more to gain market share, pushing from low share to high.
Hence the business can move to star quadrant, and subsequently has the potential to
become cash cow, when the business growth rate reduces to a low level. When the
company cannot improve its low competitive position, the options available would be to
divest the business. Businesses with high industry growth but low market share for a
company are question or problem children. They require large amount of cash to maintain
or gain market share. In terms of PLC, the question mark is usually product in
introduction stage. “Question marks” are usually new products or services which have
good commercial potential. “Question marks may become ‘stars’ if enough investment is
made, or they may become ‘dogs’ if ignored. There are several industries in India where
many companies find themselves holding businesses which are ‘question marks’.
The main features of question marks are:
High industry growth
Low market share
The firm may adopt growth strategy for question marks. Various activities may be
undertaken to transform question marks into stars:
Penetration pricing strategy
Effective sales promotion and other elements of promotion mix
Dealers incentives
Enhancing customer relationship
EXAMPLE OF QUESTION MARK PRODUCTS OF NESTLE: -
Milo, nestle kitkat/barone/munch, maggiesauces,magi soups, nestle butter,nesvita,milk
NM COLLEGE OF COMMERCE AND ECONOMICS 12

BCG MATRIX OF NESTLE MCOM-ISEM-1
DOGS:-
Those businesses which are related to slow-growth industries and where a company has a
low relative market share are termed as ‘dogs’. They neither generate nor require large
amount of cash. In other words if the business growth rate is low and the company’s
relative market share also low, the business is classified as dog. The low market share
normally means poor profits. As the growth rate is also low, attempts to increase market
share would demand prohibitive investments. Thus the cash required to maintain
competitive position often exceeds the cash generated. There is a net negative cash flow.
Under such circumstances, the strategic solution is to liquidate the business. In term of
PLC, the ‘dogs’ are usually products in late maturity or decline stage.
The main features of dogs are:
Low industry growth
Low market share
The company may adopt retrenchment strategy. The company may adopt divestment
strategy relating to the business unit or product line, or close down the unviable business.
EXAMPLE OF DOG PRODUCT OF NESTLE: -
Nestea, milkybar,nestle crunch
2.4 BCG MATRIX RELATED TO NESTLE
PRODUCT: NESCAFE POSITION: STAR
Reasons for present positioning:
Nescafe is one of the leading coffee brands in the Indian market.
It has find a dominance which is unparalleled by any other brand in the country.
NM COLLEGE OF COMMERCE AND ECONOMICS 13

BCG MATRIX OF NESTLE MCOM-ISEM-1
Not only does it have a high market share but it growth rate is also significantly high.
The name Nescafe has become generic with coffee.
PRODUCT: CERALAC POSITION: COW
Reasons for present positioning:
Ceralac has become one of the leading baby food products
It has witnesses quite a long hold in its market share with its sales increasing on a
continuous basis for almost more than one and a half decade.
Its different variants have kept competitors at bay and its finds a place easily at almost
every general or provisional store in the Indian market.
POSITION: QUESTION MARK
INTENDED PLACEMENT: STAR
The reason why these are is not placed as a dog is that it has the potential to expand
and also because the product lies in a market with high business growth rate.
The retailers don’t give much importance to these items as an item on the shelf but they
also do not completely disregard it off their stores.
NM COLLEGE OF COMMERCE AND ECONOMICS 14

BCG MATRIX OF NESTLE MCOM-ISEM-1
WHY?
These might have not seriously taken promotional drive.
The main chunk of advertisements is seasonal
Extensive promotional exercise meant to place it in the mindset of the Indian psyche.
It has huge avenues for growth especially analyzing the extending Indian market.
Reasons for present positioning of Maggie pickle:
Maggi Pickles and, on account of its limited variety (especially in this taste crazy
country) and comparatively higher prices, has been unable to acquire a market necessary
for its bare minimum existence.
The sales of Maggi Pickles has never really trigged since its launch.
The placement of Maggi Pickles is doubted for the twin reasons of its high price and
packing, which seems to target it to the upper substrata while the lack of a significant
number of variants poses it a challenge to maintain itself in such households.
It is not a dog because it is not the market which has low growth rate. In fact the market
of packaged pickle is growing but it is Maggi Pickles which is unable to gather a
substantial share in this growing market.
Placing Maggi Pickles on the hearts and mind of the typical taste centric and money
conscious Indian consumer will require an overhauling and huge investment.
NM COLLEGE OF COMMERCE AND ECONOMICS 15

BCG MATRIX OF NESTLE MCOM-ISEM-1
Extensive price cuts are required but the matching returns are doubtful.
Pickles being a non-durable product and their success essentially related to the taste of
the consumer, are not one of the core competencies of Nestle, which is better known to
introduce standard taste in the country and get them approved by the consumers.
Thus it is better advised to disinvest in the business and focus on other brands.
Facts do not favor Nestle to continue with its butter.
Instead of no response, a significant number of retailers are of the opinion that Nestle
Butter seems to be rejected by the consumers for the reason that its taste does not suit the
Indian psyche.
Thus it is advisable for Nestle to discontinue with butter, as it did with its water brand,
Pure Life. Also, it would be better to concentrate on other brand than to go in for a head
on collision with Amul, the market leader, which is inevitable on account of the same
market which both the products cater to.
Product: Milky Bar
Position: Dogs
Reasons for present positioning:
It become quite popular in and around the year 2000 but it never reached the stage of a
power brand.
Primary tried by the Indian consumer as a craze which laid in trying the first no brown
chocolate, Nestle Milky bar was a sweet chocolate with cream color. Thus the primary
acceptance of Milky bar was not based on its core qualities but on the basis of certain
peculiarities which it contained, differentiating it from other products in the same line.
NM COLLEGE OF COMMERCE AND ECONOMICS 16

BCG MATRIX OF NESTLE MCOM-ISEM-1
Milky Bar, as a chocolate, though has a growing market, yet it has been placed as a dog
on account of the inherent lack of core quality which makes it generic with chocolates.
This was the main reason why it was never considered a competitor by other chocolate
manufactures and the consumers also treated it so.
2.5 STRATEGIC IMPLICATIONS:
Most companies will have different segments scattered across the first four quadrants of the BCG
matrix, corresponding to cash cows but avoid over-investing. The surplus cash generated by cash
cows should invited first in star businesses, to maintain their relative competitive position. Any
surplus cash left with the company may be used for selected question mark businesses to gain
market share for them. Those businesses with low market share and which cannot be adequately
funded may be considered for divestment. The dogs are generally considered as the weak
segments of the company with limited or no new investments allocated to them.
NM COLLEGE OF COMMERCE AND ECONOMICS 17

BCG MATRIX OF NESTLE MCOM-ISEM-1
2.6 ADVANTAGES OF BCG MATRIX
1. Diversification with sustainable profits:
The basic message is very simple. It begins with the fact that most companies participate in a
number of different “businesses”, even if all fall within one general industry category. These
businesses were not created equal, are not equal at any point in time, and will never offer
equal opportunities to earn high and sustained returns.
2. Allocation of scarce resources of the company:
The portfolio concept asserts that one of the primary responsibilities of the chief executive is
to make decisive investment choices for the benefit of shareholders. To make choices there
must be alternatives. For some companies there are too many, and the challenge is finding a
sound rationale for discrimination. For others there are too few, and the challenge for them is
creating opportunity. For all there is a need to ensure that every major alternative for a given
business has been uncovered and considered before a course of action is chosen.
3. Higher profits and growth rates:
Companies must choose on the basis of the closely linked combination of sustainable
competitive advantage and potential financial contribution to the company. The former yields
the high profits that convert to high net cash flow as growth slows and investment
requirements moderate. This in turn creates the high returns and high valuations that satisfy
shareholders and protect against take-over. More positively, high returns and high valuation
make raising new capital relatively easy and cheap. They make acquisitions possible. The
company has superior ability to repeat the process and invest to grow in pursuit of
competitive advantage in new businesses.
4. Raising equity capital only when necessary:
The portfolio concept stresses the critical need to keep resources fully employed in the areas
where they have the highest yield or potential yield. This means focusing technical and
NM COLLEGE OF COMMERCE AND ECONOMICS 18
BCG MATRIX OF NESTLE MCOM-ISEM-1
human resources where the company can gain and hold an edge over competitors that are
valued by customers. It means concentrating physical assets where they can be used to create
or support unique or at least scarce capability. And it means using equity capital only where
there is no safely cheaper alternative.
5. Simple to understand and implement:
Imagine a company following these guidelines, and you have a company that grows, is like
all great ideas, the portfolio concept is simple. The portfolio concept is a guide to action, a
summary of thinking, and not a substitute for detailed analysis and judgment.
6. Competitive advantage principle:
The portfolio concept builds on the observation that superior profitability depends first and
foremost on competitive advantage, and that growth is easiest where the market itself is
growing. Often superior market share carries with it competitive advantage. Advantage may
be based on superior technology, speed of response, quality and attention to specific
customer needs location-many factors that may or may not translate in to overall market
share leadership. This almost always requires focus within the market place. Thus the search
for advantage must be serious, detailed, imaginative, and rigorous. The bigger the company
and the further removed the strategist from the business, the more likely it is that opportunity
will be overlooked, and the greater the risk of oversimplifying what, it will take to succeed.
7. Discovering growth:
Second, there is the issue of growth. The long period of across-the-board expansion through
the sixties and in to the seventies spoiled us, and we now think of growth as more elusive.
The easy conditions of broad market growth have given way to more localized patterns of
growth. These often involve substitution-not just product-for-product substitution, but the
substitution of one better way of doing business for another. Latent customer needs must
uncover, before they become obvious. Creating and exploiting growth opportunities in these
conditions calls for more insight, better preparation, and greater risk taking than before.
Growth is often where you make it. Growth opportunities often lie dormant within what at
NM COLLEGE OF COMMERCE AND ECONOMICS 19

BCG MATRIX OF NESTLE MCOM-ISEM-1
first sight appear to be low growth, “mature” markets. This makes higher the importance of
first-class, forward thinking staff work closely combined with vigorous and decisive
management. Building and sustaining a strong portfolio is more difficult now, but more
necessary than ever.
2.7 LIMITATIONS OF BCG MATRIX
1. Predicting profitability from growth and market share:
BCG analysis assumes that profits depend on growth and market share. The attractiveness
of an industry may be different from its simple growth rate and the firm’s competitive
position may not be reflected in its market share.
2. Difficulty in determining market share:
There is a heavy dependence on the market share of a business as an indicator of its
competitive strength. The calculation of market share is strongly influenced by the way the
business activity and the way the total market are defined. In case of complex and
interdependent industries, it may also be quite difficult to determine the market share based
on the sales turnover of the final products only.
3. Disregard for human aspect:
The BCG analysis, while considering different business does not take in to consideration the
human aspect of running an organization. Cash generated within a business unit may come to
be symbolically associated with the power of the concerned manager. As such the manger
running a cash cow business may be reluctant to a part with the surplus cash generated by
this unit. Similarly, the workers of a dog business which has been decided to be divested may
react strongly against in the ownership. They may consider the divesture as a threat to their
livelihood. Thus BCG analysis could throw up strategic options which may or may not be
easy to implement.
NM COLLEGE OF COMMERCE AND ECONOMICS 20

BCG MATRIX OF NESTLE MCOM-ISEM-1
4. Variety of influences:
Long term profitability is subject to a variety of influences not directly tied to growth and
market share. This fact has not been considered adequately by the four-cell matrix. For
example, in many industries, organizations with low market share are able to earn high profit
and sometimes outperform large rivals. Similarly, high market share business in low growth
market may not generate high cash surplus as the competition is likely to be stiff and profit
may squeeze.
5. Other dimension:
The four cell matrix gives consideration only to relative market share position and growth of
sales. Though, these are important dimensions but other dimensions are equally important
from strategic point of view. These may be stage of product, strategic posture of different
businesses, presence of competitive position emerging threats and opportunities, capital
requirements, size of market etc.
2.8 EFFICIENCY OF BCG MATRIX AS A TOOL OF STRATEGIC
MANAGEMENT
1. BCG is a framework which measures the industry growth rate and relative market share
so as to help the firm identify each product either as a star or a dog and accordingly
allocate its scarce resources.
2. BCG also helps a company analyze their various business units and product line, so as to
formulate different strategy as per their industry growth and relative market share.
3. As regards sales and promotion, BCG helps in brand and product positioning thereby
creating brand equity for each and every business unit separately and not as an entire
company.
NM COLLEGE OF COMMERCE AND ECONOMICS 21

BCG MATRIX OF NESTLE MCOM-ISEM-1
4. Every company and its various product lines go through a life cycle of introduction,
growth, maturity and decline and with BCG it is possible to manage these.
5. In today’s times only a multi product multi business diversified company can survive and
a now in the competitive market. This is possible only with BCG.
NM COLLEGE OF COMMERCE AND ECONOMICS 22
BCG MATRIX OF NESTLE MCOM-ISEM-1
CHAPTER NO:3
ANALYSIS
NM COLLEGE OF COMMERCE AND ECONOMICS 23
BCG MATRIX OF NESTLE MCOM-ISEM-1
1. Do you eat nestle products
A) Yes B) No
Biscuits Number of Respondents
Yes 100%
No 0%
100%
productsYes No
NM COLLEGE OF COMMERCE AND ECONOMICS 24

BCG MATRIX OF NESTLE MCOM-ISEM-1
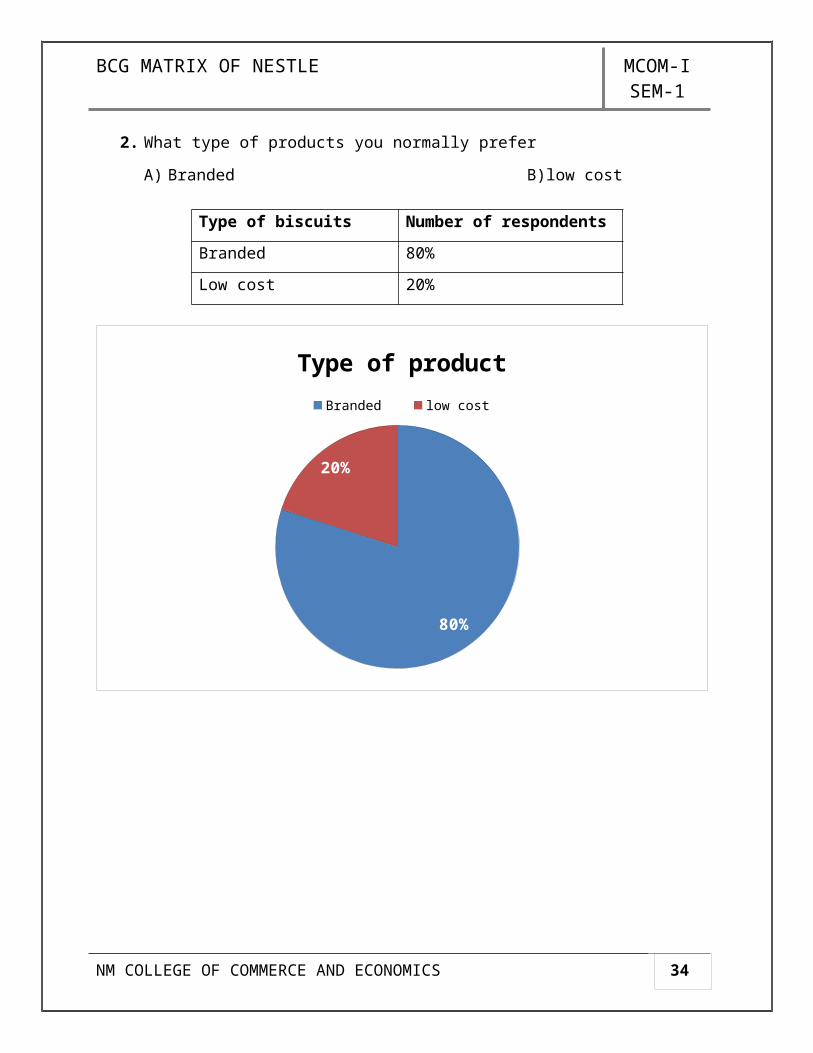
2. What type of products you normally prefer
A) Branded B)low cost
80%
20%
Type of product
Branded low cost
NM COLLEGE OF COMMERCE AND ECONOMICS 25
Type of biscuits Number of respondents
Branded 80%
Low cost 20%

BCG MATRIX OF NESTLE MCOM-ISEM-1
3. How often do you nestle product
A) Once In A Month B) Once In A Week
C) Alternate Days D) Every Day
Do you eat biscuits Number of respondents
Once In A Month 7%
Once In A Week 40%
Alternate Days 20%
Every Day 33%
Once In A Month
Once In A Week
Alternate Days
Every Day0%
5%
10%
15%
20%
25%
30%
35%
40%
45%
7%
40%
20%
33%
Do you eat nestle product
Number of respondents
NM COLLEGE OF COMMERCE AND ECONOMICS 26

BCG MATRIX OF NESTLE MCOM-ISEM-1
4. Rank the buying factors(Please tick any one of them)
A) Price B) Brand Name
Buying factors Number of respondents
Price 33%
Brand Name 67%
Price Brand Name0%
10%
20%
30%
40%
50%
60%
70%
80%
33%
67%
Buying factors
Number of respondents
NM COLLEGE OF COMMERCE AND ECONOMICS 27

BCG MATRIX OF NESTLE MCOM-ISEM-1
5. Please tick the brand normally prefer to buy
A) nestle B) amul
C) mahanand D) Others
Brand normally prefer to buy Number of respondents
nestle 47%
amul 20%
mahanand 6%
Others 27%
47%
20%
6%
27%
Brand normally prefer to buy
nestleamulmahanandOthers
NM COLLEGE OF COMMERCE AND ECONOMICS 28

BCG MATRIX OF NESTLE MCOM-ISEM-1
6. If nestle is not available in the shop will you look for it in the next shop
A) Yes B) No
nestle is not available in the shopyou look for it in the next shop Number of respondents
Yes 60%
No 40%
60%
40%
nestle is not available in the shop you look for it in the next shop
Yes No
NM COLLEGE OF COMMERCE AND ECONOMICS 29

BCG MATRIX OF NESTLE MCOM-ISEM-1
7. If the retailer gives you another brand product instead of nestle, will you buy
A) Yes B) No
Will you buy another brand of
product instead of nestle
Number of respondents
Yes 53%
No 47%
Yes No43%
44%
45%
46%
47%
48%
49%
50%
51%
52%
53%
53%
47%
Number of respondents
NM COLLEGE OF COMMERCE AND ECONOMICS 30

BCG MATRIX OF NESTLE MCOM-ISEM-1
8. Please rate the attributes of the various brand given below
On a scale of 1-5 (1 being the least important and 5 being the most important)
Attributes nestle amul mahanand
Size
Nutrition
Ingredients
Freshness
Color
Flavors
Various brand Number of respondents
nestle 40%
amul 47%
mahanand 13%
nestle amul mahanand0%5%
10%15%20%25%30%35%40%45%50%
40%
47%
13%
Number of respondents
Number of respondents
NM COLLEGE OF COMMERCE AND ECONOMICS 31

BCG MATRIX OF NESTLE MCOM-ISEM-1
From the survey concluded that 100% of the respondents eat nestle products
80% of the respondents normally prefer branded one and the remaining prefer low cost
product
From the total number of respondents 40% eat nestle product once in a week and the
remaining respondents answered that 33%,20% and 7% respondents eat nestle product every
day, alternate and once in a month respectively.
67% respondents answered that they buy the nestle product by brand name and the remaining
respondents buying factor is price
47% normally prefer to buy nestle than the other one
60% of the respondents answered that they will look for the next shop if nestle is not
available in the shop
50% of the respondents will not buy the another brand instead of nestle
40% of the respondents rated that the Britannia attributes is nice of its color, flavor, etc. 47%
of the respondents rated that the amul is better than the nestle.
NM COLLEGE OF COMMERCE AND ECONOMICS 32

BCG MATRIX OF NESTLE MCOM-ISEM-1
CHAPTER NO: 6 4
APPENDIX
NM COLLEGE OF COMMERCE AND ECONOMICS 33
BCG MATRIX OF NESTLE MCOM-ISEM-1
4.1 ANNEXURE-QUESTIONNAIRE
NM COLLEGE OF COMMERCE & ECONOMICS
Name: ______________________________
Address: _____________________________
Email Id: ____________________________ Mobile Number:__________________
1. Do you eat biscuits
B) Yes B) No
2. What type of biscuits you normally prefer
B) Branded B)low cost
3. How often do you eat nestle product
A) Once In A Month B) Once In A Week
C) Alternate Days D) Every Day
4. Rank the buying factors(Please tick any one of them)
A) Price B) Brand Name
5. Please tick the brand normally prefer to buy
A) nestle B) amul
C) mahanand D) Others
6. If nestle is not available in the shop will you look for it in the next shop
A) Yes B) No
7. If the retailer gives you another brand product instead of nestle, will you buy
A) Yes B) No
NM COLLEGE OF COMMERCE AND ECONOMICS 34

BCG MATRIX OF NESTLE MCOM-ISEM-1
8. Please rate the attributes of the various biscuits given below
On a scale of 1-5 (1 being the least important and 5 being the most important)
Attributes nestle Amul Mahanand
Size
Nutrition
Ingredients
Freshness
Color
Flavors
NM COLLEGE OF COMMERCE AND ECONOMICS 35

BCG MATRIX OF NESTLE MCOM-ISEM-1
4.2 BIBLIOGRAPHY
Strategic management publication MananPrakashan
Strategic management publication VipulPrakashan
4.3 WEBLIOGRAPHY
www.cimaglobal.com
www.accaglobal.com
www.managementmania.com
www.bcg.com
www.cesc.co.in
www.marketing91.com
NM COLLEGE OF COMMERCE AND ECONOMICS 36