bbookch11
DESCRIPTION
yayayayayaTRANSCRIPT

Object-Oriented Software EngineeringPractical Software Development using UML and Java
Chapter 11: Managing the Software Process
Timing: 90 minutes
““The most likely way for the world to be destroyed, most experts The most likely way for the world to be destroyed, most experts agree, is by accident. That's where we come in; we're computer agree, is by accident. That's where we come in; we're computer professionals. We cause accidents."professionals. We cause accidents."

© Lethbridge/Laganière 2005 Chapter 11: Managing the Software Process 2
A lot of computer science people think:
“I don’t want to code for the rest of my life. Maybe I would enjoy managing the project.”
What do you think are some of the tasks you would be doing if you were a project manager? Would you still code? Would you miss coding ? Is it important the project manager be able to code?

© Lethbridge/Laganière 2005 Chapter 11: Managing the Software Process 3
11.1 What is Project Management?
Project management encompasses all the activities needed to plan and execute a project:
• Deciding what needs to be done
• Estimating costs
• Ensuring there are suitable people to undertake the project
• Defining responsibilities
• Scheduling
• Making arrangements for the work
• continued ...

© Lethbridge/Laganière 2005 Chapter 11: Managing the Software Process 4
What is Project Management?
• Directing
• Being a technical leader
• Reviewing and approving decisions made by others
• Building morale and supporting staff
• Monitoring and controlling
• Co-ordinating the work with managers of other projects
• Reporting
• Continually striving to improve the process

© Lethbridge/Laganière 2005 Chapter 11: Managing the Software Process 5
Can you think of any Canadian software projects that have gone horribly wrong?
•Gun Registry In Canadahttp://www.cbc.ca/news/story/2004/02/13/gunregistry_rdi040213.html

© Lethbridge/Laganière 2005 Chapter 11: Managing the Software Process 6
11.2 Software Process Models
Software process models are general approaches for organizing a project into activities.
• Help the project manager and his or her team to decide:
—What work should be done;
—In what sequence to perform the work.
• The models should be seen as aids to thinking, not rigid prescriptions of the way to do things.
• Each project ends up with its own unique plan.

© Lethbridge/Laganière 2005 Chapter 11: Managing the Software Process 7
The opportunistic approach
Think of Idea for
Improvement
Modify Until
Satisfied
First Prototype

© Lethbridge/Laganière 2005 Chapter 11: Managing the Software Process 8
The opportunistic approach
… is what occurs when an organization does not follow good engineering practices.
• It does not acknowledge the importance of working out the requirements and the design before implementing a system.
• The design of software deteriorates faster if it is not well designed.
• Since there are no plans, there is nothing to aim towards. • There is no explicit recognition of the need for
systematic testing and other forms of quality assurance. • The above problems make the cost of developing and
maintaining software very high.
© Lethbridge/Laganière 2005 Chapter 11: Managing the Software Process 9
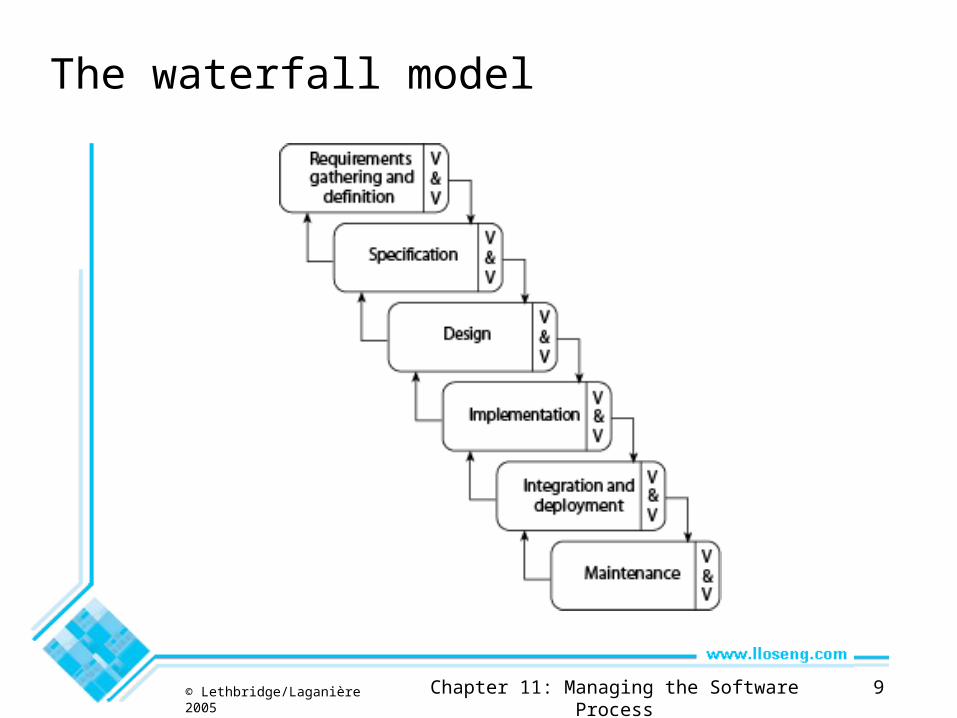
The waterfall model

© Lethbridge/Laganière 2005 Chapter 11: Managing the Software Process 10
The waterfall model
The classic way of looking at S.E. that accounts for the importance of requirements, design and quality assurance.
• The model suggests that software engineers should work in a series of stages.
• Before completing each stage, they should perform quality assurance (verification and validation).
• The waterfall model also recognizes, to a limited extent, that you sometimes have to step back to earlier stages.
• QUESTION: What is wrong with getting all the requirements completed upfront (like I have done for you with our project)?

© Lethbridge/Laganière 2005 Chapter 11: Managing the Software Process 11
Limitations of the waterfall model
• The model implies that you should attempt to complete a given stage before moving on to the next stage
—Does not account for the fact that requirements constantly change.
—It also means that customers can not use anything until the entire system is complete.
• The model makes no allowances for prototyping.
• It implies that you can get the requirements right by simply writing them down and reviewing them.
• The model implies that once the product is finished, everything else is maintenance.

Agile Software Development
• Agile Development:
“based on iterative and incremental development, where requirements and solutions evolve through collaboration between self-organizing, cross-functional teams. It promotes adaptive planning, evolutionary development and delivery, a time-boxed iterative approach, and encourages rapid and flexible response to change.”
© Lethbridge/Laganière 2005 Chapter 11: Managing the Software Process 12
13
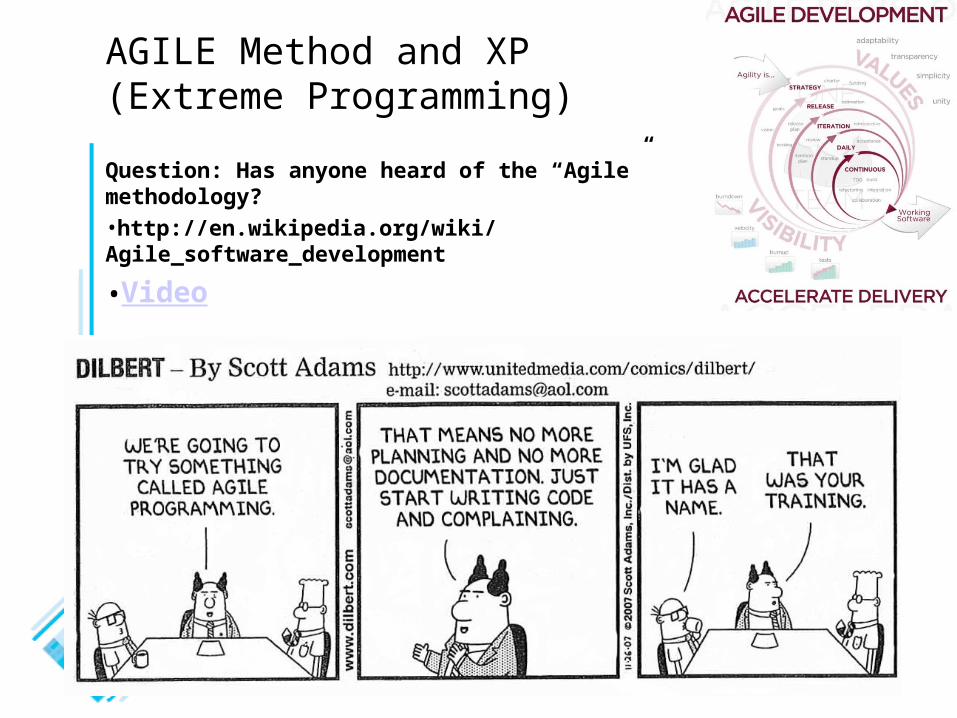
AGILE Method and XP (Extreme Programming)
Question: Has anyone heard of the “Agile” methodology?
•http://en.wikipedia.org/wiki/Agile_software_development
•Video

© Lethbridge/Laganière 2005 Chapter 11: Managing the Software Process 14
Reengineering
Periodically project managers should set aside some time to re-engineer part or all of the system
• The extent of this work can vary considerably:
—Cleaning up the code to make it more readable.
—Completely replacing a layer.
—Re-factoring part of the design.
• In general, the objective of a re-engineering activity is to increase maintainability.
© Lethbridge/Laganière 2005 Chapter 11: Managing the Software Process 15
11.3 Cost estimationTo estimate how much software-engineering time will be required to do some work.
• Elapsed time
—The difference in time from the start date to the end date of a task or project.
• Development effort
—The amount of labour used in person-months or person-days.
—To convert an estimate of development effort to an amount of money:
You multiply it by the weighted average cost (burdened cost) of employing a software engineer for a month (or a day).

© Lethbridge/Laganière 2005 Chapter 11: Managing the Software Process 16
Question
Assume that I gave your group the task of figuring out how much time you needed to code your project because you were going sell it online.
What are some techniques/ideas/concerns/thoughts you have for estimating the timing of a large project?
i.e. How do you decide/figure out how long it takes you to do an assignment?

© Lethbridge/Laganière 2005 Chapter 11: Managing the Software Process 17
Principles of effective cost estimation
Principle 1: Divide and conquer.
• To make a better estimate, you should divide the project up into individual subsystems.
• Then divide each subsystem further into the activities that will be required to develop it.
• Next, you make a series of detailed estimates for each individual activity.
• And sum the results to arrive at the grand total estimate for the project.

© Lethbridge/Laganière 2005 Chapter 11: Managing the Software Process 18
Principles of effective cost estimation
Principle 2: Include all activities when making estimates.
• The time required for all development activities must be taken into account.
• Including:- Prototyping
- Design
- Inspecting
- Testing
- Debugging
- Writing user documentation
- Deployment.

© Lethbridge/Laganière 2005 Chapter 11: Managing the Software Process 19
Principles of effective cost estimation
Principle 3: Base your estimates on past experience combined with knowledge of the current project.
• If you are developing a project that has many similarities with a past project:
— You can expect it to take a similar amount of work. • Base your estimates on the personal judgement of your
expertsor
• Use algorithmic models developed in the software industry as a whole by analyzing a wide range of projects.
—They take into account various aspects of a project’s size and complexity, and provide formulas to compute anticipated cost.

© Lethbridge/Laganière 2005 Chapter 11: Managing the Software Process 20
Algorithmic models
Allow you to systematically estimate development effort.
• Based on an estimate of some other factor that you can measure, or that is easier to estimate:
—The number of use cases
—The number of distinct requirements
—The number of classes in the domain model
—The number of widgets in the prototype user interface
—An estimate of the number of lines of code

© Lethbridge/Laganière 2005 Chapter 11: Managing the Software Process 21
Algorithmic models
• A typical algorithmic model uses a formula like the following:
—COCOMO:
—Functions Points:
E = a + bNc
S = W1F1 + W2F2 +W3F3 + …

© Lethbridge/Laganière 2005 Chapter 11: Managing the Software Process 22
Principles of effective cost estimation
Principle 4: Be sure to account for differences when extrapolating from other projects.
• Different software developers
• Different development processes and maturity levels
• Different types of customers and users
• Different schedule demands
• Different technology
• Different technical complexity of the requirements
• Different domains
• Different levels of requirement stability

© Lethbridge/Laganière 2005 Chapter 11: Managing the Software Process 23
Principles of effective cost estimation
Principle 5: Anticipate the worst case and plan for contingencies.
• Develop the most critical use cases first
—If the project runs into difficulty, then the critical features are more likely to have been completed
• Make three estimates:
—Optimistic (O)- Imagining a everything going perfectly
—Likely (L)- Allowing for typical things going wrong
—Pessimistic- Accounting for everything that could go wrong

© Lethbridge/Laganière 2005 Chapter 11: Managing the Software Process 24
Principles of effective cost estimation
Principle 6: Combine multiple independent estimates.• Use several different techniques and compare the results. • If there are discrepancies, analyze your calculations to
discover what factors causing the differences.• Use the Delphi technique.
—Several individuals initially make cost estimates in private.
—They then share their estimates to discover the discrepancies.
—Each individual repeatedly adjusts his or her estimates until a consensus is reached.

© Lethbridge/Laganière 2005 Chapter 11: Managing the Software Process 25
Principles of effective cost estimation
Principle 7: Revise and refine estimates as work progresses
• As you add detail.
• As the requirements change.
• As the risk management process uncovers problems.

© Lethbridge/Laganière 2005 Chapter 11: Managing the Software Process 26
11.4 Building Software Engineering Teams
Software engineering is a human process.
• Choosing appropriate people for a team, and assigning roles and responsibilities to the team members, is therefore an important project management skill
• Software engineering teams can be organized in many different ways
a) Egoless b) Chief programmer c) Strict hierarchy

© Lethbridge/Laganière 2005 Chapter 11: Managing the Software Process 27
Software engineering teams
Egoless team:
• In such a team everybody is equal, and the team works together to achieve a common goal.
• Decisions are made by consensus.
• Most suited to difficult projects with many technical challenges.

© Lethbridge/Laganière 2005 Chapter 11: Managing the Software Process 28
Software engineering teams
Hierarchical manager-subordinate structure:
• Each individual reports to a manager and is responsible for performing the tasks delegated by that manager.
• Suitable for large projects with a strict schedule where everybody is well-trained and has a well-defined role.
• However, since everybody is only responsible for their own work, problems may go unnoticed.
© Lethbridge/Laganière 2005 Chapter 11: Managing the Software Process 29
Software engineering teams
Chief programmer team:
• Midway between egoless and hierarchical.
• The chief programmer leads and guides the project.
• He or she consults with, and relies on, individual specialists.

© Lethbridge/Laganière 2005 Chapter 11: Managing the Software Process 30
Choosing an effective size for a team
• For a given estimated development effort, in person months, there is an optimal team size.
—Doubling the size of a team will not halve the development time.
• Subsystems and teams should be sized such that the total amount of required knowledge and exchange of information is reduced.
• For a given project or project iteration, the number of people on a team will not be constant.
• You can not generally add people if you get behind schedule, in the hope of catching up.

© Lethbridge/Laganière 2005 Chapter 11: Managing the Software Process 31
Skills needed on a team
• Architect
• Project manager
• Configuration management and build specialist
• User interface specialist
• Technology specialist
• Hardware and third-party software specialist
• User documentation specialist
• Tester

© Lethbridge/Laganière 2005 Chapter 11: Managing the Software Process 32
11.5 Project Scheduling and Tracking
• Scheduling is the process of deciding:
—In what sequence a set of activities will be performed.
—When they should start and be completed.
• Tracking is the process of determining how well you are sticking to the cost estimate and schedule.

UWO Computer Science Department 33
Some Basic Project Management Terminology•Deliverable: some concrete thing which is to be delivered, to the client or internally to the development team; e.g.
• Specifications reports• Executable program• Source code
•Task/Activity: something we have to do during the project; e.g.• Defining user requirements• Coding a module• Doing system testing
•Each task or activity will take some length of time• Referred to as duration of task• Sometimes measured in days, weeks, etc.• Sometimes measured in person-days, person-weeks, etc.• Person-day = number of people X number of days
—Example: 12 person days for writing all code could mean 1 person 12 days or 4 people 3 days
—Note: not always true that a task that takes 1 programmer 12 days would take 12 programmers 1 day

UWO Computer Science Department 34
Dependencies and Milestones
•For a given task or activity, may be impossible to start it without some other task(s) or activity(ies) having been completed; e.g.
• Cannot start coding without completing design• Cannot start system testing without completing code integration and
test plan•If task B cannot start without A being completed, we say
• B depends on A• There is a dependency between A and B
•Milestone: some achievement which must be made during the project; e.g.
• Delivering some deliverable• Completing some task
•Note, delivering a deliverable may be a milestone, but not all milestones are associated with deliverables

UWO Computer Science Department 35
Setting and Making Deadlines•Deadline time by which milestone has to be met
• Some deadlines are set by the client• Others are set by us on project to make sure project stays on track
•To set a deadline for completing task T, we must consider how long it will take to:
• Complete the tasks that task T depends on• Complete task T itself
•If we miss a deadline, we say (euphemistically) “the deadline has slipped”
• This is virtually inevitable•Important tasks for project managers
• Monitor whether past deadlines have slipped• Monitor whether future deadlines are going to slip• Allocate or reallocate resources to help make deadlines
•PERT chart and Gantt charts help project managers do these things (among others)

UWO Computer Science Department 36
PERT Charts
•PERT = Project Evaluation and Review Technique•PERT chart = graphical representation of the scheduling of events in a project•Sample PERT Chart:
•A PERT chart is a graph• Edges are tasks/activities that need to be done• Nodes are the events or milestones
•Task edge T from event node E1 to event node E2 signifies:• Until event E1 happens, task T cannot be started• Until task T finishes, event E2 cannot happen
•Events often simply represent completion of tasks associated with arrows entering it
100
2 44
3 106
4 77
A4
B2
C3 5 10
10D3
6 1313
E3
F3

UWO Computer Science Department 37
PERT Chart Task Edges
•Parts of a task/activity edge
•Task letter:
• Often keyed to a legend to tell which task it represents
•Task duration = how long (e.g. days, hours) task will take
D
5
Task duration
Task letter

UWO Computer Science Department 38
PERT Chart Event Nodes
59
19
Event Number:
Sequence number assigned
Only task edges indicate dependencies
Earliest Completion Time (ECT):
Earliest time this event can be achieved, given
durations and dependencies
Latest Completion Time (LCT):
Latest time that this event could be safely achieved
UWO Computer Science Department 39
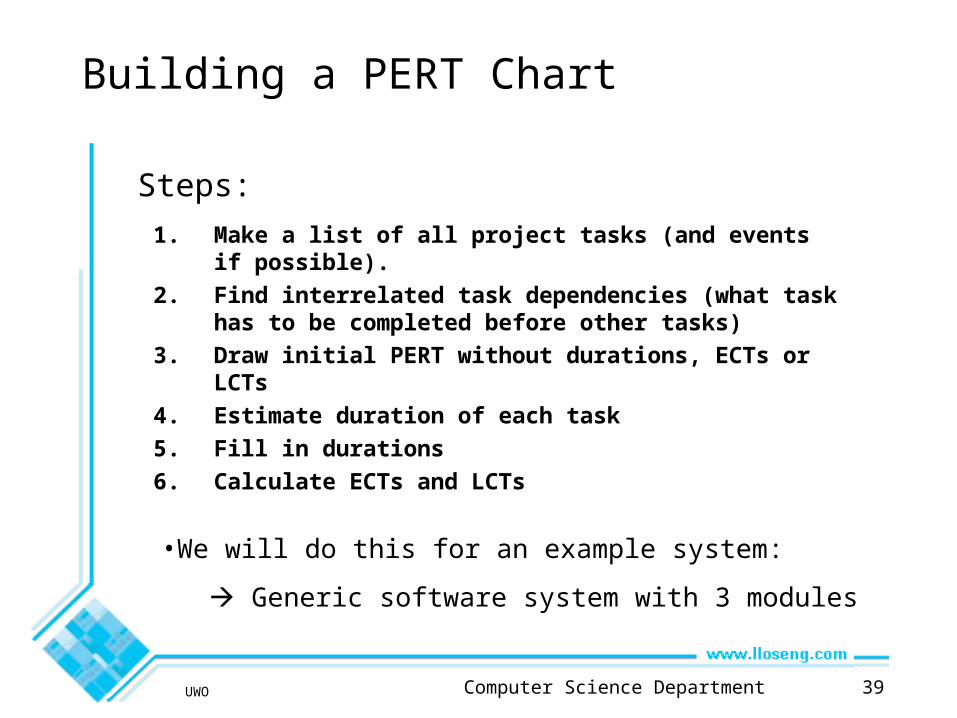
Building a PERT Chart
1. Make a list of all project tasks (and events if possible).
2. Find interrelated task dependencies (what task has to be completed before other tasks)
3. Draw initial PERT without durations, ECTs or LCTs
4. Estimate duration of each task
5. Fill in durations
6. Calculate ECTs and LCTs
•We will do this for an example system:
Generic software system with 3 modules
Steps:
UWO Computer Science Department 40
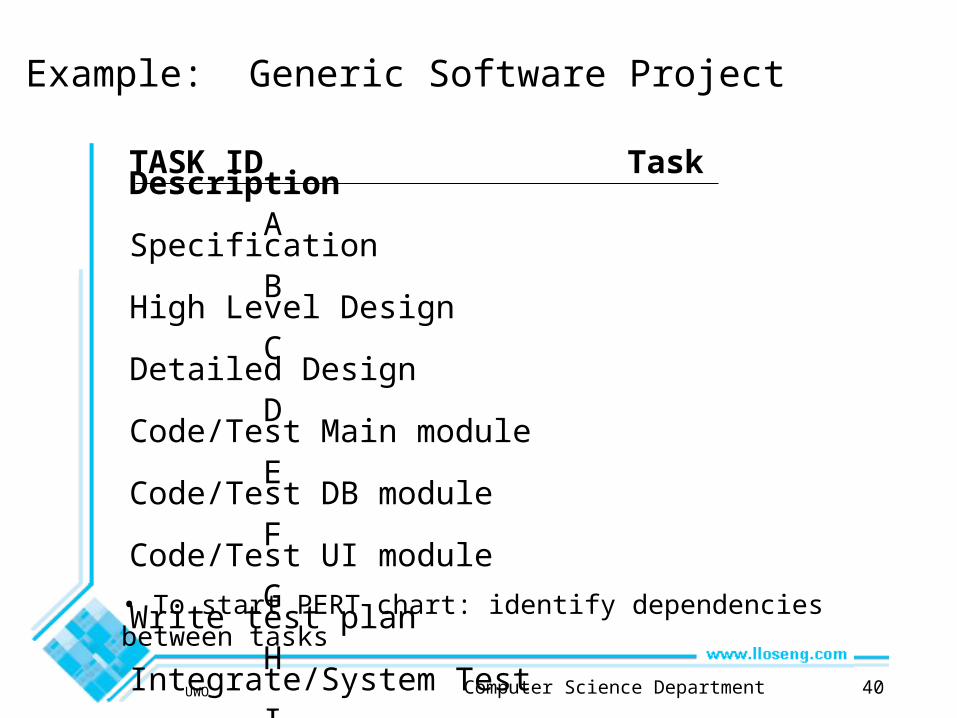
Example: Generic Software Project
TASK ID Task Description A Specification B High Level Design C Detailed Design D Code/Test Main module E Code/Test DB module F Code/Test UI module G Write test plan H Integrate/System Test I Write User Manual J Typeset User Manual • To start PERT chart: identify dependencies between tasks

UWO Computer Science Department 41
Dummy Tasks
Sometimes it is necessary to use dummy tasks:
• Shows the dependency between 2 events where no activity is performed
Example:
• Events 3, 4 signify the compilation of separate modules.
• Create an event 5 to signify “all modules compiled together”. Denote dummy tasks using dash lines
39
10
49
12
59
12
T
3

UWO Computer Science Department 42
Example: Tasks with Dependencies
To start the PERT, identify the dependencies amongst tasks
TASK ID Task Description Preceed ID Succ. ID
A Specification 1 2 B High Level Design 2 3 C Detailed Design 3 4 D Code/Test Main 4 5 E Code/Test DB 4 6 F Code/Test UI 4 7 G Write test plan 4 8 Dummy Task 5 8 Dummy Task 6 8 Dummy Task 7 8 H Integrate/System Test 8 9 I Write User Manual 8 10
J Typeset User Manual 10 9

UWO Computer Science Department 43
Software Example: Skeleton PERT Chart
1A
2B
3C
4E
5
6
7
8H
9
1
JF
D
I
G
Note: dummy tasks connecting events 5, 6 and 7 to 8

UWO Computer Science Department 44
Estimating Durations
Suggestions for estimating durations of tasks:
• Don’t just make up a number
• Look at previous similar tasks from other projects and use those as guidelines
• Try to identify factors such as difficulty, skill level
—Each weighting factor will help you make a better estimate
Factors to consider:
• Difficulty of task
• Size of team
• Experience of team
• Number, attitude and availability of end users
• Management commitment
• Other projects in progress

UWO Computer Science Department 45
PERT Chart With Durations
1A
2B
3C
4E
5
6
7
8 H 9
1
JF
D
I
G
3 2 2
7
2
3
6
2 1
5
•Say we have estimated durations of all tasks (in days)
•New PERT chart, with durations filled in:
•Note, dummy tasks (dashed lines) always have a duration of zero

UWO Computer Science Department 46
Calculating ECTsECT = earliest time event can be completed
To calculate:
• For an event not depending on others: ECT = 0
—Usually this is the first event
• For an event E depending on one or more others:
—Calculate ECTs of event(s) that E depends on
—Add duration(s) of task(s) leading to E
—If E depends on more than one event, take MAX
Proceed left to right ( ) through the chart
Exercise: calculate the ECT for our example.

UWO Computer Science Department 47
Calculating LCTLCT = latest time event can be completed, while still finishing last ask at indicated
time
To calculate:
• For an event which no other events depend on: LCT = ECT
—Generally there will only be one such event
• For an event E which one or more others depend on:
—Calculate LCTs of event(s) that depend on E
—Subtract duration(s) of task(s) leading from E
—If more than one event depends on E, take MINIMUM
Proceed right to left ( ) through PERT chart
Exercise: calculate LCT for our example

UWO Computer Science Department 48
Critical Path
Red line is the critical path
What does it represent?

UWO Computer Science Department 49
Uses of PERT ChartsWe can use PERT charts for:
• Determining the estimated time to complete a project
• Deriving actual project dates
• Allocating resources
• Identifying potential and current problems (is one task behind schedule?, can we shuffle people?)
Critical Path: Path through chart such that if any deadline slips, the final deadline slips (where all events have ECT = LCT (usually there is only one)
In software example:
• Task I is not on the critical path: even if we don’t finish it until time 18, we’re still okay
• Task D is on the critical path: if we don’t finish it until for example, time 16, then:
—We can’t start task H (duration 3) until time 16
—So we can’t complete task H until time 21
We can use PERT charts for
• Identifying the critical path
• Reallocating resources, e.g. from non-critical to critical tasks.

UWO Computer Science Department 50
PERT Chart ExerciseTask Prec Tasks Description Time(hrs)
A none decide on date for party 1B A book bouncy castle 1C A send invitations 4D C receive replies 7E D buy toys and balloons 1F D buy food 3G E blow up balloons 2H F make food 1I H, G decorate 1J B get bouncy castle 1K J, I have party 1L K clean up 4M K send back bouncy castle 1N L send thank you letters 3O M donate unwanted gifts 3

UWO Computer Science Department 51
PERT Chart ExerciseDraw the PERT chart for the preceding slide and identify the critical path

UWO Computer Science Department 52
Gantt Charts
•Graphical Representation of a schedule
•Helps to plan, coordinate and track specific tasks in a project
•Named after Henry Gantt who invented them in 1917
•Depicts some of the same information as on a PERT chart
•Also depicts new information
UWO Computer Science Department 53
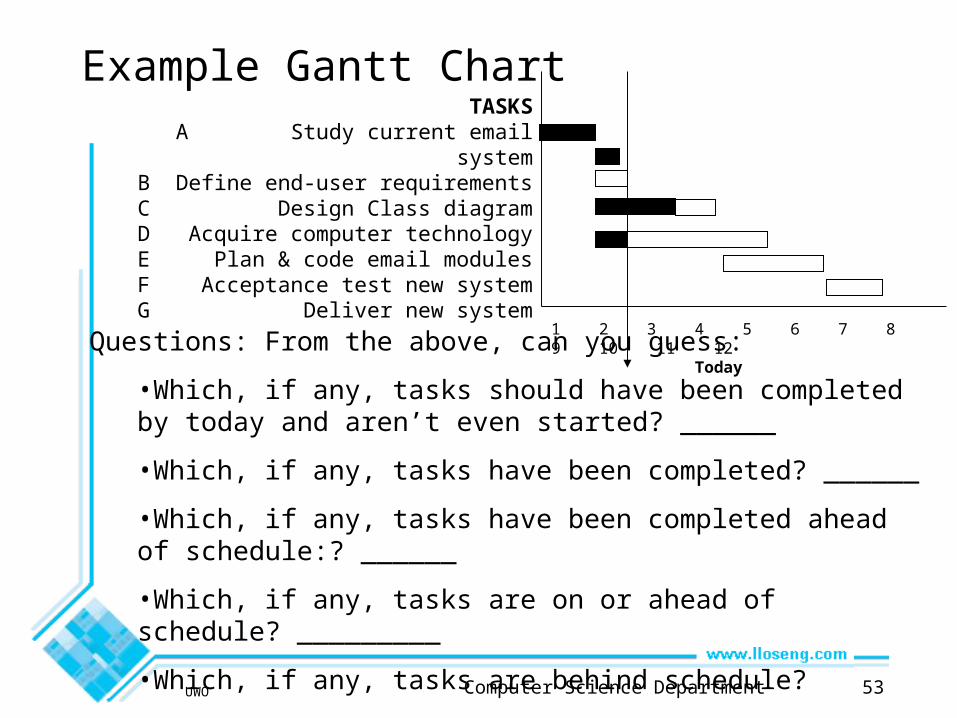
Example Gantt ChartTASKS
A Study current email systemB Define end-user requirementsC Design Class diagramD Acquire computer technologyE Plan & code email modulesF Acceptance test new systemG Deliver new system
1 2 3 4 5 6 7 8 9 10 11 12 TodayQuestions: From the above, can you guess:
•Which, if any, tasks should have been completed by today and aren’t even started? ______
•Which, if any, tasks have been completed? ______
•Which, if any, tasks have been completed ahead of schedule:? ______
•Which, if any, tasks are on or ahead of schedule? _________
•Which, if any, tasks are behind schedule? ________

UWO Computer Science Department 54
Building and Using a Gantt Chart
Steps for building a Gantt Chart
1. Identify the tasks to be scheduled2. Determine the durations of each task3. List each task down the vertical axis of chart
1. In general, list tasks to be performed first at the top and then move downward as the tasks will happen
4. Use horizontal axis for the dates5. Determine start and finish dates for activities
1. Consider which tasks must be completed or partially completed before the next task
To use the Gantt chart to report progress:
• If the task has been completed, completely shade in the bar corresponding to the task
• If the task has been partially completed, shade in the percentage of the bar that represents the percentage of the task that has been completed
• Unshaded bars represents tasks that have not been started.

UWO Computer Science Department 55
Gantt Chart: ExerciseTask Prec Tasks Description Time(hrs)
A none decide on date for party 1B A book bouncy castle 1C A send invitations 4D C receive replies 7E D buy toys and balloons 1F D buy food 3G E blow up balloons 2H F make food 1I H, G decorate 1J B get bouncy castle 1K J, I have party 1L K clean up 4M K send back bouncy castle 1N L send thank you letters 3O M donate unwanted gifts 3

UWO Computer Science Department 56
Gantt Chart: Exercise
Draw the Gantt chart using the following criteria:
• label hours 0 to 30 across the horizontal axis
• Mark a review stage at hour 14 to monitor the progress
• Assume and illustrate that tasks A, B, C and D have been completed at hour 14
• State which tasks are ahead and which tasks are behind schedule
• NOTE: if you are using MS Project and want a different unit of time, just type 2 hours (instead of 2 days). ALSO, if you want to have a milestone, like Handing in Group Assignment 1, then give it a ZERO duration.

UWO Computer Science Department 57
Your Gantt chart:

UWO Computer Science Department 58
PERT vs. Gantt
PERT chart
• All us to show dependencies explicitly
• Allow us to calculate critical path
• Can tell us how one task falling behind affects other tasksGantt charts
• Allow us to record progress of project
• Allow us to see what tasks are falling behind
• Allow us to represent overlapping tasksProject Management Tools, e.g. MS Project
• Allow us to specify tasks, dependencies, etc
• Allow us to specify progress on tasks, etc
• Can generate either PERT or Gantt charts (whichever we want) from data entered

© Lethbridge/Laganière 2005 Chapter 11: Managing the Software Process 59
Bouncy Castle PERT Example using MS Project

© Lethbridge/Laganière 2005 Chapter 11: Managing the Software Process 60
Bouncy Castle Gantt Example using MS Project
In MS Project set the task length to be 0 to get a milestone

© Lethbridge/Laganière 2005 Chapter 11: Managing the Software Process 61
11.7 Difficulties and Risks in Project Management
• Accurately estimating costs is a constant challenge—Follow the cost estimation guidelines.
• It is very difficult to measure progress and meet deadlines
—Improve your cost estimation skills so as to account for the kinds of problems that may occur.
—Develop a closer relationship with other members of the team.
—Be realistic in initial requirements gathering, and follow an iterative approach.
—Use earned value charts to monitor progress.

© Lethbridge/Laganière 2005 Chapter 11: Managing the Software Process 62
Difficulties and Risks in Project Management
• It is difficult to deal with lack of human resources or technology needed to successfully run a project
—When determining the requirements and the project plan, take into consideration the resources available.
—If you cannot find skilled people or suitable technology then you must limit the scope of your project.
© Lethbridge/Laganière 2005 Chapter 11: Managing the Software Process 63
Difficulties and Risks in Project Management
• Communicating effectively in a large project is hard
—Take courses in communication, both written and oral.
—Learn how to run effective meetings.
—Review what information everybody should have, and make sure they have it.
—Make sure that project information is readily available.
—Use ‘groupware’ technology to help people exchange the information they need to know

© Lethbridge/Laganière 2005 Chapter 11: Managing the Software Process 64
Difficulties and Risks in Project Management
• It is hard to obtain agreement and commitment from others
—Take courses in negotiating skills and leadership.
—Ensure that everybody understands - The position of everybody else.
- The costs and benefits of each alternative.
- The rationale behind any compromises.
—Ensure that everybody’s proposed responsibility is clearly expressed.
—Listen to everybody’s opinion, but take assertive action, when needed, to ensure progress occurs.

© Lethbridge/Laganière 2005 Chapter 11: Managing the Software Process 65
ReviewDraw a PERT Chart for the following activities:
Activity Description Predecessor Estimated Time
A Drive home None 0.5
B Wash Clothes A 4.0
C Pack B 0.5
D Go to bank A 1.0
E Pay bill D 0.5
F Pack car C,E 0.5
G Drive to bus F 0.5