bayernlb fixed income conference - talanx · munich re generali 2 axa 2 ... group (“best...
TRANSCRIPT

Alik Hertel, Head of TreasuryMarcus Sander, Senior Investor Relations Manager Munich, 18 May 2015
BayernLB Fixed Income Conference
2 BayernLB Fixed Income Conference, Munich, 18 May 2015
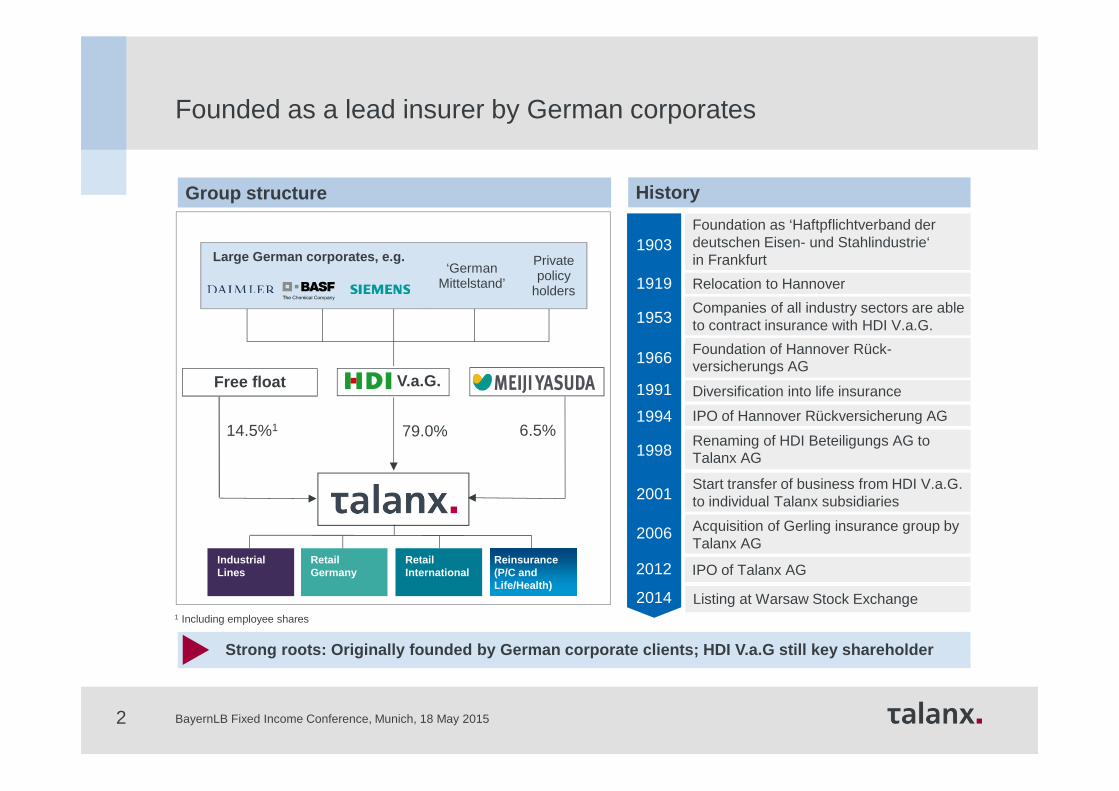
‘German Mittelstand’
Private policy
holders
Large German corporates, e.g.
V.a.G.
79.0%
Strong roots: Originally founded by German corporat e clients; HDI V.a.G still key shareholder
Group structure
Free float
1903
1919
1953
1966
1991
1994
1998
2001
2006
2012
Foundation as ‘Haftpflichtverband der deutschen Eisen- und Stahlindustrie‘in Frankfurt
Relocation to Hannover
Companies of all industry sectors are ableto contract insurance with HDI V.a.G.
Foundation of Hannover Rück-versicherungs AG
Diversification into life insurance
IPO of Hannover Rückversicherung AG
Renaming of HDI Beteiligungs AG to Talanx AG
Start transfer of business from HDI V.a.G. to individual Talanx subsidiaries
Acquisition of Gerling insurance group by Talanx AG
IPO of Talanx AG
History
14.5%1 6.5%
1 Including employee shares
IndustrialLines
RetailGermany
Reinsurance (P/C and Life/Health)
RetailInternational
Founded as a lead insurer by German corporates
Listing at Warsaw Stock Exchange2014

3
IndustrialLines
RetailGermany
Reinsurance(P/C andLife/Health)
RetailInternational
CorporateOperations
Four divisions with a strong portfolio of brands
Integrated international insurance group following a multi-brand approach
BayernLB Fixed Income Conference, Munich, 18 May 2015
4
Industrial Lines
Retail International
Reinsurance
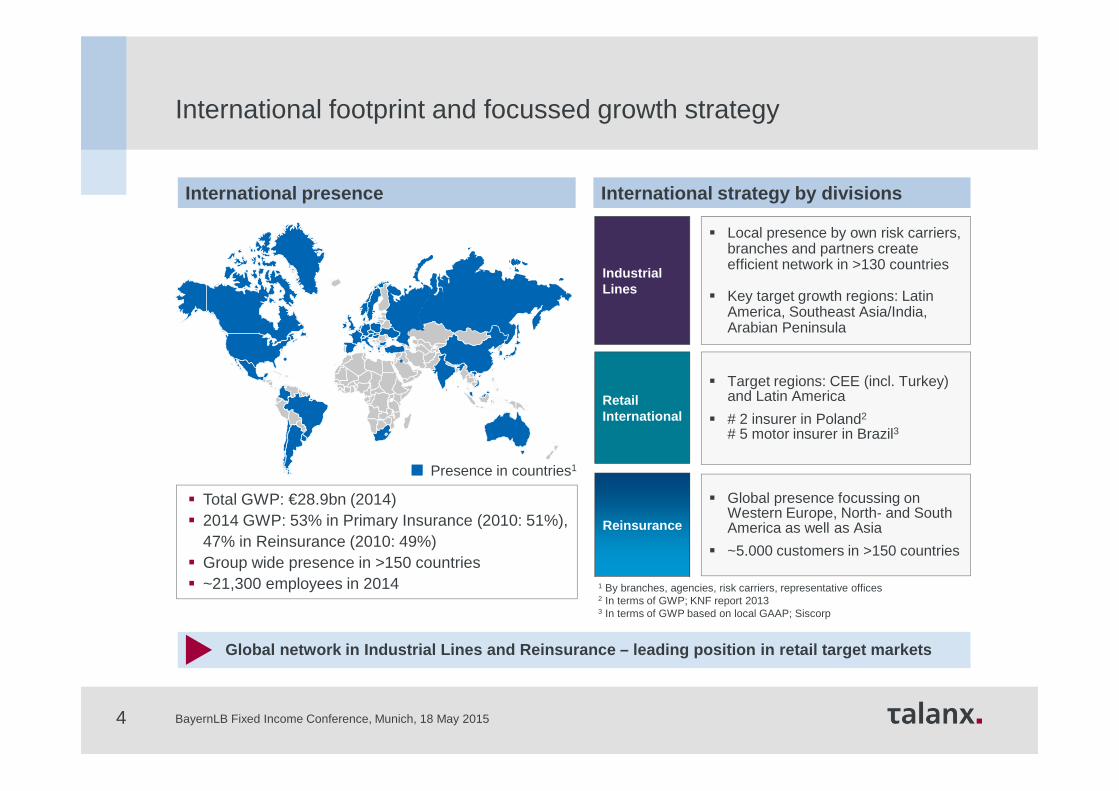
� Local presence by own risk carriers, branches and partners create efficient network in >130 countries
� Key target growth regions: Latin America, Southeast Asia/India, Arabian Peninsula
� Target regions: CEE (incl. Turkey) and Latin America
� # 2 insurer in Poland2
# 5 motor insurer in Brazil3
� Global presence focussing on Western Europe, North- and South America as well as Asia
� ~5.000 customers in >150 countries
Presence in countries1
1 By branches, agencies, risk carriers, representative offices2 In terms of GWP; KNF report 20133 In terms of GWP based on local GAAP; Siscorp
International presence International strategy by divisions
� Total GWP: €28.9bn (2014)� 2014 GWP: 53% in Primary Insurance (2010: 51%),
47% in Reinsurance (2010: 49%)� Group wide presence in >150 countries� ~21,300 employees in 2014
Global network in Industrial Lines and Reinsurance – leading position in retail target markets
International footprint and focussed growth strategy
BayernLB Fixed Income Conference, Munich, 18 May 2015
5
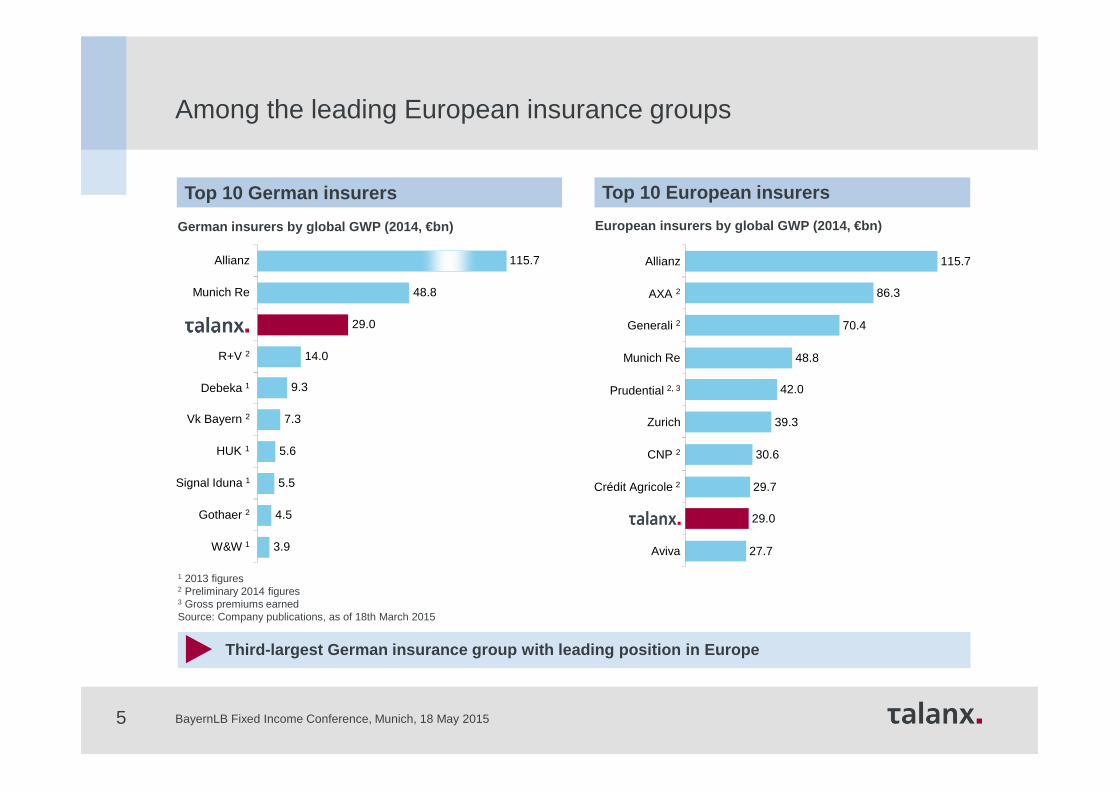
European insurers by global GWP (2014, €bn)German insurers by global GWP (2014, €bn)
Listed insurers
1 2013 figures2 Preliminary 2014 figures3 Gross premiums earnedSource: Company publications, as of 18th March 2015
Top 10 European insurersTop 10 German insurers
Third-largest German insurance group with leading p osition in Europe
Among the leading European insurance groups
3.9
4.5
5.5
5.6
7.3
9.3
14.0
29.0
48.8
115.7
W&W 1
Gothaer 2
Signal Iduna 1
HUK 1
Vk Bayern 2
Debeka 1
R+V 2
Munich Re
Allianz
27.7
29.0
29.7
30.6
39.3
42.0
48.8
70.4
86.3
115.7
Aviva
Crédit Agricole 2
CNP 2
Zurich
Prudential 2, 3
Munich Re
Generali 2
AXA 2
Allianz
BayernLB Fixed Income Conference, Munich, 18 May 2015
6
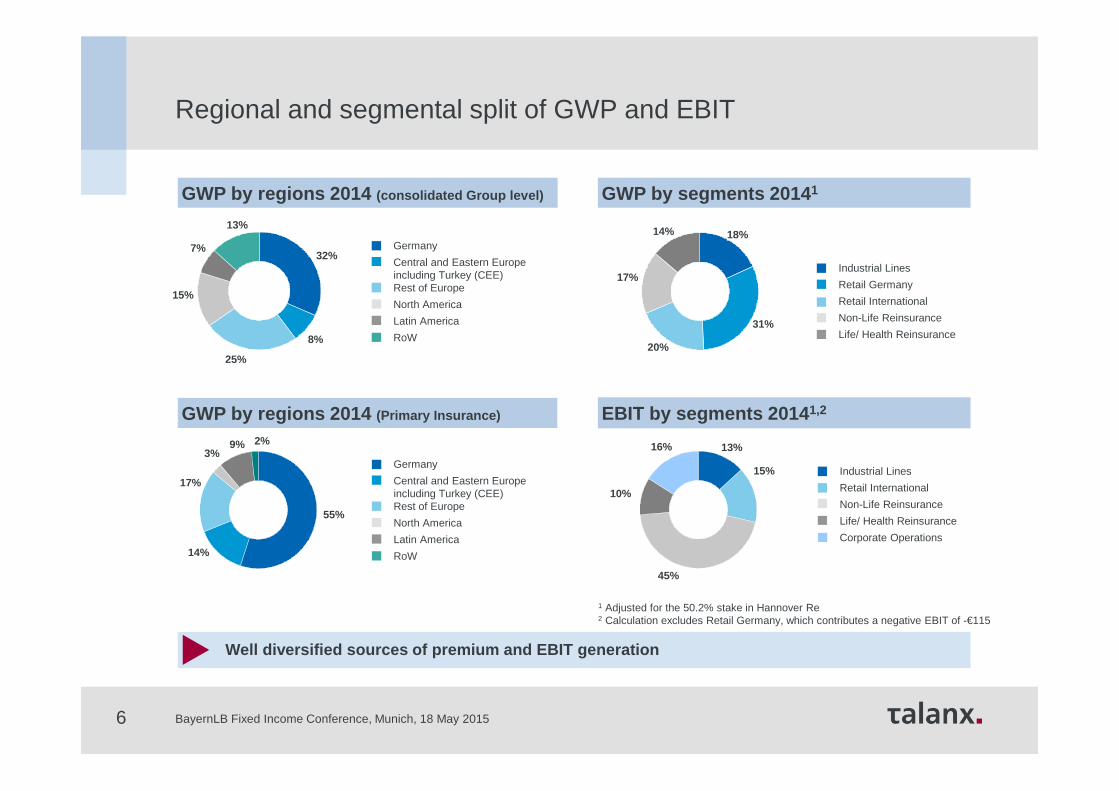
GWP by regions 2014 (Primary Insurance)
Regional and segmental split of GWP and EBIT
GWP by regions 2014 (consolidated Group level)
Germany
Central and Eastern Europe including Turkey (CEE)Rest of Europe
North America
Latin America
RoW
GWP by segments 2014 1
Industrial Lines
Retail Germany
Retail International
Non-Life Reinsurance
Life/ Health Reinsurance
EBIT by segments 2014 1,2
Industrial Lines
Retail International
Non-Life Reinsurance
Life/ Health Reinsurance
Corporate Operations
Well diversified sources of premium and EBIT genera tion
31%
13%
15%
45%
10%
16%
1 Adjusted for the 50.2% stake in Hannover Re2 Calculation excludes Retail Germany, which contributes a negative EBIT of -€115
18%
20%
17%
14%
Germany
Central and Eastern Europe including Turkey (CEE)Rest of Europe
North America
Latin America
RoW
32%
8%
25%
15%
7%
13%
55%
14%
17%
3%9% 2%
BayernLB Fixed Income Conference, Munich, 18 May 2015
7
Industrial Lines
Retail Germany
Retail International
Reinsurance
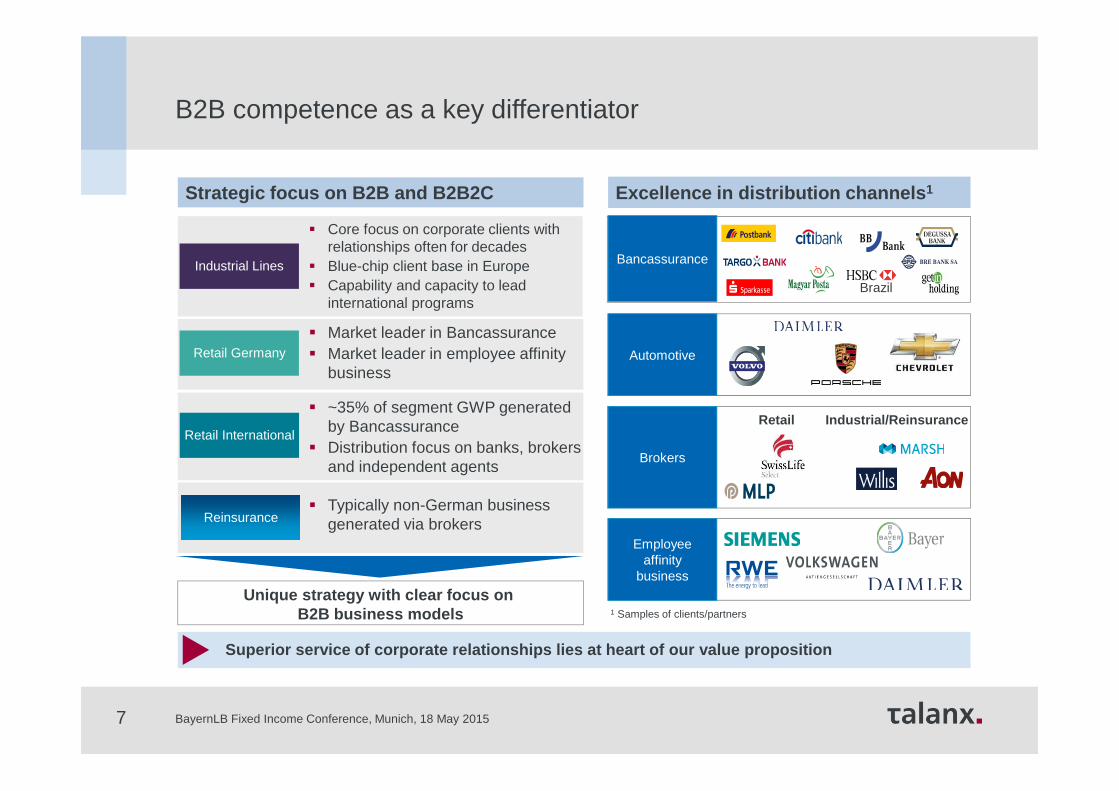
� Market leader in Bancassurance� Market leader in employee affinity
business
� Core focus on corporate clients with relationships often for decades
� Blue-chip client base in Europe� Capability and capacity to lead
international programs
� ~35% of segment GWP generatedby Bancassurance
� Distribution focus on banks, brokers and independent agents
� Typically non-German business generated via brokers
Unique strategy with clear focus on B2B business models
Strategic focus on B2B and B2B2C Excellence in distribution channels 1
Brokers
Bancassurance
Automotive
Employee affinity
business
Retail Industrial/Reinsurance
Brazil
Superior service of corporate relationships lies at heart of our value proposition
B2B competence as a key differentiator
1 Samples of clients/partners
BayernLB Fixed Income Conference, Munich, 18 May 2015

8
Industrial Lines Retail Germany Retail International Reinsurance Selected examples
Right of first choice for Hannover Re to underwrite business from Talanx’s primary insurance companies
Opportunity for higher retention on Group level
Retail International acting as entry pointand (licensed) platform to write industrial risk in new markets
Business relationships by Industrial Lines help to sell retail policies (employee affinity business, auto dealerships)
Leveraging expertise across Talanx Group (“best practice”), e.g. productdevelopment, underwriting capabilities, Bancassurance know-how
Opportunities for Group-wide synergies
Group-wide cooperation and “best practice” approach c reates value for Talanx Group
Group-wide asset management unit (Talanx Asset Management)
Securing reinsurance support
Fronting arrangements to expand global footprint
Market entry support
Support acquisition and product distribution
Leveraging expertise across the Group
Synergy benefits from shared back-office, IT and reinsurance procurement
BayernLB Fixed Income Conference, Munich, 18 May 2015
9
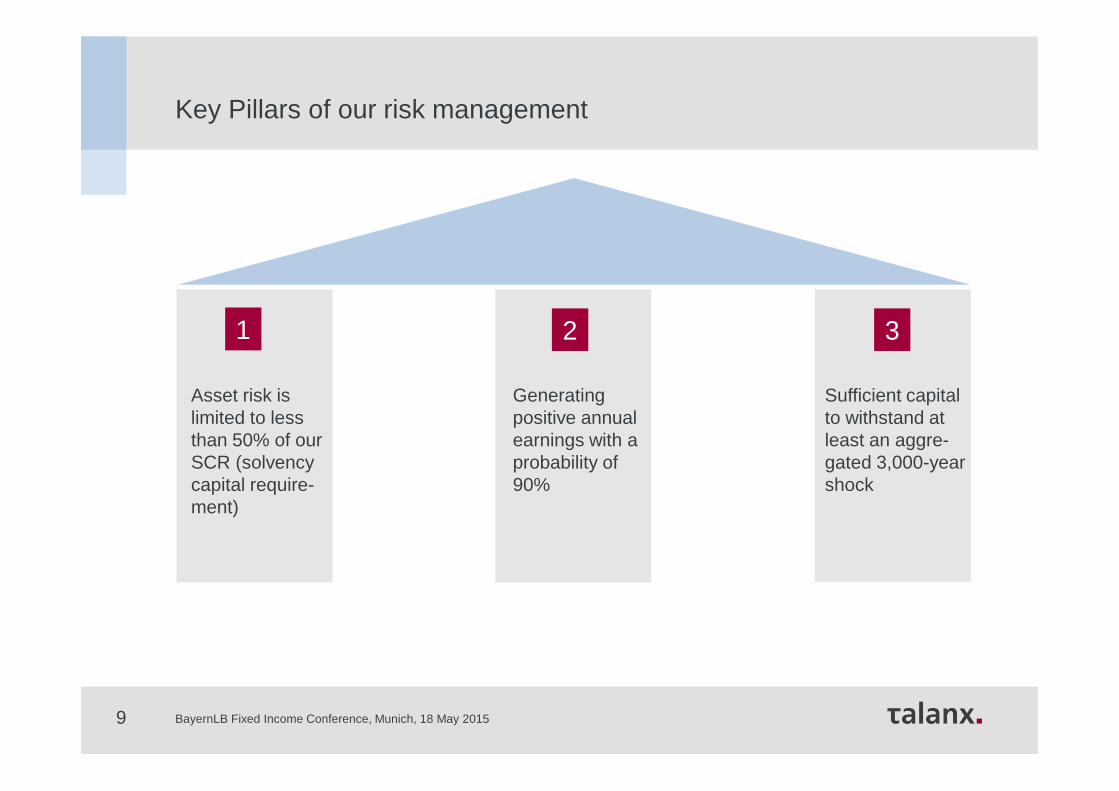
Key Pillars of our risk management
Asset risk is limited to less than 50% of our SCR (solvency capital require-ment)
Generating positive annual earnings with a probability of 90%
Sufficient capital to withstand at least an aggre-gated 3,000-year shock
1 2 3
BayernLB Fixed Income Conference, Munich, 18 May 2015
10
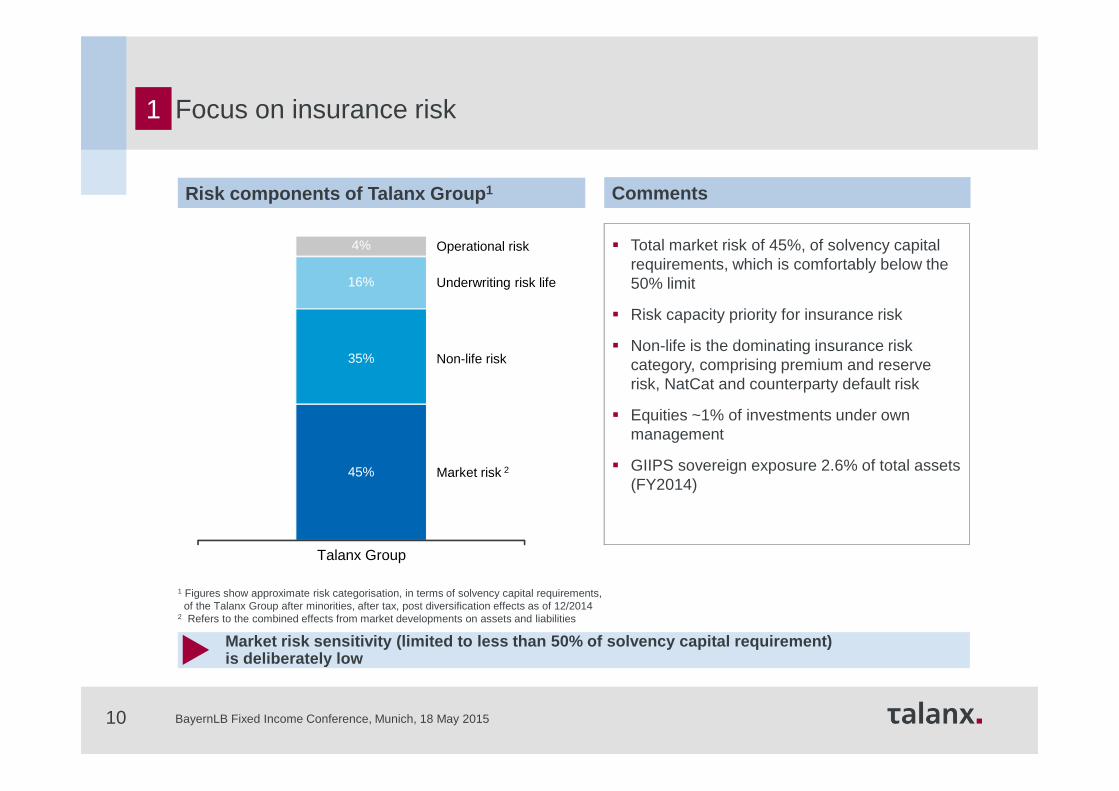
Market risk 2
Non-life risk
Underwriting risk life
Operational risk � Total market risk of 45%, of solvency capital requirements, which is comfortably below the 50% limit
� Risk capacity priority for insurance risk
� Non-life is the dominating insurance risk category, comprising premium and reserve risk, NatCat and counterparty default risk
� Equities ~1% of investments under own management
� GIIPS sovereign exposure 2.6% of total assets (FY2014)
45%
35%
16%
4%
Talanx Group
Market risk sensitivity (limited to less than 50% o f solvency capital requirement) is deliberately low
1 Figures show approximate risk categorisation, in terms of solvency capital requirements,of the Talanx Group after minorities, after tax, post diversification effects as of 12/2014
2 Refers to the combined effects from market developments on assets and liabilities
CommentsRisk components of Talanx Group 1
1 Focus on insurance risk
BayernLB Fixed Income Conference, Munich, 18 May 2015

11
2005 2006 2007 2008 2009 2010 2011 2012
7 1 2- - - 3 2
2013
2
+ Net profit – Net loss
1 Net income of Talanx after minorities, after tax based on restated figures as shown in annual reports (2004–2013 according to IFRS)2 Adjusted on the basis of IAS 83 Top 20 European listed peers, each year measured by GWP;on group level; IFRS standardsSource: Bloomberg, annual reports
Tal
anx
Gro
up a
ndpr
edec
esso
rs n
et in
com
e1
Talanx Group net income 1 (€m)
# of
loss
mak
ing
com
petit
ors3
+ + + + + + + + + +
Talanx Group net income
Robust cycle resilience due to diversification of s egments
Diversification of business model leads to earnings resilience 2
2014
-
245
394
477
183
4852
2162
5152
6262
7322 769
BayernLB Fixed Income Conference, Munich, 18 May 2015
12
3
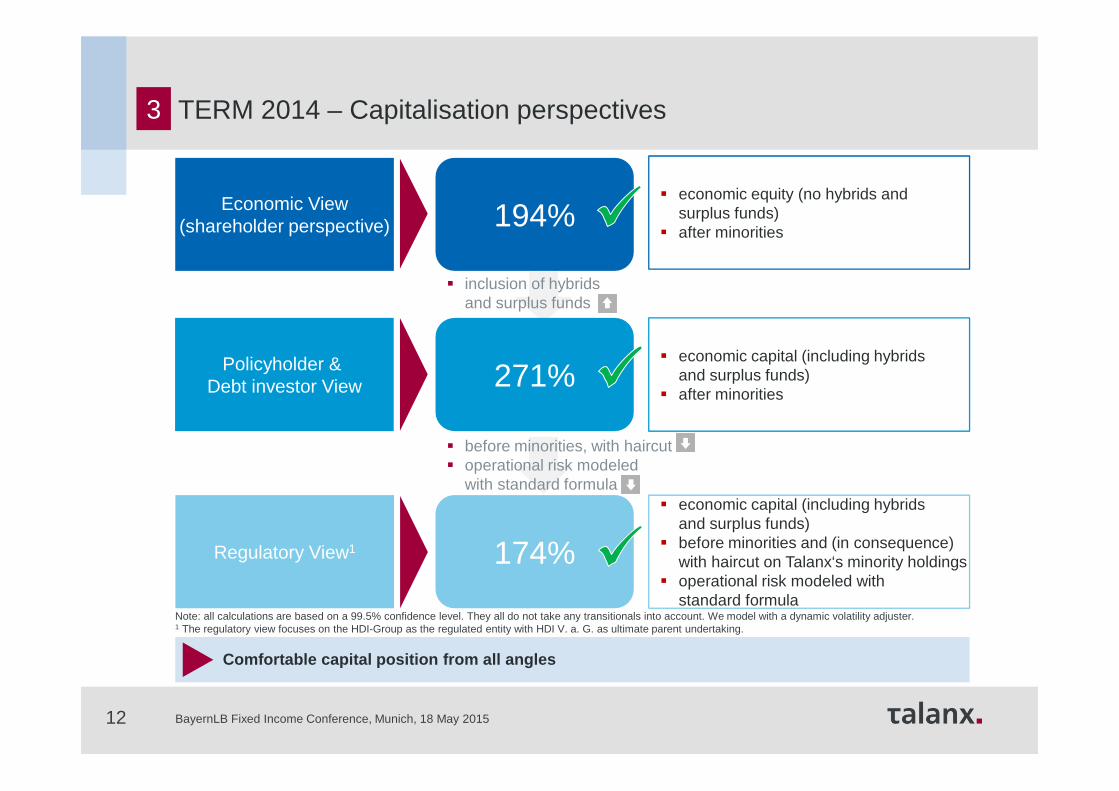
� before minorities, with haircut� operational risk modeled
with standard formula
Policyholder & Debt investor View 271%
� economic capital (including hybrids and surplus funds)
� after minorities
174%
TERM 2014 – Capitalisation perspectives
Comfortable capital position from all angles
Economic View(shareholder perspective)
Regulatory View1
Note: all calculations are based on a 99.5% confidence level. They all do not take any transitionals into account. We model with a dynamic volatility adjuster.1 The regulatory view focuses on the HDI-Group as the regulated entity with HDI V. a. G. as ultimate parent undertaking.
194%� economic equity (no hybrids and
surplus funds)� after minorities
� economic capital (including hybrids and surplus funds)
� before minorities and (in consequence)with haircut on Talanx‘s minority holdings
� operational risk modeled with standard formula
� inclusion of hybridsand surplus funds
BayernLB Fixed Income Conference, Munich, 18 May 2015
13
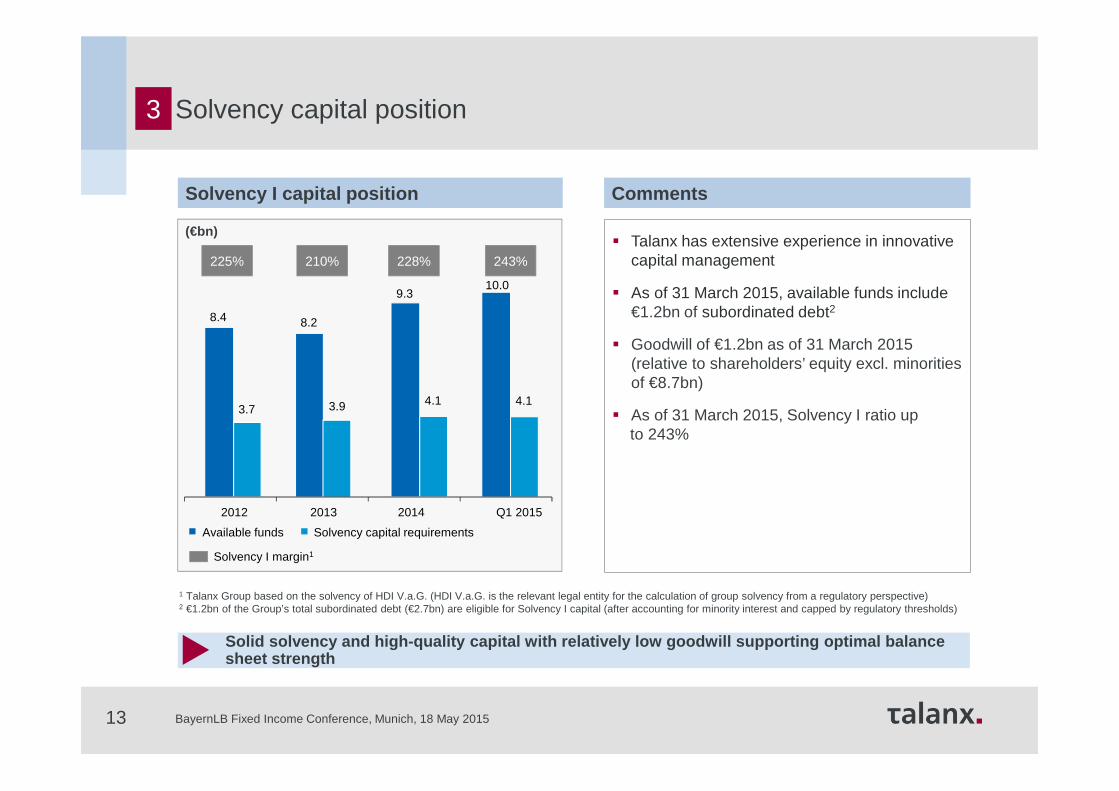
� Talanx has extensive experience in innovative capital management
� As of 31 March 2015, available funds include €1.2bn of subordinated debt2
� Goodwill of €1.2bn as of 31 March 2015(relative to shareholders’ equity excl. minorities of €8.7bn)
� As of 31 March 2015, Solvency I ratio up to 243%
(€bn)
Solid solvency and high-quality capital with relati vely low goodwill supporting optimal balance sheet strength
1 Talanx Group based on the solvency of HDI V.a.G. (HDI V.a.G. is the relevant legal entity for the calculation of group solvency from a regulatory perspective)2 €1.2bn of the Group’s total subordinated debt (€2.7bn) are eligible for Solvency I capital (after accounting for minority interest and capped by regulatory thresholds)
CommentsSolvency I capital position
Solvency I margin1
225% 210% 228% 243%
8.2
10.0
3.9 4.1
2012 2013 2014 Q1 2015
Available funds Solvency capital requirements
8.4
3.7
Solvency capital position3
9.3
4.1
BayernLB Fixed Income Conference, Munich, 18 May 2015
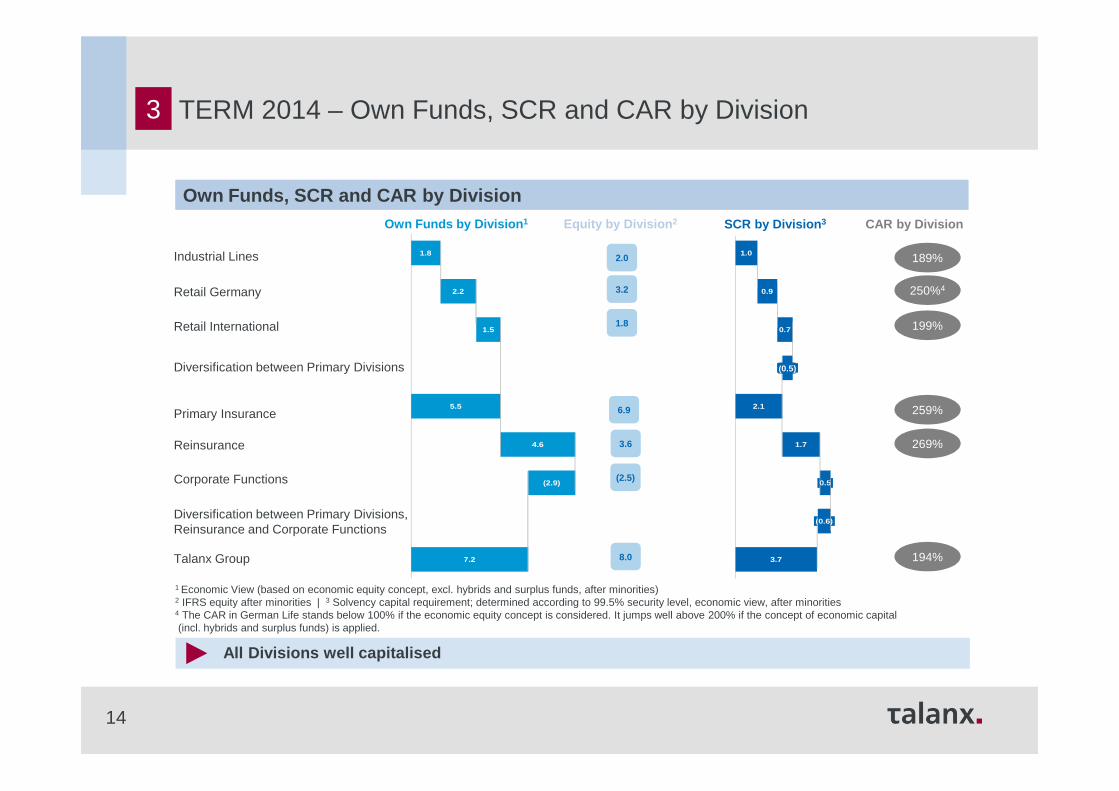
1.0
0.9
0.7
(0.6)
2.1
1.7
0.5
(0.6)
3.7
189%
250%4
199%
259%
269%
2.0
3.2
1.8
6.9
3.6
(2.5)
8.0 194%
Industrial Lines
Retail Germany
Retail International
Diversification between Primary Divisions
Primary Insurance
Reinsurance
Corporate Functions
Diversification between Primary Divisions, Reinsurance and Corporate Functions
Talanx Group
14
All Divisions well capitalised
Equity by Division 2 CAR by Division
1 Economic View (based on economic equity concept, excl. hybrids and surplus funds, after minorities)2 IFRS equity after minorities | 3 Solvency capital requirement; determined according to 99.5% security level, economic view, after minorities4 The CAR in German Life stands below 100% if the economic equity concept is considered. It jumps well above 200% if the concept of economic capital(incl. hybrids and surplus funds) is applied.
Own Funds, SCR and CAR by DivisionOwn Funds by Division 1 SCR by Division 3
1.8
2.2
1.5
5.5
4.6
(2.9)
7.2
(0.5)
3 TERM 2014 – Own Funds, SCR and CAR by Division
Results Presentation FY2014, 23 March 2015151515
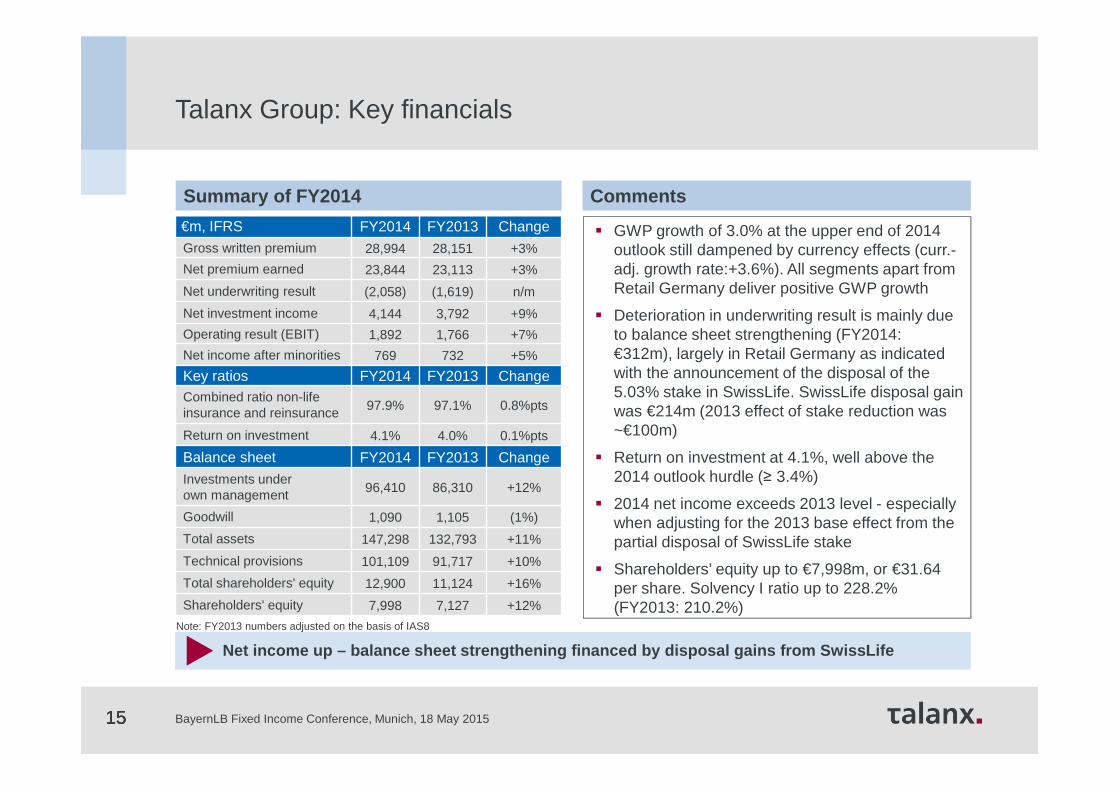
Summary of FY2014
Net income up – balance sheet strengthening financed by disposal gains from SwissLife
€m, IFRS FY2014 FY2013 ChangeGross written premium 28,994 28,151 +3%
Net premium earned 23,844 23,113 +3%
Net underwriting result (2,058) (1,619) n/m
Net investment income 4,144 3,792 +9%
Operating result (EBIT) 1,892 1,766 +7%
Net income after minorities 769 732 +5%
Key ratios FY2014 FY2013 ChangeCombined ratio non-life insurance and reinsurance 97.9% 97.1% 0.8%pts
Return on investment 4.1% 4.0% 0.1%pts
Balance sheet FY2014 FY2013 Change
Investments under own management 96,410 86,310 +12%
Goodwill 1,090 1,105 (1%)
Total assets 147,298 132,793 +11%
Technical provisions 101,109 91,717 +10%
Total shareholders' equity 12,900 11,124 +16%
Shareholders' equity 7,998 7,127 +12%
Comments
Note: FY2013 numbers adjusted on the basis of IAS8
� GWP growth of 3.0% at the upper end of 2014 outlook still dampened by currency effects (curr.-adj. growth rate:+3.6%). All segments apart from Retail Germany deliver positive GWP growth
� Deterioration in underwriting result is mainly due to balance sheet strengthening (FY2014: €312m), largely in Retail Germany as indicated with the announcement of the disposal of the 5.03% stake in SwissLife. SwissLife disposal gain was €214m (2013 effect of stake reduction was ~€100m)
� Return on investment at 4.1%, well above the 2014 outlook hurdle (≥ 3.4%)
� 2014 net income exceeds 2013 level - especially when adjusting for the 2013 base effect from the partial disposal of SwissLife stake
� Shareholders’ equity up to €7,998m, or €31.64 per share. Solvency I ratio up to 228.2% (FY2013: 210.2%)
Talanx Group: Key financials
BayernLB Fixed Income Conference, Munich, 18 May 2015
Results Presentation FY2014, 23 March 20151616
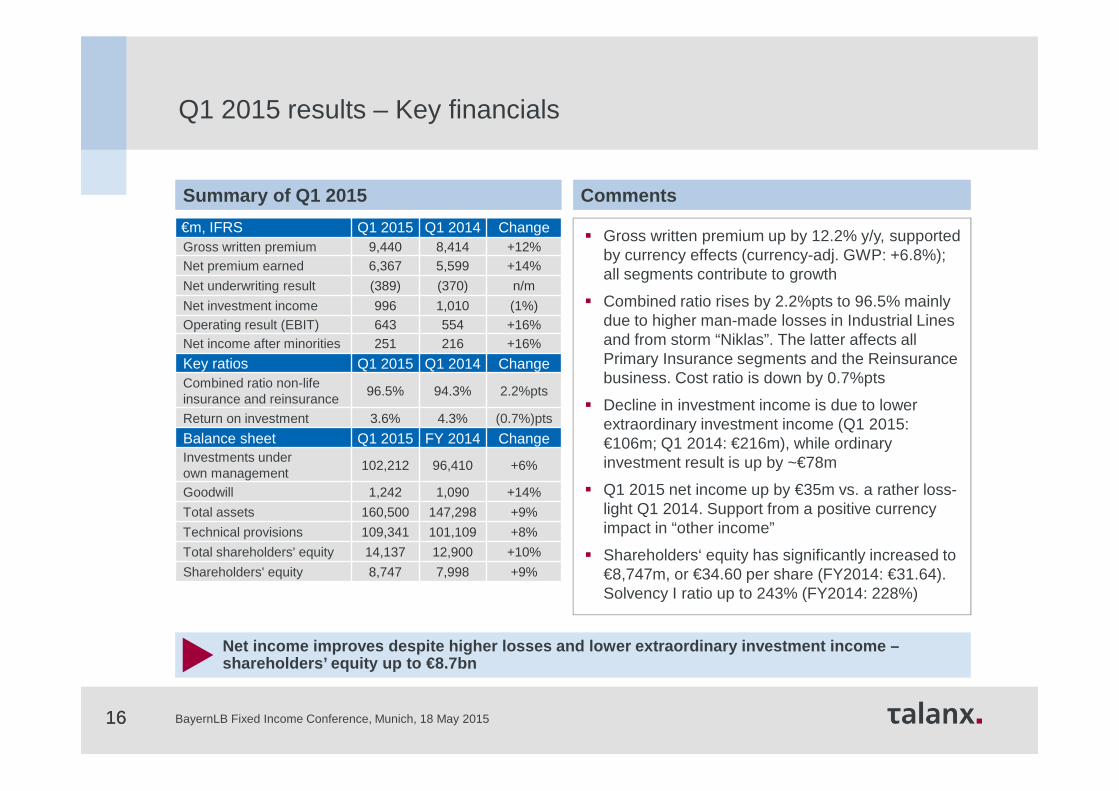
Summary of Q1 2015
Net income improves despite higher losses and lower extraordinary investment income –shareholders’ equity up to €8.7bn
€m, IFRS Q1 2015 Q1 2014 ChangeGross written premium 9,440 8,414 +12%Net premium earned 6,367 5,599 +14%
Net underwriting result (389) (370) n/m
Net investment income 996 1,010 (1%)Operating result (EBIT) 643 554 +16%Net income after minorities 251 216 +16%
Key ratios Q1 2015 Q1 2014 ChangeCombined ratio non-life insurance and reinsurance
96.5% 94.3% 2.2%pts
Return on investment 3.6% 4.3% (0.7%)pts
Balance sheet Q1 2015 FY 2014 ChangeInvestments under own management
102,212 96,410 +6%
Goodwill 1,242 1,090 +14%
Total assets 160,500 147,298 +9%
Technical provisions 109,341 101,109 +8%
Total shareholders' equity 14,137 12,900 +10%
Shareholders' equity 8,747 7,998 +9%
Comments
� Gross written premium up by 12.2% y/y, supported by currency effects (currency-adj. GWP: +6.8%); all segments contribute to growth
� Combined ratio rises by 2.2%pts to 96.5% mainly due to higher man-made losses in Industrial Lines and from storm “Niklas”. The latter affects all Primary Insurance segments and the Reinsurance business. Cost ratio is down by 0.7%pts
� Decline in investment income is due to lower extraordinary investment income (Q1 2015: €106m; Q1 2014: €216m), while ordinary investment result is up by ~€78m
� Q1 2015 net income up by €35m vs. a rather loss-light Q1 2014. Support from a positive currency impact in “other income”
� Shareholders‘ equity has significantly increased to €8,747m, or €34.60 per share (FY2014: €31.64). Solvency I ratio up to 243% (FY2014: 228%)
Q1 2015 results – Key financials
BayernLB Fixed Income Conference, Munich, 18 May 2015
17
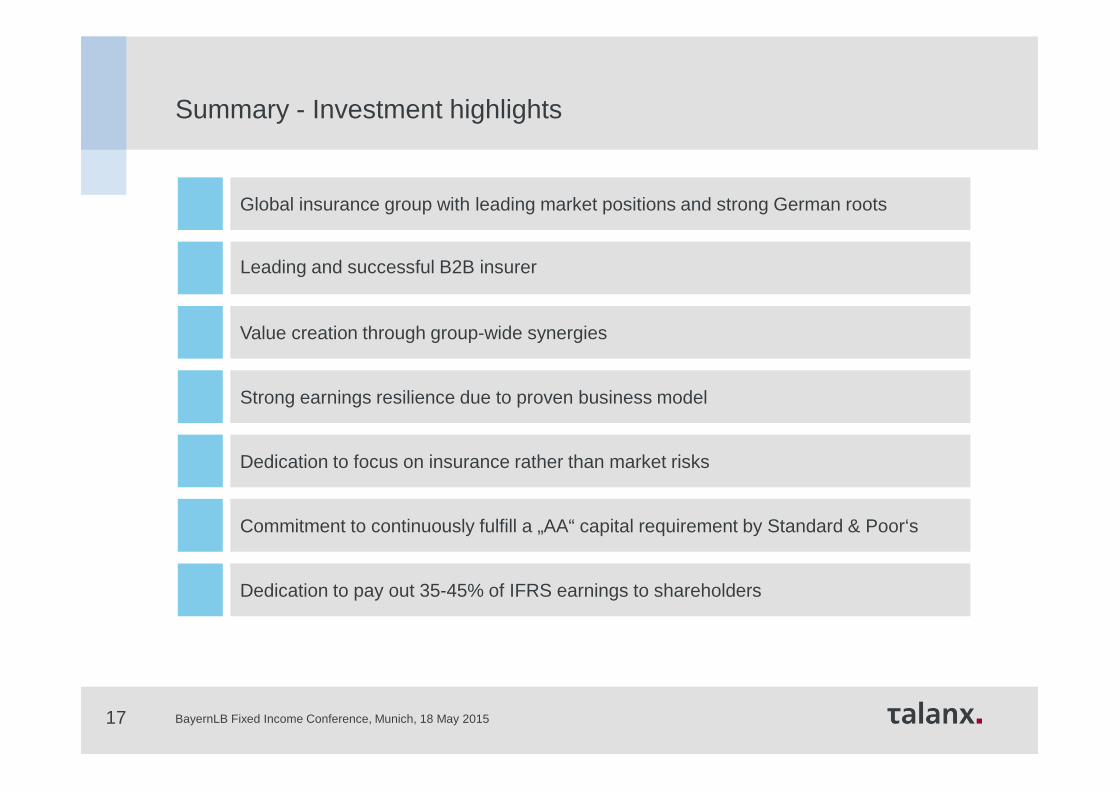
Summary - Investment highlights
Global insurance group with leading market positions and strong German roots
Dedication to focus on insurance rather than market risks
Value creation through group-wide synergies
Strong earnings resilience due to proven business model
Leading and successful B2B insurer
Commitment to continuously fulfill a „AA“ capital requirement by Standard & Poor‘s
Dedication to pay out 35-45% of IFRS earnings to shareholders
BayernLB Fixed Income Conference, Munich, 18 May 2015
1818
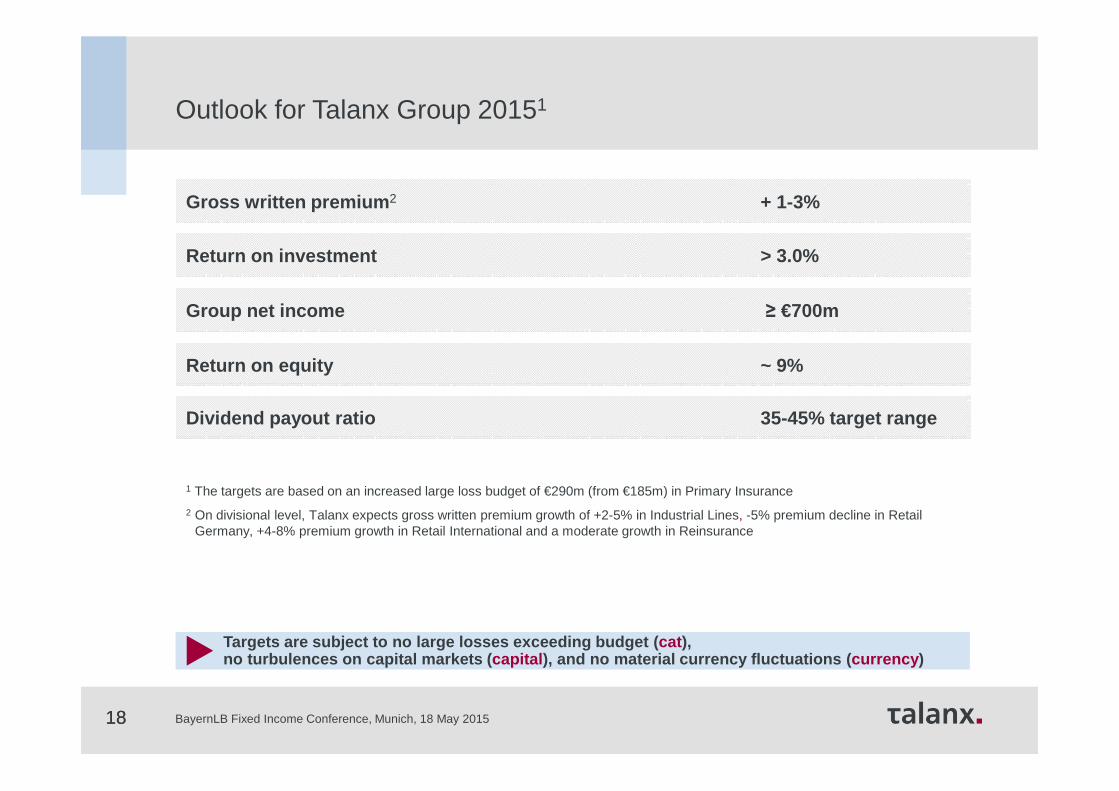
Targets are subject to no large losses exceeding bu dget ( cat ), no turbulences on capital markets ( capital ), and no material currency fluctuations ( currency )
Gross written premium 2 + 1-3%
Return on investment > 3.0%
Group net income ≥ €700m
Return on equity ~ 9%
Dividend payout ratio 35-45% target range
1 The targets are based on an increased large loss budget of €290m (from €185m) in Primary Insurance
2 On divisional level, Talanx expects gross written premium growth of +2-5% in Industrial Lines, -5% premium decline in Retail Germany, +4-8% premium growth in Retail International and a moderate growth in Reinsurance
Outlook for Talanx Group 20151
BayernLB Fixed Income Conference, Munich, 18 May 2015
19
- Debt Financing Overview -
BayernLB Fixed Income Conference, Munich, 18 May 2015

CommentsOrganisational overview
� One central function for capital and liquidity management
� Secure a comfortable level of liquidity at Talanx AG
� Active capital and liquidity management
� Know-how centre for capital market instruments
� Central steering of all capital markets processes in the group
� Financing of group companies at-arms-lengths
� Cost reduction in consequence of concentration of all bank relations in one function
� FX / Interest rate hedging
� Investment of Liquidity buffers
Capital markets
Treasury
capital/liquidity
dividend/interests
Banks/Investors
Subordinated Bonds
Senior Bonds
Equities
Convertibles
Credit lines
Realisation of efficiency and scale effects through central state-of-the-art treasury function.
Capital / liquidity management (excluding Hannover Re)
BayernLB Fixed Income Conference, Munich, 18 May 201520

Subordinated bond 8.367%, 30-NC-10
2012
2013
Liability management exercise
Strengthening of capitalisation of Talanx
Group
Reduction of external debt
IPO
Senior bond 3.125%, 10 years
Financing of organic and inorganic growth and partially
repay amounts outstanding under two credit facilities
Refinancing of internal debt
500
(204)
517
750
300
Latest capital market transactions (excluding Hanno ver Re)
1 conversion of the Tier 1 Meiji Yasuda bond.
April
July
Oct
€m
Capital market appearances established by liquid in struments in major market segments
April
July
Oct
Feb
April
July
Oct
Feb
Senior bond 2.50%, 12 years
2014 500Refinancing
of internal debtJuly
1
Historic market transactions
BayernLB Fixed Income Conference, Munich, 18 May 201521
2014 2015 2016 2017 2018 2019 2020 2021 2022 2023 2024 2025 2026
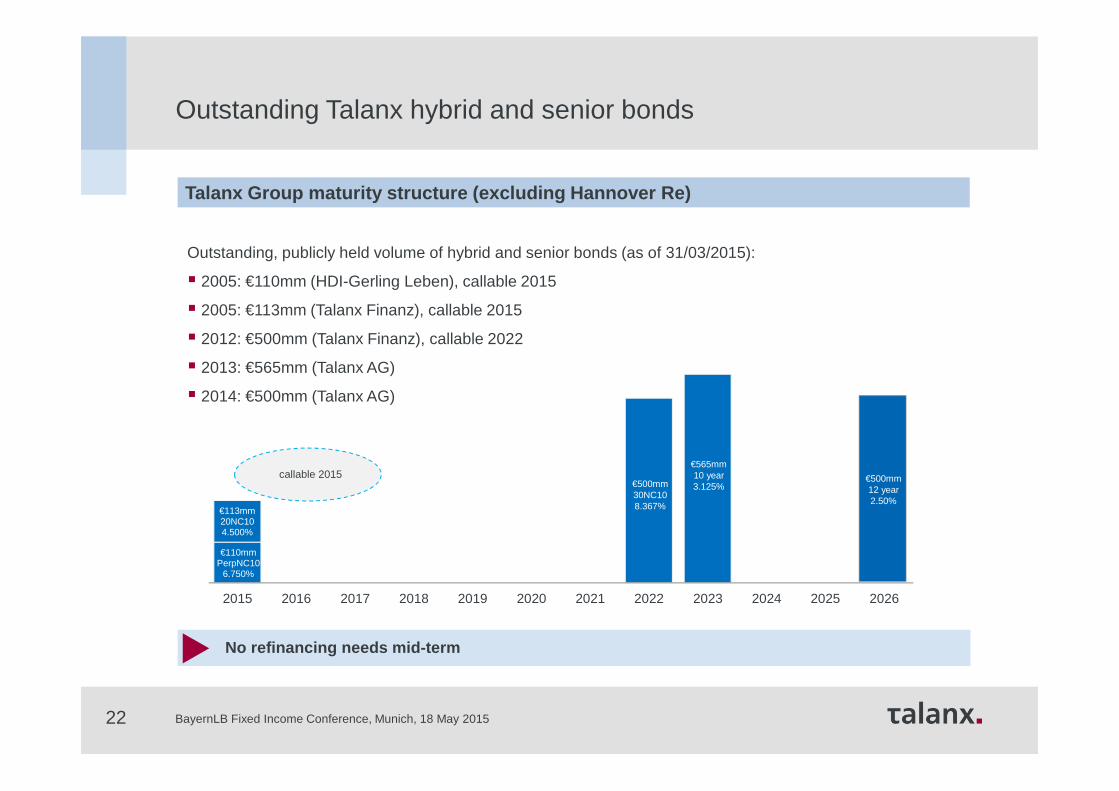
No refinancing needs mid-term
Talanx Group maturity structure (excluding Hannover Re)
Outstanding, publicly held volume of hybrid and senior bonds (as of 31/03/2015):
� 2005: €110mm (HDI-Gerling Leben), callable 2015
� 2005: €113mm (Talanx Finanz), callable 2015
� 2012: €500mm (Talanx Finanz), callable 2022
� 2013: €565mm (Talanx AG)
� 2014: €500mm (Talanx AG)
€500mm 30-nc-108.367%
€113mm 20NC104.500%
€110mm PerpNC10
6.750%
€500mm 30NC108.367%
callable 2015€565mm 10 year3.125%
€500mm 12 year 2.50%
Talanx Group maturity structure (excluding Hannover Re)
Outstanding Talanx hybrid and senior bonds
BayernLB Fixed Income Conference, Munich, 18 May 201522
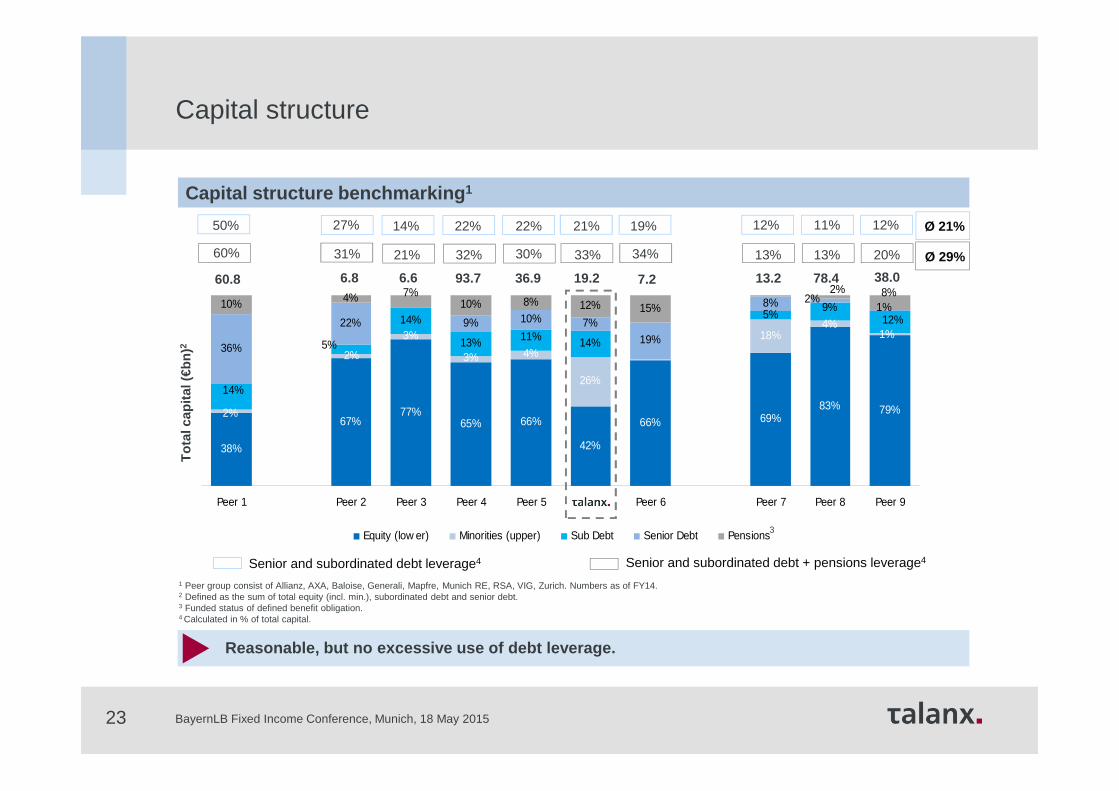
Capital structure benchmarking 1
Reasonable, but no excessive use of debt leverage.
1 Peer group consist of Allianz, AXA, Baloise, Generali, Mapfre, Munich RE, RSA, VIG, Zurich. Numbers as of FY14. 2 Defined as the sum of total equity (incl. min.), subordinated debt and senior debt.3 Funded status of defined benefit obligation.4 Calculated in % of total capital.
Senior and subordinated debt + pensions leverage4
Tot
al c
apita
l (€b
n)2
Senior and subordinated debt leverage4
50%
60%
27%
31%
14%
21%
22%
32%
22%
30%
21%
33%
19%
34%
12%
13%
11%
13%
12%
20%
Ø 21%
Ø 29%
60.8 6.8 6.6 93.7 36.9 19.2 7.2 13.2 78.4 38.0
38%
67%77%
65% 66%
42%
66% 69%83% 79%
3%
26%
18%14%
13% 14%
5%
36%
22% 9% 10% 7%
19%
8%10% 4% 10% 8% 12% 15%
1%4%
4%3%2%
2%
14%
11%5%
9%12%
1%2% 8%7% 2%
Peer 1 Peer 2 Peer 3 Peer 4 Peer 5 Talanx Peer 6 Peer 7 Peer 8 Peer 9
Equity (low er) Minorities (upper) Sub Debt Senior Debt Pensions3
Capital structure
BayernLB Fixed Income Conference, Munich, 18 May 201523
24
- Segments -
BayernLB Fixed Income Conference, Munich, 18 May 2015

25
Key figures Comments
� GWP grew by +5.1% y/y in FY2014 (currency-adjusted:+5.9%)
� Sustainable growth resulting from international activities, incl. North America and Asia Pacific
� Increased retention rate of 50.9% in FY2014 (FY2013: 44.5%) despite reinstatement premiums of €127m
� Profitability impacted by reinstatement premium (€127m in FY2014) and large losses, e.g. storm Ela in Q2 and various man-made losses
1 Based on total GWP adjusted for 50.2% share in Hannover Re2 Net, including income from interest on deposits
2014 GWP:geographic split
Share in 2014 group GWP 1
Key financials (€m) FY2011 FY2012 FY2013 FY2014 Change
Gross written premium 3,138 3,572 3,835 4,031 +5%
Net premium earned 1,375 1,608 1,744 2,022 +16%
Net underwriting result 155 79 (42) (61) n/m
Net investment income 204 247 240 268 +12%
Operating result (EBIT) 321 259 129 182 +41%
Combined ratio2 in % 88.6 95.1 102.4 103.0 +0.6%pts
Return on Equity in % 12.4 8.8 4.2 6.3 +2.1%pts
18%
2014 GWP: split by line
Industrial Lines: Overview
Talanx is a leading European industrial lines insur er with global ambitions
20%
37%
43%
GermanyEurope (excl. Germany)RoW
1%4%10%
13%
30%
42%
Property + EngineeringLiabilityMotor
MarineAccidentAviation
€4.0 bn €4.0 bn
BayernLB Fixed Income Conference, Munich, 18 May 2015

26
Relationships with large listed German companies 1 (DAX-30)
1 Lead insurer in liability or property line; Lead insurer at least in one line
Selected client acquisitions since 2013
Industrial Lines: Client relationships
Preferred lead insurer for large corporates
BayernLB Fixed Income Conference, Munich, 18 May 2015
27
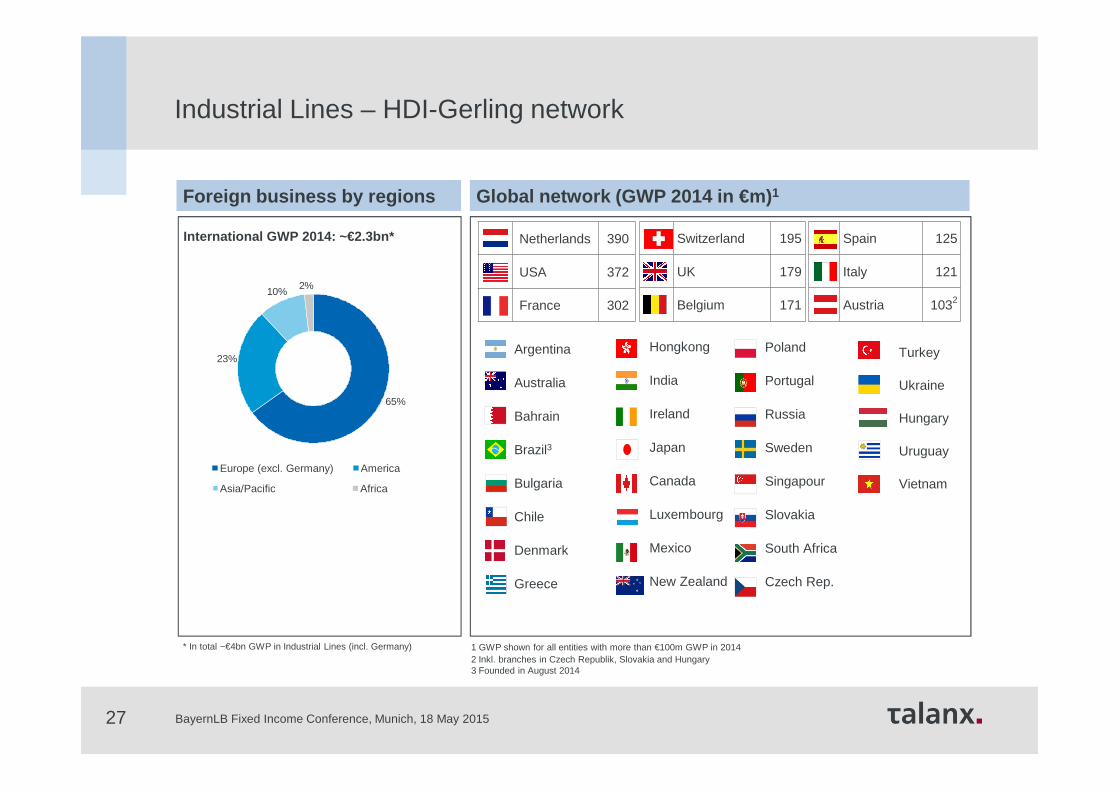
Industrial Lines – HDI-Gerling network
Global network (GWP 2014 in €m) 1Foreign business by regions
1 GWP shown for all entities with more than €100m GWP in 2014
International GWP 2014: ~€2.3bn*
* In total ~€4bn GWP in Industrial Lines (incl. Germany)
Europe (excl. Germany) America
Asia/Pacific Africa
65%
23%
10%2%
Netherlands 390
USA 372
France 302
2 Inkl. branches in Czech Republik, Slovakia and Hungary3 Founded in August 2014
Switzerland 195
UK 179
Belgium 171
Spain 125
Italy 121
Austria 1032
Argentina
Australia
Bahrain
Brazil3
Bulgaria
Chile
Denmark
Greece
Hongkong
India
Ireland
Japan
Canada
Luxembourg
Mexico
New Zealand
Poland
Portugal
Russia
Sweden
Singapour
Slovakia
South Africa
Czech Rep.
Turkey
Ukraine
Hungary
Uruguay
Vietnam
BayernLB Fixed Income Conference, Munich, 18 May 2015

28
Life GWP 2014: split by business
Share in 2014 group GWP 1
Key figures Comments
� In line with targets, slight reduction in GWP, primarily reflecting a decline in traditional Life business(FY2014: -1.4%)
� FY2014 included balance sheet strengthening of ~€290m. Adjusting for this effect, FY2014 combined ratio stood at 100.8% (Q4 2014: 103.6%)
� Adjusted FY2014 EBIT stood at €175m
� Decline in underwriting result due to balance sheet strengthening and higher capital gains (~€110m) to finance ZZR. Higher ordinary investment income contributed to bottom line
� 2014 ZZR allocation – according to HGB - of €358m (Q4 2014: €92m). In FY2014 total ZZR stock rose to ~€1.1bn
Key financials (€m) FY2011 FY2012 FY2013 FY2014 Change
Gross written premium 6,710 6,829 6,954 6,890 (1%)
Net premium earned 5,461 5,501 5,605 5,630 +0%
Net underwriting result (1,258) (1,425) (1,515) (1,953) n/m
Net investment income 1,530 1,621 1,786 1,899 +6%
Operating result (EBIT) 110 100 161 (115) n/m
Combined ratio2 in % 101.6 100.6 102.4 108.6 +6.2%pts
Return on Equity in % 2.7 4.8 3.0 (2.9) n/m1 Based on total GWP adjusted for 50.2% share in Hannover Re2 Including interest income on funds withheld and contract deposits; net, property/casualty only
32%
P&C GWP 2013: split by line
Retail Germany: Overview
Profitability numbers in Retail Germany affected by balance sheet strengthening measures
20%
18%
48%6%
8%
PropertyAccident
OtherCasualtyMotor
€1.5bn€5.4 bn
Unit-linked OtherRisk ProductsTraditional
53%2%
32%
13%
BayernLB Fixed Income Conference, Munich, 18 May 2015
29
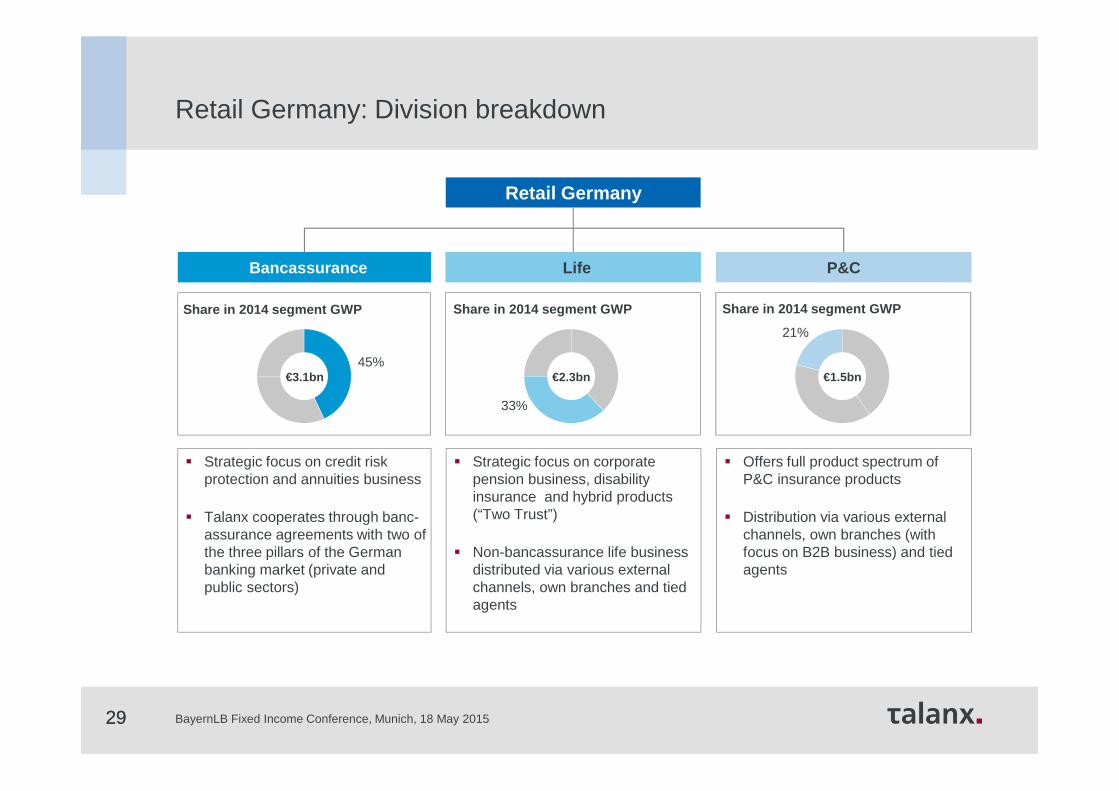
Retail Germany
� Offers full product spectrum of P&C insurance products
� Distribution via various external channels, own branches (with focus on B2B business) and tied agents
� Strategic focus on corporate pension business, disability insurance and hybrid products (“Two Trust”)
� Non-bancassurance life business distributed via various external channels, own branches and tied agents
� Strategic focus on credit risk protection and annuities business
� Talanx cooperates through banc-assurance agreements with two of the three pillars of the German banking market (private and public sectors)
Bancassurance P&CLife
€2.3bn€3.1bn €1.5bn45%
33%
21%
29
Retail Germany: Division breakdown
Share in 2014 segment GWP Share in 2014 segment GWP Share in 2014 segment GWP
BayernLB Fixed Income Conference, Munich, 18 May 2015
30
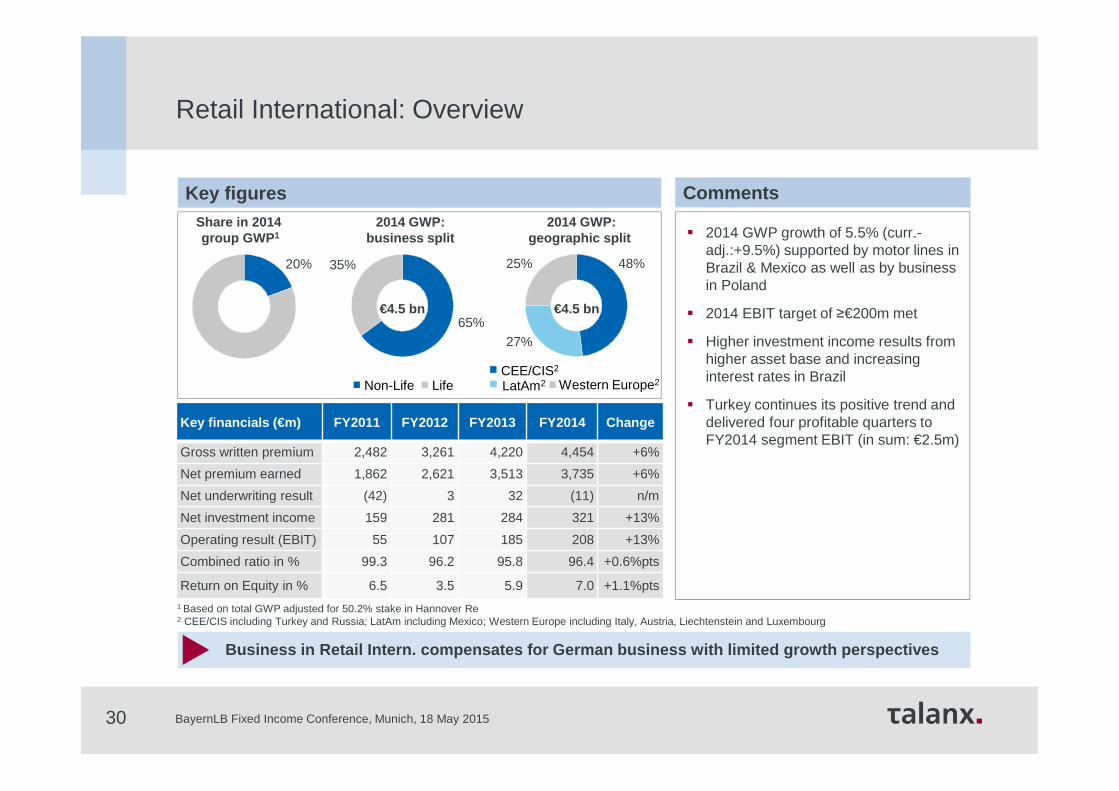
Retail International: Overview
Key figures
Key financials (€m) FY2011 FY2012 FY2013 FY2014 Change
Gross written premium 2,482 3,261 4,220 4,454 +6%
Net premium earned 1,862 2,621 3,513 3,735 +6%
Net underwriting result (42) 3 32 (11) n/m
Net investment income 159 281 284 321 +13%
Operating result (EBIT) 55 107 185 208 +13%
Combined ratio in % 99.3 96.2 95.8 96.4 +0.6%pts
Return on Equity in % 6.5 3.5 5.9 7.0 +1.1%pts
2014 GWP:geographic split
LatAm2 Western Europe2CEE/CIS2
� 2014 GWP growth of 5.5% (curr.-adj.:+9.5%) supported by motor lines in Brazil & Mexico as well as by business in Poland
� 2014 EBIT target of ≥€200m met
� Higher investment income results from higher asset base and increasing interest rates in Brazil
� Turkey continues its positive trend and delivered four profitable quarters to FY2014 segment EBIT (in sum: €2.5m)
1 Based on total GWP adjusted for 50.2% stake in Hannover Re2 CEE/CIS including Turkey and Russia; LatAm including Mexico; Western Europe including Italy, Austria, Liechtenstein and Luxembourg
Share in 2014 group GWP 1
20%
2014 GWP: business split
65%
35%
Non-Life Life
48%
27%
25%
Comments
Business in Retail Intern. compensates for German b usiness with limited growth perspectives
€4.5 bn €4.5 bn
BayernLB Fixed Income Conference, Munich, 18 May 2015
31
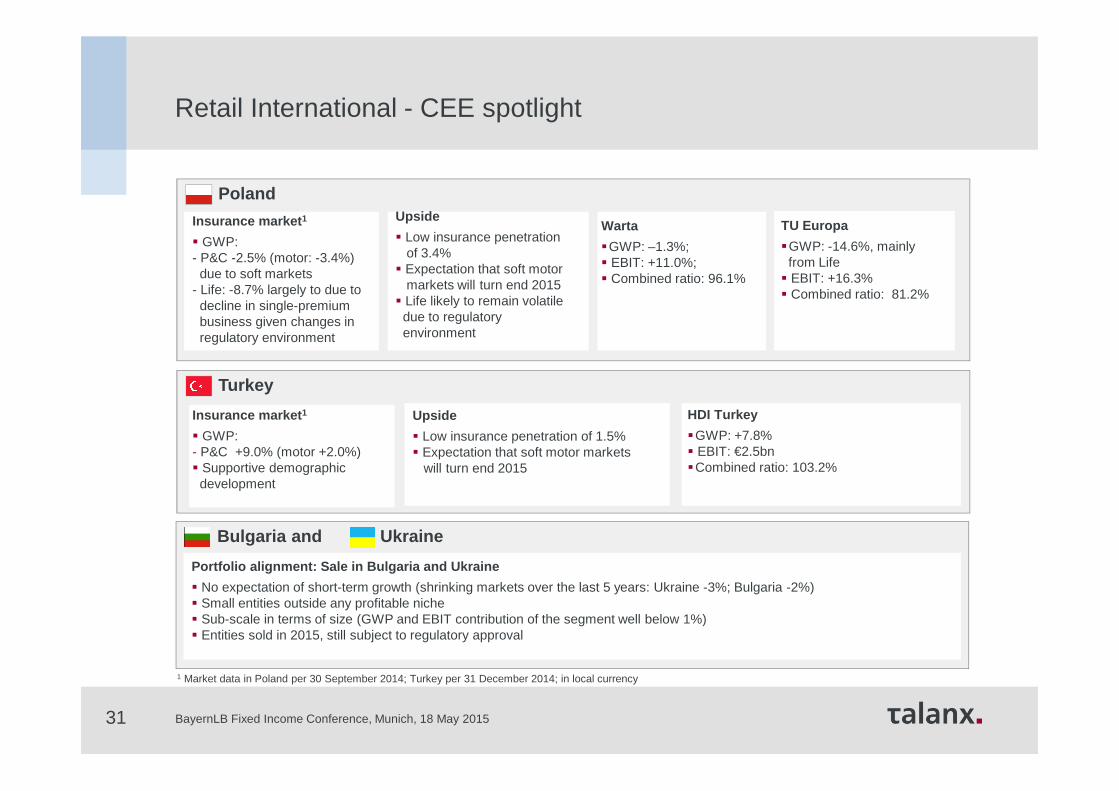
Retail International - CEE spotlight
Poland
Insurance market 1
� GWP:- P&C -2.5% (motor: -3.4%)due to soft markets
- Life: -8.7% largely to due todecline in single-premiumbusiness given changes inregulatory environment
Upside
� Low insurance penetrationof 3.4%
� Expectation that soft motormarkets will turn end 2015
� Life likely to remain volatiledue to regulatoryenvironment
TU Europa
�GWP: -14.6%, mainly from Life
� EBIT: +16.3%� Combined ratio: 81.2%
Warta
�GWP: –1.3%; � EBIT: +11.0%; � Combined ratio: 96.1%
Turkey
Insurance market 1
� GWP:- P&C +9.0% (motor +2.0%)� Supportive demographicdevelopment
Upside
� Low insurance penetration of 1.5%� Expectation that soft motor markets
will turn end 2015
HDI Turkey
�GWP: +7.8% � EBIT: €2.5bn�Combined ratio: 103.2%
Bulgaria and Ukraine
Portfolio alignment: Sale in Bulgaria and Ukraine
� No expectation of short-term growth (shrinking markets over the last 5 years: Ukraine -3%; Bulgaria -2%) � Small entities outside any profitable niche� Sub-scale in terms of size (GWP and EBIT contribution of the segment well below 1%)� Entities sold in 2015, still subject to regulatory approval
1 Market data in Poland per 30 September 2014; Turkey per 31 December 2014; in local currency
BayernLB Fixed Income Conference, Munich, 18 May 2015

32
Retail International – Latin America spotlight
Chile
Take-over of Inversiones Magallanes� Signing of contract with majority owner in December 2014� Fully consolidated from 13 February 2015 � Talanx achieves a market-leading position in Chile:
- No. 5 in P&C insurance- No. 2 in motor insurance
Brazil
Insurance market 1
� P&C: GWP growthof 11.1% (motor: 10.1%)
Upside
� Low insurancepenetration:- ~60% of vehiclesnot insured
- ~90% of privatehouseholds not insured
HDI Brazil
� GWP: +4.1%; currency-adj. +13.1%
� EBIT up by 12.6%; currrency-adj.+22.3%
� Combined ratio of 98.8%
� Fifth-largest motor insurer in Brazil� „Hermes“ award for the best motor insurer in the country
Mexico
Insurance market 1
� P&C: decline in GWP by -1.2% (motor 2.2%)
Upside
� Low insurance penetration: - More than 70% of vehicles not insured
- ~90% of privatehouseholds not insured
HDI Mexico
� GWP +7.8%; currency-adj. +11.4%
� EBIT up by 12.2%; currency-adj. +15.9%
� Combined ratio of 92.4%
� Ninth-largest motor insurer in Mexico
1 Market data per 30 September 2014 in local currency
BayernLB Fixed Income Conference, Munich, 18 May 2015

33
Key figures Comments
Key financials (€m)Non-Life Life / Health
FY2011 FY2012 FY2013 FY2014 Change FY2011 FY2012 FY2013 FY2 014 Change
Gross written premium 6,826 7,717 7,818 7,903 +1% 5,270 6,058 6,145 6,459 +5%
Net premium earned 5,961 6,854 6,866 7,011 +2% 4,789 5,426 5,359 5,411 +1%
Net investment income 880 982 811 867 +7% 512 684 611 613 +0%
Operating result (EBIT) 637 1,133 1,097 1,219 +11% 213 270 139 268 +93%
Comb.Ratio2 in % 104.2 95.8 94.9 94.7 (0.2%pts) - - - - -
GWP development (total, €bn)Share in 2014 group GWP 1
1 Based on total GWP adjusted for 50.2% share in Hannover Re2 Incl. expenses on funds withheld and contract deposits; net3 EBIT margins reflect a Talanx Group view
31%
Reinsurance
FY2011 FY2012 FY2013 FY2014 Change
Return on Equity in % 14.1 16.5 15.9 15.8 (0.1%pts)
Non Life: � Growth effects mainly from structured Reinsurance in Asia
and facultative business� Major losses of €426m (6.1% of NPE) below budget of
€670m; conservative loss reserving policy maintained� FY2014 EBIT margin3 of 17.4% (FY2013:16%) is well above
target
Life/Health:� Growth effects mainly from Australia and Longevity BATs� Improved technical result due to normalised result from
Australian disability business
Reinsurance: Overview
Hannover Re is one of the largest and most profitab le reinsurers globally
2012 2013 2014
13.8
14.0
14.3
BayernLB Fixed Income Conference, Munich, 18 May 2015

34
Hannover Re keeps its leading position in RoE ranking
Source: Hannover Re company presentation as of 10 March 2015; reflects Hannover Re’s reported numbers on a stand-alone basis
BayernLB Fixed Income Conference, Munich, 18 May 2015

35
- Appendix -
BayernLB Fixed Income Conference, Munich, 18 May 2015
3636
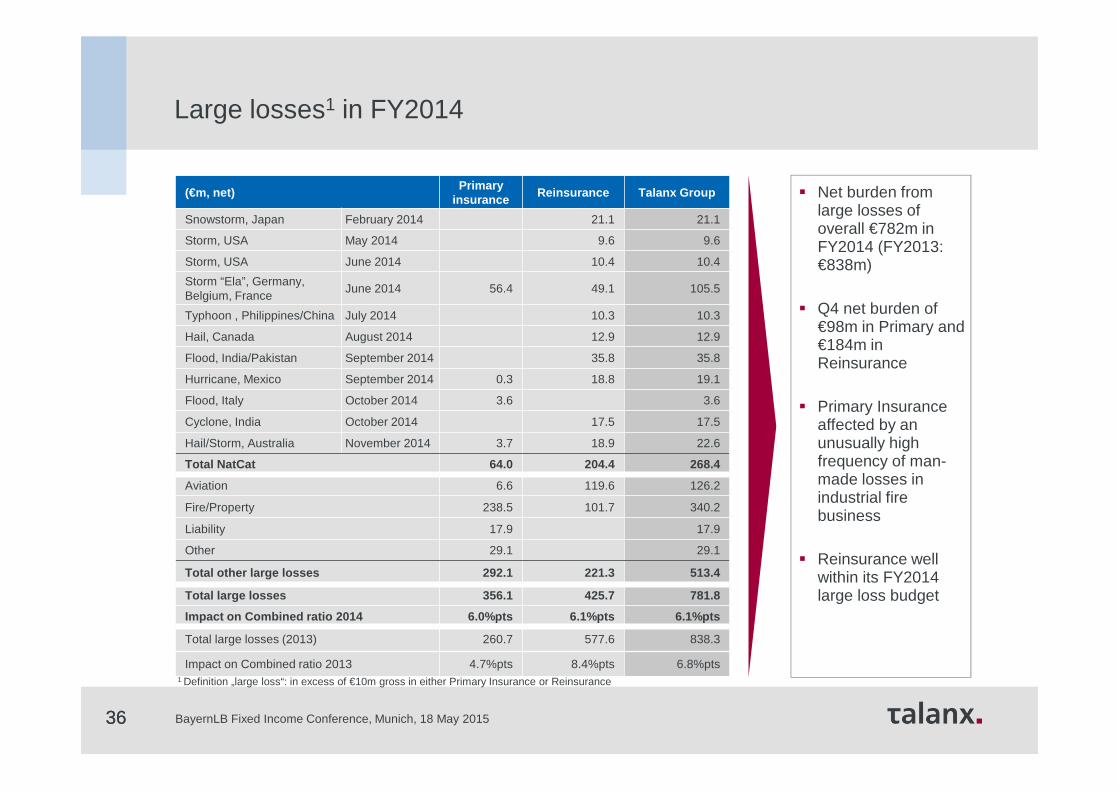
� Net burden from large losses of overall €782m in FY2014 (FY2013: €838m)
� Q4 net burden of €98m in Primary and €184m in Reinsurance
� Primary Insurance affected by an unusually high frequency of man-made losses in industrial fire business
� Reinsurance well within its FY2014 large loss budget
1 Definition „large loss“: in excess of €10m gross in either Primary Insurance or Reinsurance
Large losses1 in FY2014
(€m, net)Primary
insuranceReinsurance Talanx Group
Snowstorm, Japan February 2014 21.1 21.1
Storm, USA May 2014 9.6 9.6
Storm, USA June 2014 10.4 10.4
Storm “Ela”, Germany, Belgium, France
June 2014 56.4 49.1 105.5
Typhoon , Philippines/China July 2014 10.3 10.3
Hail, Canada August 2014 12.9 12.9
Flood, India/Pakistan September 2014 35.8 35.8
Hurricane, Mexico September 2014 0.3 18.8 19.1
Flood, Italy October 2014 3.6 3.6
Cyclone, India October 2014 17.5 17.5
Hail/Storm, Australia November 2014 3.7 18.9 22.6
Total NatCat 64.0 204.4 268.4
Aviation 6.6 119.6 126.2
Fire/Property 238.5 101.7 340.2
Liability 17.9 17.9
Other 29.1 29.1
Total other large losses 292.1 221.3 513.4
Total large losses 356.1 425.7 781.8
Impact on Combined ratio 2014 6.0%pts 6.1%pts 6.1%pts
Total large losses (2013) 260.7 577.6 838.3
Impact on Combined ratio 2013 4.7%pts 8.4%pts 6.8%pts
BayernLB Fixed Income Conference, Munich, 18 May 2015
37
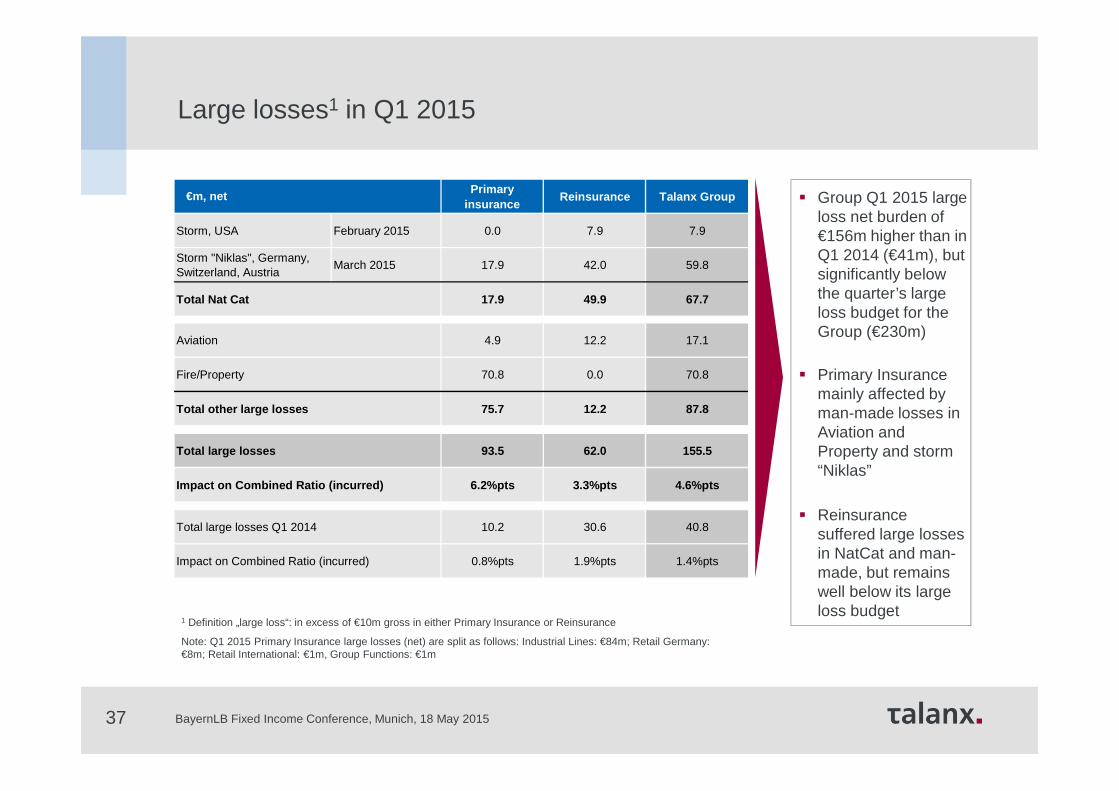
� Group Q1 2015 large loss net burden of €156m higher than in Q1 2014 (€41m), but significantly below the quarter’s large loss budget for the Group (€230m)
� Primary Insurance mainly affected by man-made losses in Aviation and Property and storm “Niklas”
� Reinsurance suffered large losses in NatCat and man-made, but remains well below its large loss budget
Large losses1 in Q1 2015
1 Definition „large loss“: in excess of €10m gross in either Primary Insurance or Reinsurance
Note: Q1 2015 Primary Insurance large losses (net) are split as follows: Industrial Lines: €84m; Retail Germany: €8m; Retail International: €1m, Group Functions: €1m
Primary insurance
Reinsurance Talanx Group
Storm, USA February 2015 0.0 7.9 7.9
Storm "Niklas", Germany, Switzerland, Austria
March 2015 17.9 42.0 59.8
Total Nat Cat 17.9 49.9 67.7
Aviation 4.9 12.2 17.1
Fire/Property 70.8 0.0 70.8
Total other large losses 75.7 12.2 87.8
Total large losses 93.5 62.0 155.5
Impact on Combined Ratio (incurred) 6.2%pts 3.3%pts 4. 6%pts
Total large losses Q1 2014 10.2 30.6 40.8
Impact on Combined Ratio (incurred) 0.8%pts 1.9%pts 1.4%pts
€m, net
BayernLB Fixed Income Conference, Munich, 18 May 2015

38
Rating overview
Standard & Poor’s A. M. Best
Grade Outlook Grade Outlook
last update 30/06/14 16/05/14
Talanx Group1 - - A Stable
Talanx Primary Group2 A+ Stable - -
last update 28/05/14 19/09/14
Hannover Re subgroup3 AA– Stable A+ Stable
rating of Talanx Primary GroupCurrent financial strength ratings
Financial strength underpinned by S&P and A.M. Best ratings
1 The designation used by A. M. Best for the Group is “Talanx AG and its leading non-life direct insurance operation and its leading life insurance operation”2 This rating applies to the core members of Talanx Primary Group (the subgroup of primary insurers in Talanx Group)3 This rating applies to Hannover Re and its major core companies. The Hannover Re subgroup corresponds to the Talanx Reinsurance segment4 Insurance Industry and Country Risk Assessment
Business Risk Profile
Strong
Financial Risk Profile
Very Strong
ERM
Strong
Management & Governance
Satisfactory
Capital & Earnings
Very Strong
IICRA 4)
Intermediate Risk
Risk Position
Intermediate
Competitive Position
Strong
Financial Flexibility
Strong
Liquidity
Exceptional
Anchor rating a+ Modifiers
Modifiers
Neutral
BayernLB Fixed Income Conference, Munich, 18 May 2015

39
Financial Calendar
12 August 2015Interim Report 6M 2015
17 September 2015Capital Markets Day
12 November 2015Interim Report 9M 2015
21 March 2016Annual Report 2015
11 May 2016Annual General Meeting
13 May 2016Interim Report 3M 2016
Contact
Talanx AGRiethorst 230659 [email protected]
Carsten Werle, CFAPhone: +49 511 3747 [email protected]
Marcus Sander, CFAPhone: +49 511 3747 [email protected]
Wiebke ErlerPhone: +49 511 3747 [email protected]
Christian MarxPhone: +49 511 3747 [email protected]
39
Talanx Investor Relations
BayernLB Fixed Income Conference, Munich, 18 May 2015

40
Disclaimer
This presentation contains forward-looking statements which are based on certain assumptions, expectations and opinions of the management of Talanx AG (the "Company") or cited from third-party sources. These statements are, therefore, subject to certain known or unknown risks and uncertainties. A variety of factors, many of which are beyond the Company’s control, affect the Company’s business activities, business strategy, results, performance and achievements. Should one or more of these factors or risks or uncertainties materialize, actual results, performance or achievements of the Company may vary materially from those expressed or implied as being expected, anticipated, intended, planned, believed, sought, estimated or projected.in the relevant forward-looking statement.
The Company does not guarantee that the assumptions underlying such forward-looking statements are free from errors nor does the Company accept any responsibility for the actual occurrence of the forecasted developments. The Company neither intends, nor assumes any obligation, to update or revise these forward-looking statements in light of developments which differ from those anticipated.
Where any information and statistics are quoted from any external source, such information or statistics should not be interpreted as having been adopted or endorsed by the Company as being accurate. Presentations of the company usually contain supplemental financial measures (e.g., return on investment, return on equity, gross/net combined ratios, solvency ratios) which the Company believes to be useful performance measures but which are not recognised as measures under International Financial Reporting Standards, as adopted by the European Union ("IFRS"). Therefore, such measures should be viewed as supplemental to, but not as substitute for, balance sheet, statement of income or cash flow statement data determined in accordance with IFRS. Since not all companies define such measures in the same way, the respective measures may not be comparable to similarly-titled measures used by other companies. This presentation is dated as of 12 May 2015. Neither the delivery of this presentation nor any further discussions of the Company with any of the recipients shall, under any circumstances, create any implication that there has been no change in the affairs of the Company since such date. This material is being delivered in conjunction with an oral presentation by the Company and should not be taken out of context.
40 BayernLB Fixed Income Conference, Munich, 18 May 2015