battelle wayfinder - ohio hospital association safety and... · the battelle wayfindertm qi...
TRANSCRIPT

BATTELLE WayFinder™ SOFTWARE USER GUIDE
User Guide Version 2.0.0 | Software Version 2.0.4
Battelle Memorial Institute
505 King Avenue
Columbus, Ohio 43201
December, 2015
BATTELLE WayFinder | September 2015 ii
Table of Contents
Page
1.0 Introduction ...................................................................................................................................... 1
OVERVIEW OF WAYFINDER MODULES ...................................................................................... 1
QUICK SETTINGS ........................................................................................................................... 2
ACCOUNT SETTINGS .................................................................................................................... 3
2.0 AHRQ QUALITY INDICATORS MODULE ....................................................................................... 5
SUMMARY MEASURES.................................................................................................................. 5
PREVENTION INDEX TAB .............................................................................................................. 7
PROPORTION OF ADVERSE EVENTS THAT ARE POTENTIALLY PREVENTABLE ................. 7
PREVENTION INDEX PERCENTILE .............................................................................................. 7
ASSOCIATED COSTS ASSOCIATED WITH ADVERSE EVENTS REPORTED IN QUALITY MEASURES ..................................................................................................................................... 8
DAYS OF CARE ASSOCIATED WITH ADVERSE EVENTS REPORTED IN QUALITY MEASURES ................................................................................................................................... 10
HOSPITAL DATA TAB ................................................................................................................... 11
3.0 AHRQ Composite Measures Module ............................................................................................. 20
AHRQ COMPOSITE MEASURES ................................................................................................. 20
AHRQ COMPOSITE MEASURES SYSTEM OVERVIEW ............................................................ 21
COMPOSITE QUALITY INDICATOR OVERVIEW ........................................................................ 24
4.0 Readmission Measures Module ..................................................................................................... 26
5.0 Priority Reports .............................................................................................................................. 33
6.0 Appendix A: DATA SOURCES ...................................................................................................... 34
7.0 Appendix B. List of Measures included in each Module ............................................................... 36
BATTELLE WayFinder | September 2015 iii
The Battelle WayFinderTM QI Dashboard is a cloud-based, quality analytics tool
that can help you understand and manage performance measurement in your
hospital.
It provides easy access to your hospital’s performance data over time, and provides
comparisons with several benchmark groups. The tool provides information on the
impact of these measures in terms of the CMS pay-for-performance program, and
also provides estimates of how these adverse events translate to increased costs and
days of care for hospitals and patients.
One innovative feature is the Priority Report, which lets you drill down into
specific patient encounters to identify adverse events that impacted your quality
measures in the past. Another advanced feature is an analysis of the characteristics
of patients who experienced adverse events, and whether those characteristics were
associated with increased or decreased risk of experiencing an adverse event.
These two tools can help you to identify patterns and trends among patients and
their treatment that can help you to improve your management of these types of
events in the future.
All this information provides a rich set of knowledge to help you to prioritize and
address the areas of quality that are most critical for improvement in your hospital.
BATTELLE WayFinder 1
1.0 Introduction
Quality measures are tools that provide valuable feedback about your hospital’s performance in
important areas. These measures are used by the federal government to improve performance, to
establish payments based on performance, and to provide comparative information to patients to
inform their decision making. Because of these important roles that quality measures play, it is
valuable for your hospital to be able to have timely and relevant information about these
measures. This timeliness and relevance is exactly what WayFinder provides.
There are several levels of detail about different types of quality measures for each hospital that
you can access through WayFinder. General measures, composite measures and re-admission
measures are all available through this single data platform. Each of these measures can be
compared to several benchmarks, including National, State, geographical region, hospitals of
similar size, type of hospital, and several others. More detail about these three types of measures
and how to access the data in WayFinder is described below. For information on the data
sources for these measures, please see Appendix A.
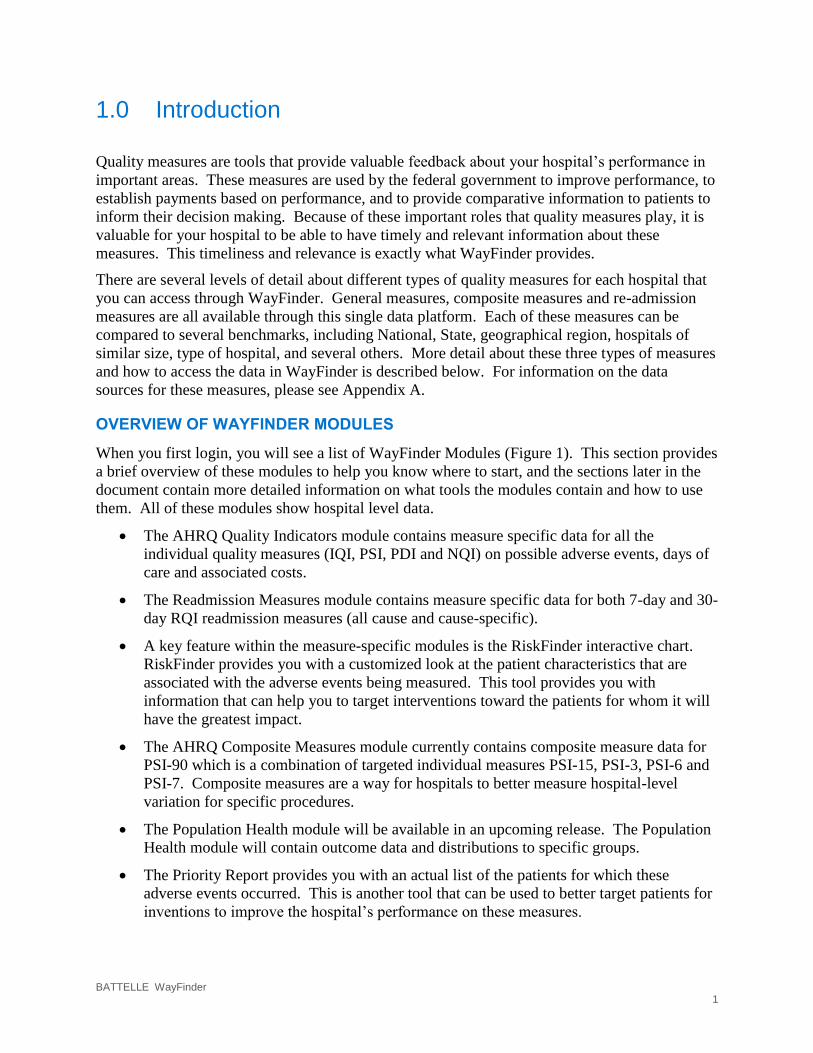
OVERVIEW OF WAYFINDER MODULES
When you first login, you will see a list of WayFinder Modules (Figure 1). This section provides
a brief overview of these modules to help you know where to start, and the sections later in the
document contain more detailed information on what tools the modules contain and how to use
them. All of these modules show hospital level data.
The AHRQ Quality Indicators module contains measure specific data for all the
individual quality measures (IQI, PSI, PDI and NQI) on possible adverse events, days of
care and associated costs.
The Readmission Measures module contains measure specific data for both 7-day and 30-
day RQI readmission measures (all cause and cause-specific).
A key feature within the measure-specific modules is the RiskFinder interactive chart.
RiskFinder provides you with a customized look at the patient characteristics that are
associated with the adverse events being measured. This tool provides you with
information that can help you to target interventions toward the patients for whom it will
have the greatest impact.
The AHRQ Composite Measures module currently contains composite measure data for
PSI-90 which is a combination of targeted individual measures PSI-15, PSI-3, PSI-6 and
PSI-7. Composite measures are a way for hospitals to better measure hospital-level
variation for specific procedures.
The Population Health module will be available in an upcoming release. The Population
Health module will contain outcome data and distributions to specific groups.
The Priority Report provides you with an actual list of the patients for which these
adverse events occurred. This is another tool that can be used to better target patients for
inventions to improve the hospital’s performance on these measures.
BATTELLE WayFinder 2
Figure 1 - Landing Page with WayFinder Modules
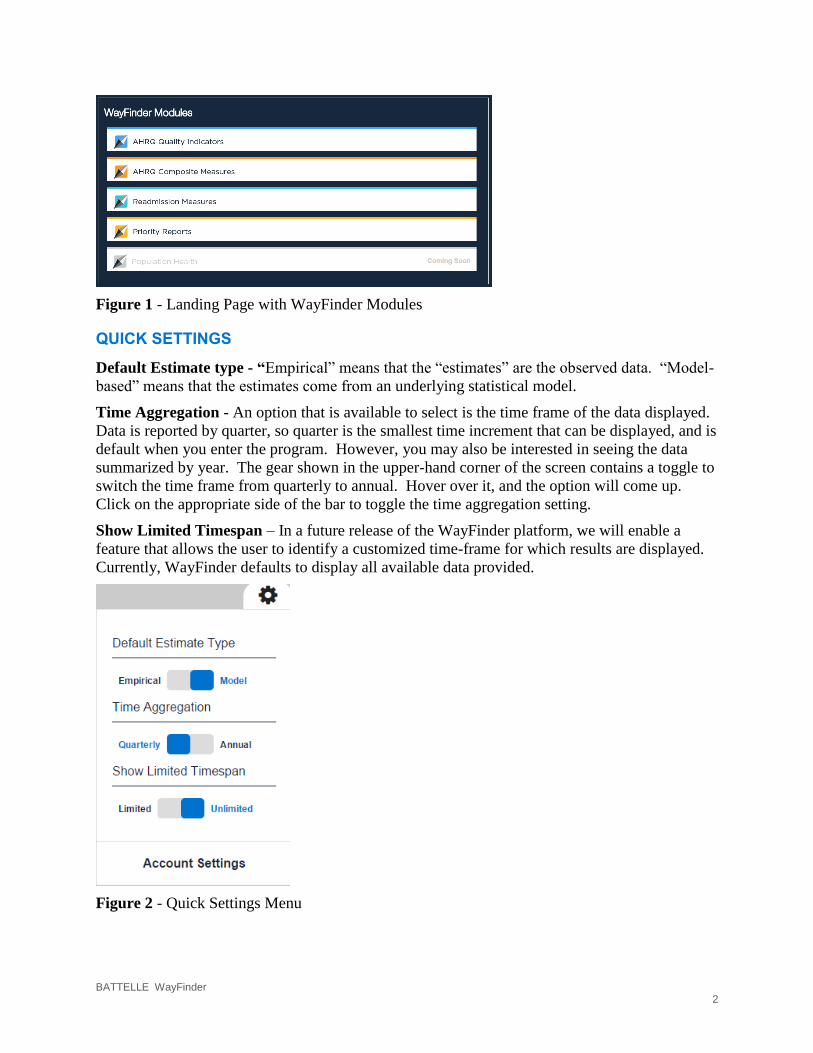
QUICK SETTINGS
Default Estimate type - “Empirical” means that the “estimates” are the observed data. “Model-
based” means that the estimates come from an underlying statistical model.
Time Aggregation - An option that is available to select is the time frame of the data displayed.
Data is reported by quarter, so quarter is the smallest time increment that can be displayed, and is
default when you enter the program. However, you may also be interested in seeing the data
summarized by year. The gear shown in the upper-hand corner of the screen contains a toggle to
switch the time frame from quarterly to annual. Hover over it, and the option will come up.
Click on the appropriate side of the bar to toggle the time aggregation setting.
Show Limited Timespan – In a future release of the WayFinder platform, we will enable a
feature that allows the user to identify a customized time-frame for which results are displayed.
Currently, WayFinder defaults to display all available data provided.
Figure 2 - Quick Settings Menu

BATTELLE WayFinder 3
ACCOUNT SETTINGS
User Profile Settings - User profile settings can be accessed by following the “Account
Settings” link at the bottom of the Quick Settings menu. On this screen, all your user
information is shown. The password for the user profile can be updated in the login information
section. You can make any changes he re and click “Save Changes.”
Figure 3 – User Profile Settings
WayFinder Default Settings - For setting overall system defaults, select “Edit Defaults.”
Under this view, the option to modify the time aggregation level is offered again, in addition to
the three items listed below. An explanation for each of these options is included below. If
changed here, these default selections will impact all the tables and graphs that you access during
this session. Often, there are options offered to change time frames or benchmark groups within
a specific table or graph, and you can use those to change that specific item, but the default as
you move to other tables and graphs are set here.

BATTELLE WayFinder 4
Figure 4 – WayFinder Default Settings
Default Time Aggregation: Select the default display value of Annual or Quarterly
Default Estimate Type: Select the default display value of Modeled or Empirical
Default Benchmark: Select the default benchmark (National, State, and other options
based on your hospital type)
Default Organization: Not yet implemented
Suppress Warnings: Select the checkbox “Do not show warnings (e.g. Invalid Benchmark,
Invalid Indicator, etc.) to suppress a warning message such as the message in Figure 5.
Figure 5 – Benchmark Warning Message
If you change one or more of these default settings you must select “Save Changes” before
navigating away from this page. To navigate away from this page once you have saved your
changes, just click on one of the options in the top menu.
BATTELLE WayFinder 5
2.0 AHRQ QUALITY INDICATORS MODULE
The AHRQ Quality Indicators module contains information on the general measures related to
adverse events. Table B-1 in the appendix lists all the measures that are included in this module.
SUMMARY MEASURES
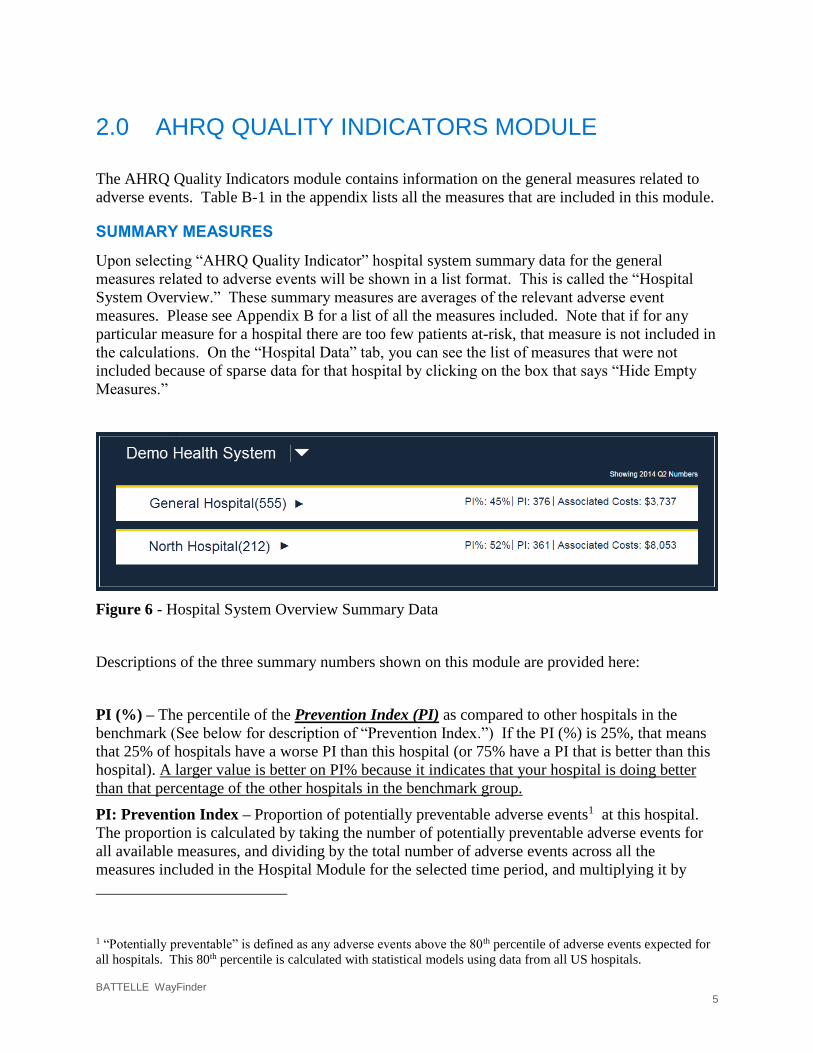
Upon selecting “AHRQ Quality Indicator” hospital system summary data for the general
measures related to adverse events will be shown in a list format. This is called the “Hospital
System Overview.” These summary measures are averages of the relevant adverse event
measures. Please see Appendix B for a list of all the measures included. Note that if for any
particular measure for a hospital there are too few patients at-risk, that measure is not included in
the calculations. On the “Hospital Data” tab, you can see the list of measures that were not
included because of sparse data for that hospital by clicking on the box that says “Hide Empty
Measures.”
Figure 6 - Hospital System Overview Summary Data
Descriptions of the three summary numbers shown on this module are provided here:
PI (%) – The percentile of the Prevention Index (PI) as compared to other hospitals in the
benchmark (See below for description of “Prevention Index.”) If the PI (%) is 25%, that means
that 25% of hospitals have a worse PI than this hospital (or 75% have a PI that is better than this
hospital). A larger value is better on PI% because it indicates that your hospital is doing better
than that percentage of the other hospitals in the benchmark group.
PI: Prevention Index – Proportion of potentially preventable adverse events1 at this hospital.
The proportion is calculated by taking the number of potentially preventable adverse events for
all available measures, and dividing by the total number of adverse events across all the
measures included in the Hospital Module for the selected time period, and multiplying it by
1 “Potentially preventable” is defined as any adverse events above the 80th percentile of adverse events expected for
all hospitals. This 80th percentile is calculated with statistical models using data from all US hospitals.

BATTELLE WayFinder 6
1000. For this metric, a smaller number is better. Smaller is better because it means only a
relatively small fraction of its adverse event were not predicted, based on the hospital’s case-mix.
If this hospital’s proportion of potentially preventable events is at the 80th percentile or lower,
then the PI is equal to zero. A higher number means that the hospital has a higher proportion of
adverse events above what is expected based on their case mix. This display shows the most
recently available time frame; data for all available time frames is shown in a graph described in
Section 2.2.1. Please refer to the companion guide, WayFinder™ Software Background and
Methods for greater detail regarding this calculation.
Associated Costs – Associated Costs are the total estimated costs that are associated with the
adverse events. These costs are estimated through modeling of discharge data. More detail is
provided below.
Looking to the upper right corner of the Hospital System Overview page in the AHRQ Quality
Indicators module (refer to Figure 6), the timeframe of coverage is shown. Unless the default
value is changed by the user, all information presented on the AHRQ Quality Indicators Module
and in the related tabs are for the timeframe listed here.
From this summary screen, if you click on the name of the hospital, detailed information will be
displayed for these general measures.
BATTELLE WayFinder 7
PREVENTION INDEX TAB
Upon clicking on the name of the hospital from the AHRQ Quality Indicators Module (Figure 4),
a screen showing multiple charts for this hospital under the tab titled “Prevention Index” is
displayed. As mentioned earlier, the “Prevention Index” is the overall proportion of adverse
events that are potentially preventable for this hospital.
PROPORTION OF ADVERSE EVENTS THAT ARE POTENTIALLY PREVENTABLE
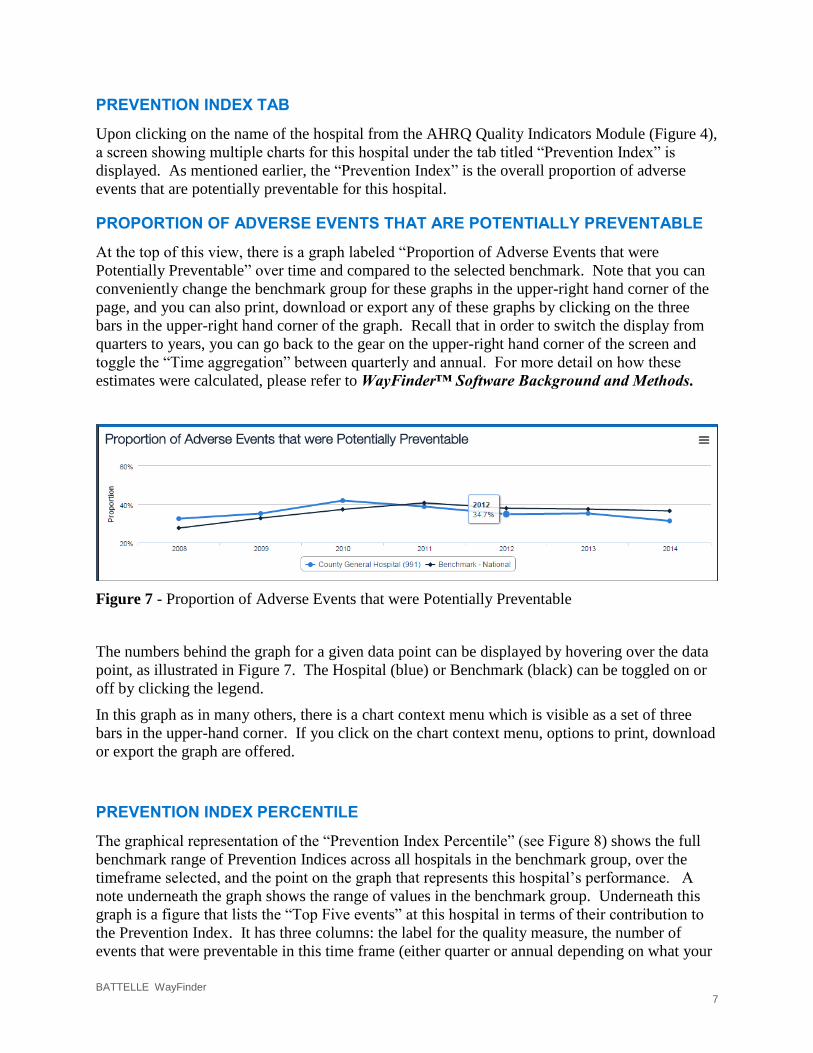
At the top of this view, there is a graph labeled “Proportion of Adverse Events that were
Potentially Preventable” over time and compared to the selected benchmark. Note that you can
conveniently change the benchmark group for these graphs in the upper-right hand corner of the
page, and you can also print, download or export any of these graphs by clicking on the three
bars in the upper-right hand corner of the graph. Recall that in order to switch the display from
quarters to years, you can go back to the gear on the upper-right hand corner of the screen and
toggle the “Time aggregation” between quarterly and annual. For more detail on how these
estimates were calculated, please refer to WayFinder™ Software Background and Methods.
Figure 7 - Proportion of Adverse Events that were Potentially Preventable
The numbers behind the graph for a given data point can be displayed by hovering over the data
point, as illustrated in Figure 7. The Hospital (blue) or Benchmark (black) can be toggled on or
off by clicking the legend.
In this graph as in many others, there is a chart context menu which is visible as a set of three
bars in the upper-hand corner. If you click on the chart context menu, options to print, download
or export the graph are offered.
PREVENTION INDEX PERCENTILE
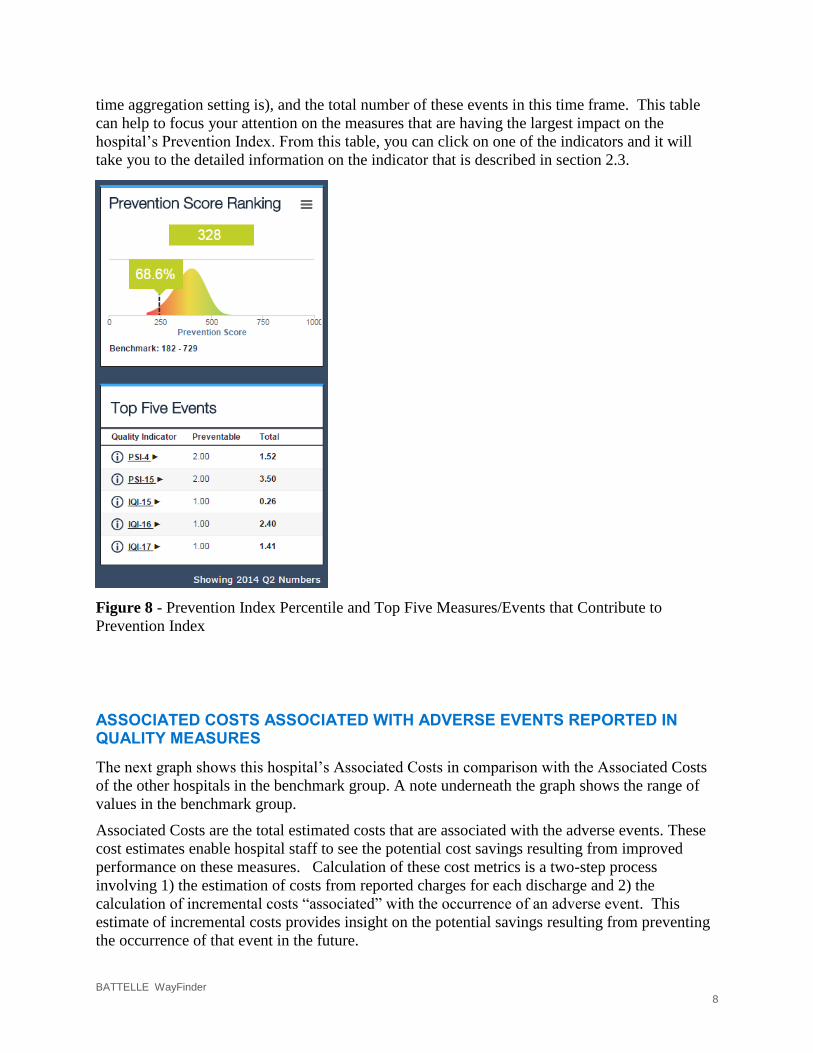
The graphical representation of the “Prevention Index Percentile” (see Figure 8) shows the full
benchmark range of Prevention Indices across all hospitals in the benchmark group, over the
timeframe selected, and the point on the graph that represents this hospital’s performance. A
note underneath the graph shows the range of values in the benchmark group. Underneath this
graph is a figure that lists the “Top Five events” at this hospital in terms of their contribution to
the Prevention Index. It has three columns: the label for the quality measure, the number of
events that were preventable in this time frame (either quarter or annual depending on what your
BATTELLE WayFinder 8
time aggregation setting is), and the total number of these events in this time frame. This table
can help to focus your attention on the measures that are having the largest impact on the
hospital’s Prevention Index. From this table, you can click on one of the indicators and it will
take you to the detailed information on the indicator that is described in section 2.3.
Figure 8 - Prevention Index Percentile and Top Five Measures/Events that Contribute to
Prevention Index
ASSOCIATED COSTS ASSOCIATED WITH ADVERSE EVENTS REPORTED IN QUALITY MEASURES
The next graph shows this hospital’s Associated Costs in comparison with the Associated Costs
of the other hospitals in the benchmark group. A note underneath the graph shows the range of
values in the benchmark group.
Associated Costs are the total estimated costs that are associated with the adverse events. These
cost estimates enable hospital staff to see the potential cost savings resulting from improved
performance on these measures. Calculation of these cost metrics is a two-step process
involving 1) the estimation of costs from reported charges for each discharge and 2) the
calculation of incremental costs “associated” with the occurrence of an adverse event. This
estimate of incremental costs provides insight on the potential savings resulting from preventing
the occurrence of that event in the future.

BATTELLE WayFinder 9
The Associated Costs are estimated from administrative claims data that include total charges for
each hospital stay. However, this charge information represents the amount that hospitals billed
for services, but does not reflect how much hospital services actually cost or the specific amounts
that hospitals received in payment. To determine cost savings for quality improvement
activities, the hospital charges must be translated into actual costs, and this is done in WayFinder
using cost-to-charge ratios. Charge information is obtained by summing total charges across
hospital stays for each hospital. Cost information is obtained from the hospital accounting reports
collected by the Centers for Medicare and Medicaid Services (CMS). Some imputation for
missing values is necessary (a weighted average for a peer group within the state). Converting
the discharge-level charge data to cost estimates involves simply multiplying total charges with
the appropriate hospital-level cost-to-charge ratio.
The calculation of incremental costs “associated” with the occurrence of an adverse event
involves matching “cases” (discharges that experienced a particular adverse event) to “controls”
(discharges in the population at risk that did not experience a particular adverse event). Cases
and controls are matched based on the predicted rate for the adverse event using the same
covariates used in the risk adjustment models (i.e. age, gender, severity and comorbidities). The
mean associated costs for the particular adverse event then equals the mean value of estimated
costs per case – estimated costs per control across all case-control matched pairs. The total
associated costs then equals the number of observed adverse events multiplied by the mean
associated costs.
Underneath this graph is a figure that lists the “Top Five Costs” at this hospital in terms of their
contribution to the total Associated Cost. It has three columns: the label for the quality indicator
that was associated with preventable adverse events in this time frame (either quarter or annual
depending on what your time aggregation setting is), and the associated cost of all these events
(even the non-preventable ones) in this time frame. This table can help to focus your attention
on the measures that are having the largest impact on the hospital’s Associated Cost. From this
table, you can click on one of the indicators and it will take you to the detailed information on
the indicator that is described in section 2.3.

BATTELLE WayFinder 10
Figure 9 - Associated Costs and Top Five Measures that Contribute to Associated Costs
DAYS OF CARE ASSOCIATED WITH ADVERSE EVENTS REPORTED IN QUALITY MEASURES
Days of Care is the total number of inpatient days that were associated with adverse events.
These are calculated using a similar methodology as used in estimating “Associated Costs.” This
is a companion metric to “Associated Costs;” they are reporting on the same impact but with
different units of measure.
This graph shows this hospital’s estimated Days of Care in comparison with the estimated Days
of Care for the other hospitals in the benchmark group. A note underneath the graph shows the
range of values in the benchmark group.
Underneath this graph is a figure that lists the “Top Five Days of Care” at this hospital in terms
of their contribution to the Prevention Index. It has three columns: the label for the quality
indicator, the days of care that were associated with the preventable event in this time frame
(either quarter or annual depending on what your time aggregation setting is), and the total
number of days of care that were associated with the total number of these events in this time
frame (even the preventable ones.) This table can help to focus your attention on the measures
that are having the largest impact on the hospital’s total number of Days of Care. From this table,
you can click on one of the indicators and it will take you to the detailed information on the
indicator that is described in section 2.3.

BATTELLE WayFinder 11
Figure 10 - Days of Care and Top Five Measures that Contribute to Days of Care
HOSPITAL DATA TAB
The “Hospital Data” tab shows the data for each measure individually. This is in comparison to
the “AHRQ Quality Indicators Module” and the “Prevention Index” tab, which display the
overall quality result for the hospital, which is an aggregation of all the quality measures. There
is a check box on this page that says “Hide Empty Measures.” When this box is unchecked, all
measures are shown; measures with insufficient data are labeled with “Too few cases” in the data
fields.

BATTELLE WayFinder 12
Figure 11 - Hospital Data Tab
2.3.1 Summary of Data by Quality Measure
There are three different options that can be displayed in this table for each measure. The default
option shown when this tab is opened is “Adverse Events.” This default can be changed to two
other options: “Days of Care” or “Associated Costs.” These three options were described in
detail in the previous section, and are briefly described here:
Adverse Events: A count of the outcome of interest for the quality measures (e.g.,
number of in-hospital deaths, number of in-hospital complications) in the specified time
frame. This count is taken from the actual hospital discharge data – this is not a modeled
number. In other words, there is a patient associated with each one of these events.
Days of Care: Total inpatient days associated with adverse events. This is a modeled
estimate.
Associated Costs: Total estimated costs associated with adverse events. This is a
modeled estimate.

BATTELLE WayFinder 13
When any of these options is selected, a table is displayed. Across the top of the table is listed:
the chosen option, the year, the quarter (if relevant), and the benchmark group. Each of these has
a drop-down box that can be used to change the data displayed. Recall that to switch from a
quarterly display to an annual display, use the gear-shaped toggle on the right-hand side of the
top of the menu.
For each of these measures, there are six columns shown in the data sheet. They are, in order:
Rank: the Rank of the Prevention Index for this hospital on this measure as compared to
the selected benchmark population. The worst hospital is ranked “1,” so bigger numbers
are better here.
Measure Label and Name: By clicking on the “Information” symbol, (i.e., the circle
with an imbedded “i”), brief technical specifications of a selected indicator is displayed,
as shown in Figure 12.
Figure 12 - Technical Specifications for a Measure
Percentile: Percentage of facilities in the benchmark group with a worse (higher)
preventability index than the selected facility. A bigger number is better here, because
that means there are fewer hospitals ranked higher than this one (e.g. a hospital with a
98% for a specific quality measure translates to a ranking in the top 5). Note: Rank and
Percentile are providing the same information in two different forms.
Observed < >: Number of adverse events/associated costs/days of care for this quality
measure, observed over the selected time frame for the selected hospital.
Expected < >: Number of adverse events/associated costs/days of care for this quality
measure based on the 1) Case mix of the hospital and 2) Reference population rate case
mix for the hospital. For more information on these adjustments, please refer to
WayFinder™ Software Background and Methods.
Risk Adjusted < >: Risk adjusted rate multiplied by the total number of cases.
Ratio of Observed vs Expected < >: The Observed divided by Expected Number of
adverse events/associated costs/days of care for this quality measure, calculated over the
selected time frame for the selected hospital. If this number is close to 1, that means the
BATTELLE WayFinder 14
hospital is close to performing as expected for this measure. If this number is much
greater than 1, that means the hospital is performing much worse than expected for this
measure. If this number is much less than 1, that means this hospital is performing much
better than expected for this measure.
2.3.2 Detailed Data for each Quality Measure
Clicking on the name of a measure on the “Hospital Data” table will bring up detailed
information on that measure.
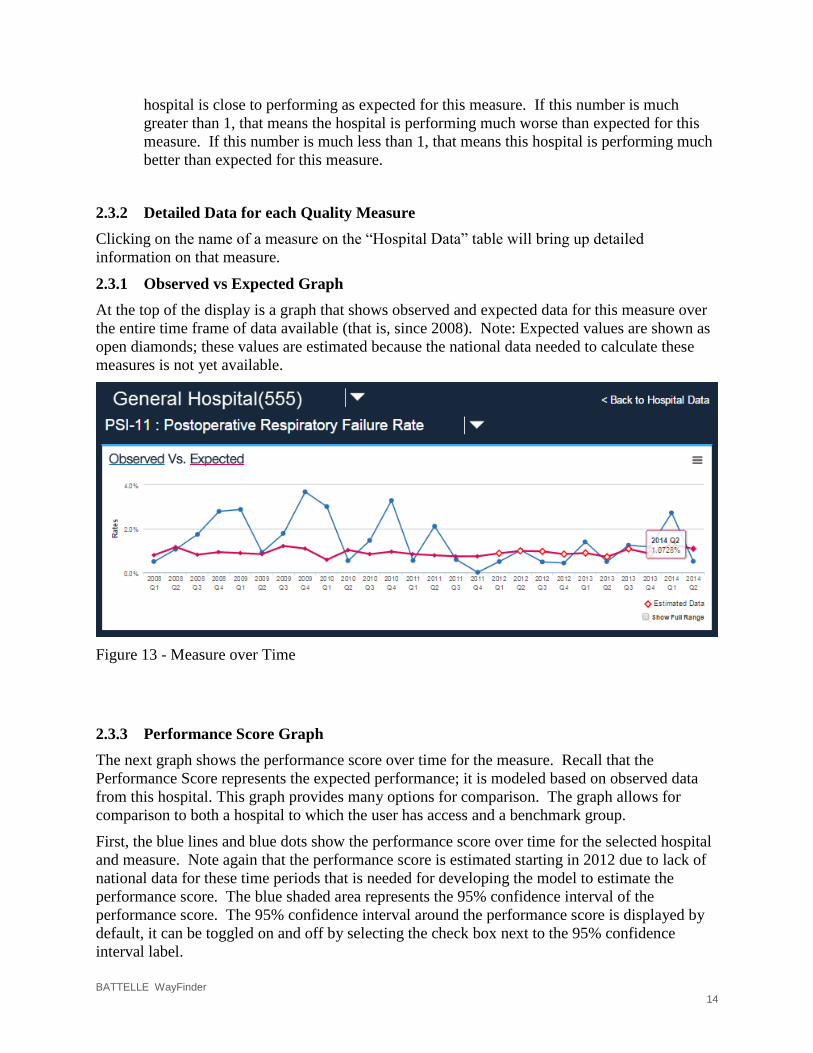
2.3.1 Observed vs Expected Graph
At the top of the display is a graph that shows observed and expected data for this measure over
the entire time frame of data available (that is, since 2008). Note: Expected values are shown as
open diamonds; these values are estimated because the national data needed to calculate these
measures is not yet available.
Figure 13 - Measure over Time
2.3.3 Performance Score Graph
The next graph shows the performance score over time for the measure. Recall that the
Performance Score represents the expected performance; it is modeled based on observed data
from this hospital. This graph provides many options for comparison. The graph allows for
comparison to both a hospital to which the user has access and a benchmark group.
First, the blue lines and blue dots show the performance score over time for the selected hospital
and measure. Note again that the performance score is estimated starting in 2012 due to lack of
national data for these time periods that is needed for developing the model to estimate the
performance score. The blue shaded area represents the 95% confidence interval of the
performance score. The 95% confidence interval around the performance score is displayed by
default, it can be toggled on and off by selecting the check box next to the 95% confidence
interval label.

BATTELLE WayFinder 15
Next, select a hospital for comparison by enabling the check box next to the “Select Hospital to
Compare” dropdown box. Hospitals that are available for comparison will be visible in the list
(Note: If no hospitals are in the list the current user does not have permission to view other
hospitals in the system). Once selected a green line will be added to the graph to represent the
performance score for the comparison hospital. As with the previously discussed 95%
confidence interval, a 95% confidence interval is available for the comparison hospital. Check
the box to toggle a green shaded area.
Benchmark groups can be added to the graph to display on the graph. Select a benchmark from
the “Select Benchmark to Compare”, this list will change based on the benchmarks assigned to
the selected hospitals. Once a benchmark is selected, you must select the group that you want to
display on the graph; available options are 10%, 20%, 50%, 80% and 90%. Hence, if you want
to compare the selected hospitals performance against the national 10th percentile, then select
National and 10%. Once selected the graph will display a green line on the performance score
graph to represent the comparison against the selected benchmark.
The data on this graph should be interpreted in terms of the quality measure of interest. For
example, if the quality measure is a mortality rate, then lower numbers on the quality measure
indicate better performance. If the quality measure is a process rate, capturing the % of times the
appropriate process is performed, then higher numbers on the quality measure indicate better
performance. You can use this percentile option with benchmark groups to get a sense for how
your hospital performs on this measure as compared to each benchmark group.
The last option on this graph, “show full range,” allows you to adjust the values on the y-axis. If
the box is checked, the range of the y-axis is 0% to 100%. If the box is unchecked, the y-axis is
adjusted to show the relevant range for this data, providing the ability to see the data at a more
detailed level.
Figure 14 - Performance Score of a Measure
The CMS Dollars at Risk graph is only available for measures that are tracked by CMS. The
CMS Dollars at Risk graph displays hospital indicator specific dollars at risk over time.
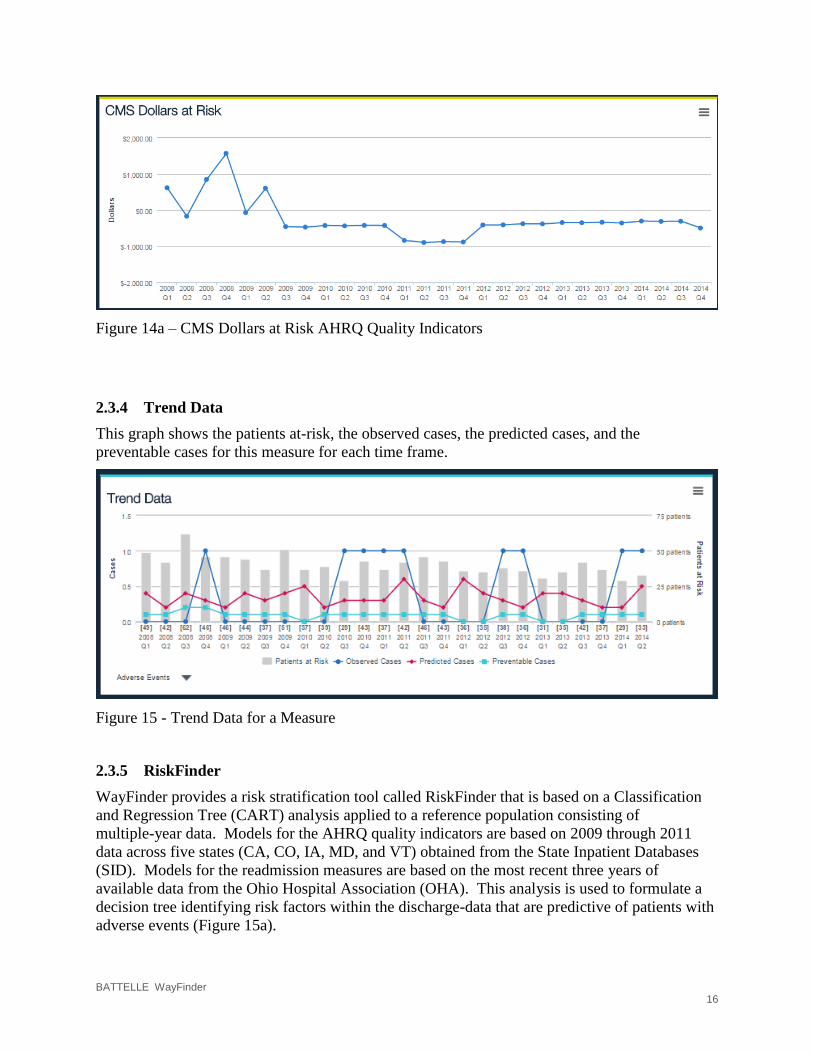
BATTELLE WayFinder 16
Figure 14a – CMS Dollars at Risk AHRQ Quality Indicators
2.3.4 Trend Data
This graph shows the patients at-risk, the observed cases, the predicted cases, and the
preventable cases for this measure for each time frame.
Figure 15 - Trend Data for a Measure
2.3.5 RiskFinder
WayFinder provides a risk stratification tool called RiskFinder that is based on a Classification
and Regression Tree (CART) analysis applied to a reference population consisting of
multiple-year data. Models for the AHRQ quality indicators are based on 2009 through 2011
data across five states (CA, CO, IA, MD, and VT) obtained from the State Inpatient Databases
(SID). Models for the readmission measures are based on the most recent three years of
available data from the Ohio Hospital Association (OHA). This analysis is used to formulate a
decision tree identifying risk factors within the discharge-data that are predictive of patients with
adverse events (Figure 15a).
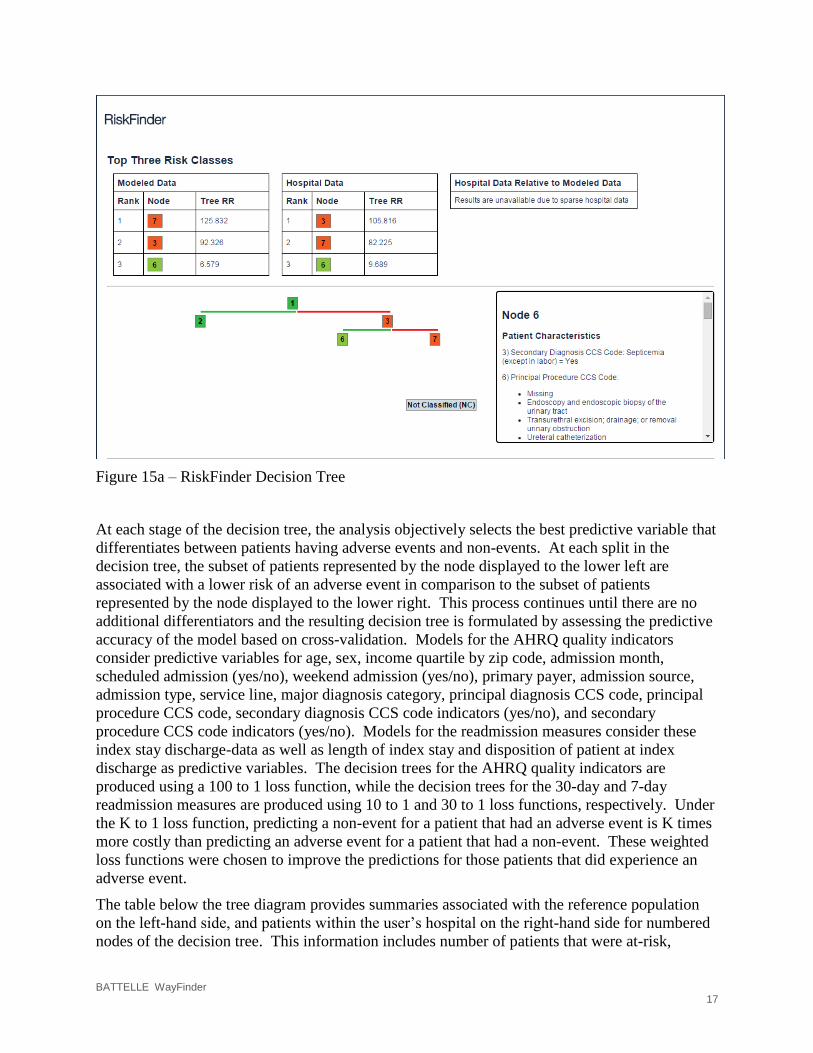
BATTELLE WayFinder 17
Figure 15a – RiskFinder Decision Tree
At each stage of the decision tree, the analysis objectively selects the best predictive variable that
differentiates between patients having adverse events and non-events. At each split in the
decision tree, the subset of patients represented by the node displayed to the lower left are
associated with a lower risk of an adverse event in comparison to the subset of patients
represented by the node displayed to the lower right. This process continues until there are no
additional differentiators and the resulting decision tree is formulated by assessing the predictive
accuracy of the model based on cross-validation. Models for the AHRQ quality indicators
consider predictive variables for age, sex, income quartile by zip code, admission month,
scheduled admission (yes/no), weekend admission (yes/no), primary payer, admission source,
admission type, service line, major diagnosis category, principal diagnosis CCS code, principal
procedure CCS code, secondary diagnosis CCS code indicators (yes/no), and secondary
procedure CCS code indicators (yes/no). Models for the readmission measures consider these
index stay discharge-data as well as length of index stay and disposition of patient at index
discharge as predictive variables. The decision trees for the AHRQ quality indicators are
produced using a 100 to 1 loss function, while the decision trees for the 30-day and 7-day
readmission measures are produced using 10 to 1 and 30 to 1 loss functions, respectively. Under
the K to 1 loss function, predicting a non-event for a patient that had an adverse event is K times
more costly than predicting an adverse event for a patient that had a non-event. These weighted
loss functions were chosen to improve the predictions for those patients that did experience an
adverse event.
The table below the tree diagram provides summaries associated with the reference population
on the left-hand side, and patients within the user’s hospital on the right-hand side for numbered
nodes of the decision tree. This information includes number of patients that were at-risk,
BATTELLE WayFinder 18
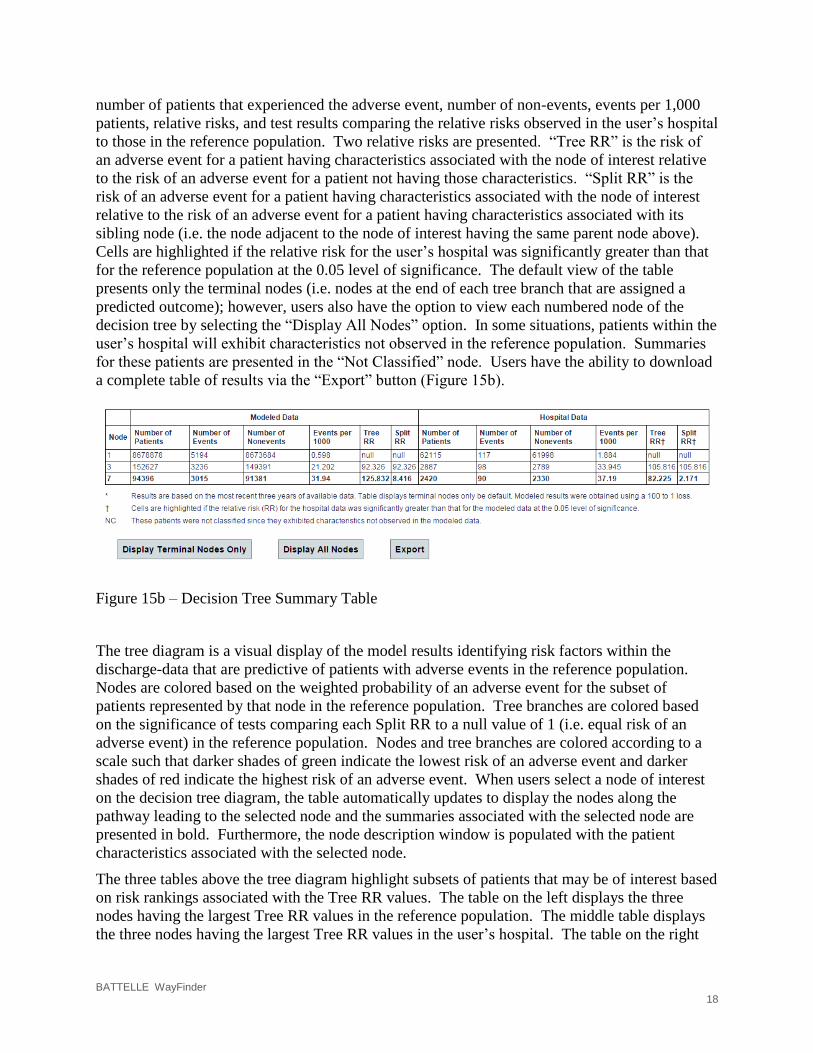
number of patients that experienced the adverse event, number of non-events, events per 1,000
patients, relative risks, and test results comparing the relative risks observed in the user’s hospital
to those in the reference population. Two relative risks are presented. “Tree RR” is the risk of
an adverse event for a patient having characteristics associated with the node of interest relative
to the risk of an adverse event for a patient not having those characteristics. “Split RR” is the
risk of an adverse event for a patient having characteristics associated with the node of interest
relative to the risk of an adverse event for a patient having characteristics associated with its
sibling node (i.e. the node adjacent to the node of interest having the same parent node above).
Cells are highlighted if the relative risk for the user’s hospital was significantly greater than that
for the reference population at the 0.05 level of significance. The default view of the table
presents only the terminal nodes (i.e. nodes at the end of each tree branch that are assigned a
predicted outcome); however, users also have the option to view each numbered node of the
decision tree by selecting the “Display All Nodes” option. In some situations, patients within the
user’s hospital will exhibit characteristics not observed in the reference population. Summaries
for these patients are presented in the “Not Classified” node. Users have the ability to download
a complete table of results via the “Export” button (Figure 15b).
Figure 15b – Decision Tree Summary Table
The tree diagram is a visual display of the model results identifying risk factors within the
discharge-data that are predictive of patients with adverse events in the reference population.
Nodes are colored based on the weighted probability of an adverse event for the subset of
patients represented by that node in the reference population. Tree branches are colored based
on the significance of tests comparing each Split RR to a null value of 1 (i.e. equal risk of an
adverse event) in the reference population. Nodes and tree branches are colored according to a
scale such that darker shades of green indicate the lowest risk of an adverse event and darker
shades of red indicate the highest risk of an adverse event. When users select a node of interest
on the decision tree diagram, the table automatically updates to display the nodes along the
pathway leading to the selected node and the summaries associated with the selected node are
presented in bold. Furthermore, the node description window is populated with the patient
characteristics associated with the selected node.
The three tables above the tree diagram highlight subsets of patients that may be of interest based
on risk rankings associated with the Tree RR values. The table on the left displays the three
nodes having the largest Tree RR values in the reference population. The middle table displays
the three nodes having the largest Tree RR values in the user’s hospital. The table on the right
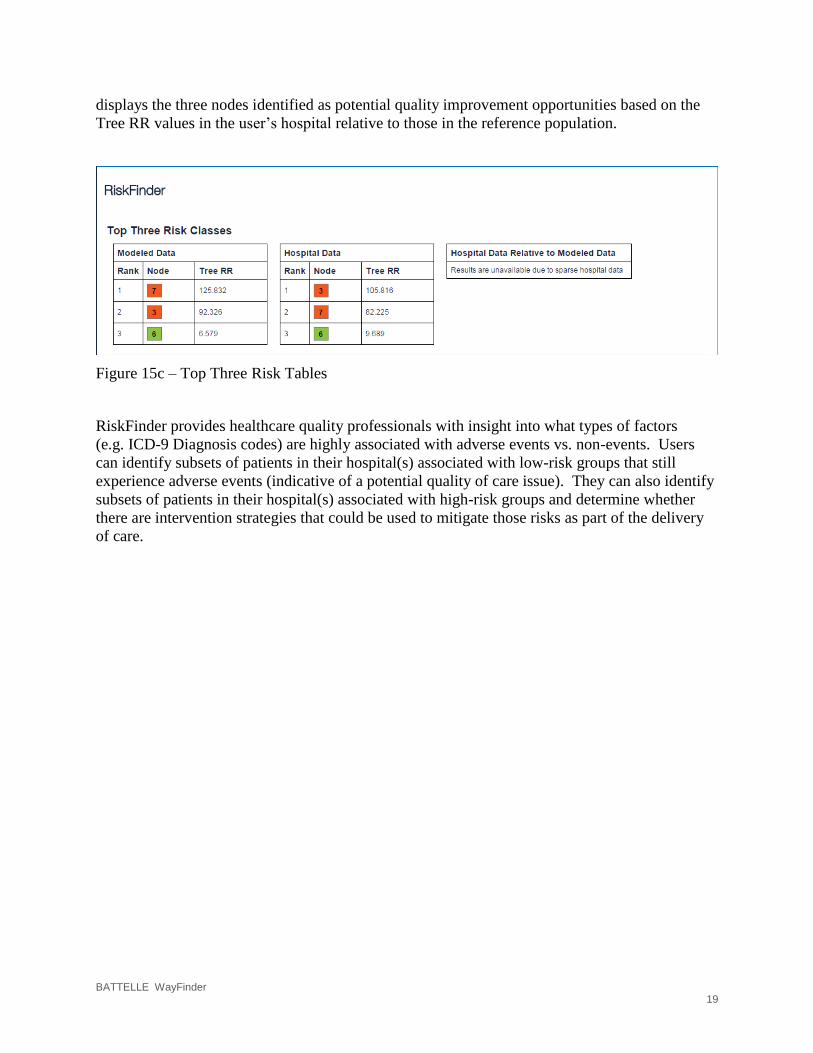
BATTELLE WayFinder 19
displays the three nodes identified as potential quality improvement opportunities based on the
Tree RR values in the user’s hospital relative to those in the reference population.
Figure 15c – Top Three Risk Tables
RiskFinder provides healthcare quality professionals with insight into what types of factors
(e.g. ICD-9 Diagnosis codes) are highly associated with adverse events vs. non-events. Users
can identify subsets of patients in their hospital(s) associated with low-risk groups that still
experience adverse events (indicative of a potential quality of care issue). They can also identify
subsets of patients in their hospital(s) associated with high-risk groups and determine whether
there are intervention strategies that could be used to mitigate those risks as part of the delivery
of care.

BATTELLE WayFinder 20
3.0 AHRQ Composite Measures Module
The AHRQ Composite Measures module contains information to allow the user to summarize
quality across multiple indicators to provide the opportunity to detect differences among
providers and indicators, identify domains and drivers of quality and prioritize quality initiatives.
AHRQ COMPOSITE MEASURES
The AHRQ Composite Measures can be found on the WayFinder landing page (Figure 17) and
on the OHA WayFinder Modules menu (Figure 16).
Figure 16 - OHA WayFinder Modules Menu
Figure 17 – WayFinder Modules Landing Page
BATTELLE WayFinder 21
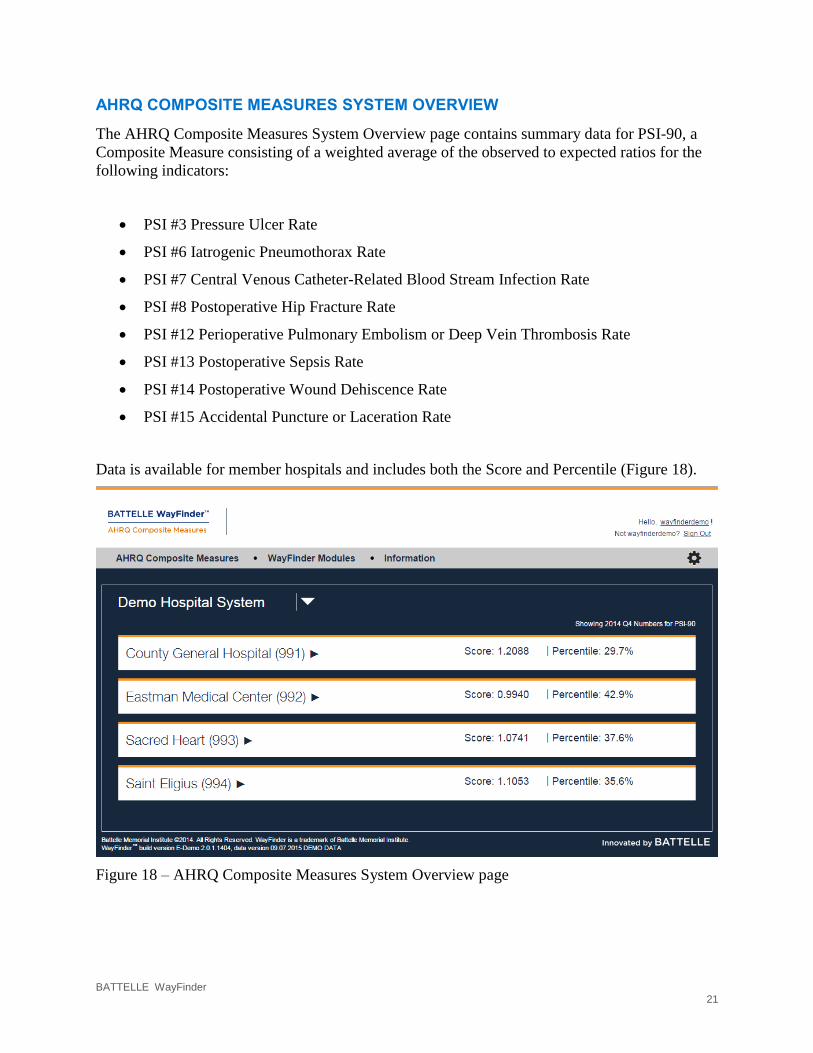
AHRQ COMPOSITE MEASURES SYSTEM OVERVIEW
The AHRQ Composite Measures System Overview page contains summary data for PSI-90, a
Composite Measure consisting of a weighted average of the observed to expected ratios for the
following indicators:
PSI #3 Pressure Ulcer Rate
PSI #6 Iatrogenic Pneumothorax Rate
PSI #7 Central Venous Catheter-Related Blood Stream Infection Rate
PSI #8 Postoperative Hip Fracture Rate
PSI #12 Perioperative Pulmonary Embolism or Deep Vein Thrombosis Rate
PSI #13 Postoperative Sepsis Rate
PSI #14 Postoperative Wound Dehiscence Rate
PSI #15 Accidental Puncture or Laceration Rate
Data is available for member hospitals and includes both the Score and Percentile (Figure 18).
Figure 18 – AHRQ Composite Measures System Overview page

BATTELLE WayFinder 22
3.3 Hospital Composite Data Table
The Hospital Composite Data table provides a detailed view of the Composite Measure (Figure
19). PSI-90: Patient Safety for Selected Indicators is comprised of the Quality Indicators listed
in the table below. If you select an individual Quality Indicator it will return the user to the
AHRQ Quality Indicators module, as discussed in Section 2.0.
Figure 19A – Hospital Composite Data Table
The Hospital Composite Data Table can be filtered for a specific hospital by Year, Quarter and
Benchmark by using the dropdown lists above the table. Figure 19 is an example of Annual
data, if the table is viewed in Quarterly data the quarter will be included as filter criteria (Figure
19B).

BATTELLE WayFinder 23
Figure 19B – Quarterly view of Hospital Composite Data table
A definition of each Quality Indicator in the table is provided by selecting the “i” to the left of
each indicator (Figure 19C).
Figure 19C – Example of the provided definition for PSI-90.
BATTELLE WayFinder 24
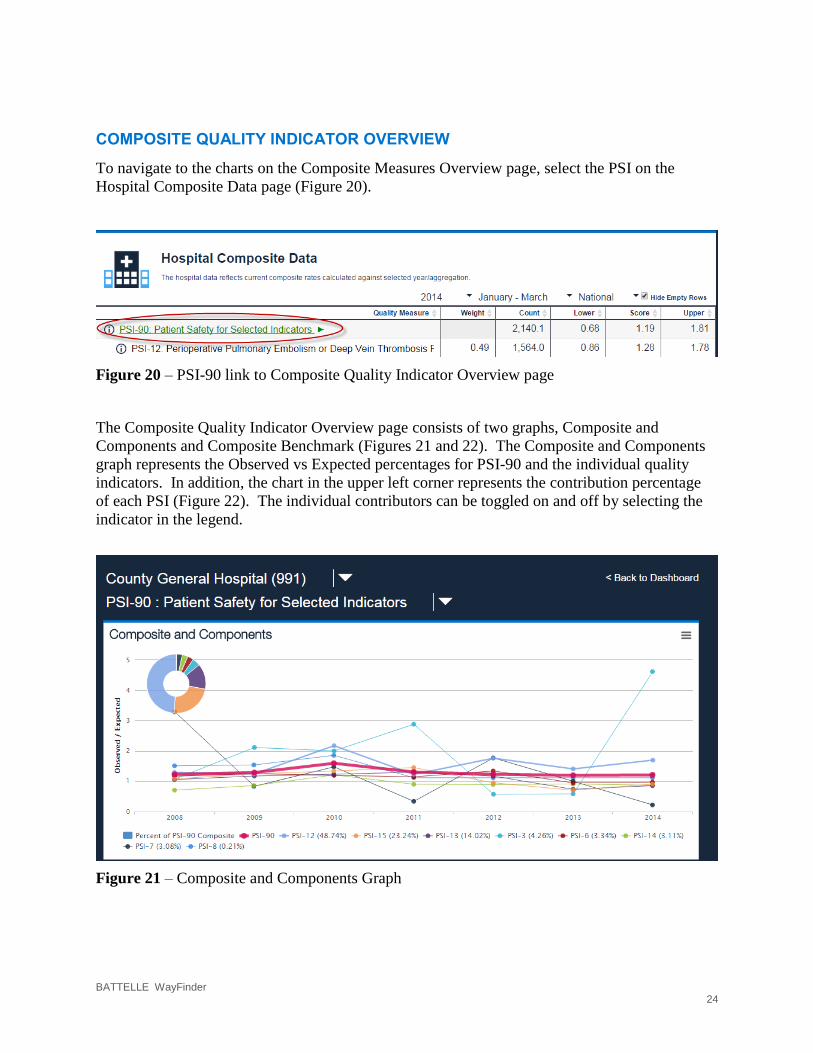
COMPOSITE QUALITY INDICATOR OVERVIEW
To navigate to the charts on the Composite Measures Overview page, select the PSI on the
Hospital Composite Data page (Figure 20).
Figure 20 – PSI-90 link to Composite Quality Indicator Overview page
The Composite Quality Indicator Overview page consists of two graphs, Composite and
Components and Composite Benchmark (Figures 21 and 22). The Composite and Components
graph represents the Observed vs Expected percentages for PSI-90 and the individual quality
indicators. In addition, the chart in the upper left corner represents the contribution percentage
of each PSI (Figure 22). The individual contributors can be toggled on and off by selecting the
indicator in the legend.
Figure 21 – Composite and Components Graph
BATTELLE WayFinder 25
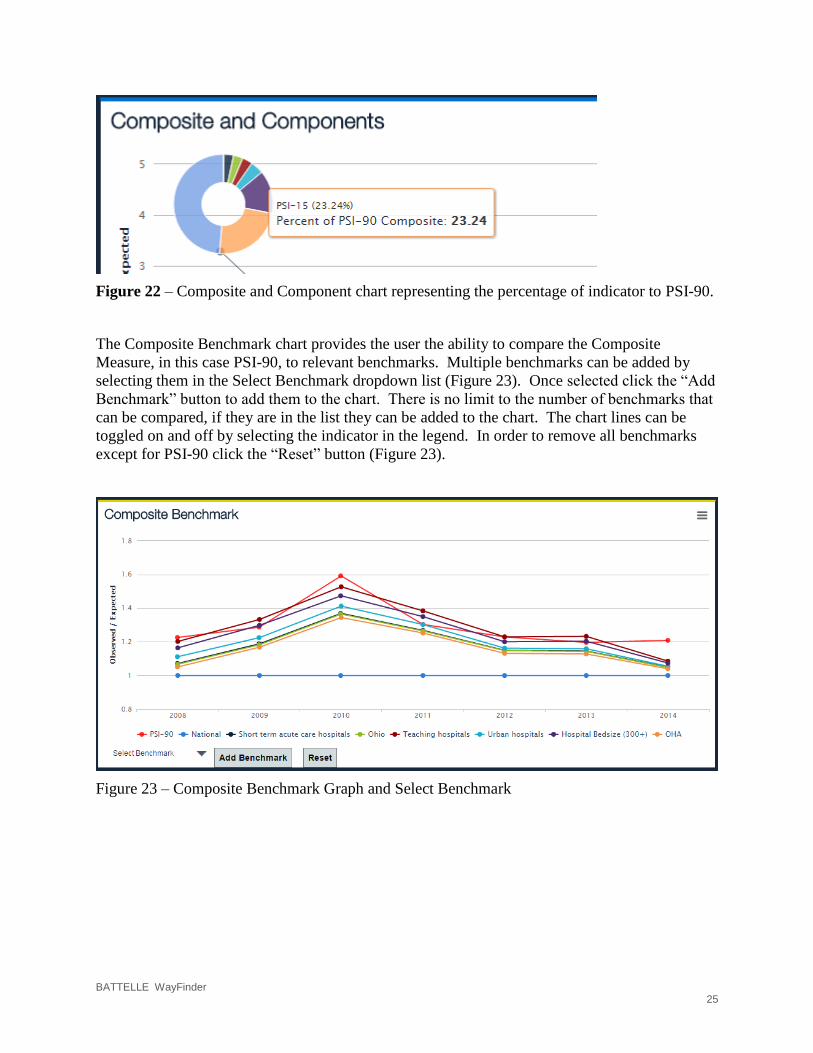
Figure 22 – Composite and Component chart representing the percentage of indicator to PSI-90.
The Composite Benchmark chart provides the user the ability to compare the Composite
Measure, in this case PSI-90, to relevant benchmarks. Multiple benchmarks can be added by
selecting them in the Select Benchmark dropdown list (Figure 23). Once selected click the “Add
Benchmark” button to add them to the chart. There is no limit to the number of benchmarks that
can be compared, if they are in the list they can be added to the chart. The chart lines can be
toggled on and off by selecting the indicator in the legend. In order to remove all benchmarks
except for PSI-90 click the “Reset” button (Figure 23).
Figure 23 – Composite Benchmark Graph and Select Benchmark
BATTELLE WayFinder 26
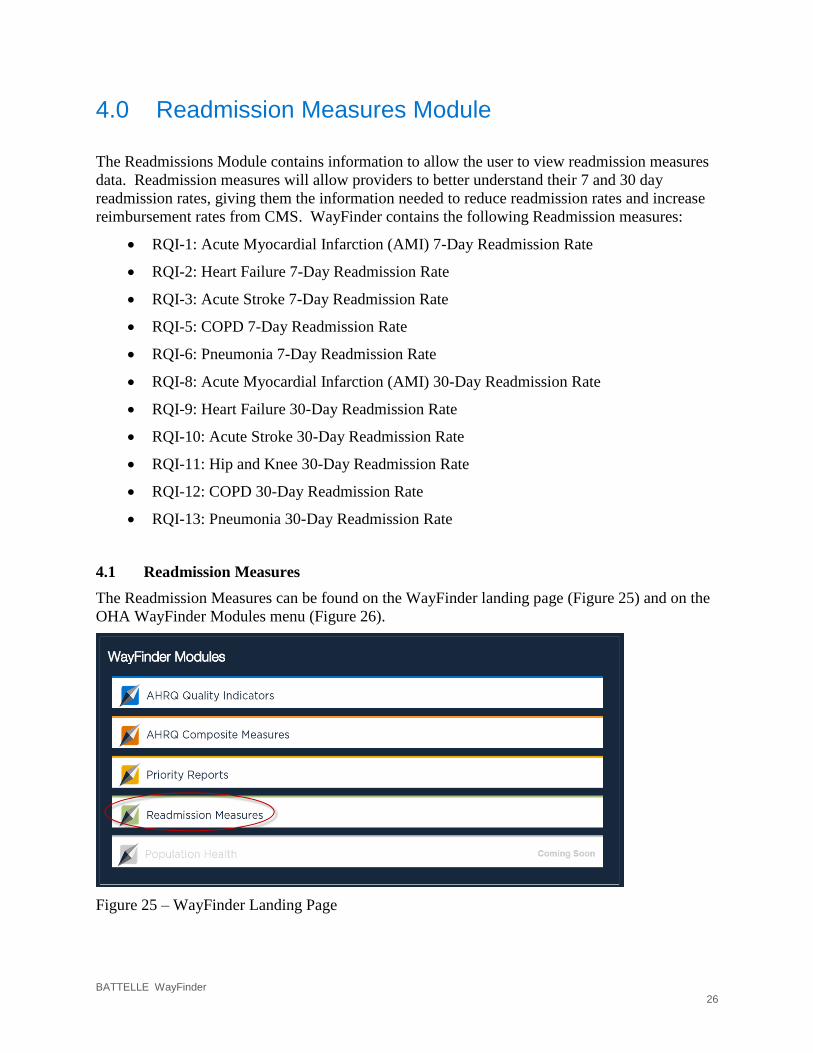
4.0 Readmission Measures Module
The Readmissions Module contains information to allow the user to view readmission measures
data. Readmission measures will allow providers to better understand their 7 and 30 day
readmission rates, giving them the information needed to reduce readmission rates and increase
reimbursement rates from CMS. WayFinder contains the following Readmission measures:
RQI-1: Acute Myocardial Infarction (AMI) 7-Day Readmission Rate
RQI-2: Heart Failure 7-Day Readmission Rate
RQI-3: Acute Stroke 7-Day Readmission Rate
RQI-5: COPD 7-Day Readmission Rate
RQI-6: Pneumonia 7-Day Readmission Rate
RQI-8: Acute Myocardial Infarction (AMI) 30-Day Readmission Rate
RQI-9: Heart Failure 30-Day Readmission Rate
RQI-10: Acute Stroke 30-Day Readmission Rate
RQI-11: Hip and Knee 30-Day Readmission Rate
RQI-12: COPD 30-Day Readmission Rate
RQI-13: Pneumonia 30-Day Readmission Rate
4.1 Readmission Measures
The Readmission Measures can be found on the WayFinder landing page (Figure 25) and on the
OHA WayFinder Modules menu (Figure 26).
Figure 25 – WayFinder Landing Page

BATTELLE WayFinder 27
Figure 26 – OHA WayFinder Modules Menu
The Readmission Measures Summary page is located under “Readmission Measures” on either
the WayFinder Modules menu or the WayFinder Landing Page. The Readmission Measures
Summary page contains Hospital level summary data. Currently, the summary page in the
DEMO System is set by default to display “2014 Q4 Numbers for RQI-13”. By selecting a
Hospital, the user will be directed to the Hospital Overview page (Figure 27).
Figure 27 – Readmission Measures System Overview
BATTELLE WayFinder 28
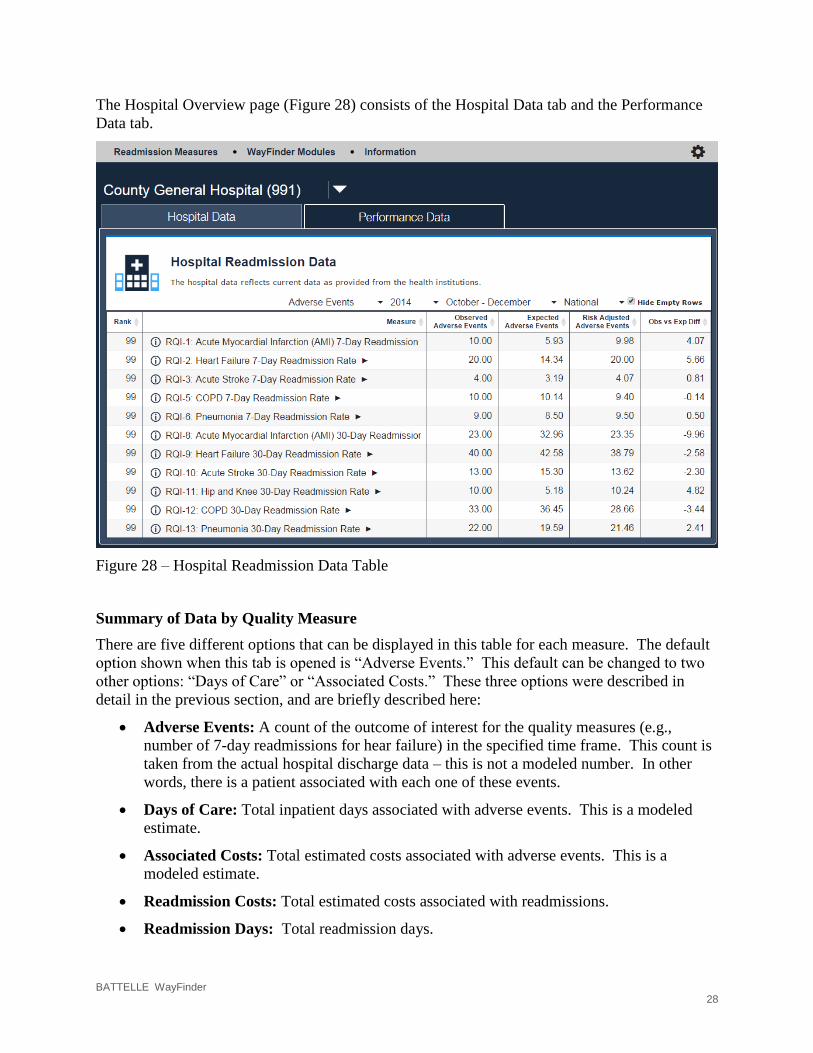
The Hospital Overview page (Figure 28) consists of the Hospital Data tab and the Performance
Data tab.
Figure 28 – Hospital Readmission Data Table
Summary of Data by Quality Measure
There are five different options that can be displayed in this table for each measure. The default
option shown when this tab is opened is “Adverse Events.” This default can be changed to two
other options: “Days of Care” or “Associated Costs.” These three options were described in
detail in the previous section, and are briefly described here:
Adverse Events: A count of the outcome of interest for the quality measures (e.g.,
number of 7-day readmissions for hear failure) in the specified time frame. This count is
taken from the actual hospital discharge data – this is not a modeled number. In other
words, there is a patient associated with each one of these events.
Days of Care: Total inpatient days associated with adverse events. This is a modeled
estimate.
Associated Costs: Total estimated costs associated with adverse events. This is a
modeled estimate.
Readmission Costs: Total estimated costs associated with readmissions.
Readmission Days: Total readmission days.
BATTELLE WayFinder 29
When any of these options is selected, a table is displayed. Across the top of the table is listed:
the chosen option, the year, the quarter (if relevant), and the benchmark group. Each of these has
a drop-down box that can be used to change the data displayed. Recall that to switch from a
quarterly display to an annual display, use the gear-shaped toggle on the right-hand side of the
top of the menu.
For each of these measures, there are six columns shown in the data sheet. They are, in order:
Rank: the Rank of the Prevention Index for this hospital on this measure as compared to
the selected benchmark population. The worst hospital is ranked “1,” so bigger numbers
are better here.
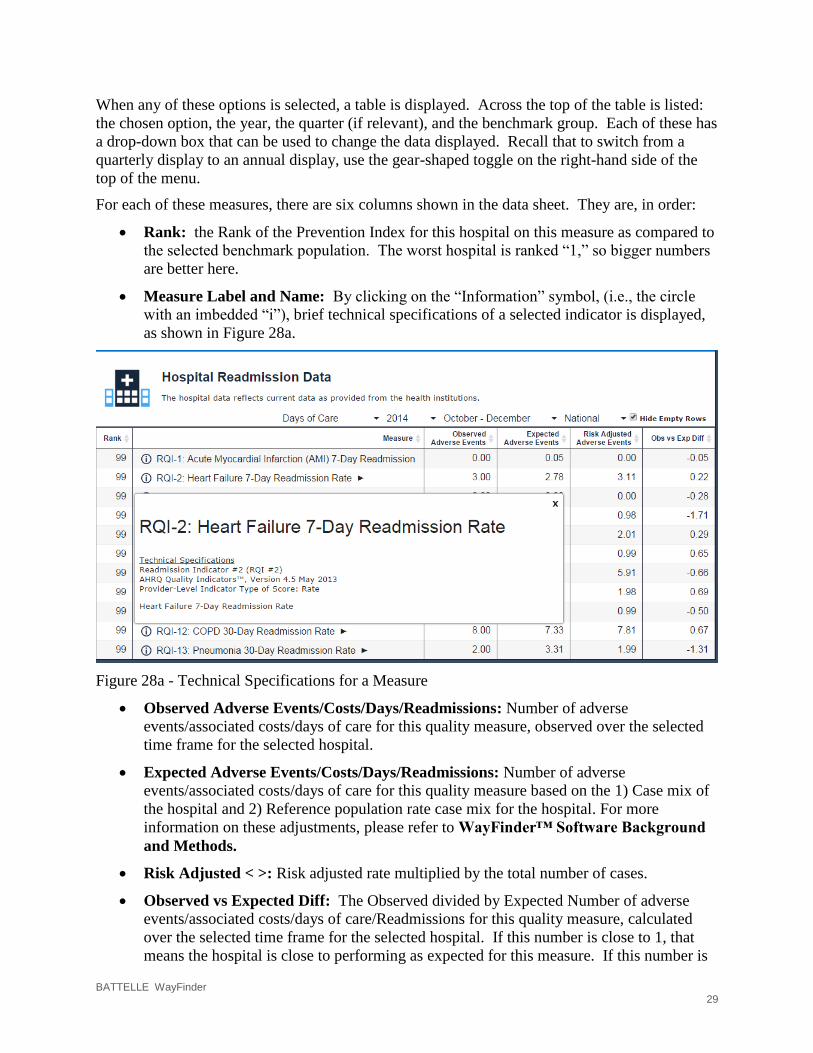
Measure Label and Name: By clicking on the “Information” symbol, (i.e., the circle
with an imbedded “i”), brief technical specifications of a selected indicator is displayed,
as shown in Figure 28a.
Figure 28a - Technical Specifications for a Measure
Observed Adverse Events/Costs/Days/Readmissions: Number of adverse
events/associated costs/days of care for this quality measure, observed over the selected
time frame for the selected hospital.
Expected Adverse Events/Costs/Days/Readmissions: Number of adverse
events/associated costs/days of care for this quality measure based on the 1) Case mix of
the hospital and 2) Reference population rate case mix for the hospital. For more
information on these adjustments, please refer to WayFinder™ Software Background
and Methods.
Risk Adjusted < >: Risk adjusted rate multiplied by the total number of cases.
Observed vs Expected Diff: The Observed divided by Expected Number of adverse
events/associated costs/days of care/Readmissions for this quality measure, calculated
over the selected time frame for the selected hospital. If this number is close to 1, that
means the hospital is close to performing as expected for this measure. If this number is
BATTELLE WayFinder 30
much greater than 1, that means the hospital is performing much worse than expected for
this measure. If this number is much less than 1, that means this hospital is performing
much better than expected for this measure.
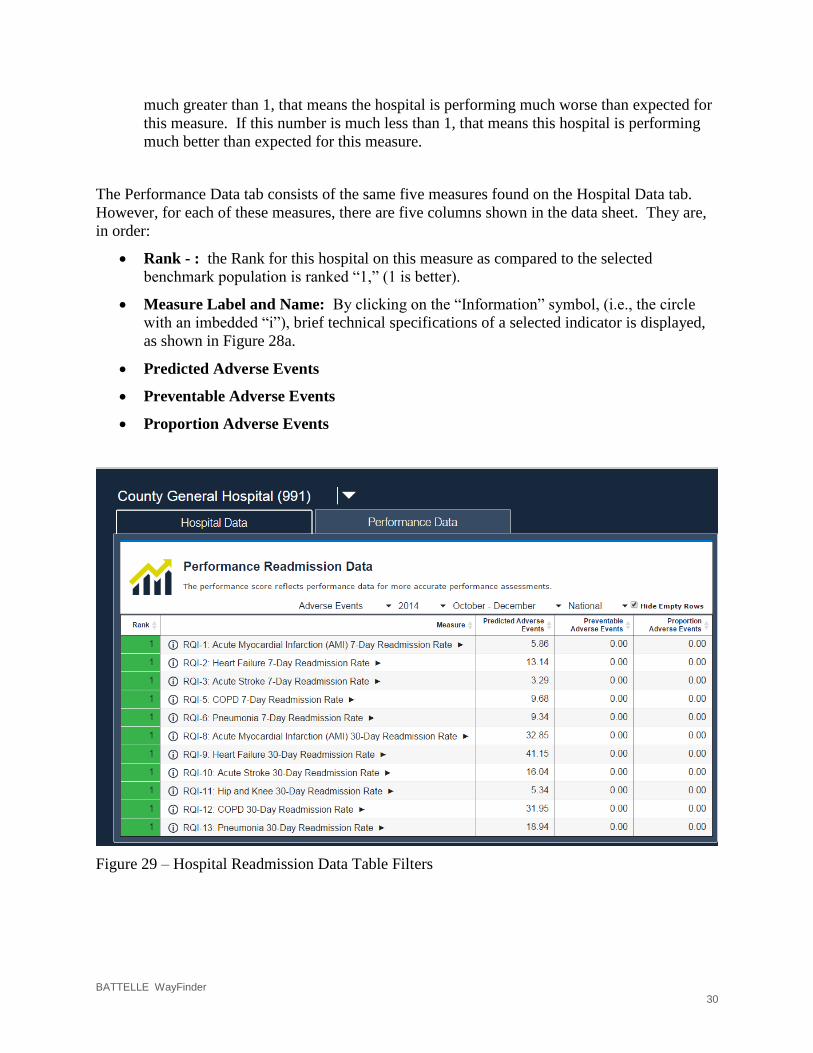
The Performance Data tab consists of the same five measures found on the Hospital Data tab.
However, for each of these measures, there are five columns shown in the data sheet. They are,
in order:
Rank - : the Rank for this hospital on this measure as compared to the selected
benchmark population is ranked “1,” (1 is better).
Measure Label and Name: By clicking on the “Information” symbol, (i.e., the circle
with an imbedded “i”), brief technical specifications of a selected indicator is displayed,
as shown in Figure 28a.
Predicted Adverse Events
Preventable Adverse Events
Proportion Adverse Events
Figure 29 – Hospital Readmission Data Table Filters

BATTELLE WayFinder 31
Clicking on the name of a measure on the “Hospital Data” table will bring up detailed
information on that measure.
At the top of the page is a graph that shows observed and expected data for this measure over the
entire time frame of data available (that is, since 2008). Note: Expected values are shown as
open diamonds; these values are estimated because the national data needed to calculate these
measures is not yet available.
Figure 30 – Readmission Indicator Observed vs Expected Chart
The Performance Score graph was discussed in the general measures section 2.3.2.
Figure 31 – Readmission Indicator Performance Score Chart
BATTELLE WayFinder 32
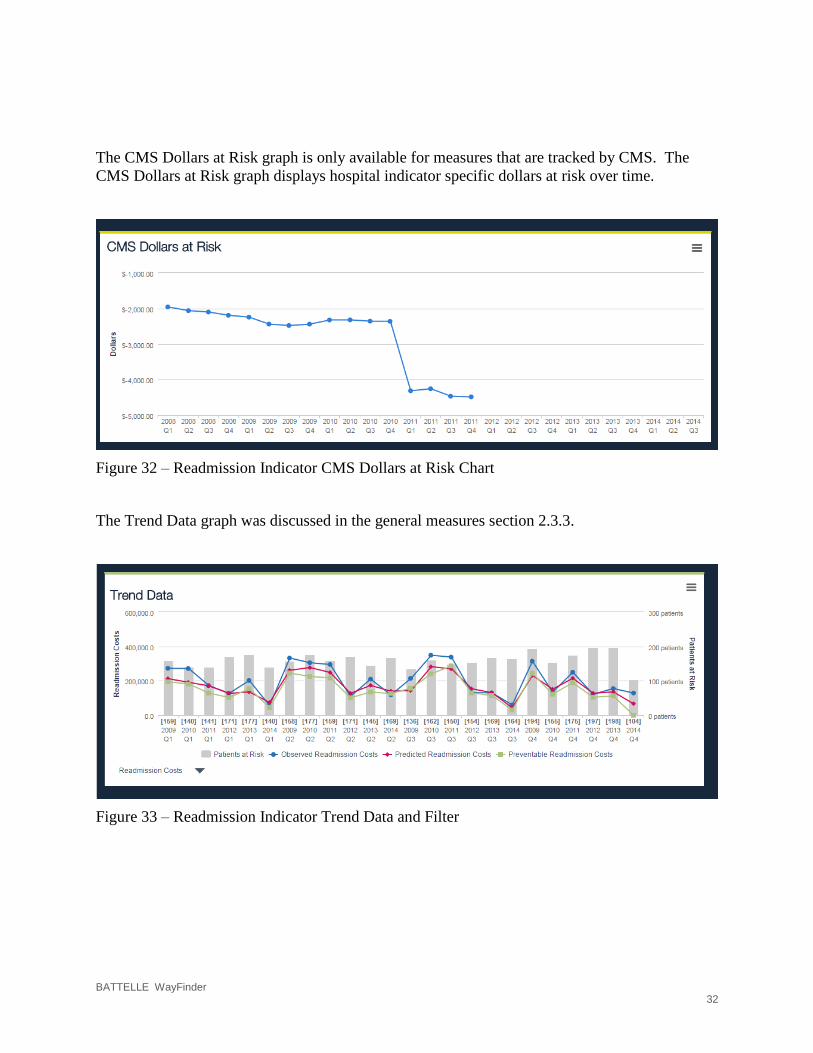
The CMS Dollars at Risk graph is only available for measures that are tracked by CMS. The
CMS Dollars at Risk graph displays hospital indicator specific dollars at risk over time.
Figure 32 – Readmission Indicator CMS Dollars at Risk Chart
The Trend Data graph was discussed in the general measures section 2.3.3.
Figure 33 – Readmission Indicator Trend Data and Filter
BATTELLE WayFinder 33
5.0 Priority Reports
Priority reports provide detailed information that links hospital performance on quality measures
to patient records. This detailed information readily provides data that can help your hospital to
target quality problems and mitigate them. Since the information in these reports is personally
identifiable information (PII), special security requirements are needed to view these reports.
There is a separate user guide, namely, “WayFinder™ Secure File Client User Guide,” that
describes the process that must be used to access this protected data. This section will explain
generally what the priority reports will include.
The priority report will be in the form of an excel file. It will contain the following fields:
Medical Record number
Patient Account number
Discharge year
Discharge quarter
Indicator (that is, the quality measure associated with this record)
Risk index
Risk index decile
Present on admission
Node number (1:1 loss)
Node class (1:1 loss)
Node number (100:1 loss)
Node class (100:1 loss)

BATTELLE WayFinder 34
6.0 Appendix A: DATA SOURCES
The WayFinder™ software incorporates State Hospital Associations (SHA) Data (i.e.,
community hospital data) and the Healthcare Cost Utilization Project (HCUP) nationally
comparative databases, sponsored by the publicly funded Agency for Healthcare Research and
Quality (AHRQ), an Operating Division of the U.S. Department of Health and Human Services
(HHS).
A.1 HCUP DATA SOURCES
The WayFinder™ software incorporates data from two “Restricted Access Public Release”
HCUP databases. The chosen databases are as follows:
• Nationwide Inpatient Sample (NIS)
• State Inpatient Databases (SID)
A.1.1 NIS (Nationwide Inpatient Sample)
The NIS is the largest publicly available all-payer inpatient healthcare database in the United
States, yielding national estimates of hospital outcomes and the effect of patient risk factors. Un-
weighted, it contains data from approximately 8 million hospital stays each year. Weighted, it
estimates roughly 40 million hospitalizations. Sampled from the SID, the NIS contains all
discharge data from more than 1,000 short-term and non-Federal hospitals each year, which
approximates a 20 percent stratified sample of U.S. community hospitals. NIS data can be used
to estimate the trend in the national reference population rate, to estimate the expected rate based
on the hospital’s case-mix used to calculate the hospital’s risk-adjusted rate, and to forecast those
rates for future years. As new NIS data years are made available, the predictions will be updated
within WayFinder™ software and the accuracy of the predictions assessed. New calendar year
data are generally available in late spring (1).
A.1.2 SID (State Inpatient Databases)
The SID includes inpatient discharge records from community hospitals in participating states
(46 states now participate in the SID). The SID files include all patients, regardless of payer,
encompassing about 97 percent of all U.S. community hospital discharges. The SID contains a
core set of clinical and nonclinical information on all patients, including individuals covered by
Medicare, Medicaid, or private insurance, as well as those who are uninsured. Most important for
our analysis is the availability of present on admission (POA) data for selected states.
WayFinder™ software utilizes SID data from five states with POA data (i.e., CA, CO, IA, MD,
and VT), allowing for trending estimates in the probability that a given outcome was POA and to
forecast that probability for later years. As new SID data years and states are made available, the
predictions will be updated and the accuracy of the predictions assessed. New calendar year data
are generally available in early spring (2).
A.2 STATE HOSPITAL ASSOCIATION DATA INCORPORATION
The State Hospital Association (SHA) data include most or all community hospitals located in
state and, potentially, some out-of-state members. The data also include all payers (i.e.,
Medicare, Medicaid, commercial) and age ranges (i.e., adult and pediatric). The date range
includes discharges from the first quarter of 2008, when reporting of POA data became more
common, to the present (i.e., 4th quarter (Q4) of 2013 as of this publication). Data elements and

BATTELLE WayFinder 35
data values in the SHA data are mapped to the AHRQ Quality Indicator (QI) Software data
dictionary. The calculation of the - numerator, denominator, and observed, expected, risk-
adjusted and reliability-adjusted rates are based on Version 4.5 of the AHRQ Quality Indicator™
SAS Software. (http://www.qualityindicators.ahrq.gov/Software/SAS.aspx)
BATTELLE WayFinder 36
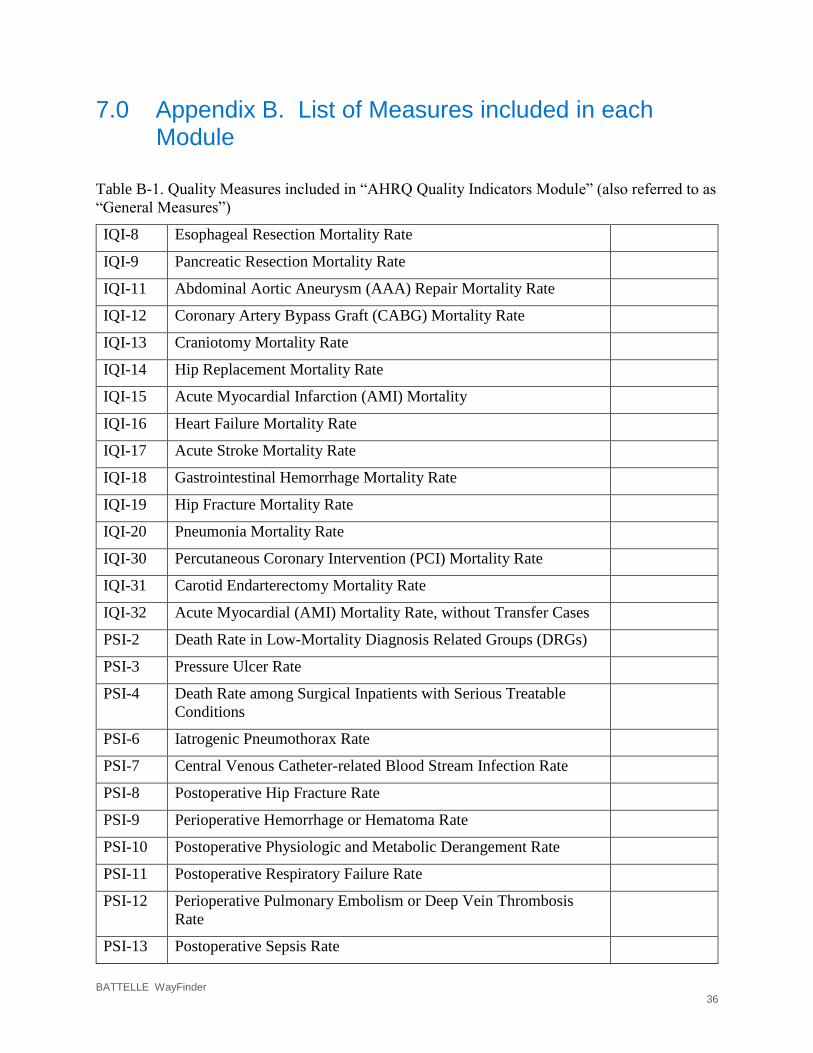
7.0 Appendix B. List of Measures included in each Module
Table B-1. Quality Measures included in “AHRQ Quality Indicators Module” (also referred to as
“General Measures”)
IQI-8 Esophageal Resection Mortality Rate
IQI-9 Pancreatic Resection Mortality Rate
IQI-11 Abdominal Aortic Aneurysm (AAA) Repair Mortality Rate
IQI-12 Coronary Artery Bypass Graft (CABG) Mortality Rate
IQI-13 Craniotomy Mortality Rate
IQI-14 Hip Replacement Mortality Rate
IQI-15 Acute Myocardial Infarction (AMI) Mortality
IQI-16 Heart Failure Mortality Rate
IQI-17 Acute Stroke Mortality Rate
IQI-18 Gastrointestinal Hemorrhage Mortality Rate
IQI-19 Hip Fracture Mortality Rate
IQI-20 Pneumonia Mortality Rate
IQI-30 Percutaneous Coronary Intervention (PCI) Mortality Rate
IQI-31 Carotid Endarterectomy Mortality Rate
IQI-32 Acute Myocardial (AMI) Mortality Rate, without Transfer Cases
PSI-2 Death Rate in Low-Mortality Diagnosis Related Groups (DRGs)
PSI-3 Pressure Ulcer Rate
PSI-4 Death Rate among Surgical Inpatients with Serious Treatable
Conditions
PSI-6 Iatrogenic Pneumothorax Rate
PSI-7 Central Venous Catheter-related Blood Stream Infection Rate
PSI-8 Postoperative Hip Fracture Rate
PSI-9 Perioperative Hemorrhage or Hematoma Rate
PSI-10 Postoperative Physiologic and Metabolic Derangement Rate
PSI-11 Postoperative Respiratory Failure Rate
PSI-12 Perioperative Pulmonary Embolism or Deep Vein Thrombosis
Rate
PSI-13 Postoperative Sepsis Rate
BATTELLE WayFinder 37
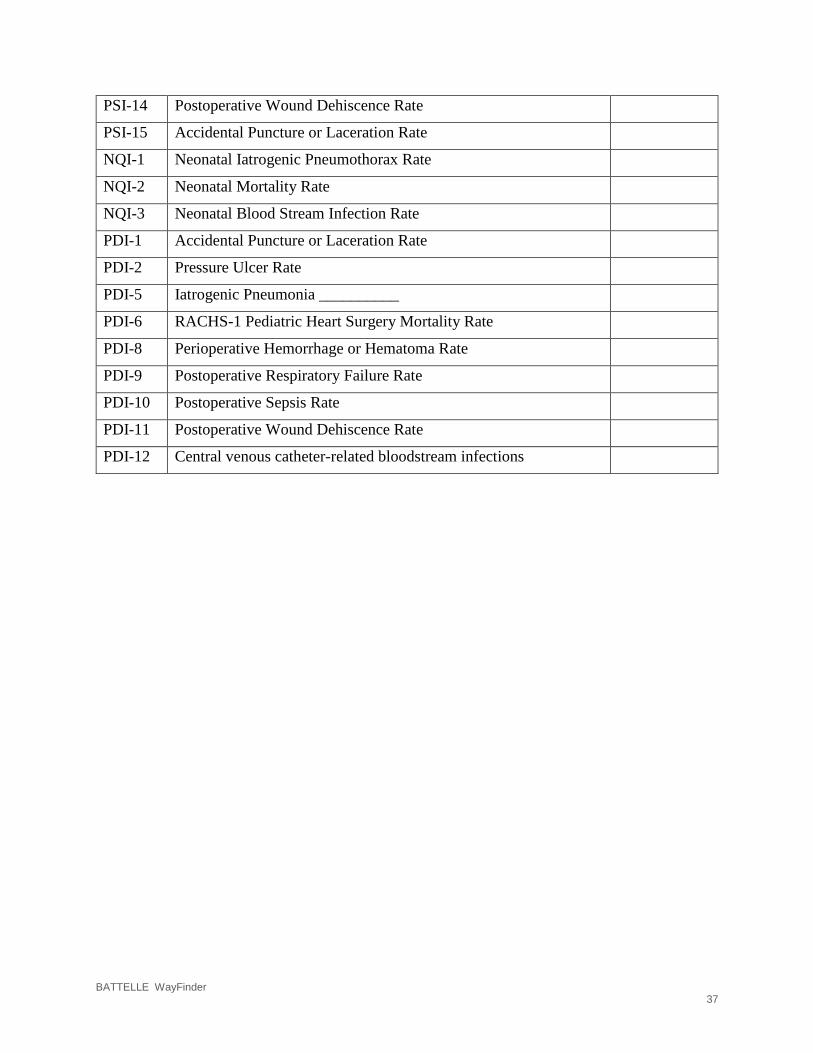
PSI-14 Postoperative Wound Dehiscence Rate
PSI-15 Accidental Puncture or Laceration Rate
NQI-1 Neonatal Iatrogenic Pneumothorax Rate
NQI-2 Neonatal Mortality Rate
NQI-3 Neonatal Blood Stream Infection Rate
PDI-1 Accidental Puncture or Laceration Rate
PDI-2 Pressure Ulcer Rate
PDI-5 Iatrogenic Pneumonia __________
PDI-6 RACHS-1 Pediatric Heart Surgery Mortality Rate
PDI-8 Perioperative Hemorrhage or Hematoma Rate
PDI-9 Postoperative Respiratory Failure Rate
PDI-10 Postoperative Sepsis Rate
PDI-11 Postoperative Wound Dehiscence Rate
PDI-12 Central venous catheter-related bloodstream infections

BATTELLE WayFinder 38
Table B-1. Quality Measures included in “Composite Measures”
PSI-90