batch foam separation of a soluble protein - 北海道大学 · foam separation is an available...
TRANSCRIPT

Instructions for use
Title Batch foam separation of a soluble protein
Author(s) Maruyama, Hideo; Seki, Hideshi; Suzuki, Akira; Inoue, Norio
Citation Water Research, 41(3): 710-718
Issue Date 2006
Doc URL http://hdl.handle.net/2115/15419
Type article (author version)
File Information maruyama_etal_WR_2006.pdf
Hokkaido University Collection of Scholarly and Academic Papers : HUSCAP

Batch Foam Separation of a Soluble Protein
Hideo Maruyama*, Hideshi Seki, Akira Suzuki and Norio Inoue
Division of Marine Biosciences, Graduate School of Fisheries Sciences, Hokkaido
University, Minato 3–1–1, Hakodate, JAPAN 041–8611 Telephone: +81(138)408813; Facsimile: +81(138)408811; E–mail:
* Corresponding author.
E–mail address: [email protected] (H. Maruyama)
1
Abstract
Removal of protein dissolved in water by batch foam separation was conducted with
using ovalbumin (OA) as a model protein in the light of wastewater treatment reducing
organic loading. The removal efficiency had a maximum value near the i.e.p. of OA (pH
4.6), thus, most experiments were conducted at pH 4.6. Typical experimental
conditions; superficial gas velocity, Ug: 1.97×10⁻² – 5.37×10⁻² cm/s; initial bulk
concentration of OA, Ci: ca. 0.05 - 0.25 g/L; liquid volume, V: 600 cm3. A model
estimating bulk concentration profile was proposed by taking into account a mass
balance of the present system. The model predicted that OA could be removed perfectly,
however, was not all removed experimentally. The residual OA concentration of the
bulk liquid within the column reached plateau value, which correspond to ca. 18 % of
the initial OA concentration. The plateau value of the bulk concentration was attained
for ca. 100 - 500 min with Ug = 1.97×10⁻² – 5.37×10⁻² cm/s. Foaming ability test
revealed that the foaming limit concentration of OA at pH 4.6 was 9.72×10⁻³ g/L. These
results suggested that OA molecules could be damaged by interaction of bubble surface
in the dispersed phase, since there were the residual OA concentrations over the limit
concentration. To take account of this phenomena and correct the model, average
surface density, Xd, which should convert protein molecule into the denatured protein
molecule, was introduced. The corrected model could explain well time profile of OA
bulk concentration.
Keywords: Foam separation; Batch operation; Ovalbumin; Protein removal modeling;
Wastewater Treatment
1

1. Introduction
Foam separation is an available method for the enrichment or the removal of dilute
surface-active substances dissolved in water. This technique has been studied in many
fields, such as chemical/biochemical engineering (Sarker et al., 1987; Brown et al.,
1990; Bhattacharya et al., 1991; Mohan et al., 1992; Montero et al., 1993; Maruyama et
al., 2000; Wong et al., 2001; Du et al., 2002), analytical chemistry (Schoen, 1966;
Karger and Miller, 1969), wastewater treatment (Ng et al., 1976; Huang et al., 1995;
Beheir and Aziz, 1996) and so on.
From the view point of wastewater treatment, it is important to remove solid or
soluble organic substances from aqueous environments since these substances cause
high organic loading in the effluent and can become resources of un-ionized ammonia,
ammonium, nitrate and nitrite ions which are well-known as toxic substances for human
and vertebrates. Therefore, removal of these substances before disposing to wastewater
treatment can reduce the organic loading. Foam separation method has been employed
for this purpose as one of effective and low cost techniques.
However, studies on protein denaturation by this technique have been reported. It
appears that there are three possible mechanisms by which proteins may be damaged in
foam separation process: (i) unfolding at the gas-liquid interface (Graham and Phillips,
1979; Clark et al., 1988; Varley and Ball, 1994; Clarkson et al., 2000), (ii) high shear
stress rates (Maa and Hsu, 1997), and (iii) chemical damage may occur by oxidation
(Montero et al., 1993; Liu et al., 1998). Maa and Hsu (1997) examined the combined
effect of shear stress and gas-liquid interface on protein denaturation. They concluded
that shear plays only a minor role with the damage being mainly due to interaction with
2

gas-liquid interface even though their estimation of shear stress in foaming were lower.
Monteo et al. (1993) reported denaturation of cellulase in foam and assumed that this
damage was caused by oxidation due to sparging gas. Liu et al. (1998) investigated
denaturation of enzymes in foam separation and reported that oxidative deactivation of
enzymes was identified and the deactivation could be reduced by applying N2 or CO2
gas as sparging gas. They suggested that reducing the contact time of bubble and
enzyme proven mild and effective recovery in foam separation using loop bubble
column.
In batch foam separation process, protein molecules in bubble dispersed bulk phase
seemed to be damaged by some factors described above. It is necessary to consider
influences of these damages for estimation of protein removal from aqueous phase by
foam separation. This consideration and the knowledge about this will be also important
for enrichment operation of proteins/enzymes for biochemical engineering/biochemical
industries.
In this paper, the authors conducted batch foam separation. Ovalbumin was used as
a model protein in a batch foam separation process. A model is proposed estimating the
bulk concentration profile of ovalbumin during batch foam separation.
3

2. Model description
Protein contained in the foam liquid is assumed to originate from that adsorbed onto
the bubble surface and from that entrained bulk liquid. According to the material
balance between the foam bed and the pool liquid in the column, the following relation
was given as
–V(dCb/dt) = Sb X + Wf0 Cb, (1)
where, Cb, Sb, Wf0, V and X are the protein concentration of the bulk liquid, the
production rate of bubble surface area in the column, the volumetric flow rate of the
liquid in foam at the liquid–foam interface, liquid volume within the column and the
adsorption density onto bubble surface, respectively. We employed Sb, X and Wf0 as the
following relationship.
The production rate of bubble surface area in the column, Sb, is expressed by the
following equation (Suzuki et al., 1995; Suzuki et al., 1996).
Sb = 6 A εG(1–εG)4.65{(4/225)(ρL−ρG)2g2/(µLρL)}1/3, (2)
where A, εG, g, ρL, ρG and µL denote a cross–sectional area of the column, the gas
holdup, the gravitational acceleration, the density of liquid and gas and the viscosity of
the liquid, respectively.
In our previous study (Maruyama et al., 2000), we reported that adsorption of
protein onto bubble surface was subjected to Langmuir's isotherm.
4
X = KγCb/(1+KCb), (3)
where K and γ are the equilibrium constant and the saturated surface density,
respectively.
The volumetric flow rate, Wf0, of the liquid in foam at liquid-foam interface can be
correlated using the Ohnesorge number, Z, (Suzuki and Maruyama, 2001),
Wf0 = 2.53 A Ug Z 0.533, (4)
In Eq. (4), the Ohnesorge number, Z, is defined as follows:
Z = µL /(ρL σ db)0.5, (5)
where, σ and db are surface tension and the average bubble diameter in the pool liquid
in the column. The average bubble diameter, db, was estimated by the following
equation (Suzuki and Maruyama, 2001).
db = Ug/[εG(1–εG)4.65 {(4/225)(ρL–ρG)2g2/(ρLµL)}1/3]. (6)
Eqs. (2) and (6) were derived from the following three assumptions: (i) bubbles are
almost homogeneous spheres in aqueous solution including surface-active substances,
(ii) their terminal velocity can be calculated by Allen`s equation (Allen, 1990) in our
experimental range, and (iii) an equation for voidage compensation proposed by Lewis
5
et al. (Lewis et al., 1949) was employed. This was reported in our previous studies
(Suzuki et al., 1995; Suzuki and Maruyama, 2001).
Cb is calculated numerically by combining Eq. (1) and Eqs. (2)-(6) with the
Runge-Kutta method using a spreadsheet program on a personal computer. The
calculated values will be compared with the experimental values.
6
3. Materials and method
3.1 Materials
Ovalbumin from egg white was purchased from Difco Laboratories and was used
without further purification. All the other chemicals were analytical grade reagents. The
pHs of solutions were adjusted with aqueous HCl or NaOH to several desired values.
3.2 Experimental setup
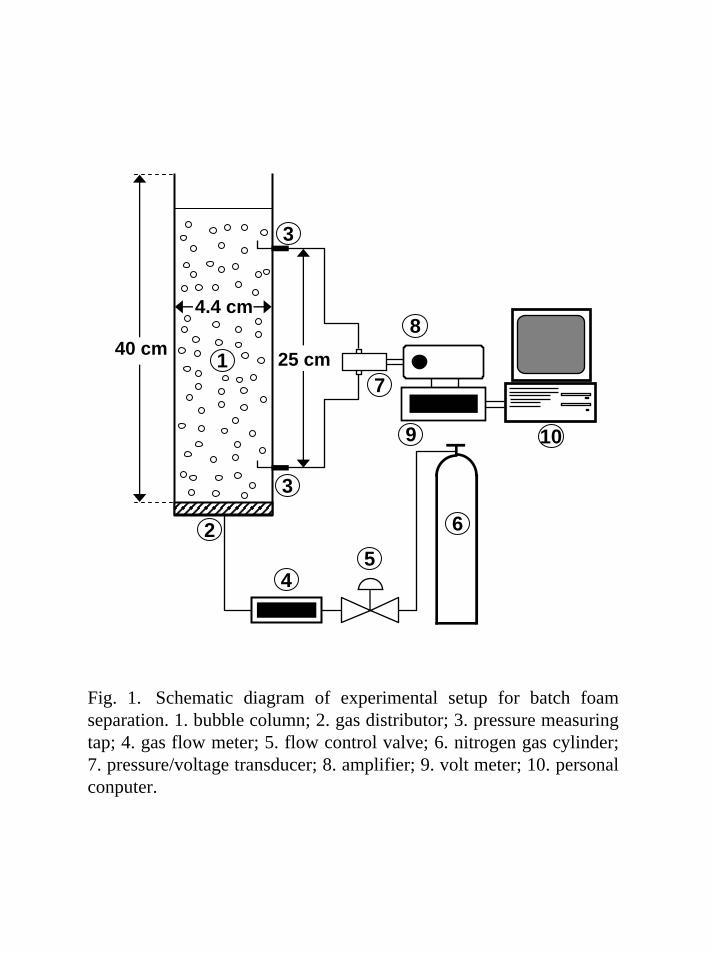
A schematic diagram of an experimental setup for batch foam separation is shown in
Fig. 1. A bubble column of 4.4×10⁻² m inside diameter and 0.4 m height was employed.
The column was made of transparent acrylic resin. Sintered glass filter, which had pores
of 10×10–6–15×10–6 m mean diameter, was installed as a gas distributor at the bottom of
the column. Nitrogen gas was supplied to the column through a distributor. Two
pressure taps for measuring gas holdup in the column were along the wall installed at
intervals of 0.25 m.
3.3 Batch foam separation experiment
All experiments were operated in batchwise with respect to liquid. Ovalbumin (OA)
was used as a model water-soluble protein. The OA solution prepared at desired
concentration was charged into the column without foaming. After that, nitrogen gas
was supplied and was dispersed as bubbles through the distributor. The aspiration of
foam was started at 2×10⁻² m height from the foam-liquid interface within the column to
prevent back flowing the collapsed foam liquid to the column. The bulk liquid in the
column was sampled from a sampling tap at the bottom of the column. The
7

concentrations of protein solution were measured by Lowry method (Lowry et al.,
1951). The pH of the bulk liquid in the column was measured with a pH meter (ORION
Model SA 520). The gas holdup was determined from the difference in static pressure
between the clear and aerated liquids using a differential pressure transducer (Tem-Tech
Lab. Inc., JAPAN). Voltage signals were recorded by a personal computer (NEC
PC–9801VM) via A/D converter (CONTEC).
3.4 Foaming ability experiment
The experiment was carried out according to a modified version of Japanese
Industrial Standard K2518 method (1991). 200 mL of protein solution prepared at
desired concentration and pH was charged into the column, and the nitrogen gas was
dispersed into the solution as bubbles at Ug = 9.86×10⁻⁴ m/s. The foam height from the
liquid–foam interface within the column was measured by a scale along the outside wall
of the column during aeration.
8

4. Results and discussion
4.1 Dependence of removal efficiency on pH
Protein molecules are well known as an amphoteric molecule, therefore, properties
of protein molecule are greatly affected by pH value of solution. Influence of pH on
removal efficiency of ovalbumin (OA) is shown in Fig. 2. The removal efficiency
profile had a maximum peak near the i.e.p. (iso-electronic point) of OA (pH 4.6). In
case of BSA (bovine serum albumin), same tendency has been reported in literature
(Schnepf and Gaden, 1959). Therefore, we carried out all subsequent experiments at pH
4.6.
4.2 Concentration profile of bulk liquid
Typical results of time course of OA concentration in the bulk liquid within the
column are shown in Fig. 3. Superficial gas velocities, Ug, greatly affected the time
course profiles. The values of gas holdup and Sb calculated from Eq. (2) are shown in
Figs. 4a and 4b as a function of Ug, respectively. In the present experiments, Sb is
proportional to Ug linearly. In the case of Fig. 3, the liquid properties of the protein
solutions are not so different because pH and initial concentration of OA were almost
same, removal rate would be dominated by the surface area production rate, Sb.
4.3 Comparison of experimental results and model calculation
Solid lines in Fig. 3 represent the calculated values of bulk liquid concentration by
Runge-Kutta method using spreadsheet program on a personal computer. In these
calculations, the values of gas holdup was employed the experimental values, K and γ
9

were employed 1.01×104 cm3/g and 3.39×10⁻⁷ g/cm2, respectively, which were
determined experimentally in our previous study (Maruyama et al., 2000). The
calculated values have good agreement with the experimental ones in the initial region
(t < 80 min). The difference between both values became larger in the later region (t >
80 min). The calculated lines could reach at zero finally, i.e., the calculation predicted
that OA in the bulk liquid was removed perfectly. On the other hand, the experimental
value of bulk concentration of OA could not yet become zero. The residual
concentration of OA seemed to reach at an apparent equilibrium concentration (plateau
value) in this experimental condition.
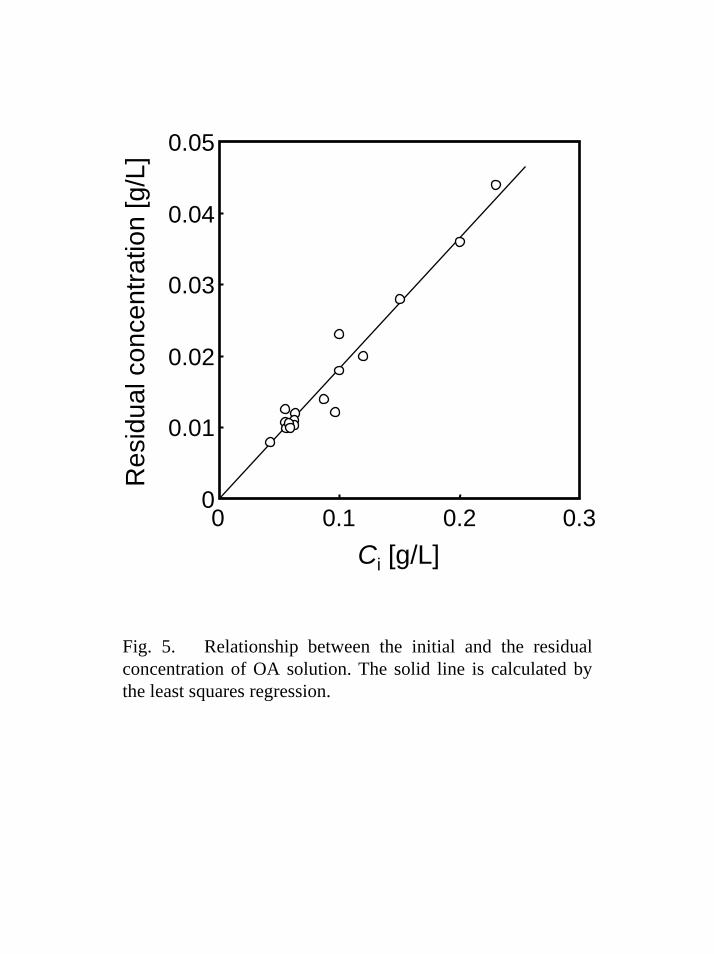
4.4 Influence of initial concentration on residual concentration
Various initial concentrations of OA were employed to investigate whether the
residual concentrations were influenced by the initial concentrations of OA. The result
is shown in Fig. 5 as a function of the initial concentration. The residual concentration
was proportional to the initial concentration. A least-square regression gave this slope as
0.182. Therefore, the residual concentration became ca. 18 % of the initial concentration.
When air or oxygen gas were used as aeration gas in place of nitrogen gas, there were
not so large difference in concentration profiles and the residual concentrations in
comparison with the case of nitrogen gas (data were not shown).
The authors considered that the residual concentration would be caused by (i)
Corresponding the residual bulk concentration to the foaming limit concentration of OA
or (ii) protein denaturation which made OA molecules not adsorb onto bubble surface.
Therefore, we conducted some additional experiments to explore these possibilities and
discussed in the following sections.
10
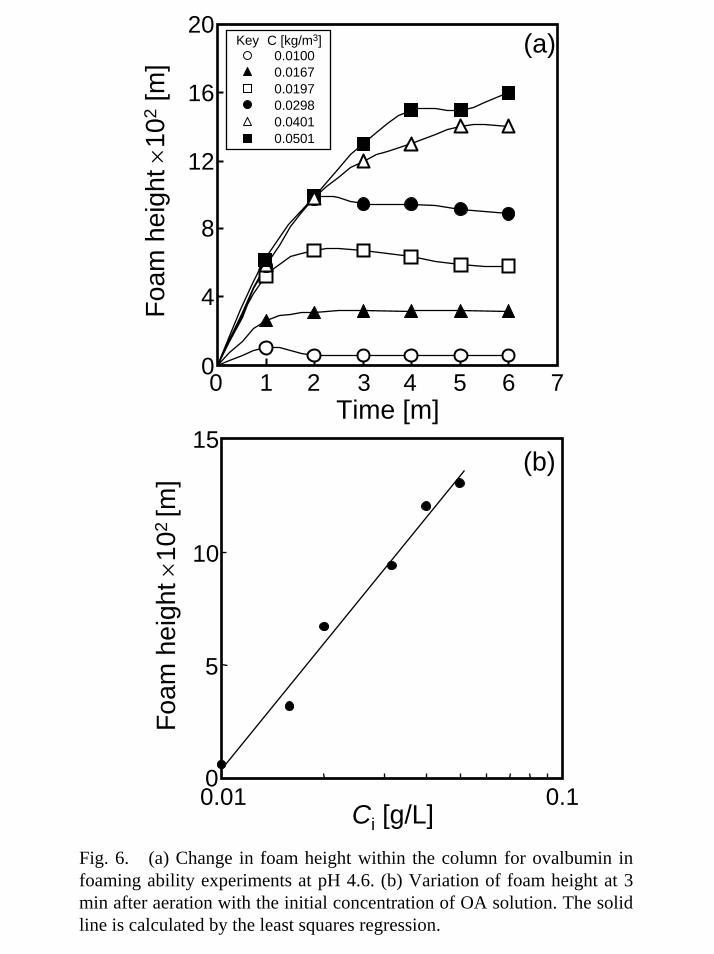
4.5 Determination of foaming limit concentration
The foaming profiles are shown in Fig. 6a. The foam height increased immediately
up to 2 min. The foam height of all concentrations employed in this experiment reached
at each maximum height at 3 min. The foam height at 3 min. was chosen to determine
the foaming limit concentration by the extrapolation graphically. Fig. 6b shows a plot of
the foam height at 3 min. versus the initial concentration of OA in logarithmic scale.
The straight line in this figure was obtained by a least square method. The intercept of
x-axis gave the foaming limit concentration. The value of the intercept was 9.72×10⁻³
g/L.
This result conflicts with the result of Fig. 5. As can be seen in Fig. 5, there were
obviously higher residual concentrations than the foaming limit concentration. This
experimental result suggests that when the initial concentration was employed more
than ca. 0.1 g/L, OA molecules in the bulk solution within the column might be
damaged and denatured by aeration. The damage might make OA molecules be not
adsorbed onto bubble surface.
The authors consider that the gas-liquid interface of bubbles in foam layer was not
only the ground of the denaturation but that of the dispersed bubbles in bulk liquid also
play a role with protein denaturation, since the foam bubbles were originated from the
dispersed bubbles in the bulk liquid within the column. It will be necessary for
preventing proteins from denaturation to shorten residence time of column liquid or to
conduct with smaller air-liquid interface area.
4.6 Correction and verification of the model
11

The authors assumed that a part of the OA molecules adsorbed onto bubble surface
(gas-liquid interface) should be damaged and the damaged OA could not adsorb onto
bubble surface at all. Thus, they would be remained in the bulk liquid phase. The bubble
surface generated within the column would play an important role in the denaturation.
The authors assume an average adsorption density, Xd, which was denatured and became
residual OA molecules in bulk liquid. Eq. (1) can be also rewritten as:
–V(dCb/dt) = Sb (X – Xd) + Wf0 Cb. (7)
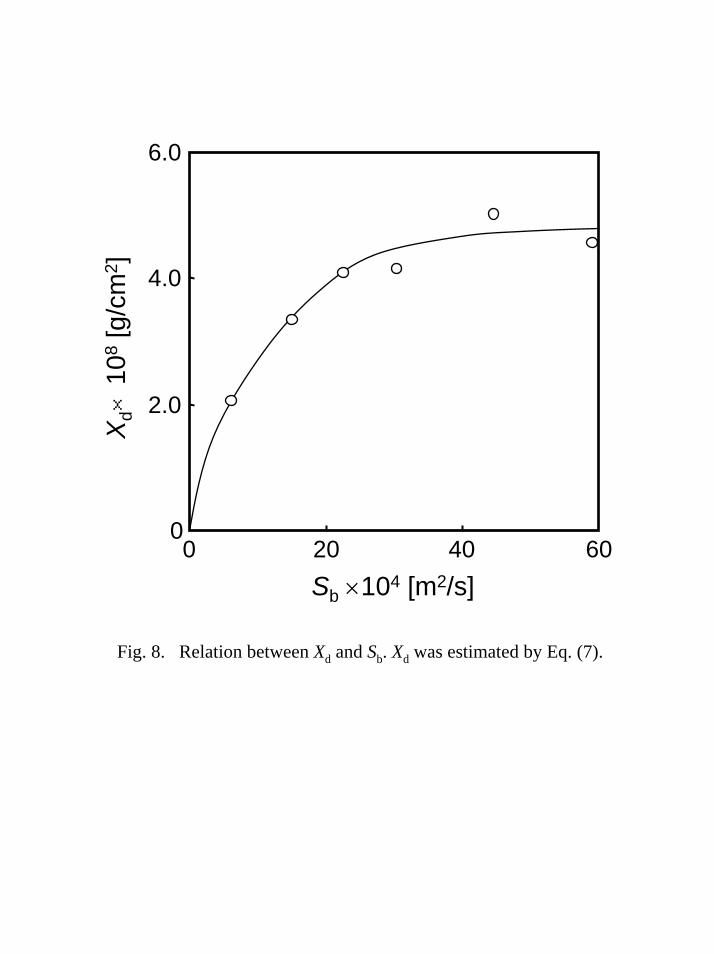
Xd will be determined by fitting the data to Eq. (7) using a least-squares regression.
Typical results of fitting of the data to Eq. (7) shows in Fig. 7. The corrected model
could explain well the concentration profiles in batch foam separation by determination
of one parameter, Xd, using a least-square regression. The determined parameter, Xd, in
Eq. (7) is shown in Fig. 8 as a function of Sb. The Xd increased with increasing Sb up to
ca. 30 cm2/s and reached at plateau level in a region of Sb > ca. 30 cm2/s. Thus, the
value of Xd/γ indicates the degree of OA denaturation. The maximum value of Xd/γ
(denatured fraction) is about 0.15 in the present result.
4.7 Residual concentration of the OA mixture solution
To confirm whatever the OA in the residual solution could be removed, a batch
experiment using a mixture solution was carried out. The mixture solution was
consisted of prepared newly and residual OA solutions. The mixture solution included
4.71×10⁻² g/L of fresh OA and 2.89×10⁻² g/L of the residual OA, respectively. Thus, the
initial concentration of total OA was 7.60×10⁻² g/L.
12
The time course of total OA concentration in the mixture solution is shown in Fig. 9.
Solid curve in Fig. 9 was obtained by calculation with Eq. (7). The calculation was done
with the following conditions for the prepared fresh OA solution: Ci = 4.71×10⁻² g/L, Ug
= 0.0537 cm/s, V = 500 mL (these are experimental condition) and Xd = 4.57×10⁻⁸ g/cm2
(from Fig. 8). The total OA concentration was calculated by the addition of the
concentration of fresh OA and that of the denatured OA, 2.89×10⁻² g/L, since it was
assumed that the denatured OA originated from the residual solution would not be
removed from bulk liquid. As seen in Fig. 9, the profile of the calculated total OA
concentration corresponded to the experimental one. The concentration profiles could
be estimated by the corrected model calculation (Eq. (7)) within ca. 10 % error (average
value). The experimental result suggests that OA molecules originated from the residual
bulk solution would not adsorbed onto bubble surface.
Many investigators reported adsorption of protein at liquid/air interface and
surface-induced unfolding of protein molecules (MacRitchie and Alexander, 1963a-c;
Graham and Phillips, 1979a-c; Guzman etal., 1986; Hunter et al., 1990; Hunter et al.,
1991; Narsimhan and Uraizee, 1992). Graham and Phillips (1979a-c) reported
adsorption of casein, BSA and lysozyme at air/water as well as oil/water interface and
concluded that the extent of unfolding proteins depended on the surface pressure and
that the time scale of the surface rearrangement in much larger than that of adsorption.
The conformational change due to unfolding has been reported (Damodaran and Song,
1988; Clark et al., 1988 and so on).
Due to recent developments in techniques that can be exploited to obtained insight
in the molecular details of these surface-unfolded proteins and their surface activity,
many progress have been made in the understanding of the process. Rodríguez Patino et
13

al. (2004) studied adsorption of soy globulin at air/water interface and its adsorption
kinetics by means of surface tension measurement coupled with Brewster angle
microscopy. The result showed that the adsorption kinetics at the beginning of the
adsorption was diffusion-controlled, however, the mechanism that controls the
long-term adsorption is the penetration and unfolding of the protein. Lu et al. (2005)
reported structural conformations of human lactoferrin adsorbed at air/water interface
by neutron reflectivity. The result showed that unfolded lactoferrin was characterized by
two main regions, a top layer of 10-20 Å with a high polypeptide volume fraction of 0.5
on the air side and a bottom layer of 50-80 Å with a low polypeptide volume fraction of
0.2 immersed in water. The top layer is predominantly exposed to air, indicating the
strong hydrophobic nature of the polypeptide chain in this region.
Clarkson et al. (1999a) pointed out that protein denaturation in foam can be directly
correlated with the interfacial exposure area and that shear stress and oxidation did not
significantly contribute denaturation of protein. They also reported that in foam, protein
molecules would undergo changes in tertiary and in some particular cases secondary
structure and that some proteins were found to form aggregates after foaming (Clarkson
et al., 1999b). Wierenga et al. (2003) studied influence of exposed hydrophobicity on
kinetics of protein at air/water interface using native and caprylated ovalbumin. The
adsorption kinetics of the caprylated ovalbumin follow the calculations form diffusional
transport more closely, which shows that the energy barrier for adsorption of caprylated
ovalbumin is much lower than for the native ovalbumin. Bramanti et al (2006)
investigated surface activity of chemically denatured proteins by using dynamic surface
tension detector. The results showed that surface pressure of some denatured proteins
generally increased as denaturants (urea, GdmSCN and GdmHCl). Lechevalier, et al.,
14

(2003) investigated structural modification of ovalbumin, ovotransferrin and lysozyme
at air-water interface by SDS-PAGE, intrinsic and ANS fluorometry and circular
dichroism techniques and reported that ovalbumin undergoes secondary and tertiary
structure modifications that are weaker than those for ovotransferrin, however, because
of its free sulfhydryl groups, these changes are enough to enable intermolecular
sulfhydryl -disulfide exchanges, leading to aggregation of ovalbumin.
The results in this study suggest that the denatured OA did not adsorbed on bubble
surface and had lower surface activity rather than that of native OA. However, the
present result is insistent with experimental facts reported by Wierenga et al. (2003) and
Bramanti et al. (2006). If denatured OA formed aggregates by means of binding with
exposed hydrophobic functional groups between unfolded OA molecules, resulting that
the aggregated proteins exposed their hydrophilic functional groups (polar groups) to
bulk liquid, thus, the aggregates might not adsorb on bubble surface because of its high
hydrophilicity. The lower surface activity of denatured OA observed in this study may
be related to the aggregating process reported by Lechevalier, et al., (2003).
15

5. Conclusions
The authors conducted removal of dissolved protein by batch foam separation
method. The experimental results of batch foam separation and foaming ability test
revealed that residual OA molecules were not adsorbed onto bubble surface. Residual
fraction of OA was ca. 18 % of the initial OA concentration in the present experimental
conditions. These suggest that OA molecules were denatured due to some interactions
between the molecules and gas-liquid interface. The corrected model estimating the
bulk concentration profile could represent the concentration profile in bulk liquid within
the column by taking account of average surface density, Xd, converting OA molecule
into the denatured one. From the calculations, The maximum value of denatured
fraction was ca. 0.15 in the present experimental conditions. The further study of
improvement on more effective protein removal by batch foam separation will be
needed from the viewpoints of wastewater treatment.
16

Notation
A = a cross sectional area of bubble column [m2]
Cb = concentration of bulk liquid in bubble column [kg/m 3 ]
Ci = initial concentration of bulk liquid in bubble column [kg/m 3 ]
db = the average bubble diameter defined by Eq. [4] [m]
ε = gas holdup [-]
g = gravitational acceleration [m/s2]
γ = saturated surface density of protein [kg/m 2 ]
µL = liquid viscosity [kg/(m s)]
ρG = gas density [kg/m 3 ]
ρL = liquid density [kg/m 3 ]
σ = surface tension [N/m]
Sb = the production rate of bubble surface area
in the dispersion phase [m2/s]
Ug = superficial gas velocity [m/s]
V = liquid volume within bubble column [m3]
Wf0 = the intrinsic volumetric flow rate of the liquid in foam
at the liquid – foam interface within bubble column [m3/s]
X = surface density of protein [kg/m 2 ]
Xd = average surface density which should convert
protein molecule into the denatured one [kg/m2]
Z = Ohnesorge number [-]
17
References
Allen, H.S., 1990. The motion of a sphere in a viscous fluids. Phil. Mag. 50, 323-338.
Beheir, S.G. Aziz, M., 1996. Removal of Zn(II) from dilute aqueous solutions and
radioactive process wastewater by foam separation. J. Radioanal. Nucl. Chem. 209,
75-89.
Bhattacharya, P., Ghosal, S.K., Sen, K., 1991. Effect of physicochemical parameters on
the separation of proteins from human placental extract using a continuous foam
fractionating column. Sep. Sci. Technol. 26, 1279-1293.
Bramanti, E., Allegrini, C., Onor, M., Raspi, G., Skogerboe, K.J., Synovec, R.E., 2006.
Flow injection analysis with diode array adsorbance detection and dynamic surface
tension detection for studying denaturation and surface activity of globular proteins.
Anal. Biochem. 351, 100-113.
Brown, L., Narsimhan, G., Wankat, P.C., 1990. Foam fractionation of globular proteins.
Biotechnol. Bioeng. 36, 947-959.
Clark, D.C., Smith, L.J., Wilson, D.R., 1988. A spectroscopic study of the
conformational properties of foamed bovine serum albumin. J. Colloid Interface Sci.
121, 136-147.
Clarkson, J.R., Cui, Z.F., Darton, R.C., 1999a. Protein denaturation in foam I.
mechanism study. J. Colloid Interface Sci. 215, 323-332.
Clarkson, J.R., Cui, Z.F., Darton, R.C., 1999b. Protein denaturation in foam II. surface
activity and conformational change. J. Colloid Interface Sci. 215, 333-338.
Clarkson, J.R., Cui, Z.F., Darton, R.C., 2000. Effect of solution conditions on protein
damage in foam. Biochem. Eng. J. 4, 107-114.
18

Damodaran, S., Song, K.B., 1988. Kinetics of adsorption of proteins at interfaces: role
of protein conformation in diffusional adsorption. Biochim. Biophys. Acta 954,
253-264.
Du, L., Prokop, A., Tanner, R.D., 2002. Effect of bubble size on foam fractionation of
ovalbumin. Applied. Biochem. Bioeng. 98, 1075-1092.
Graham, D.E., Phillips, M.C., 1979a. Proteins at liquid interfaces I. kinetics of
adsorption and surface denaturation. J. Colloid Interface Sci. 70, 403-414.
Graham, D.E., Phillips, M.C., 1979b. Proteins at liquid interfaces II. adsorption
isotherms. J. Colloid Interface Sci. 70, 415-426.
Graham, D.E., Phillips, M.C., 1979c. Proteins at liquid interfaces III. molecular
structures of adsorbed films. J. Colloid Interface Sci. 70, 427-439.
Guzman, R.Z., Carbonell, R.G., Kilpatrick, P.K., 1986. The adsorption of proteins to
gas-liquid interfaces, J. Colloid Interface Sci. 114, 536-547.
Huang, S.D., Ho, H., Li, Y., Lin, C., 1995. Adsorbing colloid flotation of heavy metal
ions from aqueous solutions at large ionic strength. Environ. Sci. Technol. 29,
1802-1807.
Hunter, J.R., Kilpatrick, P.K., Carbonell, R.G., 1990. Lysozyme adsorption at the
air/water interface. J. Colloid Interface Sci. 137, 462-482.
Hunter, J.R., Kilpatrick, P.K., Carbonell, R.G., 1991. β-casein adsorption at the air/water
interface. J. Colloid Interface Sci. 142, 429-447.
Japanese industrial standard K2518 (petroleum products–lubricating oils–determination
of foaming characteristics), 1991.
Karger, B.L. Miller, M.W., 1969. Selectivity in foam separation by control of charge on
the extracting solute: metal-chloro complexes. Anal. Chim. Acta 48, 273-290.
19
Lechevalier, V., Croguennec, T., Pezennec, S., Guérin-Dubiard, C., Pasco, M., Nau, F.,
2003. Ovalbumin, ovotransferrin, lysozyme: three model proteins for structural
modifications at air-water interface. J. Agric. Food Chem. 51, 6354-6361.
Lewis, W.K., Gilliland, E.R., Bauer, W.C., 1949. Characteristics of fluidized particles.
Ind. Eng. Chem. 41, 1104-1117.
Liu, Z., Liu, Z., Wang, D., Ding, F., Yuan N., 1998. On the denaturation of enzymes in
the process of foam fractionation. Bioseparation 7, 167-174.
Lowry, O.H., Rowebrough, N.J., Farr, A.L., Randall, R.J., 1951. Protein measurement
with the folin phenol reagent. J. Biol. Chem. 193, 265-275.
Lu, J.R., Perumal, S., Zhao, X., 2005. Surface-induced unfolding of human lactoferrin.
Langmuir 21, 3354-3361.
Maa, Y-F, Hsu, C.C., 1997. Protein denaturation by combined effect of shear and
air-liquid interface. Biotechnol. Bioeng. 54, 503-512.
MacRitchie, F., Alexander, A.E., 1963a, Kinetics of adsorption of proteins at interfaces
part I. the role of bulk diffusion in adsorption. J. Colloid Interface Sci. 18, 453-457.
MacRitchie, F., Alexander, A.E., 1963b, Kinetics of adsorption of proteins at interfaces
part II. the role of pressure barriers in adsorption. J. Colloid Interface Sci. 18,
458-463.
MacRitchie, F., Alexander, A.E., 1963c, Kinetics of adsorption of proteins at interfaces
part III. the role of electrical barriers in adsorption. J. Colloid Interface Sci. 18,
464-469.
Maruyama, H., Suzuki, A., Seki, H., 2000. Adsorption of water–soluble proteins onto
bubbles in continuous foam separation. J. Colloid Interface Sci. 224, 76-83.
Mohan, S.B., Smith, L., Kemp, W., Lyddiatt, A., 1992. An immunochemical analysis of
20

beer foam. J. Inst. Brew. 98, 187-192 .
Montero, G.A., Kirchner, T.F., Tanner, R.D., 1993. Bubble and foam concentration of
cellulase. Appl. Biochem. Biotechnol. 39/40, 467-475.
Narsimhan, G., Uraizee, F., 1992. Kinetics of adsorption of globular proteins at
air-liquid interface. Biotechnol. Prog. 8, 187-196.
Ng, K.S., Muller, J.C. Walden, C.C., 1976. Foam separation for detoxification of
bleached kraft mill effluents, J. WPCF 48, 458-472.
Rodríguez Patino, J.M., Carrera Sanchez, C., Molina Ortiz, S.E., Rodríguez Niño, M.R.,
Cristina Añón. M., 2004. Adsorption of soy globulin films at air-water interface. Ind.
Eng. Chem. Res. 43, 1681-1689.
Sarkar, P., Bhattacharya, P., Mukerjea, R.N., Mukerjea, M., 1987. Isolation and
purification of protease from human placenta by foam fractionation. Biotechnol.
Bioeng. 29, 934-940.
Schoen, H.M., 1966. Foam separation as a purification and preparative tool. Ann. N.Y.
Acad. Sci. 137, 148-161.
Schnepf, R.W, Gaden, G.E.L., 1959. Foam fractionation of proteins: concentration of
aqueous solutions of bovine serum albumin. J. Biochem. Microbiol. Technol. Eng. 1,
1-8.
Suzuki, A., Maruyama, H., Seki, H. Hayashi, T., 1995. Application of nonfoaming
bubble separation to enrichment of dilute dye solution. J. Chem. Eng. Jpn. 28,
115-117.
Suzuki, A., Maruyama, H., Seki, H., 1996. Adsorption behavior of organic substances
onto bubble surface in nonfoaming bubble separation. J. Chem. Eng. Jpn. 29,
794-798.
21

Suzuki, A., Maruyama, H., 2001. Influence of liquid properties and operating variables
on enrichment ratio in nonfoaming and foaming adsorptive bubble separation
techniques. J. Colloid Interface Sci. 238, 54-61.
Wierenga, P.A., Meinders, M.B.J., Egmond, M.R., Voragen, F.A.G., de Jongh, H.J.,
2003. Protein exposed hydrophobicity reduces the kinetics barrier for adsorption of
ovalbumin to air-water interface. Langmuir 19, 8964-8970.
Wong, C.H., Hossain, M.M., Davies, C.E., 2001. Performance of a continuous foam
separation column as a function of process variables. Bioproc. Biosyst. Eng. 24,
73-81.
Varley, J., Ball, S.K., 1994. Foam separation for enzyme recovery: maintenance of
activity. Special Publication - Royal Society of Chemistry, 158 (Separations for
Biotechnology 3), 525-531.
22

Captions of Figures
Fig. 1. Schematic diagram of experimental setup for batch foam separation. 1. bubble
column; 2. gas distributor; 3. pressure measuring tap; 4. gas flow meter; 5. flow control
valve; 6. nitrogen gas cylinder; 7. pressure/voltage transducer; 8. amplifier; 9. volt
meter; 10. personal conputer.
Fig. 2. Influence of pH on removal efficiency of ovalbumin (OA) by batch wise
foam separation. The initial concentration of OA was 3.68×10⁻² kg/m3 and superficial
gas velocity is 5.37×10⁻⁴ m/s.
Fig. 3. Typical time course of ovalbumin removal from bulk liquid by batch wise
foam separation. Solid lines were model predictions calculated from the present model.
Fig. 4. (a) Change in gas holdup with superficial gas velocity, Ug. The solid line was
calculated by a least square regression. (b) Variation of bubble surface area production
rate, Sb, with superficial gas velocity, Ug. The values were calculated from Eq. [2].
Fig. 5. Relationship between the initial and the residual concentration of OA solution.
The solid line is calculated by the least squares regression.
Fig. 6. (a) Change in foam height within the column for ovalbumin in foaming
23

ability experiments at pH 4.6. (b) Variation of foam height at 3 min after aeration with
the initial concentration of OA solution. The solid line is calculated by the least squares
regression.
Fig. 7. Typical results of fitting of the data to Eq. [7].
Fig. 8. Relation between Xd and Sb. Xd was estimated by Eq. [7].
Fig. 9. Comparison of the calculated profile (solid line) and the experimental one.
The experiment was conducted mixture solution of prepared fresh and the residual
solution of OA. The former and the latter concentrations were 0.0471 and 0.0289 g/L,
respectively. In this calculation, Xd = 4.57×10⁻⁸ g/cm2 was employed.
24
1
2
4.4 cm
4
6
7
8
9
3
3
40 cm 25 cm
5
10
Fig. 1. Schematic diagram of experimental setup for batch foam separation. 1. bubble column; 2. gas distributor; 3. pressure measuring tap; 4. gas flow meter; 5. flow control valve; 6. nitrogen gas cylinder; 7. pressure/voltage transducer; 8. amplifier; 9. volt meter; 10. personal conputer.

0
0.2
0.4
0.6
0.8
1
2 4 6 8pH
Rem
oval
effi
cien
cy
Fig. 2. Influence of pH on removal efficiency of ovalbumin (OA) by batch wise foam separation. The initial concentration of OA was 3.68×10⁻² kg/m3 and superficial gas velocity is 5.37×10⁻⁴ m/s.

0
0.2
0.4
0.6
0.8
1
0 100 200 300 400 500 600
5.8
5.55.6
Ci ×102 [kg/m3] Ug ×104 [m/s]1.97
5.372.68
KeyC
b/Ci
Time [m]
Fig. 3. Typical time course of ovalbumin removal from bulk liquid by batch wise foam separation. Solid lines were model predictions calculated from the present model.

0
3
6
9
12
15
0 5 10 15Ug×104 [m/s]
0
30
60
90
120
150
Sb
(a)
(b)
×104
[m2 /s
]G
as h
oldu
p×10
3
Fig. 4. (a) Change in gas holdup with superficial gas velocity, Ug. The solid line was calculated by a least square regression. (b) Variation of bubble surface area production rate, Sb, with superficial gas velocity, Ug. The values were calculated from Eq. (2).
0.05
0.02
0.03
0.04
0.01
00 0.30.1 0.2
Ci [g/L]
Res
idua
l con
cent
ratio
n [g
/L]
Fig. 5. Relationship between the initial and the residual concentration of OA solution. The solid line is calculated by the least squares regression.
0
4
8
12
16
20
0 1 2 3 4 5 6 7Time [m]
Foam
hei
ght ×
102
[m] 0.0100
0.01670.01970.02980.04010.0501
Key C [kg/m3]
0
5
10
15
0.01 0.1Ci [g/L]
Foam
hei
ght ×
102 [m
]
(a)
(b)
Fig. 6. (a) Change in foam height within the column for ovalbumin in foaming ability experiments at pH 4.6. (b) Variation of foam height at 3 min after aeration with the initial concentration of OA solution. The solid line is calculated by the least squares regression.

0
0.2
0.4
0.6
0.8
1
0 100 200 300 400 500Time [m]
Cb/C
i
5.77
5.48
5.68
Ci ×102 [kg/m3] Ug ×104 [m/s]
1.97
5.37
3.94
Key
Fig. 7. Typical results of fitting of the data to Eq. (7).
0
2.0
4.0
6.0
0 20 40 60Sb ×104 [m2/s]
Xd×
108
[g/c
m2 ]
Fig. 8. Relation between Xd and Sb. Xd was estimated by Eq. (7).

0
2.0
4.0
6.0
8.0
0 100 200 300 400
×10
5[g
/L]
Cb
Time [m]
Fig. 9. Comparison of the calculated profile (solid line) and the experimental one. The experiment was conducted mixture solution of prepared fresh and the residual solution of OA. The former and the latter concentrations were 0.0471 and 0.0289 g/L, respectively. In thiscalculation, Xd = 4.57×10⁻⁸ g/cm2 was employed.