bass lake 31-0576-00 itasca county - rmbel · bass lake 31-0576-00 itasca county lake water quality...
TRANSCRIPT

RMB Environmental Laboratories, Inc. 1 of 22 2015 Bass Lake
Bass Lake 31-0576-00 ITASCA COUNTY
Lake Water Quality
Summary Bass Lake is located 5 miles northwest of Grand Rapids, MN in Itasca County. It is a long lake covering 2,765 acres (Table 1). Bass Lake has five inlets and one outlet, which classify it as a drainage lake. Water enters Bass Lake from other lakes in the area. Bass Brook exits the lake to the south into the Mississippi River. Water quality data have been collected on Bass Lake from 1993 to present (Tables 2 & 3). These data show that the lake is mesotrophic (TSI = 44) with mostly clear water conditions most of the summer and excellent recreational opportunities. Bass Lake has an organized association that is involved in activities
such as water quality monitoring and education.
Table 1. Bass Lake location and key physical characteristics.
Location Data
MN Lake ID: 31-0576-00
County: Itasca
Ecoregion: Northern Lakes and Forests
Major Drainage Basin: Mississippi R. - Headwaters
Latitude/Longitude: 47.338199/-93.676082
Invasive Species: Heterosporis
Physical Characteristics
Surface area (acres): 2,765
Littoral area (acres): 1,267
% Littoral area: 46
Max depth (ft), (m): 76.0, 23.2
Inlets: 5
Outlets: 1
Public Accesses: 3
Table 2. Availability of primary data types for Bass Lake.
Data Availability
Transparency data
Good data set from 1993-2014.
Chemical data
Good data set from 2008-2014.
Inlet/Outlet data
No inlet or outlet data exist for Bass Lake.
Recommendations
For recommendations refer to page 20.

RMB Environmental Laboratories, Inc. 2 of 22 2015 Bass Lake
Lake Map
Table 3. Monitoring programs and associated monitoring sites. Monitoring programs include the Citizen Lake Monitoring Program (CLMP), Itasca County Lake Assessment (ICLA), Lake Assessment Project (LAP), and RMB Environmental Laboratories Lakes Program (RMB).
Lake Site Depth (ft) Monitoring Programs
201 70 CLMP: 1994-2014; ICLA: 1992, 2002; LAP: 2003; RMB: 2008-2014
202 34 CLMP: 1993-2014; ICLA: 1992-1993
203 14 CLMP: 1993-1999, 2001
204 20 CLMP: 1993-1994, 2001; LAP: 2003; RMB: 2008-2014
205 45 CLMP: 1993-1999; ICLA: 1992-1993
206 30 CLMP: 2001
Figure 1. Map of Bass Lake with 2010 aerial imagery and illustrations of lake depth contour lines, sample site locations, inlets and outlets, and public access points. The light green areas in the lake illustrate the littoral zone, where the sunlight can usually reach the lake bottom, allowing aquatic plants to grow.

RMB Environmental Laboratories, Inc. 3 of 22 2015 Bass Lake
Average Water Quality Statistics The information below describes available chemical data for Bass Lake through 2014 (Table 4). Data for total phosphorus, chlorophyll a, and Secchi depth are from the primary site 201.
Minnesota is divided into 7 ecoregions based on land use, vegetation, precipitation and geology. The MPCA has developed a way to determine the "average range" of water quality expected for lakes in each ecoregion. For more information on ecoregions and expected water quality ranges, see page 11. Bass Lake is in the Northern Lakes and Forests Ecoregion.
Table 4. Water quality means compared to ecoregion ranges and impaired waters standard.
Parameter
Mean
Ecoregion Range1
Impaired Waters Standard2
Interpretation
Total phosphorus (ug/L) 18.0 14 – 27 > 30 Results are within the expected range for the Northern Lakes and Forests Ecoregion.
3Chlorophyll a (ug/L) 5.5 4 – 10 > 9
Chlorophyll a max (ug/L) 15.0 < 15
Secchi depth (ft) 15.8 8 – 15 < 6.5
Dissolved oxygen See page 8 Dissolved oxygen depth profiles show that the lake stratifies in the summer and is dimictic.
Total Kjeldahl Nitrogen (mg/L)
0.7 <0.4 – 0.75 Indicates insufficient nitrogen to support summer nitrogen-induced algae blooms.
Alkalinity (mg/L) NA 40 – 140 No data available.
Color (Pt-Co Units) 10.5 10 – 35 Indicates clear water with little to no tannins (brown stain).
pH 8.2 7.2 – 8.3 Within the expected range for the ecoregion. Lake water pH less than 6.5 can affect fish spawning and the solubility of metals in the water.
Chloride (mg/L) 2.5 0.6 – 1.2 Slightly above the expected range for the ecoregion, but still considered low level.
Total Suspended Solids (mg/L)
3.2 <1 – 2 Slightly above the expected range for the ecoregion, but still considered low level.
Conductivity (umhos/cm) 193.6 50 – 250 Within the expected range for the ecoregion.
TN:TP Ratio 36.6 25:1 - 35:1 Within the expected range for the ecoregion, and shows the lake is phosphorus limited.
1The ecoregion range is the 25th-75th percentile of summer means from ecoregion reference lakes 2For further information regarding the Impaired Waters Assessment program, refer to http://www.pca.state.mn.us/water/tmdl/index.html 3Chlorophyll a measurements have been corrected for pheophytin Units: 1 mg/L (ppm) = 1,000 ug/L (ppb)
RMB Environmental Laboratories, Inc. 4 of 22 2015 Bass Lake
Water Quality Characteristics - Historical Means and Ranges
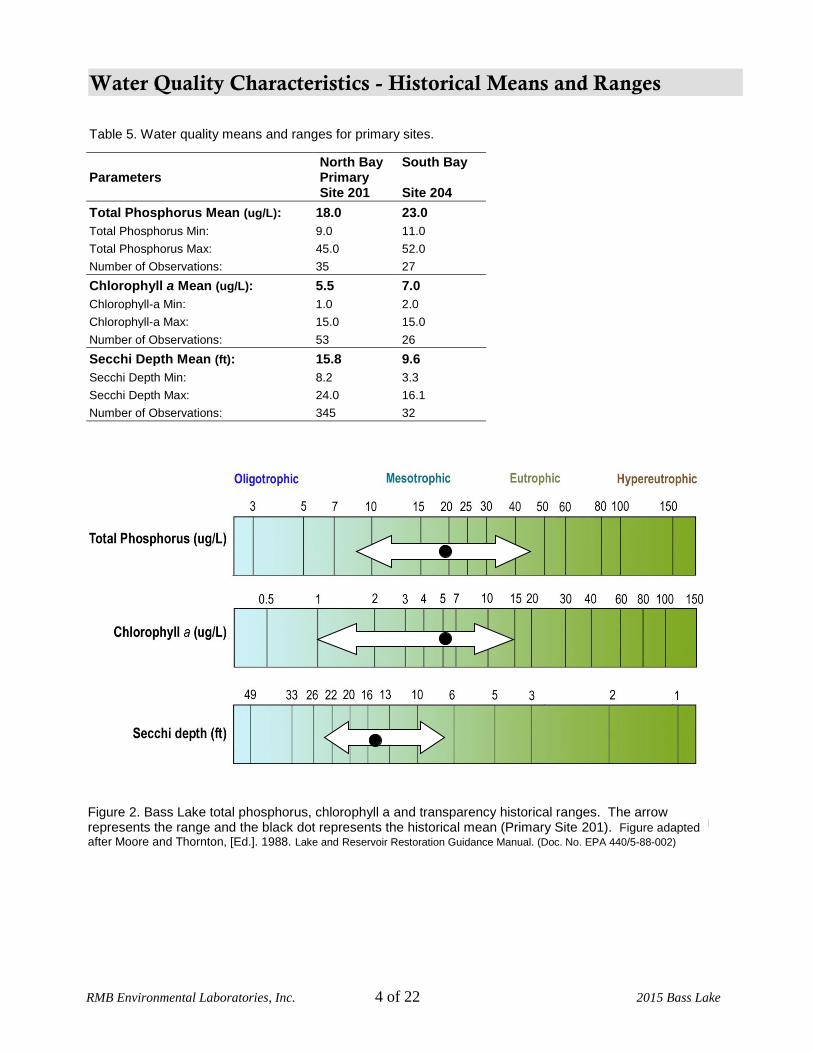
Table 5. Water quality means and ranges for primary sites.
Parameters North Bay Primary Site 201
South Bay Site 204
Total Phosphorus Mean (ug/L): 18.0 23.0
Total Phosphorus Min: 9.0 11.0
Total Phosphorus Max: 45.0 52.0
Number of Observations: 35 27
Chlorophyll a Mean (ug/L): 5.5 7.0
Chlorophyll-a Min: 1.0 2.0
Chlorophyll-a Max: 15.0 15.0
Number of Observations: 53 26
Secchi Depth Mean (ft): 15.8 9.6
Secchi Depth Min: 8.2 3.3
Secchi Depth Max: 24.0 16.1
Number of Observations: 345 32
Figure 2. Lake “insert” total phosphorus, chlorophyll a and transparency historical ranges. The arrow represents the range and the black dot represents the historical mean (Primary Site xxx). Figure adapted
after Moore and Thornton, [Ed.]. 1988. Lake and Reservoir Restoration Guidance Manual. (Doc. No. EPA 440/5-88-002)
Figure 2. Bass Lake total phosphorus, chlorophyll a and transparency historical ranges. The arrow represents the range and the black dot represents the historical mean (Primary Site 201). Figure adapted
after Moore and Thornton, [Ed.]. 1988. Lake and Reservoir Restoration Guidance Manual. (Doc. No. EPA 440/5-88-002)

RMB Environmental Laboratories, Inc. 5 of 22 2015 Bass Lake
Transparency (Secchi Depth) Transparency is how easily light can pass through a substance. In lakes it is how deep sunlight penetrates through the water. Plants and algae need sunlight to grow, so they are only able to grow in areas of lakes where the sun penetrates. Water transparency depends on the amount of particles in the water. An increase in particulates results in a decrease in transparency. The transparency varies year to year due to changes in weather, precipitation, lake use, flooding, temperature, lake levels, etc. The annual mean transparency in Bass Lake ranges from 13.6-18 feet at site 201 and 6.7-12.1 feet at site 204 (Figure 3). The annual means are lower in site 204 than 201. These two basins are very different morphologically, however. The southern bay (site 204) is only 20 feet deep where the northern bay (site 201) is 70 feet deep. For trend analysis, see page 10. Transparency monitoring should be continued annually at sites 201 and 204 in order to track water quality changes.
Figure 3. Annual mean transparency compared to long-term mean transparency.
Bass Lake transparency ranges from 8.2 to 24.0 ft at the primary site (201). Figure 4 shows the seasonal transparency dynamics. The maximum Secchi reading is usually obtained in early summer. Bass Lake transparency is high in May and June, and then declines through August. This transparency dynamic is typical of a Minnesota lake. The dynamics have to do with algae and zooplankton population dynamics, and lake turnover. It is important for lake residents to understand the seasonal transparency dynamics in their lake so that they are not worried about why their transparency is lower in August than it is in June. It is typical for a lake to vary in transparency throughout the summer.
0
10
20
30
40
50
60
70
80
90
100
0
2
4
6
8
10
12
14
16
18
20
Pre
cip
itat
ion
(in
)
Secc
hi D
ep
th (
ft)
Date
Transparency and Precipitation
Precipitation
Site 201
Site 201 Mean
Site 204
Site 204 mean

RMB Environmental Laboratories, Inc. 6 of 22 2015 Bass Lake
Figure 4. Seasonal transparency dynamics and year to year comparison (Primary Site 201). The black line represents the pattern in the data.
User Perceptions When volunteers collect Secchi depth readings, they record their perceptions of the water based on the physical appearance and the recreational suitability. These perceptions can be compared to water quality parameters to see how the lake "user" would experience the lake at that time. Looking at transparency data, as the Secchi depth decreases the perception of the lake's physical appearance rating decreases. Bass Lake was rated as being "not quite crystal clear" 86% of the time by samplers at site 201 between 1994 and 2014 (Figure 5).
Figure 5. Bass Lake physical appearance ratings by samplers.
0
5
10
15
20
25
30
Secc
hi D
ep
th (
ft)
Seasonal Transparency Dynamics19941995199619971998199920002001200220032005200620072008200920102011201220132014Grand TotalPoly. (Grand Total)
4%
86%
10%
4% Crystal clear water 86% Not quite crystal clear – a little algae visible 10% Definite algae – green, yellow, or brown color apparent 0% High algae levels with limited clarity and/or mild odor apparent 0% Severely high algae levels
Physical Appearance Rating

RMB Environmental Laboratories, Inc. 7 of 22 2015 Bass Lake
0
5
10
15
20
25
30
35
40
45
Tota
l Ph
osp
ho
rus
(ug/
L)
Total Phosphorus 1992
2003
2008
2010
2011
2012
2013
2014
As the Secchi depth decreases, the perception of recreational suitability of the lake decreases. Bass Lake was rated as being "beautiful" 33% of the time from 1994 to 2014 (Figure 6).
Figure 6. Recreational suitability rating, as rated by the volunteer monitor.
Total Phosphorus Bass Lake is phosphorus limited, which means that algae and aquatic plant growth is dependent upon available phosphorus. Total phosphorus was evaluated in Bass Lake at site 201 (north bay) in 1992, 2003, 2008, 2010-2014. The phosphorus concentrations appear to be higher in spring and fall, which could be due to lake turnover. The majority of the data points fall into the mesotrophic/oligotrophic border (Figure 7).
33%
67%
33% Beautiful, could not be better 67% Very minor aesthetic problems; excellent for swimming, boating 0% Swimming and aesthetic enjoyment of the lake slightly impaired because of algae levels 0% Desire to swim and level of enjoyment of the lake substantially reduced because of algae levels 0% Swimming and aesthetic enjoyment of the lake nearly impossible because of algae levels
Recreational Suitability Rating
Oligotrophic
Mesotrophic
Eutrophic
Figure 7. Historical total phosphorus concentrations (ug/L) for Bass Lake site 201.

RMB Environmental Laboratories, Inc. 8 of 22 2015 Bass Lake
0
2
4
6
8
10
12
14
16
Ch
loro
ph
yll a
(u
g/L)
Chlorophyll a
1992
2003
2008
2010
2011
2012
2013
2014
Minor Algae
0
10
20
30
40
50
60
Tota
l Ph
osp
ho
rus
(ug/
L)
Total Phosphorus
2003
2008
2009
2010
2011
2012
2013
2014
Total phosphorus was evaluated in Bass Lake at site 204 (south bay) in 2003, 2008-2014. The phosphorus concentrations are relatively stable all year except for one outlier in 2003. The majority of the data points fall into the mesotrophic range (Figure 8). Site 201 has lower phosphorus than site 204. For more explanation of this see the Summary and Recommendations section at the end of this report. Figure 8. Total Phosphorus concentrations for Bass Lake, site 204.
Chlorophyll a Chlorophyll a is the pigment that makes plants and algae green. Chlorophyll a is tested in lakes to determine the algae concentration or how "green" the water is. Chlorophyll a concentrations greater than 10 ug/L are perceived as a mild algae bloom, while concentrations greater than 20 ug/L are perceived as a nuisance. Chlorophyll a was evaluated in Bass Lake at site 201 in 1992, 2003, 2008, 2010-2014 (Figure 9). Chlorophyll a concentrations went above 10 ug/L only once, which means that most years there are no visible algae blooms. There was not much variation over the years monitored and chlorophyll a concentrations remained relatively steady over the summer.
Figure 9. Chlorophyll a concentrations (ug/L) for Bass Lake at site 201.
Oligotrophic
Mesotrophic
Eutrophic

RMB Environmental Laboratories, Inc. 9 of 22 2015 Bass Lake
0
2
4
6
8
10
12
14
16
Ch
loro
ph
yll a
(u
g/L)
Chlorophyll a
2003
2008
2010
2011
2012
2013
2014
Minor Algae
0 2 4 6 8 10 12
0
1
2
3
4
5
6
7
8
9
10
11
13
14
15
16
17
18
19
20
21
Dissolved Oxygen (mg/L)
De
pth
(m)
Chlorophyll a was evaluated in Bass Lake at site 204 in 2003, 2008, 2010-2014 (Figure 10). Chlorophyll a concentrations reached 10 ug/L in 2003, 2010 and 2011, which means that there were minor algae blooms. There was not much variation over the years monitored and chlorophyll a concentrations remained relatively steady over the
summer.
Dissolved Oxygen
Dissolved Oxygen (DO) is the amount of oxygen dissolved in lake water. Oxygen is necessary for all living organisms to survive except for some bacteria. Living organisms breathe in oxygen that is dissolved in the water. Dissolved oxygen levels of <5 mg/L are typically avoided by game fisheries. Bass Lake is a deep lake, with a maximum depth of 76 feet. Dissolved oxygen profiles from data collected in 2003 at site 201 show stratification developing mid-summer (Figure 11). The thermocline occurs around 7-8 meters (23-26 feet). The oxygen is depleted below this depth in July and August, which means that gamefish will be scarce below the thermocline during those months.
Figure 11. Dissolved oxygen profile for Bass Lake.
Figure 10. Chlorophyll a concentrations (ug/L) for Bass Lake at site 204.

RMB Environmental Laboratories, Inc. 10 of 22 2015 Bass Lake
Trophic State Index (TSI) TSI is a standard measure or means for calculating the trophic status or productivity of a lake. More specifically, it is the total weight of living algae (algae biomass) in a waterbody at a specific location and time. Three variables, chlorophyll a, Secchi depth, and total phosphorus, independently estimate algal biomass. Phosphorus (nutrients), chlorophyll a (algae concentration) and Secchi depth (transparency) are related. As phosphorus increases, there is more food available for algae, resulting in increased algal concentrations. When algal concentrations increase, the water becomes less transparent and the Secchi depth decreases. If all three TSI numbers are within a few points of each other, they are strongly related. If they are different, there are other dynamics influencing the lake’s productivity, and TSI mean should not be reported for the lake. The mean TSI for Bass Lake falls into the mesotrophic range (Figure 10). There is good agreement between the TSI for phosphorus and chlorophyll a, indicating that these variables are strongly related (Table 6). The TSI for transparency is less, but it could be due to the fact that the Secchi data set is much larger than the other parameters. Mesotrophic lakes (TSI 40-50) are characterized by moderately clear water most of the summer. "Meso" means middle or mid; therefore, mesotrophic means a medium amount of productivity. Mesotrophic lakes are commonly found in central Minnesota and have clear water with algal blooms in late summer (Table 7). They are also good for walleye fishing. Table 7. Trophic state index attributes and their corresponding fisheries and recreation characteristics.
TSI Attributes Fisheries & Recreation
<30 Oligotrophy: Clear water, oxygen throughout the year at the bottom of the lake, very deep cold water.
Trout fisheries dominate
30-40 Bottom of shallower lakes may become anoxic (no oxygen).
Trout fisheries in deep lakes only. Walleye, Cisco present.
40-50 Mesotrophy: Water moderately clear most of the summer. May be "greener" in late summer.
No oxygen at the bottom of the lake results in loss of trout. Walleye may predominate.
50-60 Eutrophy: Algae and aquatic plant problems possible. "Green" water most of the year.
Warm-water fisheries only. Bass may dominate.
60-70 Blue-green algae dominate, algal scums and aquatic plant problems.
Dense algae and aquatic plants. Low water clarity may discourage swimming and boating.
70-80 Hypereutrophy: Dense algae and aquatic plants.
Water is not suitable for recreation.
Source: Carlson, R.E. 1997. A trophic state index for lakes. Limnology and Oceanography. 22:361-369.
Hypereutrophic
Eutrophic
Mesotrophic
Oligotrophic
100
0
50
40
70
Trophic State Index Site 201 Site 204
TSI Total Phosphorus 46 49
TSI Chlorophyll-a 47 50
TSI Secchi 37 45
TSI Mean 44 48
Trophic State: Mesotrophic
Numbers represent the mean TSI for each parameter.
Table 6. Trophic State Index for Bass.
Site 201 (North)
Figure 12. Trophic state index chart with corresponding trophic status.
Site 204 (South)

RMB Environmental Laboratories, Inc. 11 of 22 2015 Bass Lake
Trend Analysis For detecting trends, a minimum of 8-10 years of data with 4 or more readings per season are recommended. Minimum confidence accepted by the MPCA is 90%. This means that there is a 90% chance that the data are showing a true trend and a 10% chance that the trend is a random result of the data. Only short-term trends can be determined with just a few years of data, because there can be different wet years and dry years, water levels, weather, etc, that affect the water quality naturally. Bass Lake had enough data to perform a trend analysis on transparency (Table 8). The data were analyzed using the Mann Kendall Trend Analysis. Table 8. Trend analysis for Bass Lake.
Lake Site Parameter Date Range Trend Probability
201 Total Phosphorus 2008-2014 (only one data point in 2009)
Insufficient data --
201 Chlorophyll a 2008-2014 (only one data point in 2009)
Insufficient data --
201 Transparency
1994-2014 Improving 90%
202 Transparency
1994-2014 Improving 95%
204 Transparency 2008-2014 (only one data point in 2009)
Insufficient data --
204 Total Phosphorus 2008-2014 (only one data point in 2009)
Insufficient data --
204 Chlorophyll a 2008-2014 (only one data point in 2009)
Insufficient data --
Figure 13. Transparency (feet) trend for site 201 from 1992,1994-2013.
Bass Lake shows evidence of an improving transparency trend (Figure 11). This means that the transparency is getting better over time. The lake experienced it’s record Secchi disk reading in 2013 at 24 feet. Transparency monitoring should continue so that this trend can be tracked in future years.
0
5
10
15
20
25
30
05
/06
/19
92
06
/22
/19
94
09
/06
/19
94
08
/18
/19
95
06
/06
/19
96
08
/29
/19
96
07
/04
/19
97
09
/20
/19
97
07
/29
/19
98
04
/17
/19
99
07
/24
/19
99
05
/16
/20
00
08
/13
/20
00
07
/19
/20
01
05
/21
/20
02
08
/15
/20
02
07
/19
/20
03
05
/02
/20
05
07
/23
/20
05
06
/17
/20
06
09
/06
/20
06
07
/10
/20
07
06
/07
/20
08
08
/23
/20
08
07
/15
/20
09
05
/07
/20
10
07
/19
/20
10
05
/07
/20
11
08
/07
/20
11
08
/13
/20
12
06
/12
/20
13
09
/13
/20
13
Secc
hi d
ep
th (
ft)
Bass Lake Transparency Trend

RMB Environmental Laboratories, Inc. 12 of 22 2015 Bass Lake
increased
algae
Ecoregion Comparisons Minnesota is divided into 7 ecoregions based on land use, vegetation, precipitation and geology (Figure 14). The MPCA has developed a way to determine the "average range" of water quality expected for lakes in each ecoregion. From 1985-1988, the MPCA evaluated the lake water quality for reference lakes. These reference lakes are not considered pristine, but are considered to have little human impact and therefore are representative of the typical lakes within the ecoregion. The "average range" refers to the 25th - 75th percentile range for data within each ecoregion. For the purpose of this graphical representation, the means of the reference lake data sets were used. Bass Lake is in the Northern Lakes and Forest Ecoregion. The mean total phosphorus, chlorophyll a and transparency (Secchi depth) for Bass Lake are within the ecoregion ranges (Figure 15).
Figure 15. Bass Lake ranges compared to Northern Lakes and Forest Ecoregion ranges.
0
10
20
30
40
50
60
To
tal P
ho
sp
ho
rus (
ug
/L, p
pb
)
0
5
10
15
20
25
30
Ch
loro
ph
yll
-a (
ug
/L, p
pb
)
0
5
10
15
20
25
30
Secch
i d
ep
th (
ft)
crystal
clear
Figure 14. Minnesota Ecoregions.

RMB Environmental Laboratories, Inc. 13 of 22 2015 Bass Lake
Lakeshed Data and Interpretations
Lakeshed Understanding a lakeshed requires an understanding of basic hydrology. A watershed is defined as all land and water surface area that contribute excess water to a defined point. The MN DNR has delineated three basic scales of watersheds (from large to small): 1) basins, 2) major watersheds, and 3) minor watersheds. The Mississippi River Headwaters Major Watershed is one of the watersheds that make up the Upper Mississippi River Basin, which drains south to the Gulf of Mexico (Figure 16). This major watershed is made up of 121 minor watersheds. Bass Lake is located in minor watershed 7009 (Figure 17).
Figure 16. Miss. River – Headwaters Major Watershed. Figure 17. Minor Watershed.
The MN DNR also has evaluated catchments for each individual lake with greater than 100 acres surface area. These lakesheds (catchments) are the “building blocks” for the larger scale watersheds. Bass Lake falls within lakeshed 700904 (Figure 18). Though very useful for displaying the land and water that contribute directly to a lake, lakesheds are not always true watersheds because they may not show the water flowing into a lake from upstream streams or rivers. While some lakes may have only one or two upstream lakesheds draining into them, others may be
Figure 18. Bass Lake lakeshed (700904) with land ownership, lakes, wetlands, and rivers illustrated.

RMB Environmental Laboratories, Inc. 14 of 22 2015 Bass Lake
connected to a large number of lakesheds, reflecting a larger drainage area via stream or river networks. For further discussion of Bass Lake’s watershed, containing all the lakesheds upstream of the Bass Lake lakeshed, see page 17. The data interpretation of the Bass Lake lakeshed includes only the immediate lakeshed as this area is the land surface that flows directly into Bass Lake. The lakeshed vitals table identifies where to focus organizational and management efforts for each lake (Table 9). Criteria were developed using limnological concepts to determine the effect to lake water quality. KEY
Possibly detrimental to the lake Warrants attention
Beneficial to the lake
Table 9. Bass Lake lakeshed vitals table.
Lakeshed Vitals Rating
Lake Area 2,765 acres descriptive
Littoral Zone Area 1,267 acres descriptive
Lake Max Depth 76 feet descriptive
Lake Mean Depth 20.46 feet descriptive
Water Residence Time NA NA
Miles of Stream 4.62 miles descriptive
Inlets 5
Outlets 1
Major Watershed 7 - Mississippi River-Headwaters descriptive
Minor Watershed 7009 descriptive
Lakeshed 700904 descriptive
Ecoregion Northern Lakes and Forests descriptive
Total Lakeshed to Lake Area Ratio (total
lakeshed includes lake area) 4:1
Standard Watershed to Lake Basin Ratio (standard watershed includes lake areas)
6:1
Wetland Coverage (NWI) 21.3%
Aquatic Invasive Species None
Public Drainage Ditches 0
Public Lake Accesses 3
Miles of Shoreline 21.29 miles descriptive
Shoreline Development Index 2.96
Public Land to Private Land Ratio 1:4
Development Classification Recreational Development
Miles of Road 23.97 miles descriptive
Municipalities in lakeshed Cohasset
Forestry Practices None
Feedlots 0
Sewage Management Individual Waste Treatment Systems (septic systems and holding tanks)
Lake Management Plan None
Lake Vegetation Survey/Plan DNR, 2000

RMB Environmental Laboratories, Inc. 15 of 22 2015 Bass Lake
Land Cover / Land Use The activities that occur on the land within the lakeshed can greatly impact a lake. Land use planning helps ensure the use of land resources in an organized fashion so that the needs of the present and future generations can be best addressed. The basic purpose of land use planning is to ensure that each area of land will be used in a manner that provides maximum social benefits without degradation of the land resource. Changes in land use, and ultimately land cover, impact the hydrology of a lakeshed. Land cover is also directly related to the land’s ability to absorb and store water rather than cause it to flow overland (gathering nutrients and sediment as it moves) towards the lowest point, typically the lake. Impervious intensity describes the land’s inability to absorb water, the higher the % impervious intensity the more area that water cannot penetrate in to the soils. Monitoring the changes in land use can assist in future planning procedures to address the needs of future generations.
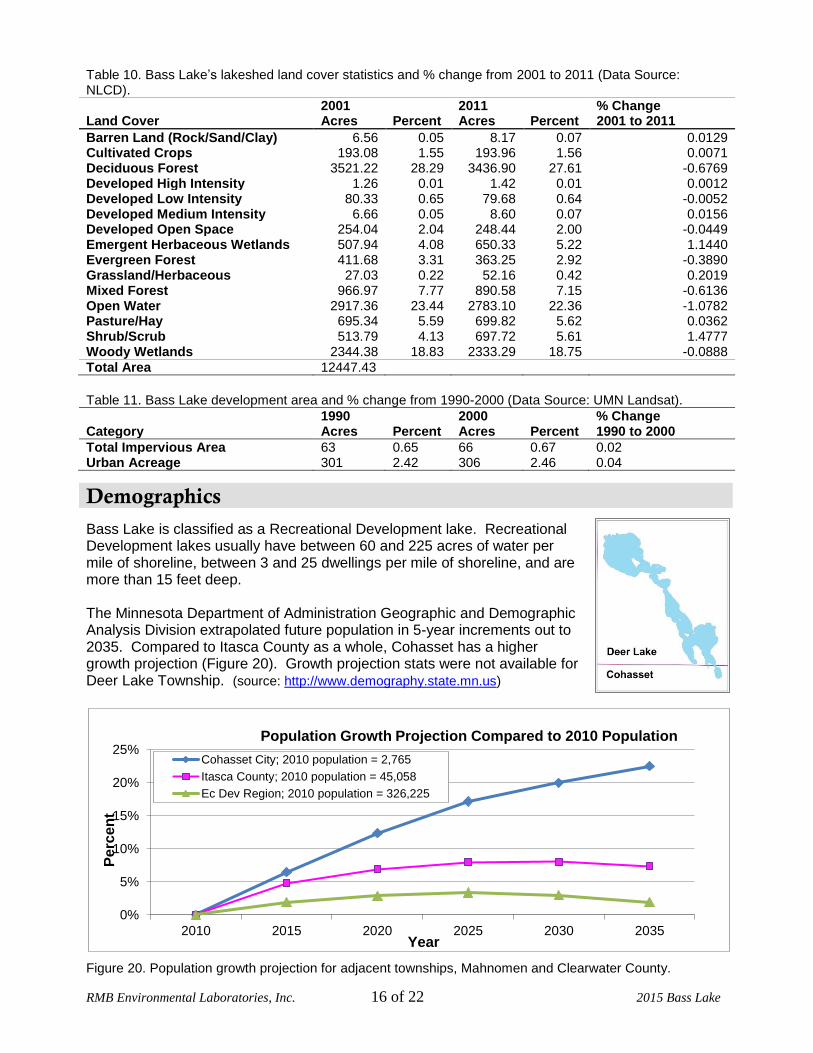
Phosphorus export, which is the main cause of lake eutrophication, depends on the type of land cover occurring in the lakeshed. Figure 17 depicts the land cover in Bass Lake’s lakeshed. The National Land Cover Dataset (NLCD) has records from 2001 and 2011. Table 10 describes Bass Lake’s lakeshed land cover statistics and percent change from 2001 to 2011. Overall, there was not much change over this decade. Much of Bass Lake’s lakeshore is wetland and is undevelopable (Figure 19). Development has not increased much since 1990 (Tables 10-11) and most likely will not change much in the future either (Figure 18).
Figure 19. Bass Lake lakeshed (700904) land cover (NLCD 2011).
RMB Environmental Laboratories, Inc. 16 of 22 2015 Bass Lake
Table 10. Bass Lake’s lakeshed land cover statistics and % change from 2001 to 2011 (Data Source: NLCD). 2001 2011 % Change
2001 to 2011 Land Cover Acres Percent Acres Percent
Barren Land (Rock/Sand/Clay) 6.56 0.05 8.17 0.07 0.0129 Cultivated Crops 193.08 1.55 193.96 1.56 0.0071 Deciduous Forest 3521.22 28.29 3436.90 27.61 -0.6769 Developed High Intensity 1.26 0.01 1.42 0.01 0.0012 Developed Low Intensity 80.33 0.65 79.68 0.64 -0.0052 Developed Medium Intensity 6.66 0.05 8.60 0.07 0.0156 Developed Open Space 254.04 2.04 248.44 2.00 -0.0449 Emergent Herbaceous Wetlands 507.94 4.08 650.33 5.22 1.1440 Evergreen Forest 411.68 3.31 363.25 2.92 -0.3890 Grassland/Herbaceous 27.03 0.22 52.16 0.42 0.2019 Mixed Forest 966.97 7.77 890.58 7.15 -0.6136 Open Water 2917.36 23.44 2783.10 22.36 -1.0782 Pasture/Hay 695.34 5.59 699.82 5.62 0.0362 Shrub/Scrub 513.79 4.13 697.72 5.61 1.4777 Woody Wetlands 2344.38 18.83 2333.29 18.75 -0.0888
Total Area 12447.43
Table 11. Bass Lake development area and % change from 1990-2000 (Data Source: UMN Landsat).
1990 2000 % Change Category Acres Percent Acres Percent 1990 to 2000
Total Impervious Area 63 0.65 66 0.67 0.02 Urban Acreage 301 2.42 306 2.46 0.04
Demographics
Bass Lake is classified as a Recreational Development lake. Recreational Development lakes usually have between 60 and 225 acres of water per mile of shoreline, between 3 and 25 dwellings per mile of shoreline, and are more than 15 feet deep. The Minnesota Department of Administration Geographic and Demographic Analysis Division extrapolated future population in 5-year increments out to 2035. Compared to Itasca County as a whole, Cohasset has a higher growth projection (Figure 20). Growth projection stats were not available for Deer Lake Township. (source: http://www.demography.state.mn.us)
Figure 20. Population growth projection for adjacent townships, Mahnomen and Clearwater County.
0%
5%
10%
15%
20%
25%
2010 2015 2020 2025 2030 2035
Pe
rce
nt
Year
Population Growth Projection Compared to 2010 Population
Cohasset City; 2010 population = 2,765
Itasca County; 2010 population = 45,058
Ec Dev Region; 2010 population = 326,225

RMB Environmental Laboratories, Inc. 17 of 22 2015 Bass Lake
Lakeshed Water Quality Protection Strategy Each lakeshed has a different makeup of public and private lands. Looking in more detail at the makeup of these lands can give insight on where to focus protection efforts. The protected lands (easements, wetlands, public land) are the future water quality infrastructure for the lake. Developed land and agriculture have the highest phosphorus runoff coefficients, so this land should be minimized for water quality protection. The majority of the privately-owned land within Bass Lake’s lakeshed is forested (Table 12). This land can be the focus of development and protection efforts in the lakeshed. Table 12. Land ownership, land use/land cover, estimated phosphorus loading, and ideas for protection and restoration in the lakeshed (Sources: County parcel data and the 2011 National Land Cover Dataset).
Private (65.4) Public (11.8)
Developed Agriculture
Forested Uplands Other Wetlands
Open Water County State Federal
Land Use (%) 2.5 6.2 38.4 0.4 16.8 22.9 4.4 7.4 0
Runoff Coefficient
Lbs of phosphorus/acre/year
0.45 – 1.5 0.26 – 0.9 0.09 0.09 0.09 0.09 0.09
Estimated Phosphorus Loading Acreage x runoff coefficient
138 –460 199 –689 430 1.5 48.753 83.025 0
Description Focused on Shoreland
Cropland
Focus of develop-ment and protection
efforts
Open, pasture, grass-land,
shrub-land
Protected
Protection and Restoration Ideas
Shoreline restoration
Restore wetlands;
CRP
Forest stewardship planning, 3rd
party certification, SFIA, local woodland
cooperatives
Protected by
Wetland Conservation
Act
County
Tax Forfeit Lands
State Forest
National Forest
DNR Fisheries approach for lake protection and restoration
Credit: Peter Jacobson and Michael Duval, Minnesota DNR Fisheries
In an effort to prioritize protection and restoration efforts of fishery lakes, the MN DNR has developed a ranking system by separating lakes into two categories, those needing protection and those needing restoration. Modeling by the DNR Fisheries Research Unit suggests that total phosphorus concentrations increase significantly over natural concentrations in lakes that have watershed with disturbance greater than 25%. Therefore, lakes with watersheds that have less than 25% disturbance need protection and lakes with more than 25% disturbance need restoration (Table 13). Watershed disturbance was defined as having urban, agricultural and mining land uses. Watershed protection is defined as publicly owned land or conservation easement.

RMB Environmental Laboratories, Inc. 18 of 22 2015 Bass Lake
Percent of the Watershed with Disturbed Land Cover
0%
100% 25%
Bass Lake (9.8%)
Percent of the Watershed Protected
0% 100% 75%
Bass Lake (38%)
Table 13. Suggested approaches for watershed protection and restoration of DNR-managed fish lakes in Minnesota.
Watershed Disturbance
(%)
Watershed Protected
(%)
Management Type
Comments
< 25%
> 75% Vigilance Sufficiently protected -- Water quality supports healthy and diverse native fish communities. Keep public lands protected.
< 75% Protection
Excellent candidates for protection -- Water quality can be maintained in a range that supports healthy and diverse native fish communities. Disturbed lands should be limited to less than 25%.
25-60% n/a Full Restoration Realistic chance for full restoration of water quality and improve quality of fish communities. Disturbed land percentage should be reduced and BMPs implemented.
> 60% n/a Partial Restoration
Restoration will be very expensive and probably will not achieve water quality conditions necessary to sustain healthy fish communities. Restoration opportunities must be critically evaluated to assure feasible positive outcomes.
The next step was to prioritize lakes within each of these management categories. DNR Fisheries identified high value fishery lakes, such as cisco refuge lakes. Ciscos (Coregonus artedi) can be an early indicator of eutrophication in a lake because they require cold hypolimnetic temperatures and high dissolved oxygen levels. These watersheds with low disturbance and high value fishery lakes are excellent candidates for priority protection measures, especially those that are related to forestry and minimizing the effects of landscape disturbance. Forest stewardship planning, harvest coordination to reduce hydrology impacts and forest conservation easements are some potential tools that can protect these high value resources for the long term. Bass Lake’s lakeshed is classified with having 38% of the watershed protected and 9.8% of the watershed disturbed (Figure 21). Therefore, this lakeshed should have a protection focus. Goals for the lake should be to limit any increase in disturbed land use. Bass Lake has three other lakesheds flowing into it, but they have low disturbance as well (Figure 22).
Figure 21. Bass Lake’s lakeshed percentage of watershed protected and disturbed.
Figure 22. Lakesheds that contribute water to the Bass Lake lakeshed. Color-coded based on management focus (Table 13).

RMB Environmental Laboratories, Inc. 19 of 22 2015 Bass Lake
Status of the Fishery (DNR, as of 07/18/2005)
Bass Lake is a 2,407 acre lake located near Cohasset, MN in the Mississippi River watershed. The lake has a littoral area of 1,254 acres and a maximum depth of 76 feet. The lake has two distinct basins connected by a long, shallow channel. Bass Lake has an outlet to the Mississippi River with a modified rock weir to maintain water levels but allow fish passage. Bass Lake supports a diverse aquatic plant community and many of the shoal water areas support emergent vegetation such as bulrushes and wild rice. While much of the shoreline has been developed for residences, the central part of the lake is mainly in public ownership. The DNR also maintains Crawford Island, a large island in the north basin, as a State Aquatic Management Area. Bass Lake is a popular lake for fishing and recreational boating due to its large size and close proximity to Grand Rapids. Bass Lake provides good angling opportunities for a variety of species. The lake management plan lists Walleye and Bluegill as the primary species of management.
The 2014 Walleye gill-net catch was 3.4/net, below the management plan goal of 5.0/net. This catch was down slightly from the 2010 assessment but similar to the lake class median and the long-term average for Bass Lake. Walleye size structure declined slightly as well. Sampled fish varied from 7.0 to 23.5 inches with a mean length of 14.2 inches. Age structure of the sample revealed a high proportion of young fish. Age 1-3 fish made up 58% of the catch. Walleye size structure should improve in the next couple of years as these fish grow to sizes more preferable to anglers. Bass Lake is stocked with Walleye fingerlings in odd-numbered years. Past surveys have documented some natural reproduction. Results from the 2014 assessment concurred as 44% of sampled Walleye were attributed to non-stocked years.
Northern Pike were captured at 6.1/gill net, within the expected range for this lake class and near the long-term average for Bass Lake. As in previous assessments, size structure of Northern Pike was poor. Sampled pike ranged from 12.5 to 25.6 inches with a mean length of 18.6 inches. Age structure of the sample was dominated by younger age fish; age 2-3 pike made up 79% of the sample. Growth of pike was similar to statewide means. On average, Northern Pike in Bass Lake take 4 years to reach 21 inches.
Smallmouth Bass appear to be a recent development in Bass Lake, first sampled in 2005. Gill-net catches for Smallmouth Bass have exceeded the lake class third quartile in the last two assessments. The 2014 catch rate was similar to the previous survey at 1.3/net. Size structure remained favorable with fish ranging from 10.2 to 18.3 inches with a mean length of 14.7 inches. Growth appeared fairly good with Smallmouth Bass exceeding 15.0 inches at age 5. Five Smallmouth Bass were also captured during a spring night electrofishing assessment.
A total of 22 Largemouth Bass were sampled with night electrofishing for a catch rate of 14.5/hour. This is considered a relatively low catch rate compared to other area lakes. Sampled Largemouth Bass ranged from 6.0 to 18.6 inches with a mean length of 12.7 inches. Recruitment appeared fairly consistent with seven year classes identified between ages 2-10. Growth was considered average with fish exceeding 14 inches at age 5.
The trap-net catch for Bluegill equaled the historic high catch for a mid-summer assessment at 5.1/net. Bluegill size structure was favorable, but declined slightly from previous surveys. Sampled fish ranged from 2.8 to 9.8 inches with a mean length of 7.2 inches. A special conservation regulation (5 fish bag limit for sunfish) was implemented in 2001 to protect the quality Bluegill population, and special spring trap-net assessments targeting Bluegill have been conducted eight times since 2000. The spring assessments obtain larger sample sizes and provide more detailed information on Bluegill age, growth and size structure.

RMB Environmental Laboratories, Inc. 20 of 22 2015 Bass Lake
The gill-net catch for Yellow Perch was below the historical average for the lake, but within the expected range for this lake class at 5.7/net. Sampled perch ranged from 5.2 to 12.5 inches with a mean length of 6.4 inches.
As in the previous two surveys, the gill-net catch for Tullibee remained near a historic low of 0.1/net. Summer gill-net catches for Tullibee are typically not a reliable index of abundance due to that species' tendency to suspend in mid-lake areas where no nets are set.
Other species sampled in this assessment included Black Crappie, Bowfin, Hybrid Sunfish, Longear Sunfish, Pumpkinseed Sunfish, Rock Bass, Brown Bullhead, Yellow Bullhead and White Sucker.
See the link below for specific information on gillnet surveys, stocking information, and fish consumption guidelines. http://www.dnr.state.mn.us/lakefind/showreport.html?downum=31057600
Key Findings / Recommendations
Monitoring Recommendations Transparency monitoring at sites 201 and 204 should be continued annually. It is important to continue transparency monitoring weekly or at least bimonthly every year to enable year-to-year comparisons and trend analyses. Total Phosphorus and chlorophyll a monitoring should continue, as the budget allows, to track trends in water quality. The inlets to Bass Lake appear to be minor, but if they are suspected as phosphorus sources to the lake they could be monitored for phosphorus. Overall Summary Bass Lake is a mesotrophic lake (TSI = 44) with evidence of an improving trend in water clarity. The total phosphorus, chlorophyll a and transparency ranges are within the ecoregion ranges. Only ten percent (9.8%) of the Bass Lake lakeshed is disturbed by development and agriculture (Figure 21). The threshold of disturbance where water quality tends to decline is 25%. Bass Lake is well under this threshold. Much of the lakeshed is forested (38%) or wetlands (16%), which is generally good for water quality (Table 12). The whole narrow middle portion of Bass Lake is lined by wetlands and emergent vegetation (bulrush, wild rice). It is very important to protect this area as it is likely sensitive shoreline. Priority Impacts to the Lake The priority impact to Bass Lake would be the expansion of residential housing development in the lakeshed and second tier development along the lakeshore. The conversion of small lake cabins to year-round family homes increases the impervious surface and runoff from the lake lots. Some, but not all, of the private land around the lake has been developed in the first tier. Most of the second tier remains in large parcels and has not been subdivided for development, except for the southwest corner of the lake near Cohasset. Overall, the development pressure for Bass Lake appears low due to the abundance of public land and wetlands surrounding the lake. Data from 1990-2000 and 2001-2011 show there wasn’t much increase in development during that period of time (Tables 10-11).

RMB Environmental Laboratories, Inc. 21 of 22 2015 Bass Lake
Best Management Practices Recommendations The management focus for Bass Lake should be to protect the current water quality and lakeshed. Efforts should be focused on managing and/or decreasing the impact caused by additional development, and impervious surface area on existing lots (conversion of seasonal cabins to year-round homes). The current lakeshore homeowners can lessen their negative impact on water quality by installing or maintaining the existing trees on their properties. Forested uplands contribute significantly less phosphorus (lbs/acre/year) than developed land cover (Table 12). Forested uplands can be managed with Forest Stewardship Planning. In addition, filter strips or native vegetative buffers could be installed to decrease or slow the runoff reaching the water’s edge. Septic systems should be pumped and inspected regularly. The lakeshed still has some large undeveloped shoreline parcels (Figure 16). Because a lot of undeveloped private land still exists, there is a great potential for protecting this land with conservation easements and aquatic management areas (AMAs). Conservation easements can be set up easily and with little cost with help from organizations such as the Board of Soil and Water Resources and the Minnesota Land Trust. AMAs can be set up through the local DNR fisheries office. Project Implementation The best management practices above can be implemented by a variety of entities. Some possibilities are listed below. Individual property owners
• Shoreline restoration
• Rain gardens
• Aquatic plant bed protection (only remove a small area for swimming)
• Conservation easements Lake Associations
• Lake condition monitoring
• Ground truthing – visual inspection upstream on stream inlets
• Watershed runoff mapping by a consultant
• Shoreline inventory study by a consultant
• Conservation easements Soil and Water Conservation District (SWCD) and Natural Resources Conservation Service (NRCS)
• Shoreline restoration
• Stream buffers
• Wetland restoration
• Forest stewardship planning
• Work with farmers to o Restore wetlands o Implement conservation farming practices o Land retirement programs such as Conservation Reserve Program

RMB Environmental Laboratories, Inc. 22 of 22 2015 Bass Lake
Organizational contacts and reference sites
Bass Lake Association
Itasca County Environmental Services Department
124 NE 4th St., Grand Rapids, MN 55744 (218) 327-2857 https://www.co.itasca.mn.us
Itasca Soil and Water Conservation
District
1889 East Highway 2, Grand Rapids, MN 55744 (218) 326-0017 http://www.itascaswcd.org
DNR Fisheries Office 1201 East Highway 2, Grand Rapids, MN 55744 (218) 327-4430 http://www.dnr.state.mn.us/areas/fisheries/grandrapids/index.html
Regional Minnesota Pollution Control Agency Office
525 Lake Avenue South, Duluth, MN 55802
(218) 723-4660 http://www.pca.state.mn.us
Regional Board of Soil and Water Resources Office
1601 Minnesota Drive, Brainerd, MN 56401
(218) 828-2383
http://www.bwsr.state.mn.us