basins and design storms for conveyance · basins and design storms for conveyance section 2...
TRANSCRIPT

Basins and Design Storms for Conveyance Section 2
2/15/2008 1 Final
In this example you will learn about:
• How to determine the applicable storm duration for a project location.
• Creating a basin, the different basin options, and how to estimate runoff from a basin.
• How to transfer basin information to a report.
• The Slope Calculator.

Basins and Design Storms for Conveyance Section 2
EWA - Short Duration Storm The short duration summer thunder storm is 3 hours in duration and generates the greatest peak discharges. This storm should be used in Eastern Washington to design conveyance systems and flow-based BMP’s (structures, ditches and bioswales). The precipitation values are determined from the following steps.
1. Determine the 2-year 2-hour precipitation from the Eastern Isopluvial Maps using the web links from Appendix 4A in the HRM.
2. Using the climatic region descriptions in section 4C-2 of the HRM, determine the climatic region for a given project. Climatic regions are also shown on the Mean Annual Precipitation (MAP) maps.
3. Find the MAP using the web link in Appendix 4A of the HRM. The links will open the HQ Hydraulics Web Page. Select the link titled ‘Washington Mean Annual Precipitation Map’.
4. Given the MAP and the climatic region, locate the Csds from the table below, which can also be found in the last section of Appendix 4C. The Csds is a coefficient that converts the 2 hour precipitation to a 3 hour precipitation.
5. Next, using the 2 year 2 hour precipitation from step 1 and the Csds from step 4, convert the precipitation to the applicable 3 hour storm using the equation below.
Psds = Csds (P2yr2hr)
Where:
Psds - the 3-hour precipitation (inches) for a selected recurrence interval for the short-duration storm.
Csds - a coefficient from Table 4C-12 for converting the 2-year 2-hour precipitation to a 3-hour precipitation.
P2yr2hr - is the 2-year, 2-hour precipitation in Appendix 4A.
2/15/2008 2 Final

Basins and Design Storms for Conveyance Section 2
For example:
1. From the Isopluvial Map below, the 2 year 2 hour storm was found to be between 0.40 and 0.50 in Spokane. For this example we will use 0.48”.
2. Spokane is located in climatic region 3. For a map (see below) and description of the regions, see Appendix 4C. (Both the NC and SC are located in climatic regions 1 and 2.)
2/15/2008 3 Final

Basins and Design Storms for Conveyance Section 2
3. The MAP for Spokane is 18”, which can be found on the map on the next page.
4. For climatic region 3, the Csds = 0.71 for the 6 month duration as shown in look in Table 4C-12. Repeat this process for the 10 and 25 year storms.
2/15/2008 4 Final
"
5. Lastly, convert the 6 month, 10, and 25 year storms to 3 hour duration, as shown below. These values were input into the Project Defaults tab, shown earlier in this tutorial.
34.0"48.071.036 == xP hrmon
"75.0"48.x56.1P hr3yr10 ==
"93.0"48.x93.1P hr3yr25 ==

Basins and Design Storms for Conveyance Section 2 Basins and Design Storms for Conveyance Section 2
2/15/2008 5 Final 2/15/2008 5 Final

Basins and Design Storms for Conveyance Section 2
Example ProblemExample Problem
Develop basins for the before and after conditions using the following description:
• A new two-lane roadway section is to be constructed near Spokane, which is in Climatic Region 3.
• The SCS soil type for the entire project is Type C and the ground cover is primarily forest in fair conditions.
• The existing site condition is approximately 1800 feet in length and 50 feet wide, all forested and grass.
• The calculated time of concentration should be assumed for the forested/grass conditions to be 50 feet of sheet flow with the remaining 1750 feet as shallow concentrated flow. The average slope of the ground before the construction was 1%.
• The proposed conditions for the new impervious roadway will be slightly elevated and will utilize curb and gutter to control the flow. The developed site will have a sag in the profile (see Figure 3). See the plan and cross section view below in Figures 1 and 2 below.
PLAN VIEW Figure 1
2/15/2008 6 Final
1800 ft.
600ft 300ft 300ft 600ft 50 ft
CROSS SECTION Figure 2
40 ft
PROFILE Figure 3
CL
5ft 5ft
1%1% 2%2%
1% 1%
900 ft 900 ft

Basins and Design Storms for Conveyance Section 2
Creating a New File
When StormShed 3G is opened, it will automatically open to the last file used. The first step for this example is to create a new file. Select File>New and input a unique name that will easily remind you of the project. For this example, call the New Project Name: basin. Then click on Ok.
The 3G project disclaimer dialog will appear as shown below. This is just a reminder that this is technical software and while the software developer has made every effort to eliminate errors in the program, it is up to the designer to use engineering judgment when reviewing the results.
Select I Fully Understand and the box will close.
Set Project Defaults After a project is created, the next step is to set the project defaults. In this tutorial we will only modify the items in the Project Defaults tab.
Select Data>Config.
2/15/2008 7 Final

Basins and Design Storms for Conveyance Section 2
Before the Project Configuration box opens, the following warning will appear. StormSHED 3G utilizes TR-55 methodology to calculate travel time and the travel time equation for sheet flow requires the 2 year 24 hour precipitation in the.
After selecting OK, the Project Configuration box will open as shown below.
To eliminate the Warning dialog box; the Design Event must be typed as ‘2 year 24 hour’ or ‘2yr 24hr’. If ‘2 year’ is typed, the warning will continue to appear.
Project Precips – After determining the precipitation values (see the applicable EWA or WWA storm determination sections of this tutorial), input the values as shown above.
• To modify an existing value, highlight the Design Event by LMB click on an item and then modify the values in the boxes above. Accept the change by selecting the Update button.
• To add a new value, input the design event and precip. into the blank boxes, then select the Add button.
For this tutorial we will leave the default selections for AMC, IDF and Tc as shown above.
2/15/2008 8 Final

Basins and Design Storms for Conveyance Section 2
Create Basins
First, define the ‘before’ drainage basin conditions.
Expand the Basin option in the Data Tree View and then double click on PROTOTYPE to open the basin dialog box. The PROTOTYPE dialog box is the template for all other basin records. It will save time if repetitive options are set in the PROTOTYPE dialog box and saved before creating a new basin or use an existing basin to create a new basin.
Select the New button and input the basin name, for this tutorial use ‘before’. Then click OK to close the dialog box.
2/15/2008 9 Final

Basins and Design Storms for Conveyance Section 2
Next we will review the input boxes on the first tab, labeled the basin name ‘before’:
• Rainfall Type – This is where the design storm, as specified in Chapter 4 of the HRM, is selected. For this project, we were told to use the short duration storm or the EWash-3hr.rac for EWA and the Type1A.RAC for WWA.
• Storm Duration – the length of a storm is set here and the program will either stretch or shrink a storm distribution to this time line. For this example, set the duration at 3 hours in EWA and 24 hours in WWA the distribution used for the short duration storm.
• Design Method – designers have three methods to select from for the design analysis: SCS, SBUH, or the Rational Method. Either the SCS or SBUH is acceptable on WSDOT projects as both will yield similar results for most WSDOT project. For projects with more pervious surface or in a rural area, consider the SCS method and for projects with more impervious surface or in an urban area consider the SBUH method.
• Hyd Interval – or the hydrograph interval. This is the interval at which data is reported from the 3G analysis; this value does not affect the actual analysis. When the Type 1A or Long Duration Storm is used, the 10 minute default is appropriate. For the short duration storm, a 5 minutes interval is recommended. The reason this value is reduced for the short storm is the duration of the high intensity portion of the storm may last from 5 to 30 minutes, less than a 5 minute interval and first portion of the storm could be missed.
• Peak Factor – This feature is not modified for WSDOT projects from the default value of 484. This is a customization feature that will either flatten or heighten the hydrograph.
• Unit Hydrograph – A unit hydrograph basically put represents the affect rainfall has on a particular basin. In 3G there are two options: SCS and Delmarva. The Delmarva only applies to projects in Marylands, so for all WSDOT projects the SCS Unit Hydrograph option should be selected.
• Loss Method – there are three options for determining precipitation losses on a project: SCS, Green Ampt, and Holtan. Generally all WSDOT projects use the SCS CN Approach which combines infiltration losses with the initial abstraction. The Green Ampt and Holtan method require more information than we usually have on a WSDOT project.
2/15/2008 10 Final

Basins and Design Storms for Conveyance Section 2
The Perv CN tab is where the pervious drainage basin area is defined by both the total area in acres and the Curve Number (CN). The CN values can be selected from the pull-down tab based on the land use selected, (Urban, Developing Urban, Cultivated Agriculture, Other Agriculture, and Arid Rangeland) and the HSG (Hydrologic Soils Group). Designers should verify these values are the same as found in Appendix 4B of the HRM, an example is shown on the next page. Note there are separate CN tables for eastern and western Washington in the HRM, be sure to use the correct table. Notice there are values already set up in the PROTOTYPE basin; these are examples of how to input data and should be deleted. Next input the information from the example by typing the values in the boxes as shown below and then selecting the Add tab. To modify information already input, LMB click on the data and the information will appear in the upper boxes. Make the necessary changes and then select the Update button. The changes should appear in the lower box.
• For this example, input the data as shown in the box below.
• Move to DCIA – This option allows designers to move pervious basins to the
impervious basin tab, a time saver when basins are accidentally input on the wrong tab. Simply highlight the row, select this button, and the basin description, subarea, and CN will be moved to the Directly Connected CN tab.
• Abstraction Coeff – This value can only be modified when using the SCS CN for the loss method. Precipitation has to be greater than 0.2S (the maximum soil water retention parameter) before runoff is generated. While this number can be modified in the Pervious CN tabs only, it should be left as 0.2 for WSDOT applications.
• Total Area – The total pervious area entered for this basin is summed in this box.
2/15/2008 11 Final
• Avg CN – This is the average CN computed based on all the pervious surfaces reported.

Basins and Design Storms for Conveyance Section 2
Defining the Time of Concentration (TC) is the next step for the pervious surface. Select the Perv TC tab and modify the information as shown on the below using the example problem statement summarized below.
• For this example we have 50ft of sheet flow on a 1% and the land cover type is a fair forest condition. The best match for a sheet flow Kf from the pull down menu is, wood or forest with light under brush.
• The second type of pervious flow is shallow for a length of 1750ft at a 1% slope. Select brushy ground with some trees for the ns value.
Again the default values in the PROTOYPE description area are for example and need to be either deleted or updated.
2/15/2008 12 Final

Basins and Design Storms for Conveyance Section 2
Now let’s review the options in the Flow Type pull-down menu. While there are many options we generally only use the ones noted below on WSDOT projects:
• Fixed – Rather than having the program calculate the travel time, the designer can manually input the value.
• Sheet Flow – Flow, over a relatively flat surface that does not concentrate more than 0.1’ deep, and in length is less than 100’ for unpaved areas and 150’ for paved areas is considered sheet flow. This type of flow will be used to model runoff as it travels off the roadway to the shoulder.
• Shallow Flow – Once flow exceeds the depth and or length requirements for Sheet Flow, it begins to have a defined flow path and is assumed to be Shallow Flow. Runoff traveling along the curb line or in ditches should be modeled as Shallow Flow.
• Channel Flow – Channel flow is assumed to begin where surveyed cross section information has been obtained, where channels are visible on aerial photographs, or where lines indicating streams are shown on US Geological Survey Maps. There are two options for Channel Flow in 3G: intermittent and continuous. Intermittent flow is a channel that only has flow during rainfall events and is assumed to have a lower hydraulics radius (0.2). Continuous flow is a channel that always has some flow running through and is assumed to have a higher hydraulic radius of (0.4).
Since in the before condition there is no impervious surface, the next two Directly Connected tabs should be left blank.
The last tab, Compute Design Event, can be used to quickly compute a flow rate and volume of the runoff based on this basins characteristic.
• The Select Design Event pull-down menu references the precipitation values input into the Program Defaults tabs. For this example, select 25 year.
• The AMC group can be changed for just this computation when using the compute command; it is not a permanent change. This will only give the designer an idea of how a different AMC could affect runoff from this basin. Note the Project AMC that was set in the Project Defaults tab, is also noted here.
2/15/2008 13 Final

Basins and Design Storms for Conveyance Section 2
• Select the Compute button for a quick look at the runoff generated from the basin. Using this command does not report the data to the history view; instructions for reporting this data are described at the end of this tutorial.
Next, the After drainage basin site conditions will be defined (the new impervious roadway with curb and gutters).
• Click on the New button, to create a new basin and then type ‘after’. To save
time reselecting the settings, select the ‘before’ basin instead of the prototype basin.
Next, delete any entries in the Perv tabs since in the after condition; the pervious surfaces are replaced with pavement. Or to save time, highlight the pervious basin and hit the Move DCIA button. This will automatically move the basin to the Directly Connected CN tab. Remember to update the Description and CN to reflect an impervious area.
Directly Connected CN and TC – These tabs were formally known as Impervious CN and TC in the older version of StormSHED. For the most part almost all WSDOT projects impervious surfaces should be input into the Directly Connected CN and TC tabs and pervious areas into the Perv CN and TC tab. The new name simply describes the flow condition for impervious surfaces; which is that runoff is directly connected to the point of interest. An example of a directly connected surface is runoff that sheet flows off a roadway to a ditch and travels through the ditch to some point of interest (a culvert or pond). The most accurate way to analyze this condition is to generate two hydrographs (one for the
2/15/2008 14 Final

Basins and Design Storms for Conveyance Section 2
impervious area (Directly Connected tab) and one for the Pervious areas) and then add the two hydrographs together. Basins input in the Perv CN tab will generate a composite CN value based on the weighted average CN value of the basins. If runoff (both impervious and pervious) is not directly connected, a composite CN is more representative of a project site runoff. For example, if there is an impervious tennis court in the middle of a pervious basin and the runoff from the impervious area travels through the pervious area before reaching a point of interest this is not a directly connected impervious surface. The most accurate way to analyze this situation is by entering both the pervious and impervious areas into the Perv CN and TC tabs.
Next, select the Directly Connected TC tab. Each flow path must be defined for the impervious area, below is a summary of the example description.
• For this example we were told there is 20ft of sheet flow at a 2% and the land cover type is a paved condition. Thus when defining the coefficient for sheet flow, select smooth surfaces from the pull down menu.
• The second type of flow we have on the site is shallow for a length of 900ft at a 1% slope. From the pull down menu select paved and gravel areas as the coefficient value.
Need to calculate the slope? Select the Slope Calc button below the Coeff. box and the calculator to the left will open. Next input the runoff length and the up and down elevations and select the Compute button. 3G will automatically transfer the resulting slope to the slope box for the tab that is open in the basin dialog box.
2/15/2008 15 Final

Basins and Design Storms for Conveyance Section 2
Select the last tab, Compute, to quickly compute a flow rate and volume based on the after construction basin runoff as shown below.
Create a Report Once information for each basin is entered, the designer will need to provide this data in the hydraulic report. There is no formal report writing command in 3G, however information can be sent to the History View and then copied into a word document. This can be done by:
• LMB click to select the basin in the Data Tree View.
• RMB click to open the menu.
• Then LMB click to select the ‘To History’ option.
This process should be repeated for each basin.
2/15/2008 16 Final
Basins and Design Storms for Conveyance Section 2
2/15/2008 17 Final
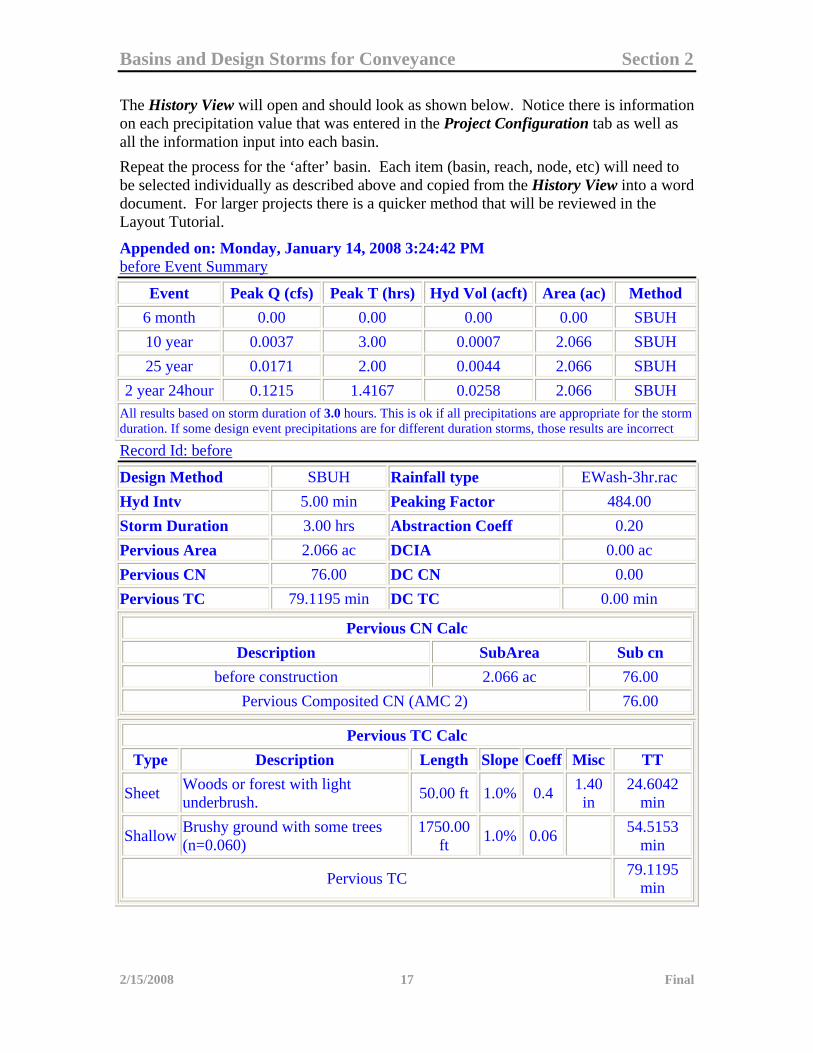
The History View will open and should look as shown below. Notice there is information on each precipitation value that was entered in the Project Configuration tab as well as all the information input into each basin. Repeat the process for the ‘after’ basin. Each item (basin, reach, node, etc) will need to be selected individually as described above and copied from the History View into a word document. For larger projects there is a quicker method that will be reviewed in the Layout Tutorial.
Appended on: Monday, January 14, 2008 3:24:42 PM before Event Summary
Event Peak Q (cfs) Peak T (hrs) Hyd Vol (acft) Area (ac) Method 6 month 0.00 0.00 0.00 0.00 SBUH 10 year 0.0037 3.00 0.0007 2.066 SBUH 25 year 0.0171 2.00 0.0044 2.066 SBUH
2 year 24hour 0.1215 1.4167 0.0258 2.066 SBUH All results based on storm duration of 3.0 hours. This is ok if all precipitations are appropriate for the storm duration. If some design event precipitations are for different duration storms, those results are incorrect
Record Id: before
Design Method SBUH Rainfall type EWash-3hr.rac Hyd Intv 5.00 min Peaking Factor 484.00 Storm Duration 3.00 hrs Abstraction Coeff 0.20 Pervious Area 2.066 ac DCIA 0.00 ac Pervious CN 76.00 DC CN 0.00 Pervious TC 79.1195 min DC TC 0.00 min
Pervious CN Calc Description SubArea Sub cn
before construction 2.066 ac 76.00 Pervious Composited CN (AMC 2) 76.00
Pervious TC Calc Type Description Length Slope Coeff Misc TT
Sheet Woods or forest with light underbrush. 50.00 ft 1.0% 0.4 1.40
in 24.6042
min
Shallow Brushy ground with some trees (n=0.060)
1750.00 ft 1.0% 0.06 54.5153
min
Pervious TC 79.1195 min
Basins and Design Storms for Conveyance Section 2
2/15/2008 18 Final
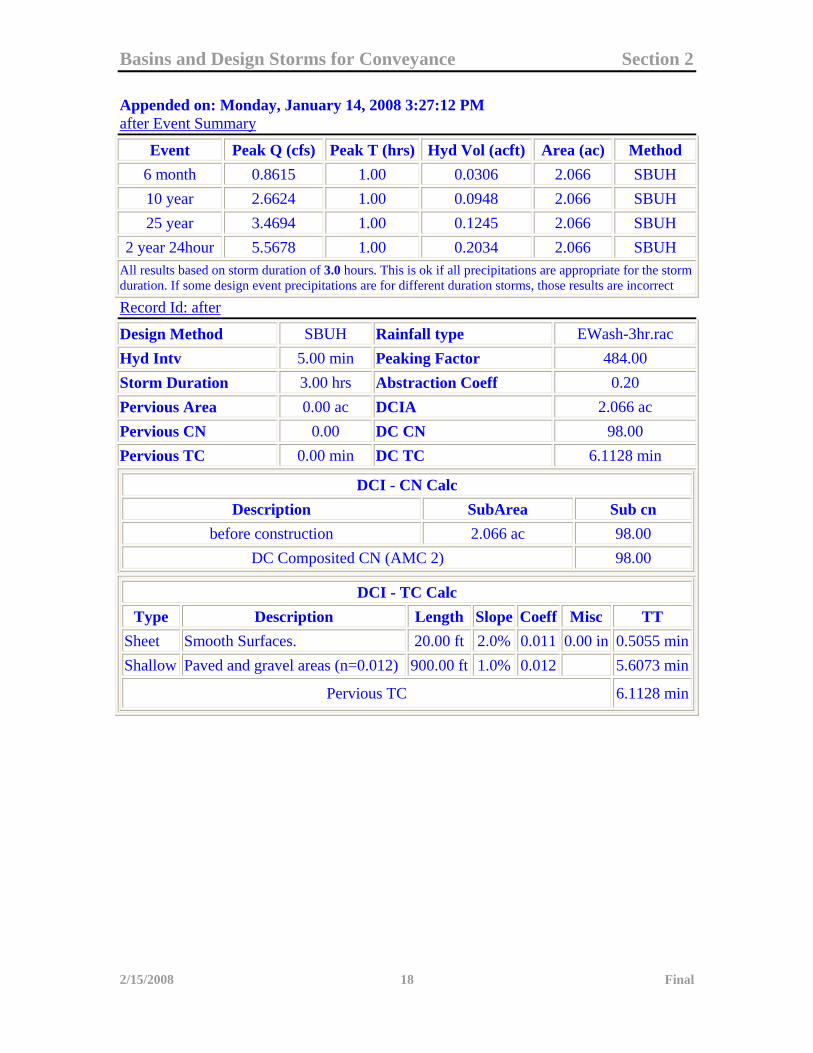
Appended on: Monday, January 14, 2008 3:27:12 PM after Event Summary
Event Peak Q (cfs) Peak T (hrs) Hyd Vol (acft) Area (ac) Method 6 month 0.8615 1.00 0.0306 2.066 SBUH 10 year 2.6624 1.00 0.0948 2.066 SBUH 25 year 3.4694 1.00 0.1245 2.066 SBUH
2 year 24hour 5.5678 1.00 0.2034 2.066 SBUH All results based on storm duration of 3.0 hours. This is ok if all precipitations are appropriate for the storm duration. If some design event precipitations are for different duration storms, those results are incorrect
Record Id: after
Design Method SBUH Rainfall type EWash-3hr.rac Hyd Intv 5.00 min Peaking Factor 484.00 Storm Duration 3.00 hrs Abstraction Coeff 0.20 Pervious Area 0.00 ac DCIA 2.066 ac Pervious CN 0.00 DC CN 98.00 Pervious TC 0.00 min DC TC 6.1128 min
DCI - CN Calc Description SubArea Sub cn
before construction 2.066 ac 98.00 DC Composited CN (AMC 2) 98.00
DCI - TC Calc Type Description Length Slope Coeff Misc TT
Sheet Smooth Surfaces. 20.00 ft 2.0% 0.011 0.00 in 0.5055 minShallow Paved and gravel areas (n=0.012) 900.00 ft 1.0% 0.012 5.6073 min
Pervious TC 6.1128 min