basics of proc tabulate - analytics, business intelligence ... group presentatio… · anky lai...
TRANSCRIPT

Anky LaiCancer Surveillance & Outcomes (CSO)
Population Oncology
BC Cancer Agency
Basics of Proc Tabulate

Introduction
What is Proc Tabulate?– A procedure that displays descriptive statistics in tabular format
But aren’t there other procs that do the same thing…
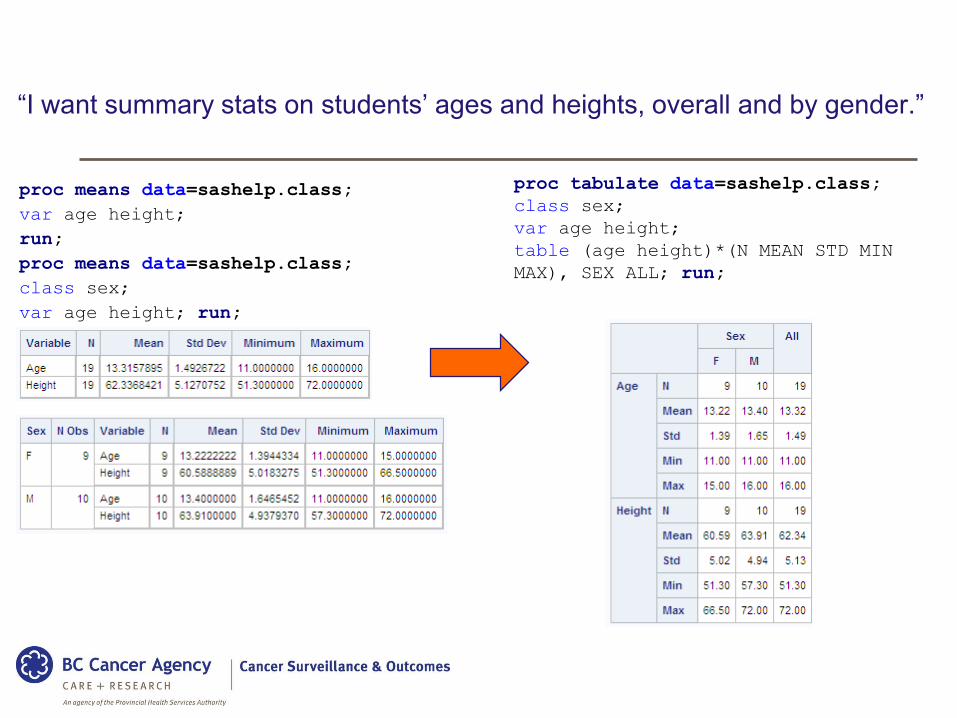
proc means data=sashelp.class;
var age height;
run;
proc means data=sashelp.class;
class sex;
var age height; run;
“I want summary stats on students’ ages and heights, overall and by gender.”
proc tabulate data=sashelp.class;
class sex;
var age height;
table (age height)*(N MEAN STD MIN
MAX), SEX ALL; run;
Introduction
Why should you use it?– Payoff is in the output
– Saves a lot of time
– Reduces errors
– Easy to format tables
Outline
PROC TABULATE basics
Customize tables
Export tables
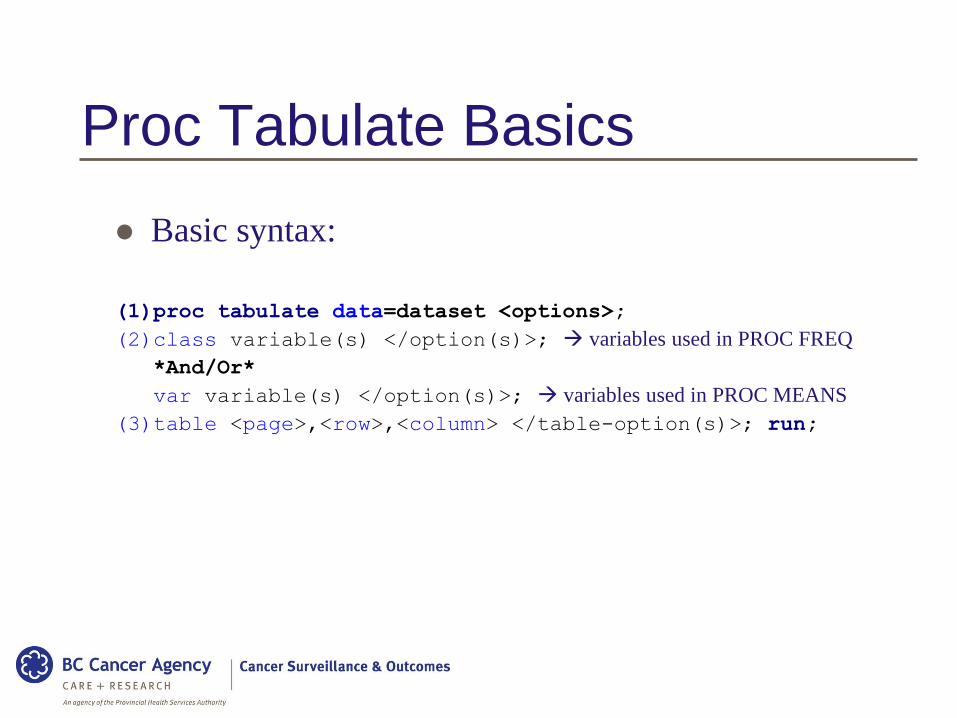
Proc Tabulate Basics
Basic syntax:
(1)proc tabulate data=dataset <options>;
(2)class variable(s) </option(s)>; variables used in PROC FREQ
*And/Or*
var variable(s) </option(s)>; variables used in PROC MEANS
(3)table <page>,<row>,<column> </table-option(s)>; run;
Table Statement All variables listed in the TABLE statement must
be listed in CLASS or VAR
More than one TABLE statement can be used
The order of the variables in the statement will be the same as the output table
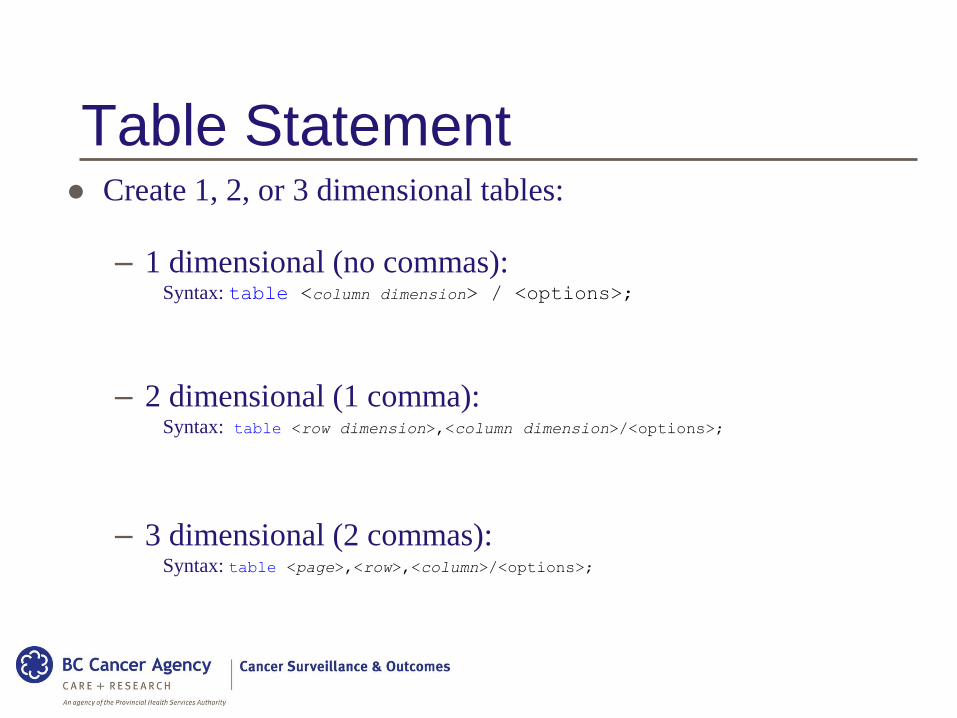
Table Statement Create 1, 2, or 3 dimensional tables:
– 1 dimensional (no commas): Syntax: table <column dimension> / <options>;
– 2 dimensional (1 comma): Syntax: table <row dimension>,<column dimension>/<options>;
– 3 dimensional (2 commas): Syntax: table <page>,<row>,<column>/<options>;

Table Statement Operators to use in each dimension:
1) Asterisk (*) adding a classification variableadding another statistic
2) Parentheses ( ) group elements and simplify coding and output
3) ‘space’ places output for each element immediately after the output of the preceding.
4) All calculate row or column totals
Dataset Dataset: sashelp.CARS (N=428)
Set up dataset as you would have it for PROC FREQ or PROC MEANS
Examples done in SAS V9.3
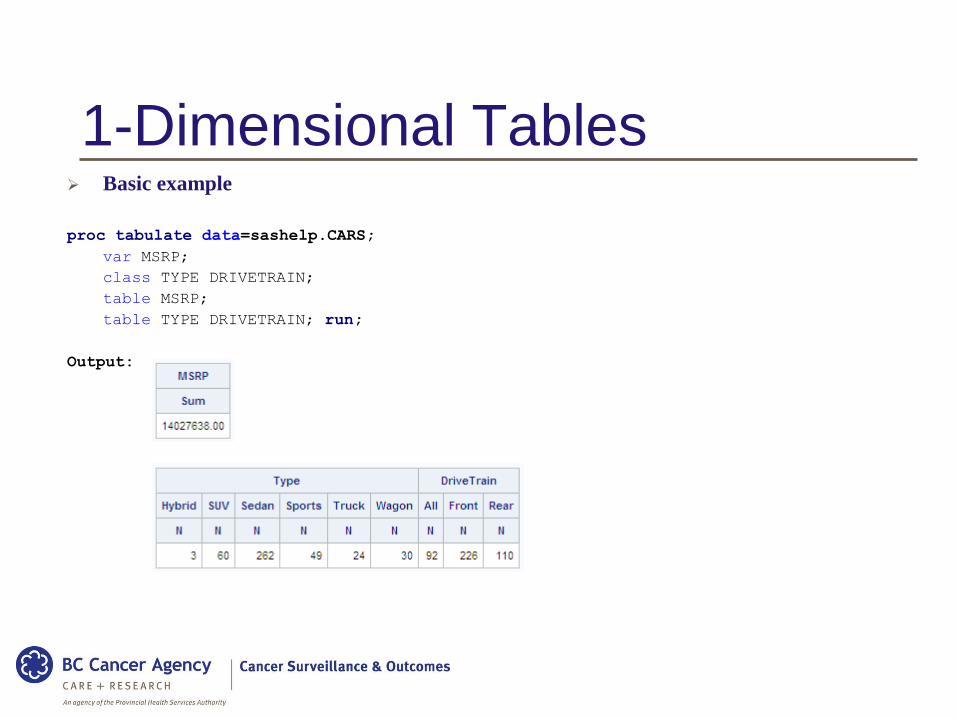
1-Dimensional Tables Basic example
proc tabulate data=sashelp.CARS;
var MSRP;
class TYPE DRIVETRAIN;
table MSRP;
table TYPE DRIVETRAIN; run;
Output:
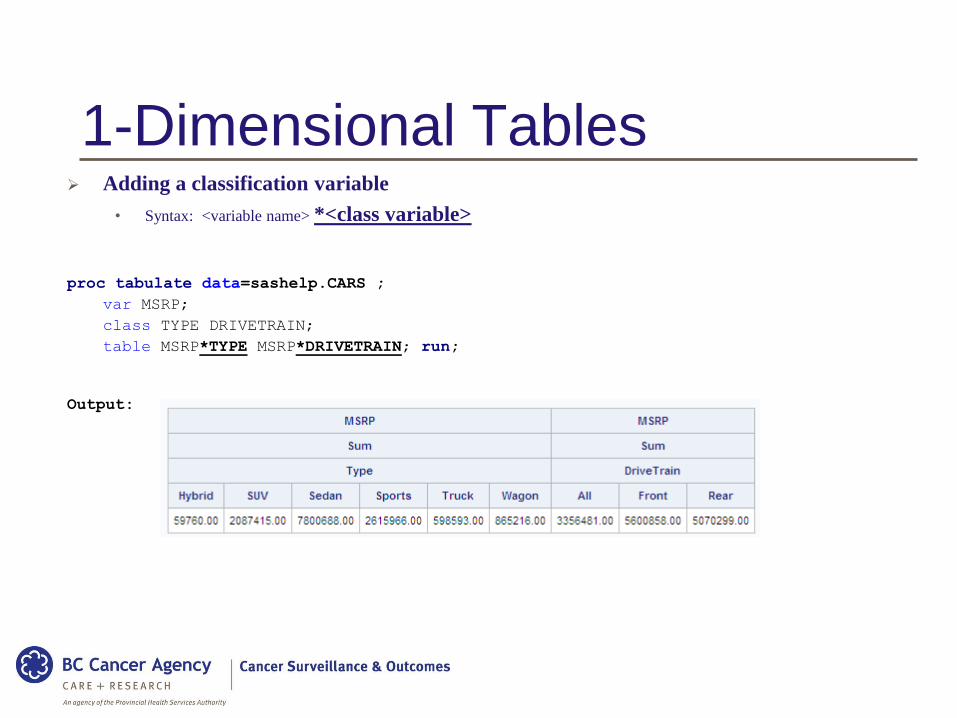
1-Dimensional Tables Adding a classification variable
• Syntax: <variable name> *<class variable>
proc tabulate data=sashelp.CARS ;
var MSRP;
class TYPE DRIVETRAIN;
table MSRP*TYPE MSRP*DRIVETRAIN; run;
Output:

1-Dimensional Tables Adding another statistic
• Syntax: <variable name>*statistic-keyword
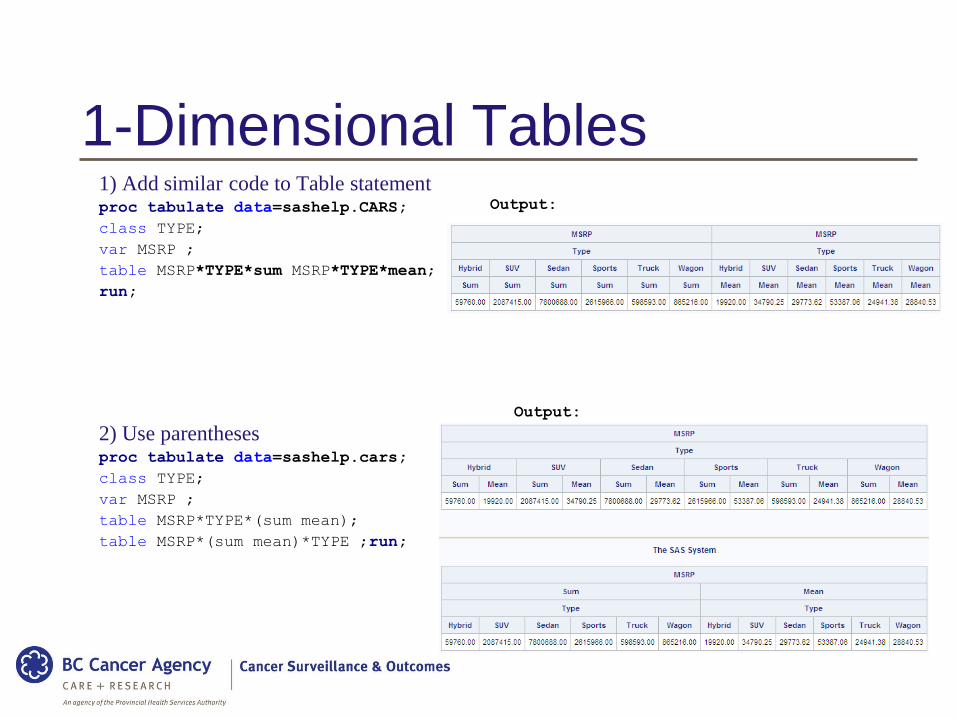
1-Dimensional Tables1) Add similar code to Table statementproc tabulate data=sashelp.CARS;
class TYPE;
var MSRP ;
table MSRP*TYPE*sum MSRP*TYPE*mean;
run;
Output:
2) Use parenthesesproc tabulate data=sashelp.cars;
class TYPE;
var MSRP ;
table MSRP*TYPE*(sum mean);
table MSRP*(sum mean)*TYPE ;run;
Output:
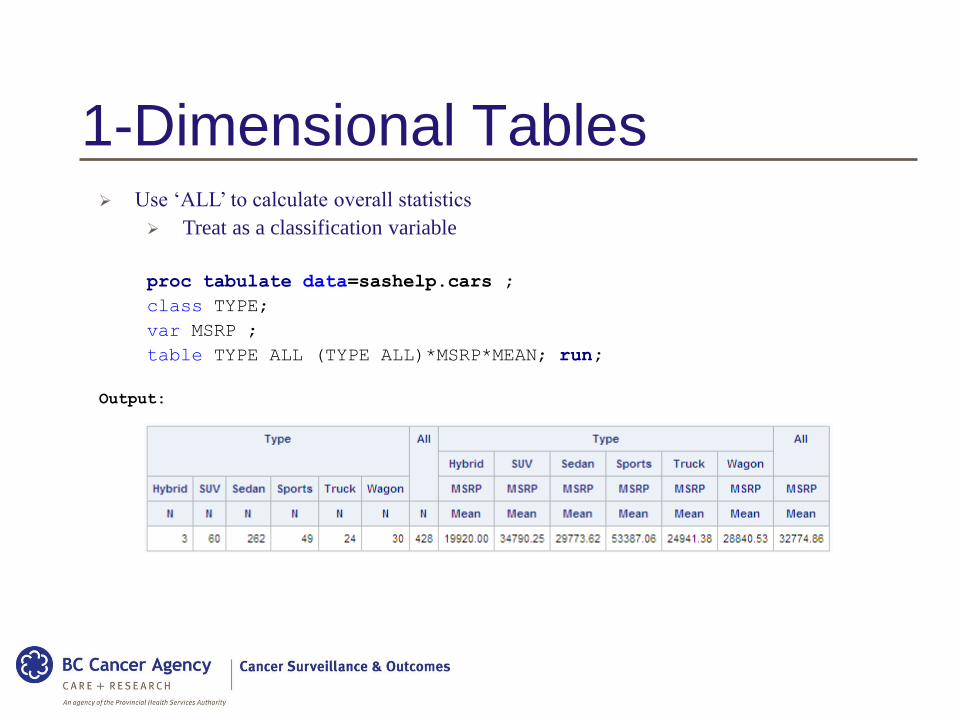
1-Dimensional Tables Use ‘ALL’ to calculate overall statistics
Treat as a classification variable
proc tabulate data=sashelp.cars ;
class TYPE;
var MSRP ;
table TYPE ALL (TYPE ALL)*MSRP*MEAN; run;
Output:
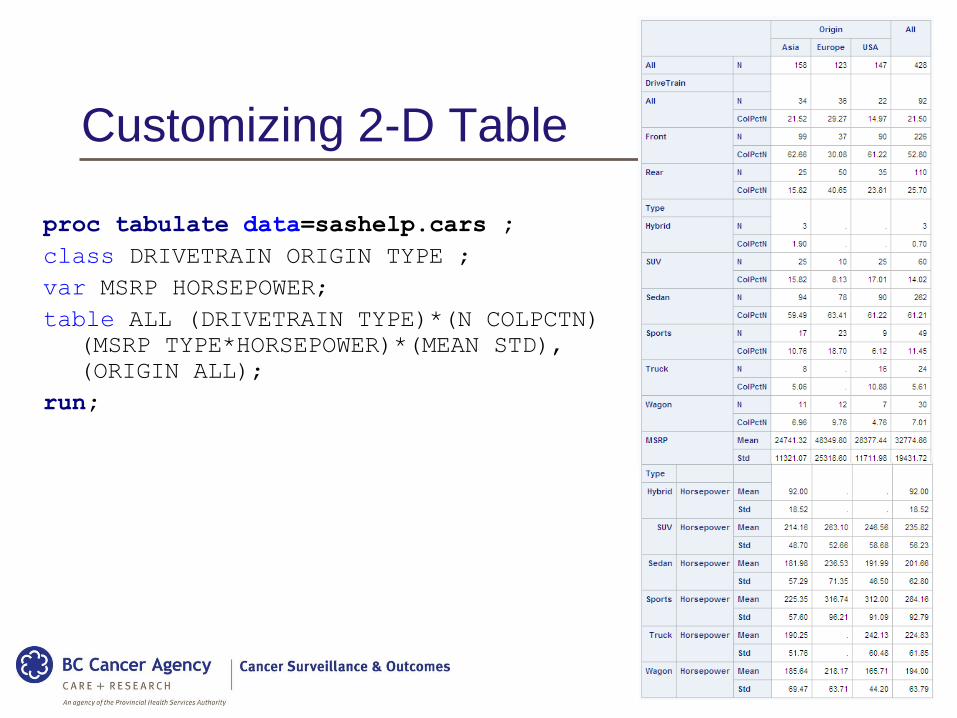
Customizing 2-D Table
proc tabulate data=sashelp.cars ;
class DRIVETRAIN ORIGIN TYPE ;
var MSRP HORSEPOWER;
table ALL (DRIVETRAIN TYPE)*(N COLPCTN)
(MSRP TYPE*HORSEPOWER)*(MEAN STD),
(ORIGIN ALL);
run;
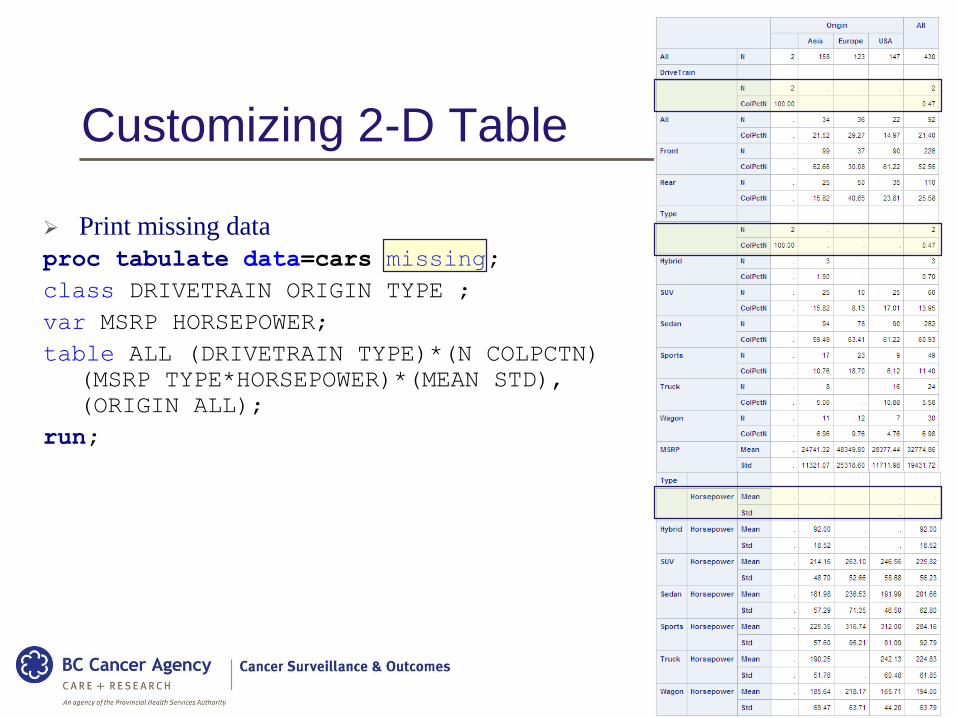
Customizing 2-D Table
Print missing data
proc tabulate data=cars missing;
class DRIVETRAIN ORIGIN TYPE ;
var MSRP HORSEPOWER;
table ALL (DRIVETRAIN TYPE)*(N COLPCTN)
(MSRP TYPE*HORSEPOWER)*(MEAN STD),
(ORIGIN ALL);
run;
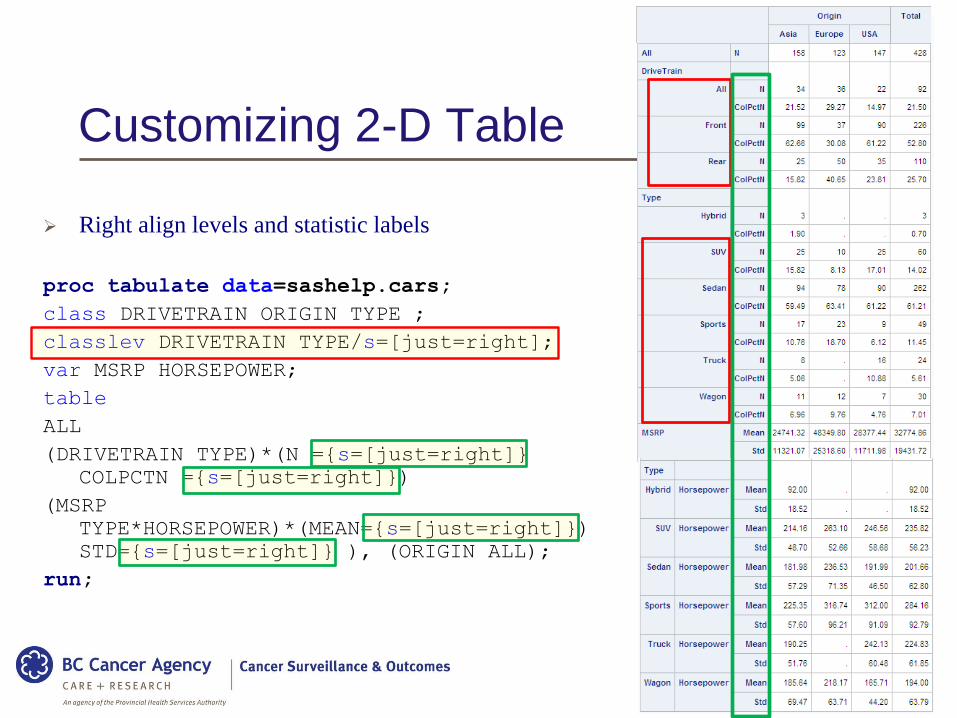
Customizing 2-D Table
Right align levels and statistic labels
proc tabulate data=sashelp.cars;
class DRIVETRAIN ORIGIN TYPE ;
classlev DRIVETRAIN TYPE/s=[just=right];
var MSRP HORSEPOWER;
table
ALL
(DRIVETRAIN TYPE)*(N ={s=[just=right]}
COLPCTN ={s=[just=right]})
(MSRP
TYPE*HORSEPOWER)*(MEAN={s=[just=right]})
STD={s=[just=right]} ), (ORIGIN ALL);
run;
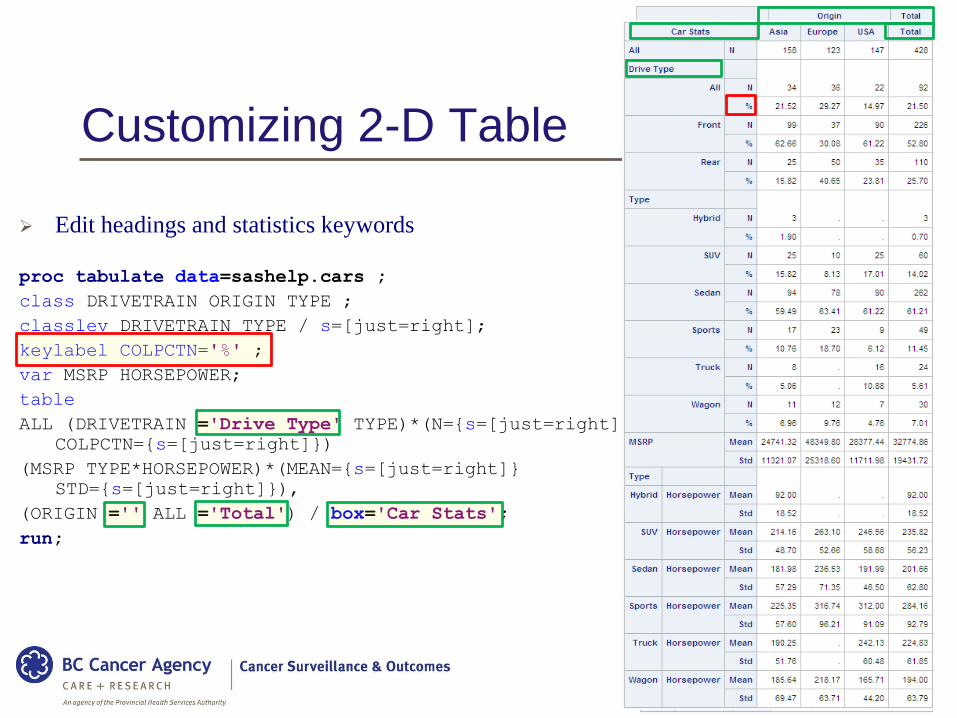
Customizing 2-D Table
Edit headings and statistics keywords
proc tabulate data=sashelp.cars ;
class DRIVETRAIN ORIGIN TYPE ;
classlev DRIVETRAIN TYPE / s=[just=right];
keylabel COLPCTN='%' ;
var MSRP HORSEPOWER;
table
ALL (DRIVETRAIN ='Drive Type' TYPE)*(N={s=[just=right]}
COLPCTN={s=[just=right]})
(MSRP TYPE*HORSEPOWER)*(MEAN={s=[just=right]}
STD={s=[just=right]}),
(ORIGIN ='' ALL ='Total') / box='Car Stats';
run;
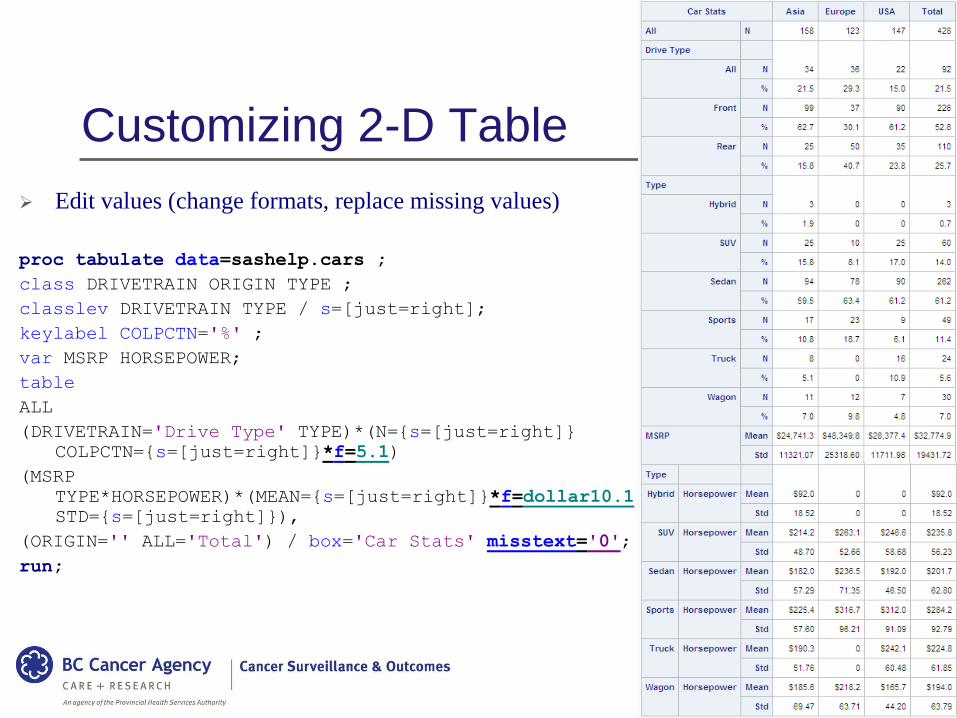
Customizing 2-D Table
Edit values (change formats, replace missing values)
proc tabulate data=sashelp.cars ;
class DRIVETRAIN ORIGIN TYPE ;
classlev DRIVETRAIN TYPE / s=[just=right];
keylabel COLPCTN='%' ;
var MSRP HORSEPOWER;
table
ALL
(DRIVETRAIN='Drive Type' TYPE)*(N={s=[just=right]}
COLPCTN={s=[just=right]}*f=5.1)
(MSRP
TYPE*HORSEPOWER)*(MEAN={s=[just=right]}*f=dollar10.1
STD={s=[just=right]}),
(ORIGIN='' ALL='Total') / box='Car Stats' misstext='0';
run;
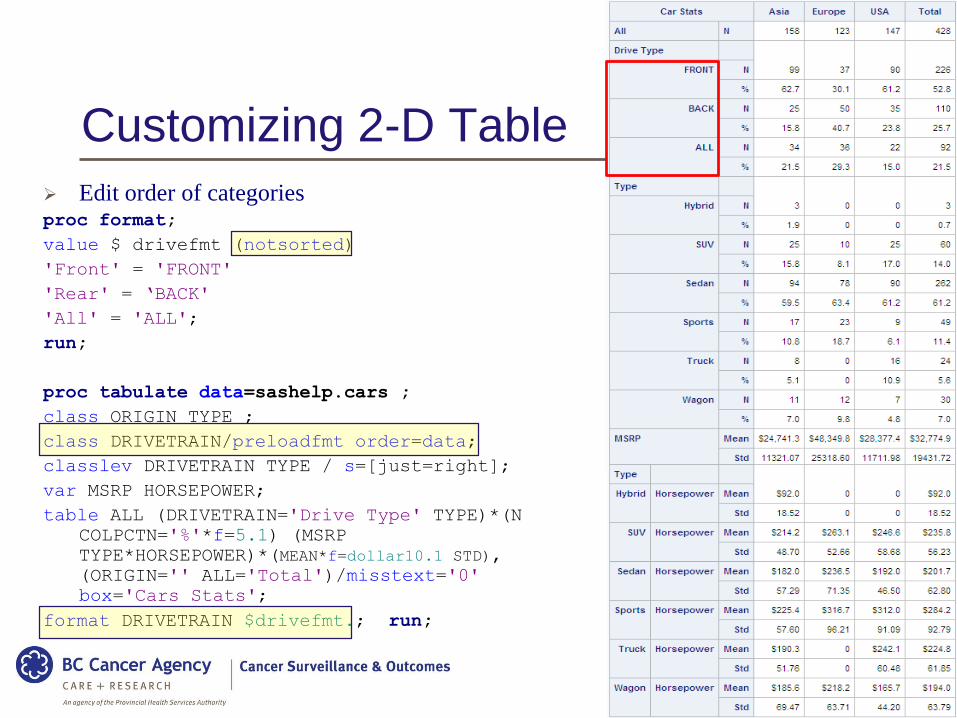
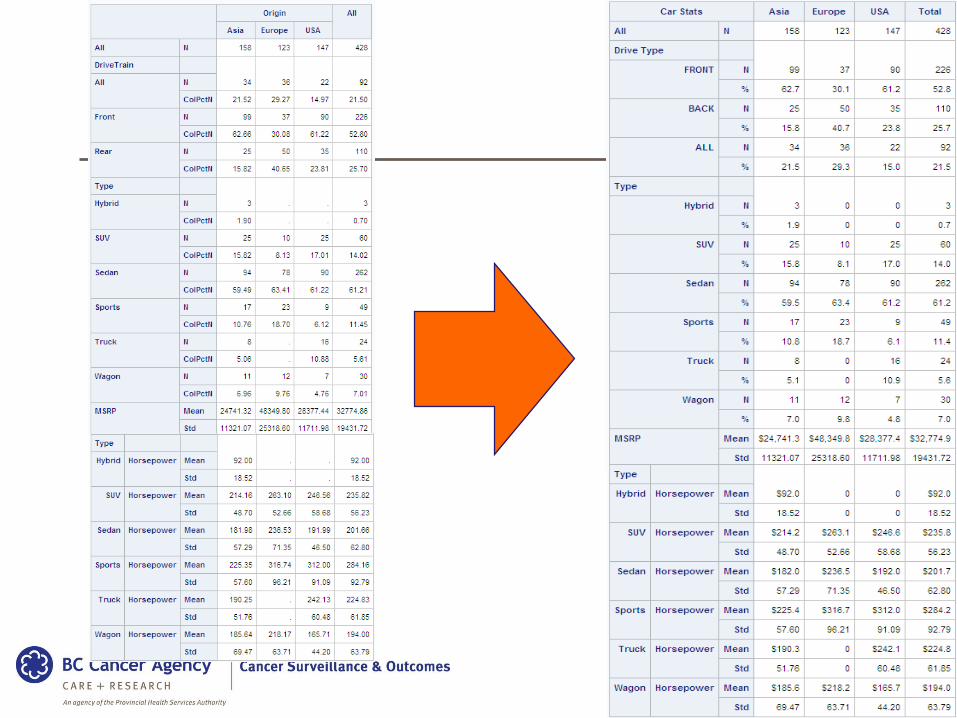
Customizing 2-D Table
Edit order of categories proc format;
value $ drivefmt (notsorted)
'Front' = 'FRONT'
'Rear' = ‘BACK'
'All' = 'ALL';
run;
proc tabulate data=sashelp.cars ;
class ORIGIN TYPE ;
class DRIVETRAIN/preloadfmt order=data;
classlev DRIVETRAIN TYPE / s=[just=right];
var MSRP HORSEPOWER;
table ALL (DRIVETRAIN='Drive Type' TYPE)*(N
COLPCTN='%'*f=5.1) (MSRP
TYPE*HORSEPOWER)*(MEAN*f=dollar10.1 STD),
(ORIGIN='' ALL='Total')/misstext='0'
box='Cars Stats';
format DRIVETRAIN $drivefmt.; run;
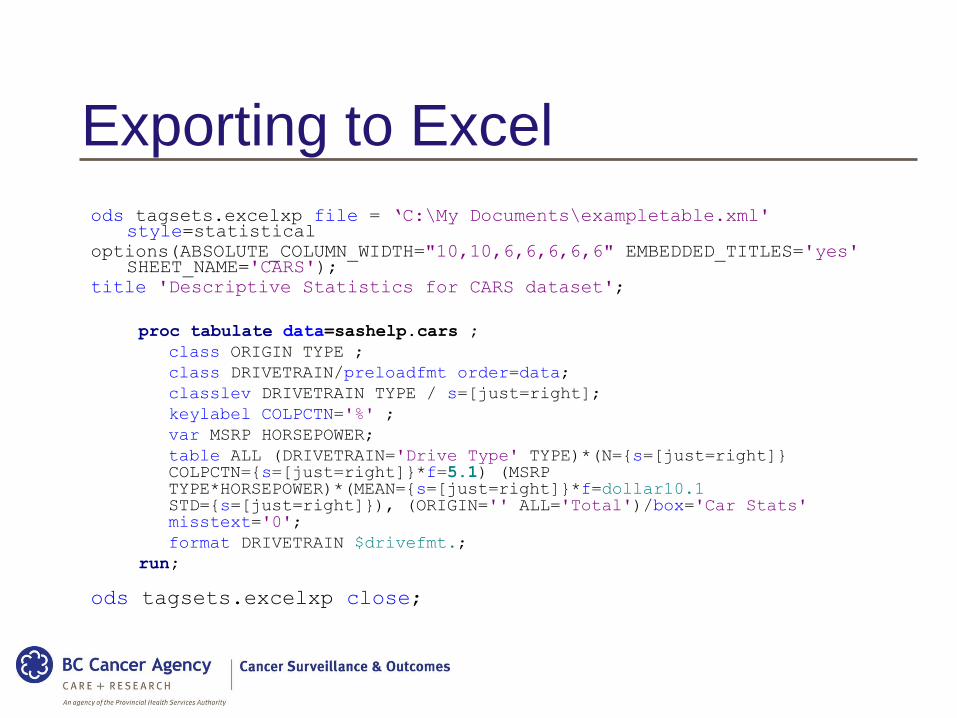
Exporting to Excel
ods tagsets.excelxp file = ‘C:\My Documents\exampletable.xml'style=statistical
options(ABSOLUTE_COLUMN_WIDTH="10,10,6,6,6,6,6" EMBEDDED_TITLES='yes'SHEET_NAME='CARS');
title 'Descriptive Statistics for CARS dataset';
proc tabulate data=sashelp.cars ;
class ORIGIN TYPE ;
class DRIVETRAIN/preloadfmt order=data;
classlev DRIVETRAIN TYPE / s=[just=right];
keylabel COLPCTN='%' ;
var MSRP HORSEPOWER;
table ALL (DRIVETRAIN='Drive Type' TYPE)*(N={s=[just=right]} COLPCTN={s=[just=right]}*f=5.1) (MSRP TYPE*HORSEPOWER)*(MEAN={s=[just=right]}*f=dollar10.1STD={s=[just=right]}), (ORIGIN='' ALL='Total')/box='Car Stats'misstext='0';
format DRIVETRAIN $drivefmt.;
run;
ods tagsets.excelxp close;
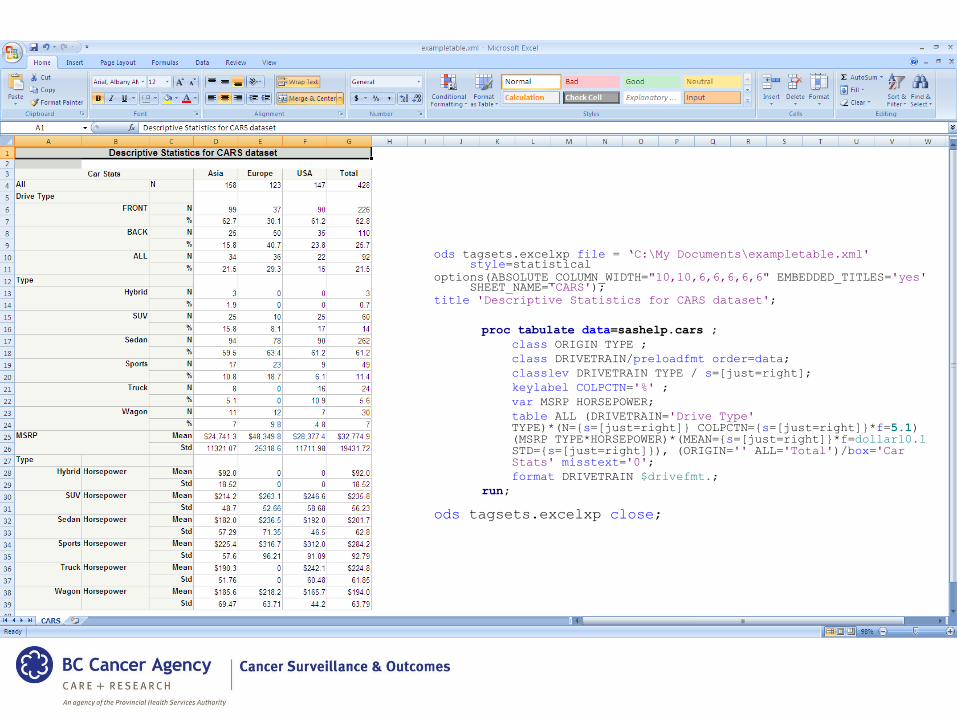
Exporting to Excel
ods tagsets.excelxp file = ‘C:\My Documents\exampletable.xml'style=statistical
options(ABSOLUTE_COLUMN_WIDTH="10,10,6,6,6,6,6" EMBEDDED_TITLES='yes'SHEET_NAME='CARS');
title 'Descriptive Statistics for CARS dataset';
proc tabulate data=sashelp.cars ;
class ORIGIN TYPE ;
class DRIVETRAIN/preloadfmt order=data;
classlev DRIVETRAIN TYPE / s=[just=right];
keylabel COLPCTN='%' ;
var MSRP HORSEPOWER;
table ALL (DRIVETRAIN='Drive Type'TYPE)*(N={s=[just=right]} COLPCTN={s=[just=right]}*f=5.1) (MSRP TYPE*HORSEPOWER)*(MEAN={s=[just=right]}*f=dollar10.1STD={s=[just=right]}), (ORIGIN='' ALL='Total')/box='Car Stats' misstext='0';
format DRIVETRAIN $drivefmt.;
run;
ods tagsets.excelxp close;
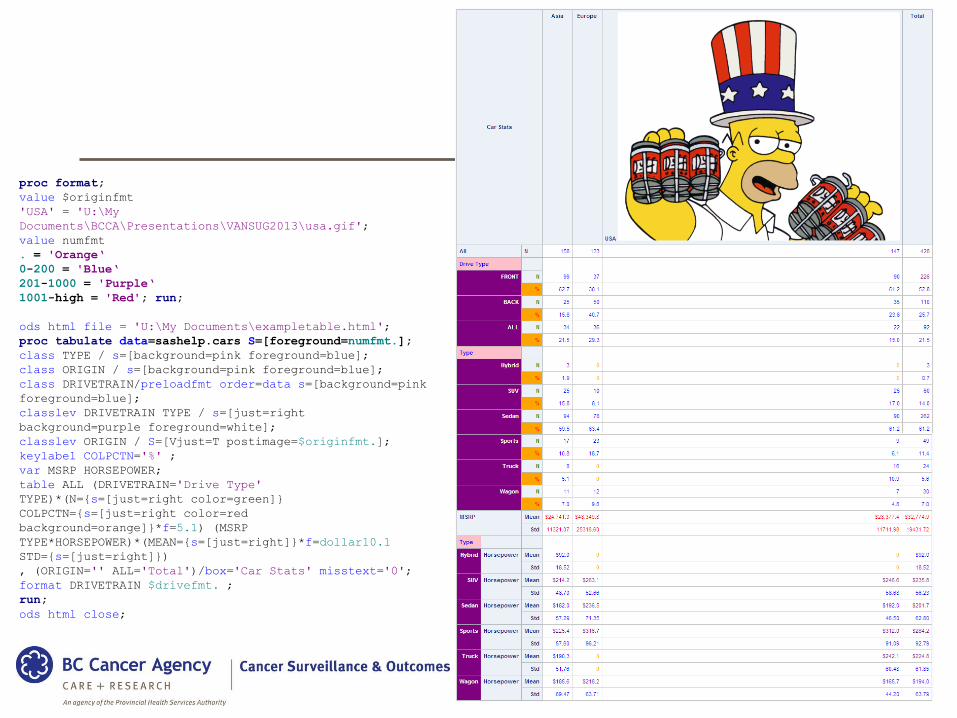
proc format;
value $originfmt
'USA' = 'U:\My
Documents\BCCA\Presentations\VANSUG2013\usa.gif';
value numfmt
. = 'Orange‘
0-200 = 'Blue‘
201-1000 = 'Purple‘
1001-high = 'Red'; run;
ods html file = 'U:\My Documents\exampletable.html';
proc tabulate data=sashelp.cars S=[foreground=numfmt.];
class TYPE / s=[background=pink foreground=blue];
class ORIGIN / s=[background=pink foreground=blue];
class DRIVETRAIN/preloadfmt order=data s=[background=pink
foreground=blue];
classlev DRIVETRAIN TYPE / s=[just=right
background=purple foreground=white];
classlev ORIGIN / S=[Vjust=T postimage=$originfmt.];
keylabel COLPCTN='%' ;
var MSRP HORSEPOWER;
table ALL (DRIVETRAIN='Drive Type'
TYPE)*(N={s=[just=right color=green]}
COLPCTN={s=[just=right color=red
background=orange]}*f=5.1) (MSRP
TYPE*HORSEPOWER)*(MEAN={s=[just=right]}*f=dollar10.1
STD={s=[just=right]})
, (ORIGIN='' ALL='Total')/box='Car Stats' misstext='0';
format DRIVETRAIN $drivefmt. ;
run;
ods html close;
References
http://support.sas.com/resources/papers/proceedings09/039-2009.pdf