basic studies in the field of high-temperature engineering
TRANSCRIPT
Basic Studies in the Fieldof High-temperatureEngineering
Nuclear Science
N U C L E A R • E N E R G Y • A G E N C Y
Third InformationExchange MeetingIbaraki-ken, Japan11-12 September 2003
Nuclear Science
Basic Studies in the Field of High-Temperature Engineering
Third Information Exchange Meeting Ibaraki-ken, Japan
11-12 September 2003
Co-organised by the Japan Atomic Energy Research Institute (JAERI)
© OECD 2004 NEA No. 5309
NUCLEAR ENERGY AGENCY ORGANISATION FOR ECONOMIC CO-OPERATION AND DEVELOPMENT

ORGANISATION FOR ECONOMIC CO-OPERATION AND DEVELOPMENT
Pursuant to Article 1 of the Convention signed in Paris on 14th December 1960, and which came into force on 30th September 1961, the Organisation for Economic Co-operation and Development (OECD) shall promote policies designed:
� to achieve the highest sustainable economic growth and employment and a rising standard of living in member countries, while maintaining financial stability, and thus to contribute to the development of the world economy;
� to contribute to sound economic expansion in member as well as non-member countries in the process of economic development; and
� to contribute to the expansion of world trade on a multilateral, non-discriminatory basis in accordance with international obligations.
The original member countries of the OECD are Austria, Belgium, Canada, Denmark, France, Germany, Greece, Iceland, Ireland, Italy, Luxembourg, the Netherlands, Norway, Portugal, Spain, Sweden, Switzerland, Turkey, the United Kingdom and the United States. The following countries became members subsequently through accession at the dates indicated hereafter: Japan (28th April 1964), Finland (28th January 1969), Australia (7th June 1971), New Zealand (29th May 1973), Mexico (18th May 1994), the Czech Republic (21st December 1995), Hungary (7th May 1996), Poland (22nd November 1996), Korea (12th December 1996) and the Slovak Republic (14 December 2000). The Commission of the European Communities takes part in the work of the OECD (Article 13 of the OECD Convention).
NUCLEAR ENERGY AGENCY
The OECD Nuclear Energy Agency (NEA) was established on 1st February 1958 under the name of the OEEC European Nuclear Energy Agency. It received its present designation on 20th April 1972, when Japan became its first non-European full member. NEA membership today consists of 28 OECD member countries: Australia, Austria, Belgium, Canada, the Czech Republic, Denmark, Finland, France, Germany, Greece, Hungary, Iceland, Ireland, Italy, Japan, Luxembourg, Mexico, the Netherlands, Norway, Portugal, Republic of Korea, the Slovak Republic, Spain, Sweden, Switzerland, Turkey, the United Kingdom and the United States. The Commission of the European Communities also takes part in the work of the Agency.
The mission of the NEA is:
� to assist its member countries in maintaining and further developing, through international co-operation, the scientific, technological and legal bases required for a safe, environmentally friendly and economical use of nuclear energy for peaceful purposes, as well as
� to provide authoritative assessments and to forge common understandings on key issues, as input to government decisions on nuclear energy policy and to broader OECD policy analyses in areas such as energy and sustainable development.
Specific areas of competence of the NEA include safety and regulation of nuclear activities, radioactive waste management, radiological protection, nuclear science, economic and technical analyses of the nuclear fuel cycle, nuclear law and liability, and public information. The NEA Data Bank provides nuclear data and computer program services for participating countries.
In these and related tasks, the NEA works in close collaboration with the International Atomic Energy Agency in Vienna, with which it has a Co-operation Agreement, as well as with other international organisations in the nuclear field.
© OECD 2004 Permission to reproduce a portion of this work for non-commercial purposes or classroom use should be obtained through the Centrefrançais d’exploitation du droit de copie (CCF), 20, rue des Grands-Augustins, 75006 Paris, France, Tel. (33-1) 44 07 47 70, Fax (33-1) 46 34 67 19, for every country except the United States. In the United States permission should be obtained through the Copyright Clearance Center, Customer Service, (508)750-8400, 222 Rosewood Drive, Danvers, MA 01923, USA, or CCC Online: http://www.copyright.com/. All other applications for permission to reproduce or translate all or part of this book should be made to OECD Publications, 2, rue André-Pascal, 75775 Paris Cedex 16, France.
3
FOREWORD
The NEA Nuclear Science Committee (NSC) organised a first workshop on high-temperature engineering research and facilities at the Energy Research Centre (ECN) of the Netherlands at Petten in November 1997. One of the recommendations emanating from this meeting was to organise a series of information exchange meetings on “Basic Studies in the Field of High-temperature Engineering”. This recommendation was endorsed by the NSC and the first meeting in the series was held in Paris, France in September 1999. The meeting was followed by a second meeting in Paris in October 2001. The third meeting, object of the present proceedings, was held in Oarai, Japan on 11-12 September 2003.
The meetings have been devoted to high-temperature, irradiation-induced effects in advanced materials and fuels, and to possible co-operative studies using available experimental facilities. They have also become a forum for the presentation of national and international research programmes relevant to high-temperature irradiation, as well as to discussing behaviour of irradiated graphite/carbon and ceramic materials, including their composites under operation and storage conditions, and the development of in-pile instrumentation.
The third meeting, the last in the series, concluded with a general discussion and recommendations for future work. The recommendations, which can be found in the Executive Summary, will be discussed at the NEA Nuclear Science Committee meeting in June 2004.
5
TABLE OF CONTENTS
Foreword ............................................................................................................................................ 3
Executive Summary............................................................................................................................ 9
SESSION I Overviews of High-temperature Engineering Research in Each Country and Organisation ..................................................................................... 11
Chairs: G. Neighbour, S. Shiozawa
M. MethnaniIAEA High-temperature Gas-cooled Reactor Activities .......................................... 13
B.J. Marsden, A.S.L. Fok, J. Marrow, P. Mummery Research Activities of the Nuclear Graphite Research Group at the University of Manchester, UK.................................................................................. 19
T. Burchell, M. Srinivasan, D. NausCodes and Standards Development for Graphite-moderated Nuclear Reactors ....... 33
P. Billot, J.L. Seran, M.T. Cabrillat, H. Burlet, A. Terlain, J.P. BonalCEA R&D Programme on Structural Materials for Future Gas-cooled Nuclear Systems ....................................................................................................... 41
M. Ishihara, T. Shibata, S. Ishino, T. Terai, T. Ohoshima, T. Oku, Y. Motohashi, M. Yamaha, T. Shikama, C. Mori, S. ShiozawaCurrent Status of the Innovative Basic Research on High-temperature Engineering using the HTTR.................................................................................... 67
SESSION II Basic Studies on Behaviour of Irradiated Graphite/Carbon Including their Composites .................................................................................... 81
Chairs: B. Marsden, T. Oku
D. Buckthorpe, M. Davies, R. Couturier, J. van der Laan, J. Hegeman, A. Vreeling, B. Riou, H. Rantala, P. Ennis, G. Haag, K. Kuhn, A. Buenaventura, B-C. FriedrichHigh-temperature Reactor Materials: Progress of HTR-M Projects......................... 83
T. MaruyamaNeutron Irradiation Effect on the Dimensional Change of Graphite Materials ........ 95
G.B. NeighbourThe Prediction of Irradiation Creep .......................................................................... 107

6
A. Kurumada, Y. Imamura, T. Oku, M. Ishihara, S. Baba, J. AiharaIon Irradiation Effects on Tensile Properties of Carbon Fibres ................................ 121
L. Shi, S.L. Fok, B.J. Marsden, L. Ng, P. Mummery, J. Marrow Analysis of Crack Propagation in Nuclear Graphite using Three-point Bending of Sandwiched Specimens.......................................................................... 129
S. Hanawa, M. Ishihara, Y. MotohashiStudy on Multi-axial Strength Model Taking Account of Grain/Pore Microstructure ........................................................................................ 141
M.J. Holt, G.B. NeighbourExamining the Issues of Scale in Nuclear Graphite Components ............................ 153
SESSION III Other Topics in the Field of High-temperature Engineering with Emphasis on Basic Studies ..................................................................................... 171
Chairs: M. Methnani, T. Maruyama
W.F.G. van Rooijen, J.L. Kloosterman, H. van Dam, T.H.J.J. van der HagenDesign of Spherical Fuel Element for a Gas-cooled Fast Reactor............................ 173
P. GuillermierModelling of Fission Product Diffusion in High-temperature Gas Reactor Fuel.............................................................................................................. 183
SESSION IV Improvement in Material Properties through High-temperature Irradiation ............................................................................................................... 195
Chairs: T. Burchell, M. Yamawaki
T. Ohshima, N. Morishita, T. Kamiya, J. Isoya, S. Baba, J. Aihara, M. Yamaji, M. IshiharaIntroduction of Phosphorus Atoms in Silicon Carbide using Nuclear Transmutation Doping at Elevated Temperatures....................................... 197
T. Terai, Y. Nagamoto, N. Chikumoto, M. IshiharaModification of HTSC by High-temperature Neutron Irradiation............................ 203
Y. Motohashi, C. Wan, T. Sakuma, S. Harjo, T. Shibata, M. Ishihara, S. Baba, T. HoshiyaEffects of Superplastic Deformations on Thermophysical Properties of Tetragonal Zirconia Polycrystals.......................................................................... 205
Y. Sakka, T.S. Suzuki, T. Uchikoshi, K. Hiraga, T. Shibata, M. IshiharaFabrication of Tailored Ceramics by Colloidal Processing and their Application ....................................................................................................... 225
7
SESSION V Development of In-core Material Characterisation and Instrumentation Method ........................................................................................ 237
Chairs: P. Billot, T. Terai
M. Yamawaki, K. Yamaguchi, G-N. Luo, T. Terai, M. IshiharaTowards In Situ Monitoring and Characterisation of Material Surfaces Under Irradiation at Elevated Temperatures............................................................. 239
T. Shikama, K. Toh, M. Ishihara, M. Narui, S. Nagata, S. Baba, B. Tsuchiya, N. Shamoto, T. KakutaIn-reactor Optical Dosimetry in High-temperature Engineering Test Reactor (HTTR)................................................................................................ 251
K. Toh, S. Nagata, B. Tsuchiya, T. Suzuki, T. Shikama, M. Ishihara, M. Fujitsuka, T. Tanabe, S. YamamotoStudy on High-temperature Radioluminescent Ceramics for HTTR Application .................................................................................................... 261
List of Participants.............................................................................................................................. 271
9
EXECUTIVE SUMMARY
The Third Information Exchange Meeting on Basic Studies in the Field of High-temperature Engineering was held at the JAERI Oarai Research Establishment in Japan on 11-12 September 2003. It was co-organised by the OECD Nuclear Energy Agency (NEA) and the Japan Atomic Energy Research Institute (JAERI). The main areas discussed at the meeting were:
� recent studies conducted on high-temperature, irradiation-induced damage/effects in advanced materials and fuels;
� the possibility of organising co-operative studies in the field of high-temperature engineering, using the HTTR and other research reactors for irradiation research programmes in an international framework, notably under the auspices of the OECD Nuclear Energy Agency.
Fifty-two participants from seven countries and two international organisations participated in the meeting. Twenty-one papers on recent progress and national/international programmes in the field of high-temperature engineering were submitted. The papers were presented in five sessions as follows:
� Session I: Overviews of High-temperature Engineering Research in Each Country and Organisation (five papers).
� Session II: Basic Studies on Behaviour of Irradiated Graphite/Carbon Including their Composites (seven papers).
� Session III: Other Topics in the Field of High-temperature Engineering with Emphasis on Basic Studies (two papers).
� Session IV: Improvement in Material Properties through High-temperature Irradiation (four papers).
� Session V: Development of In-core Material Characterisation and Instrumentation Methods (three papers).
Session I summarised the current status of high-temperature engineering research being carried out by France, Japan, the United Kingdom, the United States and the International Atomic Energy Agency (IAEA).
Session II covered the status of the European collaboration research project HTR-M, as well as neutron irradiation effects on graphite and carbon composites, prediction of irradiation creep of graphite, ion irradiation effect on carbon fibres, crack propagation analysis of graphite, development of multi-axial strength modelling of graphite and porosity models for predicting graphite strength.
10
Session III was devoted to fuel performance research, fuel and core design aspects of fast, gas-cooled reactor concepts and modelling of fission product diffusion from high-temperature, gas-cooled reactors (HTGRs).
Session IV dealt with improvements in materials properties, development of semiconductors produced by nuclear transmutation doping, modification of high-temperature superconductors through neutron irradiation, superplastic deformation effect on the thermo-physical properties of zirconia polycrystals and fabrication of tailored ceramics through colloidal processing.
Session V covered development of in situ material characterisation methods, reactor dosimetry by optical fibres and high-temperature radioluminescent ceramics.
In the final session of the meeting, summaries and proposed recommendations written by the chairpersons of each session were distributed. According to these summaries, the following subjects were proposed for possible international collaboration:
� establishing a predictive capability of irradiation-induced property change of graphite, C/C composites and silicon carbide (SiC);
� advanced techniques for HTR in-core instrumentation and on-line monitoring;
� material modification under high-temperature irradiation, HTSC, SiC semiconductors, etc.;
� development of codes and standards for graphite materials;
� modelling of fission product diffusion in HTGR fuel.
In the discussion that followed, it was noted that the first two subjects could be of interest to the OECD/NEA, whereas the last two subjects, i.e. development of standards and modelling of HTGR fuel, would be more suitable for, or were already covered by, the IAEA programme of work. The third subject on material modification was, due to the limited number of countries interested, considered to be more appropriate for bilateral co-operation.
The meeting proposed that the OECD/NEA Nuclear Science Committee consider establishing expert groups to explore the following topics:
� establishing a predictive capability for irradiation-induced property changes in graphite, C/C composites and SiC (specific topics to be determined in consultation with the graphite expert group), to be led by the University of Manchester (first priority);
� advanced techniques for HTR in-core instrumentation and on-line monitoring, to be led by JAERI (second priority).
11
SESSION I
Overviews of High-temperature Engineering Research in Each Country and Organisation
Chairs: G. Neighbour, S. Shiozawa
13
IAEA HIGH-TEMPERATURE GAS-COOLED REACTOR ACTIVITIES
Mabrouk Methnani International Atomic Energy Agency
Wagramerstrasse 5, P.O. Box 100, A-1400 Vienna, Austria
Abstract
IAEA activities on high-temperature gas-cooled reactors are conducted with the review and support of member states, primarily through the Technical Working Group on Gas-cooled Reactors. This paper overviews current and planned activities through a review of Co-ordinated Research Projects, meetings, conferences and workshops.
14
Introduction
International interest in high-temperature gas-cooled reactor (HTGR) technology has been increasing in recent years due to a growing recognition of the potential of HTGR designs to provide high-efficiency, cost-effective electricity generation appropriate for the conditions in developing countries, and in the longer term to provide a source of high- and low-temperature process heat. The international exchange of information and co-ordination of HTGR research through the IAEA has helped to establish the foundation for the future development and deployment of HTGR technology. The gas-cooled reactor activities of the IAEA are conducted with the active participation and advice of the Technical Working Group on Gas-cooled Reactors. Updates on HTGR-related activities and published IAEA technical documents can be obtained at www.iaea.org/htgr.
Technical Working Group on Gas-cooled Reactors
The Technical Working Group on Gas-cooled Reactors (TWG-GCR) is a continuing working group whose purpose is to advise the IAEA on promoting the exchange of technical information in the field of gas-cooled reactors. Created in 1978, the group promotes international co-operation related to the development of gas-cooled reactors for electricity and process heat applications. The latter involve high-temperature applications such as hydrogen production and low-temperature applications such as seawater desalination and district heating.
The TWG-GCR currently includes participants from the following countries:
China France Germany Indonesia Japan The Netherlands Russian Federation South Africa Turkey UK US
The last meeting (the 18th) was held in June 2003 in Istanbul, Turkey [1].
Co-ordinated Research Projects
Research efforts supported by the agency are normally carried out within the framework of Co-ordinated Research Projects (CRPs). CRPs are developed in relation to a well-defined research topic on which a number of institutions agree to collaborate, and represent an effective means of bringing together researchers in both developing and industrialised countries to solve a problem of common interest. Each CRP is essentially a network of 5-15 national research institutions mandated to conduct the research within the countries concerned, each being represented by a Chief Scientific Investigator (CSI).
Advanced HTGR designs currently being developed promise a high degree of safety with substantially reduced safety-related demands on plant operations and licensing oversight through reliance on inherent safety features. These anticipated benefits derive largely from the ability of the ceramic-coated fuel particles to retain fission products under normal and accident conditions, the neutron physics behaviour of the core, the chemical stability of the core and the ability of the design to dissipate decay heat by natural heat transport mechanisms without reaching excessive temperatures. In support of licensing and commercial deployment of advanced HTGRs, these features must be demonstrated under experimental conditions representing realistic reactor conditions, and the methods used to predict the performance of the fuel and reactor must be validated against experimental data.

15
Currently, two CRPs are ongoing, one on HTGR performance evaluation (CRP-5) and one on advances in HTGR fuel technology (CRP-6). A new CRP on fresh water co-generation using HTGRs is also under consideration. A brief overview of the three CRPs follows.
CRP on Evaluation of High-temperature Gas-cooled Reactor Performance (CRP-5)
The CRP, initiated in October 1997 and scheduled to be completed in October 2004, has the following member states as participants: China, France, Germany, Indonesia, Japan, the Netherlands, the Russian Federation, South Africa, Turkey and the United States The following scope has been defined for the project:
� reactor physics benchmark analysis;
� thermal-hydraulic transient benchmark analysis;
� demonstration of HTGR safety characteristics.
Benchmark problems have been defined for the purpose of comparing analytical results with experimental data from HTR-10, HTTR, as well as the PBMR and HTGR projects. Four research co-ordination meetings have already taken place and an IAEA technical document containing the first part of the results is being published [2].
CRP on Advances in HTGR Fuel Technology (CRP-6)
The CRP involves institutes from eight member states: China, France, Germany, Japan, the Netherlands, the Republic of Korea, Russia and the United States. The first meeting was held 9-11 Dec. 2002 at the VIC in Vienna and the following topics were discussed:
� previous work, current issues and planned activities;
� fuel design, fabrication, QA/QC and licensing (topical area 1);
� fuel irradiation, testing, operation performance and spent fuel disposition (topical area 2);
� fuel characterisation and performance modelling (topical area 3).
A work plan and schedule for the CRP has been agreed upon and the next meeting is planned for 2004 [3].
Proposed CRP on fresh water co-generation using high-temperature gas-cooled reactors
Process heat has always been one of the potential applications of modular high-temperature gas-cooled reactors (MHTGRs), in co-generation with electricity. Applications such as hydrogen production and coal gasification require high-temperature steam, which could be made available by this reactor type. Understandably, the emphasis in the past has been mostly on these high-temperature applications. However, with recent developments in HTGR and desalination technologies, the potential for low-temperature heat applications such as seawater desalination using Multi-stage Flashing (MSF) or Multi-effect Distillation (MED) technologies is unfolding as a cost-effective solution to the

16
energy-intensive process of fresh water production. Since then, and with the switch to advanced gas-turbine designs, HTGRs offer virtually cost-free energy at the heat sink boundaries of the pre-cooler and inter-cooler, and importantly so, at the desired range of temperatures needed by the distillation process (100-120�C). Since energy costs represent 30-50% of overall desalination costs, the incentives for using HTGRs for potable water production are compelling. Preliminary studies point to the potential for cutting the projected water costs by up to 50%. Another potential benefit would be the boosted co-generation efficiency. Operating an HTGR in co-generation mode would help boost the plant energy utilisation efficiency to 80% or more, with no significant effect on electrical efficiency.
Workshops, topical meetings and conferences
� IAEA-HTGR Workshop 2003 (ICTP, Trieste, Italy, 7-11 July 2003). An IAEA workshop on the status of HTGR Technology was hosted by the ICTP centre in Trieste, Itlay (7-11 July 2003) with 23 participants attending from 12 member states. The five-day workshop included lectures on gas-cooled reactor design, market potential, fuel aspects, core and power conversion unit design, fuel cycle and safety aspects. Real-time core temperature viewgraphs for a 600 MWt HTGR nuclear power plant undergoing a forced loss of cooling accident with depressurisation, were communicated daily to the participants to illustrate the large thermal constant of this particular design and its effect on plant safety [4].
� IAEA-HTGR Workshop 2004 (INET, Beijing, China, 5-8 April 2004). An IAEA HTGR workshop will be held at the INET institute of Tsinghua University in China in April 2004. The workshop will focus on HTGR passive safety demonstration, key design options, analysis methods, market potential and user requirements.
� Topical Meeting on HTGR Modelling, Fuel and Graphite Behaviour (Istanbul, Turkey, 16 June 2003). A topical meeting was held in conjunction with the meeting of the Technical Working Group on HTGRs in Istanbul, Turkey (16-18 June 2003). The topics include results from the ongoing co-ordinated research project on HTGR performance evaluation, HTGR simulation and modelling as well as fuel and graphite behaviour [1].
� HTR-2002 (Petten, NL, 22-24 April 2002). In April 2002, the Agency co-operated with the European Union’s High-temperature Reactor Technology Network (HTR-TN) on their HTR-2002 conference held in Petten, the Netherlands, by sponsoring the attendance of some delegates from developing countries and also publishing and distributing the conference proceedings. The next conference is planned in 2004.
17
REFERENCES
[1] Proceedings of the 18th Meeting of the Technical Working Group on Gas-cooled Reactors,Istanbul, Turkey (June 2003), IAEA CD-ROM Working Material.
[2] Proceedings of the 4th Research Coordination Meeting on HTGR Performance Evaluation,Vienna, Austria (Sept. 2002), IAEA CD-ROM Working Material.
[3] Proceedings of the 1st Research Coordination Meeting on Advances in HTGR Fuel Technology,Vienna, Austria (Dec. 2002), IAEA CD-ROM Working Material.
[4] Proceedings of the HTGR ICTP Workshop (July 2003), IAEA CD-ROM Working Material.
19
RESEARCH ACTIVITIES OF THE NUCLEAR GRAPHITE RESEARCH GROUP AT THE UNIVERSITY OF MANCHESTER, UK
Barry J. Marsden, Alex S.L. Fok Manchester School of Engineering
James Marrow, Paul Mummery Manchester Materials Science Centre
Abstract
In 2001 the Nuclear Safety Division (NSD) of the UK Health and Safety Executive (HSE) decided to underwrite the Nuclear Graphite Research Group (NGRG) at the University of Manchester, UK with the aim of providing a source of independent research and advice to the HSE (NSD). Since then the group has rapidly expanded to 16 members and attracted considerable funding from the nuclear power industry and the regulator for a wide range of research and consultancy work. It is now also part of the Material Performance Centre within the BNFL Universities Research Alliance. Extensive collaboration exists between the group and other nuclear research institutes, both in the UK and overseas.
This paper briefly describes some of the research programmes being carried out by the NGRG at Manchester.

20
Introduction
The main emphasis in nuclear power in the UK has been based on graphite-moderated reactors. This started with the development of air-cooled reactors and eventually led to carbon-dioxide-cooled reactors. During the 1960s and 1970s a considerable amount of high-temperature reactor research was carried out in connection with the DRAGON project, resulting in an initial design of a British HTR. Unfortunately in the 1970s this project was abandoned in favour of the development of the fast reactor at Dounreay. However, since 1946 six major graphite-moderated research/prototype reactors and 40 commercial gas-cooled reactors have been built and operated, with 25 commercial reactors still in operation. During the 1980s and 1990s the UK nuclear industry was reorganised and downsized, but it is still expected that graphite-moderated reactors will be operating in the UK for the next 20 years. Also, BNFL has become a major shareholder in the PBMR project in South Africa, rekindling the interest in the development of nuclear graphite technology in the UK.
The Nuclear Graphite Research Group (NGRG) was set up in September 2001 at the Manchester School of Engineering to provide independent advice and research on safety issues related to the behaviour of nuclear graphite and graphite reactor cores. As such the interests of the group cover the study of irradiated and radiolytically oxidised nuclear graphite, the behaviour and life of nuclear graphite components in the reactor and the behaviour and life of core structures during reactor operation. In addition the group is involved in research into nuclear graphite decommissioning issues. The UK Heath and Safety Executive (Nuclear Safety Division) have undertaken to underwrite the activities of the group and recently the NGRG has become a member of the Centre for Materials in Process and Power of the BNFL University Research Alliances. The group already consists of nine members of staff, one consultant, three post-doctoral research assistants and three doctorate students, and has attracted a considerable amount of funding from the nuclear industry. Extensive collaboration exists between the group and other research institutes, both in the UK and overseas, notably the Nuclear Research Group (NRG), Petten, in the Netherlands and the Institute of Nuclear Energy Technology (INET), Tsinghua University, in China.
One of the main aims of the NGRG is to gain a mechanistic understanding of dimensional changes and property changes in irradiated graphite, including the effects of radiolytic oxidation. Research is being carried out at the microstructural and component levels, using both experimentation and modelling. The understanding of the failure/fracture behaviour of nuclear graphite components is an important part of this research. It is hoped that this work will enable present reactors to operate safely for longer and enable new graphite to be developed for future high-temperature reactor systems.
This paper describes some of the activities carried out within the Nuclear Graphite Research Group at Manchester.
Crack growth and arrest
Andrew Hodgkins1
Graphite fracture is characterised by the formation of a process zone around the crack tip. This determines the influence of graphite microstructure on the toughness and fracture behaviour. Using Electronic Speckle Pattern Interferometry (ESPI) it is now possible to obtain an image of the crack tip damage zone as it forms and grows under load. Experiments are currently being performed combining ESPI with fracture toughness measurement to understand the relationship between graphite microstructure and resistance to crack propagation.
1 Post-graduate researcher.
21
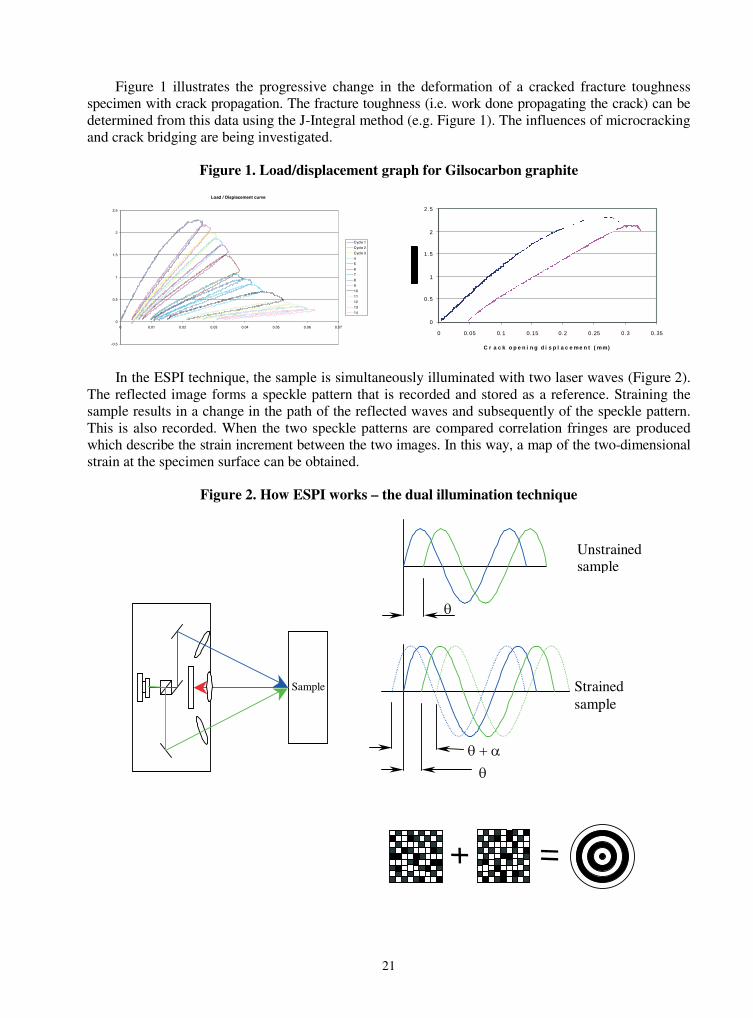
Figure 1 illustrates the progressive change in the deformation of a cracked fracture toughness specimen with crack propagation. The fracture toughness (i.e. work done propagating the crack) can be determined from this data using the J-Integral method (e.g. Figure 1). The influences of microcracking and crack bridging are being investigated.
Figure 1. Load/displacement graph for Gilsocarbon graphite
Load / Displacement curve
-0.5
0
0.5
1
1.5
2
2.5
0 0.01 0.02 0.03 0.04 0.05 0.06 0.07
Cycle 1
Cycle 2
Cycle 3
4
5
6
7
8
9
10
11
12
13
14
0
0.5
1
1.5
2
2.5
0 0.05 0.1 0.15 0.2 0.25 0.3 0.35
C r a c k o p e n i n g d i s p l ac e me n t ( mm)
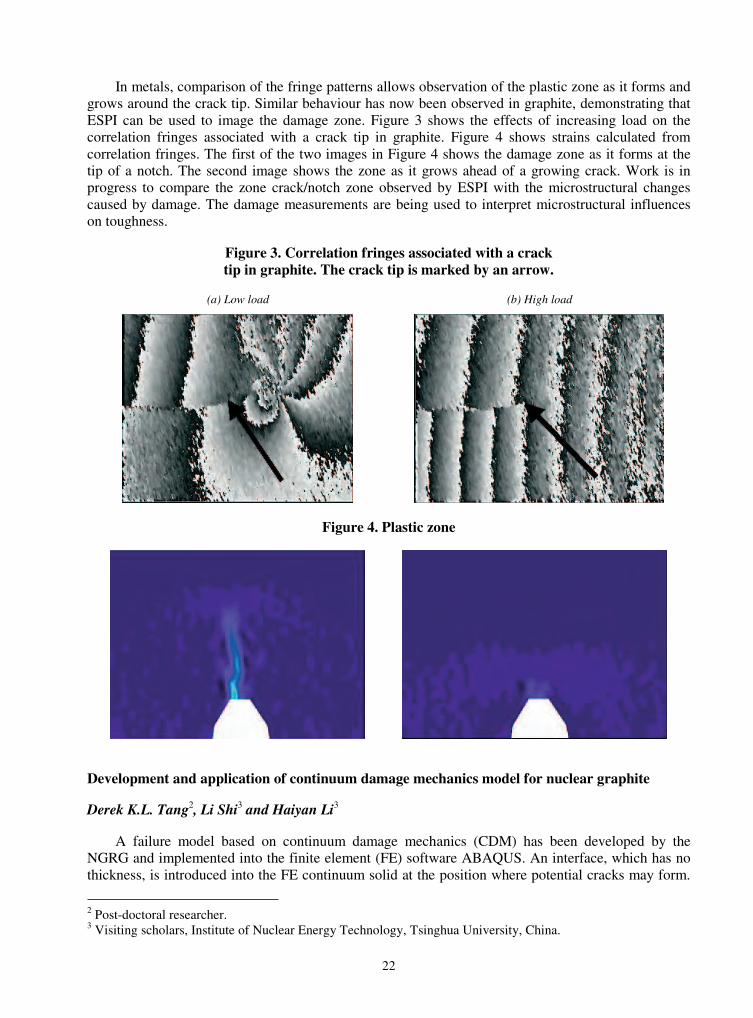
In the ESPI technique, the sample is simultaneously illuminated with two laser waves (Figure 2). The reflected image forms a speckle pattern that is recorded and stored as a reference. Straining the sample results in a change in the path of the reflected waves and subsequently of the speckle pattern. This is also recorded. When the two speckle patterns are compared correlation fringes are produced which describe the strain increment between the two images. In this way, a map of the two-dimensional strain at the specimen surface can be obtained.
Figure 2. How ESPI works – the dual illumination technique
Sample
��
���������
Unstrained sample
Strained sample
22
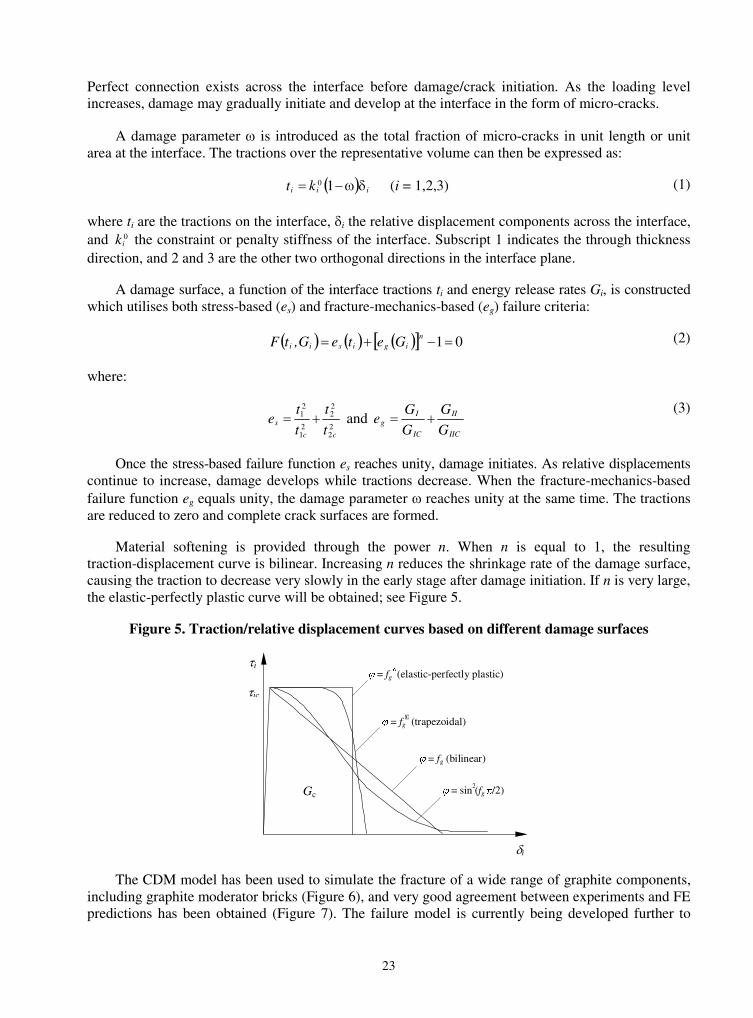
In metals, comparison of the fringe patterns allows observation of the plastic zone as it forms and grows around the crack tip. Similar behaviour has now been observed in graphite, demonstrating that ESPI can be used to image the damage zone. Figure 3 shows the effects of increasing load on the correlation fringes associated with a crack tip in graphite. Figure 4 shows strains calculated from correlation fringes. The first of the two images in Figure 4 shows the damage zone as it forms at the tip of a notch. The second image shows the zone as it grows ahead of a growing crack. Work is in progress to compare the zone crack/notch zone observed by ESPI with the microstructural changes caused by damage. The damage measurements are being used to interpret microstructural influences on toughness.
Figure 3. Correlation fringes associated with a crack tip in graphite. The crack tip is marked by an arrow.
(a) Low load (b) High load
Figure 4. Plastic zone
Development and application of continuum damage mechanics model for nuclear graphite
Derek K.L. Tang2, Li Shi3 and Haiyan Li3
A failure model based on continuum damage mechanics (CDM) has been developed by the NGRG and implemented into the finite element (FE) software ABAQUS. An interface, which has no thickness, is introduced into the FE continuum solid at the position where potential cracks may form.
2 Post-doctoral researcher. 3 Visiting scholars, Institute of Nuclear Energy Technology, Tsinghua University, China.
23
Perfect connection exists across the interface before damage/crack initiation. As the loading level increases, damage may gradually initiate and develop at the interface in the form of micro-cracks.
A damage parameter � is introduced as the total fraction of micro-cracks in unit length or unit area at the interface. The tractions over the representative volume can then be expressed as:
� � iii kt �� 10 (i = 1,2,3) (1)
where ti are the tractions on the interface, �i the relative displacement components across the interface, and 0
ik the constraint or penalty stiffness of the interface. Subscript 1 indicates the through thickness direction, and 2 and 3 are the other two orthogonal directions in the interface plane.
A damage surface, a function of the interface tractions ti and energy release rates Gi, is constructed which utilises both stress-based (es) and fracture-mechanics-based (eg) failure criteria:
� � � � � �� � 01� nigisii GeteG,tF (2)
where:
22
22
21
21
cc
st
t
t
te � and
IIC
II
IC
Ig
G
G
G
Ge �
(3)
Once the stress-based failure function es reaches unity, damage initiates. As relative displacements continue to increase, damage develops while tractions decrease. When the fracture-mechanics-based failure function eg equals unity, the damage parameter � reaches unity at the same time. The tractions are reduced to zero and complete crack surfaces are formed.
Material softening is provided through the power n. When n is equal to 1, the resulting traction-displacement curve is bilinear. Increasing n reduces the shrinkage rate of the damage surface, causing the traction to decrease very slowly in the early stage after damage initiation. If n is very large, the elastic-perfectly plastic curve will be obtained; see Figure 5.
Figure 5. Traction/relative displacement curves based on different damage surfaces
�i
�i
� = fg (bilinear)
� = fg10 (trapezoidal)
� = sin2(fg�/2) Gc
�ic
� = fg� (elastic-perfectly plastic)
The CDM model has been used to simulate the fracture of a wide range of graphite components, including graphite moderator bricks (Figure 6), and very good agreement between experiments and FE predictions has been obtained (Figure 7). The failure model is currently being developed further to

24
Figure 6. Simulation of fracture in a graphite component with keyways
Figure 7. Load/displacement curves for L-shape specimens
r=0
r=1r=2
r=4
0.30 0.20 0.10 0
200
400
600
0
Displacement (mm)
Loa
d P
(N
)
Experimental trace (r=2)
include the effects of irradiation and radiolytic oxidation. Some success has already been achieved in amalgamating a time-integrated analysis tool for irradiation-induced stresses with the CDM model. When completed, the resulting tool will help to reduce much of the arbitrariness and unnecessary conservatism in safety assessment methodologies.
25
Dynamic analysis of fracture in graphite components (stress waves)
Masatoshi Kuroda4
Internal stresses are generated in graphite components that are subjected to irradiation in a nuclear reactor through the process of dimensional and property changes. The build-up of these stresses may eventually lead to component failure. In addition, there is the possibility that the stress waves created by the initial fracture would produce further fractures in the component in their wake.
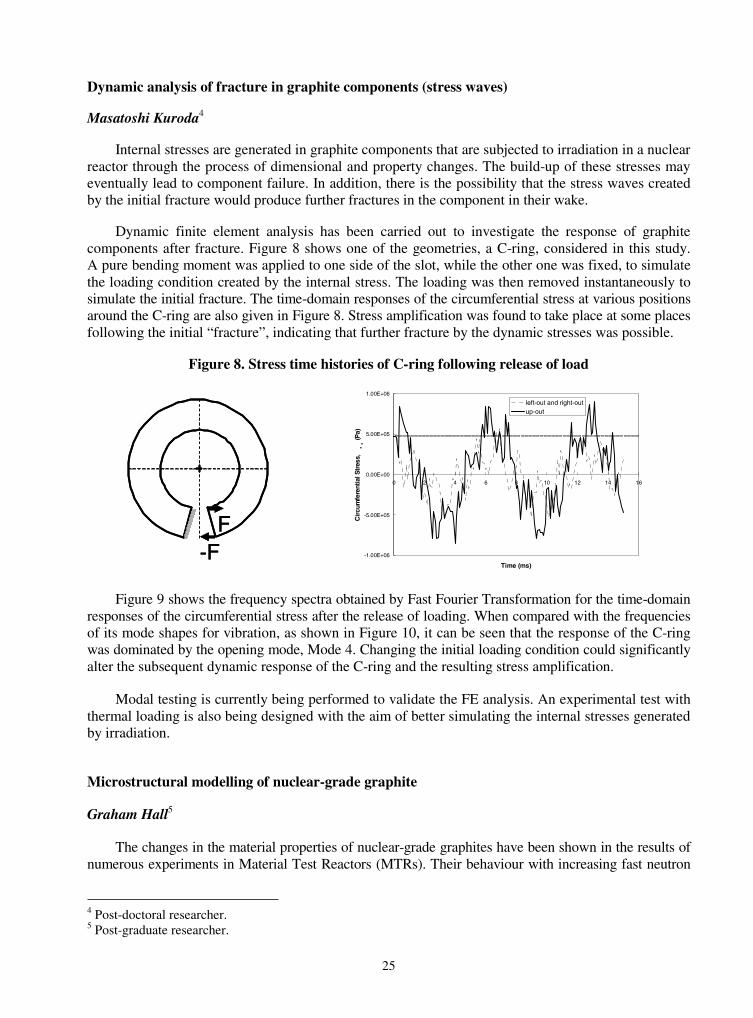
Dynamic finite element analysis has been carried out to investigate the response of graphite components after fracture. Figure 8 shows one of the geometries, a C-ring, considered in this study. A pure bending moment was applied to one side of the slot, while the other one was fixed, to simulate the loading condition created by the internal stress. The loading was then removed instantaneously to simulate the initial fracture. The time-domain responses of the circumferential stress at various positions around the C-ring are also given in Figure 8. Stress amplification was found to take place at some places following the initial “fracture”, indicating that further fracture by the dynamic stresses was possible.
Figure 8. Stress time histories of C-ring following release of load
-FF
-FF
-1.00E+06
-5.00E+05
0.00E+00
5.00E+05
1.00E+06
0 2 4 6 8 10 12 14 16
Time (ms)
Cir
cum
fere
ntia
l Str
ess,
(P
a)
left-out and right-outup-out
Figure 9 shows the frequency spectra obtained by Fast Fourier Transformation for the time-domain responses of the circumferential stress after the release of loading. When compared with the frequencies of its mode shapes for vibration, as shown in Figure 10, it can be seen that the response of the C-ring was dominated by the opening mode, Mode 4. Changing the initial loading condition could significantly alter the subsequent dynamic response of the C-ring and the resulting stress amplification.
Modal testing is currently being performed to validate the FE analysis. An experimental test with thermal loading is also being designed with the aim of better simulating the internal stresses generated by irradiation.
Microstructural modelling of nuclear-grade graphite
Graham Hall5
The changes in the material properties of nuclear-grade graphites have been shown in the results of numerous experiments in Material Test Reactors (MTRs). Their behaviour with increasing fast neutron
4 Post-doctoral researcher. 5 Post-graduate researcher.

26
Figure 9. Frequency spectra of dynamic response of C-ring
0.00E+00
1.00E+05
2.00E+05
3.00E+05
4.00E+05
5.00E+05
0 500 1000 1500 2000 2500 3000 3500 4000 4500 5000
Frequency (Hz)
Amp
litud
e
left-out and right-outup-outMode 4
Mode 6Mode 8
0.00E+00
1.00E+05
2.00E+05
3.00E+05
4.00E+05
5.00E+05
0 500 1000 1500 2000 2500 3000 3500 4000 4500 5000
Frequency (Hz)
Amp
litud
e
left-out and right-outup-out
0.00E+00
1.00E+05
2.00E+05
3.00E+05
4.00E+05
5.00E+05
0 500 1000 1500 2000 2500 3000 3500 4000 4500 5000
Frequency (Hz)
Amp
litud
e
left-out and right-outup-outMode 4
Mode 6Mode 8
Figure 10. Mode shapes of C-ring
Mode 1 Mode 2 Mode 3 Mode 4
Mode 5 Mode 6 Mode 7 Mode 8
dose is not always straightforward, especially with the added complication of radiolytic oxidation. Various authors have examined these changes and proposed various relationships and mechanisms, such as pore generation, to account for the observed changes. Unfortunately, these theoretical explanations often provide little insight into what is actually happening to the microstructure in order to cause such behaviour. Through the use of the finite element technique it has now been possible to deduce the probable microstructural mechanisms behind two material properties: dimensional changes and Young’s modulus.
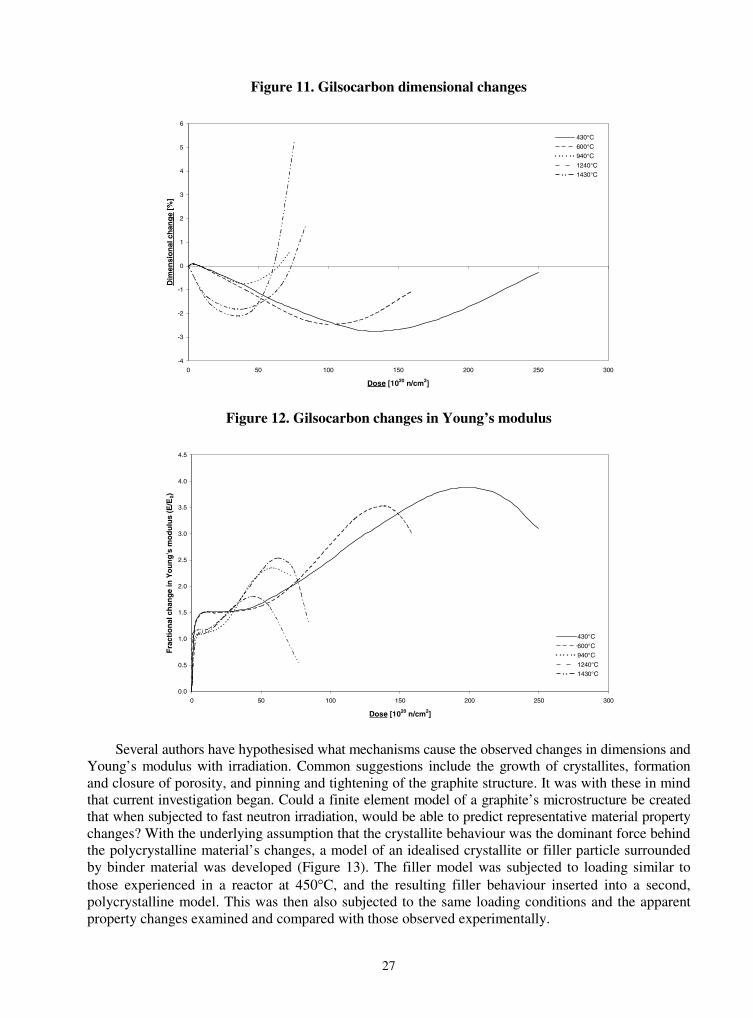
If the graphite Gilsocarbon is taken as an example, the complexity of the dimensional irradiation behaviour can be seen (Figure 11). At irradiation temperatures of ~400 C, the graphite initially contracts at a low rate or expands slightly, and then as the dose increases, shrinks at a higher rate. As the dose increases even further, the contraction rate reduces, until eventually it begins to expand, a phenomenon known as turnaround. If the irradiation temperature is increased, the rates and magnitudes of these changes will be affected in different ways depending on the irradiation temperature.
The changes in the Young’s modulus are just as perplexing (Figure 12). At ~400 C, the Young’s modulus increases sharply at low doses, and then remains approximately constant. As the dose increases there is a second increase at a slower rate, which eventually becomes a decrease. Again, increasing the irradiation temperature will affect the changes in different ways.
27
Figure 11. Gilsocarbon dimensional changes
-4
-3
-2
-1
0
1
2
3
4
5
6
0 50 100 150 200 250 300
Dose [1020 n/cm2]
Dim
ensi
on
al c
han
ge
[%]
430°C
600°C
940°C
1240°C
1430°C
Figure 12. Gilsocarbon changes in Young’s modulus
0.0
0.5
1.0
1.5
2.0
2.5
3.0
3.5
4.0
4.5
0 50 100 150 200 250 300
Dose [1020 n/cm2]
Fra
ctio
nal
ch
ang
e in
Yo
un
g’s
mo
du
lus
(E/E
0)
430°C
600°C
940°C
1240°C
1430°C
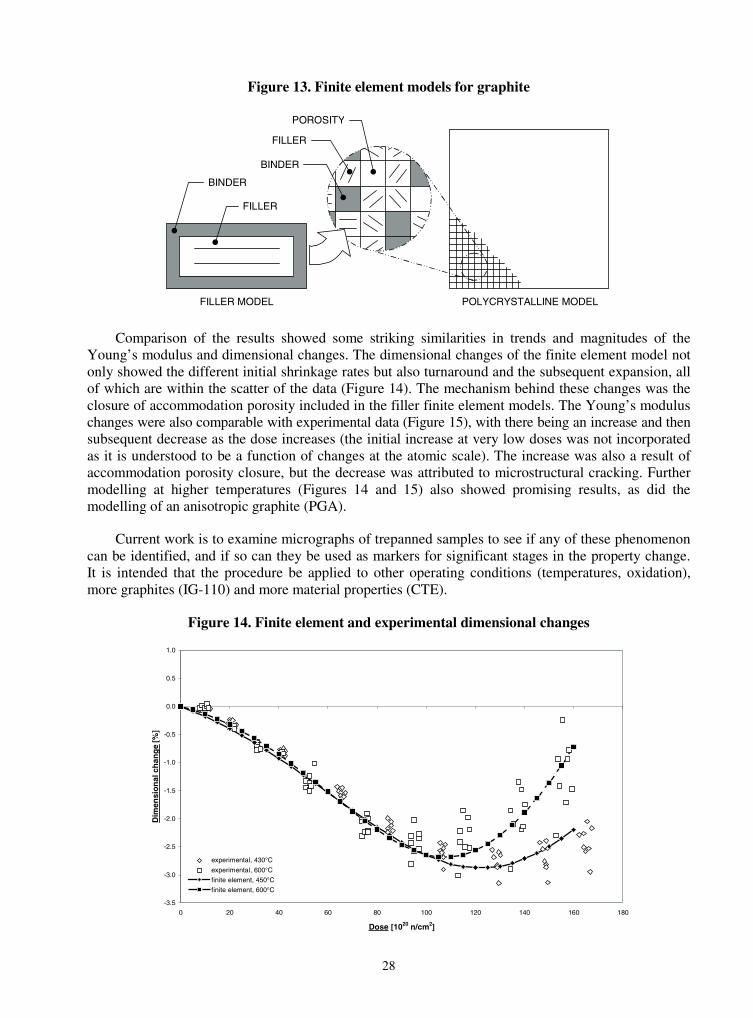
Several authors have hypothesised what mechanisms cause the observed changes in dimensions and Young’s modulus with irradiation. Common suggestions include the growth of crystallites, formation and closure of porosity, and pinning and tightening of the graphite structure. It was with these in mind that current investigation began. Could a finite element model of a graphite’s microstructure be created that when subjected to fast neutron irradiation, would be able to predict representative material property changes? With the underlying assumption that the crystallite behaviour was the dominant force behind the polycrystalline material’s changes, a model of an idealised crystallite or filler particle surrounded by binder material was developed (Figure 13). The filler model was subjected to loading similar to those experienced in a reactor at 450 C, and the resulting filler behaviour inserted into a second, polycrystalline model. This was then also subjected to the same loading conditions and the apparent property changes examined and compared with those observed experimentally.
28
Figure 13. Finite element models for graphite
FILLER MODEL POLYCRYSTALLINE MODEL
BINDER
FILLER
BINDER
FILLER
POROSITY
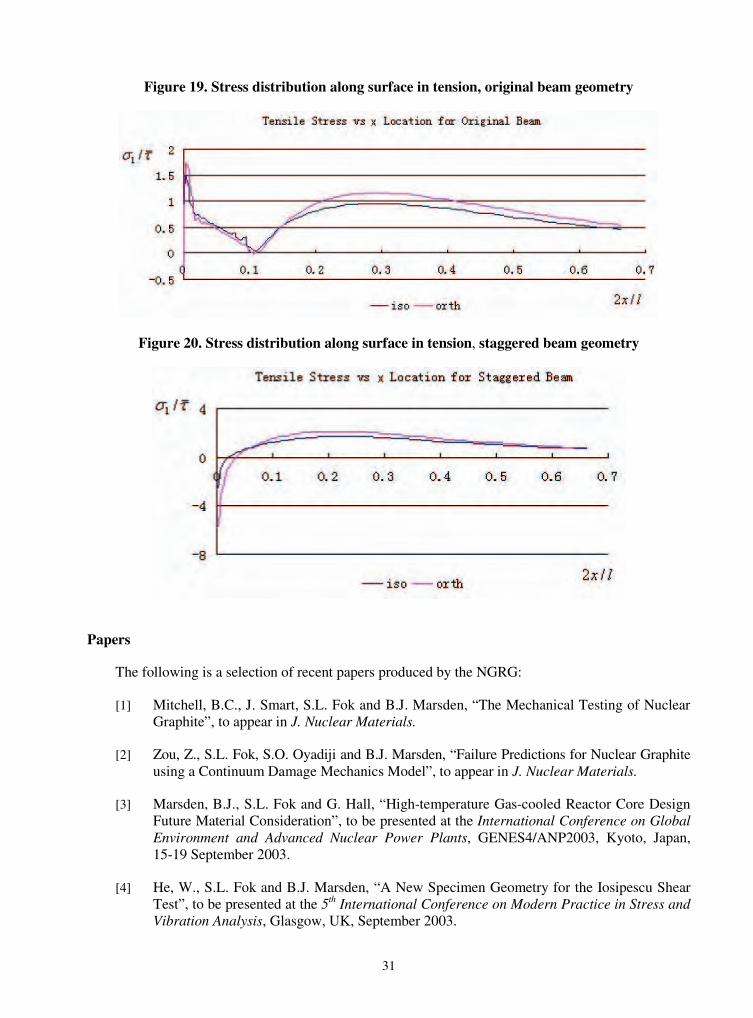
Comparison of the results showed some striking similarities in trends and magnitudes of the Young’s modulus and dimensional changes. The dimensional changes of the finite element model not only showed the different initial shrinkage rates but also turnaround and the subsequent expansion, all of which are within the scatter of the data (Figure 14). The mechanism behind these changes was the closure of accommodation porosity included in the filler finite element models. The Young’s modulus changes were also comparable with experimental data (Figure 15), with there being an increase and then subsequent decrease as the dose increases (the initial increase at very low doses was not incorporated as it is understood to be a function of changes at the atomic scale). The increase was also a result of accommodation porosity closure, but the decrease was attributed to microstructural cracking. Further modelling at higher temperatures (Figures 14 and 15) also showed promising results, as did the modelling of an anisotropic graphite (PGA).
Current work is to examine micrographs of trepanned samples to see if any of these phenomenon can be identified, and if so can they be used as markers for significant stages in the property change. It is intended that the procedure be applied to other operating conditions (temperatures, oxidation), more graphites (IG-110) and more material properties (CTE).
Figure 14. Finite element and experimental dimensional changes
-3.5
-3.0
-2.5
-2.0
-1.5
-1.0
-0.5
0.0
0.5
1.0
0 20 40 60 80 100 120 140 160 180
Dose [1020 n/cm2]
Dim
ensi
on
al c
han
ge
[%]
experimental, 430°C
experimental, 600°C
finite element, 450°C
finite element, 600°C

29
Figure 15. Finite element and experimental Young’s modulus changes
0.0
0.5
1.0
1.5
2.0
2.5
3.0
0 20 40 60 80 100 120 140 160 180
Dose [1020 n/cm2]
Fra
ctio
nal
ch
ang
e in
Yo
un
g’s
mo
du
lus
(E/E
0)
experimental, 430°C
experimental, 600°C
finite element, 450°C
finite element, 600°C
Shear testing
Weijing He6
The graphite moderator bricks in many reactor cores are connected via a key-keyway system, with the graphite keys being subjected to shear loading during core displacement. An accurate measurement of the shear strength of graphite is therefore important in assessing the structural integrity of such a graphite core.
Since its introduction in the 1960s, the Iosipescu shear test, or its variation the notched beam in anti-symmetric four-point bending, has become a popular method for measuring the shear strength of engineering materials. The test configuration, as shown in Figure 16, consists of a beam with a V-notch centrally located on each longitudinal edge of the specimen. A pure shear stress state is induced within the notched section by the application of two counteracting force couples.
Figure 16. V-notched beam in anti-symmetric four-point bending
6 Post-graduate researcher.

30
However, recent research has shown that the Iosipescu shear test specimen has several faults. First of all, the pure shear stress state between the notches is far from uniform. Thus, correction factors need to be applied to the measured data. Further, a stress singularity exists at the sharp notch tip if the notch angle is not generous enough. In addition, a tensile stress concentration, independent of the stress singularity, exists along the notch flank on the side opposite to the inner loading point, and at a short distance away from the notch tip. These stress concentrations at the notches either give rise to notch root axial splits (Figure 17) prior to ultimate failure in the case of laminated composites, or catastrophic tensile fracture in the case of brittle materials such as graphite.
Figure 17. Photo image showing axial split at notch flank
It has been reported by other researchers that axial splitting tends to promote a more uniform shear stress distribution in the gauge-section and around the notches. Thus, it seems a good idea to remove the material separated by the axial splits from the remaining beam before the test is performed. This will eliminate the associated complications in analysing the measured data. The new specimen has a “staggered” anti-symmetric configuration as shown in Figure 18.
Figure 18. Anti-symmetric four-point bending with staggered beam
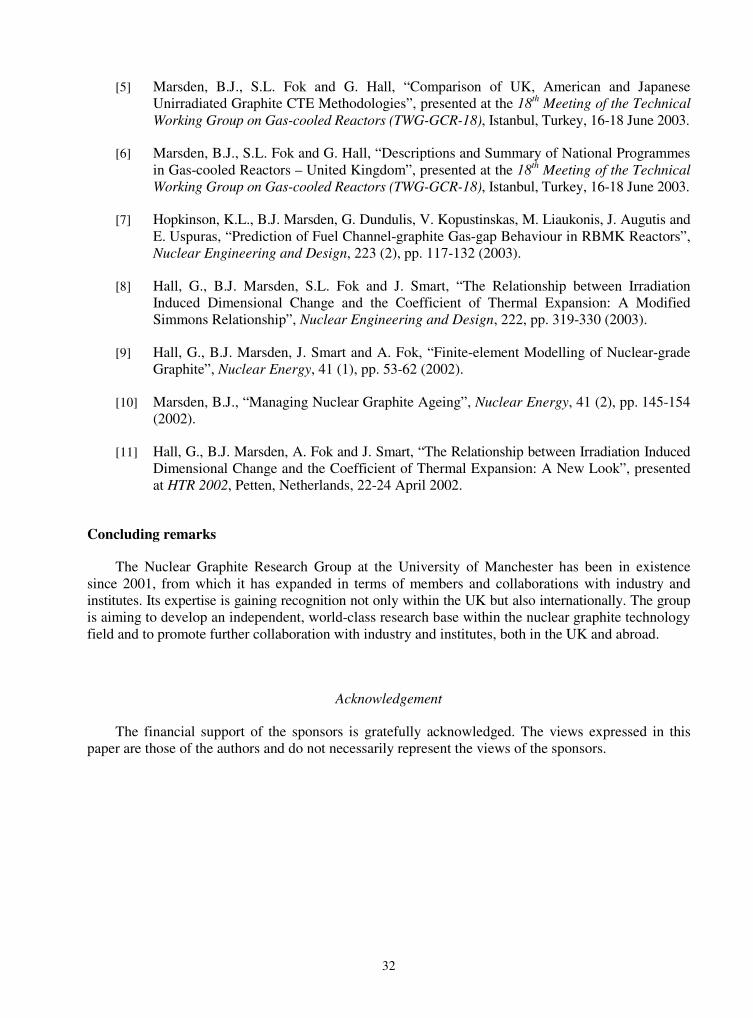
Figure 19 shows the maximum principal stress along the top surface in tension for the original double V-notch beam specimen. The high stress concentration at the notch can clearly be seen. In contrast, the newly proposed staggered geometry has completely eliminated this stress concentration (Figure 20) and may therefore have the advantage of not producing axial splits in the case of laminated composites, or premature failure through tension in the case of brittle materials such as graphite.
31
Figure 19. Stress distribution along surface in tension, original beam geometry
Figure 20. Stress distribution along surface in tension, staggered beam geometry
Papers
The following is a selection of recent papers produced by the NGRG:
[1] Mitchell, B.C., J. Smart, S.L. Fok and B.J. Marsden, “The Mechanical Testing of Nuclear Graphite”, to appear in J. Nuclear Materials.
[2] Zou, Z., S.L. Fok, S.O. Oyadiji and B.J. Marsden, “Failure Predictions for Nuclear Graphite using a Continuum Damage Mechanics Model”, to appear in J. Nuclear Materials.
[3] Marsden, B.J., S.L. Fok and G. Hall, “High-temperature Gas-cooled Reactor Core Design Future Material Consideration”, to be presented at the International Conference on Global Environment and Advanced Nuclear Power Plants, GENES4/ANP2003, Kyoto, Japan, 15-19 September 2003.
[4] He, W., S.L. Fok and B.J. Marsden, “A New Specimen Geometry for the Iosipescu Shear Test”, to be presented at the 5th International Conference on Modern Practice in Stress and Vibration Analysis, Glasgow, UK, September 2003.
32
[5] Marsden, B.J., S.L. Fok and G. Hall, “Comparison of UK, American and Japanese Unirradiated Graphite CTE Methodologies”, presented at the 18th Meeting of the Technical Working Group on Gas-cooled Reactors (TWG-GCR-18), Istanbul, Turkey, 16-18 June 2003.
[6] Marsden, B.J., S.L. Fok and G. Hall, “Descriptions and Summary of National Programmes in Gas-cooled Reactors – United Kingdom”, presented at the 18th Meeting of the Technical Working Group on Gas-cooled Reactors (TWG-GCR-18), Istanbul, Turkey, 16-18 June 2003.
[7] Hopkinson, K.L., B.J. Marsden, G. Dundulis, V. Kopustinskas, M. Liaukonis, J. Augutis and E. Uspuras, “Prediction of Fuel Channel-graphite Gas-gap Behaviour in RBMK Reactors”, Nuclear Engineering and Design, 223 (2), pp. 117-132 (2003).
[8] Hall, G., B.J. Marsden, S.L. Fok and J. Smart, “The Relationship between Irradiation Induced Dimensional Change and the Coefficient of Thermal Expansion: A Modified Simmons Relationship”, Nuclear Engineering and Design, 222, pp. 319-330 (2003).
[9] Hall, G., B.J. Marsden, J. Smart and A. Fok, “Finite-element Modelling of Nuclear-grade Graphite”, Nuclear Energy, 41 (1), pp. 53-62 (2002).
[10] Marsden, B.J., “Managing Nuclear Graphite Ageing”, Nuclear Energy, 41 (2), pp. 145-154 (2002).
[11] Hall, G., B.J. Marsden, A. Fok and J. Smart, “The Relationship between Irradiation Induced Dimensional Change and the Coefficient of Thermal Expansion: A New Look”, presented at HTR 2002, Petten, Netherlands, 22-24 April 2002.
Concluding remarks
The Nuclear Graphite Research Group at the University of Manchester has been in existence since 2001, from which it has expanded in terms of members and collaborations with industry and institutes. Its expertise is gaining recognition not only within the UK but also internationally. The group is aiming to develop an independent, world-class research base within the nuclear graphite technology field and to promote further collaboration with industry and institutes, both in the UK and abroad.
Acknowledgement
The financial support of the sponsors is gratefully acknowledged. The views expressed in this paper are those of the authors and do not necessarily represent the views of the sponsors.
33
CODES AND STANDARDS DEVELOPMENT FOR GRAPHITE-MODERATED NUCLEAR REACTORS1
T. Burchell, M. Srinivasan* and D. NausOak Ridge National Laboratory
PO Box 2008, Oak Ridge, TN 37831-6088, USA *US Nuclear Regulatory Commission Washington, DC 20555-0001, USA
Abstract
Nuclear codes and standards are being developed in the USA in support of the design and development of graphite-moderated high-temperature gas-cooled reactors such as the Very High-temperature Reactor (VHTR) and the Pebble Bed Modular Reactor (PBMR). Under the auspices of the American Society for Testing and Materials (ASTM), Subcommittee DO2-F on Manufactured Carbons and Graphites, a materials specification is being developed for nuclear-grade graphites. The specification includes the acceptable processing methods and the non-irradiated properties for a near-isotropic or isotropic nuclear-grade graphite. In a parallel effort, ASTM standard C-781 (Standard Practice for Testing Graphite and Boronated Graphite Components for High-temperature Gas-cooled Nuclear Reactors) is being revised and updated to include, among other items, key properties such as fracture toughness. Current challenges in writing material specification includes the need for appropriate measurement methods for determining fracture toughness, Weibull modulus, acceptable minimum flaw sizes and the NDE technique that will provide such information, and the lack of knowledge and model to predict irradiated properties under high fluences and temperatures expected in gas-cooled reactors. Therefore, new ASTM standards for properties measurements are being developed for nuclear graphites, including a recommended methodology for determining the Weibull modulus of nuclear-grade graphite.
Design codes link the materials specification and the material properties to the limiting stresses and temperatures during service for a designed lifetime, which is established via a failure criterion, and specify the applicable design rules. Safety margins are established in these design rules that incorporate the uncertainties in the materials properties data and in service conditions and the sensitivities of these data to variations in operational parameters and measurement conditions. In the US, the American Society for Mechanical Engineers (ASME) Boiler and Pressure Vessel Code, Section III, Division II, Subsection CE on “Design Requirements for Graphite Core Support” was developed in the 1990s. This code used a deterministic approach and placed limits on the maximum stresses that a component may endure in service based on the specified minimum graphite strength. However, other failure criterion should be assessed and alternate design practices considered, e.g. probabilistic approaches.
1 The contents of this presentation are based on the authors’ knowledge and their work for the NRC Office of Nuclear Regulatory Research. This presentation is an independent product of the authors and does not necessarily reflect the views or regulatory position of the NRC.

34
Alternate failure criteria for nuclear graphite include neutron irradiation lifetimes, e.g. return to original volume or strength, residual strength limit, probabilistic variations in service parameters and probabilistic fracture mechanics considerations for arriving at flaw/crack size limits, which are coupled with in-service inspections.
This presentation will address the challenges involved in materials specification writing that involves acceptable processing methods, establishing minimum acceptable properties and properties ranges, establishing design codes that consider appropriately the inherent variability in properties of graphite, graphite failure criteria, and the inspection requirements for nuclear graphite before use and during service. The presentation will also include the status of activities related to the codes and standards development in the US and report on recent activities and directions in the ASTM and ASME standards and codes.
35
Introduction
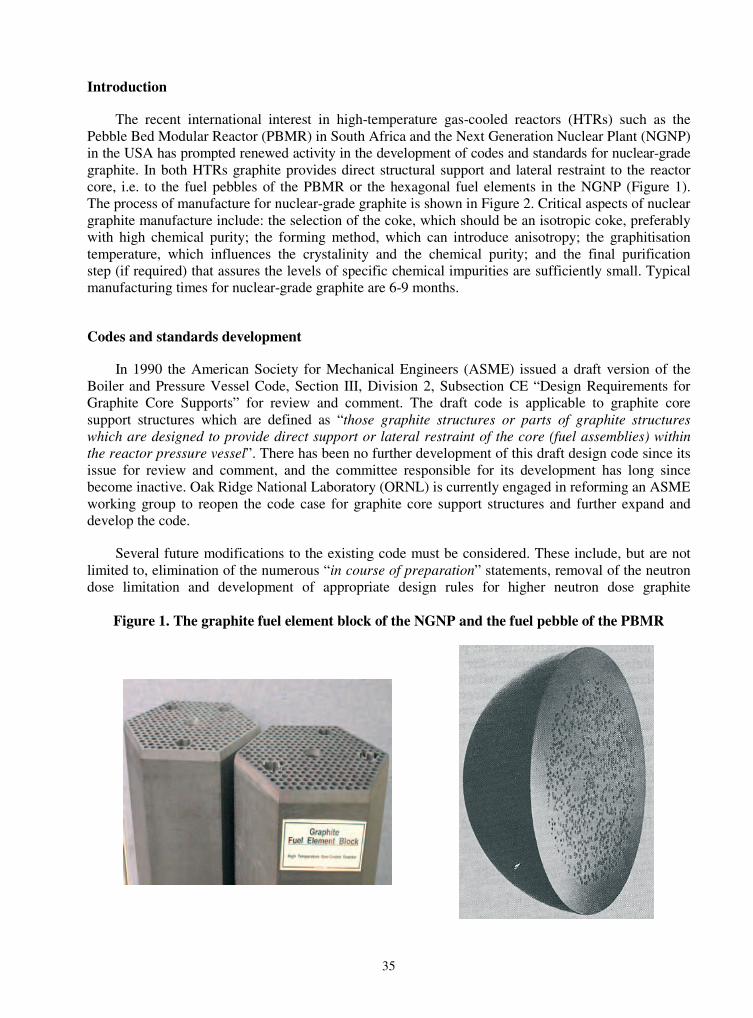
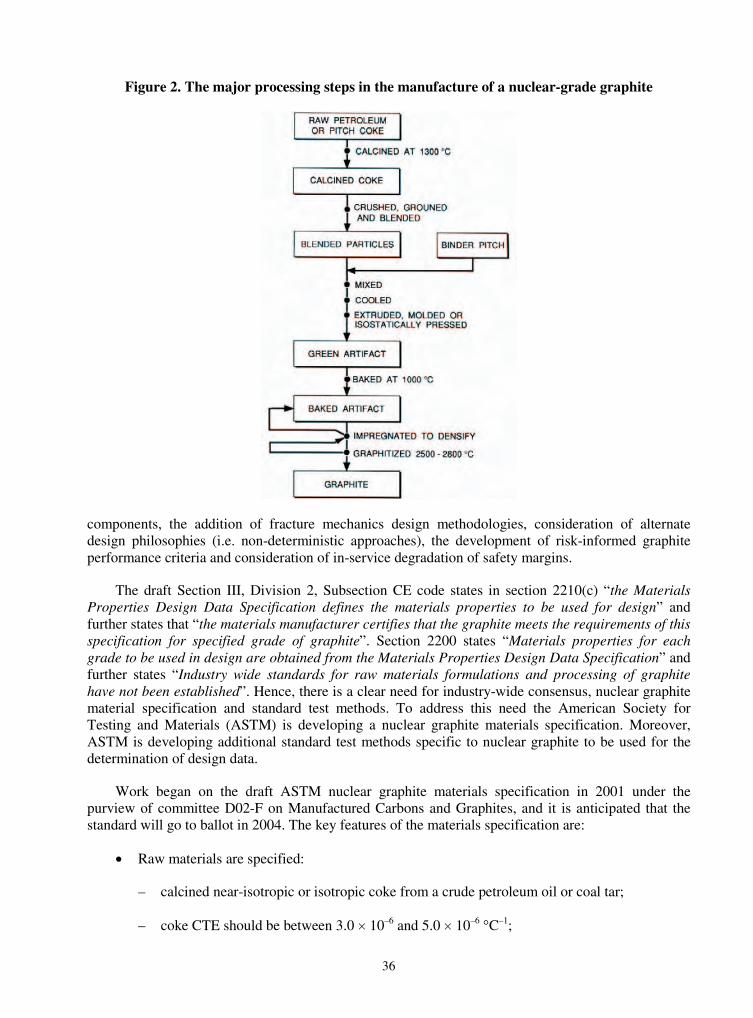
The recent international interest in high-temperature gas-cooled reactors (HTRs) such as the Pebble Bed Modular Reactor (PBMR) in South Africa and the Next Generation Nuclear Plant (NGNP) in the USA has prompted renewed activity in the development of codes and standards for nuclear-grade graphite. In both HTRs graphite provides direct structural support and lateral restraint to the reactor core, i.e. to the fuel pebbles of the PBMR or the hexagonal fuel elements in the NGNP (Figure 1). The process of manufacture for nuclear-grade graphite is shown in Figure 2. Critical aspects of nuclear graphite manufacture include: the selection of the coke, which should be an isotropic coke, preferably with high chemical purity; the forming method, which can introduce anisotropy; the graphitisation temperature, which influences the crystalinity and the chemical purity; and the final purification step (if required) that assures the levels of specific chemical impurities are sufficiently small. Typical manufacturing times for nuclear-grade graphite are 6-9 months.
Codes and standards development
In 1990 the American Society for Mechanical Engineers (ASME) issued a draft version of the Boiler and Pressure Vessel Code, Section III, Division 2, Subsection CE “Design Requirements for Graphite Core Supports” for review and comment. The draft code is applicable to graphite core support structures which are defined as “those graphite structures or parts of graphite structures which are designed to provide direct support or lateral restraint of the core (fuel assemblies) within the reactor pressure vessel”. There has been no further development of this draft design code since its issue for review and comment, and the committee responsible for its development has long since become inactive. Oak Ridge National Laboratory (ORNL) is currently engaged in reforming an ASME working group to reopen the code case for graphite core support structures and further expand and develop the code.
Several future modifications to the existing code must be considered. These include, but are not limited to, elimination of the numerous “in course of preparation” statements, removal of the neutron dose limitation and development of appropriate design rules for higher neutron dose graphite
Figure 1. The graphite fuel element block of the NGNP and the fuel pebble of the PBMR
36
Figure 2. The major processing steps in the manufacture of a nuclear-grade graphite
components, the addition of fracture mechanics design methodologies, consideration of alternate design philosophies (i.e. non-deterministic approaches), the development of risk-informed graphite performance criteria and consideration of in-service degradation of safety margins.
The draft Section III, Division 2, Subsection CE code states in section 2210(c) “the Materials Properties Design Data Specification defines the materials properties to be used for design” and further states that “the materials manufacturer certifies that the graphite meets the requirements of this specification for specified grade of graphite”. Section 2200 states “Materials properties for each grade to be used in design are obtained from the Materials Properties Design Data Specification” and further states “Industry wide standards for raw materials formulations and processing of graphite have not been established”. Hence, there is a clear need for industry-wide consensus, nuclear graphite material specification and standard test methods. To address this need the American Society for Testing and Materials (ASTM) is developing a nuclear graphite materials specification. Moreover, ASTM is developing additional standard test methods specific to nuclear graphite to be used for the determination of design data.
Work began on the draft ASTM nuclear graphite materials specification in 2001 under the purview of committee D02-F on Manufactured Carbons and Graphites, and it is anticipated that the standard will go to ballot in 2004. The key features of the materials specification are:
� Raw materials are specified:
– calcined near-isotropic or isotropic coke from a crude petroleum oil or coal tar;
– coke CTE should be between 3.0 � 10–6 and 5.0 � 10–6 �C–1;

37
– maximum coke size of 1.68 mm;
– up to 25% recycle graphite may be utilised;
– up to 20% recycle green mix/carbon in the mix formulation;
– coal tar pitch binder and petroleum pitch impregnant.
� Manufacturing process is specified:
– forming via extrusion, moulding, or isomoulding;
– graphitisation temperature of at least 2 700�C.
� Graphite properties are specified.
� Sampling of the graphite logs required, statistical sampling plan and cutting plan to be agreed with the purchaser.
� Testing method specified (e.g. ASTM C-781).
� Quality assurance requirements of ASME NQA-1 apply.
� Product traceability required for all raw materials and throughout all production steps.
� 100% dimensional inspection of finished logs.
� 100% non-destructive evaluation required on all graphite logs – acceptance limits set by purchaser.
� Neutron irradiation performance IS NOT specified.
Tables 1-3 report the mechanical, physical and chemical properties required by the draft specification. Further discussion and modification of these requirements and properties is anticipated prior to the acceptance of the nuclear graphite materials specification.
Table 1. Proposed mechanical properties for nuclear grade graphite
Property ASTM test method Specification Tensile strength C781 (C749) 12 MPa min Flexural strength C781 (C651) 20 MPa min Compressive strength C781 (C965) 60 MPa min Dynamic elastic modulus C781 (C747) 9.5 GPa min Stress-strain response & modulus of elasticity C781 (C749) 9.5 GPa min Weibull modulus C781 8 min Fracture toughness C781 0.9 MPa.�m min
38
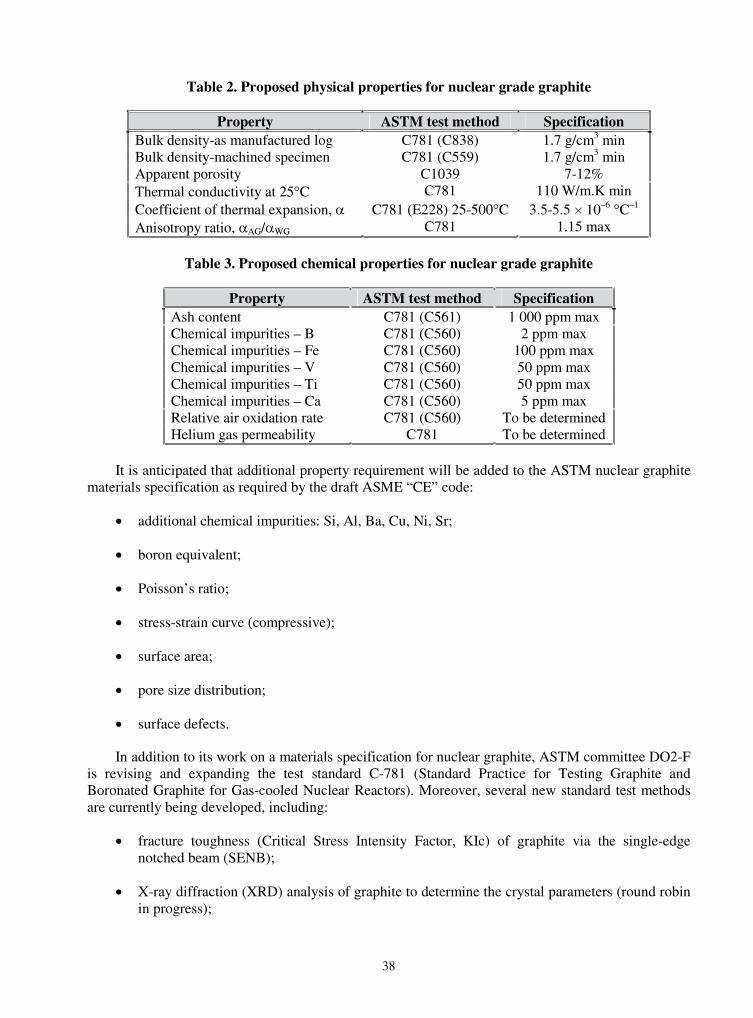
Table 2. Proposed physical properties for nuclear grade graphite
Property ASTM test method Specification Bulk density-as manufactured log C781 (C838) 1.7 g/cm3 min Bulk density-machined specimen C781 (C559) 1.7 g/cm3 min Apparent porosity C1039 7-12% Thermal conductivity at 25�C C781 110 W/m.K min Coefficient of thermal expansion, �� C781 (E228) 25-500�C 3.5-5.5 � 10–6 �C–1
Anisotropy ratio, �AG/�WG C781 1.15 max
Table 3. Proposed chemical properties for nuclear grade graphite
Property ASTM test method Specification Ash content C781 (C561) 1 000 ppm max Chemical impurities – B C781 (C560) 2 ppm max Chemical impurities – Fe C781 (C560) 100 ppm max Chemical impurities – V C781 (C560) 50 ppm max Chemical impurities – Ti C781 (C560) 50 ppm max Chemical impurities – Ca C781 (C560) 5 ppm max Relative air oxidation rate C781 (C560) To be determined Helium gas permeability C781 To be determined
It is anticipated that additional property requirement will be added to the ASTM nuclear graphite materials specification as required by the draft ASME “CE” code:
� additional chemical impurities: Si, Al, Ba, Cu, Ni, Sr;
� boron equivalent;
� Poisson’s ratio;
� stress-strain curve (compressive);
� surface area;
� pore size distribution;
� surface defects.
In addition to its work on a materials specification for nuclear graphite, ASTM committee DO2-F is revising and expanding the test standard C-781 (Standard Practice for Testing Graphite and Boronated Graphite for Gas-cooled Nuclear Reactors). Moreover, several new standard test methods are currently being developed, including:
� fracture toughness (Critical Stress Intensity Factor, KIc) of graphite via the single-edge notched beam (SENB);
� X-ray diffraction (XRD) analysis of graphite to determine the crystal parameters (round robin in progress);
39
� graphite air oxidation rate method;
� graphite surface area via BET method (round robin in progress);
� development of a new standard method for boron equivalent of nuclear graphite (planned).
Work on the above standards will be ongoing for several years. Participation in the standards development process is welcomed and further information can be obtained for the ASTM web site at www.astm.org.
Conclusions
Codes and standards development is required in support of HTR design and licensing activities. The proposed (1990) Section III, Division 2, Subsection CE “Design Requirements for Graphite Core Supports” of the ASME Boiler and Pressure Vessel code requires substantial revision and expansion. ORNL is leading an effort to reconstitute an ASME working group to begin code review activities. The current draft version of the “CE” code calls for a materials properties design data specification. ASTM committee DO2-F is developing a materials specification for nuclear-grade graphite to meet this need. Moreover, ASTM committee DO2-F is developing additional standard test methods applicable to nuclear graphites.
Acknowledgements
This work was sponsored by US Nuclear Regulatory Commission, Office of Nuclear Regulatory Research, under DOE Interagency Agreement 1886-N668-9YNRC JCN Y6689. The work was conducted at Oak Ridge National Laboratory under contract DE-AC05-00OR22725 with UT-Battelle, LLC.

41
CEA R&D PROGRAMME ON STRUCTURAL MATERIALS FOR FUTURE GAS-COOLED NUCLEAR SYSTEMS
P. Billot1, J.L. Seran1, M.T. Cabrillat2, H. Burlet3, A. Terlain1, J.P. Bonal1
1CEA/DEN/Saclay, F-91191 Gif-sur-Yvette, France 2CEA/DEN/Cadarache, F-13108 Saint-Paul-lez-Durance, Cedex, France
3CEA/DRT/Grenoble, F-38054 Grenoble, Cedex, France
Abstract
CEA has launched feasibility studies of future nuclear advanced systems in a consistent series of gas-cooled reactors ranging from thermal systems (PMR, VHTR) for the mid-term to fast reactor (GFR) for the longer term. Since structural materials of these systems must operate at least up to 1 000�C in normal conditions several key technologies must be mastered such as high temperature structural materials under new environments and constraints.
The material technologies that have to be investigated are on the one hand, the technology of very high-temperature materials (up to 1 650�C in accidental conditions) for core applications (graphites for thermal reactors and ceramic materials for GFR) and on the other hand, the technology of medium (~450-650�C) and high-temperature (~650-950�C) metallic materials for vessel structures, internals, primary circuit and turbine components. The first chapter of R&D to take up is related to out-of-core metallic structural materials. This set of tasks is important because it is a common R&D need for a large range of He-cooled thermal or fast neutron modular systems operating at high temperature.
Ni-base alloys and superalloys have been chosen to cover the highest working temperatures of the un-irradiated components (hot gas systems and turbine components). This paper will give an overview of the selected material variants to be studied and the corresponding R&D programme (mechanical and corrosion properties characterisation) planned over the next six years.
As concerns the reactor pressure vessel structures, the first candidate belongs to the class of 9-12Cr martensitic steels. The main R&D items addressed in this paper include basic metallurgical studies on optimisation of chemical composition and thermal treatments regarding possible evolutions of the material specification. The programme of out-of-pile characterisations of creep, fatigue, Charpy and fracture toughness properties as well as the mechanical analysis and codification studies applied to gas-cooled RPV are described.
Finally, this paper gives elements of CEA R&D on ceramic materials for in-core applications, where the main effort will be directed toward the most promising ceramics to be chosen among micro- and nano-structured carbide (nitrides) materials (SiC, ZrC, TiC,…) or cermet composite materials.
42
Introduction
Over the past two years, CEA has launched feasibility studies of future nuclear advanced systems in a consistent series of gas-cooled reactors ranging from thermal reactors to fast reactors. The selection of this research objective originates both from the significance of fast neutrons and high temperatures for nuclear energy to meet the needs anticipated beyond 2020/2030, and from the significant common R&D pathway that supports both medium term industrial projects and more advanced versions of gas-cooled reactors such as a very high-temperature reactor (VHTR) for massive production of hydrogen, and a gas fast reactor (GFR) with a closed fuel cycle for sustainable nuclear power.
For the structural materials of GFR, the main challenge is that the in-vessel components will have to withstand fast neutron damages and/or high temperatures, up to 1 600�C for in-core components under accident conditions. The review of the main candidates considered as the reference option for structural materials of GFR have been already described [1].
This paper will focus on the main axes of R&D on materials to resolve the viability issues of the VHTR by 2010.
Since structural materials of this system must operate up to around 1 000�C under operating conditions, several key technologies must be mastered; particularly, structural materials must be made to adapt to new environments and constraints.
The material technologies that have to be investigated are, respectively, those of medium temperature (~450-650�C) for vessel structures and cold internals, high temperature (~650-950�C) for primary circuit, recuperator, intermediate heat exchanger, turbine component and very high temperature (~1 000-1 650�C) for core and hot gas facing components.
In the first class of materials, the reference materials are 9-12Cr martensitic steels and austenitic steels of the 300 series. The second class is classically represented by Ni-based alloys and superalloys, though more advanced materials such as oxide dispersion strengthened (ODS) metallic variants or carbide ceramic (SiC type) are also envisaged. The last class consists mainly of graphites and C/C composites.
This paper provides an overview of the selected materials variants to be studied and the corresponding R&D programme (mechanical and corrosion properties characterisation) anticipated for the next six years.
Overview of the main critical components of the VHTR: Prime candidate materials and R&D programme
Reactor pressure vessel
The operating conditions planned for this key component are the following:
� Coolant gas (He) pressure and vessel temperature. Respectively, 70 bar and 550�C under nominal operating conditions and about 650�C during 50 h under accident conditions. These last operating temperatures prevent the designers from using conventional vessel materials already experimented with in water reactors. At the least, high Cr martensitic steels are required; it can be assumed that creep resistance will be the key qualification for the choice of the vessel material.
43
� Design life duration and maximum irradiation dose. Respectively, 60 years (longer than the higher durations known presently for a nuclear component) and 2.5 � 10–3 dpa (about 4 � 1018 n/cm2 for neutrons with energy E > 0.1 MeV), which is lower than the projected end-of-life doses of water reactors pressure vessels. Consequently, we can expect that such a low level of irradiation can induce only a negligible effect on the mechanical properties, particularly in the case of materials belonging to the class of high Cr martensitic steels. However, this will have to be verified.
The projected main dimensions of the RPV are presently about 26 m in height, 8 m in diameter and 180 mm in minimum thickness. This high value of thickness is designed to lower the gas pressure stress.
Regarding these characteristics and taking into account the CEA’s experience [2] and broad accumulated knowledge [3], the prime candidate alloy selected for VHTR applications is a 9-12Cr type of martensitic steel.
The studies carried out on this material are currently oriented to collect:
� Preliminary metallurgical data required to demonstrate that the modified 9Cr-1Mo can be considered as the prime reference material of a full dimension vessel, and is feasible at the industrial level (manufacturing and welding). Subsequently, a more advanced creep-resistant variant will be defined to reach higher operating temperatures.
� Mechanical test results to validate the choice of the material characterising the creep, fatigue and fracture properties as well as the life duration of base metal and welds, the final objective being to propose the main rules of mechanical analysis and standards for the design structure.
Internals, recuperator, IHX and turbine
The cross vessel that connects the reactor vessel to the energy production unit operating in the range 500-600�C has to be distinguished from the hot internals (hot gas duct,…) that operate in the range 850-1 000�C. The maximum irradiation dose collected on these structures is very low, but not entirely negligible (about 0.03 dpa).
The maximum operating conditions of the other critical (but not irradiated) components are about 600�C/7 MPa for the recuperator, 850�C/150 MPa/60 000 h for the turbine and about 1 050°C for IHX.
Regarding materials to be used for all these applications, CEA has launched feasibility studies on a commercial high-strength Ni-based alloy, the Haynes 230 alloy, or coatings on a more conventional alloy (alloy 800H), as alternative solutions in the 900-1 000�C temperature range.
The status of work relative to the Haynes 230 alloy is as follows: mechanical properties up to 1 200�C, welding capability, gas chemical compatibility and preliminary qualification under representative conditions in helium test benches and experimental loops. Comparisons with other reference materials such as A 800 or Hastelloy X and XR are also planned.
In addition, the feasibility of coatings is studied via the development of different thermal barriers (Y-stabilised zirconia, alumina, …), different alumina former bondcoats (NiCrAlY, NiAl, NiAl-Pt), different layering processes (EBPVD, CVD, plasma deposition +) and different layer microstructures, especially nano-structured coating.
44
As regards the discs of gas turbine, the main effort is focused on the development of different grades of Udimet 720 alloy (forged, HIP and HIP + forged) being able to operate at lower temperatures than 750°C (cooled disc option). As for the blades, chromia and alumina formers Ni-based superalloys have been selected as candidates for gas temperature operating conditions of ~850°C (Directionally Solidified Alloy 792 and CM247LC) or for gas temperature beyond 900°C (single crystal alloys PWA 1483 and CMSX-4).
Core structural components
Graphite is the main structural material for the VHTR core structures. The maximal operating conditions are 1 250-1 600�C, 3 dpa, three years for the fuel elements and 1 200�C, 0.003dpa, 60 years for the permanent reflectors and core support blocks. The available nuclear graphite variants currently studied are different grades of UCAR, SGL and Toyo Tanso origin.
The out-of-pile work consists of as-received characterisations (physical, thermal, mechanical properties up to 1 600�C) and corrosion studies in order to anticipate consequences of air/water ingress on the mechanical integrity of graphite core components.
The irradiation programme includes:
� the monitoring of the dedicated HFR irradiation at 700-750�C planned to start at the end of 2003 with post-irradiation examinations at different increasing doses between 2006 and 2012;
� the implementation of a CEA irradiation experiment at high temperature (1 000�C) with first PIE by 2010.
Finally, C/C composites are devoted to control rod structures application to extend the operating temperatures beyond those allowed by metallic materials such as alloy 800H. The CEA will begin the study of these materials in 2004.
Dedicated experimental devices
The out-of-pile corrosion programme includes the development of two experimental devices:
� one dedicated to study the main corrosion phenomena likely to occur under representative conditions of VHTR;
� the other to assess the corrosion effect on the possible degradation of mechanical properties.
Regarding the VHTR needs, the CEA irradiation programme is under progress on the basis of the development of the Osiris experimental rig that is dedicated to the qualification of different variants of graphite and C/C composites at two temperature levels (650 and 1 000�C) and representative fluence.
In addition to this experiment a test is planned in the Phénix reactor to investigate higher doses and the neutron flux effect on irradiation-controlled properties of graphites and C/C composites.
R & D programme and task schedule
The different tasks of the CEA programme on structural materials for VHTR applications are gathered in Table 1.

45
Table 1. 2003-2010 CEA R&D programme on structural materials for VHTR application
Characteristion of thick products: Base metal in 2005, welds in 2006.Welding of thick products: Process in 2004, procedure in 2005.Specifications and characterisations of large and thick forged ring: 2008.Optimisation studies: Proposal of new specification in 2006.Industrial feasibility studies of the new product selected in 2006: 2008.
Creep, fatigue & relaxation properties of base metal (experiments & models)Fracture mechanics: Bending programme in 2005, tensile/torsion in 2006.Mechanical behavior of welds: Cracking 2006, residual stresses 2007.Codes & standards. Code adaptation, design rules, material dossiers.
Evaluation of Haynes 230 and comparison with present references.Evaluation of coatings. Feasibility 2006, material dossier in 2008.Codes & standards for metallic internals. Steps of 2006, 2008 & 2010.Evaluation of ODS & ceramics. Feasibility 2006, material dossier in 2008.Reference material for disc. Choice 2006, full-scale disc demo in 2010.Reference material for blade (same milestones as given for disc).Innovative materials for disc. Choice in 2008, material dossiers in 2010.
Graphite materials. Contribution to main dossiers 2004, 2006, 2008, 2010.C/C composites materials. Same steps as previous task.Codes & standards for graphite & C/C composite structures.
Corrosion devices. Qualification 2006 & use for milestones of 2008-2010.Irradiation experiments in Osiris & Phénix.Technological He benches and loops.
Mechanical studies on modified 9Cr-1Mo
Helite
Irradiations First PIE’sPreparation
Tribometer & Hethimo
Dedicated experimental devices to study environment effects
Graphites and C/C composites
CEA R&D on structural materials for VHTR applications
Metallurgical studies on modified 9Cr-1Mo
2008
2009
2010
2006
2007
2003
2004
2005
High-temperature metallic materials
Preparation Tests
Technical options dossier
Preliminary feasibility dossier
Validation dossier
Technical dossier Main materials
dossiers
The tasks given in Table 1 are planned to successfully reach the following main steps: the VHTR technical options in 2004, the preliminary feasibility of these options in 2006 and the material dossiers of reference options in 2008.
Metallurgical studies on modified 9Cr-1Mo
Industrial feasibility in large dimension of grade 91-type steel
Due to the large dimensions of VHTR vessels, the preliminary work must demonstrate that:
� Local microstructure and mechanical properties have to be homogeneous in the varied sections of the vessel and correspond to the metallurgical specifications of the product.
� Weldments of the different rings that make up the vessel must be free from defects.
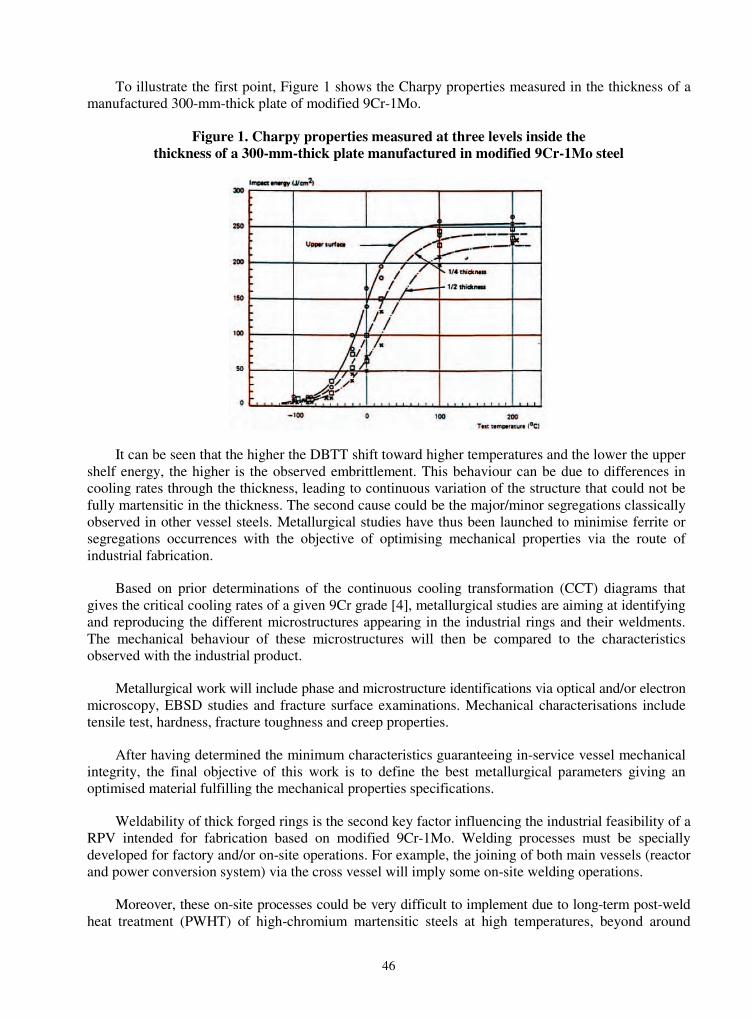
46
To illustrate the first point, Figure 1 shows the Charpy properties measured in the thickness of a manufactured 300-mm-thick plate of modified 9Cr-1Mo.
Figure 1. Charpy properties measured at three levels inside the thickness of a 300-mm-thick plate manufactured in modified 9Cr-1Mo steel
It can be seen that the higher the DBTT shift toward higher temperatures and the lower the upper shelf energy, the higher is the observed embrittlement. This behaviour can be due to differences in cooling rates through the thickness, leading to continuous variation of the structure that could not be fully martensitic in the thickness. The second cause could be the major/minor segregations classically observed in other vessel steels. Metallurgical studies have thus been launched to minimise ferrite or segregations occurrences with the objective of optimising mechanical properties via the route of industrial fabrication.
Based on prior determinations of the continuous cooling transformation (CCT) diagrams that gives the critical cooling rates of a given 9Cr grade [4], metallurgical studies are aiming at identifying and reproducing the different microstructures appearing in the industrial rings and their weldments. The mechanical behaviour of these microstructures will then be compared to the characteristics observed with the industrial product.
Metallurgical work will include phase and microstructure identifications via optical and/or electron microscopy, EBSD studies and fracture surface examinations. Mechanical characterisations include tensile test, hardness, fracture toughness and creep properties.
After having determined the minimum characteristics guaranteeing in-service vessel mechanical integrity, the final objective of this work is to define the best metallurgical parameters giving an optimised material fulfilling the mechanical properties specifications.
Weldability of thick forged rings is the second key factor influencing the industrial feasibility of a RPV intended for fabrication based on modified 9Cr-1Mo. Welding processes must be specially developed for factory and/or on-site operations. For example, the joining of both main vessels (reactor and power conversion system) via the cross vessel will imply some on-site welding operations.
Moreover, these on-site processes could be very difficult to implement due to long-term post-weld heat treatment (PWHT) of high-chromium martensitic steels at high temperatures, beyond around
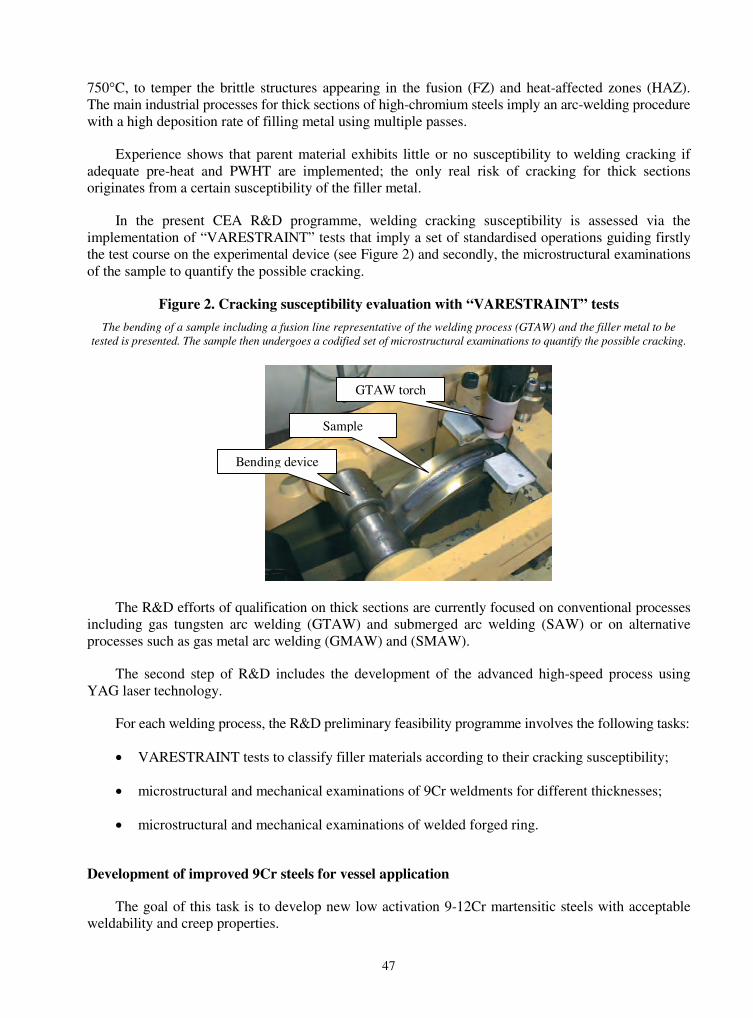
47
750�C, to temper the brittle structures appearing in the fusion (FZ) and heat-affected zones (HAZ). The main industrial processes for thick sections of high-chromium steels imply an arc-welding procedure with a high deposition rate of filling metal using multiple passes.
Experience shows that parent material exhibits little or no susceptibility to welding cracking if adequate pre-heat and PWHT are implemented; the only real risk of cracking for thick sections originates from a certain susceptibility of the filler metal.
In the present CEA R&D programme, welding cracking susceptibility is assessed via the implementation of “VARESTRAINT” tests that imply a set of standardised operations guiding firstly the test course on the experimental device (see Figure 2) and secondly, the microstructural examinations of the sample to quantify the possible cracking.
Figure 2. Cracking susceptibility evaluation with “VARESTRAINT” tests
The bending of a sample including a fusion line representative of the welding process (GTAW) and the filler metal to be tested is presented. The sample then undergoes a codified set of microstructural examinations to quantify the possible cracking.
GTAW torch
Sample
Bending device
The R&D efforts of qualification on thick sections are currently focused on conventional processes including gas tungsten arc welding (GTAW) and submerged arc welding (SAW) or on alternative processes such as gas metal arc welding (GMAW) and (SMAW).
The second step of R&D includes the development of the advanced high-speed process using YAG laser technology.
For each welding process, the R&D preliminary feasibility programme involves the following tasks:
� VARESTRAINT tests to classify filler materials according to their cracking susceptibility;
� microstructural and mechanical examinations of 9Cr weldments for different thicknesses;
� microstructural and mechanical examinations of welded forged ring.
Development of improved 9Cr steels for vessel application
The goal of this task is to develop new low activation 9-12Cr martensitic steels with acceptable weldability and creep properties.

48
These new alloys, all chosen in the well-documented class of 9-12Cr martensitic steels, could be alternative solutions to 91 grade, if its creep resistance and activation criteria prove to be insufficient for the VHTR final design.
This basic research work is based on preliminary studies aiming to identify the main microstructural parameters that govern creep resistance. Modelling studies use different metallurgical tools to predict phase stability (“Thermocalc”, see Figure 3) and creep behaviour of 9-12Cr steels via the use of a “neural network”.
Figure 3. Example of phase prediction with “Thermocalc”
This prediction is very useful to adjust the alloy specifications with the objective of promoting (or preventing) the occurrence of some phases known for increasing or decreasing creep resistance
9Cr 0,05Mn 0,05Ni 2W 0,3V 0,1C 0,085N
1.00E-002
1.00E-001
1.00E+000
1.00E+001
1.00E+002
1.00E+003
0 200 400 600 800 1000 1200 1400 1600 1800
Temperature (C)
Mas
s (%
)
"LIQUID"
"BCC_A2"
"FCC_A1"
"HCP_A3"
"M23C6"
"LAVES_PHASE"
"NV"
The current programme involves the preliminary development (alloy design, fabrication route, manufacture, physical metallurgy) of three new melted ingots with optimised contents of nitrogen, vanadium and titanium.
Different heat treatments will be experimented in order to obtain a high volume fraction of fine and stable vanadium nitrides or titanium carbides in the matrix (mainly to ensure good creep properties) with a prior austenitic grain size as small as possible to maintain good toughness properties. Finally, creep, tensile tests, impact and welding tests will be performed to select the best variant.
Mechanical studies on modified 9Cr-1Mo
Damage mechanisms to consider for the design of the RPV have been identified, and a review of available data for modified 9Cr-1Mo steel was performed. This has allowed to highlight that it is necessary to validate or improve some design rules and to define complementary programmes in order to obtain missing data. The research programmes described below have thus been undertaken at CEA.
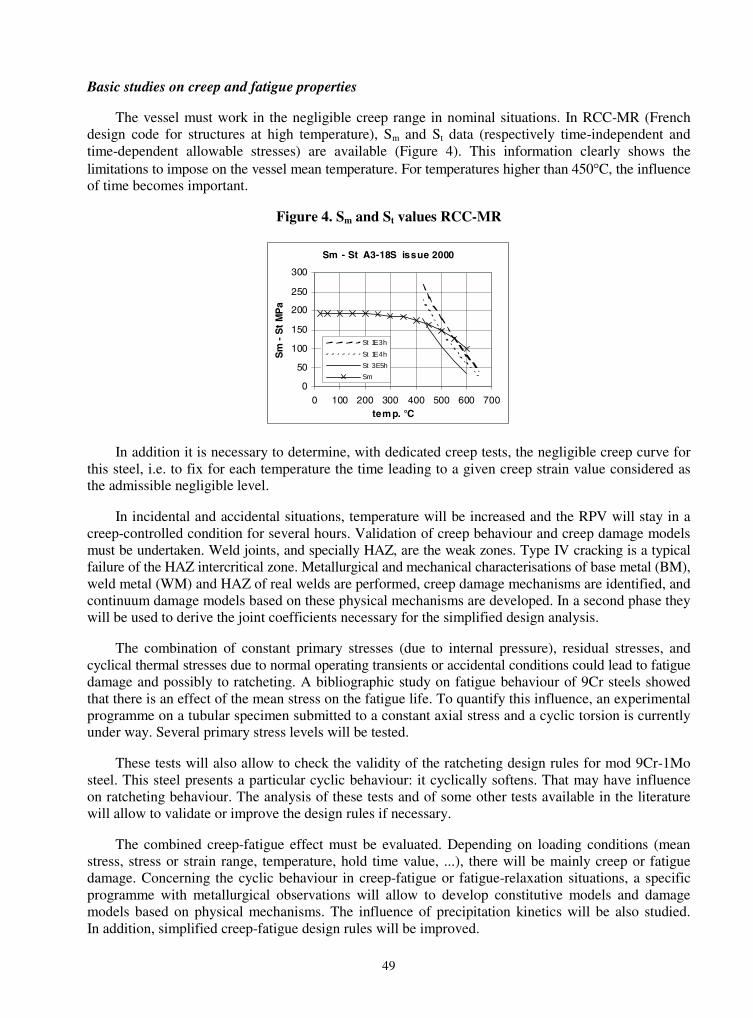
49
Basic studies on creep and fatigue properties
The vessel must work in the negligible creep range in nominal situations. In RCC-MR (French design code for structures at high temperature), Sm and St data (respectively time-independent and time-dependent allowable stresses) are available (Figure 4). This information clearly shows the limitations to impose on the vessel mean temperature. For temperatures higher than 450�C, the influence of time becomes important.
Figure 4. Sm and St values RCC-MR
Sm - St A3-18S issue 2000
0
50
100
150
200
250
300
0 100 200 300 400 500 600 700temp. °C
Sm
- S
t M
Pa
St 1E 3h
St 1E 4h
St 3E5h
Sm
In addition it is necessary to determine, with dedicated creep tests, the negligible creep curve for this steel, i.e. to fix for each temperature the time leading to a given creep strain value considered as the admissible negligible level.
In incidental and accidental situations, temperature will be increased and the RPV will stay in a creep-controlled condition for several hours. Validation of creep behaviour and creep damage models must be undertaken. Weld joints, and specially HAZ, are the weak zones. Type IV cracking is a typical failure of the HAZ intercritical zone. Metallurgical and mechanical characterisations of base metal (BM), weld metal (WM) and HAZ of real welds are performed, creep damage mechanisms are identified, and continuum damage models based on these physical mechanisms are developed. In a second phase they will be used to derive the joint coefficients necessary for the simplified design analysis.
The combination of constant primary stresses (due to internal pressure), residual stresses, and cyclical thermal stresses due to normal operating transients or accidental conditions could lead to fatigue damage and possibly to ratcheting. A bibliographic study on fatigue behaviour of 9Cr steels showed that there is an effect of the mean stress on the fatigue life. To quantify this influence, an experimental programme on a tubular specimen submitted to a constant axial stress and a cyclic torsion is currently under way. Several primary stress levels will be tested.
These tests will also allow to check the validity of the ratcheting design rules for mod 9Cr-1Mo steel. This steel presents a particular cyclic behaviour: it cyclically softens. That may have influence on ratcheting behaviour. The analysis of these tests and of some other tests available in the literature will allow to validate or improve the design rules if necessary.
The combined creep-fatigue effect must be evaluated. Depending on loading conditions (mean stress, stress or strain range, temperature, hold time value, ...), there will be mainly creep or fatigue damage. Concerning the cyclic behaviour in creep-fatigue or fatigue-relaxation situations, a specific programme with metallurgical observations will allow to develop constitutive models and damage models based on physical mechanisms. The influence of precipitation kinetics will be also studied. In addition, simplified creep-fatigue design rules will be improved.

50
Basic studies on fracture mechanics
A programme to validate defect nocivity analysis has started. In the vicinity of weldments, defects can exist, either due to fabrication or developed during the life. Validation of initiation and propagation crack laws in fatigue, creep and creep-fatigue conditions is carried out on CT specimens, respectively for BM, WM and HAZ. Tests on large thick plates with defects in a weld and submitted to bending loading (Figure 5) are performed to validate the methodology for structures.
Figure 5. Large plate with a defect in the weld
Complementary tests on tubular specimens solicited in traction-torsion will allow to study the defect nocivity in combined mode.
Behaviour and life prediction of weldments
The susceptibility of this steel to reheat cracking will be investigated. Residual stresses can reach high levels because of the large dimensions of the vessel. During post-welding heat treatment, or during service at elevated temperatures, the stresses will relax and if the ductility is reduced due to the modification of microstructure, cracks can develop. Specific tests, known as “BORLAND” tests (Figure 6), are planned to be implemented on samples involving real welds. They are maintained at the test temperature for a given time, and codified non-destructive tests (ultrasonic controls) are regularly realised.
Figure 6. “BORLAND” specimen
Residual stresses may have a significant effect on the initiation of cracks during welding, heat treatment or service life. A large programme has been proposed to perform residual stress evaluations for all elements. This programme would include metallurgical characterisation, phase transformation diagram determination under representative conditions, thermal and mechanical characterisation, development and validation of models, design and realisation of validation tests.
51
Finally, in addition to the task devoted to metallurgical welding described in the section entitled Metallurgical studies on modified 9Cr-1Mo, a complementary mechanical approach is planned to qualify and optimise the welding process. The influence of the main welding parameters will be anticipated, in order to define the best procedure for each process.
Codes and standards activities
All the developments performed on this steel and on other structural materials for VHTR will be introduced in a high-temperature design code. The aim of this task is to elaborate and validate conception and construction rules for gas-cooled reactor structures. It will include improvement of some design rules, such as creep-fatigue, ratcheting, fatigue with mean stress, irradiation allowance, …, but also recommendations for supplying the different products, drafting standards for fabrication (recommendations for welding for instance), and compilation of material data needed for the final design of the components.A database gathering all the results of mechanical tests performed within this programme is being developed, and it will be added to as new results become available.
High-temperature metallic materials
Ni-based alloy for primary circuit, hot gas duct and IHX
Up to 900-1 000�C, solid solution strengthened Ni-based alloys are promising candidates for applications requiring structural stability, creep resistance under low stress levels and environmental resistance. In the 80s exhaustive work was performed to qualify Inconel 617, Hastelloy X and Hastelloy XR for HTR application. Inconel 617 exhibits the best creep properties but its high Co content is considered a drawback with regard to potential contamination problems. Moreover, its corrosion resistance was found inappropriate for VHTR application. Haynes 230, which was developed to succeed Inconel 617, has a low Co content (around 0.1%) and is expected to present high creep resistance (similar to Inconel 617). Moreover, metal working and welding techniques for this grade are well established. The experimental programme launched at CEA aims at qualifying this material for application in VHTR. Long-term high-temperature exposure tests are foreseen to assess its structural stability, and tensile and creep tests on aged specimens will evaluate the influence of the microstructural changes on the mechanical properties.
The first results obtained on Haynes 230 confirm that this material could exhibit a higher creep resistance than the other reference materials and also have revealed a precipitation of carbides at 850�C which resulted in a certain reduction of ductility at room temperature. Actually, no significant effect has been detected on the tensile properties at elevated temperatures. Longer exposure tests are required to conclude on this point. Mid-term creep tests under air and vacuum are currently under way and the results will be compared to Inconel 617 and Hastelloy XR data.
For the intermediate heat exchanger additional work is being performed concerning the workability and welding of this material. Due to the required specifications of this huge component, it is expected to choose a base concept for plates. Attempts to obtain complex shape parts from thin plates are currently under way. These elementary parts will then be welded to manufacture small modules. The thermomechanical behaviour of such assemblies will then be investigated.

52
Studies on coatings
An alternative design for the hot-gas-facing metallic components consists of using thermal barrier coatings (TBC) on a less resistant material. A metallic bond coat (NiAl or NiCrAlY) is first deposited on the substrate to provide oxidation/corrosion resistance by forming a slow-growing adherent protective aluminium oxide scale. Then a thick ceramic layer is added to reduce the substrate alloy temperature. The industrial current standard for a TBC is partially yttria-stabilised zirconia. Different processes are investigated at CEA: air-plasma spraying, electron beam physical vapour deposition (EB-PVD) or chemical vapour deposition (CVD) techniques. The chosen substrate is a standard alloy 800. Each process gives rise to a different microstructure. EB-PVD generates columnar microstructure which exhibits high strain tolerances under thermal cycles, but this process is very expensive and is restricted to quite small components. It is thus inappropriate for the hot gas duct. CVD techniques are far cheaper but suffer from a very low deposition rate. The key issues to be addressed with TBC are the diffusion phenomena between the substrate and the coat which may lead to the formation of brittle phase, deterioration of the mechanical properties of the substrate close to the surface, and the evolution of the ceramic layer itself. High operational temperature combined with long-term exposure times will lead to an in-service sintering of the zirconia. The densification of the ceramic results in a loss of strain tolerances and in an increase of the spallation risk. Ageing treatments and thermal cycle tests will thus be conducted on small coated parts.
Ni-based superalloys for turbine discs and blades
Even if a detailed design of the turbine is not yet determined, it is expected that the turbine of a VHTR will be quite similar to the turbine of the Gas Turbine Modular Helium Reactor (GT-MHR) for which preliminary design requirements have been established. The main characteristics are the following: large disc size (diameter of around 1.4 m), blades of 15-20 mm length, long maintenance intervals (~60 000 h). The turbine inlet temperature should lie in the range 900-1 000�C allowing a non-cooled blade design. The presence of impurities in the gas requires the use of a protective coating against corrosion. The selection of this coating has not yet been addressed, but it will be performed among the existing technologies developed within the aeronautic field. Diffusion phenomena between the coat and the substrate will have to be deeply investigated due to the foreseen long service times. The experimental programme already launched at CEA aimed at qualifying two Ni-based DS superalloys in terms of long-term creep performance and thermal stability.
The material selection for the disk has been based on the preliminary results issued from a thermomechanical analysis performed at operation temperatures. As for the blades, tensile strength after long-term services and creep performance are of prime importance. Typical requirements for the first stage disc are: creep deformation after 60 000 h at 700�C less than 0.2% under 174 MPa and less than 1% under 200 MPa. Such high levels of creep resistance are not attainable with the existing technologies developed for large turbine discs. The most recent advances realised for the land-based turbine discs deal with Inconel 718. This superalloy, widely used in aeronautic engines, exhibits thermal instability at temperatures higher than 600-650�C, preventing its use for VHTR application. Material candidates for high temperature use are Waspalloy and Udimet 720. No past experience in manufacturing such large components exists for both of these heavily alloyed materials. Technological developments are thus required.
The CEA has decided to work on grade Udimet 720Li, which is the most promising material with regard to its creep performance. Two process routes are investigated in parallel. The first, which is also the most widespread method, is to manufacture large diameter rotor disc blanks using the “cast and wrought” route. A large ingot is first elaborated using a triple melting technology, then the ingot is

53
processed into billets on hydraulic presses, and finally hot die forging is used to manufacture the disc blank. Difficulties are expected within the melting step related to a risk of macro-segregation. Since high creep performance is required, the final heat treatment will aim at obtaining a coarse-grain microstructure. Cast and wrought Udimet 720LI is known to exhibit a very rapid and non-uniform grain-coarsening behaviour which makes this last step very challenging. Such a technological development being very expensive, CEA has decided in a first step to qualify this material manufactured as a small disc. The loss of mechanical properties expected with a large disc is a key issue which will be addressed later. The experimental programme comprises mid-term creep tests, tensile tests after lengthy ageing treatments, some low cycle fatigue tests and fine microstructural examinations.
The alternative process route considered is based on powder metallurgy (P/M). One of the main advantages of this process is that it is possible to manufacture directly a blank with a geometry and size close to those of the final product resulting in a reduction of material usage. Moreover, the risk of macro-segregation is eliminated (the segregation lies at the level of the powder particles). However, this process suffers from other drawbacks such as the risk of ceramic inclusions issued from a powder contamination which may act as future crack initiation sites in the consolidated material, and formation of a semi-continuous film of fine precipitates (oxide/carbides) along the prior particle boundaries (PPB). CEA has launched an experimental programme to evaluate P/M U720LI for HTR application. The powder has been consolidated using a standard Hot Isostatic Pressure (HIP) cycle. A super solvent solutioning treatment is then applied, then followed by a two-step ageing treatment. The presence of the precipitates along the PPB has prevented the coarsening of austenitic grain by pinning grain boundary as can be seen in Figure 7. These precipitates also contribute to the creep damage: cracks are initiated preferentially along the PPB whereas only a few inter-granular cracks have been detected (Figure 8).
One way to improve the creep resistance of the PM U720LI grade consists of forcing the grain to grow over the initial particles. Lengthy supersolvus solutioning treatments are inefficient to obtain such a result. CEA and Aubert & Duval have developed a specific HIP cycle which has overcome this problem. The resulting grain size is around 80 �m and is quite homogeneous (Figure 9). The former powder sub-structure is hardly visible.
The first results in terms of creep life obtained on this advanced material are very promising: its creep behaviour is similar to a cast and wrought coarse grain U720LI. A full experimental programme is nevertheless required to conclude on the interest of this grade as regards VHTR application.
Figure 7. Precipitates pinning the austenitic grain boundary
200 nm
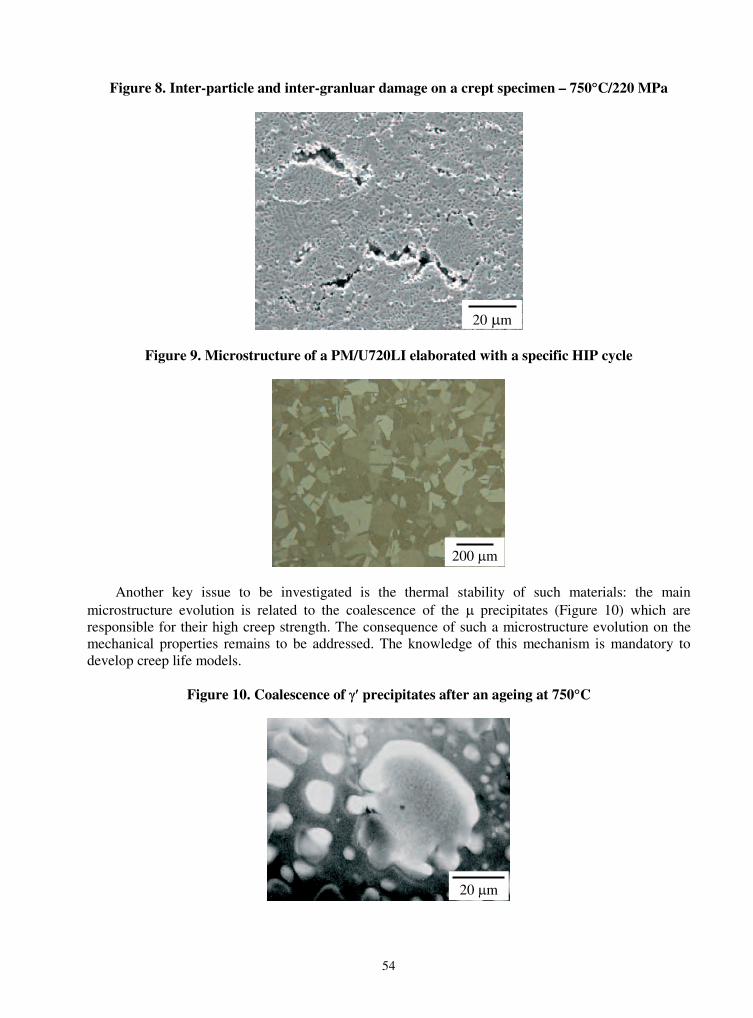
54
Figure 8. Inter-particle and inter-granluar damage on a crept specimen – 750�C/220 MPa
Figure 9. Microstructure of a PM/U720LI elaborated with a specific HIP cycle
Another key issue to be investigated is the thermal stability of such materials: the main microstructure evolution is related to the coalescence of the � precipitates (Figure 10) which are responsible for their high creep strength. The consequence of such a microstructure evolution on the mechanical properties remains to be addressed. The knowledge of this mechanism is mandatory to develop creep life models.
Figure 10. Coalescence of �� precipitates after an ageing at 750�C
20 �m
20 �m
200 �m

55
Corrosion studies
In the framework of past HTR development, corrosion induced by the cooling gas, namely the helium impurities, has been identified as a crucial issue for the choice of metallic materials of the primary circuit because such corrosion can cause a noticeable degradation of mechanical properties. To anticipate this deleterious effect, a dedicated device known as “CORSAIRE” was developed. Creep tests on the different metallic candidates for high-temperature applications can be conducted, via tensile loading, by carburising He in the range 750-900�C. These experiments just being started, we would like to focus here on the study of corrosion phenomena in the VHTR environment.
The nature and level of gaseous impurities contained in the coolant helium are set up by a dynamic equilibrium between the rate of pollution (air ingress, water in-leakage, material degassing, hydrogen diffusion through the heat exchanger, …), the pollutant reaction with the hot part of the core and the efficiency of the purification plant [5]. The main impurities are H2, H2O, CO and CH4, and their partial pressures are in the range of a few �bars to about hundred �bars. Even if the impurity levels appear to be extremely low, they nevertheless can cause corrosion of metallic materials, which in turn can induce deleterious mechanical effects.
Generally, alloys with good corrosion resistance in air at high temperatures develop at their surface a compact, adherent and low-growth-rate oxide layer allowing the substrate to be subsequently protected. The peculiarity of the HTR He coolant environment is its low oxidising potential (mainly determined by PH2O/PH2) associated with a possibly high carbon activity (set by kinetics factors related to CO and/or CH4 splitting). Different reactions with metallic materials are reported in the literature, exemplified here with Cr as the active metal [6-7]:
Oxidation 3 H2O + 2 Cr � Cr2O3 + 3 H2*Carburisation 3 CH4 + 7 Cr � Cr7C3 + 6 H2
Carburisation/oxidation 3 CO + 9 Cr � Cr2O3 + Cr7C3
Decarburisation 3 H2O + Cr7C3 � 3 CO + 3 H2 + 7 Cr 6 H2O + Cr7C3 � 3 CH4 + 2 Cr2O3 + 3 Cr
* Only reactive elements such as Ti, Al, Nb, Mn, or Si and Cr, according to the specific conditions, can be oxidised in such environments.
Moreover, above a specific temperature Ta, which depends on the atmosphere (especially PCO) as well as on the material, the following global reaction occurs [8]:
Cr2O3 + Cr7C3 � 3 CO + 9 Cr
Depending on the PCH4/PH20 ratio, it leads to deep carburisation or complete decarburisation of the material.
Carbon transfer between atmosphere and metallic material is a concern due to the changes of the material carbon content which significantly impair the mechanical properties: carburisation leads to low temperature embrittlement whereas decarburisation reduces the creep rupture strength. For practical application of the high-temperature alloys, environmental parameters must induce the formation of a protective oxide layer. At very high temperatures, volatility and spallation issues of the chromia base scale must be addressed [9].
Based on previous experience, there is valuable theoretical and/or experimental knowledge of corrosion phenomena is available, but relevant data for present VHTR material selection are lacking. On the one hand, the VHTR environment will be significantly original especially regarding the higher
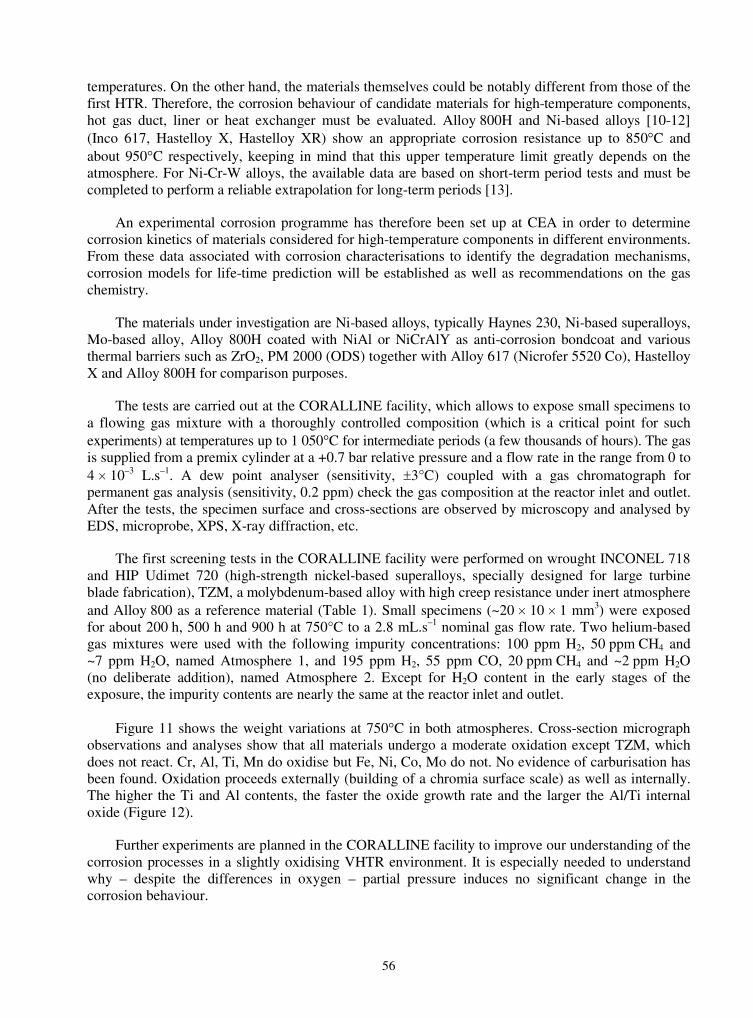
56
temperatures. On the other hand, the materials themselves could be notably different from those of the first HTR. Therefore, the corrosion behaviour of candidate materials for high-temperature components, hot gas duct, liner or heat exchanger must be evaluated. Alloy 800H and Ni-based alloys [10-12] (Inco 617, Hastelloy X, Hastelloy XR) show an appropriate corrosion resistance up to 850�C and about 950�C respectively, keeping in mind that this upper temperature limit greatly depends on the atmosphere. For Ni-Cr-W alloys, the available data are based on short-term period tests and must be completed to perform a reliable extrapolation for long-term periods [13].
An experimental corrosion programme has therefore been set up at CEA in order to determine corrosion kinetics of materials considered for high-temperature components in different environments. From these data associated with corrosion characterisations to identify the degradation mechanisms, corrosion models for life-time prediction will be established as well as recommendations on the gas chemistry.
The materials under investigation are Ni-based alloys, typically Haynes 230, Ni-based superalloys, Mo-based alloy, Alloy 800H coated with NiAl or NiCrAlY as anti-corrosion bondcoat and various thermal barriers such as ZrO2, PM 2000 (ODS) together with Alloy 617 (Nicrofer 5520 Co), Hastelloy X and Alloy 800H for comparison purposes.
The tests are carried out at the CORALLINE facility, which allows to expose small specimens to a flowing gas mixture with a thoroughly controlled composition (which is a critical point for such experiments) at temperatures up to 1 050�C for intermediate periods (a few thousands of hours). The gas is supplied from a premix cylinder at a +0.7 bar relative pressure and a flow rate in the range from 0 to 4 � 10–3 L.s–1. A dew point analyser (sensitivity, �3°C) coupled with a gas chromatograph for permanent gas analysis (sensitivity, 0.2 ppm) check the gas composition at the reactor inlet and outlet. After the tests, the specimen surface and cross-sections are observed by microscopy and analysed by EDS, microprobe, XPS, X-ray diffraction, etc.
The first screening tests in the CORALLINE facility were performed on wrought INCONEL 718 and HIP Udimet 720 (high-strength nickel-based superalloys, specially designed for large turbine blade fabrication), TZM, a molybdenum-based alloy with high creep resistance under inert atmosphere and Alloy 800 as a reference material (Table 1). Small specimens (~20 � 10 � 1 mm3) were exposed for about 200 h, 500 h and 900 h at 750°C to a 2.8 mL.s–1 nominal gas flow rate. Two helium-based gas mixtures were used with the following impurity concentrations: 100 ppm H2, 50 ppm CH4 and ~7 ppm H2O, named Atmosphere 1, and 195 ppm H2, 55 ppm CO, 20 ppm CH4 and ~2 ppm H2O(no deliberate addition), named Atmosphere 2. Except for H2O content in the early stages of the exposure, the impurity contents are nearly the same at the reactor inlet and outlet.
Figure 11 shows the weight variations at 750�C in both atmospheres. Cross-section micrograph observations and analyses show that all materials undergo a moderate oxidation except TZM, which does not react. Cr, Al, Ti, Mn do oxidise but Fe, Ni, Co, Mo do not. No evidence of carburisation has been found. Oxidation proceeds externally (building of a chromia surface scale) as well as internally. The higher the Ti and Al contents, the faster the oxide growth rate and the larger the Al/Ti internal oxide (Figure 12).
Further experiments are planned in the CORALLINE facility to improve our understanding of the corrosion processes in a slightly oxidising VHTR environment. It is especially needed to understand why – despite the differences in oxygen – partial pressure induces no significant change in the corrosion behaviour.
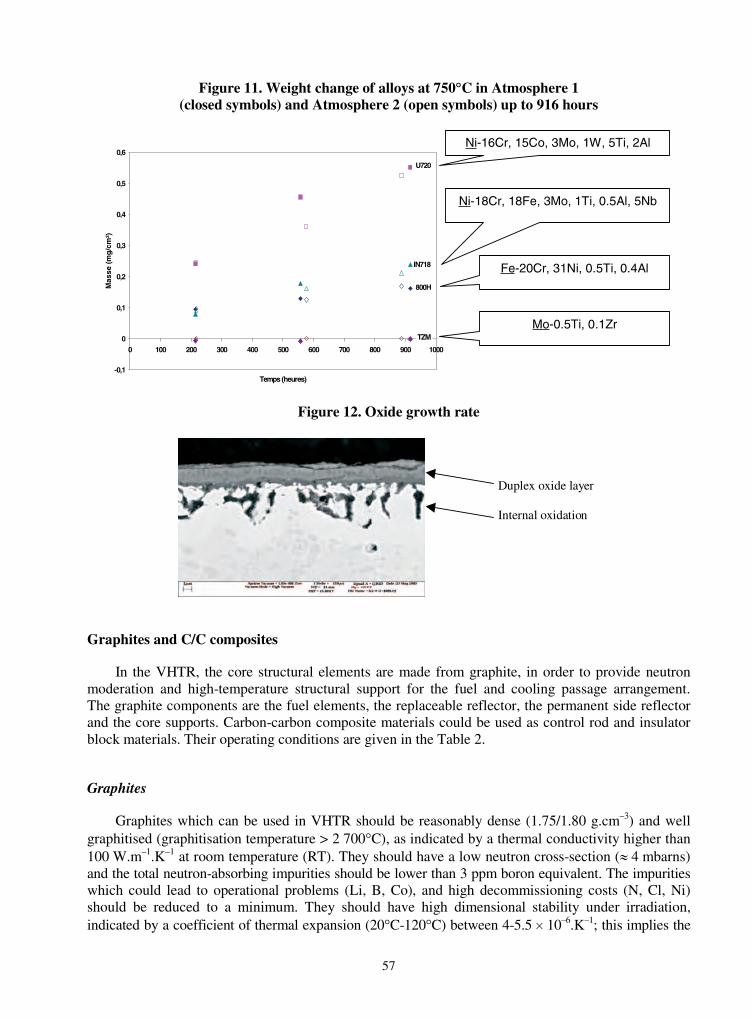
57
Figure 11. Weight change of alloys at 750�C in Atmosphere 1 (closed symbols) and Atmosphere 2 (open symbols) up to 916 hours
-0,1
0
0,1
0,2
0,3
0,4
0,5
0,6
0 100 200 300 400 500 600 700 800 900 1000
Temps (heures)
Mas
se (
mg
/cm
²)
U720
IN718
800H
TZM
Ni-16Cr, 15Co, 3Mo, 1W, 5Ti, 2Al
Ni-18Cr, 18Fe, 3Mo, 1Ti, 0.5Al, 5Nb
Fe-20Cr, 31Ni, 0.5Ti, 0.4Al
Mo-0.5Ti, 0.1Zr
Figure 12. Oxide growth rate
Duplex oxide layer
Internal oxidation
Graphites and C/C composites
In the VHTR, the core structural elements are made from graphite, in order to provide neutron moderation and high-temperature structural support for the fuel and cooling passage arrangement. The graphite components are the fuel elements, the replaceable reflector, the permanent side reflector and the core supports. Carbon-carbon composite materials could be used as control rod and insulator block materials. Their operating conditions are given in the Table 2.
Graphites
Graphites which can be used in VHTR should be reasonably dense (1.75/1.80 g.cm–3) and well graphitised (graphitisation temperature > 2 700�C), as indicated by a thermal conductivity higher than 100 W.m–1.K–1 at room temperature (RT). They should have a low neutron cross-section (� 4 mbarns) and the total neutron-absorbing impurities should be lower than 3 ppm boron equivalent. The impurities which could lead to operational problems (Li, B, Co), and high decommissioning costs (N, Cl, Ni) should be reduced to a minimum. They should have high dimensional stability under irradiation, indicated by a coefficient of thermal expansion (20�C-120�C) between 4-5.5 � 10–6.K–1; this implies the
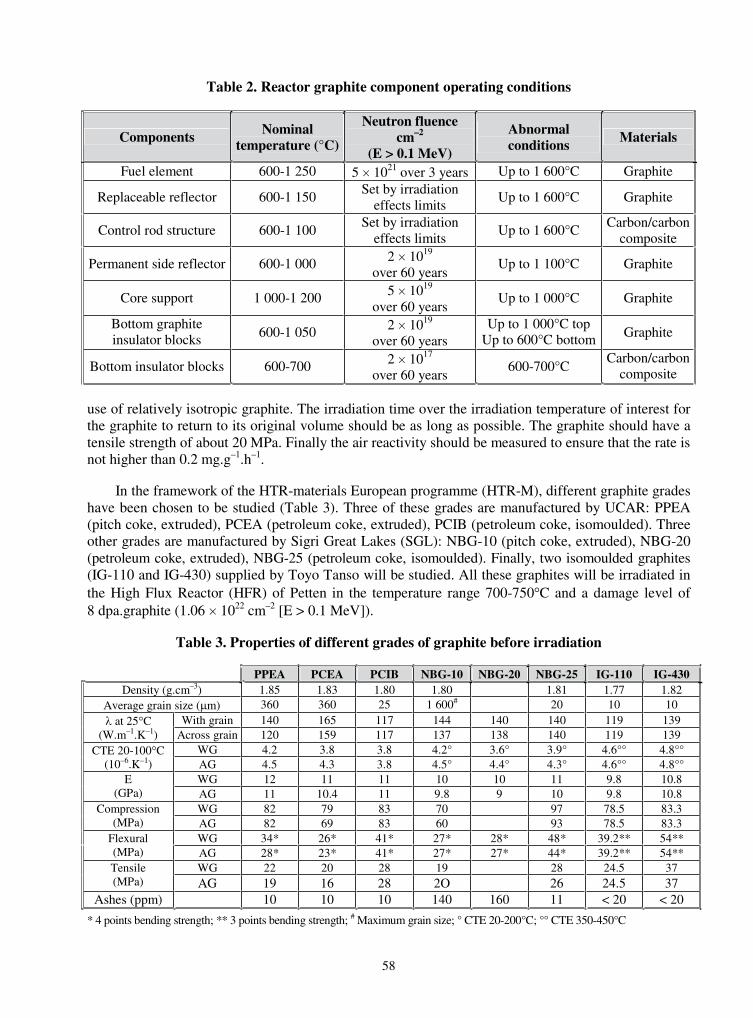
58
Table 2. Reactor graphite component operating conditions
Components Nominal temperature (°C)
Neutron fluence cm–2
(E > 0.1 MeV)
Abnormal conditions
Materials
Fuel element 600-1 250 5 � 1021 over 3 years Up to 1 600°C Graphite
Replaceable reflector 600-1 150Set by irradiation
effects limitsUp to 1 600°C Graphite
Control rod structure 600-1 100Set by irradiation
effects limitsUp to 1 600°C
Carbon/carbon composite
Permanent side reflector 600-1 000 2 � 1019
over 60 yearsUp to 1 100°C Graphite
Core support 1 000-1 200 5 � 1019
over 60 yearsUp to 1 000°C Graphite
Bottom graphite insulator blocks 600-1 050 2 � 1019
over 60 yearsUp to 1 000°C top
Up to 600°C bottom Graphite
Bottom insulator blocks 600-700 2 � 1017
over 60 years600-700°C
Carbon/carbon composite
use of relatively isotropic graphite. The irradiation time over the irradiation temperature of interest for the graphite to return to its original volume should be as long as possible. The graphite should have a tensile strength of about 20 MPa. Finally the air reactivity should be measured to ensure that the rate is not higher than 0.2 mg.g–1.h–1.
In the framework of the HTR-materials European programme (HTR-M), different graphite grades have been chosen to be studied (Table 3). Three of these grades are manufactured by UCAR: PPEA (pitch coke, extruded), PCEA (petroleum coke, extruded), PCIB (petroleum coke, isomoulded). Three other grades are manufactured by Sigri Great Lakes (SGL): NBG-10 (pitch coke, extruded), NBG-20 (petroleum coke, extruded), NBG-25 (petroleum coke, isomoulded). Finally, two isomoulded graphites (IG-110 and IG-430) supplied by Toyo Tanso will be studied. All these graphites will be irradiated in the High Flux Reactor (HFR) of Petten in the temperature range 700-750�C and a damage level of 8 dpa.graphite (1.06 � 1022 cm–2 [E > 0.1 MeV]).
Table 3. Properties of different grades of graphite before irradiation
PPEA PCEA PCIB NBG-10 NBG-20 NBG-25 IG-110 IG-430Density (g.cm–3) 1.85 1.83 1.80 1.80 1.81 1.77 1.82
Average grain size (�m) 360 360 25 1 600# 20 10 10With grain 140 165 117 144 140 140 119 139 at 25�C
(W.m–1.K–1) Across grain 120 159 117 137 138 140 119 139WG 4.2 3.8 3.8 4.2° 3.6° 3.9° 4.6°° 4.8°°CTE 20-100�C
(10–6.K–1) AG 4.5 4.3 3.8 4.5° 4.4° 4.3° 4.6°° 4.8°°WG 12 11 11 10 10 11 9.8 10.8E
(GPa) AG 11 10.4 11 9.8 9 10 9.8 10.8WG 82 79 83 70 97 78.5 83.3Compression
(MPa) AG 82 69 83 60 93 78.5 83.3WG 34* 26* 41* 27* 28* 48* 39.2** 54**Flexural
(MPa) AG 28* 23* 41* 27* 27* 44* 39.2** 54**WG 22 20 28 19 28 24.5 37Tensile
(MPa) AG 19 16 28 2O 26 24.5 37Ashes (ppm) 10 10 10 140 160 11 < 20 < 20
* 4 points bending strength; ** 3 points bending strength; # Maximum grain size; ° CTE 20-200°C; °° CTE 350-450°C

59
The CEA has undertaken a R&D programme to study the behaviour of neutron-irradiated graphites. The different graphite grades chosen in this experimental programme are the same as those studied in the framework of the HTR-M European programme. The first step of this programme is the characterisation of un-irradiated graphites in the range 600-1 600�C, so as to compare experimental results with those provided by graphites suppliers. The studied properties before irradiation will include: density; lattice crystallinity, crystallographic texture and Lc size by mean of X-ray diffraction; grain morphology by mean of Scanning Electron Microscopy; thermal properties (coefficient of thermal expansion [CTE], heat capacity and thermal conductivity); mechanical properties (Young’s modulus, compressive and flexural strength, fracture toughness). In a second step, a graphite irradiation programme will be carried out at the Osiris reactor with an irradiation temperature of 1 000�C and a neutron fluence of 5-7 � 1021 cm–2 (E > 0.1 MeV) (3.8-5.3 dpa.g), and eventually in the Phénix reactor with an irradiation temperature range of 500-1 000�C and a neutron fluence of 1022 cm–2 (E > 0.1 MeV) (� 8 dpa.g). The studied properties after irradiation will be: dimensional changes; Lc size changes by means of X-ray diffraction; grain morphology by means of Scanning Electron Microscopy; coefficient of thermal expansion (CTE) up to the irradiation temperature; heat capacity and thermal conductivity up to the irradiation temperature; Young’s modulus at room temperature and at the irradiation temperature, compressive and flexural strength at room temperature and at the irradiation temperature, fracture toughness at room temperature and at the irradiation temperature.
Additionally, a graphite corrosion studies programme (Oxygraph) is being carried out at the CEA. This programme’s objective is to analyse the graphite behaviour in HTR or VHTR in case of air ingress in the primary circuit, to reach oxidation kinetics parameters for various available graphites in different conditions and to link graphite oxidation results with the degradation of its mechanical properties. The measurements are being made by Thermo-gravimetric Analysis (TGA) with a direct coupling of gas analysis (mass spectrometry and micro gas chromatography). The parameters studied are: graphite properties (density, porosity, impurities, ...), gas phase composition, flow rate and temperature. The samples are representative of graphite foreseen for HTR application, each weighing around 400 g. The graphite is heated up to the oxidation temperature (tests are performed at 400�C,600�C, 800�C and 1 200�C) in a helium atmosphere, then the gas is replaced by a mixture of helium and air, to represent the accident conditions. Kinetics of oxidation are followed on line through gas phase analysis (CO, CO2 content). After the test, samples are weighed to check the mass loss during oxidation, and small samples are taken to perform compressive tests.
Graphite oxidation by air and oxygen can be decomposed into three phases according to the temperature. At temperatures below 600�C, the graphite oxidation is controlled by the chemical reaction between oxygen and carbon. The oxidation rate is slow, but occurs in all the graphite porosity, and is an oxidation in volume leading to a large decrease of the mechanical properties. Under these conditions, the kinetic reaction is controlled by parameters such as the graphite purity and the presence of impurities which can act as catalysts (Fe, V, Pb). Between 600�C and 900�C, the oxidation rate is controlled by gaseous species in the graphite porosity. Thus, the graphite porosity is the main parameter during the diffusional phase. At temperatures beyond 900�C, the oxidation rate is controlled by the presence of oxidising species at the surface of graphite. In this mass transfer phase, the oxidation rate is high, but it is a surface oxidation and the mechanical properties are weakly affected (Figure 13) [14].
Generally the most important property changes for the core lifetime integrity are dimensional changes. When irradiated, graphite initially undergoes a short period of swelling followed by a larger shrinkage with irradiation fluence. This shrinkage then slows down and there is a point of “turn around” before the graphite swells back to its original volume and beyond. The graphite dimensional changes depend on the irradiation temperature, the coke anisotropy, the grain size and the graphitisation temperature. For the near isotropic graphite, minimum shrinkage occurs at an irradiation temperature
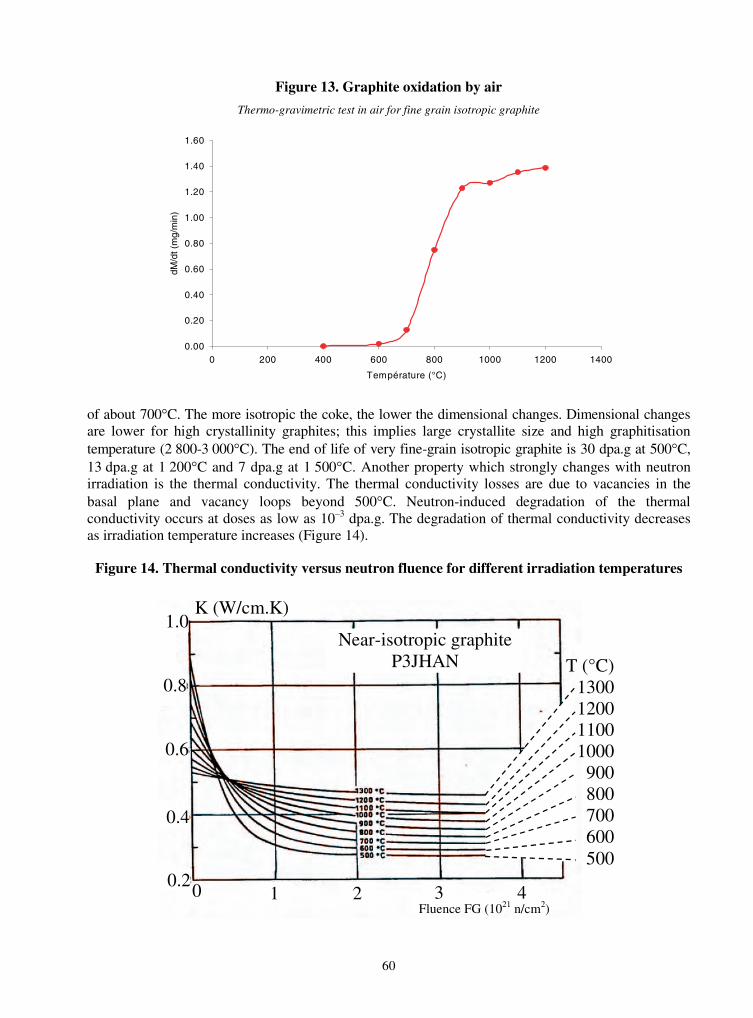
60
Figure 13. Graphite oxidation by air
Thermo-gravimetric test in air for fine grain isotropic graphite
0.00
0.20
0.40
0.60
0.80
1.00
1.20
1.40
1.60
0 200 400 600 800 1000 1200 1400
Température (°C)
dM/d
t (m
g/m
in)
of about 700�C. The more isotropic the coke, the lower the dimensional changes. Dimensional changes are lower for high crystallinity graphites; this implies large crystallite size and high graphitisation temperature (2 800-3 000�C). The end of life of very fine-grain isotropic graphite is 30 dpa.g at 500�C,13 dpa.g at 1 200�C and 7 dpa.g at 1 500�C. Another property which strongly changes with neutron irradiation is the thermal conductivity. The thermal conductivity losses are due to vacancies in the basal plane and vacancy loops beyond 500�C. Neutron-induced degradation of the thermal conductivity occurs at doses as low as 10–3 dpa.g. The degradation of thermal conductivity decreases as irradiation temperature increases (Figure 14).
Figure 14. Thermal conductivity versus neutron fluence for different irradiation temperatures
1.0
0.6
0.4
1.0
0.8
K (W/cm.K)
T (°C)1300120011001000900800700600500
1 2 43Fluence FG (1021 n/cm2)
Near-isotropic graphiteP3JHAN
0.20

61
The Young’s modulus changes are due to the pinning of dislocations by interstials clusters. The Young’s modulus increases quickly at the beginning of the irradiation, then a saturation of this phenomenon appears at a neutron fluence ranging between 0.5 and 2 � 1021 cm–2 (� FG). The �E/E is higher for lower irradiation temperatures between 600�C and 1 200�C. Generally graphite mechanical strength increases under neutron irradiation; strength and Young’s modulus are linked by the relation:
i/ 0 = (Ei/E0)n
where n = 0.5 when the irradiation temperature is between 500�C and 900�C; and where n = 1 when the irradiation temperature is higher than 900�C.
Carbon/carbon composites
It is known that carbon/carbon composites show improved performances compared to graphite as concerns the use of components subject to high temperatures. Thus, carbon/carbon composites have been widely used as plasma-facing materials in fusion facilities (JET, Tore Supra, JT-60, ...) because of their particularly high thermal shock resistance. These good performances are based on the high strength and the high thermal conductivity of carbon/carbon composites. In the framework of European fusion technology, the CEA has carried out a R&D programme to study the neutron irradiation effects on carbon/carbon composites, especially thermal conductivity and dimensional changes.
Carbon/carbon composites’ dimensional changes under neutron irradiation are dominated by the behaviour of the fibres, that is to say a shrinkage in the direction parallel to the fibres and a swelling in the direction perpendicular to the fibres. Dimensional changes of 3-D carbon/carbon composites are more isotropic than those of 2-D ones. Moreover, they increase very slightly under irradiation temperatures ranging between 620�C and 1 000�C; despite the fact that 2-D carbon/carbon composites’ dimensional changes increase more sharply with irradiation temperature (Table 4) [15].
Table 4. Dimensional changes of 2-D and 3-D carbon/carbon composites
�L/L0 (%)Irradiation temperature (°C)
Damage(dpa.g) N112 (3-D) (//) N112 (3-D) (�) DMS 678 (2-D) (//) DMS 678 (2-D) (�)
420 0.8 -0.5 -0.4 -0.6 0620 1 -0.4 -0.4 -0.8 +0.2820 1 -0.5 -0.4 -1.4 -0.3
1 000 1 -0.6 -0.4 -1.9 +2.71 000 1.8 -1.1 +0.3 -3.3 +5.7
Generally, well-graphitised 3-D carbon/carbon composites irradiated at 1 dpa.g show dimensional shrinkage lower than 0.5% in the temperature range 350-850�C. The best irradiation temperature window to obtain the lower dimensional changes in carbon/carbon composites is 500/600�C. Beyond 600�C, carbon/carbon composites’ dimensional changes increase as irradiation temperature increases. At 1 000�C, the neutron damage limit is about 2 dpa.g (2.6 � 1021 cm–2 (E > 0.1 MeV)); at 1 500�C the neutron damage limit should be lower than 0.5 dpa.g (6.6 � 1020 cm–2 (E > 0.1 MeV)) (Figure 15) [16].
Carbon/carbon composites thermal conductivity before irradiation is generally much higher than that of graphite. For some 1-D carbon/carbon composites, it can be as high as 600 W.m–1.K–1 at 25�Cin the direction parallel to the fibres. As for graphites, an increase of the irradiation temperature leads to an increase of the normalised thermal conductivity at the irradiation temperature (Ki/K0)Tirr (Table 5).
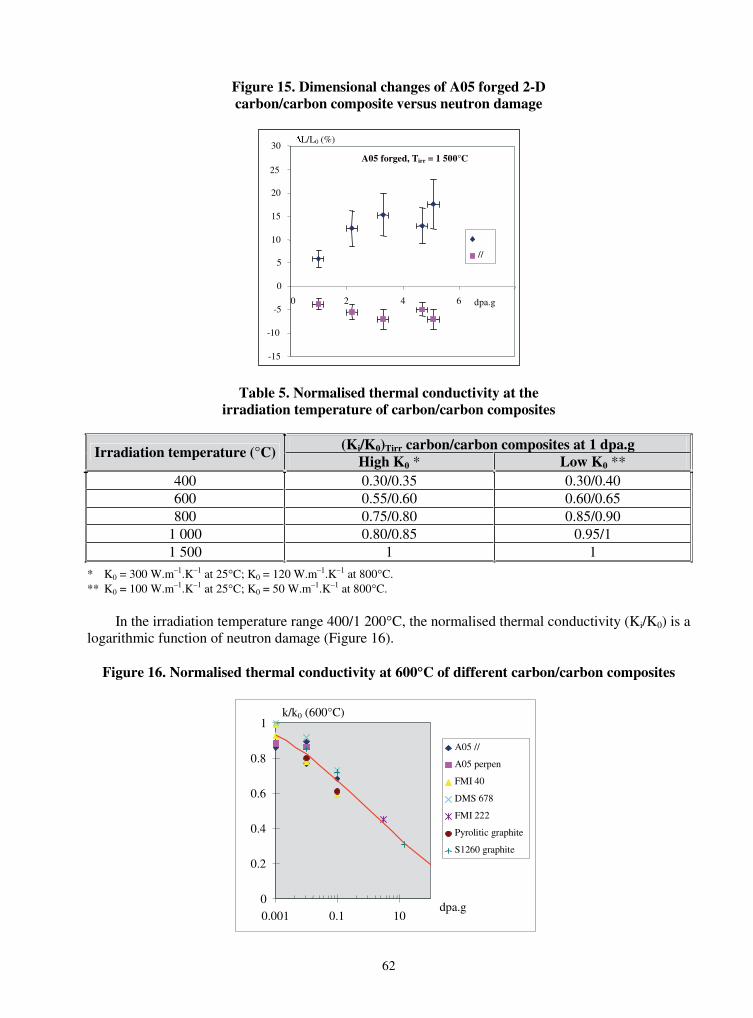
62
Figure 15. Dimensional changes of A05 forged 2-D carbon/carbon composite versus neutron damage
-15
-10
-5
0
5
10
15
20
25
30
0 2 4 6
�
//
�L/L0 (%)
dpa.g
A05 forged, Tirr = 1 500°C
Table 5. Normalised thermal conductivity at the irradiation temperature of carbon/carbon composites
(Ki/K0)Tirr carbon/carbon composites at 1 dpa.gIrradiation temperature (°C)High K0 * Low K0 **
400 0.30/0.35 0.30/0.40600 0.55/0.60 0.60/0.65800 0.75/0.80 0.85/0.90
1 000 0.80/0.85 0.95/11 500 1 1
* K0 = 300 W.m–1.K–1 at 25�C; K0 = 120 W.m–1.K–1 at 800�C.** K0 = 100 W.m–1.K–1 at 25�C; K0 = 50 W.m–1.K–1 at 800�C.
In the irradiation temperature range 400/1 200�C, the normalised thermal conductivity (Ki/K0) is a logarithmic function of neutron damage (Figure 16).
Figure 16. Normalised thermal conductivity at 600�C of different carbon/carbon composites
0
0.2
0.4
0.6
0.8
1
0.001 0.1 10
A05 //
A05 perpen
FMI 40
DMS 678
FMI 222
Pyrolitic graphite
S1260 graphite
k/k0 (600°C)
dpa.g

63
Ceramics
As far as specificities of GFR are considered, the main challenge is that the in-vessel structural materials will have to withstand important fast neutron fluences and/or high operating temperatures, 1 200�C under normal conditions and up to 1 650�C for in-core components under accident conditions. Since the best refractory metallic alloys must be eliminated in a fast core from neutronic requirements, ceramic or cermet materials will therefore be the reference option for in-core materials. For out-of-core structures and especially for the critical components working at the higher gas temperatures (850�C)special metal alloys having very special characteristics will have to be developed.
In-core structures
For the main in-core applications described here, the following inert structures are involved in the different fuel concepts:
� casing and hexagonal canning as well as gas tubing for, respectively, plate and block type composite fuel concepts;
� clad and wrapper for the solid solution pellet fuel concept;
� basket and supporting structures for the particle concept;
� subassembly structures for fast neutrons reflectors.
The operating conditions of these components are presently only roughly known:
� temperatures between about 490 and 1 200�C under normal operation, but up to 1 650�C in case of loss of coolant with depressurisation accident;
� maximal damages between 44 dpa (3 � 1 280 efpd) and 77 dpa (3 � 440 efpd) in a first stage, but higher for future advanced concepts;
� mechanical stresses probably low but diversified in nature (pressure, tension, fatigue, impact);
� environmental conditions via corrosion, at high temperature and under irradiation, by He impurities.
The target key properties of the in-core structural materials are listed below:
� fabricability in the final form and welding capabilities;
� initial and in-pile compatibility with He (and impurities) and actinide compound;
� physical, neutronic, thermal, He or gaseous fission products permeability, tensile, creep, fatigue and toughness adequate property: initial characteristics and assessment of their degradation under high neutron flux and dose;
� microstructure and phase stability under irradiation;
� irradiation creep, in-pile creep and swelling properties.
64
CEA material studies will be made preferentially on the most promising ceramic solutions to be chosen among carbides (preferred option) SiC and SiCfibre/SiC, ZrC and related composites, TiC, NbC, or other materials like nitrides (TiN, ZrN), oxides (MgO, Zr(Y)O2). The effort will also include inter-metallic compounds such as Zr3Si2 as promising candidates for the fast neutron reflector.
As monolithic micro-structured ceramics are well known to be brittle, important work will be carried out on the following solutions:
� nano-structured carbide ceramics SiC, then ZrC;
� SiC fibre reinforced SiC, then ZrC matrix;
� ceramic fibre reinforced ceramic and refractory metallic matrix;
� multi-coated, inter-penetrating skeletons or dispersed cermet materials where V, Cr, Nb or Mo could be the metallic part of the cermet option.
Out-of-core main structures
The main applications aimed toward here are the different internal structures belonging to the primary circuit, reactor vessel and main turbine components. These structures and their operating conditions are based on a VHTR reactor-type design and target properties as well as the candidate materials have been described above.
Milestones of the CEA R&D programme on structural materials
The present R&D programme has been adjusted to provide pertinent responses:
� by the years 2005-2006 or so to base feasibility of the GFR technology consisting, for structural materials, in designing, fabrication and characterisation of nuclear ceramic and metallic materials in a large range of products;
� around 2010 (then 2016) to validate, then to demonstrate the GFR concept via experimental irradiations of materials.
Conclusions
The development of materials optimised for the objectives of the VHTR to resolve the viability issues by 2010 of the VHTR includes the following steps:
� A good understanding of the materials’ behaviour in varied operating conditions leading to:
– the optimisation of 9% chromium steels for the vessel (2008);
– the validation of candidate materials (2008) beyond the super alloys available for the 2020 project, for the intermediate heat exchanger, the primary system and the internal structures of the reactor pressure vessel: Haynes 230 (< 950�C), ODS (PM2000) and ceramics (SiC) (> 1 000�C);

65
– the characterisation out-of-pile (2004-2006) and under irradiation in Osiris (2005-2007) of the best selected nuances of graphite;
– the selection (2008) of C/C materials for internal structures in the hot zones of the reactor (control rod sheath);
– the complements in the ASME code for the codification of mechanical design rules of structures at very high temperatures (2010).
� The development of compact high-temperature heat exchangers using the selected materials (2003-2006) and test of mock-ups on the technological loop from 2007 onward.
� The development of a conversion system using a gas turbine adapted to the conditions of the VHTR for the co-generation of electricity and hydrogen, and for the production of electricity only. Participation in the development of the turbo-compressor by the development fine modelling of gas flow in the machine, and materials for the disc (Udimet 720, Inconel 792 and CM 247) and for the blades of the turbine.
REFERENCES
[1] Chauvin, N., J.C. Garnier, J.L. Séran, P. Brossard, “Requirements for Fuel and Structural Materials for Gas-cooled Fast Reactor – Preliminary Design”, to be published in Proceedings of the 2003 International Congress on Advances in Nuclear Power Plants (ICAPP’03), Congress Palais, Cordoba, Spain 4-7 May 2003.
[2] Séran, J.L., J.C. Brachet, A. Alamo, Ferritic-martensitic Steels for Fast Reactors Cores, Encyclopedia of Materials: Science and Technology, Elsevier Science Ltd., ISBN 0-08-0431526,pp. 2863-2866 (2001).
[3] Klueh, R.L. and D.R. Harries, High-chromium Ferritic and Martensitic Steels for Nuclear Applications, ASTM Monograph 3, ASTM (2001).
[4] Brachet, J.C., V. Lambard, A. Alamo, “Studies of Phase Transformations Occurring in Conventional, Low Activation and ODS 7-11Cr – (mo, W, V, Nb, Ta) Martensitic Steels”, Proceedings of the Int. Conf. on Solid-solid Phase Transformations, Kyoto, Japan (1999).
[5] Graham, L.W., M.R. Everett, D. Lupton, F. Ridealgh, D.W. Sturge, M. Wagner-Löffler, “Environmental Conditions in HTRs and the Selection and Development of Primary Circuit Materials, Gas-cooled Reactors with Emphasis on Advanced Systems”, Symposium Proceedings,Jülich, 13-17 October 1975, IAEA, Vienna, Vol. 1, 319-352 (1976).
[6] Graham, L.W., “High-temperature Corrosion in Impure Helium Environments”, High Temperature Technology, 3, 1, 3-14 (1985).
66
[7] Quaddakers, W.J., H. Schuster, “Corrosion Behaviour of High-temperature Alloys in the Cooling Gas of High-temperature Reactors”, Proceedings of the Specialists Meeting on High-temperature Metallic Materials for Gas-cooled Reactors, Cracow, Poland, 20-23 June 1988, pp. 72-77.
[8] Warren, H., “Rapid Decarburization and Carburization in High-temperature Alloys in Impure Helium Environments”, High Temperature Technology, 4, 3/Aug., 119-130 (1986).
[9] Shindo, M., T. Kondo, “Evaporation Behavior of Hastelloy-X Alloys in Simulated Very High-temperature Reactor Environments”, Nuclear Technology, 66, 2/Aug., 429-438 (1984).
[10] Diehl, H., E. Bodmann, “Alloy 800 Specifications in Compliance with Component Requirements”, Journal of Nuclear Materials, 171, 63-70 (1990).
[11] Graham, L.W., “Corrosion of Metallic Materials in HTR-helium Environments”, Journal of Nuclear Materials, 171, 76-83 (1990).
[12] Tsuji, H., H. Nakajima, T. Kondo, “Current Status of Studies in High-temperature Metallic Materials for HTGR Applications in JAERI”, Proc. of the Specialists Meeting on High-temperature Metallic Materials for Gas-cooled Reactors, Cracow, Poland, 20-23 Jun 1988, pp. 81-90.
[13] Huchtemann, B., “The New Alloy Thermon 4972 (NiCr22W12Fe) for High-temperature Components of Gas-cooled Reactors”, Proceedings of the Workshop on Structural Design Criteria for HTR, Jülich, Germany, 31 Jan.-1 Feb. 1989, pp. 159-168.
[14] Bonal, J.P., O. Gelineau, J.C. Robin, “Les Structures en Graphite pour les Réacteurs à Haute Température”, SFEN Conference, Les Réacteurs à Haute Température: Un Nouvel Essor ?,Paris, 10-11 December 2002.
[15] Bonal, J.P., C.H. Wu, “Neutron Irradiation Effects on the Thermal Conductivity and the Dimensional Stability of Carbon Fiber Composites”, Physica Scripta, Vol. T 64, 26-31 (1996).
[16] Bonal, J.P., B. Thiele, G. Tsotridis, C.H. Wu, “Neutron Induced Dimensional Changes in Carbon Materials at High Temperatures and High Damage Doses”, Journal of Nuclear Materials,212-215, 1218-1222 (1994).
67
CURRENT STATUS OF THE INNOVATIVE BASIC RESEARCH ON HIGH-TEMPERATURE ENGINEERING USING THE HTTR
M. Ishihara1, T. Shibata1, S. Ishino2, T. Terai3, T. Ohoshima1, T. Oku4,Y. Motohashi5, M. Yamaha2, T. Shikama6, C. Mori7 and S. Shiozawa1
1Japan Atomic Energy Research Institute 2Tokai University
3University of Tokyo 4University of the Air
5Ibaraki University 6Tohoku University
7Aichi Institute of Technology
Abstract
JAERI’s High-temperature Engineering Test Reactor (HTTR) aims to further establish and upgrade HTGR technologies as well as the innovative basic research in the field of high-temperature engineering. An overview of the current status of the innovative basic research is briefly described in this paper. Study is concentrated on the three following fields:
1) New materials development. Scientific and technological significance and methods have been investigated for the three following research subjects: neutron transmission doping (NTD) of a high temperature SiC semiconductor, irradiation modification of high-temperature oxide superconductors (HTSC) and research on irradiation damage in heat-resistant ceramic composite materials.
2) Fusion-related research. Preliminary tests on surface and functional properties of a solid tritium breeder under irradiation have been carried out to measure in situ irradiation-induced property changes. This study is concerned with the physicochemical properties of lithium oxide ceramics for the fusion reactor blanket.
3) High-temperature in-core instrumentation development. Efforts have been made to develop optical fibres with heat- and radiation-resistant systems as well as other devices to detect neutron and gamma-ray spectra at high temperatures.
JAERI is preparing for the first HTTR irradiation in 2004 and will pursue international collaboration regarding new materials development in the field of high-temperature engineering.

68
Introduction
The HTTR is the first high-temperature gas-cooled reactor in Japan constructed by the Japan Atomic Energy Research Institute (JAERI). The aim of the HTTR is to establish and upgrade HTGR technology and perform an irradiation test for innovative basic research in the field of high-temperature engineering as shown in Figure 1. For the establishment of HTGR technology, basic data concerning reactor performance is to be accumulated on fuel integrity, helium gas leakage and so on over a period of long-term operation. As concerns the upgrading of HTGR technology, several research and development activities are to be performed in the field of evaluation of reactor performance on core physics and thermal analysis, etc., safety demonstration tests under simulated accident conditions, development of the process heat application system and so on. For the innovative basic research preliminary studies have been underway since 1994 under the aegis of the Utilisation Committee chaired by Prof. S. Ishino.
Figure 1. Research and development using HTTR
� ������ � ��� �� ����� ��� ��� �� ������� ��� ����� ��� � ��
��� ��� � ���� � � ����� ����� ���
������� �� � ����� ����� ���
��� � ��� � �� � � �� � �� ������� � � � ������
� ��� � ��� �� � ���� ������� ���
UnIted S sat te
���� ��� ��� �� � ����� ���
�������� ����� ���
���� � ��� � ��� ���� ������ � ��� � �� ���
� ����� � ��� �� � �� ���� ��� ��
��� � ��������������� �� � � !��� ����� �������������� ��� � ���� �� ����
����
�"#� �� � ���� �� ���� � ������� ���
����� �� � ��� � ����
����� � ���������� � ��� � � ����
����������� ������������ ������������������������������ �������������������������������
Verification of safetyImprovement of economy
Establishment ofHTGR technology
Upgrading ofHTGR technology
Constructionof HTTR
Operation andtesting of HTTR
R&D of nuclearheat technology
Innovative basicresearch on
high-temperatureengineering
Production of clean energy
Enlargement of heat utilisationImprovement of thermal efficiency
Creation of new technology
Contribution toinnovative projects
Aerospace technology
Fusion reactor technology
Department of HTTR project Department of advancednuclear heat technology
HTTR
Construction of the HTTR began in 1991; it achieved its first criticality on 10 November 1998 and the full core loading in December 1998. The full power of 30 MW with an outlet coolant temperature of 850�C was achieved in March 2002. A maximum outlet coolant temperature of 950�C will be attained in 2003. The major specifications of the HTTR are listed in Table 1. The operational schedule of the HTTR is shown in Figure 2.�
Current activities of the innovative basic research
HTTR Utilisation Research Committee [1-4]
The innovative basic research concerns the association of basic science and technology with high temperature irradiation environments. The direction of research involves novel and bold challenges both in nuclear and non-nuclear fields. The innovative basic research on high-temperature engineering is one of the key subjects using the HTTR as well as other research reactors.
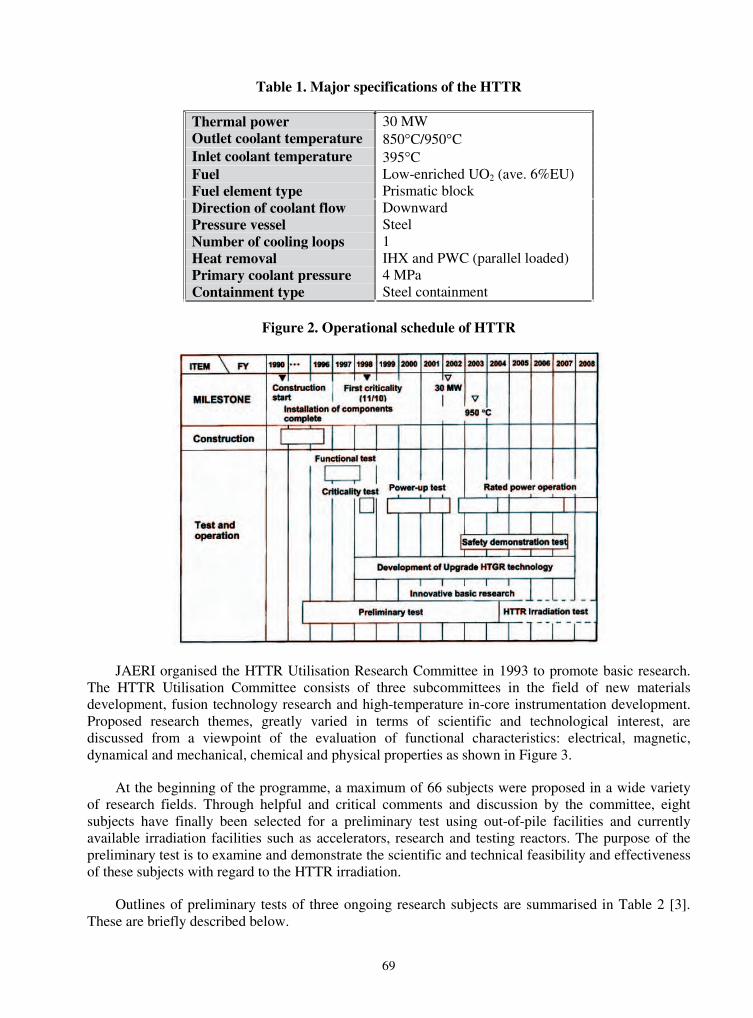
69
Table 1. Major specifications of the HTTR
Thermal power 30 MW Outlet coolant temperature 850�C/950�C�Inlet coolant temperature 395�C�Fuel Low-enriched UO2 (ave. 6%EU) Fuel element type Prismatic block Direction of coolant flow Downward Pressure vessel Steel Number of cooling loops 1Heat removal IHX and PWC (parallel loaded) Primary coolant pressure 4 MPa Containment type Steel containment
Figure 2. Operational schedule of HTTR
JAERI organised the HTTR Utilisation Research Committee in 1993 to promote basic research. The HTTR Utilisation Committee consists of three subcommittees in the field of new materials development, fusion technology research and high-temperature in-core instrumentation development. Proposed research themes, greatly varied in terms of scientific and technological interest, are discussed from a viewpoint of the evaluation of functional characteristics: electrical, magnetic, dynamical and mechanical, chemical and physical properties as shown in Figure 3.
At the beginning of the programme, a maximum of 66 subjects were proposed in a wide variety of research fields. Through helpful and critical comments and discussion by the committee, eight subjects have finally been selected for a preliminary test using out-of-pile facilities and currently available irradiation facilities such as accelerators, research and testing reactors. The purpose of the preliminary test is to examine and demonstrate the scientific and technical feasibility and effectiveness of these subjects with regard to the HTTR irradiation.
Outlines of preliminary tests of three ongoing research subjects are summarised in Table 2 [3]. These are briefly described below.
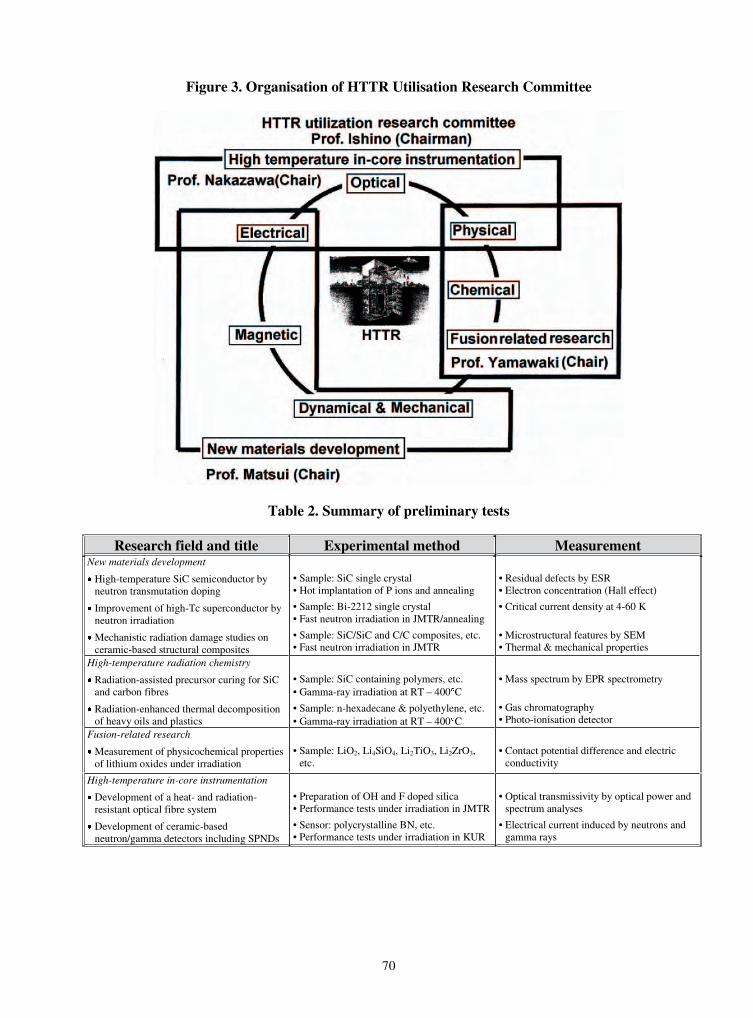
70
Figure 3. Organisation of HTTR Utilisation Research Committee
Table 2. Summary of preliminary tests
Research field and title Experimental method Measurement New materials development
� High-temperature SiC semiconductor by neutron transmutation doping
� Improvement of high-Tc superconductor by neutron irradiation
� Mechanistic radiation damage studies on ceramic-based structural composites
• Sample: SiC single crystal • Hot implantation of P ions and annealing
• Sample: Bi-2212 single crystal • Fast neutron irradiation in JMTR/annealing
• Sample: SiC/SiC and C/C composites, etc. • Fast neutron irradiation in JMTR
• Residual defects by ESR • Electron concentration (Hall effect)
• Critical current density at 4-60 K
• Microstructural features by SEM • Thermal & mechanical properties
High-temperature radiation chemistry
� Radiation-assisted precursor curing for SiC and carbon fibres
� Radiation-enhanced thermal decomposition of heavy oils and plastics
• Sample: SiC containing polymers, etc. • Gamma-ray irradiation at RT – 400�C
• Sample: n-hexadecane & polyethylene, etc.• Gamma-ray irradiation at RT – 400�C
• Mass spectrum by EPR spectrometry
• Gas chromatography • Photo-ionisation detector
Fusion-related research
� Measurement of physicochemical properties of lithium oxides under irradiation
• Sample: LiO2, Li4SiO4, Li2TiO3, Li2ZrO3,• etc.
• Contact potential difference and electric • conductivity
High-temperature in-core instrumentation
� Development of a heat- and radiation-resistant optical fibre system
� Development of ceramic-based neutron/gamma detectors including SPNDs
• Preparation of OH and F doped silica • Performance tests under irradiation in JMTR
• Sensor: polycrystalline BN, etc. • Performance tests under irradiation in KUR
• Optical transmissivity by optical power and• spectrum analyses
• Electrical current induced by neutrons and • gamma rays
71
Current results of innovative basic research
New materials development
Scientific and technological significance and method have been investigated for three research subjects in the field of new materials development. This research field is at a technical level deserving concrete investigations for the HTTR irradiation. Major results are summarised in Table 3.
Table 3. Major results obtained on new material development
Subject Objective Countermeasure Results Post-annealing:
1 873 K > T > 1 773 K Hot implantation:
1 473 K > T > 1 073 K
High-temperature semiconductor SiC
Enhancement of carrier concentration
Decrease in residual effects
Enhancement 100%
Post-annealing at 673 K �f: 1022m–2
High-temperature superconductor Bi2Sr2CaCu2Ox
Enhancement of Jc Jc: Critical current density
Rearrangement of residual effects
Enhancement > Ten times
(at 40 K) Ceramics composite
C-, SiC- Mechanistic approach
(mesoscopic) Under way Under way
Neutron Transmutation Doping (NTD) of high-temperature semiconductor [5,6]
The decrease of impurities in silicon carbide (SiC), which can be applied to high-temperature, high-power and high-speed switching devices, is a very important issue to be solved regarding the practical application of SiC. SiC is not readily permeable to impurity elements through the conventional diffuse method. On the other hand, phosphorus (P) transmutation doping (NTD) of P using thermal neutrons is recognised to be a promising method. The 30Si (natural abundance 3.1%) is transmuted into 31Si (half-life 2.62 h) by a thermal-neutron capture reaction, followed by � decay to 31P (stable) which acts as a shallow electron donor in SiC.�
As a preliminary test, after implantation with N, P and Al ions at temperatures ranging from 1 073 K to 1 473 K and subsequently annealing at higher temperatures ranging from 1 773 K to 1 873 K, residual defects of 3C-SiC (cubic) and 6H-SiC (hexagonal) films were annealed out by increasing the implantation temperature up to 1 473 K. This anneal-out is explained as the formation of an amorphous island-like structure. Amorphous island-like structures in SiC after room implantation contain impurity P atoms as well as point defects. The island structures are not readily recovered during annealing at high temperatures and even after the annealing. In contrast, such amorphous island structures are not formed in high-temperature implantation, and therefore radiation-induced defects are almost perfectly recovered by the post-implantation annealing at higher temperatures. Almost 100% activation of the impurity atoms, therefore, can be achieved by the high-temperature implantation or neutron irradiation with subsequent annealing. Figure 4 shows the implantation concentration effect on carrier concentration with annealing treatment at 1 773 K [5].
Several kinds of apparatuses for post-irradiation examinations (PIEs) of SiC semiconductors are being carried out at JAERI’s JMTR Hot Laboratory. The Hall effect apparatus and annealing furnace up to 1 973 K are installed in a hot experimental room. Currently, the first post-annealing data is being obtained on SiC samples irradiated in the JMTR as a preliminary neutron irradiation test.
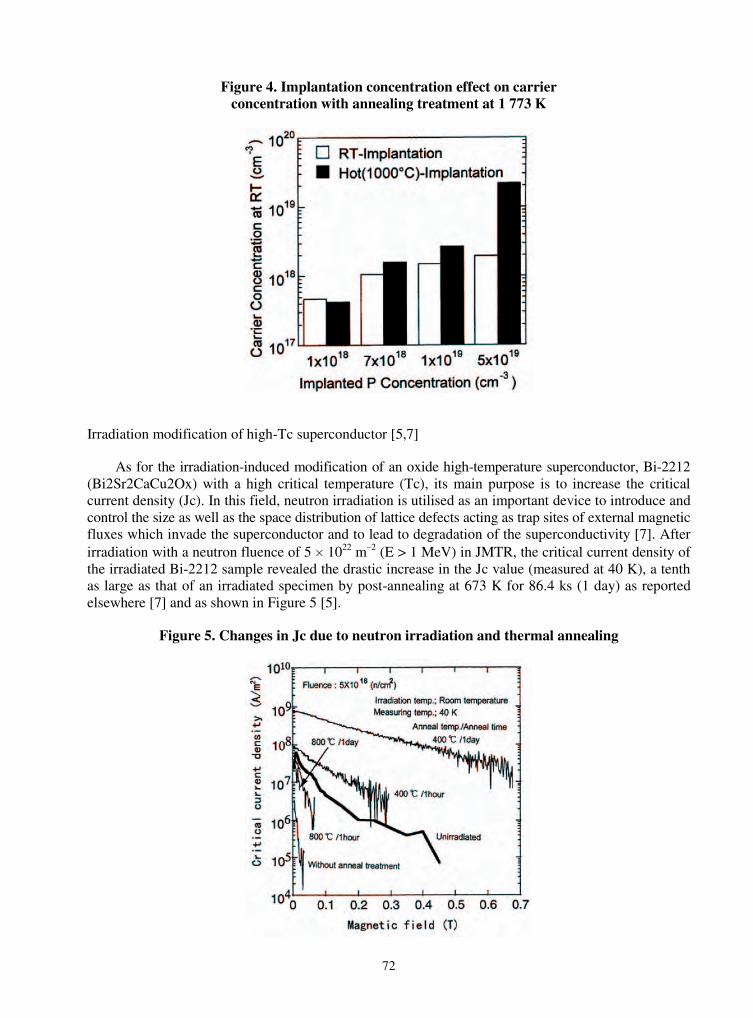
72
Figure 4. Implantation concentration effect on carrier concentration with annealing treatment at 1 773 K
Irradiation modification of high-Tc superconductor [5,7]
As for the irradiation-induced modification of an oxide high-temperature superconductor, Bi-2212 (Bi2Sr2CaCu2Ox) with a high critical temperature (Tc), its main purpose is to increase the critical current density (Jc). In this field, neutron irradiation is utilised as an important device to introduce and control the size as well as the space distribution of lattice defects acting as trap sites of external magnetic fluxes which invade the superconductor and to lead to degradation of the superconductivity [7]. After irradiation with a neutron fluence of 5 � 1022 m–2 (E > 1 MeV) in JMTR, the critical current density of the irradiated Bi-2212 sample revealed the drastic increase in the Jc value (measured at 40 K), a tenth as large as that of an irradiated specimen by post-annealing at 673 K for 86.4 ks (1 day) as reported elsewhere [7] and as shown in Figure 5 [5].
Figure 5. Changes in Jc due to neutron irradiation and thermal annealing
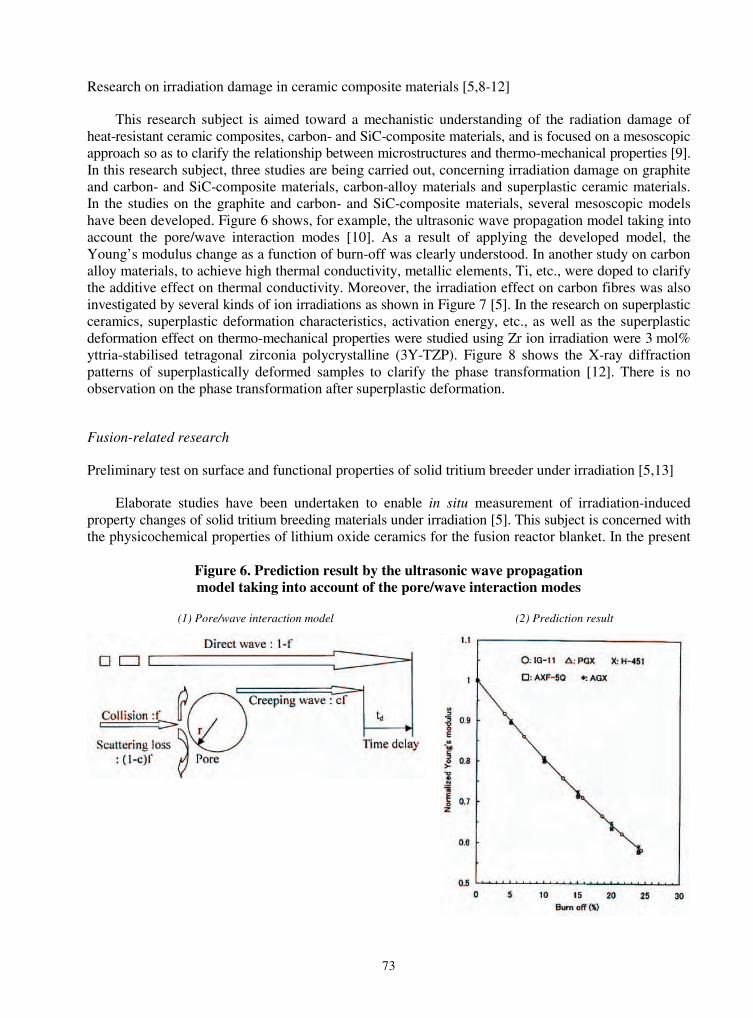
73
Research on irradiation damage in ceramic composite materials [5,8-12]
This research subject is aimed toward a mechanistic understanding of the radiation damage of heat-resistant ceramic composites, carbon- and SiC-composite materials, and is focused on a mesoscopic approach so as to clarify the relationship between microstructures and thermo-mechanical properties [9]. In this research subject, three studies are being carried out, concerning irradiation damage on graphite and carbon- and SiC-composite materials, carbon-alloy materials and superplastic ceramic materials. In the studies on the graphite and carbon- and SiC-composite materials, several mesoscopic models have been developed. Figure 6 shows, for example, the ultrasonic wave propagation model taking into account the pore/wave interaction modes [10]. As a result of applying the developed model, the Young’s modulus change as a function of burn-off was clearly understood. In another study on carbon alloy materials, to achieve high thermal conductivity, metallic elements, Ti, etc., were doped to clarify the additive effect on thermal conductivity. Moreover, the irradiation effect on carbon fibres was also investigated by several kinds of ion irradiations as shown in Figure 7 [5]. In the research on superplastic ceramics, superplastic deformation characteristics, activation energy, etc., as well as the superplastic deformation effect on thermo-mechanical properties were studied using Zr ion irradiation were 3 mol% yttria-stabilised tetragonal zirconia polycrystalline (3Y-TZP). Figure 8 shows the X-ray diffraction patterns of superplastically deformed samples to clarify the phase transformation [12]. There is no observation on the phase transformation after superplastic deformation.
Fusion-related research
Preliminary test on surface and functional properties of solid tritium breeder under irradiation [5,13]
Elaborate studies have been undertaken to enable in situ measurement of irradiation-induced property changes of solid tritium breeding materials under irradiation [5]. This subject is concerned with the physicochemical properties of lithium oxide ceramics for the fusion reactor blanket. In the present
Figure 6. Prediction result by the ultrasonic wave propagation model taking into account of the pore/wave interaction modes
(1) Pore/wave interaction model (2) Prediction result

74
Figure 7. C-ion irradiation effect on tensile strength for several kinds of carbon fibres
Figure 8. X-ray diffraction patterns of superplastically deformed samples of 3Y-TZP

75
test, in situ measurement of a contact potential difference (CPD) on the surface and of the bulk electrical conductivity of oxide ceramic materials can firstly be measured by using the experimental apparatus. Reasonable results are obtained by in situ measurement of work function on surface reaction. Figure 9 shows the work function change of Ni due to MeV H and He ion irradiation as a function of irradiation fluence [13]. This sophisticated system is useful in quantifying the irradiation-induced surface- and bulk-damages in lithium oxides as candidates of the tritium breeding materials and can be applied to nuclear and non-nuclear field by using the effective cut of irradiation-induced noise.
Figure 9. Work function change of Ni due to MeV H and He ion irradiation as a function of irradiation fluence
High-temperature in-core instrumentation
Efforts have been made to develop optical fibres with a heat- and radiation-resistance system as well as other devices for detection of neutron and gamma-ray spectra at high temperatures.
Development of a heat- and radiation-resistant optical fibre system [5,14-16]
The optical fibres to be doped fluorine (F) or hydroxyl group (OH) were newly developed with radiation resistance. In these fibres, optical loss reveals quite a lower value through the media rather than that of the conventional type of SiO2 fibre. From the recent irradiation experiments, the effect of neutron irradiation on optical fibre system with the light-emitting source made of high-purity alumina (sapphire) was investigated in JMTR and it reveals high potential to be a sensitive and effective tool for real-time detecting of optical transmission at temperatures up to 1 273 K and intensity of gamma ray of 5 � 103 Gys–1. Figure 10 shows the example of temperature monitoring by fused silica core optical fibre under JMTR high-temperature irradiation [16]. In the present stage, radioluminescence phenomena of several kinds of ceramics including the rare earth elements are systematically investigated by the JMTR irradiation test.
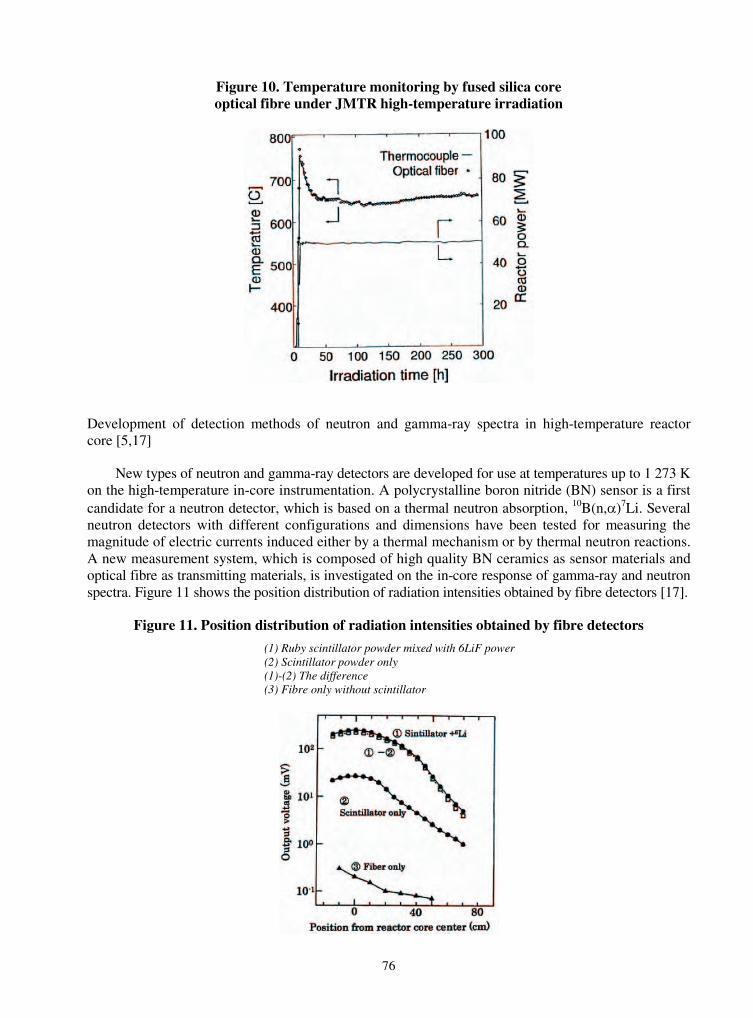
76
Figure 10. Temperature monitoring by fused silica core optical fibre under JMTR high-temperature irradiation
Development of detection methods of neutron and gamma-ray spectra in high-temperature reactor core [5,17]
New types of neutron and gamma-ray detectors are developed for use at temperatures up to 1 273 K on the high-temperature in-core instrumentation. A polycrystalline boron nitride (BN) sensor is a first candidate for a neutron detector, which is based on a thermal neutron absorption, 10B(n,�)7Li. Several neutron detectors with different configurations and dimensions have been tested for measuring the magnitude of electric currents induced either by a thermal mechanism or by thermal neutron reactions. A new measurement system, which is composed of high quality BN ceramics as sensor materials and optical fibre as transmitting materials, is investigated on the in-core response of gamma-ray and neutron spectra. Figure 11 shows the position distribution of radiation intensities obtained by fibre detectors [17].
Figure 11. Position distribution of radiation intensities obtained by fibre detectors
(1) Ruby scintillator powder mixed with 6LiF power (2) Scintillator powder only (1)-(2) The difference (3) Fibre only without scintillator
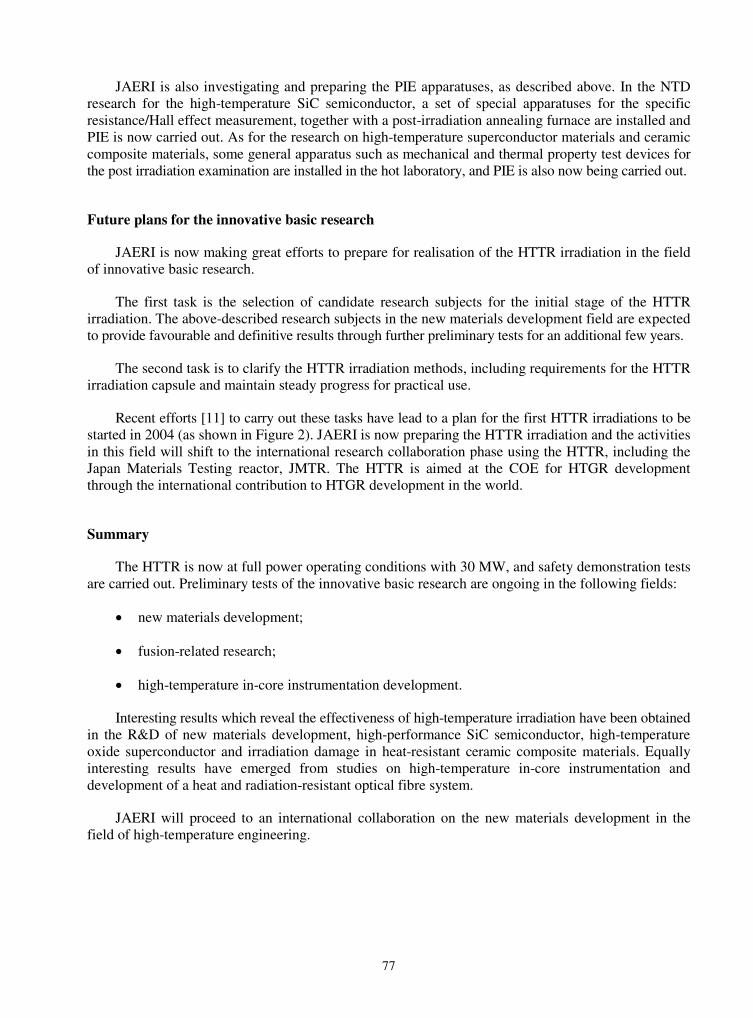
77
JAERI is also investigating and preparing the PIE apparatuses, as described above. In the NTD research for the high-temperature SiC semiconductor, a set of special apparatuses for the specific resistance/Hall effect measurement, together with a post-irradiation annealing furnace are installed and PIE is now carried out. As for the research on high-temperature superconductor materials and ceramic composite materials, some general apparatus such as mechanical and thermal property test devices for the post irradiation examination are installed in the hot laboratory, and PIE is also now being carried out.
Future plans for the innovative basic research
JAERI is now making great efforts to prepare for realisation of the HTTR irradiation in the field of innovative basic research.
The first task is the selection of candidate research subjects for the initial stage of the HTTR irradiation. The above-described research subjects in the new materials development field are expected to provide favourable and definitive results through further preliminary tests for an additional few years.
The second task is to clarify the HTTR irradiation methods, including requirements for the HTTR irradiation capsule and maintain steady progress for practical use.
Recent efforts [11] to carry out these tasks have lead to a plan for the first HTTR irradiations to be started in 2004 (as shown in Figure 2). JAERI is now preparing the HTTR irradiation and the activities in this field will shift to the international research collaboration phase using the HTTR, including the Japan Materials Testing reactor, JMTR. The HTTR is aimed at the COE for HTGR development through the international contribution to HTGR development in the world.
Summary
The HTTR is now at full power operating conditions with 30 MW, and safety demonstration tests are carried out. Preliminary tests of the innovative basic research are ongoing in the following fields:
� new materials development;
� fusion-related research;
� high-temperature in-core instrumentation development.
Interesting results which reveal the effectiveness of high-temperature irradiation have been obtained in the R&D of new materials development, high-performance SiC semiconductor, high-temperature oxide superconductor and irradiation damage in heat-resistant ceramic composite materials. Equally interesting results have emerged from studies on high-temperature in-core instrumentation and development of a heat and radiation-resistant optical fibre system.
JAERI will proceed to an international collaboration on the new materials development in the field of high-temperature engineering.

78
Acknowledgements
The authors are deeply indebted to university members on the innovative basic research, to members of the HTTR Utilisation Research Committee of JAERI, Professor Hideki Matsui of Tohoku University, Professor M. Nakazawa of the University of Tokyo and Professor Takao Hayashi of Tokai University, and to those of the Special Committee of the Atomic Energy Society of Japan.
Thanks are also due to JAERI members Dr. T. Tanaka, Dr. K. Hayashi, Dr. T. Arai, Mr. T. Kikuchi, Dr. K. Sawa, Mr. M. Niimi, Mr. S. Baba, Mr. T. Takahashi and Ms. J. Aihara, for their co-operation and encouragement.
REFERENCES
[1] Japan Atomic Energy Research Institute, Present Status of HTGR Research & Development(1996).
[2] Japan Atomic Energy Research Institute, Present Status of HTGR Research & Development(2000).
[3] Ishino, S., et al., An Investigation of High Temperature Irradiation Test Program of New Ceramic Materials, JAERI-Review 99-019 (1999) [in Japanese].
[4] HTTR Utilization Research Committee, Results and Future Plans for the Innovative Basic Research on High Temperature Engineering, JAERI-Review 2001-016 (2001) [in Japanese].
[5] HTTR Utilization Research Committee, Results and Future Plans for the Innovative Basic Research, JAERI-Review 2001-016, 2001 [in Japanese].
[6] Abe, K., T. Ohshima, H. Itoh, Y. Aoki, M. Yoshikawa, I. Nishiyama and M. Iwami, Materials Science Forum, 264-268, pp. 721-724 (1998).
[7] Terai, T., “Modification of HTSC by High-temperature Neutron Irradiation in HTTR”, Proceedings of the 1st Information Exchange Meeting on Basic Studies on High-temperature Engineering, Paris, France, 27-29 September 1999, pp. 319-329.
[8] Ishihara, M., S. Baba, J. Aihara, T. Arai, K. Hayashi and S. Ishino, “A Preliminary Study on Radiation Damage Effect in Ceramics Composite Materials as Innovative Basic Research Using the HTTR”, Proc. 6th Asian Symposium on Research Reactors, JAERI-Conf. 99-006 (1999), pp. 207 212.
[9] Ishihara, M., S. Baba, J. Aihara, T. Arai, K. Hayashi and S. Ishino, “Radiation Damage on Ceramics Composites as Structural Materials”, Proc. of the 1st Information Exchange Meeting on Basic Studies on High-temperature Engineering, Paris, France, 27-29 September 1999, pp. 299-308.
79
[10] Ishihara, M., T. Shibata, T. Takahashi, S. Baba and T. Hoshiya, “Understanding of Mechanical Properties of Graphite on the Basis of Mesoscopic Microstructure”, Proceedings of the 2nd
Information Exchange Meeting on Basic Studies on High-temperature Engineering, Paris, France, 10-12 October 2001, pp. 225-242.
[11] Oku, T., A. Kurumada, T. Sogabe, T. Hiraoka and T. Oku, “Improvement of Thermal Conductivity at High Temperatures for Carbon Materials Used for Plasma Facing Components”, Proceedings of the 1st Information Exchange Meeting on Basic Studies on High-temperature Engineering, Paris, France, 27-29 September 1999, pp. 285-298.
[12] Ishihara, M., T. Shibata, S. Baba, T. Hoshiya, C. Wan and Y. Motohashi, “Effects of Superplastic Deformation on Thermal and Mechanical Properties of 3Y-TZP Ceramics”, Proceedings of the 2nd Information Exchange Meeting on Basic Studies on High-temperature Engineering, Paris, France, 10-12 October 2001, pp. 113-124.
[13] Yamawaki, M., K. Yamaguchi, A. Suzuki, T. Yokota, G.N. Luo and K. Hayashi, “Development of a New Method for High-temperature In-core Characterisation of Solid Surfaces”, Proceedingsof the 1st Information Exchange Meeting on Basic Studies on High-temperature Engineering,Paris, France, 27-29 September 1999, pp. 357-364.
[14] Shikama, T., T. Kakuta, M. Narui, M. Ishihara, T. Sagawa and T. Arai, “Application of Optical Fibres for Optical Diagnostics in High-temperature Gas-cooled Reactor”, Proc. OECD/NEA Workshop on High-temperature Research Facilities and Experiments, ECN Petten, Netherlands, 12-14 November 1997, pp. 125-144.
[15] Shikama, T., M. Ishihara, T. Kakuta, N. Shamoto, K. Hayashi and S. Ishino, “Development of Heat- and Radiation-resistant Optical Fibres”, Proc. of the 1st Information Exchange Meeting on Basic Studies on High-temperature Engineering, Paris, France, 27-29 September 1999, pp. 379-386.
[16] Shikama, T., M. Narui, T. Kakuta, M. Ishihara, K. Hayashi, T. Sagawa and T. Hoshiya, “Application of Optical Diagnostics in High-temperature Gas-cooled Systems”, Proceedings of the 2nd Information Exchange Meeting on Basic Studies on High-temperature Engineering,Paris, France, 10-12 October 2001, pp. 153-160.
[17] Mori, C., A. Uritani, T. Kakuta, M. Katagiri, T. Shikama, M. Nakazawa, T. Iguchi, J. Kawarabayashi, I. Kimura, H. Kobayashi and S. Hayashi, “Measurement Method of In-core Neutron and Gamma-ray Distributions with Scintillator Optical Fibre Detector and Self-powered Detector”, Proc. of the 2nd Information Exchange Meeting on Basic Studies on High-temperature Engineering, Paris, France, 10-12 October 2001, pp.161-166.

81
SESSION II
Basic Studies on Behaviour of Irradiated Graphite/Carbon Including their Composites
Chairs: B. Marsden, T. Oku

83
HIGH-TEMPERATURE REACTOR MATERIALS: PROGRESS OF HTR-M PROJECTS
D. Buckthorpe, M. Davies NNC Ltd., UK
R. CouturierCommissariat à l’Énergie Atomique (CEA), France
J. van der Laan, J. Hegeman, A. Vreeling Nuclear Research and Consultancy Group (NRG), Netherlands
B. Riou FRAMATOME ANP, France
H. Rantala European Commission, Joint Research Centre (JRC), Institute for Energy, Netherlands
P. Ennis, G. Haag, K. Kuhn Forschungszentrum Jülich GmbH (FZJ.ISR), Germany
A. Buenaventura Empresarios Agrupados Internacional S A (EASA.MD), Spain
B-C. Friedrich FRAMATOME ANP (GmbH), Germany
Abstract
HTR projects have been launched within the 5th Framework Programme of the European Commission to consolidate and advance HTR technology in Europe. This paper considers the mid-term results from the project HTR-M, which looks at the materials requirements for the HTR reactor pressure vessel, the high-temperature resistant alloys for the internal structures and turbine, and graphite for the reactor core. The programme of work includes irradiation testing of vessel steel and graphite materials, and the main focus of the paper is on the progress of this test work.
84
Introduction
The HTR-M project is one of a cluster of projects being performed within the European Union 5th Framework Programme [1] investigating research and development issues connected with the high-temperature reactor (HTR). The HTR-M project focuses on the selection and development of materials for the key components of the HTR, namely, the reactor pressure vessel, the high-temperature structures (specifically the turbine) and the graphite core. This work started in November 2000 and involves seven partners from five European countries [2]. Additional materials activities (HTR-M1) were started in 2001 to introduce medium-term creep tests for the turbine materials and begin a programme of testing on the irradiation properties of graphites. Both projects extend over a period of four years and are being co-ordinated through the direction of a European HTR Technical Network (HTR-TN). This paper gives a brief outline of the HTR-M/M1 programme and presents and discusses some of the mid-term results and ongoing actions, focusing especially on the irradiation tests being performed on vessel steel and graphites.
HTR M & M1 projects
The main elements of the work programmes are summarised below:
� Vessel (RPV)
� Review existing materials used in gas-cooled reactors and previous high-temperature reactors.
� Set up a materials database on design properties (which will lead to identification of data omissions for future R& D testing).
� Carry out specific tests on welded joints under irradiated and non-irradiated conditions.
Fabrication and the effects of irradiation/environment on the vessel weld behaviour are considered crucial issues in determining the structural viability of the material for future RPV application.
� Turbine (disc and blade)
� Review existing materials used in gas-cooled reactors and previous high-temperature reactors.
� Set up a materials database on design properties (which covers a few potential materials for each component).
� Perform specific tests on selected materials [carbon/carbon (C/C) composites, high-alloy steels] at temperature and under short and intermediate times in air, vacuum and helium.
The main concern is the ability of the material to withstand the temperatures and conditions in the direct cycle environment. Creep and effects of helium on properties and strength are crucial issues.
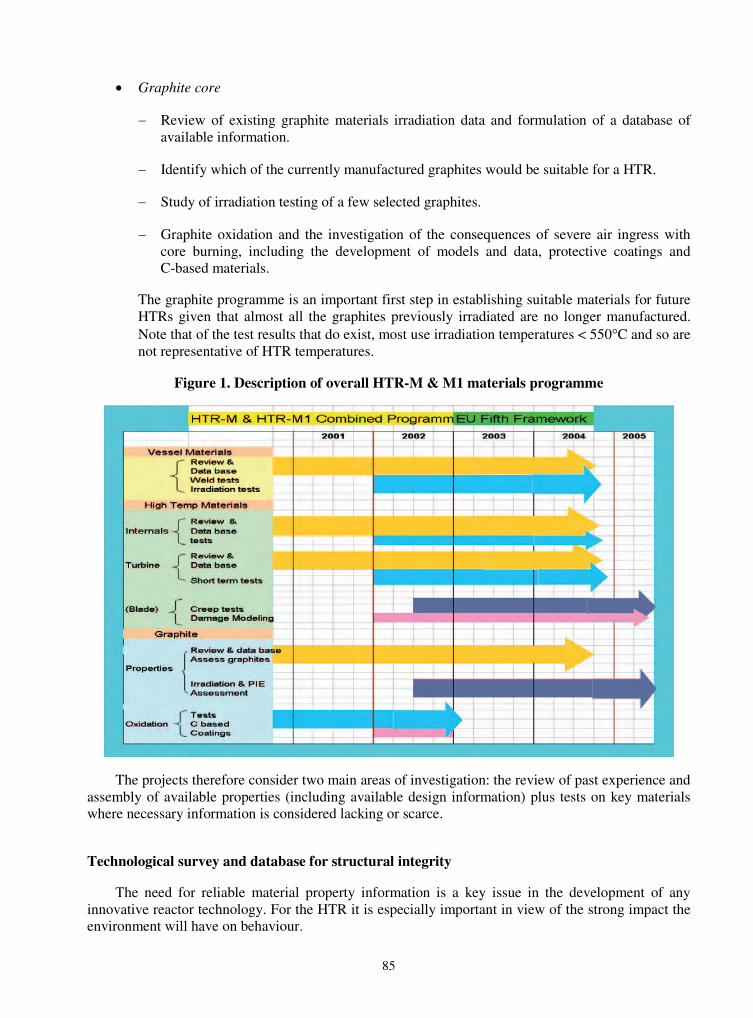
85
� Graphite core
� Review of existing graphite materials irradiation data and formulation of a database of available information.
� Identify which of the currently manufactured graphites would be suitable for a HTR.
� Study of irradiation testing of a few selected graphites.
� Graphite oxidation and the investigation of the consequences of severe air ingress with core burning, including the development of models and data, protective coatings and C-based materials.
The graphite programme is an important first step in establishing suitable materials for future HTRs given that almost all the graphites previously irradiated are no longer manufactured. Note that of the test results that do exist, most use irradiation temperatures < 550�C and so are not representative of HTR temperatures.
Figure 1. Description of overall HTR-M & M1 materials programme
The projects therefore consider two main areas of investigation: the review of past experience and assembly of available properties (including available design information) plus tests on key materials where necessary information is considered lacking or scarce.
Technological survey and database for structural integrity
The need for reliable material property information is a key issue in the development of any innovative reactor technology. For the HTR it is especially important in view of the strong impact the environment will have on behaviour.
86
Vessel
For the reactor pressure vessel, the assurance of safety is of paramount importance. HTR vessel materials will operate at temperatures higher than 450�C and information on materials behaviour during manufacture, in the operating environment (neutron-irradiation fluence, operational temperature and helium environment) and welding are needed to assure integrity. Two vessel options are considered in the technological survey:
� The “cold” vessel design concept adopted for the PBMR reactor pressure vessel uses a Mn-Ni-Mo or C-Mn type steel with grades similar to SA 508 Class 2. The advantage for these steels is the large experience that can be taken from PWR vessel technology and design rules.
� The “warm” vessel concept adopted for the GT-MHR reactor pressure vessel leads to the choice of Cr-Mo steels with modified 9Cr1Mo steel grades similar to ASME Grade 91 being a prime candidate. For the GT-MHR the operating conditions are around 400-460�C with potential temperature excursions up to 570�C.
Thermal and mechanical loads, in combination with environmental conditions, can enhance degradation and can have a significant effect on reliability. The main safety and structural integrity concerns are at the vessel welds, at thicker sections, hot spots, the belt line and regions important to functionality. Fracture, fatigue and creep-fatigue (depending on temperature) are the main damage mechanisms and degradation mechanisms (irradiation, thermal ageing, temper-embrittlement and corrosion) the main environmental considerations. The effects of irradiation on the toughness of LWR steels have been studied extensively elsewhere. The major effect is an increase in the ductile brittle transition temperature (DBTT) due to the combined effects of matrix hardening and grain boundary weakening. This is often associated with the residual elements phosphorus (P) and copper (Cu). For LWR this threat is generally considered to be significant when irradiation causes a change from ductile to brittle fracture at temperatures within the operational envelope. For the warm vessel option, no data are available for modified 9Cr1Mo steel irradiated under conditions expected for the HTR. Information has however been obtained at much higher doses (� 1 dpa) and these show a strong effect of irradiation temperature in the range 250-450�C. Effects may be small on �DBTT at 400-440�C but measurable at 350°C. There is no information on the behaviour of modified 9Cr 1Mo steel welds.
On thermal ageing embrittlement (TAE) the base materials and weld metals of both cold and warm HTR vessel steels normally have very fine grain sizes and therefore the most likely embrittlement location is the coarse-grained heat-affected zone. This is a narrow region adjacent to the fusion boundary where temperatures of 1 100-1 300�C are reached during welding. Cold vessels operate at temperatures below the embrittlement range (350-550�C) so thermal ageing embrittlement is only possible during transients involving exposure to higher temperatures for tens or hundreds of hours. Warm vessels on the other hand operate in the TAE temperature range throughout their lifetime and therefore TAE is of greater concern with regard to vessel integrity.
For corrosion, the main concerns are metal loss/carburisation/decarburisation due to actions of the impurities in the helium coolant. For the HTR vessel, metal losses will be either by controlled carburisation in cold wall vessels, and decarburisation combined with internal oxidation in warm wall vessels. The kinetics of these processes determine the effective metal loss.
For the developing database, materials such as C-Mn steels (as used in the UK Magnox and AGR types), SA 508 Grade 3 Class 1 (LWR) or its European equivalent, 2¼ Cr-1Mo steel as used on HTTR and modified 9Cr1Mo are considered. The potential for 12Cr steels will also be investigated. Aspects

87
such as composition, manufacturing information, test and design data plus operating environment are included in the database. The materials property database includes code data where available, and raw data for analysis. Modified 9Cr1Mo steel has the most uncertainty on data and fabrication experience with respect to HTR characteristics and is potentially more widely applicable. Hence this material was selected for the irradiation test programme. Significant amounts of data exist for all these steels and the main focus is on comparisons and assembling relevant design data. Management of the database is via a web-based system to allow remote access by all the partners and to maintain secure transfer of information between the different partners and countries.
Turbine (disc and blade)
For the turbine, high temperatures (850-900�C) and long-term endurance (60 000 h) are key issues. The main concerns are creep and the influence of the environment. Manufacturing considerations are especially important for the disc and blades. Candidate alloys for the disc must have good forging properties and proven thermal stability. For the blades, cast material is not sufficient; therefore, directionally solidified or single crystal alloys have to be considered. The review suggests that the need for cooling is an important issue for both disc and blades. For current disc materials temperature limits are in the region of 750�C, suggesting that a cooled disc could be necessary for the design.
The impact of corrosion is also an important selection criterion for the turbine disc and blade materials. The helium coolant gas used in an HTR contains small levels of impurities (H2, H2O, CO, CO2) at low partial pressures; these can interact with the core graphite and metallic components and cause some degradation of their properties. Low concentrations of H2O and H2 are produced by leakage and/or desorption from both metal surfaces and graphite. CO, CO2, and CH4 may be produced by coolant/graphite reactions at high temperatures. Depending on the partial pressure of the impurities the resulting atmosphere can either be oxidising or carburising for the selected materials.
Damage may be either at the surface or may diffuse to significant depths in the metallic matrices (internal oxidation or carburisation or de-carburisation) resulting in a loss of mechanical properties over a significant thickness of the material. As with the RPV, phase diagrams are used to determine the neutrality of the chemical activity and to determine whether compatibility issues are likely to have a strong impact on materials selection. For Ni-based alloys phase diagrams were constructed based on Cr levels. Typical zones for carburisation and de-carburisation and formation of protective oxidation were identified at different temperatures and used to aid materials selection.
Impurities in helium atmospheres, arising from decomposition of methane under extremely low oxygen partial pressures, are heavily carburising and can cause a significant shortening of the material creep life and accelerated creep crack growth rates. The presence of alloying elements such as cobalt (which is in most of the currently available turbine disc and blade materials) is difficult to avoid. The main issues are the potential for plate-out and lift-off of particles and their activation and prevention of going through the core.
The review and database work identified some potential materials to be considered for the experiments. Investigation of turbine disc materials revealed Udimet 720 to be the best currently available candidate that would not require significant manufacturing development. For the perceived endurance this is thought to have a temperature ceiling of around 700-750�C and is likely to require cooling. Two DS grades of material were selected for the blade tests (CM 247 LC as an Al oxide former and IN 792 as a Cr oxide former). Because of corrosion considerations, the current view is that any blades may have to be coated for long life. The choice of coating remains to be made and tested in a future Framework Programme. Adoption of a cobalt-free material was not considered a priority.
88
For the reactor internals, material selection is based on the ability to resist the effects of irradiation at the highest gas temperatures. Such materials [e.g. AISI type 316 steel, Alloy 800H (control rod) and Hastalloy XR] have to cope with high thermal strains arising from power changes and load following requirements. AISI type 316 steel is normally used for components operating at temperatures up to 550-600�C and the other two, which have been extensively investigated for the HTTR, for higher temperatures (750�C). For the control rod, which compensates for fuel burn-up and power variation reactivity effects and is also used to control the reactor operation under fast normal operating modes and to shut down the reactor system, available metallic materials (such as alloy 800H) are considered to be at their operating limit. New carbon-based materials are being considered as alternatives. Such materials are expected to give potential for improved reactivity control during shutdown and for allowing the normal operating temperatures of future reactors to be increased.
A synthesis of possible carbon-based materials was carried out to aid selection and to provide information on irradiated and non-irradiated properties for assessment and database purposes. The findings show that the properties are largely an-isotropic and are severely degraded by neutron irradiation, the level of degradation being dependent on irradiation and temperature levels. From the references studied, only limited information on irradiation-induced properties were available although some general trends in behaviour were seen in properties such as thermal conductivity and thermal resistivity. Also, the high cost and limited supply of suitably manufactured material was prohibitive.
Graphite core
Graphite behaviour has important safety implications because of structural and property changes that occur when it is irradiated. Information on behaviour is crucial and design/material property data under HTR relevant conditions is needed for candidate materials for both normal and accident conditions. The most important considerations are component integrity and changes in core geometry, both of which are affected by the fast neutron-induced dimensional change that graphite exhibits. Many of the graphites used in previous core designs are no longer available and there has been a serious decline in the ability to manufacture nuclear-grade graphite in large quantities. Today’s HTGR projects – HTTR (Japan) and HTR-10 (China) – use a Japanese graphite (IG-110) which has a high strength and is suitable for exchangeable core components where low fast neutron fluences and low total doses are applicable.
In the past, only a small number of irradiation programmes have looked at the effects of irradiation on the behaviour of graphites at high temperatures, i.e. > 600�C. Two of the most significant were for the European Dragon HTR programme and the German HTR programme. Unfortunately most of the data obtained by other countries are confidential and cannot therefore be published in the open literature. This review and collection of graphite properties considers the published information plus available internal information within the project partners. The data relevant to the irradiation temperature and neutron fluence domains for new HTRs will largely come from the new proposed tests, and will need to be built up for each graphite grade. The database of information will contain appropriate details of the graphite, i.e. grade, manufacturer, coke source, grain size and manufacturing method.
For the HTR-M programme three main graphite manufacturers were approached to see which graphites could be offered for the next generations of reactors. Five graphites were selected and identified for the programme: three isomoulded and two extruded graphites, manufactured from pitch coke and petroleum coke with a range of grain sizes (1 mm down to 10 �m). One of these, IG110 (an isomoulded graphite made using a petroleum coke and used in HTTR and HTR-10) was selected since it has previously been irradiated at high temperature, although only to a small/medium fluence.
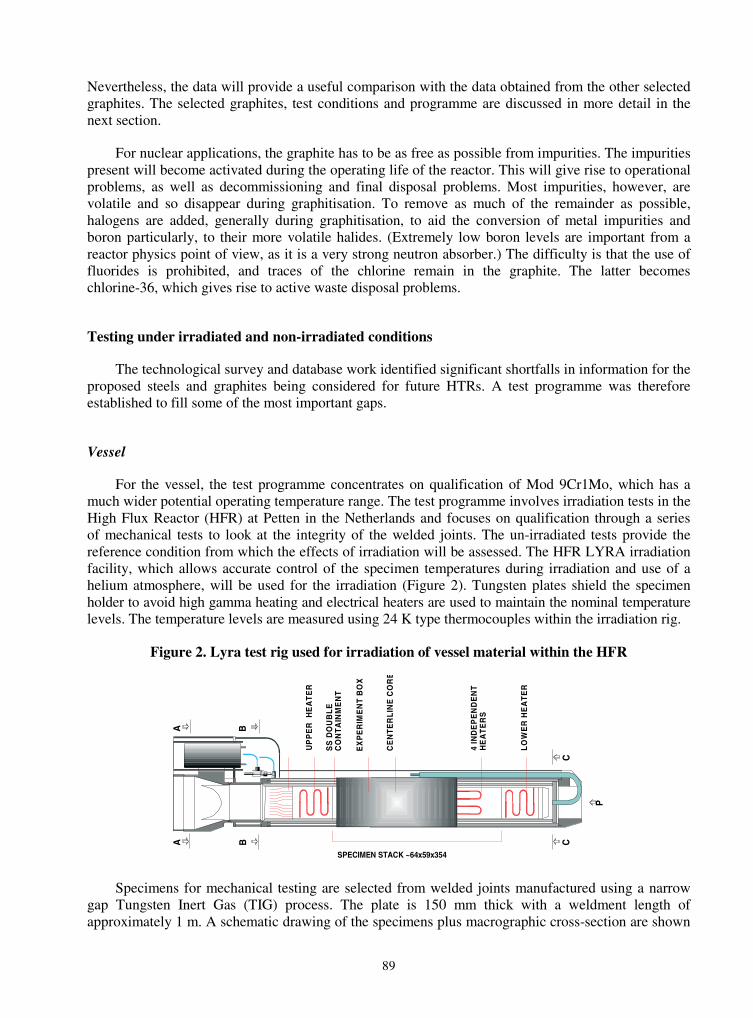
89
Nevertheless, the data will provide a useful comparison with the data obtained from the other selected graphites. The selected graphites, test conditions and programme are discussed in more detail in the next section.
For nuclear applications, the graphite has to be as free as possible from impurities. The impurities present will become activated during the operating life of the reactor. This will give rise to operational problems, as well as decommissioning and final disposal problems. Most impurities, however, are volatile and so disappear during graphitisation. To remove as much of the remainder as possible, halogens are added, generally during graphitisation, to aid the conversion of metal impurities and boron particularly, to their more volatile halides. (Extremely low boron levels are important from a reactor physics point of view, as it is a very strong neutron absorber.) The difficulty is that the use of fluorides is prohibited, and traces of the chlorine remain in the graphite. The latter becomes chlorine-36, which gives rise to active waste disposal problems.
Testing under irradiated and non-irradiated conditions
The technological survey and database work identified significant shortfalls in information for the proposed steels and graphites being considered for future HTRs. A test programme was therefore established to fill some of the most important gaps.
Vessel
For the vessel, the test programme concentrates on qualification of Mod 9Cr1Mo, which has a much wider potential operating temperature range. The test programme involves irradiation tests in the High Flux Reactor (HFR) at Petten in the Netherlands and focuses on qualification through a series of mechanical tests to look at the integrity of the welded joints. The un-irradiated tests provide the reference condition from which the effects of irradiation will be assessed. The HFR LYRA irradiation facility, which allows accurate control of the specimen temperatures during irradiation and use of a helium atmosphere, will be used for the irradiation (Figure 2). Tungsten plates shield the specimen holder to avoid high gamma heating and electrical heaters are used to maintain the nominal temperature levels. The temperature levels are measured using 24 K type thermocouples within the irradiation rig.
Figure 2. Lyra test rig used for irradiation of vessel material within the HFR
LO
WE
R H
EA
TE
R
4 IN
DE
PE
ND
EN
TH
EA
TE
RS
UP
PE
R H
EA
TE
R
SS
DO
UB
LE
CO
NT
AIN
ME
NT
CE
NT
ER
LIN
E C
OR
E
EX
PE
RIM
EN
T B
OX
SPECIMEN STACK ~64x59x354
CC
P
BB
AA
Specimens for mechanical testing are selected from welded joints manufactured using a narrow gap Tungsten Inert Gas (TIG) process. The plate is 150 mm thick with a weldment length of approximately 1 m. A schematic drawing of the specimens plus macrographic cross-section are shown
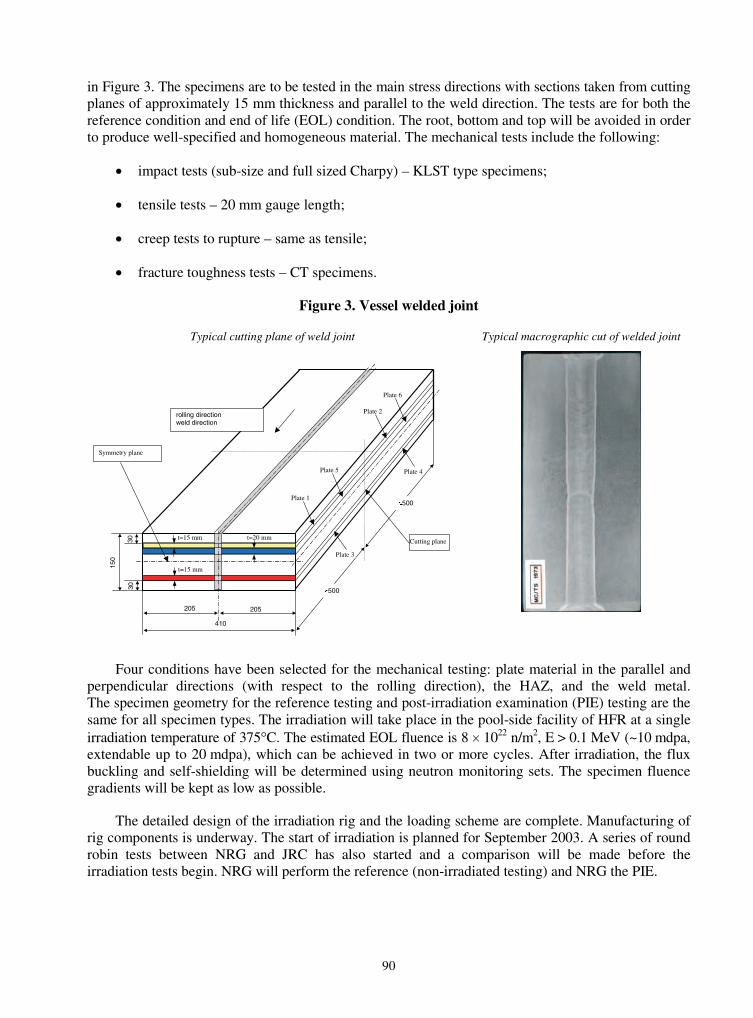
90
in Figure 3. The specimens are to be tested in the main stress directions with sections taken from cutting planes of approximately 15 mm thickness and parallel to the weld direction. The tests are for both the reference condition and end of life (EOL) condition. The root, bottom and top will be avoided in order to produce well-specified and homogeneous material. The mechanical tests include the following:
� impact tests (sub-size and full sized Charpy) – KLST type specimens;
� tensile tests – 20 mm gauge length;
� creep tests to rupture – same as tensile;
� fracture toughness tests – CT specimens.
Figure 3. Vessel welded joint
Typical cutting plane of weld joint Typical macrographic cut of welded joint
205 205
410
�500
rolling direction weld direction
150
Symmetry plane
�500
Cutting planet=15 mm
t=15 mm
t=20 mm
Plate 1
Plate 2
Plate 3
Plate 4Plate 5
Plate 6
3030
Four conditions have been selected for the mechanical testing: plate material in the parallel and perpendicular directions (with respect to the rolling direction), the HAZ, and the weld metal. The specimen geometry for the reference testing and post-irradiation examination (PIE) testing are the same for all specimen types. The irradiation will take place in the pool-side facility of HFR at a single irradiation temperature of 375�C. The estimated EOL fluence is 8 � 1022 n/m2, E > 0.1 MeV (~10 mdpa, extendable up to 20 mdpa), which can be achieved in two or more cycles. After irradiation, the flux buckling and self-shielding will be determined using neutron monitoring sets. The specimen fluence gradients will be kept as low as possible.
The detailed design of the irradiation rig and the loading scheme are complete. Manufacturing of rig components is underway. The start of irradiation is planned for September 2003. A series of round robin tests between NRG and JRC has also started and a comparison will be made before the irradiation tests begin. NRG will perform the reference (non-irradiated testing) and NRG the PIE.
91
Turbine (disc and blade)
Experiments on these materials will involve short- and intermediate-term tests. High-temperature short-term mechanical/creep tests are proposed for the turbine disc and blade materials in four simulated environments:
� as received with ageing heat treatment – I;
� de-carburised – II;
� carburised – III;
� after the carburisation or de-carburisation heat treatment – I (mod).
All tests will be carried out in air. Ageing will be carried out in an argon atmosphere, using oversize blanks. The test matrix and proposals for the test conditions will as far as possible bound the temperature and transient cases expected to be experienced by the turbine.
For the blade material two grades are being examined (IN 792 DS and CM 247 LC DS), and for the disc one grade (Udimet 720). Udimet 720 is considered to have potential for operation up to 700�Cand to be the best available material for this application using established manufacturing techniques. Manufacturing considerations are a key factor, and producing large ingots without porosity and segregation is a major challenge for the size of disc being considered. The tests on the disc material will be carried out at 700 and 750�C. For the turbine blade materials the current view is to avoid single crystal materials for the blades and to test two grades of directionally solidified materials (Cr and Al oxide formers) under tensile and creep conditions at temperatures up to 850�C. Procurement of suitable quantities of the materials is complete, and characterisation tests on the disc material have started. The duration of the intermediate creep tests is expected to be up to 3 000 h. Tests will include the disc and blade turbine material grades and aged samples. The setting-up of the test rig for treating the materials is in progress and conditioned specimens are expected to be available for testing by the end of 2003.
Graphite core
The graphite irradiation experiment (called INNOGRAPH) will use a test rig that allows distinct temperature levels to be obtained. The temperature range of interest is 550-950�C). A temperature of 750�C was selected for these first tests as it is in the middle of the range, and could correspond closely to the temperature at the peak flux position. The rig design requires the stacking of up to 150 samples, 8 mm diameter (either 6 or 12 mm in height), covering two main directions, i.e. with grain and against grain. For five selected graphites this gives15 samples per grade per direction. Pre- and post-irradiation measurements include specimen dimensions, Young’s modulus, coefficient of thermal expansion (CTE) and thermal conductivity.
The programme uses currently available graphites (including some that are recently developed). The development of a new material would take 3-5 years. The graphites selected for testing are given below in Table 1. Large graphite blocks have been delivered to NRG for sectioning and machining. The specimen shape is cylindrical with a flattened plane along its length. This plane is used to retain the z-direction of the original graphite blocks. Although five (major) grades of graphite have been selected for full testing in the experiment (shown in bold italics in Table 1), it was decided that it would be useful to have an early indication of the irradiation behaviour of some of the other candidate graphites. These will be included as “piggy-back” samples in the irradiation capsule. The (minor) graphites selected are shown in Table 1 in brackets.
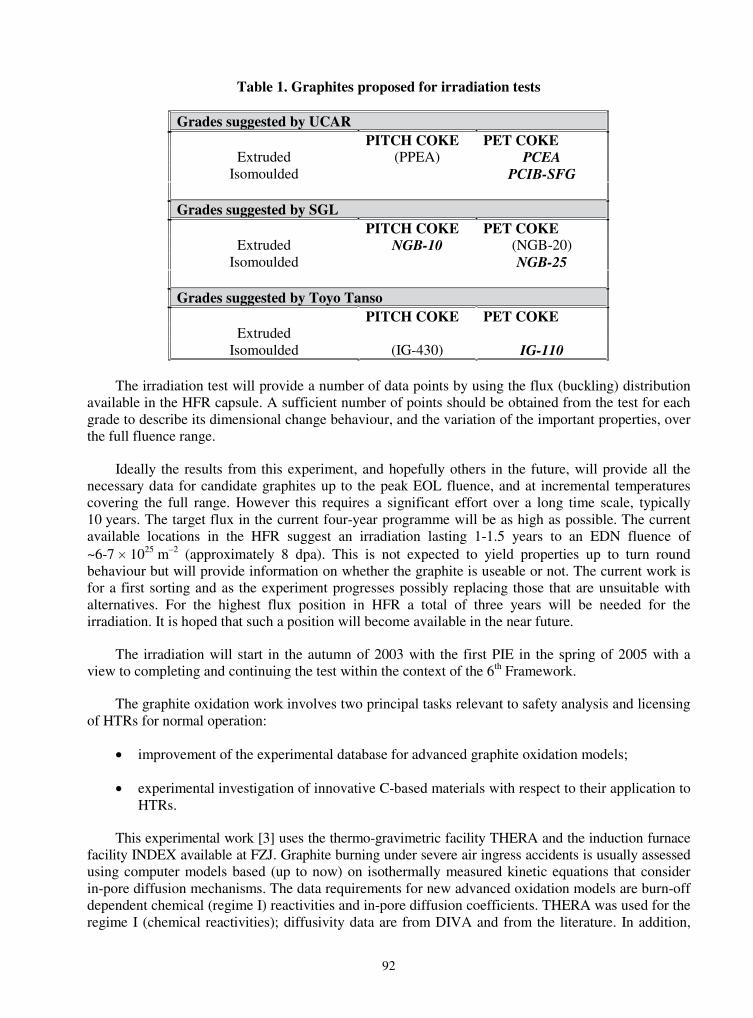
92
Table 1. Graphites proposed for irradiation tests
Grades suggested by UCAR PITCH COKE PET COKE
Extruded (PPEA) PCEAIsomoulded PCIB-SFG
Grades suggested by SGL PITCH COKE PET COKE
Extruded NGB-10 (NGB-20) Isomoulded NGB-25
Grades suggested by Toyo Tanso PITCH COKE PET COKE
Extruded Isomoulded (IG-430) IG-110
The irradiation test will provide a number of data points by using the flux (buckling) distribution available in the HFR capsule. A sufficient number of points should be obtained from the test for each grade to describe its dimensional change behaviour, and the variation of the important properties, over the full fluence range.
Ideally the results from this experiment, and hopefully others in the future, will provide all the necessary data for candidate graphites up to the peak EOL fluence, and at incremental temperatures covering the full range. However this requires a significant effort over a long time scale, typically 10 years. The target flux in the current four-year programme will be as high as possible. The current available locations in the HFR suggest an irradiation lasting 1-1.5 years to an EDN fluence of ~6-7 � 1025 m–2 (approximately 8 dpa). This is not expected to yield properties up to turn round behaviour but will provide information on whether the graphite is useable or not. The current work is for a first sorting and as the experiment progresses possibly replacing those that are unsuitable with alternatives. For the highest flux position in HFR a total of three years will be needed for the irradiation. It is hoped that such a position will become available in the near future.
The irradiation will start in the autumn of 2003 with the first PIE in the spring of 2005 with a view to completing and continuing the test within the context of the 6th Framework.
The graphite oxidation work involves two principal tasks relevant to safety analysis and licensing of HTRs for normal operation:
� improvement of the experimental database for advanced graphite oxidation models;
� experimental investigation of innovative C-based materials with respect to their application to HTRs.
This experimental work [3] uses the thermo-gravimetric facility THERA and the induction furnace facility INDEX available at FZJ. Graphite burning under severe air ingress accidents is usually assessed using computer models based (up to now) on isothermally measured kinetic equations that consider in-pore diffusion mechanisms. The data requirements for new advanced oxidation models are burn-off dependent chemical (regime I) reactivities and in-pore diffusion coefficients. THERA was used for the regime I (chemical reactivities); diffusivity data are from DIVA and from the literature. In addition,
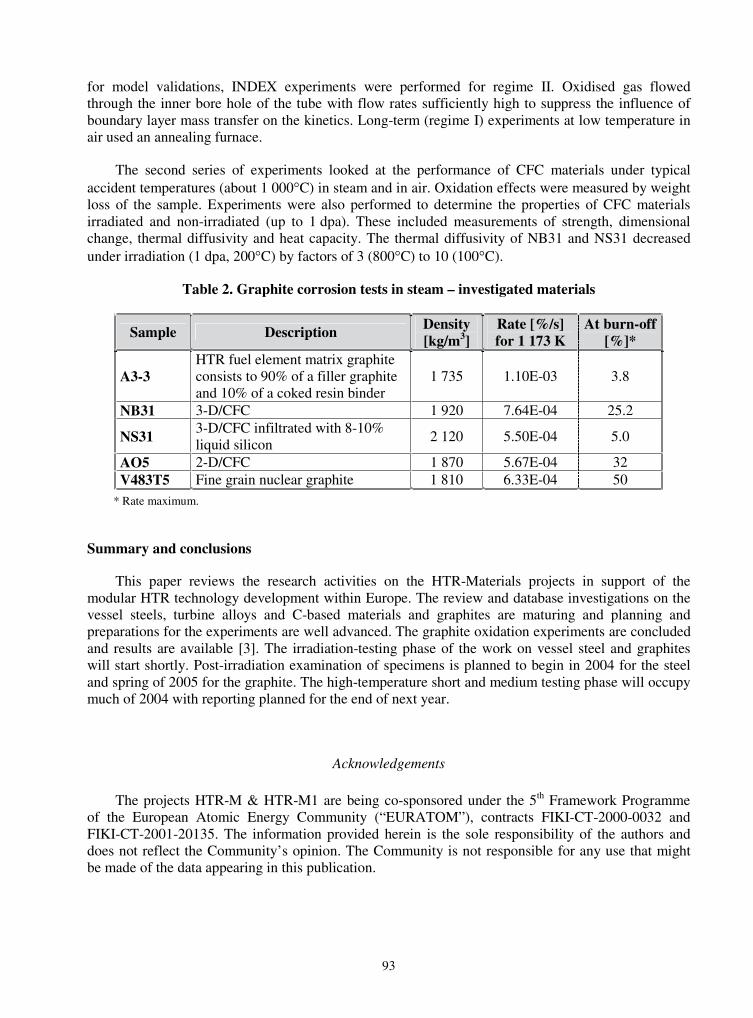
93
for model validations, INDEX experiments were performed for regime II. Oxidised gas flowed through the inner bore hole of the tube with flow rates sufficiently high to suppress the influence of boundary layer mass transfer on the kinetics. Long-term (regime I) experiments at low temperature in air used an annealing furnace.
The second series of experiments looked at the performance of CFC materials under typical accident temperatures (about 1 000�C) in steam and in air. Oxidation effects were measured by weight loss of the sample. Experiments were also performed to determine the properties of CFC materials irradiated and non-irradiated (up to 1 dpa). These included measurements of strength, dimensional change, thermal diffusivity and heat capacity. The thermal diffusivity of NB31 and NS31 decreased under irradiation (1 dpa, 200�C) by factors of 3 (800�C) to 10 (100�C).
Table 2. Graphite corrosion tests in steam – investigated materials
Sample Description Density [kg/m3]
Rate [%/s] for 1 173 K
At burn-off [%]*
A3-3 HTR fuel element matrix graphite consists to 90% of a filler graphite and 10% of a coked resin binder
1 735 1.10E-03 3.8
NB31 3-D/CFC 1 920 7.64E-04 25.2
NS313-D/CFC infiltrated with 8-10% liquid silicon
2 120 5.50E-04 5.0
AO5 2-D/CFC 1 870 5.67E-04 32 V483T5 Fine grain nuclear graphite 1 810 6.33E-04 50
* Rate maximum.
Summary and conclusions
This paper reviews the research activities on the HTR-Materials projects in support of the modular HTR technology development within Europe. The review and database investigations on the vessel steels, turbine alloys and C-based materials and graphites are maturing and planning and preparations for the experiments are well advanced. The graphite oxidation experiments are concluded and results are available [3]. The irradiation-testing phase of the work on vessel steel and graphites will start shortly. Post-irradiation examination of specimens is planned to begin in 2004 for the steel and spring of 2005 for the graphite. The high-temperature short and medium testing phase will occupy much of 2004 with reporting planned for the end of next year.
Acknowledgements
The projects HTR-M & HTR-M1 are being co-sponsored under the 5th Framework Programme of the European Atomic Energy Community (“EURATOM”), contracts FIKI-CT-2000-0032 and FIKI-CT-2001-20135. The information provided herein is the sole responsibility of the authors and does not reflect the Community’s opinion. The Community is not responsible for any use that might be made of the data appearing in this publication.

94
REFERENCES
[1] Martin-Bermejo, J., M. Hugon, G. Van Goethem, “Research Activities on High Temperature Gas-cooled Reactors (HTRs) in the 5th EURATOM RTD, Framework Programme”, Paper No. 1560, SMiRT 16, Washington DC, USA, 12-17 August 2001.
[2] Buckthorpe, D., R. Couturier, B. van der Schaaf, B. Riou, H. Rantala, R. Moormann, F. Alonso, B-C. Friedrich, “Investigation of High-temperature Reactor (HTR) Materials”, Proceedings of the 2nd Information Exchange Meeting on High-temperature Engineering, NEA/OECD, Paris, France, 10-12 October 2001.
[3] “Behaviour of Carbon-based Materials in Contact with Oxidising Gases”, Paper No. 3031, ICAPP 03 Conference, Cordoba, Spain, 4-7 May 2003.

95
NEUTRON IRRADIATION EFFECT ON THE DIMENSIONAL CHANGE OF GRAPHITE MATERIALS
Tadashi Maruyama The Wakasa Wan Energy Research Center Nagatani, Tsuruga, Fukui 914-0192 Japan
Abstract
This paper describes the results of neutron irradiation experiments on dimensional change of graphite materials irradiated in the Japan Materials Testing Reactor (JMTR) and the “JOYO” fast reactor. The specimens used in the JMTR irradiation were fine-grained isotropic graphites, a carbon/carbon composite and glassy carbon. They were neutron irradiated at temperatures from 200-400�C to fluences from 8.3 � 1022 to 7.4 � 1024n/m2 (E > 0.1 MeV). After neutron irradiation, the dimensional change and its annealing behaviour were investigated.
A review is provided of irradiation experiments for isotropic graphites irradiated in the “JOYO” fast reactor to fluences up to 2.4 � 1026 n/m2 (E > 0.1 MeV) at temperatures ranging from 550-600�C. Data concerning dimensional change, Young’s modulus and thermal diffusivity of IG-110 graphite are presented. An irradiation experiment for the isotropic graphite IG-110U and C/C composite CX-2002U and MFC-1 undertaken in the “JOYO” fast reactor is also discussed. The specimen size and irradiation conditions and general idea of post-irradiation experiment to be performed are described.
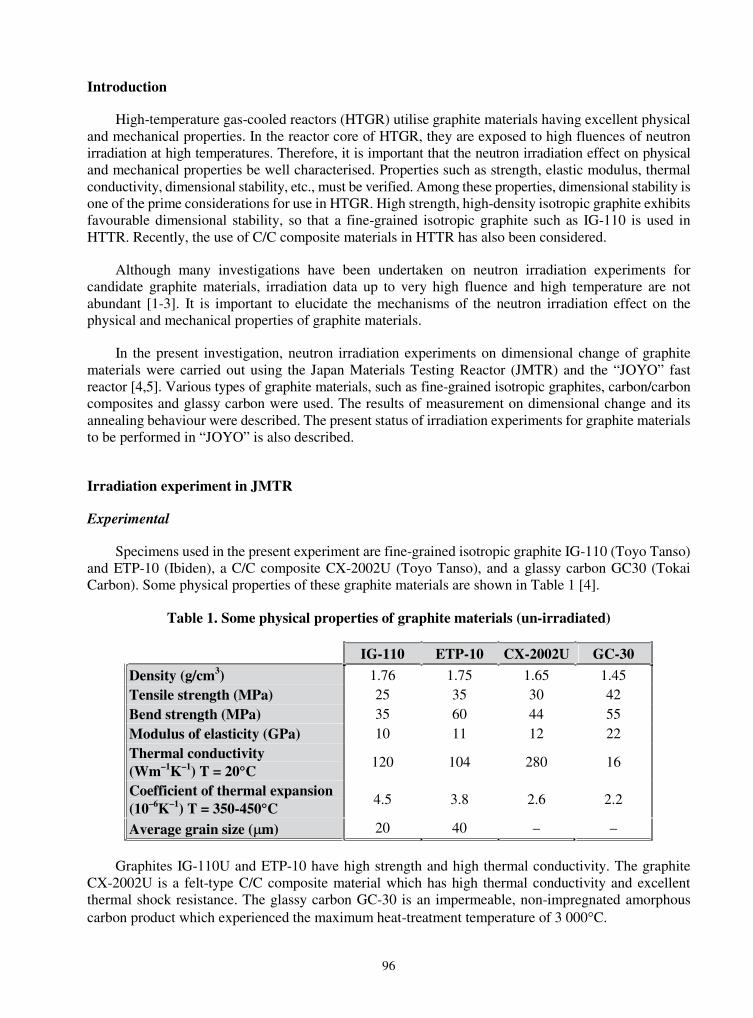
96
Introduction
High-temperature gas-cooled reactors (HTGR) utilise graphite materials having excellent physical and mechanical properties. In the reactor core of HTGR, they are exposed to high fluences of neutron irradiation at high temperatures. Therefore, it is important that the neutron irradiation effect on physical and mechanical properties be well characterised. Properties such as strength, elastic modulus, thermal conductivity, dimensional stability, etc., must be verified. Among these properties, dimensional stability is one of the prime considerations for use in HTGR. High strength, high-density isotropic graphite exhibits favourable dimensional stability, so that a fine-grained isotropic graphite such as IG-110 is used in HTTR. Recently, the use of C/C composite materials in HTTR has also been considered.
Although many investigations have been undertaken on neutron irradiation experiments for candidate graphite materials, irradiation data up to very high fluence and high temperature are not abundant [1-3]. It is important to elucidate the mechanisms of the neutron irradiation effect on the physical and mechanical properties of graphite materials.
In the present investigation, neutron irradiation experiments on dimensional change of graphite materials were carried out using the Japan Materials Testing Reactor (JMTR) and the “JOYO” fast reactor [4,5]. Various types of graphite materials, such as fine-grained isotropic graphites, carbon/carbon composites and glassy carbon were used. The results of measurement on dimensional change and its annealing behaviour were described. The present status of irradiation experiments for graphite materials to be performed in “JOYO” is also described.
Irradiation experiment in JMTR
Experimental
Specimens used in the present experiment are fine-grained isotropic graphite IG-110 (Toyo Tanso) and ETP-10 (Ibiden), a C/C composite CX-2002U (Toyo Tanso), and a glassy carbon GC30 (Tokai Carbon). Some physical properties of these graphite materials are shown in Table 1 [4].
Table 1. Some physical properties of graphite materials (un-irradiated)
IG-110 ETP-10 CX-2002U GC-30
Density (g/cm3) 1.76 1.75 1.65 1.45 Tensile strength (MPa) 25 35 30 42 Bend strength (MPa) 35 60 44 55 Modulus of elasticity (GPa) 10 11 12 22 Thermal conductivity (Wm–1K–1) T = 20�C
120 104 280 16
Coefficient of thermal expansion(10–6K–1) T = 350-450�C
4.5 3.8 2.6 2.2
Average grain size (�m) 20 40 – –
Graphites IG-110U and ETP-10 have high strength and high thermal conductivity. The graphite CX-2002U is a felt-type C/C composite material which has high thermal conductivity and excellent thermal shock resistance. The glassy carbon GC-30 is an impermeable, non-impregnated amorphous carbon product which experienced the maximum heat-treatment temperature of 3 000�C.
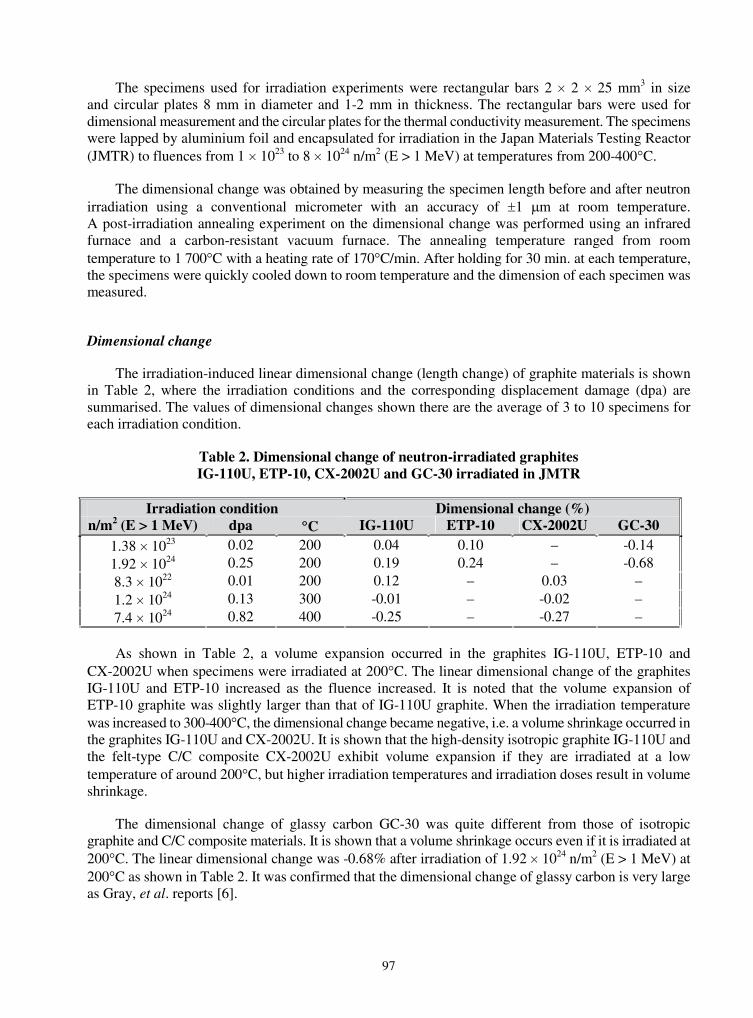
97
The specimens used for irradiation experiments were rectangular bars 2 � 2 � 25 mm3 in size and circular plates 8 mm in diameter and 1-2 mm in thickness. The rectangular bars were used for dimensional measurement and the circular plates for the thermal conductivity measurement. The specimens were lapped by aluminium foil and encapsulated for irradiation in the Japan Materials Testing Reactor (JMTR) to fluences from 1 � 1023 to 8 � 1024 n/m2 (E > 1 MeV) at temperatures from 200-400�C.
The dimensional change was obtained by measuring the specimen length before and after neutron irradiation using a conventional micrometer with an accuracy of �1 �m at room temperature. A post-irradiation annealing experiment on the dimensional change was performed using an infrared furnace and a carbon-resistant vacuum furnace. The annealing temperature ranged from room temperature to 1 700�C with a heating rate of 170�C/min. After holding for 30 min. at each temperature, the specimens were quickly cooled down to room temperature and the dimension of each specimen was measured.
Dimensional change
The irradiation-induced linear dimensional change (length change) of graphite materials is shown in Table 2, where the irradiation conditions and the corresponding displacement damage (dpa) are summarised. The values of dimensional changes shown there are the average of 3 to 10 specimens for each irradiation condition.
Table 2. Dimensional change of neutron-irradiated graphites IG-110U, ETP-10, CX-2002U and GC-30 irradiated in JMTR
Irradiation condition Dimensional change (%) n/m2 (E > 1 MeV) dpa �C IG-110U ETP-10 CX-2002U GC-30
1.38 � 1023 0.02 200 0.04 0.10 – -0.14 1.92 � 1024 0.25 200 0.19 0.24 – -0.68 8.3 � 1022 0.01 200 0.12 – 0.03 – 1.2 � 1024 0.13 300 -0.01 – -0.02 – 7.4 � 1024 0.82 400 -0.25 – -0.27 –
As shown in Table 2, a volume expansion occurred in the graphites IG-110U, ETP-10 and CX-2002U when specimens were irradiated at 200�C. The linear dimensional change of the graphites IG-110U and ETP-10 increased as the fluence increased. It is noted that the volume expansion of ETP-10 graphite was slightly larger than that of IG-110U graphite. When the irradiation temperature was increased to 300-400�C, the dimensional change became negative, i.e. a volume shrinkage occurred in the graphites IG-110U and CX-2002U. It is shown that the high-density isotropic graphite IG-110U and the felt-type C/C composite CX-2002U exhibit volume expansion if they are irradiated at a low temperature of around 200�C, but higher irradiation temperatures and irradiation doses result in volume shrinkage.
The dimensional change of glassy carbon GC-30 was quite different from those of isotropic graphite and C/C composite materials. It is shown that a volume shrinkage occurs even if it is irradiated at 200�C. The linear dimensional change was -0.68% after irradiation of 1.92 � 1024 n/m2 (E > 1 MeV) at 200�C as shown in Table 2. It was confirmed that the dimensional change of glassy carbon is very large as Gray, et al. reports [6].
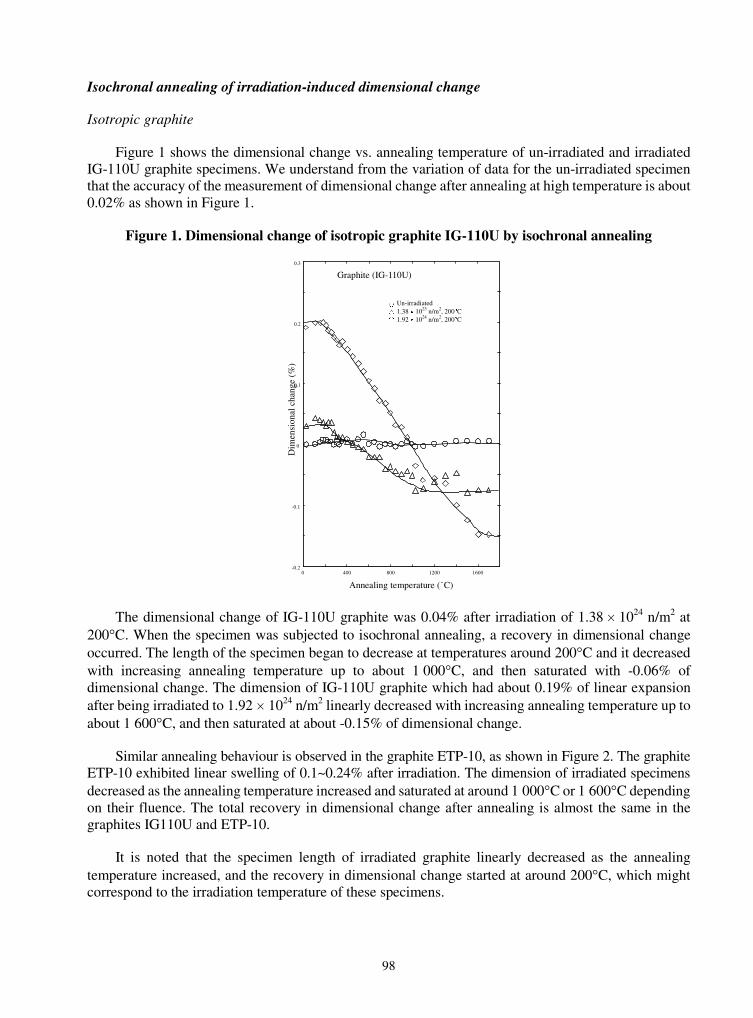
98
Isochronal annealing of irradiation-induced dimensional change
Isotropic graphite
Figure 1 shows the dimensional change vs. annealing temperature of un-irradiated and irradiated IG-110U graphite specimens. We understand from the variation of data for the un-irradiated specimen that the accuracy of the measurement of dimensional change after annealing at high temperature is about 0.02% as shown in Figure 1.
Figure 1. Dimensional change of isotropic graphite IG-110U by isochronal annealing
The dimensional change of IG-110U graphite was 0.04% after irradiation of 1.38 � 1024 n/m2 at 200�C. When the specimen was subjected to isochronal annealing, a recovery in dimensional change occurred. The length of the specimen began to decrease at temperatures around 200�C and it decreased with increasing annealing temperature up to about 1 000�C, and then saturated with -0.06% of dimensional change. The dimension of IG-110U graphite which had about 0.19% of linear expansion after being irradiated to 1.92 � 1024 n/m2 linearly decreased with increasing annealing temperature up to about 1 600�C, and then saturated at about -0.15% of dimensional change.
Similar annealing behaviour is observed in the graphite ETP-10, as shown in Figure 2. The graphite ETP-10 exhibited linear swelling of 0.1~0.24% after irradiation. The dimension of irradiated specimens decreased as the annealing temperature increased and saturated at around 1 000�C or 1 600�C depending on their fluence. The total recovery in dimensional change after annealing is almost the same in the graphites IG110U and ETP-10.
It is noted that the specimen length of irradiated graphite linearly decreased as the annealing temperature increased, and the recovery in dimensional change started at around 200�C, which might correspond to the irradiation temperature of these specimens.
-0.2
-0.1
0
0.1
0.2
0.3
0 400 800 1200 1600
Graphite (IG-110U)
Dim
ensi
onal
cha
nge
(%)
Annealing temperature (�C)
���Un-irradiated1.38 � 1023 n/m2, 200�C1.92 � 1024 n/m2, 200�C

99
Figure 2. Dimensional change of isotropic graphite ETP-10 by isochronal annealing
It is well known that similar recovery behaviour is often observed in silicon carbide [7-10]. Silicon carbide specimens irradiated by fast neutrons at temperatures below 1 000�C show swelling. When the neutron-irradiated silicon carbide is annealed at high temperatures, the length of the specimen began to decrease at around irradiation temperature. The onset of recovery is often used to determine the irradiation temperature of materials. The recovery behaviour of silicon carbide is interpreted in terms of annihilation of irradiation-induced defects by annealing at high temperatures.
However, there is a substantial difference in recovery of dimensional change between isotropic graphite and silicon carbide. When irradiated graphite samples were subjected to isochronal annealing, the dimensional change saturated at a negative value after annealing at around 1 600�C. The negative value is a volume shrinkage component of graphite materials generated by the neutron irradiation.
Thus, it is evident that there are two components in the dimensional change of irradiated graphite. One is a volume expansion component and the other is a shrinkage component. The dimensional change of irradiated graphite is determined by the sum of both components.
The behaviour of dimensional change of irradiated graphite is interpreted in terms of the irradiation-induced defects of graphite [3,11,12]. Neutron irradiation causes the displacement of carbon atoms from their equilibrium lattice positions into interstitial locations, leaving vacancies in the basal planes. Interstitials diffuse rapidly parallel to the layers of graphite crystals and recombine with vacancies. Surviving interstitials form various sized planar clusters between the original layer planes. The inter-layer interstitial clusters cause the crystals to expand in the c-direction, while the vacancies contract the crystals in the a-direction parallel to the layer plane.
If neutron irradiation is made at relatively low temperatures and fluences, a substantial fraction of irradiation-induced defects consists of small clusters of interstitials or vacancies. They produce net volume expansion and easily recombine during post-irradiation annealing as shown in the recovery
-0.2
-0.1
0
0.1
0.2
0.3
0 400 800 1200 1600
Graphite (ETP-10)
��1.38 � 1023 n/m2, 200�C1.92 � 1024 n/m2, 200�C
Dim
ensi
onal
cha
nge
(%)
Annealing temperature (�C)

100
curve of Figures 1 and 2. If neutron irradiation is performed at higher temperature and fluences, the number of various sized planar clusters increase between original layer planes and the graphite crystals expand in the c-direction, while the vacancies contract the crystals in the a-direction. Since there are pores or micro-cracks in the graphite matrix, the expansion in the c-direction (perpendicular to the hexagonal layer plane) may be absorbed by the imperfection of layer planes, pores or micro-cracks and the shrinkage in a-direction (parallel to layer plane) will dominate resulting in a net shrinkage of the graphite material.
Thus, when isotropic graphites IG-110U and ETP-10 were irradiated at 200�C to fluences of ~1.92 � 1024 n/m2, they exhibited swelling followed by post-irradiation annealing to result in a volume shrinkage which occurred at around 1 600�C. This result shows that the expansion component was larger than shrinkage in the irradiation at 200�C for those graphites. When the graphite IG-110U was irradiated at 400�C to fluence 7.4 � 1024 n/m2, volume shrinkage occurred after irradiation. This result shows that the shrinkage component was larger than the expansion component under these irradiation conditions for the graphite IG-110U.
C/C composite and glassy carbon
The changes in length of the C/C composite and glassy carbon showed complicated temperature dependencies as illustrated in Figures 3 and 4.
The dimensional change of CX-2002U is relatively small when it was irradiated at temperatures of 200-300�C to the fluences 1.2 � 1024 n/m2. When the specimens were subjected to post-irradiation annealing, the change in dimension is small. When the graphite CX-2002U was irradiated to fluence
Figure 3. Dimensional change of felt type C/C composite CX-2002U by isochronal annealing
���
Graphite (CX2002U)
0.3
0.2
0.1
0
-0.1
-0.2
-0.3
-0.4
-0.50 400 800 1400 1600
8.3 � 1022 n/m2, 200�C8.3 � 1024 n/m2, 300�C7.4 � 1024 n/m2, 400�C
Dim
ensi
onal
cha
nge
(%)
Annealing temperature (�C)
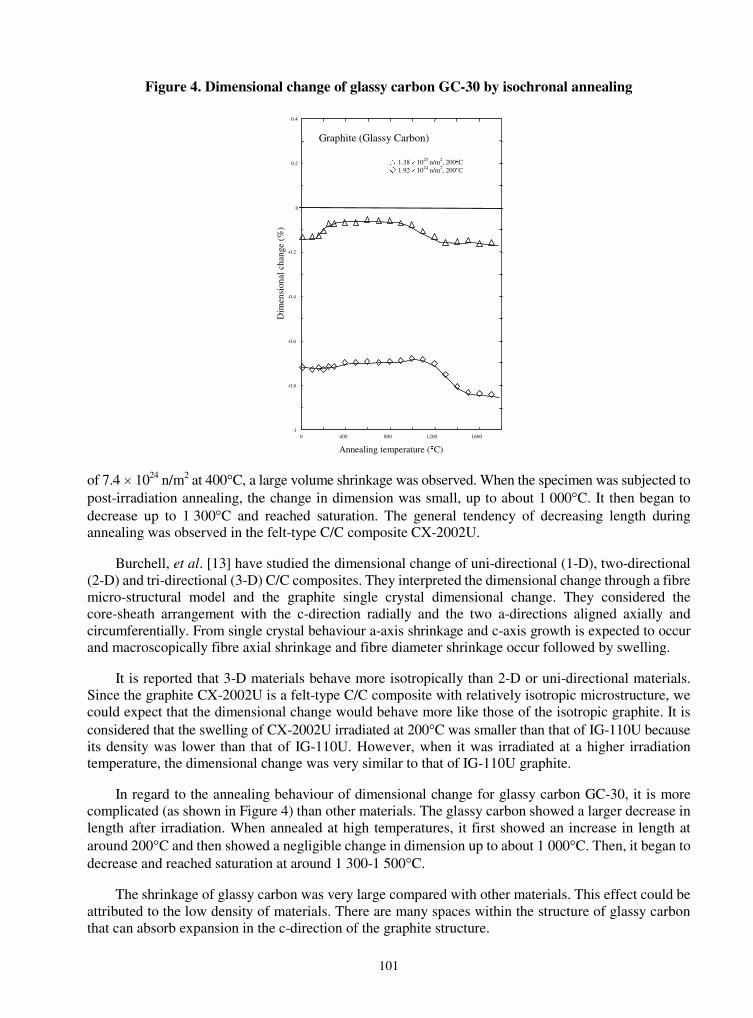
101
Figure 4. Dimensional change of glassy carbon GC-30 by isochronal annealing
of 7.4 � 1024 n/m2 at 400�C, a large volume shrinkage was observed. When the specimen was subjected to post-irradiation annealing, the change in dimension was small, up to about 1 000�C. It then began to decrease up to 1 300�C and reached saturation. The general tendency of decreasing length during annealing was observed in the felt-type C/C composite CX-2002U.
Burchell, et al. [13] have studied the dimensional change of uni-directional (1-D), two-directional (2-D) and tri-directional (3-D) C/C composites. They interpreted the dimensional change through a fibre micro-structural model and the graphite single crystal dimensional change. They considered the core-sheath arrangement with the c-direction radially and the two a-directions aligned axially and circumferentially. From single crystal behaviour a-axis shrinkage and c-axis growth is expected to occur and macroscopically fibre axial shrinkage and fibre diameter shrinkage occur followed by swelling.
It is reported that 3-D materials behave more isotropically than 2-D or uni-directional materials. Since the graphite CX-2002U is a felt-type C/C composite with relatively isotropic microstructure, we could expect that the dimensional change would behave more like those of the isotropic graphite. It is considered that the swelling of CX-2002U irradiated at 200�C was smaller than that of IG-110U because its density was lower than that of IG-110U. However, when it was irradiated at a higher irradiation temperature, the dimensional change was very similar to that of IG-110U graphite.
In regard to the annealing behaviour of dimensional change for glassy carbon GC-30, it is more complicated (as shown in Figure 4) than other materials. The glassy carbon showed a larger decrease in length after irradiation. When annealed at high temperatures, it first showed an increase in length at around 200�C and then showed a negligible change in dimension up to about 1 000�C. Then, it began to decrease and reached saturation at around 1 300-1 500�C.
The shrinkage of glassy carbon was very large compared with other materials. This effect could be attributed to the low density of materials. There are many spaces within the structure of glassy carbon that can absorb expansion in the c-direction of the graphite structure.
��
Graphite (Glassy Carbon)
-1
-0.8
-0.6
-0.4
-0.2
0
0.2
0.4
0 400 800 1200 1600
1.38 � 1023 n/m2, 200�C1.92 � 1024 n/m2, 200�C
Annealing temperature (�C)
Dim
ensi
onal
cha
nge
(%)
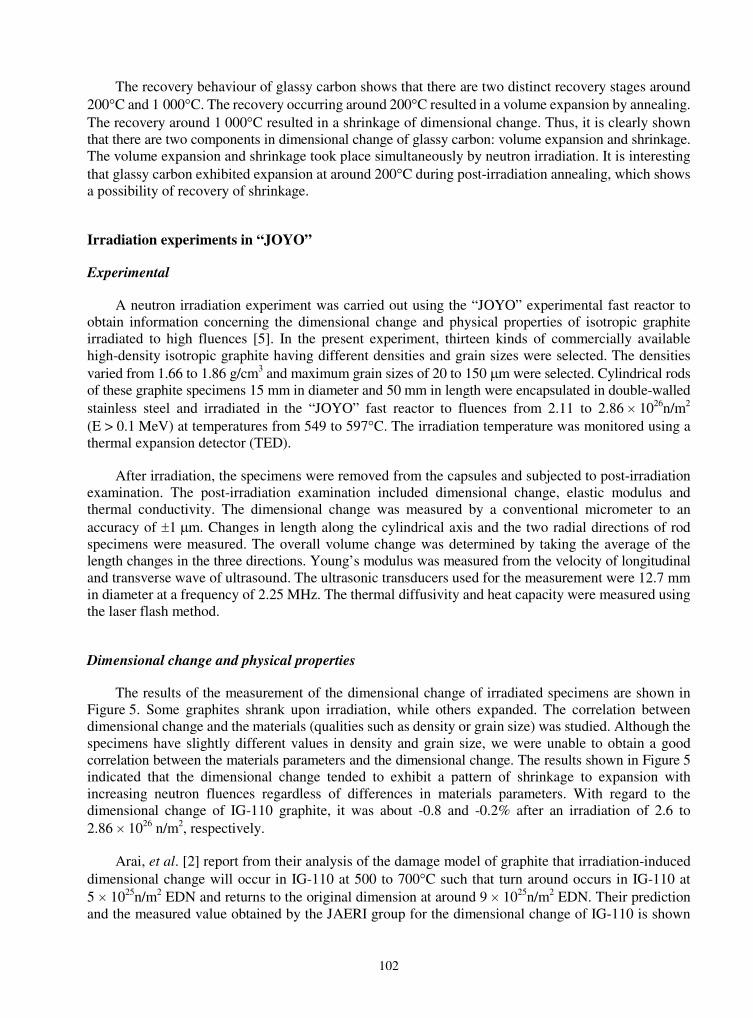
102
The recovery behaviour of glassy carbon shows that there are two distinct recovery stages around 200�C and 1 000�C. The recovery occurring around 200�C resulted in a volume expansion by annealing. The recovery around 1 000�C resulted in a shrinkage of dimensional change. Thus, it is clearly shown that there are two components in dimensional change of glassy carbon: volume expansion and shrinkage. The volume expansion and shrinkage took place simultaneously by neutron irradiation. It is interesting that glassy carbon exhibited expansion at around 200�C during post-irradiation annealing, which shows a possibility of recovery of shrinkage.
Irradiation experiments in “JOYO”
Experimental
A neutron irradiation experiment was carried out using the “JOYO” experimental fast reactor to obtain information concerning the dimensional change and physical properties of isotropic graphite irradiated to high fluences [5]. In the present experiment, thirteen kinds of commercially available high-density isotropic graphite having different densities and grain sizes were selected. The densities varied from 1.66 to 1.86 g/cm3 and maximum grain sizes of 20 to 150 �m were selected. Cylindrical rods of these graphite specimens 15 mm in diameter and 50 mm in length were encapsulated in double-walled stainless steel and irradiated in the “JOYO” fast reactor to fluences from 2.11 to 2.86 � 1026n/m2
(E > 0.1 MeV) at temperatures from 549 to 597�C. The irradiation temperature was monitored using a thermal expansion detector (TED).
After irradiation, the specimens were removed from the capsules and subjected to post-irradiation examination. The post-irradiation examination included dimensional change, elastic modulus and thermal conductivity. The dimensional change was measured by a conventional micrometer to an accuracy of �1 �m. Changes in length along the cylindrical axis and the two radial directions of rod specimens were measured. The overall volume change was determined by taking the average of the length changes in the three directions. Young’s modulus was measured from the velocity of longitudinal and transverse wave of ultrasound. The ultrasonic transducers used for the measurement were 12.7 mm in diameter at a frequency of 2.25 MHz. The thermal diffusivity and heat capacity were measured using the laser flash method.
Dimensional change and physical properties
The results of the measurement of the dimensional change of irradiated specimens are shown in Figure 5. Some graphites shrank upon irradiation, while others expanded. The correlation between dimensional change and the materials (qualities such as density or grain size) was studied. Although the specimens have slightly different values in density and grain size, we were unable to obtain a good correlation between the materials parameters and the dimensional change. The results shown in Figure 5 indicated that the dimensional change tended to exhibit a pattern of shrinkage to expansion with increasing neutron fluences regardless of differences in materials parameters. With regard to the dimensional change of IG-110 graphite, it was about -0.8 and -0.2% after an irradiation of 2.6 to 2.86 � 1026 n/m2, respectively.
Arai, et al. [2] report from their analysis of the damage model of graphite that irradiation-induced dimensional change will occur in IG-110 at 500 to 700�C such that turn around occurs in IG-110 at 5 � 1025n/m2 EDN and returns to the original dimension at around 9 � 1025n/m2 EDN. Their prediction and the measured value obtained by the JAERI group for the dimensional change of IG-110 is shown

103
Figure 5. Dimensional change of isotropic graphite materials irradiated in “JOYO” reactor
The JAERI data for IG-110 graphite was taken from Ref. [2] and the DFR curve from Ref. [14].
in Figure 5, where the neutron fluence is expressed in terms of E > 0.1 MeV. The present irradiation data indicates that IG-110 graphite approaches its original dimension at fluences around 2.9 � 1026n/m2
(E > 0.1 MeV) which is substantially higher than their prediction. It is noted that the dimensional change of the present specimens are slightly faster than that shown by the solid line in the Figure 2 which was obtained by the Gilsocarbon graphite irradiated in DFR (UKAEA) [14], whose irradiation condition is similar to that of the present irradiation in “JOYO”.
Figure 6 shows the change in Young’s modulus of neutron-irradiated graphites. The Young’s modulus of heavily-irradiated graphites increased to two or three times those of the un-irradiated materials. It generally agreed well with the DFR data showing the peak in Young’s modulus around this region. The large increase in the elastic modulus of graphite materials is mainly interpreted in terms of pinning of dislocations by irradiation-induced defects. Beyond this peak fluence, new pores or micro-cracks are generated in the graphite and degradation of mechanical properties occurs, thereby it will not be used as structural material beyond this fluence.
Figure 6. Young’s modulus change vs. neutron fluence
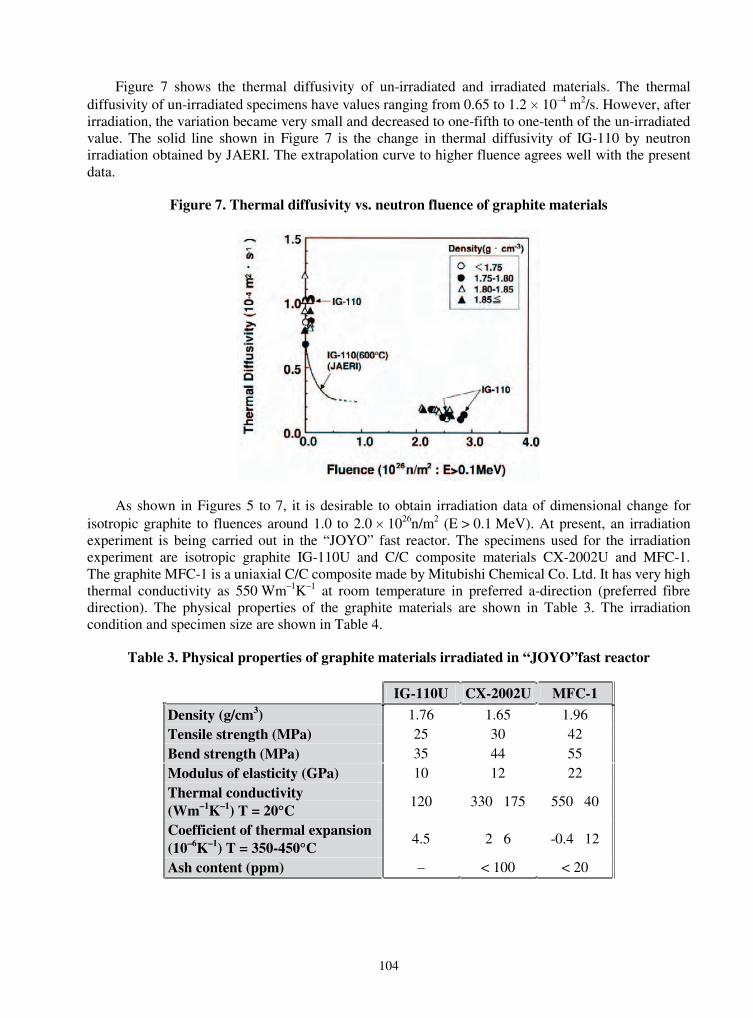
104
Figure 7 shows the thermal diffusivity of un-irradiated and irradiated materials. The thermal diffusivity of un-irradiated specimens have values ranging from 0.65 to 1.2 � 10–4 m2/s. However, after irradiation, the variation became very small and decreased to one-fifth to one-tenth of the un-irradiated value. The solid line shown in Figure 7 is the change in thermal diffusivity of IG-110 by neutron irradiation obtained by JAERI. The extrapolation curve to higher fluence agrees well with the present data.
Figure 7. Thermal diffusivity vs. neutron fluence of graphite materials
As shown in Figures 5 to 7, it is desirable to obtain irradiation data of dimensional change for isotropic graphite to fluences around 1.0 to 2.0 � 1026n/m2 (E > 0.1 MeV). At present, an irradiation experiment is being carried out in the “JOYO” fast reactor. The specimens used for the irradiation experiment are isotropic graphite IG-110U and C/C composite materials CX-2002U and MFC-1. The graphite MFC-1 is a uniaxial C/C composite made by Mitubishi Chemical Co. Ltd. It has very high thermal conductivity as 550 Wm–1K–1 at room temperature in preferred a-direction (preferred fibre direction). The physical properties of the graphite materials are shown in Table 3. The irradiation condition and specimen size are shown in Table 4.
Table 3. Physical properties of graphite materials irradiated in “JOYO”fast reactor
IG-110U CX-2002U MFC-1
Density (g/cm3) 1.76 1.65 1.96 Tensile strength (MPa) 25 30 42 Bend strength (MPa) 35 44 55 Modulus of elasticity (GPa) 10 12 22 Thermal conductivity (Wm–1K–1) T = 20�C
120 330 175 550 40
Coefficient of thermal expansion(10–6K–1) T = 350-450�C
4.5 2 6 -0.4 12
Ash content (ppm) – < 100 < 20

105
Table 4. Irradiation condition and specimen size of graphite materials irradiated in the “JOYO” fast reactor
Irradiation condition Specimens Fluence
(n/m2: E > 0.1 MeV) Temperature
(�C) Graphite Size
1.3 � 1026 394 IG-110U 10 mm � � 1.0 mm 1.8 � 1026 545 CX-2002U 10 mm � � 2.5 mm
MFC-1 10 mm � � 3.0 mm
Figure 8 shows the schematic drawing of irradiation capsule. Since there is anisotropy in C/C composites, large dimensional change is expected to occur in the direction perpendicular to preferred c-direction. Therefore, a large gap was provided between the specimen and capsule as shown in Figure 8. At present, the neutron irradiation has been completed and the capsule is stored in the hot cell at Oarai Engineering Center of Japan Nuclear Fuel Cycle Development Institute. A post-irradiation examination will be performed as concerns dimensional change and thermal conductivity.
Figure 8. Schematic drawing of irradiation capsule and specimen arrangement
Summary and conclusion
Neutron irradiation experiments on fine-grained isotropic graphites, C/C composites and glassy carbon were performed in the Japan Materials Testing Reactor (JMTR) and the “JOYO” fast reactor. The data obtained by irradiation in the JMTR show that when isotropic graphites are irradiated at low temperatures and low fluences, volume expansion occurs, but at higher irradiation temperatures and fluences, volume shrinkage occurs. A felt-type C/C composite demonstrated similar dimensional change with isotropic graphite but shrinkage of glassy carbon was very large compared with other materials.
When isotropic graphites were subjected to post-irradiation annealing, recovery in dimensional change was observed. The dimension of irradiated specimens linearly decreased as annealing temperature increased and saturated at a negative value after annealing at high temperatures. The negative value is a volume shrinkage component of graphite materials generated by the neutron irradiation. The behaviour of dimensional change of irradiated graphite is interpreted in terms of irradiation-induced defects of graphite. The changes in length of the C/C composite and glassy carbon by post-irradiation annealing showed complicated temperature dependences. Further study is needed to understand the annealing behaviour.
106
Dimensional change and physical properties of heavily irradiated isotropic graphites irradiated in the “JOYO” fast reactor were presented. It was pointed out that irradiation data of dimensional change for isotropic graphite around 1.0 to 2.0 � 1026n/m2 (E > 0.1 MeV) are needed. Regarding the neutron irradiation experiment of graphite materials, the present status of the “JOYO” irradiation experiment on isotropic graphite IG-110U, C/C composites CX-2002U and MFC-1 was described.
In conclusion, it is desirable to carry out further irradiation experiments on isotropic graphites and C/C composites up to high temperatures and high fluences. Also, it is pointed out that the post-irradiation annealing experiment provides useful information on the mechanisms of irradiation effects on graphite materials.
REFERENCES
[1] Engle, G.B. and B.T. Kelly, Journal of Nuclear Materials, 122 & 123, 122-129 (1984).
[2] Arai, T., H. Gords and H. Nickel, J. Nucl. Sci. Technol., 29, 851 (1992).
[3] Kelly, B.T., Physics of Graphite, Applied Science Publishers, London and New Jersey, pp. 416-440 (1981).
[4] T. Maruyama and M. Harayama, Journal of Nuclear Materials, 195, 44-50 (1992).
[5] T. Maruyama, T. Kaito, S. Onose, I. Shibahara, Journal of Nuclear Materials, 225, 267-272 (1995).
[6] Gray, W.J., W.C. Morgan, J.H. Cox and W.M. Woodruff, Carbon, 10, 236 (1972).
[7] Pravdyuk, N.F., V.A. Nikolenko, et al., Properties of Reactor Materials and the Effect of Radiation Damage, Proc., D.J. Litter, Ed., Butterworths, London, 57 (1962).
[8] Price, R.J., Nuclear Technology, 16, 536 (1972).
[9] Palentine, J.E., J. Nuclear Materials, 61, 243 (1976).
[10] Maruyama, T. and S. Onose, Proc. 3rd JAER-KAERI Joint Seminar on Post-irradiation Examination Technology, Oarai, Japan, pp. 335-340 (1999).
[11] Engle, G.B., Carbon, 12, 291-306 (1974).
[12] Eatherly, W.P., R.E. Causing R.A. Strehlow, C.R. Kennedy, P.K. Mioduszewsky, ORNL/ TM-10280 (1987).
[13] Burchell, T.D., W.P. Eatherly, J.M. Robbins and J.P. Strizak, Journal of Nuclear Materials,191-194, 295-299 (1992).
[14] Birch, M. and J.E. Blocklehurst, ND-R-1434(s) (1987).
107
THE PREDICTION OF IRRADIATION CREEP
Gareth B. Neighbour Department of Engineering, University of Hull, Kingston Upon Hull, HU6 7RX, United Kingdom
Tel: +44 1482 466535 • Fax: +44 1482 466664 • E-mail: [email protected]
Abstract
Nuclear graphite under load shows remarkably high creep ductility with neutron irradiation, well in excess of any strain experienced in un-irradiated graphite. As this behaviour compensates, to some extent, some other irradiation effects such as dimensional change or thermal shutdown stresses, it is an important property. This paper briefly reviews the approach to irradiation creep in the UK as described by the UK Creep Law as well as other countries. It then offers an alternative analysis of irradiation creep, using the AGR moderator graphite as an example, to high values of neutron fluence and applied stress. The paper will demonstrate that the new analysis provides for a more physically satisfying explanation for the decrease in the apparent creep strain observed at high fluence. The prediction of creep strain for a range of graphites and applications, including HTR systems, will be discussed.
108
Introduction
Increasingly, more attention is being given to the next series of civil nuclear reactors for the generation of electricity. The competition presented by graphite-moderated reactors under development throughout the world is healthy. However, within this context, the choice of any future reactor system is made more complex by economic and political considerations such as the need to demonstrate the ability to achieve a full design life to a much greater degree than perhaps was the case in earlier generations. The need to scrutinise the choice of materials and understand how these materials will behave through life under extreme conditions is paramount for persuading both society as a whole and also those who commission the projects. The project engineers may understand the technical risk, and have strived to minimise this with respect to safety, operational efficiency and return on investment, but it is the subjective or perceived risk which will ultimately decide whether nuclear energy continues and which design of reactor is adopted [1].
Graphite-moderated reactors have performed reasonably well over the past fifty years and this is somewhat demonstrated by the persistence of reactor designers to continue offering alternative graphite-moderated reactor designs [2]. However, it should be recognised that graphite still presents significant challenges to the reactor designer particularly with respect to understanding the irradiation behaviour of graphite in a general sense and then to each particular grade of polygranular graphite. Even after 50 years experience of operating graphite-moderated reactors, experimental programmes are still being actively pursued to gather data on basic material properties such as strength [3]. These investigations are valuable and will add greater clarity to our understanding; it is perhaps frustrating that the key to demonstrating efficient reactor operation over the design life under higher temperatures and high neutron fluence is a better understanding of how materials behave in terms of the effect on coefficient of thermal expansion, Poisson’s ratio and irradiation creep under high (triaxial) stress and with greater accuracy in the determination of neutron fluence and irradiation temperatures. These are some of the issues that will enable modellers to understand and predict performance much more easily for reactor components in situations such as shutdown stresses, transients, etc., and to which in-core inspection may be extremely difficult. For example, far too little attention has been given to understanding irradiation creep in “real stress” experiments. Historically, far too much attention has been given to the determination of strength or dynamic elastic modulus for which, in comparison, there is a wealth of data available for a range of graphites. To counter this trend, this paper focuses on how our prediction of irradiation creep can be improved, especially for the new generation of graphite-moderated reactors and thereby any supporting case to be made. This paper complements an earlier paper presented to the Second Information Exchange Meeting [4].
Polygranular graphite and the inter-relationship of properties
It is perhaps apt at this time to remind the reader that in considering the behaviour of polygranular graphite in-service, the development of physical understanding based on present knowledge and any new analysis must take into account the inter-relationship between properties with neutron irradiation as illustrated in Figure 1. It is, for example, not possible to consider irradiation creep of any nuclear graphite without knowledge of other properties such as dimensional change or elastic properties.
Furthermore, in any analysis, thought must be given to how the properties of polygranular graphite vary from batch-to-batch, between the different grades of polygranular graphite (due to micro-structural differences) and also how the polygranular graphite differs in several respects from that of pyrolytic or single crystal graphites. It is useful to be reminded that polygranular graphites contain:
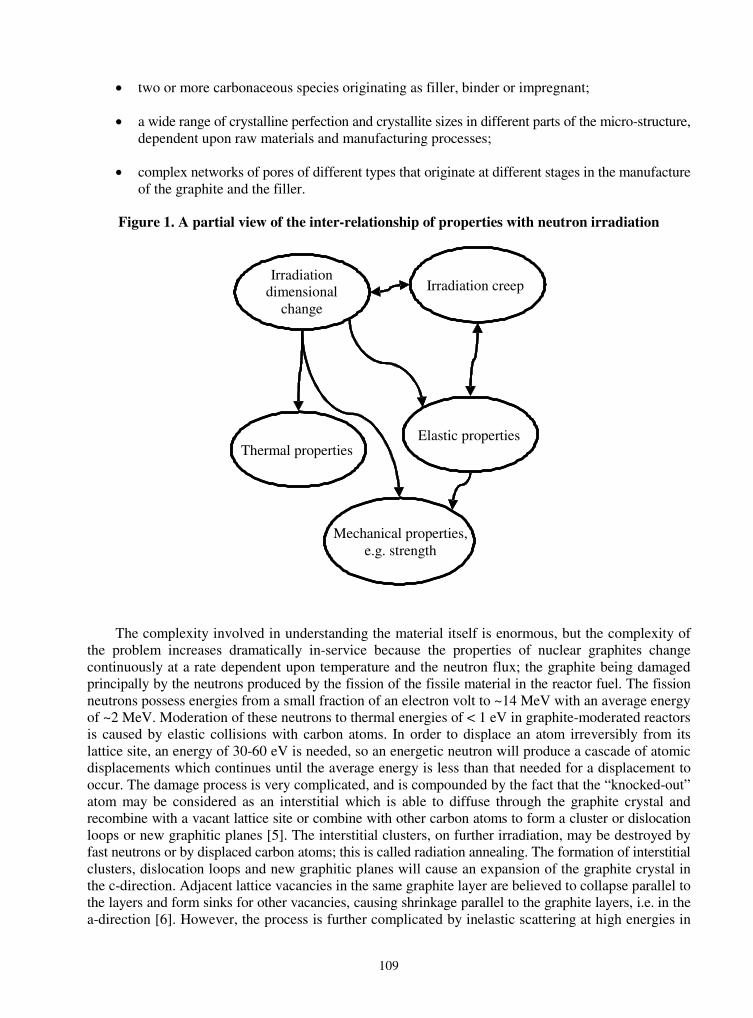
109
� two or more carbonaceous species originating as filler, binder or impregnant;
� a wide range of crystalline perfection and crystallite sizes in different parts of the micro-structure, dependent upon raw materials and manufacturing processes;
� complex networks of pores of different types that originate at different stages in the manufacture of the graphite and the filler.
Figure 1. A partial view of the inter-relationship of properties with neutron irradiation
The complexity involved in understanding the material itself is enormous, but the complexity of the problem increases dramatically in-service because the properties of nuclear graphites change continuously at a rate dependent upon temperature and the neutron flux; the graphite being damaged principally by the neutrons produced by the fission of the fissile material in the reactor fuel. The fission neutrons possess energies from a small fraction of an electron volt to ~14 MeV with an average energy of ~2 MeV. Moderation of these neutrons to thermal energies of < 1 eV in graphite-moderated reactors is caused by elastic collisions with carbon atoms. In order to displace an atom irreversibly from its lattice site, an energy of 30-60 eV is needed, so an energetic neutron will produce a cascade of atomic displacements which continues until the average energy is less than that needed for a displacement to occur. The damage process is very complicated, and is compounded by the fact that the “knocked-out” atom may be considered as an interstitial which is able to diffuse through the graphite crystal and recombine with a vacant lattice site or combine with other carbon atoms to form a cluster or dislocation loops or new graphitic planes [5]. The interstitial clusters, on further irradiation, may be destroyed by fast neutrons or by displaced carbon atoms; this is called radiation annealing. The formation of interstitial clusters, dislocation loops and new graphitic planes will cause an expansion of the graphite crystal in the c-direction. Adjacent lattice vacancies in the same graphite layer are believed to collapse parallel to the layers and form sinks for other vacancies, causing shrinkage parallel to the graphite layers, i.e. in the a-direction [6]. However, the process is further complicated by inelastic scattering at high energies in
Elastic properties
Irradiation creep
Thermal properties
Irradiation dimensional
change
Mechanical properties,e.g. strength

110
the neutron flux spectrum and excitation of electrons to metastable energy levels. For example, the primary knock-on atom will generally be ionised and may therefore lose a significant portion of its energy by electron excitation. Nightingale [7] remarks that the amount of radiation damage in graphite is not proportional to the total energy absorption because of the weak interaction between unbounded electrons and the lattice atoms in graphite. The portion of energy expended by charged knock-on atoms in exciting electrons is rapidly dissipated through a relatively large volume of material and does not result in the displacement of atoms. The fraction of energy lost by these ionisation processes increases as the energy of the bombarding particles increases.
In terms of reactor operation, as stated, neutron irradiation induces the physical and mechanical properties of nuclear graphites to change continuously. As irradiation proceeds, in terms of physical and mechanical properties, there are two principle mechanisms for damage. They are the pinning of basal plane shear due to the creation of interstitials, and other defects and structural damage due to dimensional change in crystallites which can either lead to both growth and shrinkage of bulk material depending on irradiation temperature and also ultimately neutron fluence. The general effects of irradiation damage can be illustrated using strength and modulus. For example, fast neutron irradiation rapidly increases the strength of graphite due to pinning of glissile basal plane dislocations by irradiation-induced defects, thereby raising the effective crystal shear modulus. The pinning effects tend to saturate at low irradiation neutron fluence; typically less than 1 � 1020 n cm–2 (EDN). Following this initial hardening, structural effects lead to a further increase in strength with increasing neutron fluence, due to an increase in modulus as crystalline shear becomes progressively more restricted by the closure of pores via c-axis expansion, until a peak is reached after which the strength decreases due to the generation of porosity. As irradiation temperature increases, the extent of any changes is reduced. At low neutron fluence, this is due to the increase defect mobility for pinning and at higher neutron fluence the reduction in available accommodation for irradiation growth by crystallites. The change in Young’s modulus with neutron irradiation is similar to strength, but much more pronounced.
The complex changes to the microstructure of the moderator graphite as a result of neutron irradiation are immense, but is further complicated by irradiation creep. At the fundamental level, several authors have proposed various theories about the mechanism of irradiation creep in nuclear graphites. These mechanisms include grain boundary sliding, e.g. Williamson and Jenkins [8], migration of point defects down stress gradients, e.g. Jenkins and Stephen [9], yield of crystallites due to radiation-induced thermal stresses, e.g. Roberts and Cottrell [10] and pinning-unpinning of basal plane dislocations, e.g. Kelly and Foreman [11]. The pinning-unpinning mechanism is believed to give the best overall agreement with experimental results, especially between irradiation temperatures ranging from 300�Cto 700�C. Although modelling irradiation processes is very difficult, it is possible to make predictions based upon the principal processes and the dimensional change of the crystallites, as outlined below (in particular, see the section entitled Irradiation creep – a different perspective).
A brief overview of irradiation creep experiments
Nuclear graphite under load shows remarkably high creep ductility with increasing neutron fluence to levels of strain significantly above that expected in un-irradiated graphite (and additional to any dimensional changes that would occur without stress). This irradiation creep behaviour is an important property as this ductility compensates, to some extent, some other irradiation effects such as thermal shutdown stresses which may otherwise lead to components failing.
There are various ways of measuring in-pile irradiation creep of graphite that vary in degree of sophistication, accuracy and the nature of the data generated. In early experiments, stress relaxation was studied in loaded graphite springs and thin slabs where it became evident that a large proportion
111
of the stress relaxation took place during irradiation [12]. These experiments were limited to strains well below the failure strain so that the stress relaxation effect could almost be attributed to the irradiation-induced increase in Young’s modulus. Blackstone [13] attributes the first series of “real” irradiation creep experiments to C.R. Kennedy [14] in which large cantilever beams were placed under constant load in flexure and the strain measured at various temperatures between 150-1 000�C in the Oak Ridge Research Reactor. He found that there were two distinct stages in the irradiation creep process, a transient creep and a steady-state creep. The transient creep strain was reported to saturate very quickly with a saturation value close to the elastic strain under the same force. Kennedy [14] also established that steady-state creep strain was linearly proportional to stress and fluence (and as became evident later also the un-irradiated elastic compliance).
In broad terms, there are three experimental techniques that are used to study irradiation creep. The first is a “real” irradiation creep experiment in which a specimen is subjected to a constant tensile or compressive stress while under irradiation with continuous strain measurement. This provides an accurate measure of the irradiation and stressing conditions, but the complexity and cost of this method make an investigation of a large number of specimens impractical. However, this does not remove the need of experiments of this type in future. The second technique can be found in either the “restrained growth” or the “restrained shrinkage” experiments, first used by Losty, et al. [15] and most commonly used in the irradiation temperature range 400-1 400�C. In this temperature range, all graphites undergo irradiation-induced shrinkage, but the shrinkage rates can differ markedly for different graphites. Using this knowledge, the shrinkage of a graphite tensile specimen can be restrained by pads or split sleeves made of a graphite that exhibits a smaller shrinkage rate or even expands under irradiation. By measuring the unconstrained dimensional change as well, the induced creep strain of samples within the restrained shrinkage assembly can be calculated knowing the various differences in shrinkage rates of the various components. The main disadvantage with this technique is that there is no possibility to make measurements during the irradiation. After irradiation, the stress at temperature was deduced from the established creep laws. Although this method is less accurate and precise than constant stress experiments, the advantage is that it is possible to obtain many results for a range of conditions and materials [16]. The final method can be regarded as a combination of a stress relaxation and a restrained shrinkage experiment. A large block of graphite is irradiated under a temperature and neutron flux density gradient. Strips are then cut from the block and their curvatures are measured. These results are only meaningful if a stress calculation can be performed [17]. This method was primarily used in the Dragon Reactor Experiment. As Blackstone [13] remarks, the above three techniques may be regarded as complementary since “real” irradiation creep experiments are used to derive creep laws, the restrained shrinkage experiments provide information on different materials, temperature and flux gradients, and the larger block experiment provides a test of the data and stress models under more realistic conditions. However, this brief history of early irradiation creep experiments has demonstrated the complexity involved and the difficulty in obtaining large data sets. Nevertheless, it must be emphasised that compared to other properties, our knowledge of irradiation creep remains uncertain and there is a clear need for further experimental work.
The stages of irradiation creep
There are two main stages in the irradiation creep process. The first stage, called primary or transient creep, is characterised by a rapid and reversible deformation that soon decreases in rate and can be represented by:
��
���� ����0
dteeE
P tI or at constant stress ����
��� e
EPI 1
(1)
112
where �I is the transient creep strain, � is the exponential transient creep strain rate, E is the Young’s modulus of the material, P is a constant to relate the total transient creep strain to the elastic strain at stress �, � is the fluence and t is an integration parameter. The second stage, called steady-state creep, is characterised by a linear dependence of the creep strain, �II, on stress, �, and fluence, �, such that:
��
���0
dtkII or at constant stress ���� kII
(2)
where the constant k is called the irradiation creep coefficient. As transient creep saturates rapidly, the more important mechanism is the steady-state creep which is irreversible. It should be noted that most creep experiments are designed to measure the value of k. There is strong evidence to suggest that the irradiation creep coefficient, k, of various nuclear graphites is inversely proportional to the Young’s modulus and also dependent upon the neutron flux [13]. Analogous to thermal creep, there is also a tertiary stage of irradiation creep, but more often than not this is ignored since creep experiments generally fail to reach sufficiently high neutron fluence for this stage to be observed. Consequently, there is little information on the existence of a tertiary stage in irradiation creep. Therefore, the total creep strain, �c, in irradiated graphite can be expressed by the sum of both transient and steady-state creep components such that:
IIIc � ��� or �� ��
�� ��� keE
Pc 1(3)
As can be seen from Eq. (3) above, creep strain is a linear function of stress. Various studies have shown Eq. (3) to be a good representation of creep data at low fluence. At high fluence, typically greater than 60 � 1020 n cm–2 EDN, the steady-state creep rate decreases with increasing fluence. Kelly [18] comments that this observation was expected theoretically (and to some extent demonstrated experimentally) when changes in E0 due to structure changes in the graphite are shown to modify the creep rates, particularly in the high fluence HTR experiments. Kelly [18] also remarks that the normal creep model is only strictly valid for small creep strains < 0.5% and that changes in Young’s modulus may not be significant in that range of strains.
The UK Creep Law
The UK Creep Law differs slightly from Eq. (3). Brocklehurst [19] reports that the observed decreasing steady-state creep rate at high fluence can be attributed to structural changes that modify the internal stress distribution. Brocklehurst [19] presents a theoretical approach that suggests the steady-state creep rate is directly proportional to the effective crystal shear modulus divided by the polygranular Young’s modulus. Since dislocation pinning increases both moduli in proportion, only structural effects on Young’s modulus will affect the steady-state creep strain. Thus, under constant stress, the steady-state creep is modified by substituting E0 for the effective modulus, Ec, such that:
00
0
SEEE
EE
Structure
c ����
���
��(4)
where S represents the proportional change in Young’s modulus resulting from structural changes due to irradiation damage at high fluence (Kelly and Burchell [20] suggest the structure factor, S, is similar in free and crept samples). Hence, at constant stress, the steady-state creep strain becomes:
113
��
����0
1’d
SkII
(5)
From various studies, the constants in Eq. (3) for AGR moderator graphite can be shown to be � = 4.0, k = 0.23/Ec and P assumed to be unity. The coefficients of 0.23 and 4.0 are reported to be applicable for all polygranular graphites irradiated below ~650�C [21]. The coefficient of 0.23 is actually derived from the slope of creep strain per unit initial elastic strain versus fluence and can be shown to equal kE0 [22]. Therefore, in summary, the current UK Creep Law (originally proposed by Brocklehurst and Kelly [23]) under uni-axial stress, for transient and steady-state creep respectively is as follows:
��
���
����0
4exp4exp04 ’d’E
.c
I or at constant stress ���
��� 4exp1
c
IE
(6)
��
��
��0
230 ’dE
.c
II or at constant stress �
���
c
IIE
.230(7)
Alternatively, the UK Creep Law for constant stress can be expressed as:
��
����
��cc
cE
.E
2304exp1(8)
Generally, the UK Creep Law represents data well for fluence up to ~60 � 1020 n/cm2 EDN. At higher fluence, the UK Creep Law progressively underestimates the measured creep strain, c�� .Originally, the structure term was added to account for any discrepancy between the measured and predicted creep strain, however this term has limited success, no real physical meaning and cannot be measured directly. Furthermore, the question should be asked how S changes between different polygranular graphites?
It is useful to mention here that the bulk of all available irradiation creep data support the view that any nuclear graphite irradiated under constant stress, the tensile and compressive creep strains, plotted as creep strain/initial elastic strain, �CE0/�, are directly proportional to the fluence and independent of temperature in the range 140-650�C (for UK graphites see Kelly and Brocklehurst, [24]). However, at high temperatures, i.e. > 650�C, the creep strain/initial elastic strain is the same for all graphites over a wide range of stresses, but the gradient of the line is proportional to irradiation temperature. Only at very high stresses (~40 MN/m2) is there a deviation from linearity.
Recent developments
Kelly [18] reviews the theory of irradiation creep and re-iterates that the UK model is based upon plastic and elastic deformations that are dominated by basal plane shear. He states that this assumption explains the correlation between the initial secondary creep and the corresponding un-irradiated Young’s modulus for all graphites irradiated at the same temperature and flux. Kelly [18] also explains that the UK model assumes that the creep rate of the component crystallites does not change with creep strain or fluence and more importantly the properties measured on a control sample exposed un-stressed apply equally to the stressed sample. As Kelly [18] states, the latter assumption is incorrect since CTE is known to change with irradiation creep and so other properties may also be affected. It should be noted that work on un-irradiated graphite supports the observations found for the correlation

114
of CTE with irradiation creep strain. For example, Matsuo and Sasaki [25] studied the CTE variation of H-327 grade nuclear graphite with temperature in the un-stressed condition and at compressive stresses ranging from ~45% to 95% �f. Their results showed that the thermal expansion increased linearly with applied compressive stress. Further, this work was supported by Matsuo and Sasaki [26] who found a linear relation between CTE of pre-stressed polygranular graphites and the residual strain. The change in CTE was found not to depend on the nature of the sample, the pre-stressing direction and the bulk porosity changes induced by pre-stressing.
In addition, Kennedy, et al. [27] studied the dependence of CTE as a function of creep strain using a range of graphites all stressed in the extrusion direction. The CTE was found to increase linearly with creep strain. In addition, creep strain has been shown to affect the CTE of Gilsocarbon-based graphites. Creep under a tensile stress decreases CTE and creep under a compressive stress increases CTE (Figure 2), where the un-stressed CTE values are taken from control samples irradiated to the same fluence as the stressed sample [20]; a similar observation can be made for PGA graphite, Figure 3. From this work, Kelly and Burchell [20] realised that the original definition of creep strain, i.e. the difference in length between a stressed specimen and a control is only correct if the dimensional change component in the stressed specimen is the same as that of the control. However, as dimensional change is directly proportional to the CTE and since the CTE is modified by the creep strain, it was realised that the dimensional change component in the stressed specimen cannot be the same as that in the control specimen. That is, the true creep strain, �c, will be higher in tension and lower in compression than previously assumed. In the evaluation of creep strain, the following correction to the creep strain is required.
’dd
dX T
ac
xxcc ���
�
����
��
��
���
��������
����� ��
0
(9)
where �x, x�� , �a and �c are the CTEs of the bulk un-stressed and crept graphite in direction x, a and caxes of the graphite crystallites, respectively, and XT is a crystal shape change parameter.
Figure 2. Effect of “apparent” creep strain on the CTE measured parallel to the stress axis of Gilsocarbon graphite (data taken from [20]) with linear and
polynomial best-fits and predictions based on the work of Price and Mobasheran
y = -0.0922x2 - 0.8919x
R2 = 0.7595
y = -0.6101x
R2 = 0.7116
-2
-1
0
1
2
3
4
5
-6 -5 -4 -3 -2 -1 0 1 2
Apparent Irradiation Creep Strain (%)
Cha
nges
in C
TE
(20
-120
deg
C)
( �’ x
- �
x)(x
10-6
K-1
)
AGR Graphite Price MobasheranPoly. (AGR Graphite) Linear (AGR Graphite)
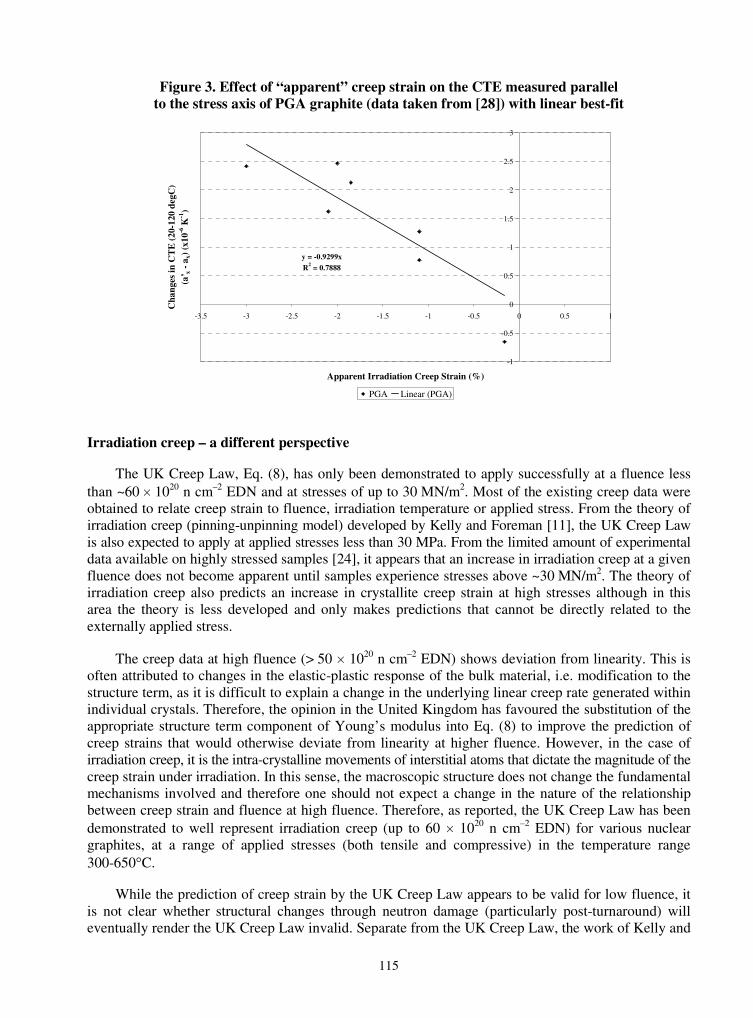
115
Figure 3. Effect of “apparent” creep strain on the CTE measured parallel to the stress axis of PGA graphite (data taken from [28]) with linear best-fit
y = -0.9299xR2 = 0.7888
-1
-0.5
0
0.5
1
1.5
2
2.5
3
-3.5 -3 -2.5 -2 -1.5 -1 -0.5 0 0.5 1
Apparent Irradiation Creep Strain (%)
Cha
nges
in C
TE
(20
-120
deg
C)
(a’ x
- a
x) (
x10-6
K-1
)
PGA Linear (PGA)
Irradiation creep – a different perspective
The UK Creep Law, Eq. (8), has only been demonstrated to apply successfully at a fluence less than ~60 � 1020 n cm–2 EDN and at stresses of up to 30 MN/m2. Most of the existing creep data were obtained to relate creep strain to fluence, irradiation temperature or applied stress. From the theory of irradiation creep (pinning-unpinning model) developed by Kelly and Foreman [11], the UK Creep Law is also expected to apply at applied stresses less than 30 MPa. From the limited amount of experimental data available on highly stressed samples [24], it appears that an increase in irradiation creep at a given fluence does not become apparent until samples experience stresses above ~30 MN/m2. The theory of irradiation creep also predicts an increase in crystallite creep strain at high stresses although in this area the theory is less developed and only makes predictions that cannot be directly related to the externally applied stress.
The creep data at high fluence (> 50 � 1020 n cm–2 EDN) shows deviation from linearity. This is often attributed to changes in the elastic-plastic response of the bulk material, i.e. modification to the structure term, as it is difficult to explain a change in the underlying linear creep rate generated within individual crystals. Therefore, the opinion in the United Kingdom has favoured the substitution of the appropriate structure term component of Young’s modulus into Eq. (8) to improve the prediction of creep strains that would otherwise deviate from linearity at higher fluence. However, in the case of irradiation creep, it is the intra-crystalline movements of interstitial atoms that dictate the magnitude of the creep strain under irradiation. In this sense, the macroscopic structure does not change the fundamental mechanisms involved and therefore one should not expect a change in the nature of the relationship between creep strain and fluence at high fluence. Therefore, as reported, the UK Creep Law has been demonstrated to well represent irradiation creep (up to 60 � 1020 n cm–2 EDN) for various nuclear graphites, at a range of applied stresses (both tensile and compressive) in the temperature range 300-650�C.
While the prediction of creep strain by the UK Creep Law appears to be valid for low fluence, it is not clear whether structural changes through neutron damage (particularly post-turnaround) will eventually render the UK Creep Law invalid. Separate from the UK Creep Law, the work of Kelly and
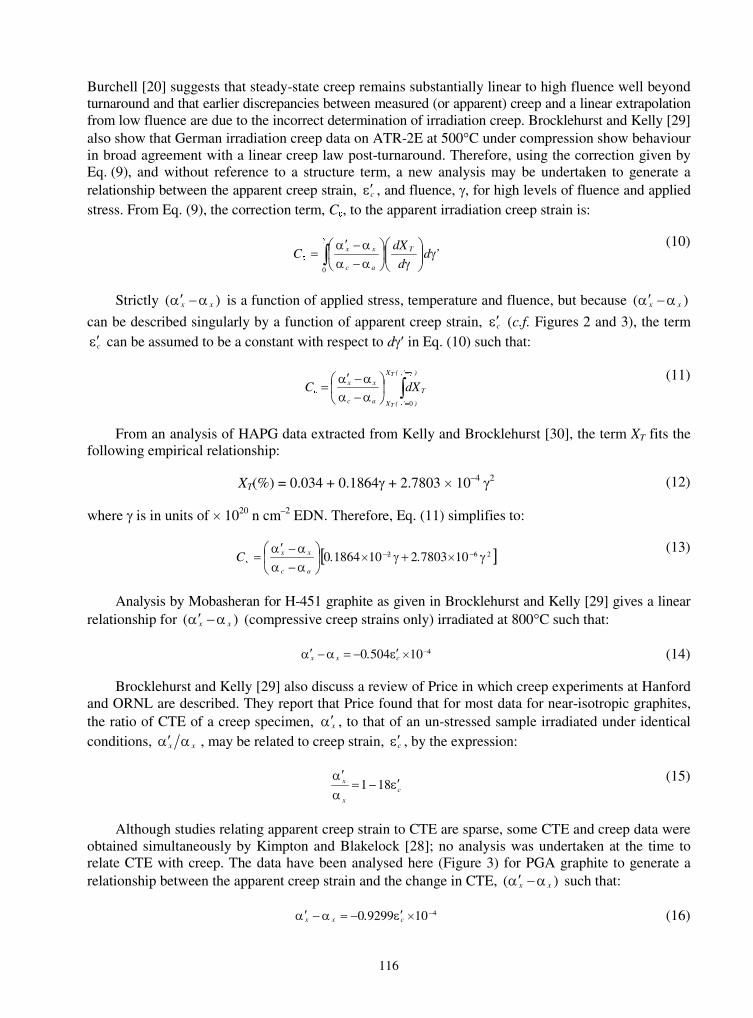
116
Burchell [20] suggests that steady-state creep remains substantially linear to high fluence well beyond turnaround and that earlier discrepancies between measured (or apparent) creep and a linear extrapolation from low fluence are due to the incorrect determination of irradiation creep. Brocklehurst and Kelly [29] also show that German irradiation creep data on ATR-2E at 500�C under compression show behaviour in broad agreement with a linear creep law post-turnaround. Therefore, using the correction given by Eq. (9), and without reference to a structure term, a new analysis may be undertaken to generate a relationship between the apparent creep strain, c�� , and fluence, �, for high levels of fluence and applied stress. From Eq. (9), the correction term, C�, to the apparent irradiation creep strain is:
’dd
dXC T
ac
xx ����
����
��
��
���
��������
� ��
�
0
(10)
Strictly )( xx ���� is a function of applied stress, temperature and fluence, but because )( xx ����
can be described singularly by a function of apparent creep strain, c�� (c.f. Figures 2 and 3), the term
c�� can be assumed to be a constant with respect to d�� in Eq. (10) such that:
����
��
� ��
���
��������
�)’(X
)’(X
T
ac
xxT
T
dXC0
(11)
From an analysis of HAPG data extracted from Kelly and Brocklehurst [30], the term XT fits the following empirical relationship:
XT(%) = 0.034 + 0.1864� + 2.7803 � 10–4 �2 (12)
where � is in units of � 1020 n cm–2 EDN. Therefore, Eq. (11) simplifies to:
� �262 10780321018640 �� ����
���
��������
� ��
�..C
ac
xx (13)
Analysis by Mobasheran for H-451 graphite as given in Brocklehurst and Kelly [29] gives a linear relationship for )( xx ���� (compressive creep strains only) irradiated at 800�C such that:
4105040 ���������� cxx . (14)
Brocklehurst and Kelly [29] also discuss a review of Price in which creep experiments at Hanford and ORNL are described. They report that Price found that for most data for near-isotropic graphites, the ratio of CTE of a creep specimen, x�� , to that of an un-stressed sample irradiated under identical conditions, xx ��� , may be related to creep strain, c�� , by the expression:
c
x
x �������
181(15)
Although studies relating apparent creep strain to CTE are sparse, some CTE and creep data were obtained simultaneously by Kimpton and Blakelock [28]; no analysis was undertaken at the time to relate CTE with creep. The data have been analysed here (Figure 3) for PGA graphite to generate a relationship between the apparent creep strain and the change in CTE, )( xx ���� such that:
41092990 ���������� cxx . (16)
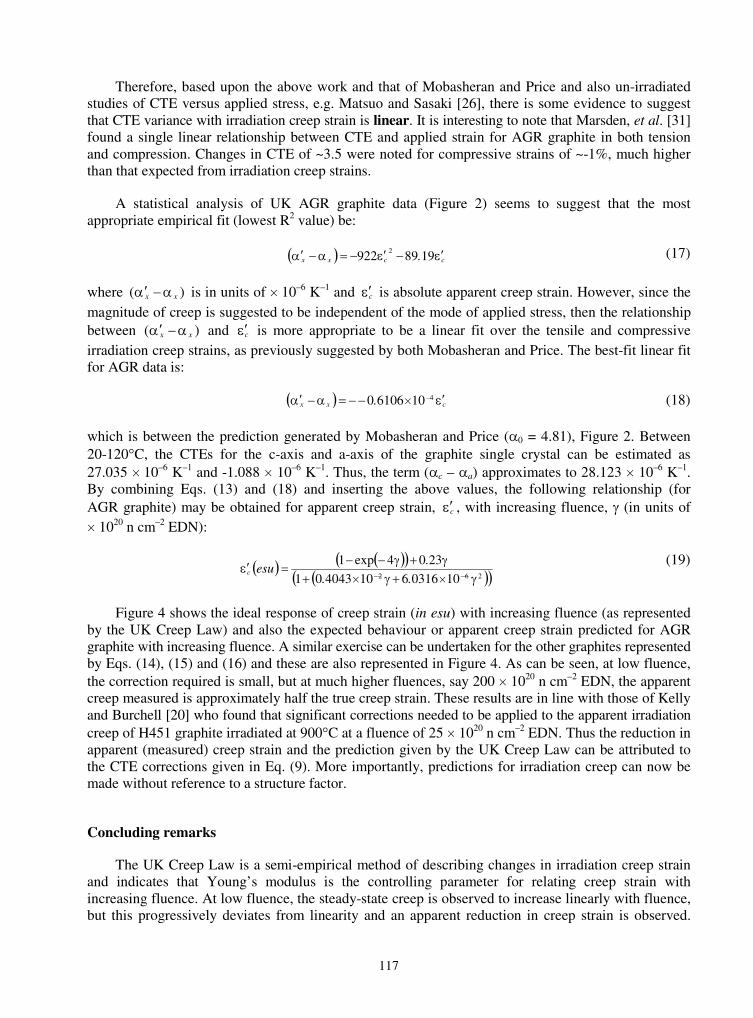
117
Therefore, based upon the above work and that of Mobasheran and Price and also un-irradiated studies of CTE versus applied stress, e.g. Matsuo and Sasaki [26], there is some evidence to suggest that CTE variance with irradiation creep strain is linear. It is interesting to note that Marsden, et al. [31] found a single linear relationship between CTE and applied strain for AGR graphite in both tension and compression. Changes in CTE of ~3.5 were noted for compressive strains of ~-1%, much higher than that expected from irradiation creep strains.
A statistical analysis of UK AGR graphite data (Figure 2) seems to suggest that the most appropriate empirical fit (lowest R2 value) be:
ccxx . ����������� 1989922 2 (17)
where )( xx ���� is in units of � 10–6 K–1 and c�� is absolute apparent creep strain. However, since the magnitude of creep is suggested to be independent of the mode of applied stress, then the relationship between )( xx ���� and c�� is more appropriate to be a linear fit over the tensile and compressive irradiation creep strains, as previously suggested by both Mobasheran and Price. The best-fit linear fit for AGR data is:
cxx . ���������� �41061060 (18)
which is between the prediction generated by Mobasheran and Price (�0 = 4.81), Figure 2. Between 20-120�C, the CTEs for the c-axis and a-axis of the graphite single crystal can be estimated as 27.035 � 10–6 K–1 and -1.088 � 10–6 K–1. Thus, the term (�c – �a) approximates to 28.123 � 10–6 K–1.By combining Eqs. (13) and (18) and inserting the above values, the following relationship (for AGR graphite) may be obtained for apparent creep strain, c�� , with increasing fluence, � (in units of � 1020 n cm–2 EDN):
262 100316610404301
2304exp1
�� �� � ���
����� ..
.esuc
(19)
Figure 4 shows the ideal response of creep strain (in esu) with increasing fluence (as represented by the UK Creep Law) and also the expected behaviour or apparent creep strain predicted for AGR graphite with increasing fluence. A similar exercise can be undertaken for the other graphites represented by Eqs. (14), (15) and (16) and these are also represented in Figure 4. As can be seen, at low fluence, the correction required is small, but at much higher fluences, say 200 � 1020 n cm–2 EDN, the apparent creep measured is approximately half the true creep strain. These results are in line with those of Kelly and Burchell [20] who found that significant corrections needed to be applied to the apparent irradiation creep of H451 graphite irradiated at 900�C at a fluence of 25 � 1020 n cm–2 EDN. Thus the reduction in apparent (measured) creep strain and the prediction given by the UK Creep Law can be attributed to the CTE corrections given in Eq. (9). More importantly, predictions for irradiation creep can now be made without reference to a structure factor.
Concluding remarks
The UK Creep Law is a semi-empirical method of describing changes in irradiation creep strain and indicates that Young’s modulus is the controlling parameter for relating creep strain with increasing fluence. At low fluence, the steady-state creep is observed to increase linearly with fluence, but this progressively deviates from linearity and an apparent reduction in creep strain is observed.

118
Figure 4. A plot of irradiation creep strain (in esu) versus neutron fluence for the UK Creep Law and predictions for apparent creep strain based on a range on CTE-creep strain relationships
0.00
5.00
10.00
15.00
20.00
25.00
30.00
0 20 40 60 80 100 120 140 160 180 200
Neutron Fluence (x1020 n cm-2 EDN)
Irra
diat
ion
Cre
ep S
trai
n (e
su)
UK Creep Law Expected Behaviour (AGR) Mobashearan Price PGA
The UK Creep Law accounts for this by changes in the “structure term”, however this term has no satisfactory physical meaning. A more physically satisfying explanation of the apparent decrease in creep strain is the modification of CTE, and consequently dimensional change, by creep strain. An analysis was presented which showed that the steady-state creep rate should remain constant without reference to a structure factor. The analysis provided a more physically satisfying explanation for the decrease in the apparent creep strain observed at high fluence than that predicted by the UK Creep Law. The approach taken is applicable to all reactors that used graphite as a moderator or reflector. This review of irradiation creep experiments also identified the need to undertake new creep experiments under better and fully monitored conditions.
Acknowledgements
I wish to thank British Energy Generation Ltd for providing support for this work. Special thanks are given to Dr. Jim Reed for his personal support over the last few years in which this work was conducted.
REFERENCES
[1] Neighbour, G.B., A.J. Wickham and P.J. Hacker, “Determining the Future for Irradiated Graphite Disposal”, Nuclear Energy, 39, [3], 179-186 (2000).
[2] Kendal, J. and M. Methnani, “Update on IAEA High-temperature Gas-cooled Reactor Activities”, Basic Studies in the Field of High-temperature Engineering, 2nd Information Exchange Meeting,10-12 October 2001, OECD/NEA, 31-38 (2002).
119
[3] Buckthorpe, D., R. Couturier, B. van der Schaaf, B. Riou, H. Rantala, R. Moormann, F. Alonso and B.C.M. Friedrich, “Investigation of High-temperature Reactor (HTR) Materials”, BasicStudies in the Field of High-temperature Engineering, 2nd Information Exchange Meeting,10-12 October 2001, OECD/NEA, 203-213 (2002).
[4] Neighbour, G.B. and P.J. Hacker, “An Analysis of Irradiation Creep in Nuclear Graphites”, Basic Studies in the Field of High-temperature Engineering, 2nd Information Exchange Meeting,10-12 October 2001, OECD/NEA, 269-280 (ISBN 92-64-19796-6) (2002).
[5] Amelinckx, S., P. Delavignette and M. Heerschap, “Dislocations and Stacking Faults in Graphite”, Chem. Phys. Carbon, 1, 1 (1966).
[6] Burchell, T.D. and T. Oku, “Material Properties Data for Fusion Reactor Plasma-facing Carbon-carbon Composites”, Atomic and Plasma-material Interaction Data for Fusion(supplement to Nuclear Fusion), International Atomic Energy Agency, 5, 77-128 (1994).
[7] Nightingale, R.E., Nuclear Graphite, Academic Press Inc, New York (1962).
[8] Williamson, G.K. and G.M. Jenkins, “The Mechanism of Irradiation Creep in Graphite”, Proc. 2nd Conf. on Industrial Carbon and Graphite, 567 (1966).
[9] Jenkins, G.M. and D.R. Stephen, “The Temperature Dependence of the Irradiation-induced Creep of Graphite”, Carbon, 4, 67-72 (1966).
[10] Roberts, A.C. and A.H. Cottrell, “Creep of Alpha Uranium During Irradiation with Neutrons”, Philosophical Magazine, 1, 711 (1956).
[11] Kelly, B.T. and A.J.E. Foreman, “The Theory of Irradiation Creep in Reactor Graphite – The Dislocation Pinning-unpinning Model”, Carbon, 12, 151-158 (1974).
[12] Davidson, H.W. and H.H.W. Losty, “The Effect of Neutron Irradiation on the Mechanical Properties of Graphite”, Proc. 2nd Int. Conf. on Peaceful Uses of Atomic Energy, 7, 307 (1962).
[13] Blackstone, R., “Radiation Creep of Graphite – An Introduction”, Journal of Nuclear Materials,65, 72-78 (1977).
[14] Kennedy, C.R., Gas-cooled Reactor Program Semi-annual Progress Report, USEAC report ORNL-3445, 221 (1963).
[15] Losty, H.H.W., N.C. Fielder, J.P. Bell and G.M. Jenkins, “The Irradiation-induced Plasticity of Graphite”, Proc. 5th Biennial Conf. on Carbon, 1, 266 (1962).
[16] Veringa, H.J. and R. Blackstone, “The Irradiation Creep in Reactor Graphites for HTR Applications”, Carbon, 14, 279-285 (1976).
[17] Kinkaed, A.N., P. Barr and M.R. Everett, “The Thermal and Mechanical Performance of HTR Fuel Elements”, Proc. BNES Conf. on Nuclear Fuel Performance, London, paper 41 (1973).
[18] Kelly, B.T., “Irradiation Creep in Graphite – Some New Considerations and Observations”, Carbon, 30, 3, 379-383 (1992).

120
[19] Brocklehurst, J.E., “Irradiation Damage in CAGR Moderator Graphite”, UKAEA Report ND-R-117(S) (1984).
[20] Kelly, B.T. and T.D. Burchell, “The Analysis of Irradiation Creep Experiments on Nuclear Reactor Graphite”, Carbon, 32, [1], 119-125 (1994).
[21] Mitchell, B.C., B.J. Marsden, J. Smart and S.L. Fok, Evaluating an Irradiation Creep Law for Nuclear Graphite at High Dose and Temperature, Private Communication (2000).
[22] Kelly, B.T. and J.E. Brocklehurst, Irradiation-induced Creep in Graphite; A Review of UKAEA Reactor Group Studies, TRG Report 2878(S) (1976).
[23] Brocklehurst, J.E. and B.T. Kelly, Proposed Modifications to the Irradiation Creep Design Rules for AGR Graphite, ND-M-3785(S).; AGR/GCWG/P(87)22 Rev. 2 (1987).
[24] Kelly, B.T. and J.E. Brocklehurst, “UKAEA Reactor Group Studies of Irradiation-induced Creep in Graphite”, Journal of Nuclear Materials, 65, 79-85 (1977).
[25] Matsuo, H. and Y. Sasaki, “Thermal Expansion of Nuclear-grade Graphite under Compressive Stress at High Temperatures”, Journal of Nuclear Materials, 101, 232-234 (1981).
[26] Matsuo, H. and Y. Sasaki, “Thermal Expansion of some Pre-stressed Nuclear-grade Graphite”, Carbon, 23, [1], 51-57 (1985).
[27] Kennedy, C.R., W.H. Cook, W.P. Eatherly, “Results of Irradiation Creep Testing at 900�C”, Proc. 13th Biennial Conf. on Carbon, 342 (1977).
[28] Kimpton and Blakelock (1967).
[29] Brocklehurst, J.E. and B.T. Kelly, “A Review of Irradiation-induced Creep in Graphite under CAGR Conditions”, UKAEA Report ND-R-1406(S) (1986).
[30] Kelly, B.T. and J.E. Brocklehurst, “High Dose Fast Neutron Irradiation of Highly-oriented Pyrolytic Graphite”, Carbon, 9, 783-789 (1971).
[31] Marsden, B.J., S.D. Preston, N. McLachlan and M.A. Davies, “The Interaction of Strain, Coefficient of Thermal Expansion and Dimensional Changes in Graphite”, Proc. IAEA Specialists Meeting on Graphite Moderator Lifecycle Technologies, University of Bath, UK, 313 (1995).
Additional reference
[32] GCDMC, The Compendium of CAGR Core and Sleeve Data and Methods, p. 28 (1996).

121
ION IRRADIATION EFFECTS ON TENSILE PROPERTIES OF CARBON FIBRES
A. KurumadaFaculty of Engineering, Ibaraki University, 4-12-1, Nakanarusawa, Hitachi, Ibaraki, 316-8511, Japan
Y. Imamura1, T. Oku2, M. Ishihara3, S. Baba3 and J. Aihara3
1Faculty of Engineering, Ibaraki University, 4-12-1, Nakanarusawa, Hitachi, Ibaraki, 316-8511, Japan 2Ibaraki Study Center, The University of the Air, 2-1-1, Bunkyo, Mito, Ibaraki, 310-0056, Japan
3Dept. of Advanced Nuclear Technology, JAERI-Oarai, 3607, Narita, Oarai, Ibaraki, 311-1394, Japan
Abstract
Carbon/carbon composite materials have high thermal conductivity and excellent mechanical properties at high temperatures. They have been used as structural materials at high temperatures in fission and experimental fusion reactors. The changes in the microstructures and the mechanical properties due to irradiation damage must be measured for the safety design and the life assessment of the materials. The purpose of this study is to obtain a basic knowledge of the development of new carbon composite materials having high thermal conductivity and excellent resistance to irradiation damage.
Five kinds of carbon fibres were selected, including a vapour growth carbon fibre (VGCF; K1100X), a polyacrylonitrile-based fibre (PAN; M55JB by Toray Corp.), two mesophase pitch-based fibres (YS-15-60S and YS-70-60S by Nippon Graphite Fiber Corp.) and a pitch-based fibre (K13C2U by Mitsubishi Chemical Co.). They were irradiated by high-energy carbon, nickel and argon ions. Irradiation damages in the carbon fibres are expected to be uniform across the cross-section, as the diameters of the carbon fibres are about 20 �m and are sufficiently smaller than the ranges of ions.
The cross-sectional areas increased due to ion irradiation, with the exception of the K1100X of VGCF. One of the reasons for the increases is the swelling of carbon basal planes due to lattice defects in the graphite interlayer. The tensile strengths and the Young’s moduli decreased due to ion irradiation except for the K1100X of VGCF and the YS-15-60S of mesophase pitch-based fibres. One of the reasons for the decreases is thought to be that the microstructures of carbon fibres are damaged in the axial direction, as ions were irradiated vertically with respect to the longitudinal direction of carbon fibres. The results of this study indicate that the VGCF and the mesophase pitch-based carbon fibres could be useful as reinforcement fibres of new carbon composite materials having high thermal conductivity and excellent resistance to irradiation damage.

122
Introduction
Carbon/carbon composite materials have good nuclear characteristics, high thermal conductivity and excellent mechanical properties at high temperatures. They have been proposed as one of the candidate materials for plasma-facing components of the next fusion experimental reactors and for the cladding tube of the control rod of the high-temperature engineering test reactor (HTTR). In order to apply them to these tasks, study on the changes in material properties and microstructures due to irradiation damage is required, and the C/C composite materials must also be endowed with irradiation damage resistance. On the other hand, the material properties of the C/C composites are well known to depend on those of carbon fibres since carbon fibres in the C/C composite are generally less crystalline than the carbon matrix part. In this study, high-energy ions of carbon, nickel and argon are irradiated to carbon fibres with different microstructures and different properties, and the effects of ion irradiation damage on the tensile properties, the microstructures and the electric resistivity are evaluated.
Experimental
Carbon fibres
The materials tested in this study were five kinds of carbon fibres with different microstructures and different properties. They include a coal-tar-pitch-based carbon fibre (K13C2U), two mesophase pitch-based carbon fibres (YS-15-60S and YS-70-60S), a polyacrylonitrile-based carbon fibre (M55JB) and a vapour growth carbon fibre (K1100X). The K13C2U carbon fibre made by Mitsubishi Chemical Co. has high elasticity, low strength and random structure. The YS-15-60S and YS-70-60S carbon fibres made by Nippon Graphite Fiber Corp. have low elasticity, middle strength and random structure, and high elasticity, high strength and random structure, respectively. The M55JB carbon fibre made by Toray Industries, Inc. has middle elasticity, middle strength and skin/core structure. Finally, the K1100X carbon fibre made by BP-Amoco Co. has random structure.
Ion irradiation
Carbon ions (12C6+) of 100 MeV with 0.5 �A were irradiated to 1 � 10–5 dpa or 3 � 10–5 dpa, and nickel ions (59Ni13+) of 200 MeV with 0.4 �A were irradiated to 1 � 10–5 dpa or 5 � 10–4 dpa by the TANDEM accelerator in Tokai, JAERI. Argon ions (40Ar8+) of 175 MeV with 1 �A were irradiated to 1 � 10–3 dpa by the AVF cyclotron in Takasaki, JAERI. The ranges of carbon, nickel and argon ions calculated by the TRIM-98 code were 161, 25.5 and 38.4 �m for the carbon material of 2.2 g/cm3,respectively. Therefore, irradiation damages in carbon fibres were uniform across the cross-section because the diameters of carbon fibres below about 10 �m were sufficiently smaller than the ranges.�
SEM observation
The cross-section of the carbon fibre was observed by SEM, and the mean value of the cross-sectional area was evaluated from the photographs and used for calculation of the tensile strength.
Tensile test
The tensile test of the carbon fibre was performed in accordance with the JIS R 7601-1986 method. Figures 1 and 2 show the tensile specimen and the tensile test method of carbon fibres. The single carbon fibre was straightly put on the centre of a frame paper with a square hole using
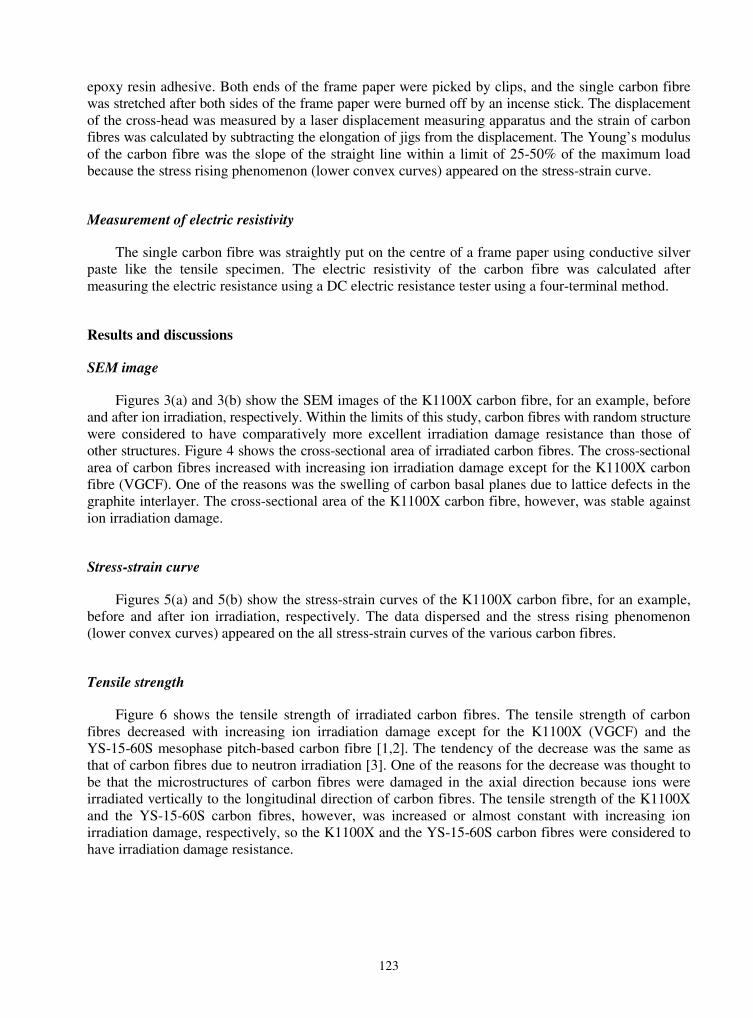
123
epoxy resin adhesive. Both ends of the frame paper were picked by clips, and the single carbon fibre was stretched after both sides of the frame paper were burned off by an incense stick. The displacement of the cross-head was measured by a laser displacement measuring apparatus and the strain of carbon fibres was calculated by subtracting the elongation of jigs from the displacement. The Young’s modulus of the carbon fibre was the slope of the straight line within a limit of 25-50% of the maximum load because the stress rising phenomenon (lower convex curves) appeared on the stress-strain curve.
Measurement of electric resistivity
The single carbon fibre was straightly put on the centre of a frame paper using conductive silver paste like the tensile specimen. The electric resistivity of the carbon fibre was calculated after measuring the electric resistance using a DC electric resistance tester using a four-terminal method.
Results and discussions
SEM image
Figures 3(a) and 3(b) show the SEM images of the K1100X carbon fibre, for an example, before and after ion irradiation, respectively. Within the limits of this study, carbon fibres with random structure were considered to have comparatively more excellent irradiation damage resistance than those of other structures. Figure 4 shows the cross-sectional area of irradiated carbon fibres. The cross-sectional area of carbon fibres increased with increasing ion irradiation damage except for the K1100X carbon fibre (VGCF). One of the reasons was the swelling of carbon basal planes due to lattice defects in the graphite interlayer. The cross-sectional area of the K1100X carbon fibre, however, was stable against ion irradiation damage.
Stress-strain curve
Figures 5(a) and 5(b) show the stress-strain curves of the K1100X carbon fibre, for an example, before and after ion irradiation, respectively. The data dispersed and the stress rising phenomenon (lower convex curves) appeared on the all stress-strain curves of the various carbon fibres.
Tensile strength
Figure 6 shows the tensile strength of irradiated carbon fibres. The tensile strength of carbon fibres decreased with increasing ion irradiation damage except for the K1100X (VGCF) and the YS-15-60S mesophase pitch-based carbon fibre [1,2]. The tendency of the decrease was the same as that of carbon fibres due to neutron irradiation [3]. One of the reasons for the decrease was thought to be that the microstructures of carbon fibres were damaged in the axial direction because ions were irradiated vertically to the longitudinal direction of carbon fibres. The tensile strength of the K1100X and the YS-15-60S carbon fibres, however, was increased or almost constant with increasing ion irradiation damage, respectively, so the K1100X and the YS-15-60S carbon fibres were considered to have irradiation damage resistance.
124
Young’s modulus
Figure 7 shows the Young’s modulus of irradiated carbon fibres. The Young’s modulus of carbon fibres tended to decrease with increasing ion irradiation damage, much like that of the tensile strength. The K1100X and the YS-15-60S carbon fibres had irradiation damage resistance.
Electric resistivity
Figure 8 shows the electric resistivity of irradiated carbon fibres. The electric resistivity of carbon fibres increased with increasing ion irradiation damage because of the increase in lattice defects. The decrease of the thermal conductivity was guessed to be the result of increased electric resistivity. The electric resistivity of the K1100X and the K13C2U carbon fibres, however, increased a little comparatively, so the K1100X and the K13C2U carbon fibres were considered to have irradiation damage resistance.
Conclusions
In this study, high-energy ions of carbon, nickel and argon were irradiated to carbon fibres with different microstructures and different properties, and the effects of ion irradiation damage on the tensile properties, the microstructures and the electric resistivity were evaluated. The K1100X of a vapour growth carbon fibre (VGCF) with random structure had the most excellent irradiation damage resistance. Therefore, the VGCF was effective to develop the excellent C/C composite materials with irradiation damage resistance.
Acknowledgements
The authors would like to thank the members of TANDEM accelerator in JAERI-Tokai and AVF cyclotron in JAERI-Takasaki, and Oarai branch, Institute for Materials Research, Tohoku University for their kind support. They also wish to thank Mitsubishi Chemical Co., Nippon Graphite Fiber Corp., Toray Industries, Inc. and BP-Amoco Co. which supplied the carbon fibres used in this study.
REFERENCES
[1] Oku, T., A. Kurumada, B. McEnaney, T.D. Burchell, M. Ishihara, K. Hayashi, S. Baba and J. Aihara, Eurocarbon 2000, 1st World Conference on Carbon, Berlin, Germany, 9-13 July 2000, Vol. II, 947-948.
[2] Oku, T., A. Kurumada, K. Kawamata and M. Inagaki, J. of Nuclear Materials, 303, 242-245 (2002).
[3] Oku, T., Y. Imamura, A. Kurumada, M. Inagaki and K. Kawamata, TANSO, No. 190, 262-266 (1999).

125
Figure 1. Tensile specimen of carbon fibres
��
�
�������25 0.5
45
10 20
Carbon fibre
(mm)
Figure 2. Tensile test method of carbon fibres
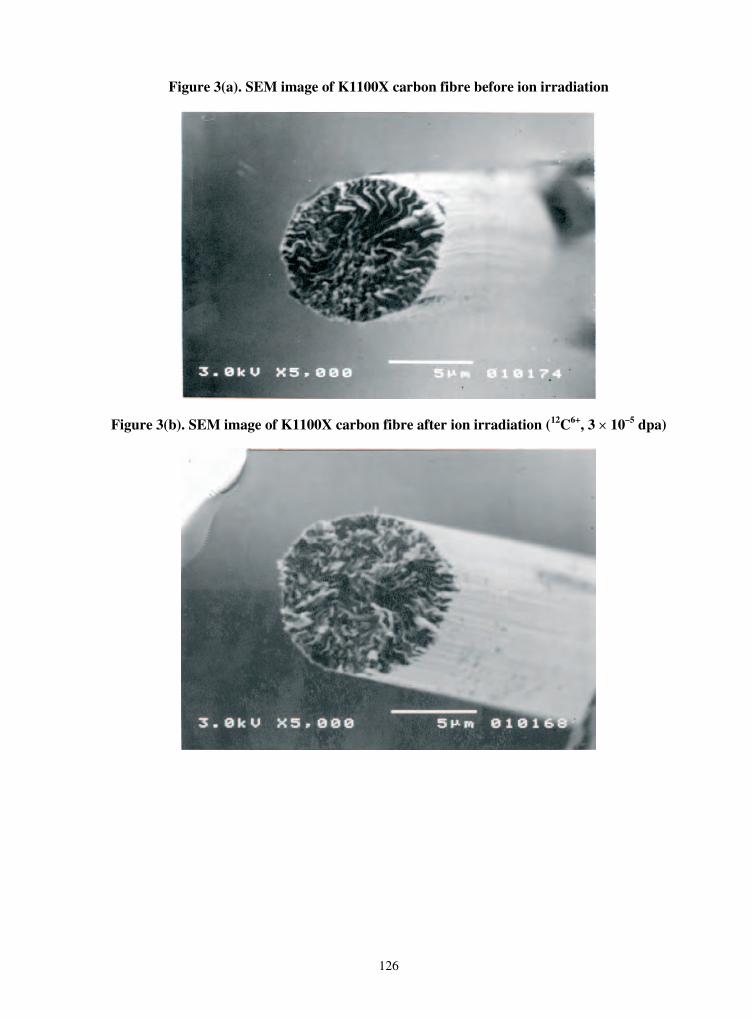
126
Figure 3(a). SEM image of K1100X carbon fibre before ion irradiation
Figure 3(b). SEM image of K1100X carbon fibre after ion irradiation (12C6+, 3 � 10–5 dpa)�
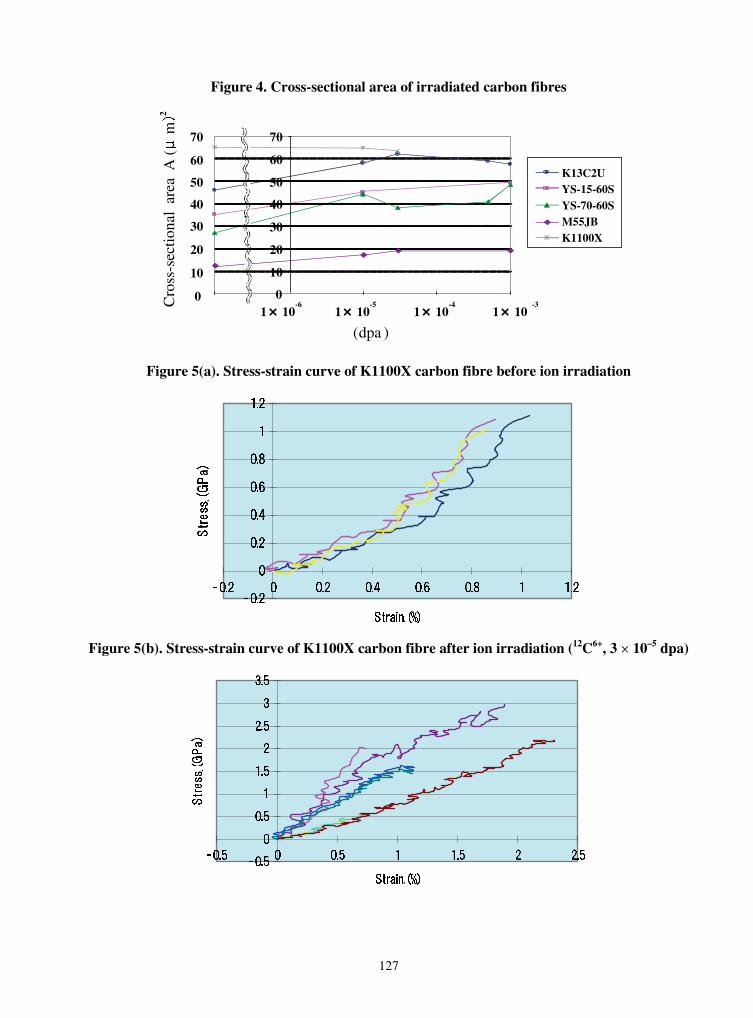
127
Figure 4. Cross-sectional area of irradiated carbon fibres
Cro
ss-s
ectio
nal
area
A (
m
(dpa )
0.01 0.1 1 10 1001� 10-6 -5 -4 -3
1� 10 1� 101� 10
2K13C2UYS-15-60SYS-70-60SM55JBK1100X
70
60
50
40
30
20
10
0 0
10
20
30
40
50
60
70
Figure 5(a). Stress-strain curve of K1100X carbon fibre before ion irradiation
Figure 5(b). Stress-strain curve of K1100X carbon fibre after ion irradiation (12C6+, 3 � 10–5 dpa)�

128
Figure 6. Tensile strength of irradiated carbon fibres
0.01 0.1 1 10 100Ten
sile
str
engt
h (G
Pa)
1� 10 1� 10
(dpa)
0
1
2
3
4
5
6
K13C2U
YS-15-60S
YS-70-60S
M55JB
K1100X
1� 10-6
1� 10-5 -4 -3
6
5
4
3
2
1
0
Figure 7. Young’s modulus of irradiated carbon fibres
1� 10 1� 10 1� 10 1� 10-5-6 -4 -3
You
ng’s
mod
ulus
E (
GPa
)
(dpa)
100
200
300
400
500
600
700
800
M55JB
K1100X
YS-70-60S
YS-15-60S
K13C2U
0
800
700
600
500
400
300
200
100
0
Figure 8. Electric resistivity of irradiated carbon fibres
0
2
4
6
8
10
12
K13C2U
YS-15-60S
YS-70-60S
M55JB
K1100K
0 1� 10-6
1� 10 1� 10 1� 10-5 -4 -3
(dpa)
Ele
ctri
c re
sist
ivit
y (�
m
129
ANALYSIS OF CRACK PROPAGATION IN NUCLEAR GRAPHITE USING THREE-POINT BENDING OF SANDWICHED SPECIMENS
Li Shi, Siu Lun Fok, Barry J. Marsden Manchester School of Engineering, University of Manchester
Oxford Road, Manchester, United Kingdom, M13 9PL
Lisa Ng, Paul Mummery, James Marrow Manchester Materials Science Centre, University of Manchester and UMIST
Grosvenor St., Manchester, United Kingdom, M1 7HS
Abstract
Three-point bend testing of sandwiched specimens has been applied to nuclear graphite. This test geometry gives stable crack propagation, which allows optical imaging of the crack path and the crack tip process zone. Direct measurement of specimen strains by electronic speckle pattern interferometry (ESPI) has been used to monitor the crack tip strain distribution. Image correlation techniques have also been employed to study the crack tip process zone.
The sandwich bend test has been simulated using a continuum damage mechanics (CDM) model, which has been developed for nuclear graphite. The model has been implemented into the commercial finite element code ABAQUS via the user element subroutine (UEL). The model can be used to predict both the initiation and propagation of cracks in components under mechanical loading. The aim of this simulation is to verify the CDM model against the existing experimental data.
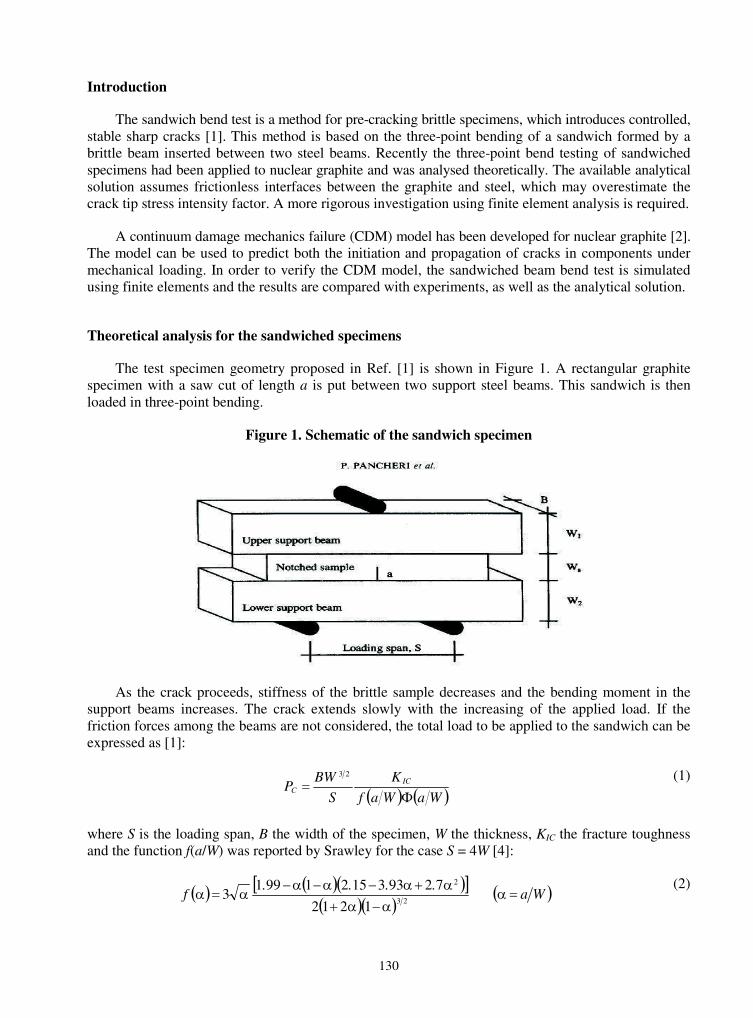
130
Introduction
The sandwich bend test is a method for pre-cracking brittle specimens, which introduces controlled, stable sharp cracks [1]. This method is based on the three-point bending of a sandwich formed by a brittle beam inserted between two steel beams. Recently the three-point bend testing of sandwiched specimens had been applied to nuclear graphite and was analysed theoretically. The available analytical solution assumes frictionless interfaces between the graphite and steel, which may overestimate the crack tip stress intensity factor. A more rigorous investigation using finite element analysis is required.
A continuum damage mechanics failure (CDM) model has been developed for nuclear graphite [2]. The model can be used to predict both the initiation and propagation of cracks in components under mechanical loading. In order to verify the CDM model, the sandwiched beam bend test is simulated using finite elements and the results are compared with experiments, as well as the analytical solution.
Theoretical analysis for the sandwiched specimens
The test specimen geometry proposed in Ref. [1] is shown in Figure 1. A rectangular graphite specimen with a saw cut of length a is put between two support steel beams. This sandwich is then loaded in three-point bending.
Figure 1. Schematic of the sandwich specimen
As the crack proceeds, stiffness of the brittle sample decreases and the bending moment in the support beams increases. The crack extends slowly with the increasing of the applied load. If the friction forces among the beams are not considered, the total load to be applied to the sandwich can be expressed as [1]:
� � � �WaWaf
K
S
BWP IC
C�
�23 (1)
where S is the loading span, B the width of the specimen, W the thickness, KIC the fracture toughness and the function f(a/W) was reported by Srawley for the case S = 4W [4]:
� � � �� �� �� �� � 23
2
1212
7293315219913
����������
���....
f � �Wa��(2)

131
The non-dimensional function �(a/W) can be defined as:
� � � �� � � � � �samplebeamstot
sample
EIEIEI
EIWa
���
1
1 (3)
where (EI)beams is the sum of the flexural stiffness of the support beams, (EI)sample is the flexural stiffness of the graphite sample and (EI)tot = (EI)beams + (EI)sample. (EI)sample depends on the crack length, i.e. on the ratio a/W, and it can be expressed as:
� �� �
� � � �43223
0324306372256639199201 ��������� .....
EI
EI
sample
sample (4)
where � �0
sampleEI is the flexural stiffness evaluated at a/W = 0, i.e. with no crack.
Curves of load versus the relative crack length a/W for different KIC values can be obtained using Eq. (1). For the specimen geometry of interest, Bsample = 5 mm, a = 1 mm, W = 5 mm, S = 20 mm, W1 = W2 = 2.5 mm and Bsteel = 5.75 mm. The loads required to achieve different a/W were calculated for KIC values of 2.0 MPam–1/2, 1.5 MPam–1/2, 1.0 MPam–1/2 and 0.5 MPam–1/2; see Figure 2.
Figure 2. Theoretical results for the bending of sandwiched beam
The analytical solution [1] makes some simplifications. Firstly, the frictional forces between the beams have been neglected. Moreover, the effect of sandwiching on the stress distribution in the cracked sample is not known and, hence, the use of Eq. (1) is only valid at first approximation.
Experimental work
The sandwiched bending test has been applied to a fine grain size nuclear graphite (RG10) to assess the analytical solution. This graphite was chosen because it does not exhibit strong R-curve
KIC=2.0Mpam-1/2
KIC=1.5Mpam-1/2
KIC=1.0Mpam-1/2
KIC=0.5Mpam-1/2

132
behaviour. The dimensions of the specimen are the same as those used in the analytical work in the previous section. However, a V-shape notch was machined into the specimen instead of a slit, as shown in Figure 3.
Figure 3. Schematic of the specimen used in experimental work
Stable crack propagation allows optical imaging of the crack path and the crack tip process zone. Direct measurement of specimen strains is achieved by electronic speckle pattern interferometry (ESPI). By recording a series of speckle patterns, taken as the sample is loaded, ESPI makes it possible to build up a two-dimensional strain contour map of the surface. Image correlation techniques have also been employed to study the crack tip process zone. The image of crack propagation obtained using optical image correlation is shown in Figure 4, while the strain distribution using ESPI is shown in Figure 5.
The relationship between the crack propagation load and crack length is given in Figure 6. The data is consistent with a fracture toughness of 2 MPam–1/2 for a/W values above 0.3. The V-notch may be the cause of disagreement at lower values of a/W as the analytical solution is for a slit.
The typical fracture toughness value for nuclear graphite is approximately 1.0-1.5 MPam–1/2 [6], however, which is much lower than the value suggested by the analytical solution of the sandwich beam specimen. The assumptions in the analytical solution could lead to this error, and a more detailed analysis was therefore conducted, using a continuum damage mechanics finite element model.
Figure 4. The optical image of the crack path
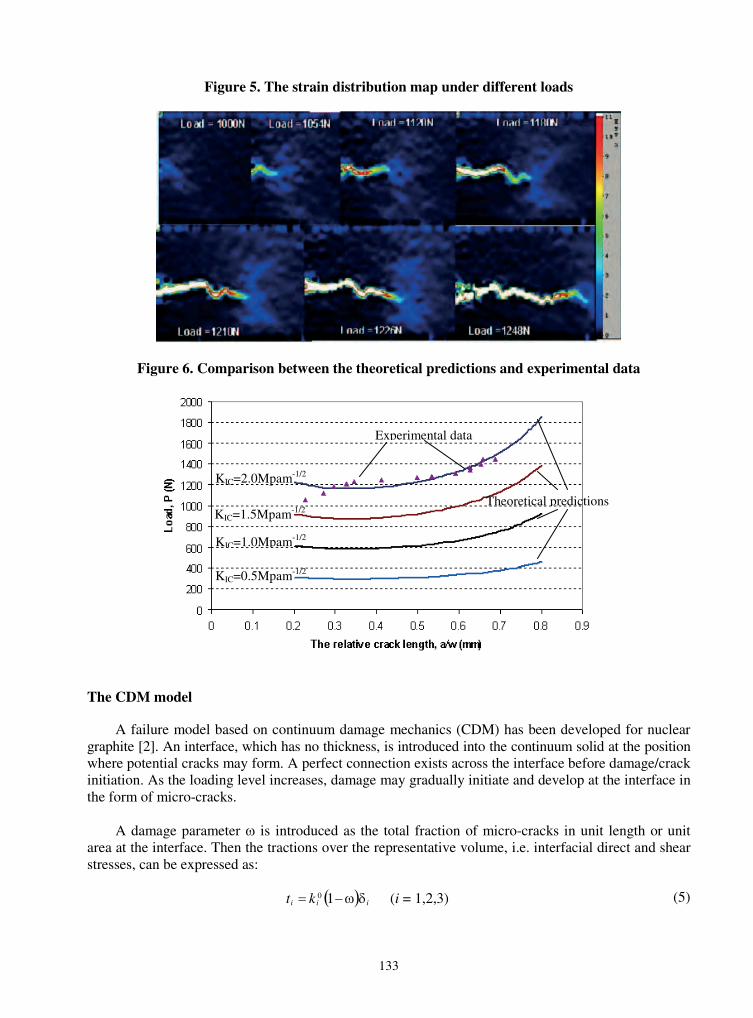
133
Figure 5. The strain distribution map under different loads
Figure 6. Comparison between the theoretical predictions and experimental data
The CDM model
A failure model based on continuum damage mechanics (CDM) has been developed for nuclear graphite [2]. An interface, which has no thickness, is introduced into the continuum solid at the position where potential cracks may form. A perfect connection exists across the interface before damage/crack initiation. As the loading level increases, damage may gradually initiate and develop at the interface in the form of micro-cracks.
A damage parameter is introduced as the total fraction of micro-cracks in unit length or unit area at the interface. Then the tractions over the representative volume, i.e. interfacial direct and shear stresses, can be expressed as:
� � iii kt ��� 10 (i = 1,2,3) (5)
KIC=2.0Mpam-1/2
KIC=1.5Mpam-1/2
KIC=1.0Mpam-1/2
KIC=0.5Mpam-1/2
Experimental data
Theoretical predictions
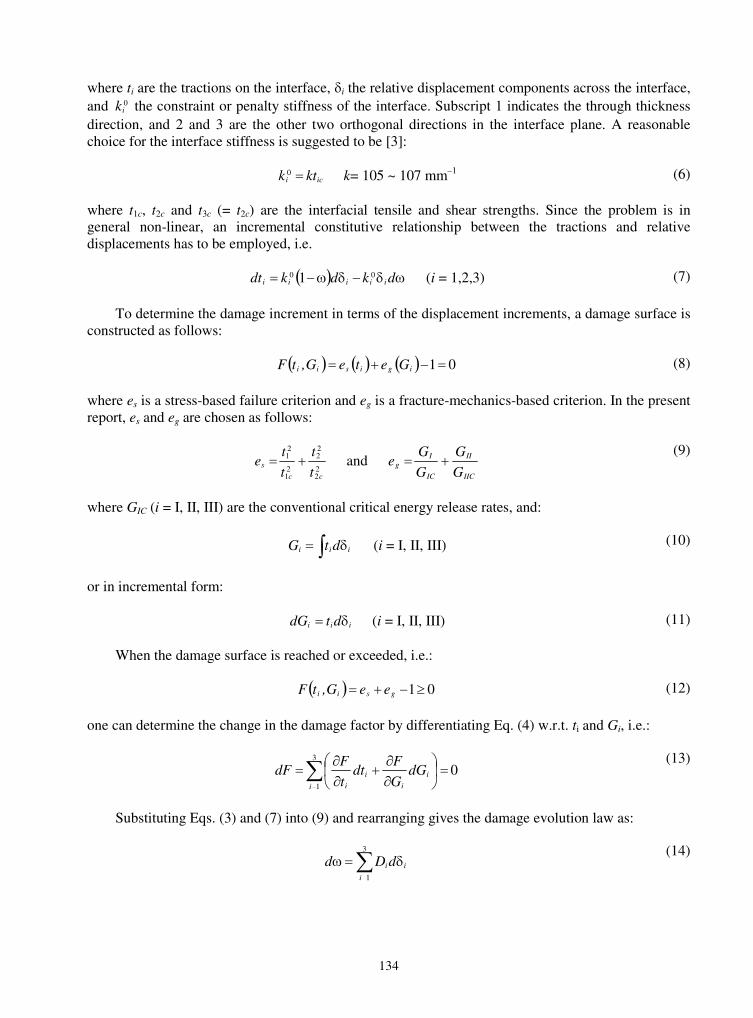
134
where ti are the tractions on the interface, �i the relative displacement components across the interface, and 0
ik the constraint or penalty stiffness of the interface. Subscript 1 indicates the through thickness direction, and 2 and 3 are the other two orthogonal directions in the interface plane. A reasonable choice for the interface stiffness is suggested to be [3]:
ici ktk �0 k= 105 ~ 107 mm–1 (6)
where t1c, t2c and t3c (= t2c) are the interfacial tensile and shear strengths. Since the problem is in general non-linear, an incremental constitutive relationship between the tractions and relative displacements has to be employed, i.e.
� � ����� dkdkdt iiiii00 1 (i = 1,2,3) (7)
To determine the damage increment in terms of the displacement increments, a damage surface is constructed as follows:
� � � � � � 01��� igisii GeteG,tF (8)
where es is a stress-based failure criterion and eg is a fracture-mechanics-based criterion. In the present report, es and eg are chosen as follows:
22
22
21
21
cc
st
t
t
te � and
IIC
II
IC
Ig
G
G
G
Ge �
(9)
where GIC (i = I, II, III) are the conventional critical energy release rates, and:
� �� iii dtG (i = I, II, III) (10)
or in incremental form:
iii dtdG �� (i = I, II, III) (11)
When the damage surface is reached or exceeded, i.e.:
� � 01 �� gsii eeG,tF (12)
one can determine the change in the damage factor by differentiating Eq. (4) w.r.t. ti and Gi, i.e.:
03
1
���
���
���
��
���i
i
i
i
i
dGG
Fdt
t
FdF
(13)
Substituting Eqs. (3) and (7) into (9) and rearranging gives the damage evolution law as:
��
��3
1i
iidDd(14)

135
where:
� � jj
j j
i
i
i
i
i kt
Ft
G
Fk
t
FD �
��
��
���
���
���
� ��
03
1
01(15)
The incremental interfacial constitutive law can then be obtained in terms of the incremental relative displacements as:
� � ��
������3
1
001j
jjiiiii dDkdkdt(16)
When the interfacial stresses are within the damage surface, i.e.:
� � 01��� gsii eeG,tF (17)
no damage development can occur, thus:
0�d (18)
and the incremental constitutive law simplifies to:
� � iii dkdt ��� 01 (19)
This situation may happen in the case of low stress level or local unloading.
Once the stress-based failure function es reaches unity, crack/damage initiates. As the relative displacements continue to increase, damage develops while tractions decrease. When the fracture mechanics-based failure function eg equals unity, the damage parameter reaches unity at the same time. The tractions are reduced to zero and complete crack surfaces are formed.
Finite element simulation for slit specimen
A finite element analysis with 2-D quadrilateral plane-strain elements was employed, using the same geometry as the analytical solution [1]. The finite element mesh with a predefined slit to model the sharp crack is shown in Figure 7. The mesh contains both graphite and steel beams.
Figure 7. FE mesh for the simulation of theoretical work
a b
Prescribed displacement
c
A
A
Steel
Steel
Graphite

136
The displacement in the vertical direction at nodes a and b was restricted, and a prescribed displacement was applied at node c. The frictional forces between the beams were not considered. In the present model, the crack path was located on the vertical line AA. There were dual coincident nodes along the assumed crack path, for the introduction of interface elements. To capture the stress concentration along the crack, the mesh around the interface was much finer than that in the main region. Models with different numbers of interface elements along the assumed crack path were analysed and the results were compared with each other. It was found that 40 or more interface elements would provide a converged failure load. The final model used 80 interface elements.
The properties of the graphite material in the model were [7]:
E = 10.0 GPa, � = 0.2, t1c = 20 MPa
It was assumed that t1c = t2c and GIC = GIIC. The critical energy release rate GIC can be expressed using Wessel’s formula [5] as:
E.KG II 0412� , E.KG IIII 0412� (20)
Different fracture toughness values can be defined by changing the critical energy release rate GIC. In the present analysis, models with KIC equal to 1.5 MPam–1/2, 1.0 MPam–1/2 and 0.5 MPam–1/2
were simulated. These had equivalent values of GIC of 216, 96and 24 Jm–2.
The prescribed displacement increased from 0 to 0.15 mm step by step, with about 100 increments. At every increment, the reaction force at the loading point and the damage of each interface element was recorded. When the damage factor [Eq. (5)], , is equal to 1.0 or larger, the damaged interface element is fully opened, and then it becomes part of the crack. The crack length can be obtained from the number of fully damaged elements.
The relationship between crack propagation load and crack length predicted by the model is shown in Figure 8. The finite element model predicts higher failure loads for a given fracture toughness than the analytical solution.
Figure 8. Graph of load P versus a/W for different KIC
values (theoretical results and finite element predictions)

137
Finite element simulations for V-notched specimen
The experimental specimen geometry was then simulated using the CDM model. The finite element mesh is shown in Figure 9. All the material properties and boundary conditions are the same as in the previous simulation. The V-notch was modelled, replacing the slit. The analysis was carried out with and without friction between the graphite and steel.
Figure 9. FE mesh for the simulation of the experimental work
a b
Predefined displacement
c
A typical plot showing the deformed shape and the von-Mises stress contour is shown in Figure 10.
Figure 10. The stress contour and the crack path from the FE analysis
Figure 11 compares the behaviour without friction with the experimental data. It should be pointed out that the FE predictions in Figure 11 for the V-notched specimen are quite similar to, but not as smooth as, those for the slit model in Figure 8. The agreement is reasonable for a/W less than 0.35 with a value of K1C of approximately 1.5 MPam–1/2. However, the agreement is poor for higher values of a/W.
Figure 12 shows the FE predictions with an interfacial friction coefficient of 0.1, which more accurately simulates the experiment. Good agreement is obtained between the model and experimental data for KIC of 1.2 MPam–1/2 and a/W < 0.5.
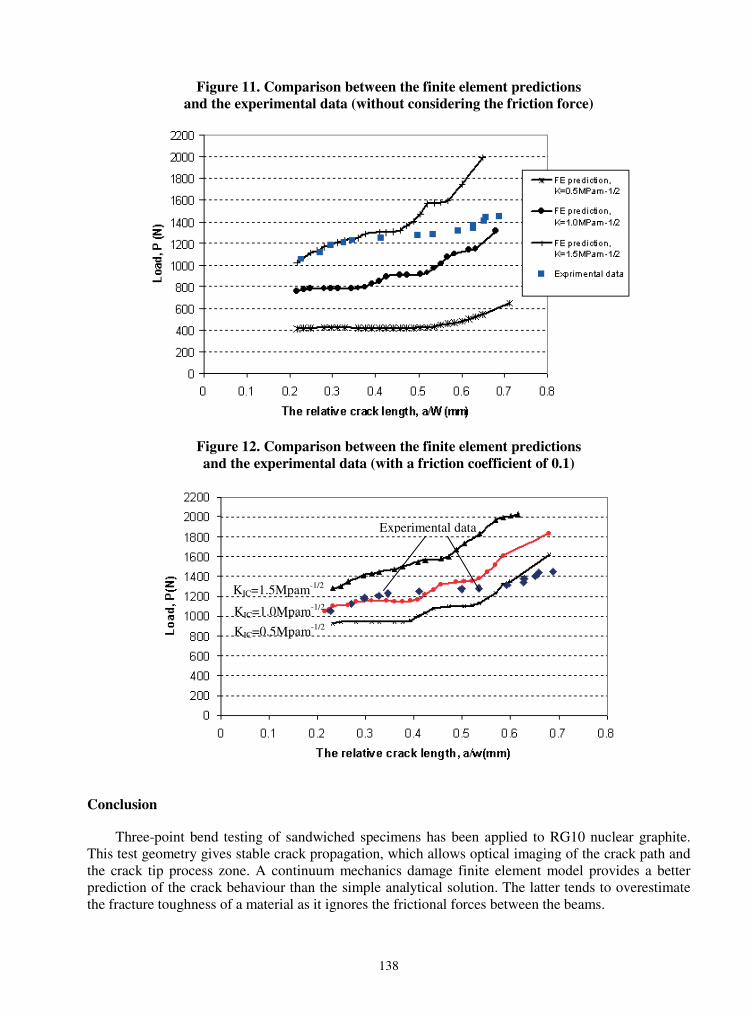
138
Figure 11. Comparison between the finite element predictions and the experimental data (without considering the friction force)
Figure 12. Comparison between the finite element predictions and the experimental data (with a friction coefficient of 0.1)
Conclusion
Three-point bend testing of sandwiched specimens has been applied to RG10 nuclear graphite. This test geometry gives stable crack propagation, which allows optical imaging of the crack path and the crack tip process zone. A continuum mechanics damage finite element model provides a better prediction of the crack behaviour than the simple analytical solution. The latter tends to overestimate the fracture toughness of a material as it ignores the frictional forces between the beams.
KIC=1.5Mpam-1/2
KIC=1.0Mpam-1/2
KIC=0.5Mpam-1/2
Experimental data
139
Acknowledgements
The financial support of the Health and Safety Executive through contract NUC/56/60/5 is gratefully acknowledged. The views expressed in this paper are those of the authors and do not necessarily represent the views of the Health and Safety Commission/Executive.
REFERENCES
[1] Pancheri, Paolo, Paolo Bosetti, Roberto Dal Maschio and Vincenzo M. Sglavo, “Production of Sharp Cracks in Ceramic Materials by Three-point Bending of Sandwiched Specimens”, Engineering Fracture Mechanics, Vol. 59, No. 4, pp. 447-456 (1998).
[2] Zou, Z., S.L. Fok, B.J. Marsden, “Failure Predictions for Nuclear Graphite using a Continuum Damage Mechanics Model”, to appear in J. of Nuclear Materials.
[3] Zou, Z., S.R. Reid, S. Li and P.D. Soden, “Modelling Interlaminar and Intralaminar Damage in Filament would Pipes under Quasi-static Indentation”, J. Compos. Mater., 36, 477-499 (2002).
[4] Srawley, J.E., “Wide Range Stress Intensity Factor Expression for ASTM E399 Standard Fracture Toughness Specimens”, International Journal of Fractures, 1976, 12, 475-476.
[5] Wessel, E.T., Engineering Fracture Mechanic, (1) 1 (1968).
[6] Rodic, M., Kleist, G., Nickel, H., “Fracture Mechanics Applied to Reactor Graphite, IWGHTR-3, Mechanical Behaviour of Graphite for HTRs”, Specialists Meeting on Mechanical Behaviour of Graphite for HTRs, Gif-sur-Yvette, France, 11-13 June 1979.
[7] Compendium of CARG Core and Sleeve Data and Methods, CSDMC/p28, Data Sheet C2/1, British Energy, October 1994.
141
STUDY ON MULTI-AXIAL STRENGTH MODEL TAKING ACCOUNT OF GRAIN/PORE MICROSTRUCTURE
Satoshi Hanawa*Japan Atomic Energy Research Institute, Oarai Research Establishment
3607, Oarai, Higashiibaraki, Ibarak, 311-1394, Japan * S. Hanawa is also studying in a special course of the graduate school, Ibaraki University
Masahiro IshiharaJapan Atomic Energy Research Institute, Oarai Research Establishment
3607, Oarai, Higashiibaraki, Ibaraki, 311-1394, Japan
Yoshinobu MotohashiResearch Center for Superplasticity, Ibaraki University
4-12-1, Nakanarusawa, Hitachi, Ibaraki, Japan
Abstract
In the structural design of graphite components, a great number of strength data are used to define the design strength, the so-called “minimum ultimate strength” in the graphite design code. However, as no appropriate fracture theory existed for graphite, large safety margins had to be introduced in the design criteria. It is thus important to apply a realistic fracture model in the design method. In this study, we expanded the microstructure-based brittle fracture model, making it possible to treat grain size as well as pore size with a fracture mechanics approach taking into account the crystal structure of the graphite, to multi-axial stress condition. The model was then applied to the bi-axial strength prediction of near isotropic nuclear graphite using grain/pore related micro-structural parameters. Prediction results were compared with bi-axial strength data obtained by simultaneous loadings of inner pressure and longitudinal load with thin-walled cylindrical specimen. From this study, it was found that the fracture model predicted fairly good not only mean strength but also strength distribution under bi-axial stress condition. It was concluded that the microstructure-based brittle fracture model would be applicable as an advanced design method.

142
Background
The structural design method of graphite materials is slightly different from metallic materials because of brittle material behaviour. In the structural design of graphite materials, stress in the structure is limited with several categorised stresses such as membrane stress, bending stress and/or peak stress, as is well known. These stress limits are stipulated from an empirical viewpoint of the structural integrity so that the structure does not fracture under stress gradient condition. In the field of structural design of graphite components, the maximum principal stress theory had been applied as multi-axial fracture theory [1], taking its simplicity into account. However, an “unsafety” region exists in the design criteria, as shown in Figure 1. Namely, it is important to introduce the more realistic fracture surface in the advanced component design philosophy.
Figure 1. Multi-axial fracture limit under maximum principal stress theory
As the graphite component design approach, there are several promising models to evaluate the strength of graphite with statistical approach, e.g. the Weibull theory [2,3], competing risk-based fracture model [4], etc. The Weibull theory treats only macroscopic strength with a probabilistic procedure considering the stress profile. The competing risk-based fracture model is similar to the Weibull strength model. The advantage of this model is to treat different macroscopic fracture models, e.g. surface flaw dominated fracture mode as well as internal flaw dominated fracture mode. Several researchers also proposed a microstructure-based fracture theory of graphite applicable to tensile strength prediction [5-8] as well as to bending strength prediction [9]. The authors have also studied the applicability of the microstructure-based brittle fracture model to predict the tensile and bending strengths [10,11]. Moreover, the authors have studied the grain size effect on strength, volume effect on strength and so on [12], and clarify the applicability to the structural design of graphite components under uni-axial conditions [13].
From a standpoint of the advanced component design philosophy, it is expected that the more realistic fracture model will eliminate the unsafety region. We thus expand the microstructure-based brittle fracture model to cover the multi-axial stress condition, and then the applicability of the expanded model is treated in this paper. The model performance is examined from comparison with experimental data of near isotropic nuclear graphite. Grain size effect on strength under multi-axial condition is also discussed in this paper.
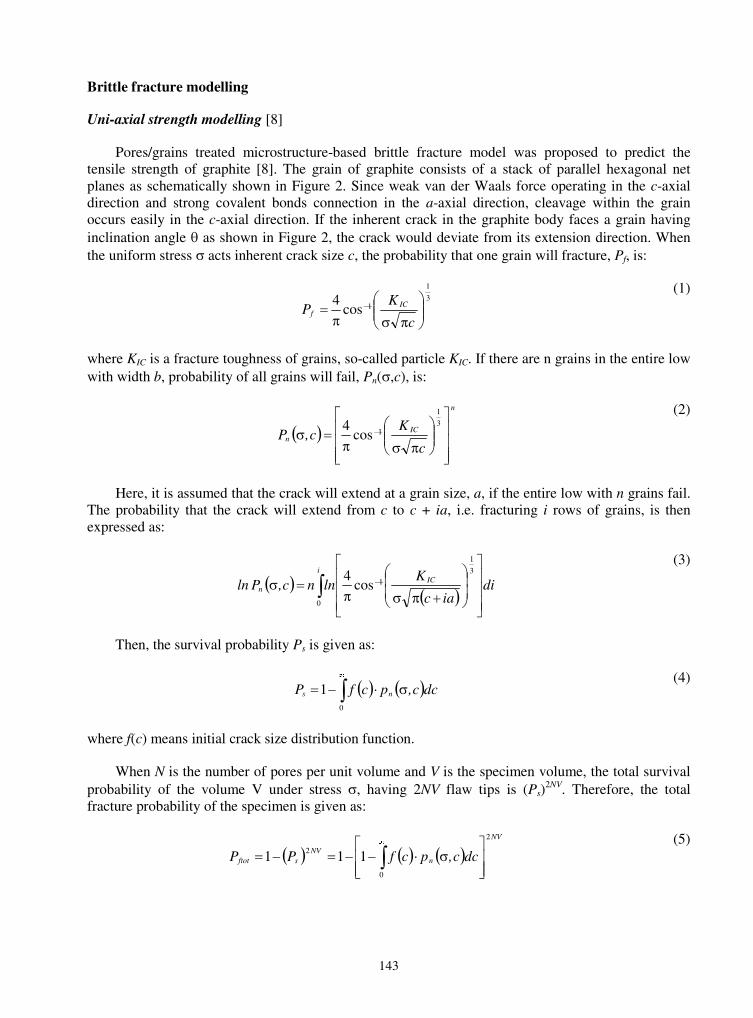
143
Brittle fracture modelling
Uni-axial strength modelling [8]
Pores/grains treated microstructure-based brittle fracture model was proposed to predict the tensile strength of graphite [8]. The grain of graphite consists of a stack of parallel hexagonal net planes as schematically shown in Figure 2. Since weak van der Waals force operating in the c-axial direction and strong covalent bonds connection in the a-axial direction, cleavage within the grain occurs easily in the c-axial direction. If the inherent crack in the graphite body faces a grain having inclination angle � as shown in Figure 2, the crack would deviate from its extension direction. When the uniform stress � acts inherent crack size c, the probability that one grain will fracture, Pf, is:�
3
1
1cos4
���
����
�
� �
c
KP IC
f
(1)
where KIC is a fracture toughness of grains, so-called particle KIC. If there are n grains in the entire low with width b, probability of all grains will fail, Pn(�,c), is:�
� �n
ICn
c
Kc,P
�
�
���
�
�
���
����
�
�� �
3
1
1cos4
(2)
Here, it is assumed that the crack will extend at a grain size, a, if the entire low with n grains fail. The probability that the crack will extend from c to c + ia, i.e. fracturing i rows of grains, is then expressed as:
� �� �
diiac
Klnnc,Pln IC
i
n
�
�
���
�
�
���
����
�
��� ��
3
1
1
0
cos4
(3)
Then, the survival probability Ps is given as:
� � � ���
���0
1 dcc,pcfP ns
(4)
where f(c) means initial crack size distribution function.
When N is the number of pores per unit volume and V is the specimen volume, the total survival probability of the volume V under stress �, having 2NV flaw tips is (Ps)
2NV. Therefore, the total fracture probability of the specimen is given as:�
� � � � � �NV
nNV
sftot dcc,pcfPP
2
0
2 111 �
�
���
������ �
� (5)
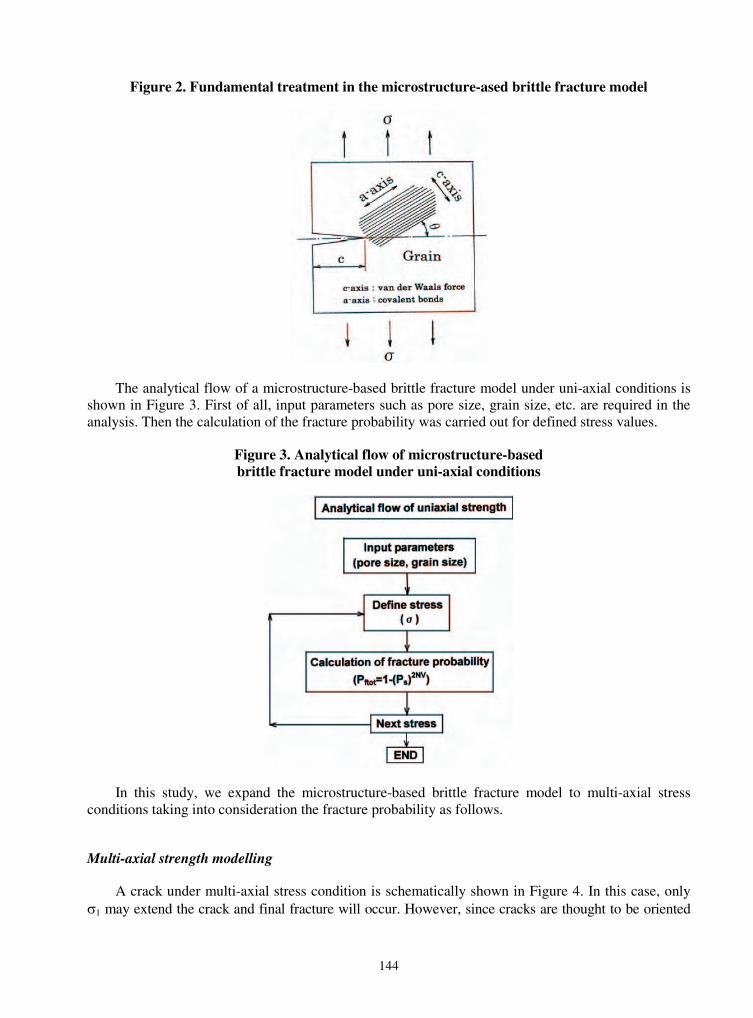
144
Figure 2. Fundamental treatment in the microstructure-ased brittle fracture model
The analytical flow of a microstructure-based brittle fracture model under uni-axial conditions is shown in Figure 3. First of all, input parameters such as pore size, grain size, etc. are required in the analysis. Then the calculation of the fracture probability was carried out for defined stress values.
Figure 3. Analytical flow of microstructure-based brittle fracture model under uni-axial conditions
In this study, we expand the microstructure-based brittle fracture model to multi-axial stress conditions taking into consideration the fracture probability as follows.
Multi-axial strength modelling
A crack under multi-axial stress condition is schematically shown in Figure 4. In this case, only �1 may extend the crack and final fracture will occur. However, since cracks are thought to be oriented
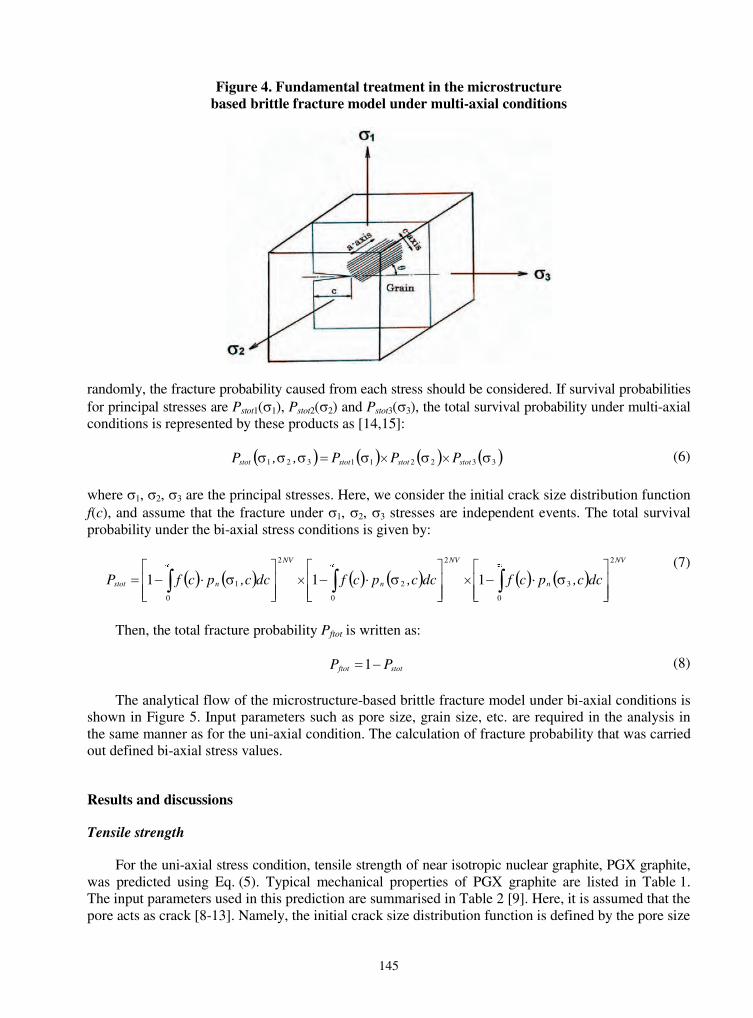
145
Figure 4. Fundamental treatment in the microstructure based brittle fracture model under multi-axial conditions
randomly, the fracture probability caused from each stress should be considered. If survival probabilities for principal stresses are Pstot1(�1), Pstot2(�2) and Pstot3(�3), the total survival probability under multi-axial conditions is represented by these products as [14,15]:
� � � � � � � �332211321 �������� stotstotstotstot PPP,,P (6)
where �1, �2, �3 are the principal stresses. Here, we consider the initial crack size distribution function f(c), and assume that the fracture under �1, �2, �3 stresses are independent events. The total survival probability under the bi-axial stress conditions is given by:
� � � � � � � � � � � �NV
n
NV
n
NV
nstot dcc,pcfdcc,pcfdcc,pcfP
2
0
3
2
0
2
2
0
1 111 �
�
���
�����
�
�
���
�����
�
�
���
���� ���
��� (7)
Then, the total fracture probability Pftot is written as:
stotftot PP �1 (8)
The analytical flow of the microstructure-based brittle fracture model under bi-axial conditions is shown in Figure 5. Input parameters such as pore size, grain size, etc. are required in the analysis in the same manner as for the uni-axial condition. The calculation of fracture probability that was carried out defined bi-axial stress values.
Results and discussions
Tensile strength
For the uni-axial stress condition, tensile strength of near isotropic nuclear graphite, PGX graphite, was predicted using Eq. (5). Typical mechanical properties of PGX graphite are listed in Table 1. The input parameters used in this prediction are summarised in Table 2 [9]. Here, it is assumed that the pore acts as crack [8-13]. Namely, the initial crack size distribution function is defined by the pore size

146
Figure 5. Analytical flow of microstructure-based brittle fracture model under bi-axial conditions
Table 1. Typical mechanical properties of PGX graphite
Tensile strength (MPa) 08.10Compressive strength (MPa) 30.60Bending strength (MPa) 13.20Young’s modulus* (GPa) 06.80Poisson’s ratio 00.11
* Secant modulus defined by two points on the stress-strain curve at ¼ of the minimum ultimate tensile and compressive strengths.
Table 2. Input parameters of PGX graphite [9]
Parameter Value Mean grain size (�m) 762Bulk density (g/cm3) 1.74 Mean pore size (�m) 238Standard deviation parameter of pore size 1.73 Number of pores per volume (m–3) 0.187 � 108
Grain fracture toughness (MN/m3/2) 0.225
distribution. Moreover, it is assumed that the pore distribution is to be a log-normal statistical distribution [8-13]. The prediction result is compared with experimental data [9] in Figure 6. We can see from this figure that the predicted result has a good agreement with experimental data.

147
Figure 6. Comparison between experimental data and analytical results of tensile strength under uni-axial stress conditions
Bi-axial strength
Ho, et al. obtained the bi-axial strength of PGX graphite with thin-walled cylindrical specimen as shown in Figure 7 [16]. Simultaneous loading with internal pressure and longitudinal load produced the bi-axial stress condition in this experiment. Figure 8 shows the prediction and experimental results under bi-axial stress condition with a stress ratio of �1/�2 = 1.0. The mean strengths of prediction and experiment are 8.5 MPa and 8.7 MPa, respectively. We can see from this figure that the prediction is in good agreement with the experimental data. The mean strength ratios of bi-axial to uni-axial strength are summarised in Table 3. The strength ratios by prediction and experiment are the same, 0.95. It is considered that a lot of pores are distributed randomly in the graphite body. If uni-axial stress �1 is applied, parallel cracks to �1 stress as shown in Figure 9 do not cause the fracture. However, if bi-axial stresses �1 and �2 are applied, parallel cracks to �1 stress���������������� ��������������2 stress. This is thought to be the reason why the bi-axial strength is lower than the uni-axial strength.
Figure 7. Shape of the bi-axial test specimen [16]
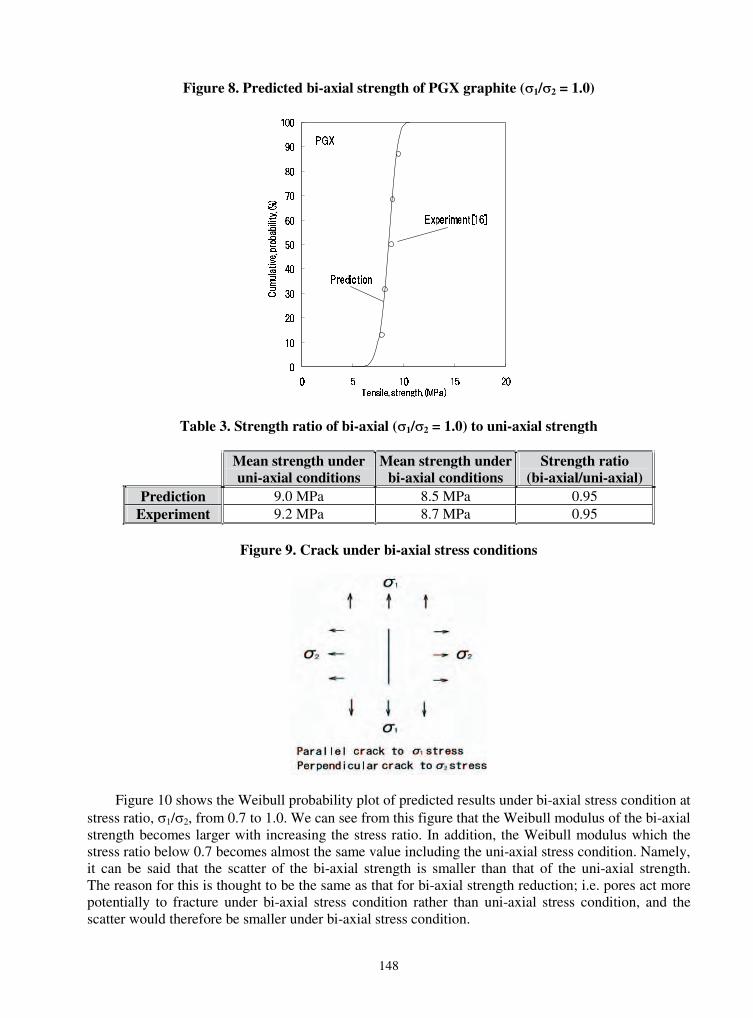
148
Figure 8. Predicted bi-axial strength of PGX graphite (�1/�2 = 1.0)�
Table 3. Strength ratio of bi-axial (�1/�2 = 1.0) to uni-axial strength�
Mean strength under uni-axial conditions
Mean strength under bi-axial conditions
Strength ratio (bi-axial/uni-axial)
Prediction 9.0 MPa 8.5 MPa 0.95 Experiment 9.2 MPa 8.7 MPa 0.95
Figure 9. Crack under bi-axial stress conditions
Figure 10 shows the Weibull probability plot of predicted results under bi-axial stress condition at stress ratio, �1/�2, from 0.7 to 1.0. We can see from this figure that the Weibull modulus of the bi-axial strength becomes larger with increasing the stress ratio. In addition, the Weibull modulus which the stress ratio below 0.7 becomes almost the same value including the uni-axial stress condition. Namely, it can be said that the scatter of the bi-axial strength is smaller than that of the uni-axial strength. The reason for this is thought to be the same as that for bi-axial strength reduction; i.e. pores act more potentially to fracture under bi-axial stress condition rather than uni-axial stress condition, and the scatter would therefore be smaller under bi-axial stress condition.
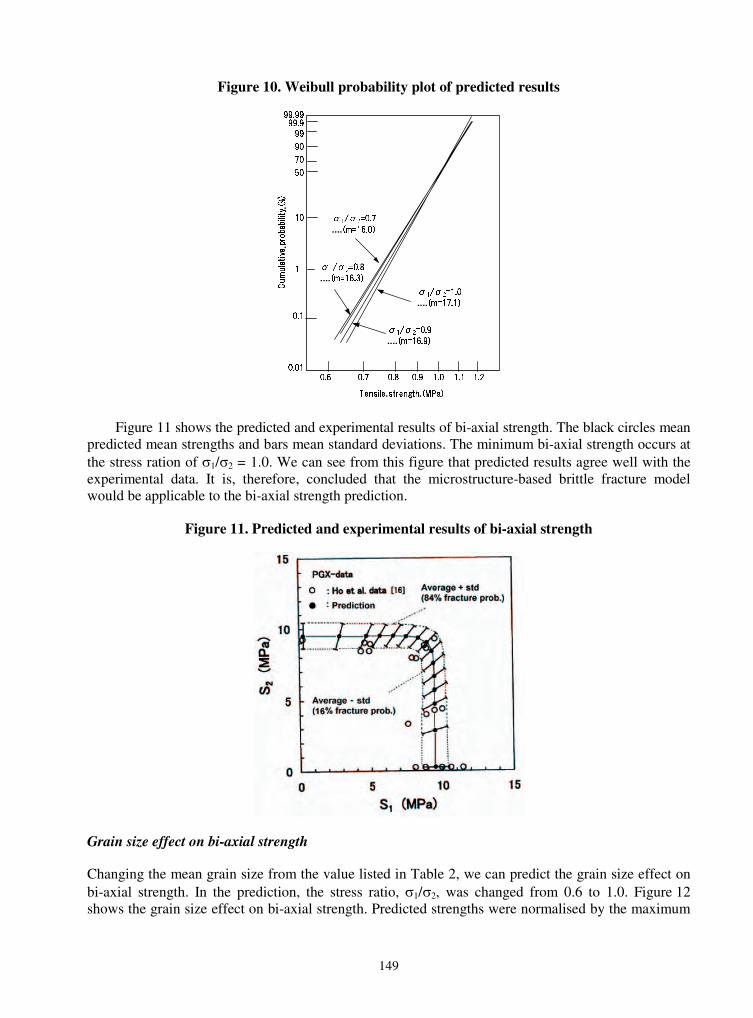
149
Figure 10. Weibull probability plot of predicted results
� �
� �
� �
� �
Figure 11 shows the predicted and experimental results of bi-axial strength. The black circles mean predicted mean strengths and bars mean standard deviations. The minimum bi-axial strength occurs at the stress ration of �1/�2 = 1.0. We can see from this figure that predicted results agree well with the experimental data. It is, therefore, concluded that the microstructure-based brittle fracture model would be applicable to the bi-axial strength prediction.
Figure 11. Predicted and experimental results of bi-axial strength
Grain size effect on bi-axial strength
Changing the mean grain size from the value listed in Table 2, we can predict the grain size effect on bi-axial strength. In the prediction, the stress ratio, �1/�2, was changed from 0.6 to 1.0. Figure 12 shows the grain size effect on bi-axial strength. Predicted strengths were normalised by the maximum �
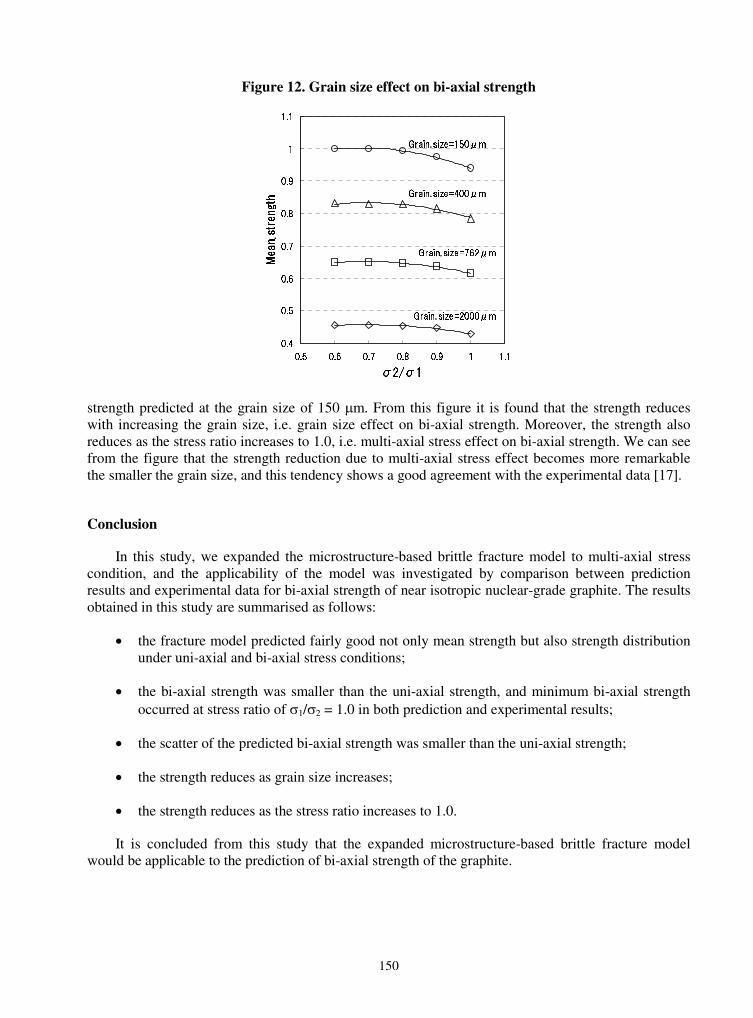
150
Figure 12. Grain size effect on bi-axial strength
strength predicted at the grain size of 150 �m. From this figure it is found that the strength reduces with increasing the grain size, i.e. grain size effect on bi-axial strength. Moreover, the strength also reduces as the stress ratio increases to 1.0, i.e. multi-axial stress effect on bi-axial strength. We can see from the figure that the strength reduction due to multi-axial stress effect becomes more remarkable the smaller the grain size, and this tendency shows a good agreement with the experimental data [17].
Conclusion
In this study, we expanded the microstructure-based brittle fracture model to multi-axial stress condition, and the applicability of the model was investigated by comparison between prediction results and experimental data for bi-axial strength of near isotropic nuclear-grade graphite. The results obtained in this study are summarised as follows:
� the fracture model predicted fairly good not only mean strength but also strength distribution under uni-axial and bi-axial stress conditions;
� the bi-axial strength was smaller than the uni-axial strength, and minimum bi-axial strength occurred at stress ratio of �1/�2 = 1.0 in both prediction and experimental results;�
� the scatter of the predicted bi-axial strength was smaller than the uni-axial strength;
� the strength reduces as grain size increases;
� the strength reduces as the stress ratio increases to 1.0.
It is concluded from this study that the expanded microstructure-based brittle fracture model would be applicable to the prediction of bi-axial strength of the graphite.
151
REFERENCES
[1] Iyoku, T., S. Shiozawa, M. Ishihara, T. Arai and T. Oku, “Graphite Core Structures and their Structural Design Criteria in the HTTR”, J. Nuclear Engineering and Design, 132, pp. 23-30 (1991).
[2] Weibull, W., “A Statistical Theory of the Strength of Materials”, Proceedings of Royal Swedish Institute for Engineering Research, No.151 (1953).
[3] Price, R.J. and H.R.W. Cobb, “Application of Weibull Statistical Theory to the Strength of Reactor Graphite”, CONF701105, pp. 547-566 (1970).
[4] Ishihara, M., T. Iyoku and S. Shiozawa, “New Approach for Fracture Assessment of Graphite”, Transactions of the 13th International Conference on Structural Mechanics in Reactor Technology, Vol. 2, pp. 491-496 (1995).
[5] Buch, J.D., “The Mechanical Properties of Graphites and their Relation to a Physically Based Statistical Theory of Fracture”, CONF701105, pp. 501-509 (1970).
[6] McLachlan, N., M.O. Tucker, and M.J. Parry, “Stress and the Microstructure of Graphite”, Proc. 19th Biennial Conf. on Carbon, pp. 460-461 (1989).
[7] Tucker, M.O., A.P.G. Rose and T.D. Burchell, “The Fracture of Polygranular Graphites”, Carbon, Vol. 24, pp. 581-602 (1986).
[8] Burvhell, T.D., “A Microstructurally Based Fracture Model for Polygranular Graphites”, Carbon, Vol. 34, pp. 297-316 (1996).
[9] Nakanishi, K., T. Arai and T.D. Burchell, “Assessment of Brittle Fracture Theory Based on Mesoscopic Fracture Mechanics of Multiple Grain/Pore System in Graphite and SiC”, Proc. Int. Symposium on Carbon, Tokyo, pp. 332-333 (1998).
[10] Takahashi, T., M. Ishihara, S. Baba and K. Hayashi, “Effect of Grain and Pore Size Distribution on Strength of Graphite”, 1st World Conf. on Carbon, EUROCARBON2000, Berlin, Germany, pp. 397-398 (2000).
[11] Ishihara, M. and T. Takahashi, “Proposal of a Brittle Fracture Model Based on Pore and Crack Interaction Effect”, Journal of the Society of Materials Science Japan, Vol. 51, pp. 425-430 (2002) (in Japanese).
[12] Ishihara, M., T. Takahashi and S. Hanawa, “Probabilistic Distribution of Tensile Strength of Nuclear Grade Graphite on the Basis of Mesoscopic Microstructure”, Proc. Asian Pacific Conf. on Fracture and Strength and Int. Conf. on Experimental Mechanics, Vol. 1, pp. 152-156 (2001).
152
[13] Ishihara, M., T. Takahashi and S. Hanawa, “Applicability of Advanced Design Method of Graphite Components by Microstructure-based Brittle Fracture Model”, Trans. of 16th SMiRT Conf., Paper No. 1114, Washington, DC, USA (2001).
[14] Freudenthal, A.M. “Statistical Approach to Brittle Fracture”, Chapter 6 of Vol. II, Fracture,H. Liebowitz, Ed., Academic Press (1968).
[15] Barnett, R.L., et al., Fracture of Brittle Materials under Transient Mechanical and Thermal Loading, Report AFFDL-TR, 66-220 (1966).
[16] Ho, F.H., R.E. Vollman, H. Yu and N.R. Adsit, “Biaxial Failure Surfaces of 2020 and PGX Graphites”, SMiRT, L4/6, Chicago (1983).
[17] Iyoku, T., M. Ishihara, J. Toyoda, S. Shiozawa, JAERI-M 91-070 (1991).

153
EXAMINING THE ISSUES OF SCALE IN NUCLEAR GRAPHITE COMPONENTS
M.J. Holt and G.B. Neighbour Department of Engineering, University of Hull
Kingston-Upon-Hull, HU6 7RX, United Kingdom
Abstract
At present, the prediction of when cracked graphite bricks will occur in a nuclear core is largely based on the measurement of mechanical properties from small samples, even though the volume of a typical brick is a factor of 104 greater than that of a typical flexural test sample. For polygranular graphites, many models to predict the probability of failure have been generated. Various models recommend the inclusion of microstructural features whilst others rely on a single criterion such as the critical strain energy density. No model is currently available which is able to address the problem of scale. This paper reports progress on a project in which a variety of methods are used to explore issues of scale, from the contribution of individual crystallites, filler and binder phases, and texture to the bulk strength of the polygranular material. In particular, this paper reports a programme of mechanical testing of a range of specimen geometry from miniaturised samples to classical SENBs. The effect of specimen volume (and other parameters) on the determination of material properties are reported and compared with classical Weibull theory (which is seen to break down for very small sample volumes and remains untested for very large samples) with a view to guiding the translation of small specimen mechanical data to very large industrial components. In addition to this, finite element analysis (FEA) techniques are being employed to develop a computer-based model of the microstructure of graphite, with particular attention being paid to the development of a random pore distribution within the model. It is intended that this model will be used in the theoretical modelling of graphite components, enabling a better prediction of the behaviour of the material.
154
Introduction
The United Kingdom’s nuclear reactors were built in accordance with stringent design codes for single components and consequently contain elements of redundancy within the reactor core. Currently, the majority of advanced gas-cooled reactors (AGRs) are reaching the second half of their operating lives, which when designed excluded the possibility of cracked bricks within the core. The prediction of whether bricks will crack within the core is based on the measurement of small samples of material, even though the actual size of the core bricks is much greater. Many studies have been undertaken in which the properties of the material, most often strength, have been seen to vary with geometry, most often volume. Few studies have reached a fully satisfactory physical explanation with the potential to accurately predict the properties of large components. The difference in strength values with volumes is explained by Weibull theory (often referred to as the weakest link theory), which can be used to determine the probability that a specimen will have a certain strength. The theory works on the principle that the larger a specimen volume is, the more likely it is to contain critical flaws and defects that will ultimately lead to failure. However, it is unknown if Weibull methods work well for very small sample volumes and they remain largely untested for large sample volumes.
It is also useful to remind the reader of the relevance of the Griffith’s equation (for purely elastic materials) to this work as it demonstrates a fundamental approach to the problem of fracture (whereas Weibull theory is empirical) such that strength is related to flaw size via the following equation:
a
E S
��
��2 (1)
The Griffith equation balances the surface energy, �s, Young’s modulus, E, and crack length, a,with the stress level required to continue crack propagation. Given the complexity of the microstructure of polygranular graphite, the use of Eq. (1) as a basis to determine the mechanical properties, i.e. strength, of components with geometry or size is very limited. It is therefore useful to investigate further the relationship between the mechanical properties and geometry, e.g. strength and volume, of polygranular graphite. This paper provides a brief summary of the modelling work underwritten with experimental studies being undertaken as part of a PhD project at the University of Hull.
A brief description of the Weibull theory
As with most ceramic materials, nuclear graphites contain a distribution of flaw sizes. Often, an understanding of these distributions and their effect on strength is obtained by a statistical treatment. The most common treatment of specimen size effects with ceramic materials is to consider a statistical distribution as proposed by Weibull [1]. Essentially, the Weibull theory assumes a variation in flaw size and that propagation of a crack from the most critical flaw, under a given stress system, results in failure of the whole body. He first proposed a statistical model for brittle failure that described the survival probability Ps(V0) as the fraction of identical samples, each of volume V0, which survive loading to a tensile stress, �, such that:
� � � �� �m
s VP 00 exp ��� (2)
where �0 is simply the tensile stress that allows 37% of samples to survive, and m is the Weibull modulus which is determined empirically using best fit curve methods. The lower the value of m, the greater variability in strength. Having determined m, it is in theory possible to predict the dependence of strength upon specimen volume since the strength of a material is dependent upon the flaw size
155
distribution within its volume. A large sample is more likely to fail at a lower stress than a smaller sample because there is a higher probability that it will contain a large flaw. The volume dependence on the strength of the material is described by the Weibull theory as the probability that a batch of nsamples all survive the stress � is simply [Ps(V0)]
n. If all these n samples were stuck together to give a single sample of volume V = nV0, then its survival probability would still be [Ps(V0)]
n. So:
� � � �� � � �� � 0
00
VV
s
n
ss VPVPVP �� (3)
Taking logs on both sides and rearranging gives:
� � � �� �00lnexp VPVVVP ss � (4)
If Eq. (2) is inserted in Eq. (4) then:
� � � �� �m
s VVVP 00exp ��� (5)
Eq. (5) describes the volume dependence on the survival probability for a specimen of volume, V.Therefore, if the survival probability of two volume sizes, V1 and V2, are equal, i.e.:
� � � �21 VPVP ss � (6)
then:
� �� � � �� �mm VVVV 02020101 expexp ����� (7)
Simplifying Eq. (7) gives:
� � mVV 1
1221 ��� (8)
Brocklehurst [2] reported that the Weibull theory failed to give consistent values of m for polygranular graphites. He stated that the Weibull theory strictly applies to brittle, linear-elastic materials, and since graphites show non-linearity in their stress-strain behaviour, it is not surprising that the theory does not conform to the range of experimental data he reviewed. However, Brocklehurst [2] does present experimental data for IM1-24 graphite where there is a maximum flexural strength of ~35 MPa at ~1 cm3. For specimens greater than 1 cm3, the decrease in flexural strength generally fits the prediction made by the Weibull statistics, but for specimens less than 1 cm3, the strength departs from the prediction and decreases. This may be because the smaller specimens are no longer representative of the microstructure and thus of the bulk properties. Brocklehurst [2] also shows that tensile strength tends to saturate at a maximum value for volumes > 8 cm3. He also mentions work by others, e.g. Mason [3], who found that small bend specimens showed the reverse effect of an increasing strength with increasing volume, passing through a peak as larger specimens were tested, and then to give a decreasing strength with further volume increases.
Development of a microstructural model
There is support for the logarithmic volume dependency with strength in other works. For example, Brocklehurst and Darby [4] considered four types of tests on AGR moderator graphite: (a) uniform tensile tests; (b) bend tests on beams; (c) internal pressure tests on rings; and (d) tests on rings under diametral compression loading. Their results suggested that the tensile/bend strength correlated very
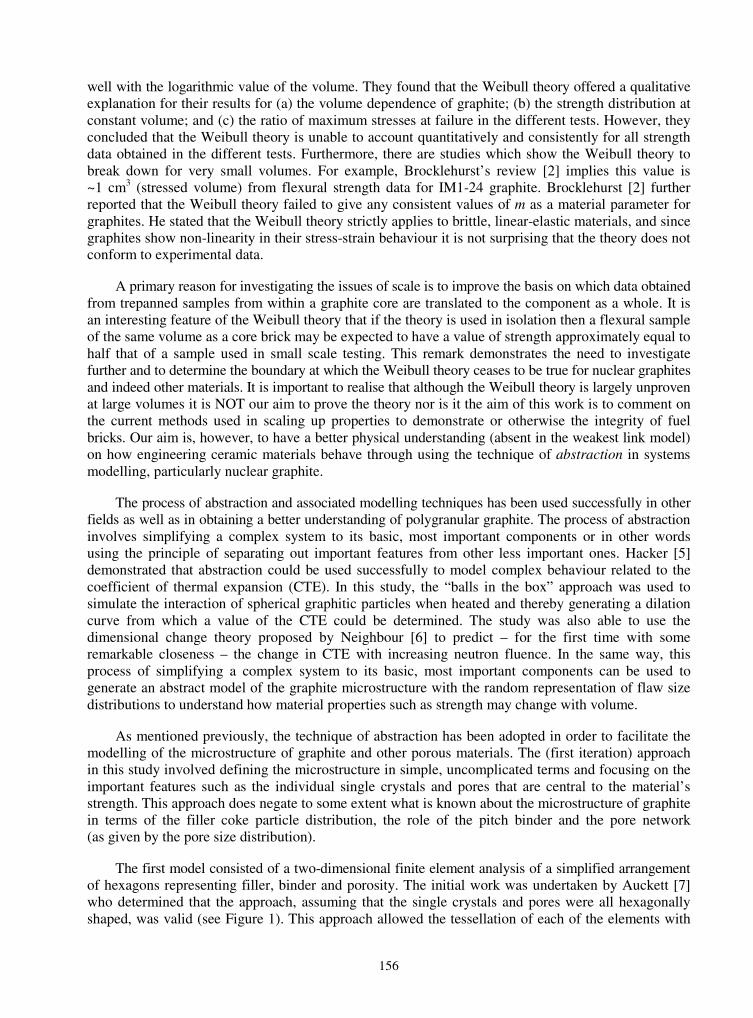
156
well with the logarithmic value of the volume. They found that the Weibull theory offered a qualitative explanation for their results for (a) the volume dependence of graphite; (b) the strength distribution at constant volume; and (c) the ratio of maximum stresses at failure in the different tests. However, they concluded that the Weibull theory is unable to account quantitatively and consistently for all strength data obtained in the different tests. Furthermore, there are studies which show the Weibull theory to break down for very small volumes. For example, Brocklehurst’s review [2] implies this value is ~1 cm3 (stressed volume) from flexural strength data for IM1-24 graphite. Brocklehurst [2] further reported that the Weibull theory failed to give any consistent values of m as a material parameter for graphites. He stated that the Weibull theory strictly applies to brittle, linear-elastic materials, and since graphites show non-linearity in their stress-strain behaviour it is not surprising that the theory does not conform to experimental data.
A primary reason for investigating the issues of scale is to improve the basis on which data obtained from trepanned samples from within a graphite core are translated to the component as a whole. It is an interesting feature of the Weibull theory that if the theory is used in isolation then a flexural sample of the same volume as a core brick may be expected to have a value of strength approximately equal to half that of a sample used in small scale testing. This remark demonstrates the need to investigate further and to determine the boundary at which the Weibull theory ceases to be true for nuclear graphites and indeed other materials. It is important to realise that although the Weibull theory is largely unproven at large volumes it is NOT our aim to prove the theory nor is it the aim of this work is to comment on the current methods used in scaling up properties to demonstrate or otherwise the integrity of fuel bricks. Our aim is, however, to have a better physical understanding (absent in the weakest link model) on how engineering ceramic materials behave through using the technique of abstraction in systems modelling, particularly nuclear graphite.
The process of abstraction and associated modelling techniques has been used successfully in other fields as well as in obtaining a better understanding of polygranular graphite. The process of abstraction involves simplifying a complex system to its basic, most important components or in other words using the principle of separating out important features from other less important ones. Hacker [5] demonstrated that abstraction could be used successfully to model complex behaviour related to the coefficient of thermal expansion (CTE). In this study, the “balls in the box” approach was used to simulate the interaction of spherical graphitic particles when heated and thereby generating a dilation curve from which a value of the CTE could be determined. The study was also able to use the dimensional change theory proposed by Neighbour [6] to predict – for the first time with some remarkable closeness – the change in CTE with increasing neutron fluence. In the same way, this process of simplifying a complex system to its basic, most important components can be used to generate an abstract model of the graphite microstructure with the random representation of flaw size distributions to understand how material properties such as strength may change with volume.
As mentioned previously, the technique of abstraction has been adopted in order to facilitate the modelling of the microstructure of graphite and other porous materials. The (first iteration) approach in this study involved defining the microstructure in simple, uncomplicated terms and focusing on the important features such as the individual single crystals and pores that are central to the material’s strength. This approach does negate to some extent what is known about the microstructure of graphite in terms of the filler coke particle distribution, the role of the pitch binder and the pore network (as given by the pore size distribution).
The first model consisted of a two-dimensional finite element analysis of a simplified arrangement of hexagons representing filler, binder and porosity. The initial work was undertaken by Auckett [7] who determined that the approach, assuming that the single crystals and pores were all hexagonally shaped, was valid (see Figure 1). This approach allowed the tessellation of each of the elements with

157
Figure 1. Illustration of the basic structural unit (BSU) used in the development of the abstract model
Crystal orientation is denoted by the horizontal and vertical bars (the central hexagon is considered to be a pore)
ease without over complicating the model. An arrangement of six hexagons around a single pore was set as the basic building block for the models (known as the basic structural unit or BSU) which could, of course, be employed in the production of any size of model by simple replication. Through using individual hexagons in the model to denote the single crystals, different material properties could be assigned to each specific hexagon in order to represent the differing crystal orientations or in the case of a pore, a null value. In the smallest models, e.g. the single BSU model, this could be done manually by selecting individual areas at random and applying the appropriate property. This method, whilst valid for building the models and defining the material properties, would prove to be very time consuming and as such, programs were written in C code to automate the tasks, principally:
Model generator. An executable file that generates an ANSYS format *.log file, which when read in to the ANSYS software builds an array of hexagons that represent the simplified version of the graphite microstructure complete with pores.
Material setter. An executable file that generates an ANSYS format *.log file that sets the material properties of the model at random to give a simple representation of the two crystal orientations with a section of graphite.
The model generator prompts the user to input a filename for the *.log file that is to be created, then asks for the scale of the model (i.e. the overall size of the model). Once completed, a *.log file is generated that contains the commands that ANSYS requires to build the model. For the material setter, the user is requested to input a filename, the number of volumes (or areas) present in the model and which type it actually is (volume or area). The created file can then be read in to ANSYS to set the material properties of the model, and randomly set half of the volumes/areas to one material property, leaving the rest set to a different material property which represents the different constituents in the microstructure, e.g. crystal orientations. For the purpose of this study, the model generator was used at this time to create a file for a model containing 100 BSU (see Figure 2) where only one material type and porosity is represented, and the required sections to build a square model. The material setter was used to generate a file that set the material properties of the model to those specified in Table 1 in the first iteration using single crystal values for Young’s modulus (1 = a-axis and 2 = c-axis) and generic values for Poisson’s ratio and density. It is important to recognise here that the values used are to some extent arbitrary and the main purpose initially is to demonstrate the methodology.
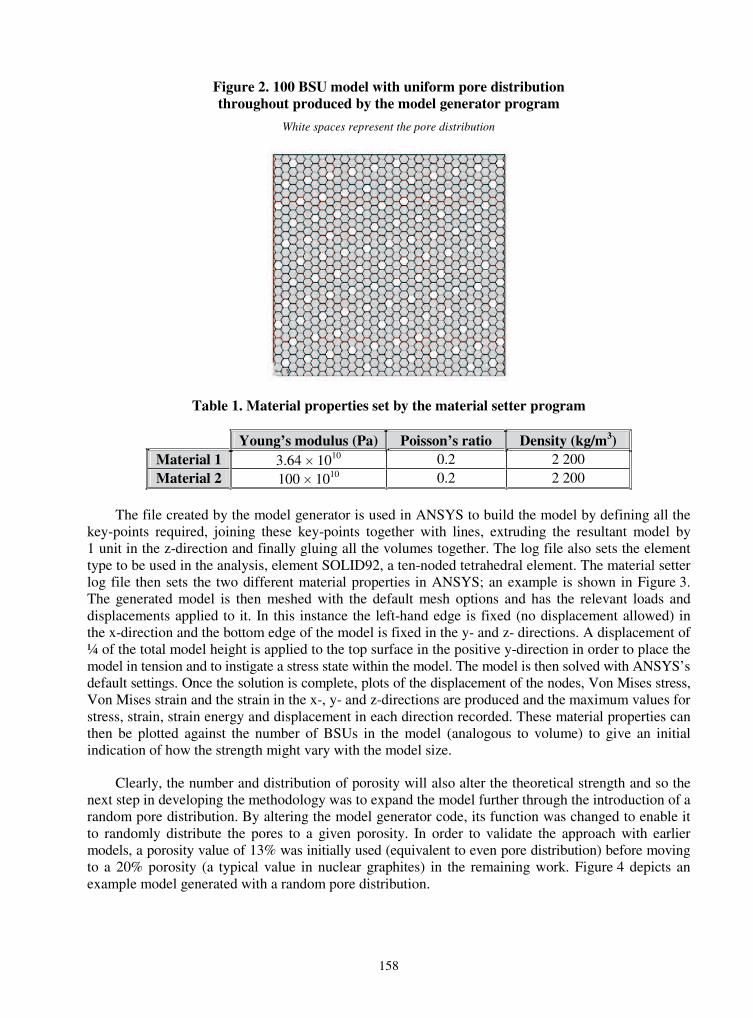
158
Figure 2. 100 BSU model with uniform pore distribution throughout produced by the model generator program
White spaces represent the pore distribution
Table 1. Material properties set by the material setter program
Young’s modulus (Pa) Poisson’s ratio Density (kg/m3)Material 1 3.64 � 1010 0.2 2 200 Material 2 100 � 1010 0.2 2 200
The file created by the model generator is used in ANSYS to build the model by defining all the key-points required, joining these key-points together with lines, extruding the resultant model by 1 unit in the z-direction and finally gluing all the volumes together. The log file also sets the element type to be used in the analysis, element SOLID92, a ten-noded tetrahedral element. The material setter log file then sets the two different material properties in ANSYS; an example is shown in Figure 3. The generated model is then meshed with the default mesh options and has the relevant loads and displacements applied to it. In this instance the left-hand edge is fixed (no displacement allowed) in the x-direction and the bottom edge of the model is fixed in the y- and z- directions. A displacement of ¼ of the total model height is applied to the top surface in the positive y-direction in order to place the model in tension and to instigate a stress state within the model. The model is then solved with ANSYS’s default settings. Once the solution is complete, plots of the displacement of the nodes, Von Mises stress, Von Mises strain and the strain in the x-, y- and z-directions are produced and the maximum values for stress, strain, strain energy and displacement in each direction recorded. These material properties can then be plotted against the number of BSUs in the model (analogous to volume) to give an initial indication of how the strength might vary with the model size.
Clearly, the number and distribution of porosity will also alter the theoretical strength and so the next step in developing the methodology was to expand the model further through the introduction of a random pore distribution. By altering the model generator code, its function was changed to enable it to randomly distribute the pores to a given porosity. In order to validate the approach with earlier models, a porosity value of 13% was initially used (equivalent to even pore distribution) before moving to a 20% porosity (a typical value in nuclear graphites) in the remaining work. Figure 4 depicts an example model generated with a random pore distribution.
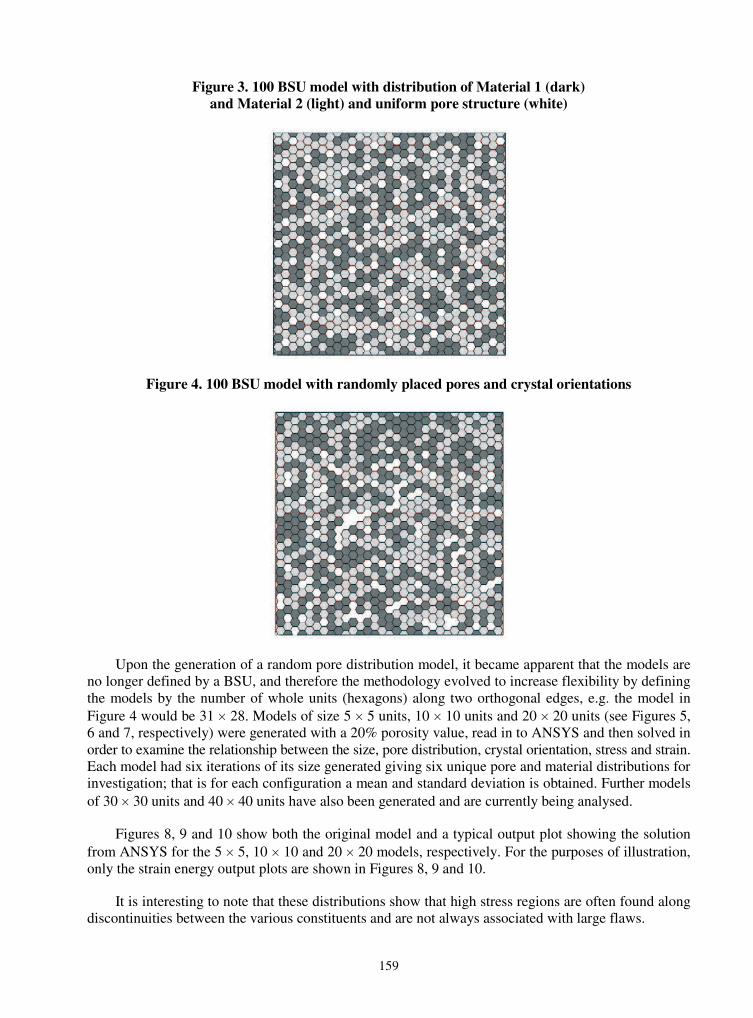
159
Figure 3. 100 BSU model with distribution of Material 1 (dark) and Material 2 (light) and uniform pore structure (white)
Figure 4. 100 BSU model with randomly placed pores and crystal orientations
Upon the generation of a random pore distribution model, it became apparent that the models are no longer defined by a BSU, and therefore the methodology evolved to increase flexibility by defining the models by the number of whole units (hexagons) along two orthogonal edges, e.g. the model in Figure 4 would be 31 � 28. Models of size 5 � 5 units, 10 � 10 units and 20 � 20 units (see Figures 5, 6 and 7, respectively) were generated with a 20% porosity value, read in to ANSYS and then solved in order to examine the relationship between the size, pore distribution, crystal orientation, stress and strain. Each model had six iterations of its size generated giving six unique pore and material distributions for investigation; that is for each configuration a mean and standard deviation is obtained. Further models of 30 � 30 units and 40 � 40 units have also been generated and are currently being analysed.
Figures 8, 9 and 10 show both the original model and a typical output plot showing the solution from ANSYS for the 5 � 5, 10 � 10 and 20 � 20 models, respectively. For the purposes of illustration, only the strain energy output plots are shown in Figures 8, 9 and 10.
It is interesting to note that these distributions show that high stress regions are often found along discontinuities between the various constituents and are not always associated with large flaws.

160
Figure 5. An example of 5 � 5 unit model showing the material and pore distribution
Figure 6. An example of 10 � 10 unit model showing the material and pore distribution
Figure 7. An example of 20 � 20 unit model showing the material and pore distribution
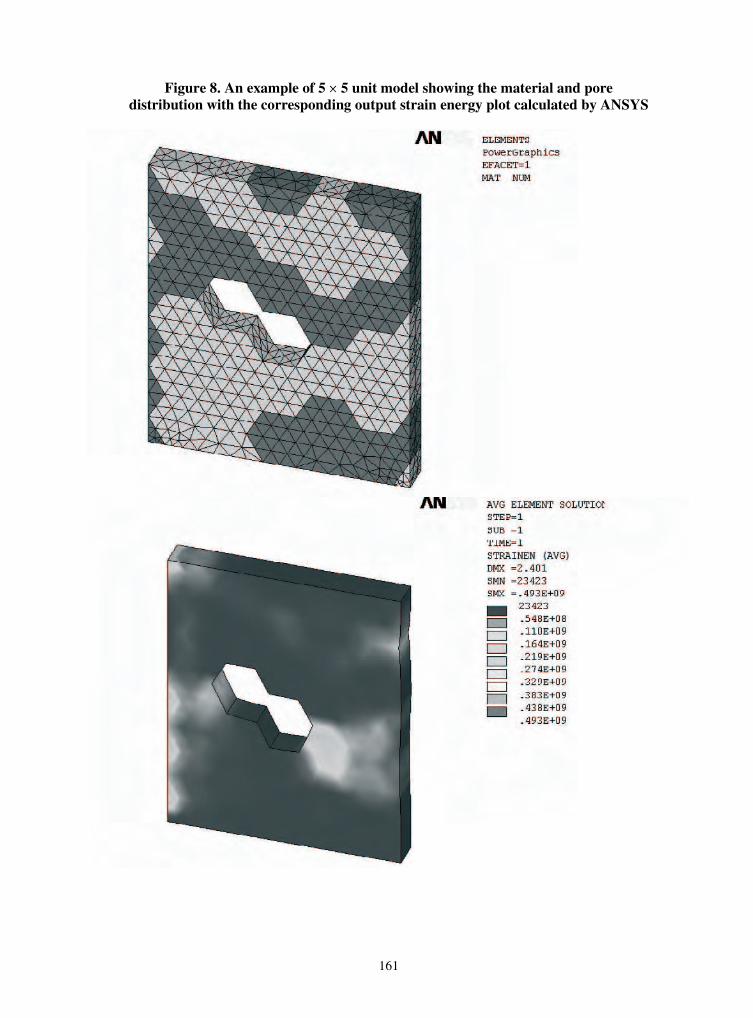
161
Figure 8. An example of 5 � 5 unit model showing the material and pore distribution with the corresponding output strain energy plot calculated by ANSYS

162
Figure 9. An example of 10 � 10 unit model showing the material and pore distribution with the corresponding output strain energy plot calculated by ANSYS

163
Figure 10. An example of 20 � 20 unit model showing the material and pore distribution with the corresponding output strain energy plot calculated by ANSYS

164
Mechanical testing programme
In parallel with the development of a microstructural modelling programme of work, a comprehensive mechanical testing programme is currently being undertaken that aims to investigate the relationship between strength and volume for un-irradiated graphite in a quantitative manner. The main purpose of the mechanical testing programme is to provide an independent data set to validate the final microstructural model. An outline of the mechanical testing programme is illustrated in Table 2 which shows a matrix of specimen dimensions and their relationship with regard to volume, length and cross-sectional area. For each specimen type, as shown in Figure 11, ten specimens are tested to failure under compression, 3-pt bend (un-notched), 4-pt bend test (un-notched), 3-pt bend (notched) and 4-pt bend test (notched). In all, 600 specimens will have been tested upon completion of the programme.
Table 2. Specimen types adopted (with geometry) in the mechanical testing programme
Specimen type Volume Length Cross-sectional area Size A V L A 3 � 3 � 10 B 7.6 V 1.9 L 4 A 6 � 6 � 19 C 10 V 4 L 2.5 A 4.74 � 4.74 � 40 D 20 V 5 L 4 A 6 � 6 � 50 E 100 V 10 L 10 A 9.49 � 9.49 � 100F 160.4 V 4 L 40.1 A 19 � 19 � 40
Figure 11. Specimen types A-F for the testing programme
Machined by SGL Carbon
Two grades of polygranular graphite have been adopted for the mechanical testing programme. The first is AGR moderator graphite (IM1-24) supplied by British Energy Generation Limited whilst the second is a reference graphite (R4340) supplied by SGL Carbon. The reference graphite was selected due to its availability, ability to machine and its finer texture. This is illustrated in Figures 12 and 13, which are optical micrographs of the IM1-24 and R4340 graphites, respectively.
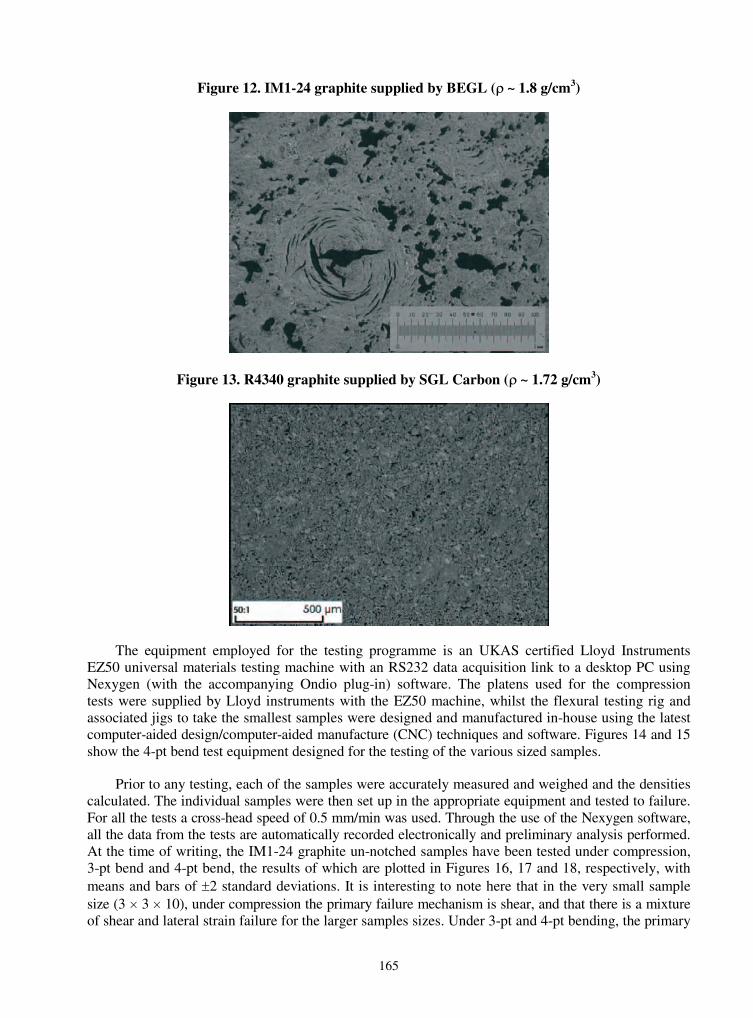
165
Figure 12. IM1-24 graphite supplied by BEGL (� ~ 1.8 g/cm3)
Figure 13. R4340 graphite supplied by SGL Carbon (� ~ 1.72 g/cm3)
The equipment employed for the testing programme is an UKAS certified Lloyd Instruments EZ50 universal materials testing machine with an RS232 data acquisition link to a desktop PC using Nexygen (with the accompanying Ondio plug-in) software. The platens used for the compression tests were supplied by Lloyd instruments with the EZ50 machine, whilst the flexural testing rig and associated jigs to take the smallest samples were designed and manufactured in-house using the latest computer-aided design/computer-aided manufacture (CNC) techniques and software. Figures 14 and 15 show the 4-pt bend test equipment designed for the testing of the various sized samples.
Prior to any testing, each of the samples were accurately measured and weighed and the densities calculated. The individual samples were then set up in the appropriate equipment and tested to failure. For all the tests a cross-head speed of 0.5 mm/min was used. Through the use of the Nexygen software, all the data from the tests are automatically recorded electronically and preliminary analysis performed. At the time of writing, the IM1-24 graphite un-notched samples have been tested under compression, 3-pt bend and 4-pt bend, the results of which are plotted in Figures 16, 17 and 18, respectively, with means and bars of �2 standard deviations. It is interesting to note here that in the very small sample size (3 � 3 � 10), under compression the primary failure mechanism is shear, and that there is a mixture of shear and lateral strain failure for the larger samples sizes. Under 3-pt and 4-pt bending, the primary
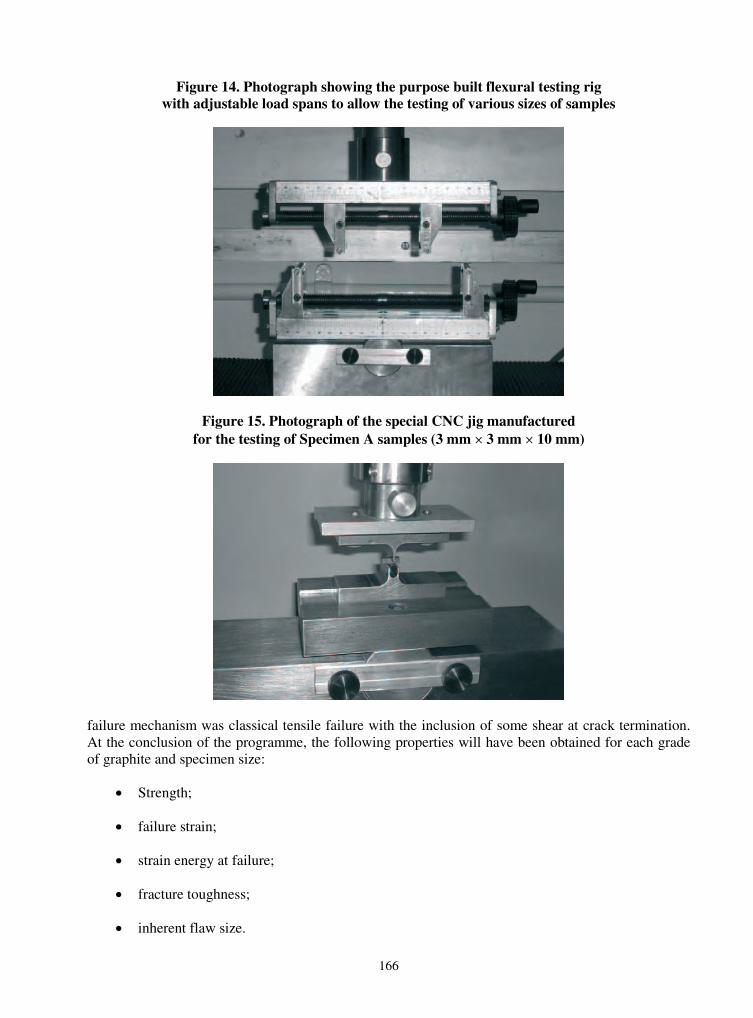
166
Figure 14. Photograph showing the purpose built flexural testing rig with adjustable load spans to allow the testing of various sizes of samples
Figure 15. Photograph of the special CNC jig manufactured for the testing of Specimen A samples (3 mm � 3 mm � 10 mm)
failure mechanism was classical tensile failure with the inclusion of some shear at crack termination. At the conclusion of the programme, the following properties will have been obtained for each grade of graphite and specimen size:
Strength;
failure strain;
strain energy at failure;
fracture toughness;
inherent flaw size.
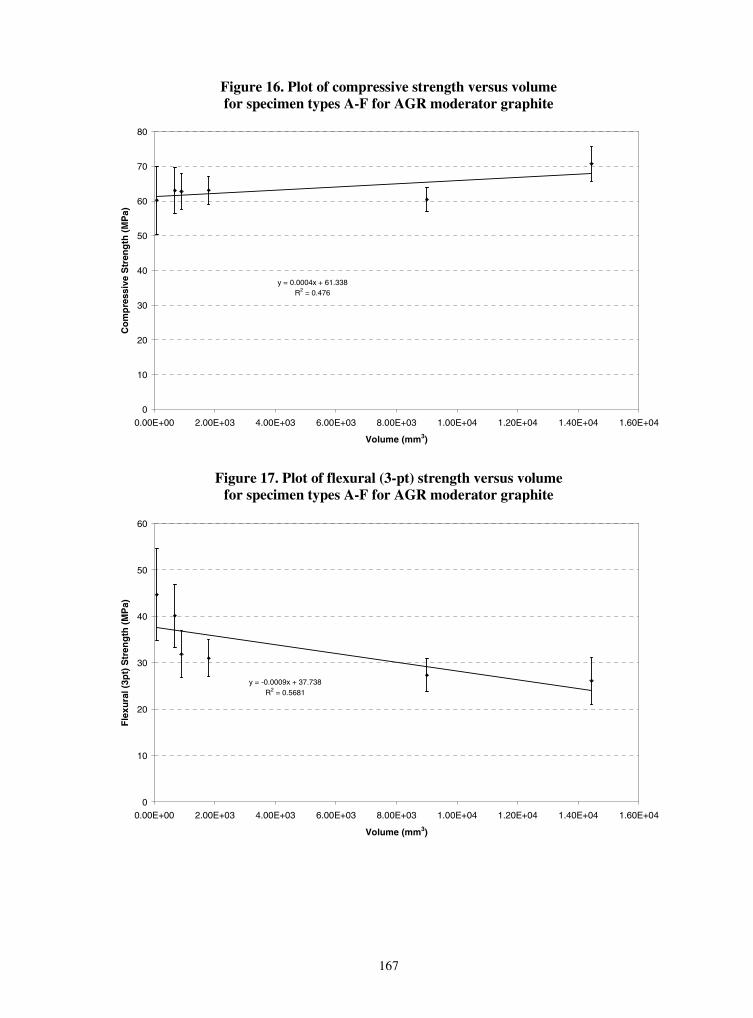
167
Figure 16. Plot of compressive strength versus volume for specimen types A-F for AGR moderator graphite
y = 0.0004x + 61.338R2 = 0.476
0
10
20
30
40
50
60
70
80
0.00E+00 2.00E+03 4.00E+03 6.00E+03 8.00E+03 1.00E+04 1.20E+04 1.40E+04 1.60E+04
Volume (mm3)
Co
mp
ress
ive
Str
eng
th (
MP
a)
Figure 17. Plot of flexural (3-pt) strength versus volume for specimen types A-F for AGR moderator graphite
y = -0.0009x + 37.738R2 = 0.5681
0
10
20
30
40
50
60
0.00E+00 2.00E+03 4.00E+03 6.00E+03 8.00E+03 1.00E+04 1.20E+04 1.40E+04 1.60E+04
Volume (mm3)
Fle
xura
l (3p
t) S
tren
gth
(M
Pa)
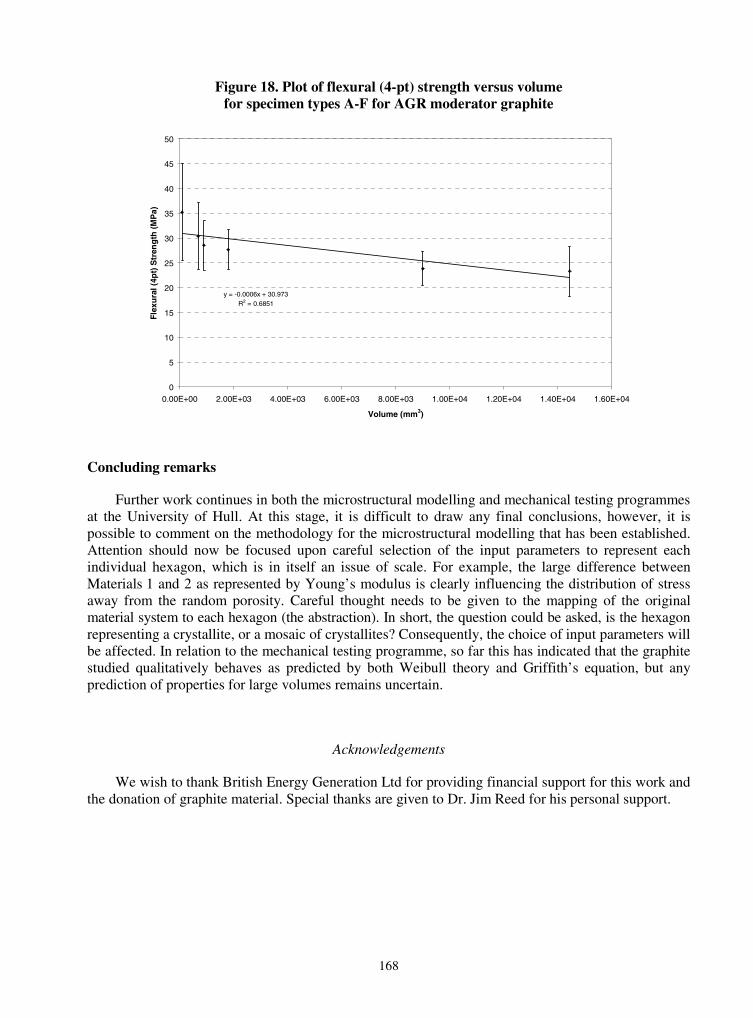
168
Figure 18. Plot of flexural (4-pt) strength versus volume for specimen types A-F for AGR moderator graphite
y = -0.0006x + 30.973R2 = 0.6851
0
5
10
15
20
25
30
35
40
45
50
0.00E+00 2.00E+03 4.00E+03 6.00E+03 8.00E+03 1.00E+04 1.20E+04 1.40E+04 1.60E+04
Volume (mm3)
Fle
xura
l (4p
t) S
tren
gth
(M
Pa)
Concluding remarks
Further work continues in both the microstructural modelling and mechanical testing programmes at the University of Hull. At this stage, it is difficult to draw any final conclusions, however, it is possible to comment on the methodology for the microstructural modelling that has been established. Attention should now be focused upon careful selection of the input parameters to represent each individual hexagon, which is in itself an issue of scale. For example, the large difference between Materials 1 and 2 as represented by Young’s modulus is clearly influencing the distribution of stress away from the random porosity. Careful thought needs to be given to the mapping of the original material system to each hexagon (the abstraction). In short, the question could be asked, is the hexagon representing a crystallite, or a mosaic of crystallites? Consequently, the choice of input parameters will be affected. In relation to the mechanical testing programme, so far this has indicated that the graphite studied qualitatively behaves as predicted by both Weibull theory and Griffith’s equation, but any prediction of properties for large volumes remains uncertain.
Acknowledgements
We wish to thank British Energy Generation Ltd for providing financial support for this work and the donation of graphite material. Special thanks are given to Dr. Jim Reed for his personal support.
169
REFERENCES
[1] Weibull, Waloddi, “A Statistical Distribution Function of Wide Applicability”, J. Applied Mechanics, 293-297 (Sept. 1951).
[2] Brocklehurst, J.E., “Fracture in Polycrystalline Graphite”, Chemistry and Physics of Carbon, 13, 145-279 (1977).
[3] Mason, I.B., “The Strength of Commercial Graphite”, Proc. 5th Carbon Conf., 597-610 (1962).
[4] Brocklehurst, J.E. and Darby, M.I., “Concerning the Fracture of Graphite under Different Test Conditions”, Materials Science and Engineering, 16, 91-106 (1974).
[5] Hacker, Paul, A Study of the Coefficient of Thermal Expansion of Nuclear Graphites, PhD Thesis, University of Bath (2001).
[6] Neighbour, G.B., “Modelling of Dimensional Changes in Irradiated Nuclear Graphites”, J. Physics D.: Appl. Phys., 33, 2966-2972 (2000).
[7] Auckett, Matthew, Issues of Scale in Nuclear Graphites, MEng Thesis, University of Hull (2003).
171
SESSION III
Other Topics in the Field of High-temperature Engineering with Emphasis on Basic Studies
Chairs: M. Methnani, T. Maruyama
173
DESIGN OF A SPHERICAL FUEL ELEMENT FOR A GAS-COOLED FAST REACTOR
W.F.G. van Rooijen, J.L. Kloosterman, H. van Dam, T.H.J.J. van der Hagen Delft University of Technology, Interfaculty Research Institute
Mekelweg 15, 2629 JB, Delft, The Netherlands
Abstract
A study is undertaken to develop a fuel cycle for a gas-cooled fast reactor (GCFR). The design goals are: highly efficient use of (depleted) uranium, application of Pu recycled from LWR discharge as fissile material, high temperature output and simplicity of design. The design focuses on spherical TRISO-like fuel elements, a homogeneous core at start-up, providing for easy fuel fabrication, and self-breeding capability with a flat keff with burn-up. Nitride fuel (15N > 99%) has been selected because of its favourable thermal conductivity, high heavy metal density and compatibility with PUREX reprocessing. Two core concepts have been studied: one with coated particles embedded inside fuel pebbles, and one with coated particles cooled directly by helium. The result is that a flat keff can be achieved for a long period of time, using coated particles cooled directly, with a homogeneous core at start-up, with a closed fuel cycle and a simple refuelling and reprocessing scheme.
174
Introduction of the gas-cooled fast reactor
The gas-cooled fast reactor (GCFR) is a nuclear reactor with a fast neutron spectrum and gas cooling. In the late sixties and early seventies, several research programmes for GCFR concepts were initiated [1,2]. The designs featured both classical fuel pins and coated particles, and used CO2, He or N2O4 as a coolant. The main problems then were related to the structural materials and the inability to provide adequate cooling in the case of a LOCA. The GCFR was abandoned in favour of the liquid metal-cooled fast reactor. Recently, the Generation IV International Forum has included the GCFR as one of the six reference reactor concepts for the future, focusing on the advantages of a gaseous coolant: helium is transparent, neutronically and chemically inert, cannot boil and enables operation at high temperatures.
One of the characteristics of FR systems is the high core power density for economical reasons. This is related to the large fissile inventory required to obtain a critical system, and the desire to have a short doubling time. The fuel costs can be reduced by using a mix of depleted U and LWR discharge Pu. Then the core power density can be lower whilst maintaining an economical system. The design presently under investigation focuses on high-temperature operation, He coolant and a simple design,including a fully homogeneous core at start-up, for which only one type of fuel element needs to be produced. The core should have a self-breeding capability, and a flat keff during burn-up. The fuel cycle should be closed, i.e. only fission products should leave the cycle after reprocessing.
Coated particles for a gas-cooled fast reactor
We envisage the use of coated particle (CP) fuel for the GCFR. We have prepared a design of a coated particle based on the TRISO CP as used in thermal HTR applications. The TRISO CP consists of a spherical fuel kernel (typical diameter 500 �m), surrounded by a low-density graphite buffer layer (porosity of 50% or more), an inner layer of pyrolytic carbon (IPyC), a sealing layer of SiC and an outer layer of pyrolytic carbon (OPyC). The buffer layer provides voidage to store the gaseous fission products that are released from the fuel, prevents mechanical interaction between kernel and sealing layer, and protects the sealing layer from damage by recoiling fission fragments. The SiC sealing layer acts as cladding, retaining all fission products within the coated particle. The IPyC and OPyC layers contract under irradiation, thereby partly relieving the stresses in the SiC layer caused by the pressure within the CP [3]. To reduce the amount of moderating material in the GCFR core, the pyrolytic carbon layers are removed from the particle.
The SiC cladding layer fails when the pressure inside the CP is too large. The maximum allowable pressure within the CP can be calculated as follows: assume a sphere of radius R surrounded by a shell of thickness �. If the pressure inside the shell is higher than outside, the tangential stress in the shell can be expressed as a function of the pressure difference �P acting on the shell. If � << R(thin shell approximation), the tangential stress in the shell is given by:
PR
yyxx ���
����2
Note that �xx is a function of the ratio R/�. The maximum allowable �P is fixed by the choice of material (�max) and the geometry (R/�) of the particle.
The fission process leads to swelling of the fuel and the generation of gaseous fission products. If we assume an ideal gas model for the gaseous FP in the buffer, the pressure in the buffer can be written as a function of burn-up as:
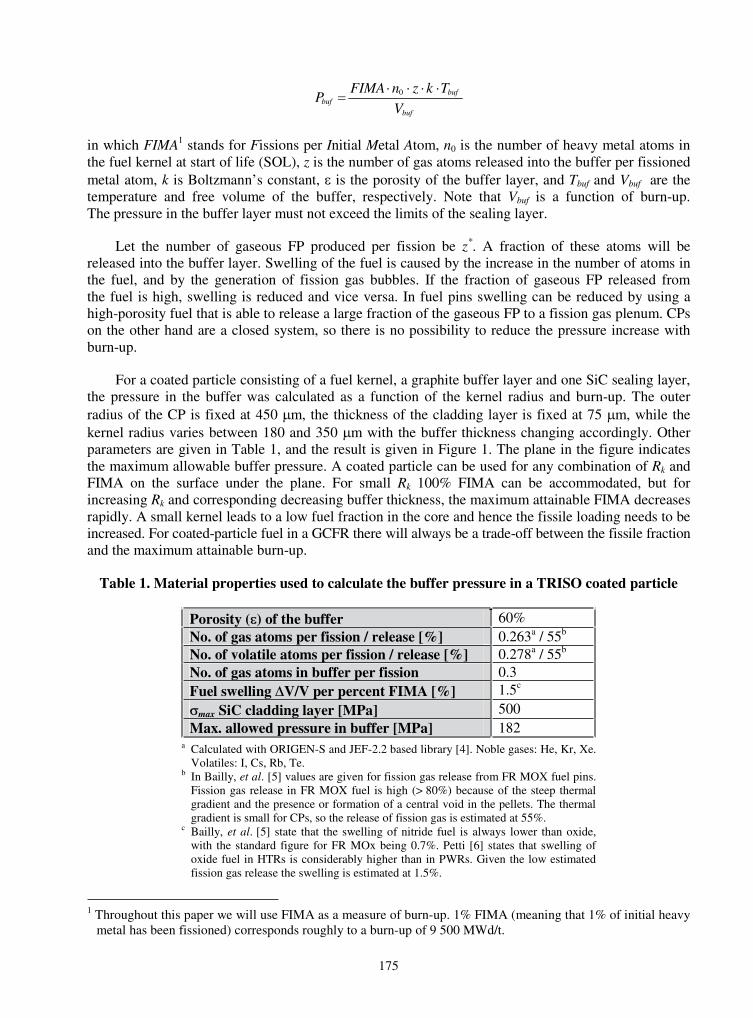
175
buf
bufbuf
V
TkznFIMAP
����� 0
in which FIMA1 stands for Fissions per Initial Metal Atom, n0 is the number of heavy metal atoms in the fuel kernel at start of life (SOL), z is the number of gas atoms released into the buffer per fissioned metal atom, k is Boltzmann’s constant, � is the porosity of the buffer layer, and Tbuf and Vbuf are the temperature and free volume of the buffer, respectively. Note that Vbuf is a function of burn-up. The pressure in the buffer layer must not exceed the limits of the sealing layer.
Let the number of gaseous FP produced per fission be z*. A fraction of these atoms will be released into the buffer layer. Swelling of the fuel is caused by the increase in the number of atoms in the fuel, and by the generation of fission gas bubbles. If the fraction of gaseous FP released from the fuel is high, swelling is reduced and vice versa. In fuel pins swelling can be reduced by using a high-porosity fuel that is able to release a large fraction of the gaseous FP to a fission gas plenum. CPs on the other hand are a closed system, so there is no possibility to reduce the pressure increase with burn-up.
For a coated particle consisting of a fuel kernel, a graphite buffer layer and one SiC sealing layer, the pressure in the buffer was calculated as a function of the kernel radius and burn-up. The outer radius of the CP is fixed at 450 �m, the thickness of the cladding layer is fixed at 75 �m, while the kernel radius varies between 180 and 350 �m with the buffer thickness changing accordingly. Other parameters are given in Table 1, and the result is given in Figure 1. The plane in the figure indicates the maximum allowable buffer pressure. A coated particle can be used for any combination of Rk and FIMA on the surface under the plane. For small Rk 100% FIMA can be accommodated, but for increasing Rk and corresponding decreasing buffer thickness, the maximum attainable FIMA decreases rapidly. A small kernel leads to a low fuel fraction in the core and hence the fissile loading needs to be increased. For coated-particle fuel in a GCFR there will always be a trade-off between the fissile fraction and the maximum attainable burn-up.
Table 1. Material properties used to calculate the buffer pressure in a TRISO coated particle
Porosity (�) of the buffer 60%No. of gas atoms per fission / release [%] 0.263a / 55b
No. of volatile atoms per fission / release [%] 0.278a / 55b
No. of gas atoms in buffer per fission 0.3Fuel swelling �V/V per percent FIMA [%] 1.5c
�max SiC cladding layer [MPa] 500Max. allowed pressure in buffer [MPa] 182
a Calculated with ORIGEN-S and JEF-2.2 based library [4]. Noble gases: He, Kr, Xe. Volatiles: I, Cs, Rb, Te.
b In Bailly, et al. [5] values are given for fission gas release from FR MOX fuel pins. Fission gas release in FR MOX fuel is high (> 80%) because of the steep thermal gradient and the presence or formation of a central void in the pellets. The thermal gradient is small for CPs, so the release of fission gas is estimated at 55%.
c Bailly, et al. [5] state that the swelling of nitride fuel is always lower than oxide, with the standard figure for FR MOx being 0.7%. Petti [6] states that swelling of oxide fuel in HTRs is considerably higher than in PWRs. Given the low estimated fission gas release the swelling is estimated at 1.5%.
1 Throughout this paper we will use FIMA as a measure of burn-up. 1% FIMA (meaning that 1% of initial heavy metal has been fissioned) corresponds roughly to a burn-up of 9 500 MWd/t.

176
Figure 1. Maximum allowable FIMA in a coated particle as a function of Rk
The plane corresponds to Pbuf = 180 MPa. A coated particle can be used until the pressure in the buffer reaches this maximum allowable value. CPs with a large kernel and corresponding small buffer can reach only low burn-up.
Calculation scheme
A short overview of how the simulations of this paper were performed: A 172-group cross section library based on JEF-2.2 is used. Calculations are 1-D, with an axial buckling.
SCALE [7] CSAS (BONAMI-NITAWL-XSDRNPM) is used to generate the cell-weighted cross-sections to calculate the flux pattern and power profile. Fuel depletion in each zone of the reactor is calculated with COUPLE-ORIGEN-S. The Pu used for all calculations presented in this paper has been recycled twice in LWRs. The isotopic vector [8] at SOL is given in Table 2.
Table 2. The isotopic vector of the Pu used in the simulations presented in this paper
Isotope 238Pu 239Pu 240Pu 241Pu 242PuFraction at SOL 1% 62% 24% 8% 5%
A pebble bed for the GCFR
The materials in the reactor can be classified as coolant, fuel and moderator (CP cladding layers and structural materials). For a pebble-bed system with spherical CPs packed into spherical fuel elements (pebbles), the following volume fractions apply:
� pcF �� 1
33
��
����
���
����
��
c
k
o
iTpf R
R
R
RF
cfm FFF ���1
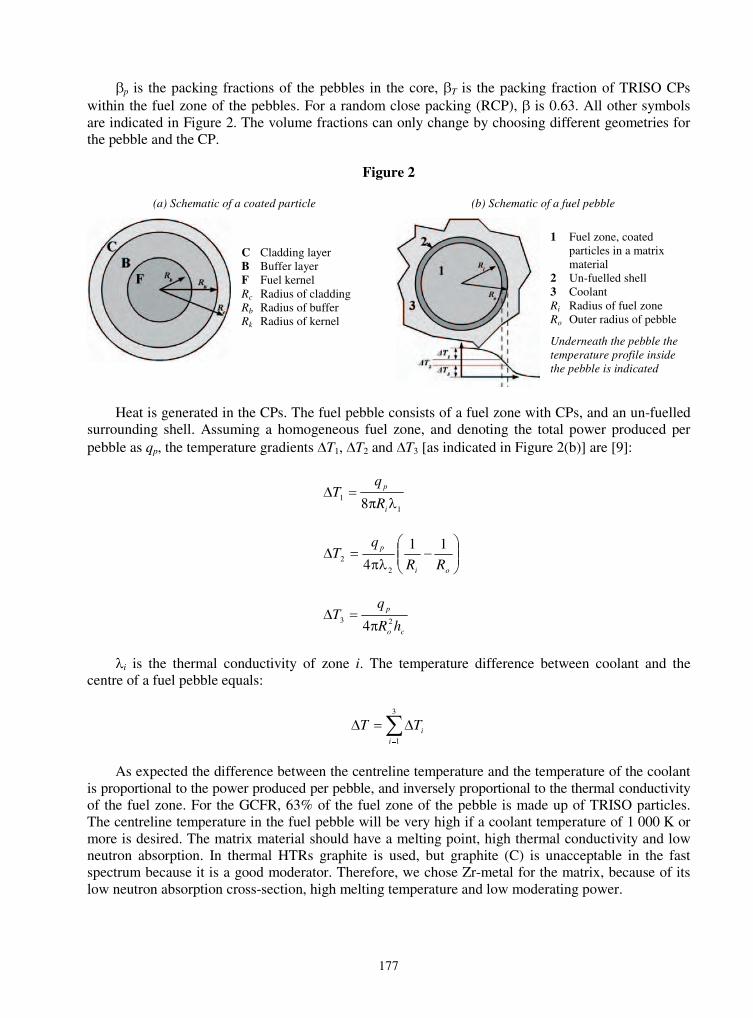
177
p is the packing fractions of the pebbles in the core, T is the packing fraction of TRISO CPs within the fuel zone of the pebbles. For a random close packing (RCP), is 0.63. All other symbols are indicated in Figure 2. The volume fractions can only change by choosing different geometries for the pebble and the CP.
Figure 2
(a) Schematic of a coated particle (b) Schematic of a fuel pebble
C Cladding layer B Buffer layer F Fuel kernel Rc Radius of cladding Rb Radius of buffer Rk Radius of kernel
1 Fuel zone, coated particles in a matrix material
2 Un-fuelled shell 3 Coolant Ri Radius of fuel zoneRo Outer radius of pebble
Underneath the pebble the temperature profile inside the pebble is indicated
Heat is generated in the CPs. The fuel pebble consists of a fuel zone with CPs, and an un-fuelled surrounding shell. Assuming a homogeneous fuel zone, and denoting the total power produced per pebble as qp, the temperature gradients �T1, �T2 and �T3 [as indicated in Figure 2(b)] are [9]:
1
1 8 ����
i
p
R
qT
��
����
��
����
oi
p
RR
qT
11
4 2
2
co
p
hR
qT
23 4���
�i is the thermal conductivity of zone i. The temperature difference between coolant and the centre of a fuel pebble equals:
��
���3
1iiTT
As expected the difference between the centreline temperature and the temperature of the coolant is proportional to the power produced per pebble, and inversely proportional to the thermal conductivity of the fuel zone. For the GCFR, 63% of the fuel zone of the pebble is made up of TRISO particles. The centreline temperature in the fuel pebble will be very high if a coolant temperature of 1 000 K or more is desired. The matrix material should have a melting point, high thermal conductivity and low neutron absorption. In thermal HTRs graphite is used, but graphite (C) is unacceptable in the fast spectrum because it is a good moderator. Therefore, we chose Zr-metal for the matrix, because of its low neutron absorption cross-section, high melting temperature and low moderating power.
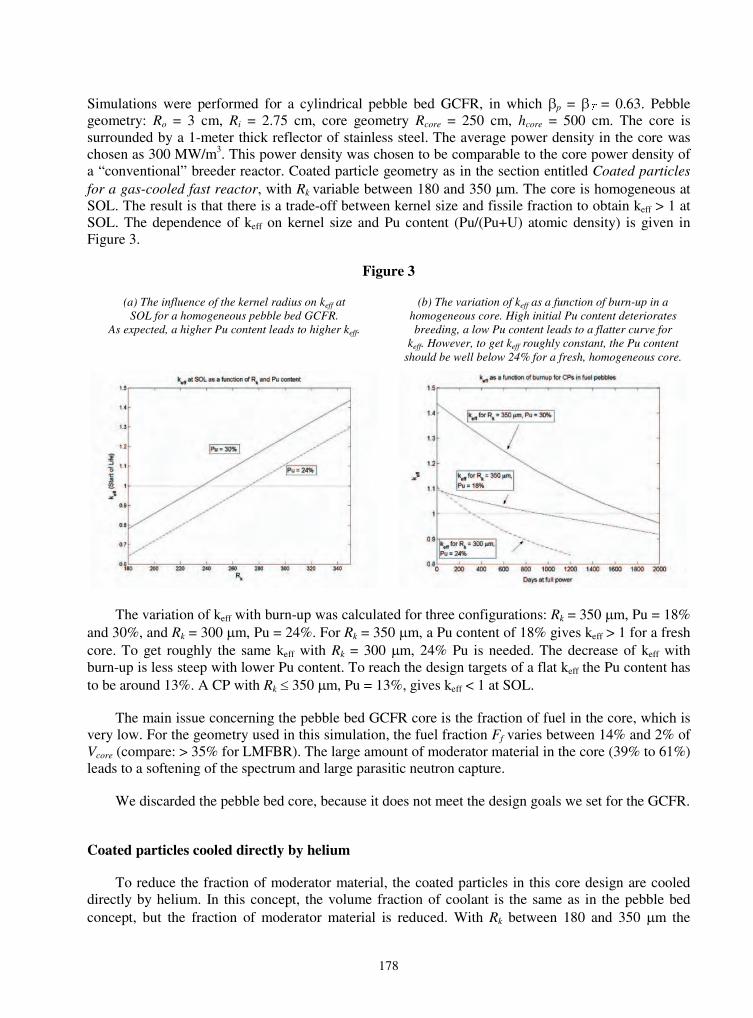
178
Simulations were performed for a cylindrical pebble bed GCFR, in which p = � = 0.63. Pebble geometry: Ro = 3 cm, Ri = 2.75 cm, core geometry Rcore = 250 cm, hcore = 500 cm. The core is surrounded by a 1-meter thick reflector of stainless steel. The average power density in the core was chosen as 300 MW/m3. This power density was chosen to be comparable to the core power density of a “conventional” breeder reactor. Coated particle geometry as in the section entitled Coated particles for a gas-cooled fast reactor, with Rk variable between 180 and 350 �m. The core is homogeneous at SOL. The result is that there is a trade-off between kernel size and fissile fraction to obtain keff > 1 at SOL. The dependence of keff on kernel size and Pu content (Pu/(Pu+U) atomic density) is given in Figure 3.
Figure 3
(a) The influence of the kernel radius on keff at SOL for a homogeneous pebble bed GCFR.
As expected, a higher Pu content leads to higher keff.
(b) The variation of keff as a function of burn-up in a homogeneous core. High initial Pu content deteriorates breeding, a low Pu content leads to a flatter curve for
keff. However, to get keff roughly constant, the Pu content should be well below 24% for a fresh, homogeneous core.
The variation of keff with burn-up was calculated for three configurations: Rk = 350 �m, Pu = 18% and 30%, and Rk = 300 �m, Pu = 24%. For Rk = 350 �m, a Pu content of 18% gives keff > 1 for a fresh core. To get roughly the same keff with Rk = 300 �m, 24% Pu is needed. The decrease of keff with burn-up is less steep with lower Pu content. To reach the design targets of a flat keff the Pu content has to be around 13%. A CP with Rk � 350 �m, Pu = 13%, gives keff < 1 at SOL.
The main issue concerning the pebble bed GCFR core is the fraction of fuel in the core, which is very low. For the geometry used in this simulation, the fuel fraction Ff varies between 14% and 2% of Vcore (compare: > 35% for LMFBR). The large amount of moderator material in the core (39% to 61%) leads to a softening of the spectrum and large parasitic neutron capture.
We discarded the pebble bed core, because it does not meet the design goals we set for the GCFR.
Coated particles cooled directly by helium
To reduce the fraction of moderator material, the coated particles in this core design are cooled directly by helium. In this concept, the volume fraction of coolant is the same as in the pebble bed concept, but the fraction of moderator material is reduced. With Rk between 180 and 350 �m the
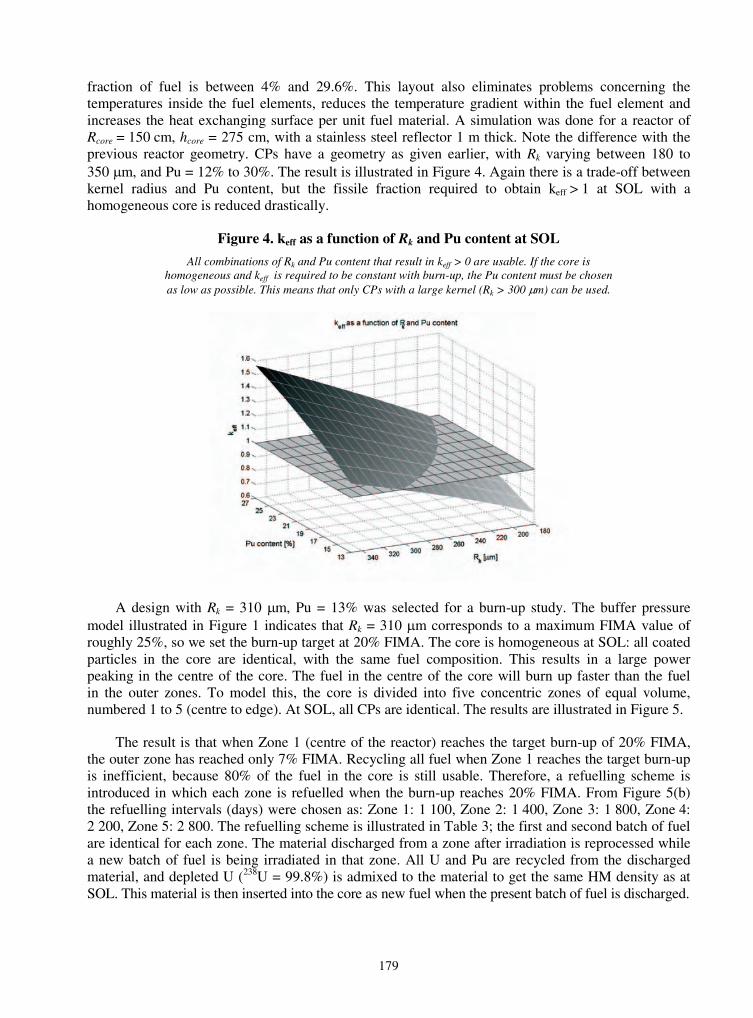
179
fraction of fuel is between 4% and 29.6%. This layout also eliminates problems concerning the temperatures inside the fuel elements, reduces the temperature gradient within the fuel element and increases the heat exchanging surface per unit fuel material. A simulation was done for a reactor of Rcore = 150 cm, hcore = 275 cm, with a stainless steel reflector 1 m thick. Note the difference with the previous reactor geometry. CPs have a geometry as given earlier, with Rk varying between 180 to 350 �m, and Pu = 12% to 30%. The result is illustrated in Figure 4. Again there is a trade-off between kernel radius and Pu content, but the fissile fraction required to obtain keff > 1 at SOL with a homogeneous core is reduced drastically.
Figure 4. keff as a function of Rk and Pu content at SOL
All combinations of Rk and Pu content that result in keff > 0 are usable. If the core is homogeneous and keff is required to be constant with burn-up, the Pu content must be chosen as low as possible. This means that only CPs with a large kernel (Rk > 300 �m) can be used.
A design with Rk = 310 �m, Pu = 13% was selected for a burn-up study. The buffer pressure model illustrated in Figure 1 indicates that Rk = 310 �m corresponds to a maximum FIMA value of roughly 25%, so we set the burn-up target at 20% FIMA. The core is homogeneous at SOL: all coated particles in the core are identical, with the same fuel composition. This results in a large power peaking in the centre of the core. The fuel in the centre of the core will burn up faster than the fuel in the outer zones. To model this, the core is divided into five concentric zones of equal volume, numbered 1 to 5 (centre to edge). At SOL, all CPs are identical. The results are illustrated in Figure 5.
The result is that when Zone 1 (centre of the reactor) reaches the target burn-up of 20% FIMA, the outer zone has reached only 7% FIMA. Recycling all fuel when Zone 1 reaches the target burn-up is inefficient, because 80% of the fuel in the core is still usable. Therefore, a refuelling scheme is introduced in which each zone is refuelled when the burn-up reaches 20% FIMA. From Figure 5(b) the refuelling intervals (days) were chosen as: Zone 1: 1 100, Zone 2: 1 400, Zone 3: 1 800, Zone 4: 2 200, Zone 5: 2 800. The refuelling scheme is illustrated in Table 3; the first and second batch of fuel are identical for each zone. The material discharged from a zone after irradiation is reprocessed while a new batch of fuel is being irradiated in that zone. All U and Pu are recycled from the discharged material, and depleted U (238U = 99.8%) is admixed to the material to get the same HM density as at SOL. This material is then inserted into the core as new fuel when the present batch of fuel is discharged.

180
Figure 5
(a) The power distribution at SOL. At SOL, 30% of all fissions occur in Zone 1, and some 11% in Zone 5. As a result, fuel
burn-up is three times faster in Zone 1 than in Zone 5.
(b) Time to reach 20% FIMA in each zone
Table 3. The refuelling and reprocessing scheme for the GCFR
Material in a certain zone of the reactor
Cycle 1: Fresh fuel, used until FIMA = 20%
Cycle 2: Fresh fuel, used until FIMA = 20%
Cycle 3: Fuel based on reprocessed HM from Cycle 1
Cycle 4: Fuel based on reprocessed HM from Cycle 2
Material of a certain zone, outside of the reactor
Reprocessing of material discharged at end of Cycle 1
Reprocessing of material discharged at end of Cycle 2
Reprocessing of material discharged at end of Cycle 3
The calculated keff for a GCFR with the proposed refuelling scheme is given in Figure 6 for a period of 7 250 days at full power. The value of keff does not drop below 1 and shows an increasing trend. In the figure refuelling of each zone is indicated by the numbers in the boxes. Sometimes, more than one zone is refuelled at one time.
The increasing keff with burn-up means that there is no requirement to have a large extra reactivity at SOL to accommodate high burn-up. The requirement was to have a flat keff. This can probably be achieved by using a lower density of HM in the later cycles. The core can reach high burn-up without the need of burnable poison or control rods, increasing safety and decreasing fuel costs.
In Figure 7 the evolution of the four most abundant Pu isotopes (239Pu to 242Pu) is illustrated. Pu is bred during burn-up, but the increase in Pu is almost entirely 240Pu, so the fissile mass (239Pu and 241Pu) does not increase. The behaviour is similar both for a single zone [Zone 1, illustrated in Figure 7(a)] and the entire core [illustrated in Figure 7(b)]. The change in isotopic vector of Pu is given in Table 4.
Note that only 238U is added to the fuel cycle after the reactor is switched on: all fissile material required is bred by the core itself. The only time when Pu is added to the system is at SOL. 238U is a rest product of enrichment for LWR plants, and the Pu used at SOL is material recycled from MOX fuel for LWRs. Hence the fuel material is cheap, which is offset by the fact that the production of CPs is probably quite expensive. The breeding gain, especially breeding of fissile material, can be improved by using shorter refuelling intervals.
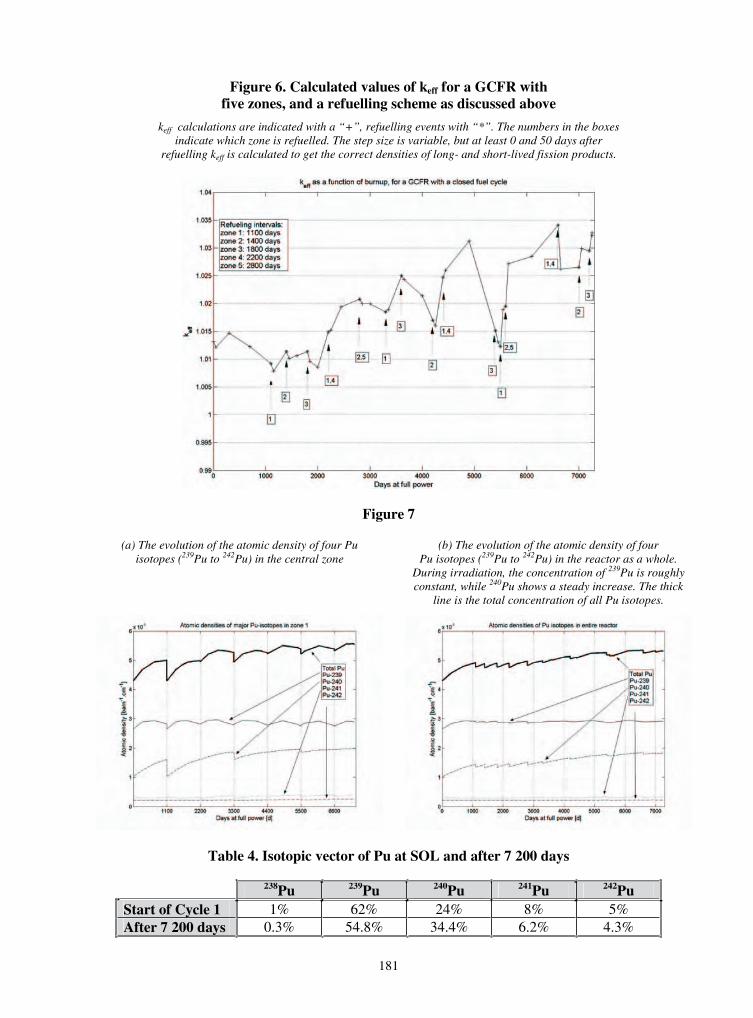
181
Figure 6. Calculated values of keff for a GCFR with five zones, and a refuelling scheme as discussed above
keff calculations are indicated with a “+”, refuelling events with “*”. The numbers in the boxes indicate which zone is refuelled. The step size is variable, but at least 0 and 50 days after
refuelling keff is calculated to get the correct densities of long- and short-lived fission products.
Figure 7
(a) The evolution of the atomic density of four Pu isotopes (239Pu to 242Pu) in the central zone
(b) The evolution of the atomic density of four Pu isotopes (239Pu to 242Pu) in the reactor as a whole.
During irradiation, the concentration of 239Pu is roughly constant, while 240Pu shows a steady increase. The thick
line is the total concentration of all Pu isotopes.
Table 4. Isotopic vector of Pu at SOL and after 7 200 days
238Pu 239Pu 240Pu 241Pu 242Pu Start of Cycle 1 1% 62% 24% 8% 5% After 7 200 days 0.3% 54.8% 34.4% 6.2% 4.3%

182
Conclusions and future research
A design is undertaken for a GCFR core with the following objectives: coated particle fuel, a homogeneous core at SOL, and a constant keff with burn-up.
A pebble bed core with coated particles embedded in large fuel spheres, is discarded because a flat keff cannot be reached, and the thermal behaviour is doubtful.
A core with coated particles cooled directly by helium has a better performance. This concept has a homogeneous core at SOL with five zones of equal volume and, with a simple refuelling and reprocessing scheme, keff is roughly constant over a long period of time. Only 238U is added to the core during its lifetime. No Pu is taken out of the fuel cycle, providing a nearly closed fuel cycle (minor actinides are not recycled). This concept uses only inexpensive fuel materials: the Pu at SOL is recycled from LWR cores, and for the 238U the tails of the enrichment process can be used. In the near future the core concept will be extended to a system with continuous refuelling.
REFERENCES
[1] Chermanne, J., GCFR Fuel Assemblies, Gas Breeder Reactor Association (1972).
[2] Mochizuki, et al., Design Study of a He Gas-cooled Fast Breeder Reactor, Kawasaki Heavy Industries (1972).
[3] Martin, D.G., “Considerations Pertaining to the Achievement of High Burn-ups in HTR Fuel”, Nuclear Engineering and Design (2002).
[4] Hoogenboom, J.E. and J.L. Kloosterman, “Generation and Validation of ORIGEN-S Libraries for Depletion and Transmutation Calculations Based on JEF-2.2 and EAF3 Basic Data”, Nuclear Engineering and Design (1997).
[5] The Nuclear Fuel of Pressurized Water Reactors and Fast Reactors, H. Bailly, Ed., CEA, France (1999).
[6] Petti, D., Coated Particle Fuel Behaviour under Irradiation, INEEL, USA (2002).
[7] SCALE-4.2 Modular Code System for Performing Standardized Computer Analyses for Licensing Evaluations, Oak Ridge National Laboratory, Tennessee, USA (1994).
[8] Ruetten, H.J. and J.C. Kuijper, Plutonium (1st and 2nd generation) Cell Burn-up Benchmark Specification, Document HTR-N1-02/06-s-3.1.1, European Commission (2003).
[9] Kugeler, K. and R. Schulten, Hochtemperaturreaktortechnik, Springer-Verlag (1989).

183
MODELLING OF FISSION PRODUCT DIFFUSION IN HIGH-TEMPERATURE GAS REACTOR FUEL
Pierre Guillermier FRAMATOME ANP, France
Abstract
The HTR-F (Fuel Technology) European R&D project is part of the 5th Framework Programme. In order to understand and to predict irradiation and behaviour under different conditions a good modelling of the fuel particles is needed. For this purpose, in this programme, it has been agreed to develop at the European level a common code taking into account the relevant existing models or developing new ones. A clear objective of such a code is to be flexible enough to calculate any type of high-temperature gas reactor (HTGR) particle fuel (U, Pu, Th, ...).
Within this framework, the role of FRAMATOME ANP is the modelling of fission product release.
In the HTR direct cycle power plants, the turbine coupled with the alternator is directly driven by the primary coolant, helium. The transport of radioactive particles that would deposit on components, especially the turbine blades, should be minimised regarding maintenance operations. The radioprotection issue underlines the importance of being able to model and estimate the release of fission products by the fuel.
Fission product release modelling and analysis was carried out in three steps:
� relevant research of the required input data (diffusion coefficients, temperature maps, source term, fraction of defected fuel particles…);
� modelling of the diffusion, absorption and transport of radioisotopes within the core;
� evaluation of the fission product quantity released into helium coolant from the core for the different HTGR projects taken into consideration (GT-MHR, HTGR-GT and PBMR).
This first estimation carried out in order to validate the model was limited to 137Cs.
Our results are in good agreement with the available values from the 600 MWth HTGR-GT Japanese project, the 300 MWth PBMR project in South Africa and the 600 MWth GT-MHR project in Russia.
184
Introduction
A characteristic feature of HTGRs is the essential role of the coated fuel particle acting as a tiny containment and serving as the main barrier against radionuclide release under all operational and accidental conditions.
The performance of TRISO (TRI-ISOtropic coatings) fuel particles and other types of coated fuel particles has been extensively investigated and a number of models developed. Previously published fuel performance models have been largely developed in the US, the UK and Germany [1]. A detailed compilation of these models has been published as an IAEA-TECDOC [2].
More recently, Miller, et al. [3] performed stress analysis for TRISO fuel and their results are being used in a fuel performance model being developed at the Idaho National Engineering and Environmental Laboratory (INEEL) [4].
In this paper, we present a description and some preliminary results of a fission product diffusion model, developed at FRAMATOME ANP, which will be part of the European HTR fuel code.
Objectives
The main purpose of this preliminary work is to estimate the behaviour of the 137Cs fission product, as an example, released into coolant helium from the core of the:
� GT-MHR project;
� Japanese 600 MWth HTGR-GT concept;
� PBMR project.
These results are then compared with the available calculated values from the JAERI Japanese team [5] for their 600 MWth HTGR-GT concept, the South African results [6] for the 300 MWth
PBMR project and the Russian results [7] for the 600 MWth GT-MHR.
Diffusion model hypothesis in the fuel particle
The Fickian law with an equivalent diffusion coefficient that globalises all the diffusion mechanisms is adopted. The source term in the kernel and radioactive disintegration must be added to complete the balance sheet:
.
sc.c.Dt
c�����
��
where c is the fission product concentration (at.cm3), � is the radioactive disintegration constant (7.297 � 10–10 s–1 for 137Cs), s is the source term (at.cm3.s–1), D is the equivalent diffusion coefficient of the considered layer:
T.R
Q
e.DoD�
�
where Do is the pre-exponential term (m2.s–1), Q is the activation energy (J.mol–1), R = 8.314 mol.J–1.K–1
and T is temperature (K).

185
Equivalent diffusion coefficient
According to the JAERI publication reference [5], the values which are assumed in this study for the 137Cs diffusion coefficient Do and the activation energy Q are as displayed in Table 1.
Table 1. 137Cs diffusion coefficient Do and activation energy Q for the different materials
UO2 Buffer I-PyC SiC O-PyC Matrix Graphite shellDo 6.75 � 10–10 6.69 � 10–6 6.69 � 10–9 6.75 � 10–12 6.69 � 10–9 3.6 � 10–4 9 � 10–6
Q 177 000 197 880 197 880 177 000 197 880 189 000 157 140
Fraction of defected fuel particle
Three types of particle have to be considered:
� Failed particle which has a fissured SiC layer. The diffusion coefficient of the defective layer is replaced by the PyC value and the ratio of coated particle with this defect is taken equal to 5 � 10–4 according to the Ref. [5].
Figure 1. Cross-section of fuel particle with crack in the SiC layer
� Exposed kernels. All the coatings of these particles have completely failed, after which fission products migrate directly and rapidly outside the particle. The ratio of this type of particle is taken equal to 2 � 10–5 according to the Ref. [5].
Figure 2. Cross-section of fuel particle with cracks in all layers

186
� Intact particles. All the coatings of these particles are unbroken.
Figure 3. Intact fuel particle
Diffusion from the matrix or the graphite to the coolant
It is necessary to know the fraction of fission products (FP) which passes through the graphite block to the helium coolant for the GT-MHR and for the HTGR-GT, and through the graphite’s shell to helium for the PBMR.
At the boundary between a solid and a gas, transition of diffusing atoms occurs due to the process of sorption and evaporation. In most practical cases these two processes are so fast that a local equilibrium between the concentration of atoms adsorbed at the solid surface and the concentration of atoms in the neighbouring layer of gas (“vapour pressure”) may be assumed. This means that the phenomenological data of importance is the sorption equation which relates these two equilibrium values.
Usually the equilibrium vapour pressure in the gas phase is expressed as a function of the fractional coverage of the solid surface by adsorbed atoms. In practice, adsorption is mainly of importance in the case of porous solids which have a large internal surface area per unit weight. The vapour pressure is expressed as an exponential function of temperature and sorbed concentration.
The transition of metallic fission products between fuel element surface and the turbulent coolant is described by sorption isotherms. Figure 4 from Ref. [2] shows an example of sorption isotherms in the case of caesium on H-451 graphite.
Figure 4. Sorption isotherms of caesium on H-451 graphite

187
To obtain the concentration of fission products in the helium when it is known in the graphite, the relevant equations are Henry’s law, Freundlich’s law and the ideal gas law.
The partial pressure of FP results from both the Freundlich and the Henrian contributions:
FH PPP ��
H for Henry’s law which predominates at low concentrations and which supposes an adsorption heat directly proportional to pressures and concentrations of the adsorbed species:
grt CCT
ED
T
BA
H ePlnln1 ��
�
���
�����
�
���
��
�
TddCt �� 21ln
F for Freundlich’s law which predominates at higher concentrations and which assumes a decreasing adsorption heat and an increasing concentration:
grCT
ED
T
BA
F ePln�
�
���
����
�
���
��
�
And according to ideal gas law:
Tk
ee
Tk
PC
B
CT
ED
T
BACC
T
ED
T
BA
B
b
grgrt lnlnln1 ��
���
����
�
���
����
�
���
�����
�
���
��
���
where P, PH and PF are partial pressures (Pa), Cb is concentration of FP in the boundary helium gas layer (at.m–3), T is the temperature (K), kB is 1.38 � 10–23 J.K–1 and Cgr is the concentration of FP in matrix or graphite bloc (mmol/Kg C).
For the fuel matrix material and graphite material (H-451), A, B, D, E, d1 and d2 are given in Ref. [2].
After the boundary helium gas layer, FP are transported in the coolant. The governing equation is:
� � � � � � � � �t,xCt,xCxA
xpt,xk
x
t,xCxv
t
t,xCbHe
f
LmHeHe �
���
���
�
where CHe is the concentration of FP in helium, Af is the sectional flow area (m2), Km is the mass transfer coefficient (m.s–1), PL is the wetted perimeter (m) and v is the helium velocity (m.s–1).
In the Japanese model [5], a global parameter � is introduced and used as ratio of an absorbed FP amount to a transported FP amount.
For temperatures above 700 C, Figure 5 shows that the concentrations’ ratio between gas and graphite is CHe = 0.9.Cgr.
These simplified functions are based on measurements at Peach Bottom HTR nuclear power plant. The 137Cs function ratio is assumed in the one-dimensional finite difference code which has been developed and serves as boundary condition.
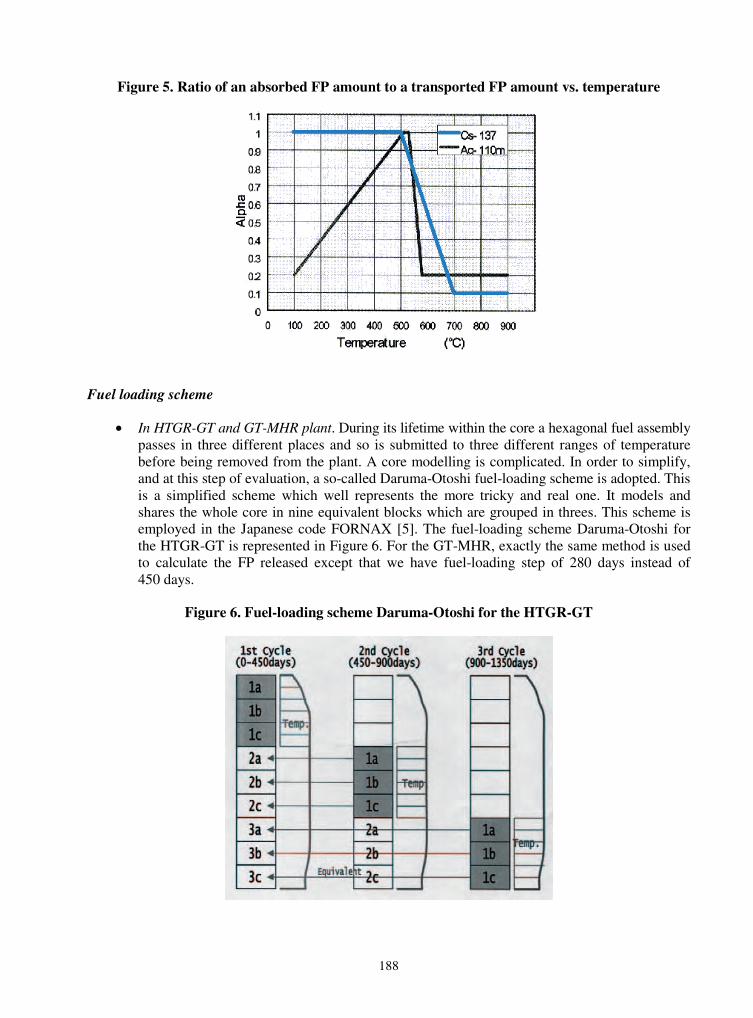
188
Figure 5. Ratio of an absorbed FP amount to a transported FP amount vs. temperature
Fuel loading scheme
� In HTGR-GT and GT-MHR plant. During its lifetime within the core a hexagonal fuel assembly passes in three different places and so is submitted to three different ranges of temperature before being removed from the plant. A core modelling is complicated. In order to simplify, and at this step of evaluation, a so-called Daruma-Otoshi fuel-loading scheme is adopted. This is a simplified scheme which well represents the more tricky and real one. It models and shares the whole core in nine equivalent blocks which are grouped in threes. This scheme is employed in the Japanese code FORNAX [5]. The fuel-loading scheme Daruma-Otoshi for the HTGR-GT is represented in Figure 6. For the GT-MHR, exactly the same method is used to calculate the FP released except that we have fuel-loading step of 280 days instead of 450 days.
Figure 6. Fuel-loading scheme Daruma-Otoshi for the HTGR-GT
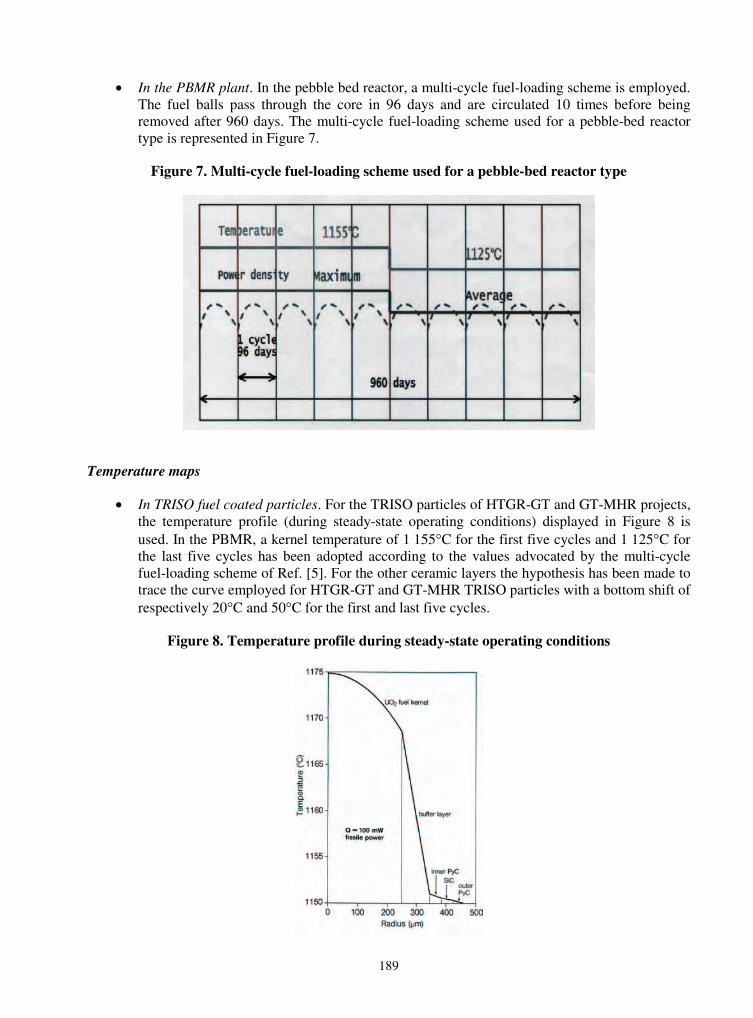
189
� In the PBMR plant. In the pebble bed reactor, a multi-cycle fuel-loading scheme is employed. The fuel balls pass through the core in 96 days and are circulated 10 times before being removed after 960 days. The multi-cycle fuel-loading scheme used for a pebble-bed reactor type is represented in Figure 7.
Figure 7. Multi-cycle fuel-loading scheme used for a pebble-bed reactor type
Temperature maps
� In TRISO fuel coated particles. For the TRISO particles of HTGR-GT and GT-MHR projects, the temperature profile (during steady-state operating conditions) displayed in Figure 8 is used. In the PBMR, a kernel temperature of 1 155 C for the first five cycles and 1 125 C for the last five cycles has been adopted according to the values advocated by the multi-cycle fuel-loading scheme of Ref. [5]. For the other ceramic layers the hypothesis has been made to trace the curve employed for HTGR-GT and GT-MHR TRISO particles with a bottom shift of respectively 20 C and 50 C for the first and last five cycles.
Figure 8. Temperature profile during steady-state operating conditions
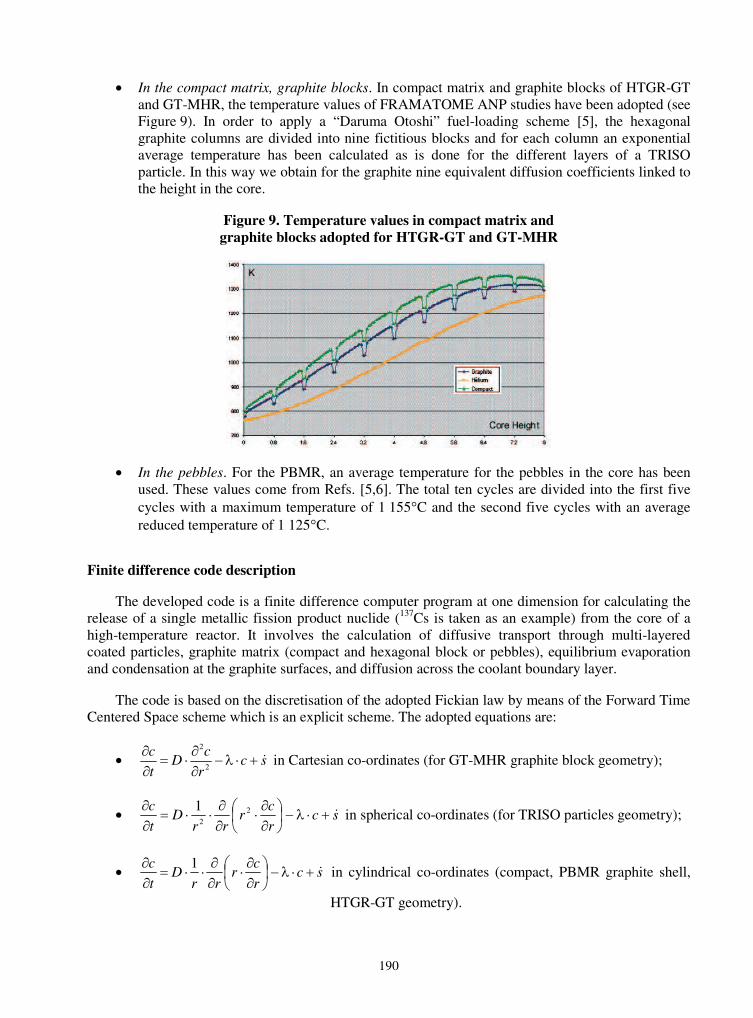
190
� In the compact matrix, graphite blocks. In compact matrix and graphite blocks of HTGR-GT and GT-MHR, the temperature values of FRAMATOME ANP studies have been adopted (see Figure 9). In order to apply a “Daruma Otoshi” fuel-loading scheme [5], the hexagonal graphite columns are divided into nine fictitious blocks and for each column an exponential average temperature has been calculated as is done for the different layers of a TRISO particle. In this way we obtain for the graphite nine equivalent diffusion coefficients linked to the height in the core.
Figure 9. Temperature values in compact matrix and graphite blocks adopted for HTGR-GT and GT-MHR
� In the pebbles. For the PBMR, an average temperature for the pebbles in the core has been used. These values come from Refs. [5,6]. The total ten cycles are divided into the first five cycles with a maximum temperature of 1 155 C and the second five cycles with an average reduced temperature of 1 125 C.
Finite difference code description
The developed code is a finite difference computer program at one dimension for calculating the release of a single metallic fission product nuclide (137Cs is taken as an example) from the core of a high-temperature reactor. It involves the calculation of diffusive transport through multi-layered coated particles, graphite matrix (compact and hexagonal block or pebbles), equilibrium evaporation and condensation at the graphite surfaces, and diffusion across the coolant boundary layer.
The code is based on the discretisation of the adopted Fickian law by means of the Forward Time Centered Space scheme which is an explicit scheme. The adopted equations are:
� scr
cD
t
c����
���
��
2
2
in Cartesian co-ordinates (for GT-MHR graphite block geometry);
� scr
cr
rrD
t
c�����
��
���
��
��
��� 2
2
1 in spherical co-ordinates (for TRISO particles geometry);
� scr
cr
rrD
t
c�����
��
���
��
��
��� 1
in cylindrical co-ordinates (compact, PBMR graphite shell,
HTGR-GT geometry).
191
The scheme which is employed can be unstable if the parameters dt and dr do not verify a stability criteria. The Von Neumann Stability Analysis gives (after calculations) a stability criterion. For the three systems of co-ordinates the Forward Time Centered Space scheme applies to our equation is stable if:
12
2���
dr
dt.D.
Thus, the values of dt and dr chosen in the code always verified this criteria.
Results
Table 2 summarises the results obtained with the FRAMATOME ANP evaluation in comparison with results obtained in Refs. [5-7].
Table 2. JAERI and FRAMATOME ANP results of 137Cs released into coolant He from a 600 MWth HTGR-GT core per 450 days of activity
FRAMATOME ANP JAERI [5] 137Cs released into coolant He from a 600 MWth HTGR-GT core per 450 days of activity
11.25 TBq 15.84 TBq
In the FRAMATOME ANP modelling, nearly all the main Japanese hypotheses (fuel loading scheme, TRISO particles and core dimensions, sorption-desorption simplified function, diffusion coefficients…) used in the Japan Atomic Research Institute’s in-house code FORNAX [5] were adopted by JAERI and FRAMATOME ANP. The diffusion coefficients being exponentially dependant on the temperature, consequently a relatively weak gap between the adopted temperatures can explain the difference between the two evaluations.
Table 3. JAERI, PBMR and FRAMATOME ANP results of 137Cs released into coolant from a 300 MWth PBMR core per 960 days of activity
FRAMATOME ANP JAERI [5] PBMR SA [6] 137Cs released into coolant He from a 300 MWth PBMR core per 960 days of activity
0.44 TBq 0.55 TBq 0.22 TBq
The South African result [6] delivered by the German code FRESCO uses a sorption-desorption function instead of the simplified JAERI sorption-desorption function [5] that is also adopted for the FRAMATOME ANP evaluation. This difference, added to a gap in the used temperature repartition, can explain these evaluations.
Table 4. Kurtchatov Institute and FRAMATOME ANP results of 137Cs released into coolant from a 600 MWth GT-MHR core per seven operating years
FRAMATOME ANP Kurtchatov Institute [7]137Cs released into coolant He from a 600 MWth GT-MHR core per seven operating years
11.47 TBq 14.09 TBq

192
For the GT-MHR, the Russian result [7] is issued from the Russian Activation Model [2] of fission product release (a technique of calculation developed in the Russian Research Center Kurchatov Institute). In this model, fission product release is treated as a superposition of releases from two groups of diffusion differing in the activation energy. Even if the Russian way of calculation is wholly different from the model expounded in this work, the results are once again of the same order of magnitude.
For the fission product 137Cs, taken as an example here, the results, in comparison with Japanese, South-African and Russian evaluations for different projects, show good agreement.
Conclusions
This model should be improved on different points. It should:
� include others fission product species (110Ag,..);
� include a sorption-desorption function using directly Henrich’s law and Freundlich’s law instead of using the Japanese simplified sorption-desorption functions;
� dispose of and consider always more accurate data dealing with temperature repartitions inside the core elements affected by fission products migration;
� study and include in the model the dependence of diffusion coefficients with fast neutron fluence.
Our first results are in good agreement with the available values from the 600 MWth HTGR-GT Japanese project, the 300 MWth PBMR project in South Africa and the 600 MWth GT-MHR project in Russia.
193
REFERENCES
[1] McCardell, R.K., D.A. Petti, et al., NP-MHTGR Fuel Development Program Results (1993).
[2] Fuel Performance and Fission Product Behavior in Gas-cooled Reactors, IAEA-TECDOC-978 (November 1997).
[3] Miller, G. and R. Bennett, “Analytical Solution for Stresses in TRISO-coated Particles”, Journal of Nuclear Materials, 206, 35-49 (November 1993).
[4] Petti, D., et al., Development of Improved Models and Designs for Coated-particle Fuels,INEEL/EXT-02-00369 (March 2002).
[5] Muto, Y., S. Ishiyama and S. Shiozawa, “Study of Fission Product Release, Plate-out and Maintenance in Helium Turbomachinery”, IAEA Committee Meeting on Gas Turbine Power Conversion Systems for Modular HTGRs, Japan Atomic Energy Research Institute, Palo Alto, CA, 14-16 November 2000.
[6] PBMR Safety Analysis Report, Document N°: 001929-207/00 Rev0a.
[7] 19th International Meeting GT-MHR Review on Fuel, July-August 2001.

195
SESSION IV
Improvement in Material Properties through High-temperature Irradiation
Chairs: T. Burchell, M. Yamawaki

197
INTRODUCTION OF PHOSPHORUS ATOMS IN SILICON CARBIDE USING NUCLEAR TRANSMUTATION DOPING AT ELEVATED TEMPERATURES
Takeshi Ohshima, Norio Morishita, Tomihiro Kamiya Japan Atomic Energy Research Institute (JAERI), Takasaki, Japan
Junichi Isoya University of Tsukuba, Japan
Shin-ichi Baba, Jun Aihara, Masatoshi Yamaji, Masahiro IshiharaJapan Atomic Energy Research Institute (JAERI), Oarai, Japan
Abstract
6H silicon carbides (SiCs) were implanted with phosphorus (P) ions at energies ranging from 9-21 MeV between RT and 1 200�C. To develop the evaluation techniques for P donors created in SiC by nuclear transmutation doping (NTD), P atoms implanted in SiC were studied using electron spin resonance (ESR). The ESR signal arising from residual defects decreased as the implantation temperature increased. Although the damage creation was strongly suppressed by implantation at 1 200�C, signals relating to shallow P donors were not observed for samples implanted up to 1 200�C. The signals arising from the isolated shallow P donors on the quasi-cubic silicon sites were observed for samples after annealing at 1 650�C for 30 minutes. Neutron irradiation into 6H-SiC at 1 200�C was carried out to develop an efficient process for NTD for SiC. The conduction type of the samples irradiated with neutrons was converted from p-type to n-type through annealing at 1 800�C for one minute.

198
Introduction
Silicon carbide (SiC) is regarded as a promising semiconductor material for high-power and high-frequency electronic devices because of its excellent physical and thermal properties such as a high thermal conductivity, a wide band gap, a high saturation velocity of electrons and a high break-down field [1-4]. Additionally, it is expected that SiC will be applied to electronic devices used in ionising radiation fields such as space and nuclear power reactors, due to its strong radiation resistance [5,6]. If SiC is to be applied to such devices, it is necessary to develop a fabrication technique for high-quality SiC substrates with uniform carrier concentration. Since phosphorus (P) atoms become shallow donors in SiC [7], NTD in which 31P atoms are created by the reaction [30Si(n,�)31Si] followed by � decay is thought to be a good method for the fabrication of n-type SiC substrates with uniform electron concentration. Heissenstein, et al. [8] reported that the conduction type of 6H-SiC was changed to n-type from p-type by neutron irradiation at room temperature (RT) and subsequent annealing above 1 700�C for 30 minutes. However, defects are also introduced in SiC by neutron irradiation, and as a result, the electrical properties of SiC degrade due to residual defects. Although thermal annealing at high temperatures above 1 500�C is usually carried out to remove defects after irradiation, heavy damage in SiC is hard to reverse [9]. Therefore, a process to reduce defects in neutron-irradiated SiC must be developed. Ohshima, et al. [10] reported that 6H-SiCs irradiated with P ions above 800�C showed better electrical properties than those irradiated at RT. This indicates that ion implantation at elevated temperatures is a useful method for impurity-doping into SiC. Since defects are also introduced during NTD, neutron irradiation at elevated temperature is thought to be a useful method for the reduction of damage induced in crystals. However, the electrical properties in SiC irradiated with neutrons at elevated temperature have not yet been clarified.
In this study, 6H-SiC was neutron-irradiated at elevated temperatures. The electrical properties of the samples were studied using the Hall effect measurement. Furthermore, to develop the evaluation technique for P atoms created in SiC by NTD, SiC implanted with P ions were investigated using ESR.
Experimental procedures
The samples used in the ESR study were n-type 6H-SiC crystals (Nippon Steel Corp.). The net donor concentration of the 6H-SiC was ~1017 per cm3. For ESR study, the samples were irradiated with P ions at energies from 9-21 MeV (nine-fold implantation, the dose of each energy is 1.3 � 1013
per cm2) in temperatures up to 1 200�C. The samples implanted with P ions were annealed at 1 650�Cfor 30 minutes in an Ar atmosphere. The samples used in the NTD study were p-type 6H-SiC epitaxial films (~5 �m) grown on p-type 6H-SiC substrates (Cree Research Inc.). The net acceptor concentration of the epitaxial films was 5.8 � 1015 per cm3. The samples were irradiated with neutrons at 1 200�C(JMTR at JAERI Oarai). The estimated fluences of fast and thermal neutrons were 1.37 � 1020 per cm2
and 2.48 � 1020 per cm2, respectively. After neutron irradiation, the samples were annealed at 1 600�C,1 700�C and 1 800�C in an Ar atmosphere.
The ESR measurements were performed using a Burker ESP300 X-band spectrometer and Oxford Instrument ESR-900 at the University of Tsukuba. Hall effect measurements of samples irradiated with neutrons were carried out at RT using a van der Pauw arrangement [11]. Ohmic electrodes formed on these samples as Al evaporated.
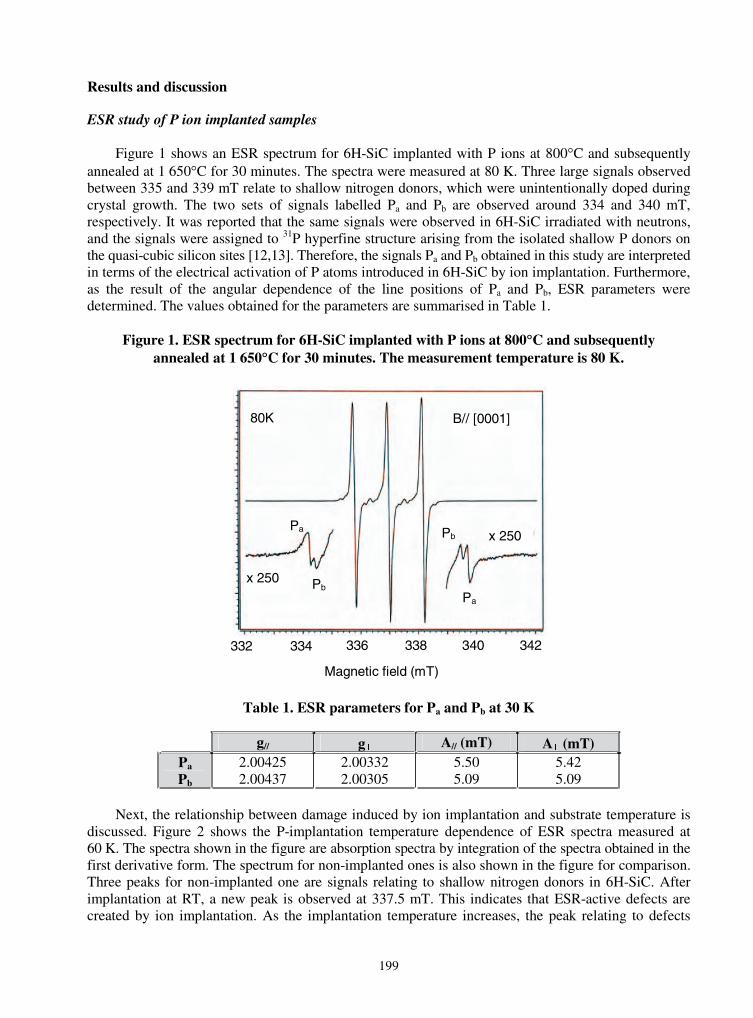
199
Results and discussion
ESR study of P ion implanted samples
Figure 1 shows an ESR spectrum for 6H-SiC implanted with P ions at 800�C and subsequently annealed at 1 650�C for 30 minutes. The spectra were measured at 80 K. Three large signals observed between 335 and 339 mT relate to shallow nitrogen donors, which were unintentionally doped during crystal growth. The two sets of signals labelled Pa and Pb are observed around 334 and 340 mT, respectively. It was reported that the same signals were observed in 6H-SiC irradiated with neutrons, and the signals were assigned to 31P hyperfine structure arising from the isolated shallow P donors on the quasi-cubic silicon sites [12,13]. Therefore, the signals Pa and Pb obtained in this study are interpreted in terms of the electrical activation of P atoms introduced in 6H-SiC by ion implantation. Furthermore, as the result of the angular dependence of the line positions of Pa and Pb, ESR parameters were determined. The values obtained for the parameters are summarised in Table 1.
Figure 1. ESR spectrum for 6H-SiC implanted with P ions at 800�C and subsequently annealed at 1 650�C for 30 minutes. The measurement temperature is 80 K.
Pa
Pb
Pb
Pa
x 250
x 250
332
Magnetic field (mT)
80K B// [0001]
334 336 338 342340
Table 1. ESR parameters for Pa and Pb at 30 K
g// g� A// (mT) A� (mT) Pa
Pb
2.004252.00437
2.003322.00305
5.505.09
5.425.09
Next, the relationship between damage induced by ion implantation and substrate temperature is discussed. Figure 2 shows the P-implantation temperature dependence of ESR spectra measured at 60 K. The spectra shown in the figure are absorption spectra by integration of the spectra obtained in the first derivative form. The spectrum for non-implanted ones is also shown in the figure for comparison. Three peaks for non-implanted one are signals relating to shallow nitrogen donors in 6H-SiC. After implantation at RT, a new peak is observed at 337.5 mT. This indicates that ESR-active defects are created by ion implantation. As the implantation temperature increases, the peak relating to defects
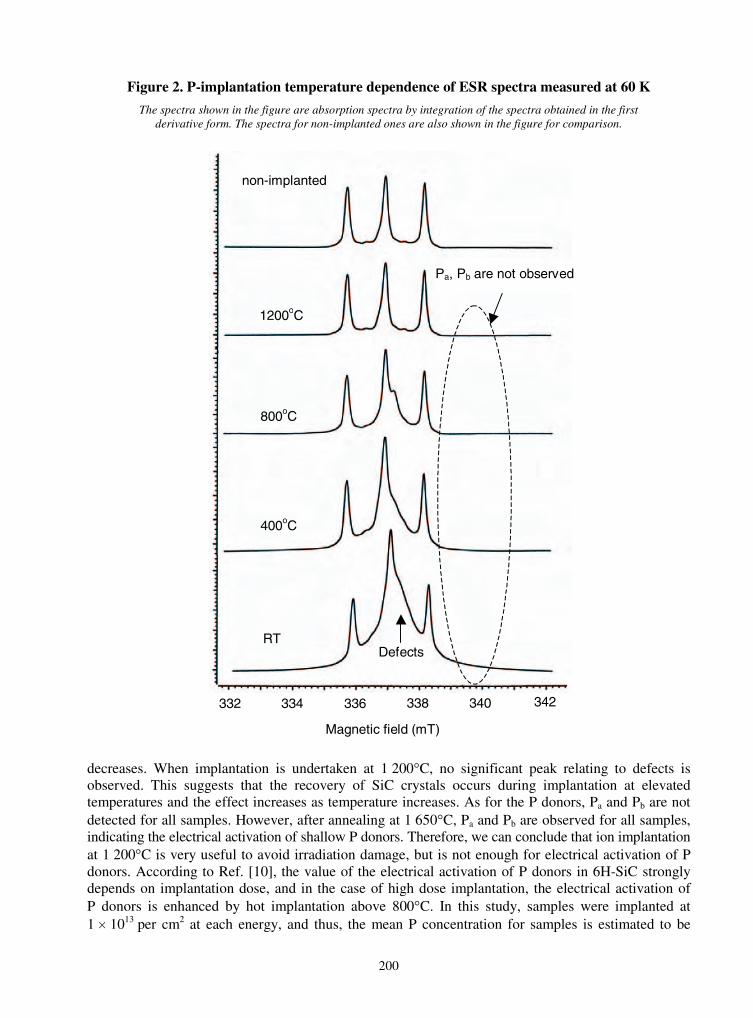
200
Figure 2. P-implantation temperature dependence of ESR spectra measured at 60 K
The spectra shown in the figure are absorption spectra by integration of the spectra obtained in the first derivative form. The spectra for non-implanted ones are also shown in the figure for comparison.
332 334 336 338 340 342
RT
400oC
800oC
1200oC
non-implanted
Magnetic field (mT)
Defects
Pa, Pb are not observed
decreases. When implantation is undertaken at 1 200�C, no significant peak relating to defects is observed. This suggests that the recovery of SiC crystals occurs during implantation at elevated temperatures and the effect increases as temperature increases. As for the P donors, Pa and Pb are not detected for all samples. However, after annealing at 1 650�C, Pa and Pb are observed for all samples, indicating the electrical activation of shallow P donors. Therefore, we can conclude that ion implantation at 1 200�C is very useful to avoid irradiation damage, but is not enough for electrical activation of P donors. According to Ref. [10], the value of the electrical activation of P donors in 6H-SiC strongly depends on implantation dose, and in the case of high dose implantation, the electrical activation of P donors is enhanced by hot implantation above 800�C. In this study, samples were implanted at 1 � 1013 per cm2 at each energy, and thus, the mean P concentration for samples is estimated to be
201
~1 � 101 per cm3 as determined by the Monte Carlo simulation code TRIM. Since this concentration is not a high dose, the result obtained for Pa and Pb in this study (no significant difference between RT and 1 200�C implantation after 1 650�C annealing) can be explained by the recovery of crystalline quality due to annealing at 1 650�C. To clarify the relationship between Pa and Pb signals and implantation dose, further investigations are necessary. In the case of NTD, heavy damage might be created during neutron irradiation. Hence, neutron irradiation at elevated temperatures is expected to be a useful technique for NTD.
Electrical properties of neutron-irradiated samples
Table 2 depicts the conduction type of neutron-irradiated samples subsequently annealed at 1 600�C, 1 700�C and 1 800�C. After annealing below 1 700�C, the conduction type is p-type. This indicates that significant electrons are not created by annealing below 1 700�C for five minutes because the electrical activation of P donors is not sufficient. On the other hand, after annealing at 1 800�C for one minute, the sample shows n-type conductivity. This suggests that enough electrons for the conversion of the conduction type are created in the 6H-SiC epitaxial layer by the activation of P donors. In previous studies [8,13], it was reported that the electrical activation of P created in SiC by neutron irradiation at RT was observed after annealing above 1 600�C for 30 minutes. In this study, the n-type samples are obtained by annealing at 1 800�C for only one minute. This suggests that damage creation by neutron irradiation is suppressed by elevated temperatures, and as a result P atoms created by NTD become easy to electrically activate through subsequent thermal annealing. To clarify this point, we intend to study neutron irradiation and subsequent annealing temperature dependence of the electrical activation of P donors.
Table 2. Conduction type of 6H-SiC irradiated with neutrons
Annealing temperature, time 1 600�C, 5 min. 1 700�C, 5 min. 1 800�C, 1 min. Conduction type p-type p-type n-type
Summary
To develop the evaluation method for defects and P donors created in SiC by NTD, 6H-SiCs implanted with P ions were studied using ESR. The value of the signal arising from damage creation by implantation decreases as the implantation temperature increases, and ESR spectra for 1 200�Cimplanted ones show almost the same as spectra for non-implanted ones. However, signals relating to shallow P donors are not observed for samples implanted up to 1 200�C. The signals labelled Pa and Pb
are observed for samples after annealing at 1 650�C. The signals are assigned to 31P hyperfine structure arising from the isolated shallow P donors on the quasi-cubic silicon sites. As a result of angular dependence of the line positions of Pa and Pb, ESR parameters were determined.
For NTD study, neutron irradiation of 6H-SiC at 1 200�C was carried out. The conduction type of samples irradiated with neutrons and subsequently annealed up to 1 800�C was measured using Hall effect measurements. As a result, the conversion from p-type to n-type is observed for samples annealed at 1 800�C for one minute.
202
REFERENCES
[1] Nelson, W.E., F.A. Halden, A. Rosengreen, J. Appl. Phys., 37, 333 (1966).
[2] Ferry, D.K., Phys. Rev., B12, 2361 (1975).
[3] Daimon, H., M. Yamanaka, M. Shibahara, E. Sakuma, S. Misawa, K. Endo, S. Yoshida, Appl. Phys. Lett., 51 2106 (1987).
[4] Bhaatnagar, M., J. Baliga, IEEE Trans. Electron Devices, 40, 645 (1993).
[5] Itoh, H., M. Yoshikawa, I. Nashiyama, S. Misawa, H. Okumura, S. Yoshida, IEEE Trans. Nucl. Sci., NS-37, 1732 (1990).
[6] Ohshima, T., M. Yoshikawa, H. Itoh, T. Takahashi, H. Okumura, S. Yoshida, I. Nashiyama, Inst.Phys. Conf. Ser., 142, 801 (1995).
[7] Troffer, T., C. Peppermuller, G. Pensl, K. Rottner and A. Schoner, J. Appl. Phys., 80, 3739 (1996).
[8] Heissenstein, H., C. Peppermuller, R. Helbig, J. Appl. Phys., 83, 7542 (1998).
[9] Kimoto, T., N. Inoue, H. Matsunami, Phys. Stat. Sol., (a) 162, 263 (1997).
[10] Ohshima, T., K. Abe, H. Itoh, M. Yoshikawa, K. Kojima, I. Nashiyama, S. Okada, Appl. Phys., A 71, 141 (2000).
[11] van der Pauw, L.J., Philips Research Reports, 13, 1 (1958).
[12] Grelich-Weber, S., Phys. Status Solidi, A 162, 95 (1997).
[13] Baranov, P.G., I.V. Ilyin, E.N. Mokov, H.J. von Bardeleben, J.L. Cantin, Phys. Rev., B 66, 165206 (2002).
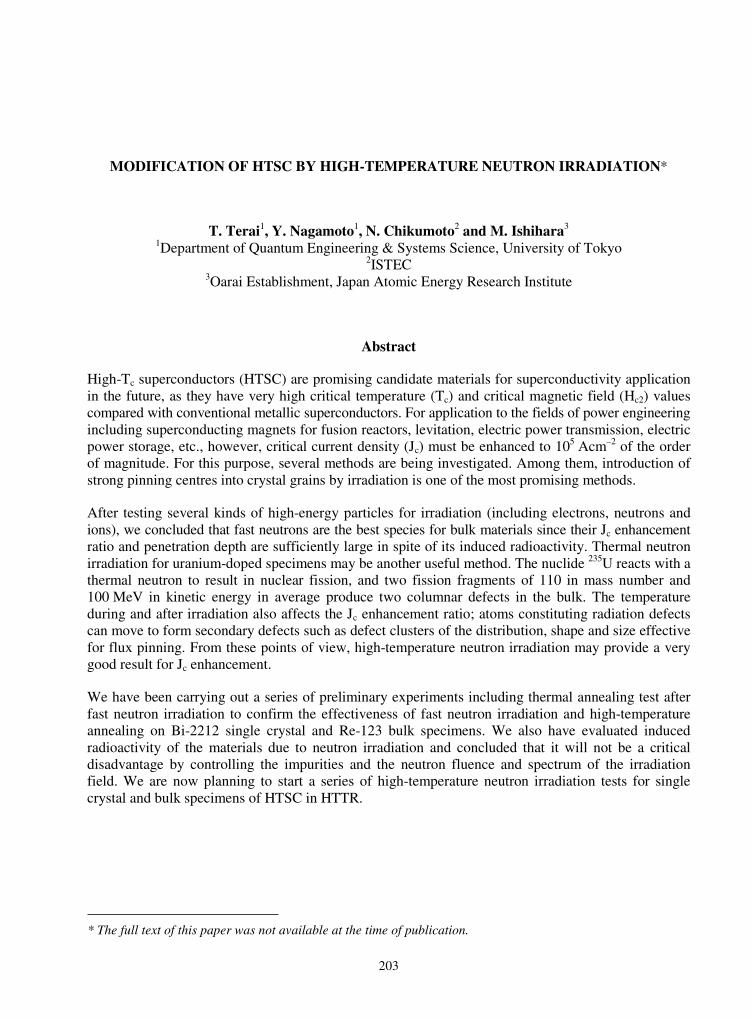
203
MODIFICATION OF HTSC BY HIGH-TEMPERATURE NEUTRON IRRADIATION*
T. Terai1, Y. Nagamoto1, N. Chikumoto2 and M. Ishihara3
1Department of Quantum Engineering & Systems Science, University of Tokyo 2ISTEC
3Oarai Establishment, Japan Atomic Energy Research Institute
Abstract
High-Tc superconductors (HTSC) are promising candidate materials for superconductivity application in the future, as they have very high critical temperature (Tc) and critical magnetic field (Hc2) values compared with conventional metallic superconductors. For application to the fields of power engineering including superconducting magnets for fusion reactors, levitation, electric power transmission, electric power storage, etc., however, critical current density (Jc) must be enhanced to 105 Acm–2 of the order of magnitude. For this purpose, several methods are being investigated. Among them, introduction of strong pinning centres into crystal grains by irradiation is one of the most promising methods.
After testing several kinds of high-energy particles for irradiation (including electrons, neutrons and ions), we concluded that fast neutrons are the best species for bulk materials since their Jc enhancement ratio and penetration depth are sufficiently large in spite of its induced radioactivity. Thermal neutron irradiation for uranium-doped specimens may be another useful method. The nuclide 235U reacts with a thermal neutron to result in nuclear fission, and two fission fragments of 110 in mass number and 100 MeV in kinetic energy in average produce two columnar defects in the bulk. The temperature during and after irradiation also affects the Jc enhancement ratio; atoms constituting radiation defects can move to form secondary defects such as defect clusters of the distribution, shape and size effective for flux pinning. From these points of view, high-temperature neutron irradiation may provide a very good result for Jc enhancement.
We have been carrying out a series of preliminary experiments including thermal annealing test after fast neutron irradiation to confirm the effectiveness of fast neutron irradiation and high-temperature annealing on Bi-2212 single crystal and Re-123 bulk specimens. We also have evaluated induced radioactivity of the materials due to neutron irradiation and concluded that it will not be a critical disadvantage by controlling the impurities and the neutron fluence and spectrum of the irradiation field. We are now planning to start a series of high-temperature neutron irradiation tests for single crystal and bulk specimens of HTSC in HTTR.
* The full text of this paper was not available at the time of publication.
205
EFFECTS OF SUPERPLASTIC DEFORMATIONS ON THERMOPHYSICAL PROPERTIES OF TETRAGONAL ZIRCONIA POLYCRYSTALS
Y. Motohashi, C. Wan, T. Sakuma, S. Harjo The Research Center for Superplasticity, Faculty of Engineering, Ibaraki University
4-12-1 Nakanarusawa, Hitachi, Ibaraki 316-8511, Japan
T. Shibata, M. Ishihara, S. Baba, T. Hoshiya Oarai Research Establishment, Japan Atomic Energy Research Institute
3607 Oaraimachi, Higashiibaraki 311-1394, Japan
Abstract
Neutron irradiation studies on superplastic zirconia-based ceramics are now in progress as an innovative basic project using the High-temperature Engineering Test Reactor (HTTR) in Japan. The characteristics of the zirconia-based engineering components, made through the formation of superplastic, may be strongly affected by their response to transient or steady-state heat flow. Reliable thermophysical properties such as the coefficients of thermal expansion and thermal conductivity are, therefore, needed to estimate and predict the influence of a high-temperature environment. Accordingly, one of this project’s targets is to study the thermophysical properties of superplastic zirconia-based ceramics. The first stage of the research addresses the effects of superplastic deformations on the thermophysical properties of a typical superplastic ceramic, 3 mol% yttria-stabilised tetragonal zirconia polycrystals (3Y-TZP), in its un-irradiated state.
First, superplastic tensile deformations were conducted on 3Y-TZP specimens under different conditions in order to obtain specimens with different microstructural characteristics. Afterwards, the following actions were taken:
� Specific heat measurements were conducted on the specimens at temperatures ranging from 473 K to 1 273 K.
� The thermal diffusivity was measured using a laser flash method. The thermal conductivity was then calculated from the measured thermal diffusivity, specific heat and density.
� The linear thermal expansion was measured by a push-rod type dilatometer from 300 K to 1 473 K. The coefficient of linear thermal expansion (CTE) was estimated from the thermal expansion data.
The results obtained from the above measurements are discussed, as is the microstructural evolution caused by the superplastic deformations. It was found that the specific heat was almost independent of microstructural evolution, whereas the thermal diffusivity, thermal conductivity and thermal expansion were quite sensitive to deformation-induced cavities. The changes in the average grain size and grain aspect ratio had almost no effect on the thermophysical properties within the present experimental range.
206
Introduction
Yttria-stabilised tetragonal zirconia polycrystals (Y-TZP) have been recognised to be promising candidates for a wide variety of structural materials, as they possess high toughness, high heat resistance, excellent chemical stability and so forth. Although structural ceramics generally have a brittle nature, Y-TZP can demonstrates characteristics of superplasticity under the proper conditions, enabling them to be formed into targeted shapes by means of plastic working [1]. It is, therefore, highly anticipated that superplastic-forming of Y-TZP is applicable to structural materials and components in the field of nuclear energy [2]. To that purpose, the effects of irradiation on physical, thermal, mechanical, chemical and other properties of the Y-TZP must be examined fully. Up to now, a number of irradiation studies on zirconia-based ceramics have been conducted using neutrons [3-6], ions [7-13] and electrons [14]. As far as we know, however, there have been few studies on the effects of irradiation on superplastic ceramics, including Y-TZP. Accordingly, neutron irradiation studies on superplastic ceramics have been undertaken as an innovative basic project using the High-temperature Engineering Test Reactor (HTTR) in Japan.
Incidentally, it is well known that superplastic deformations may bring about microstructural evolution such as the formation of a great number of fine cavities at grain boundary triple points, concurrent grain growth and so forth. These microstructural changes can cause deterioration in some mechanical properties of Y-TZP [15,16].
As the first stage of the project, we investigated the thermophysical properties of un-irradiated Y-TZP, particularly the effects of superplastic deformations on specific heat, thermal diffusivity, thermal conductivity and thermal expansion of un-irradiated 3 mol% Y2O3 stabilised TZP (3Y-TZP) [17-19]. This was done from the viewpoint that as much information as possible concerning the thermal properties of Y-TZP must be obtained to assure their suitability for application in nuclear energy field. In this article, the results obtained in the studies of the thermal properties of 3Y-TZP [17-19] are assembled and discussed together.
Experimental
Preparation and characteristics of samples
The 3Y-TZP samples for superplastic deformations were provided by a commercial source and were produced by sintering powder of ZrO2 containing 3 mol% Y2O3 in solid solution at 1 723 K in air. The samples were all from a single batch, ensuring identical composition and properties. The chemical composition of the 3Y-TZP is shown in Table 1. The tensile test pieces with gauge length 25 mm, width 4 mm and thickness 3 mm were machined from the sintered 3Y-TZP.
Table 1. Chemical composition of 3Y-TZP (in wt.%)
Y2O3 Al2O3 SiO2 Fe2O3 Na2O ZrO2
5.15 � 0.01 � 0.02 � 0.01 � 0.04 bal.
Superplastic deformations were carried out in air at 1 723 K using a universal tensile machine. The temperature deviation was �5 K. All samples were pre-elongated to a nominal strain of 5% with a cross-head speed of 0.626 mm/min, which assured the subsequent deformation of all samples to deform as uniformly as possible. Then samples of No.1 to 2, No.3 to 4 and No.5 to 6 were superplastically elongated to the total nominal strain of 70% with strain rates (�0) of 4.2 � 10–4s–1, 1.4 � 10–3s–1 and 4.2 � 10–3s–1, respectively, while No. 7 to 8 are un-deformed samples.
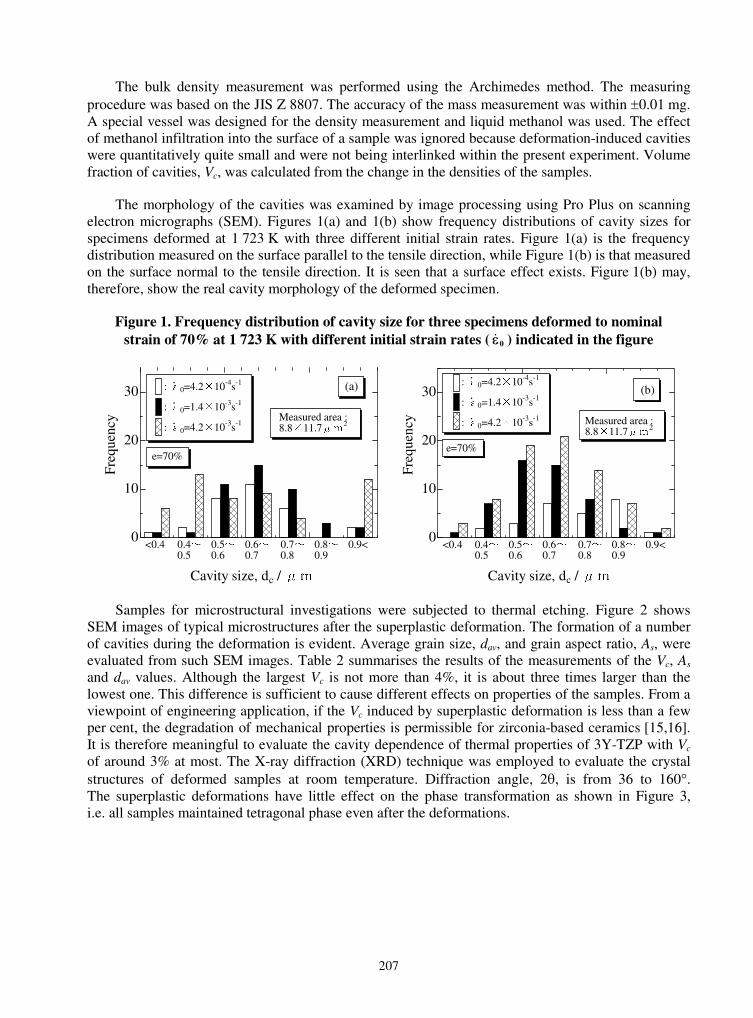
207
The bulk density measurement was performed using the Archimedes method. The measuring procedure was based on the JIS Z 8807. The accuracy of the mass measurement was within �0.01 mg. A special vessel was designed for the density measurement and liquid methanol was used. The effect of methanol infiltration into the surface of a sample was ignored because deformation-induced cavities were quantitatively quite small and were not being interlinked within the present experiment. Volume fraction of cavities, Vc, was calculated from the change in the densities of the samples.
The morphology of the cavities was examined by image processing using Pro Plus on scanning electron micrographs (SEM). Figures 1(a) and 1(b) show frequency distributions of cavity sizes for specimens deformed at 1 723 K with three different initial strain rates. Figure 1(a) is the frequency distribution measured on the surface parallel to the tensile direction, while Figure 1(b) is that measured on the surface normal to the tensile direction. It is seen that a surface effect exists. Figure 1(b) may, therefore, show the real cavity morphology of the deformed specimen.
Figure 1. Frequency distribution of cavity size for three specimens deformed to nominal strain of 70% at 1 723 K with different initial strain rates ( 0�� ) indicated in the figure
0
10
20
30 : 0=4.2�10-4s-1
: 0=1.4�10-3s-1
: 0=4.2�10-3s-1
Freq
uenc
y
Cavity size, dc /
<0.4 0.40.5
0.50.6
0.60.7
0.70.8
0.80.9
0.9<
(a).
.
. Measured area : 8.8�11.7 2
e=70%
0
10
20
30: 0=4.2�10-4s-1
: 0=1.4�10-3s-1
: 0=4.2�10-3s-1Fr
eque
ncy
Cavity size, dc /
<0.4 0.40.5
0.50.6
0.60.7
0.70.8
0.80.9
0.9<
(b).
.
. Measured area :8.8�11.7 2
e=70%
Samples for microstructural investigations were subjected to thermal etching. Figure 2 shows SEM images of typical microstructures after the superplastic deformation. The formation of a number of cavities during the deformation is evident. Average grain size, dav, and grain aspect ratio, As, were evaluated from such SEM images. Table 2 summarises the results of the measurements of the Vc, As
and dav values. Although the largest Vc is not more than 4%, it is about three times larger than the lowest one. This difference is sufficient to cause different effects on properties of the samples. From a viewpoint of engineering application, if the Vc induced by superplastic deformation is less than a few per cent, the degradation of mechanical properties is permissible for zirconia-based ceramics [15,16]. It is therefore meaningful to evaluate the cavity dependence of thermal properties of 3Y-TZP with Vc
of around 3% at most. The X-ray diffraction (XRD) technique was employed to evaluate the crystal structures of deformed samples at room temperature. Diffraction angle, 2�, is from 36 to 160�.The superplastic deformations have little effect on the phase transformation as shown in Figure 3, i.e. all samples maintained tetragonal phase even after the deformations.
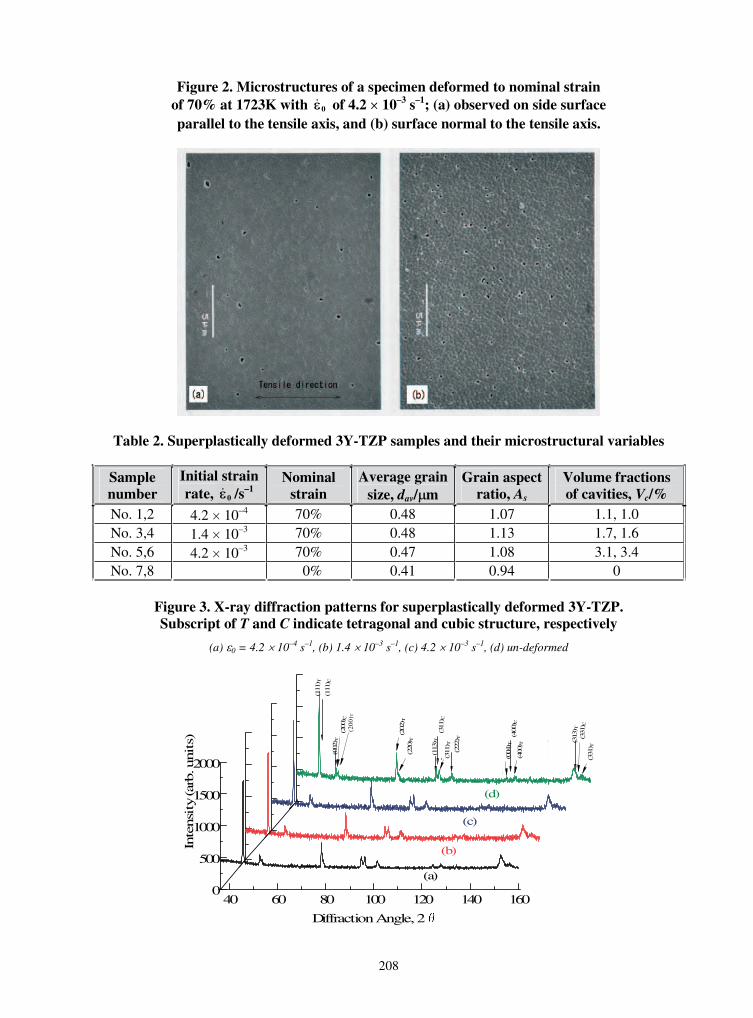
208
Figure 2. Microstructures of a specimen deformed to nominal strain of 70% at 1723K with 0�� of 4.2 � 10–3 s–1; (a) observed on side surface parallel to the tensile axis, and (b) surface normal to the tensile axis.
Table 2. Superplastically deformed 3Y-TZP samples and their microstructural variables
Sample number
Initial strain rate, 0�� /s–1
Nominal strain
Average grain size, dav/�m
Grain aspect ratio, As
Volume fractions of cavities, Vc/%
No. 1,2 4.2 � 10–4 70% 0.48 1.07 1.1, 1.0 No. 3,4 1.4 � 10–3 70% 0.48 1.13 1.7, 1.6 No. 5,6 4.2 � 10–3 70% 0.47 1.08 3.1, 3.4 No. 7,8 00% 0.41 0.94 0
Figure 3. X-ray diffraction patterns for superplastically deformed 3Y-TZP. Subscript of T and C indicate tetragonal and cubic structure, respectively
(a) �0 = 4.2 � 10–4 s–1, (b) 1.4 � 10–3 s–1, (c) 4.2 � 10–3 s–1, (d) un-deformed
(b)
Diffraction Angle, 2
Inte
nsi
ty
(c)
(a)
(311
) C
(330
) T
(arb
. units)
(d)
(202
) T
(111
) T
(111
) C(0
02) T
(113
) T
(311
) T
(222
) T
(004
) T
(400
) T
(313
) T
(331
) T
(331
) C
(400
) C
(220
) T
(200
) C
40 60 80 100 120 140 1600
500
1000
1500
2000
(200
) T
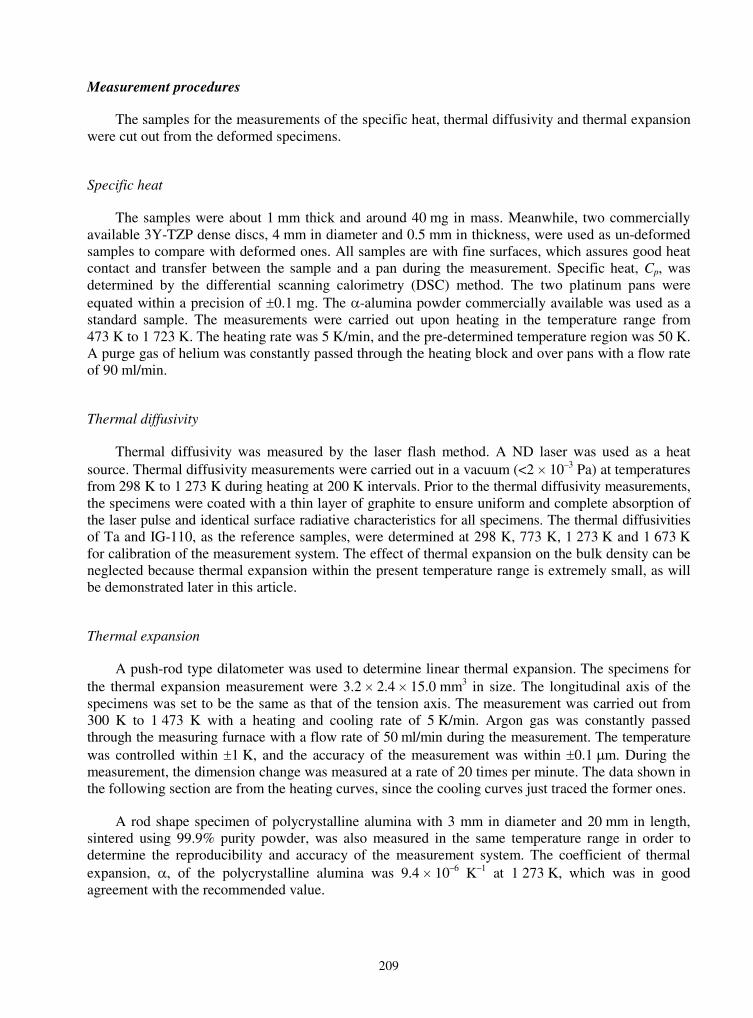
209
Measurement procedures
The samples for the measurements of the specific heat, thermal diffusivity and thermal expansion were cut out from the deformed specimens.
Specific heat
The samples were about 1 mm thick and around 40 mg in mass. Meanwhile, two commercially available 3Y-TZP dense discs, 4 mm in diameter and 0.5 mm in thickness, were used as un-deformed samples to compare with deformed ones. All samples are with fine surfaces, which assures good heat contact and transfer between the sample and a pan during the measurement. Specific heat, Cp, was determined by the differential scanning calorimetry (DSC) method. The two platinum pans were equated within a precision of �0.1 mg. The �-alumina powder commercially available was used as a standard sample. The measurements were carried out upon heating in the temperature range from 473 K to 1 723 K. The heating rate was 5 K/min, and the pre-determined temperature region was 50 K. A purge gas of helium was constantly passed through the heating block and over pans with a flow rate of 90 ml/min.
Thermal diffusivity
Thermal diffusivity was measured by the laser flash method. A ND laser was used as a heat source. Thermal diffusivity measurements were carried out in a vacuum (<2 � 10–3 Pa) at temperatures from 298 K to 1 273 K during heating at 200 K intervals. Prior to the thermal diffusivity measurements, the specimens were coated with a thin layer of graphite to ensure uniform and complete absorption of the laser pulse and identical surface radiative characteristics for all specimens. The thermal diffusivities of Ta and IG-110, as the reference samples, were determined at 298 K, 773 K, 1 273 K and 1 673 K for calibration of the measurement system. The effect of thermal expansion on the bulk density can be neglected because thermal expansion within the present temperature range is extremely small, as will be demonstrated later in this article.
Thermal expansion
A push-rod type dilatometer was used to determine linear thermal expansion. The specimens for the thermal expansion measurement were 3.2 � 2.4 � 15.0 mm3 in size. The longitudinal axis of the specimens was set to be the same as that of the tension axis. The measurement was carried out from 300 K to 1 473 K with a heating and cooling rate of 5 K/min. Argon gas was constantly passed through the measuring furnace with a flow rate of 50 ml/min during the measurement. The temperature was controlled within �1 K, and the accuracy of the measurement was within �0.1 m. During the measurement, the dimension change was measured at a rate of 20 times per minute. The data shown in the following section are from the heating curves, since the cooling curves just traced the former ones.
A rod shape specimen of polycrystalline alumina with 3 mm in diameter and 20 mm in length, sintered using 99.9% purity powder, was also measured in the same temperature range in order to determine the reproducibility and accuracy of the measurement system. The coefficient of thermal expansion, �, of the polycrystalline alumina was 9.4 � 10–6 K–1 at 1 273 K, which was in good agreement with the recommended value.

210
Results and discussion
Specific heat [17]
� Reproducibility and accuracy of measurements. It is extremely important to assure the accuracy and reproducibility of measurements by DSC [20], because experimental data can be affected by many factors. In this study, much attention was paid to each point of experimental procedures to evaluate the experimental results. The accuracy and the reproducibility of the measurement were checked with � alumina powder as the standard sample. The data obtained are shown in Figure 4. The inaccuracy in the measurements is not more than 5% in comparison with the standard data [21]. Moreover, the reproducibility of the measurement was within �3%. These results showed good agreement with the conclusion in a technical report provided by the Rigaku Corporation [22].
� Specific heat measurements. Experimental results are shown in Figure 5. The specific heat (Cp) is about 0.55 Jg–1K–1 at 473 K, then it gradually increases as temperature increases, to about 0.63 Jg–1K–1 at 1 273 K. The slope of curves decreases with temperature, i.e. the increasing rate of the specific heat slows down with temperature. The specific heat values of yttria-stabilised zirconia were reported at temperatures from 298 K to 873 K by Hasselman, et al. [23]. Raghavan, et al. [24] also reported specific heat capacities of commercially available 3Y-TZP, which were measured in the temperature range 373-1 273 K by the DSC method. Comparisons of those results with the data obtained in this study are plotted in Figure 6. The average specific heat values in the present study show a good agreement with the reported values. Swain, et al. studied specific heat values of porous partially stabilised zirconia with 3.3 mass % MgO [25]. Although there were different ratios of the tetragonal-to-monoclinic phase content among the specimens with various porosities, little difference in the specific heat was found. In this study, the factor of crystal structure can be neglected because the crystal structure of the 3Y-TZP showed no change within the present experimental range. The inaccuracy of the measurements is not more than 5% in comparison with the standard data. The experimental results showed that there was no relationship between specific heat and microstructural evolution caused by the superplastic deformations [17].
Figure 4. Accuracy of specific heat measurements on the � alumina powder as the standard sample
400 600 800 1000 1200 1400
0.6
0.8
1
1.2
1.4
Temperature, T/K
Standard Data [21] Standard Sample (I) Standard Sample (II)
Spe
cifi
c H
eat,
Cp/
Jg–1
K–1
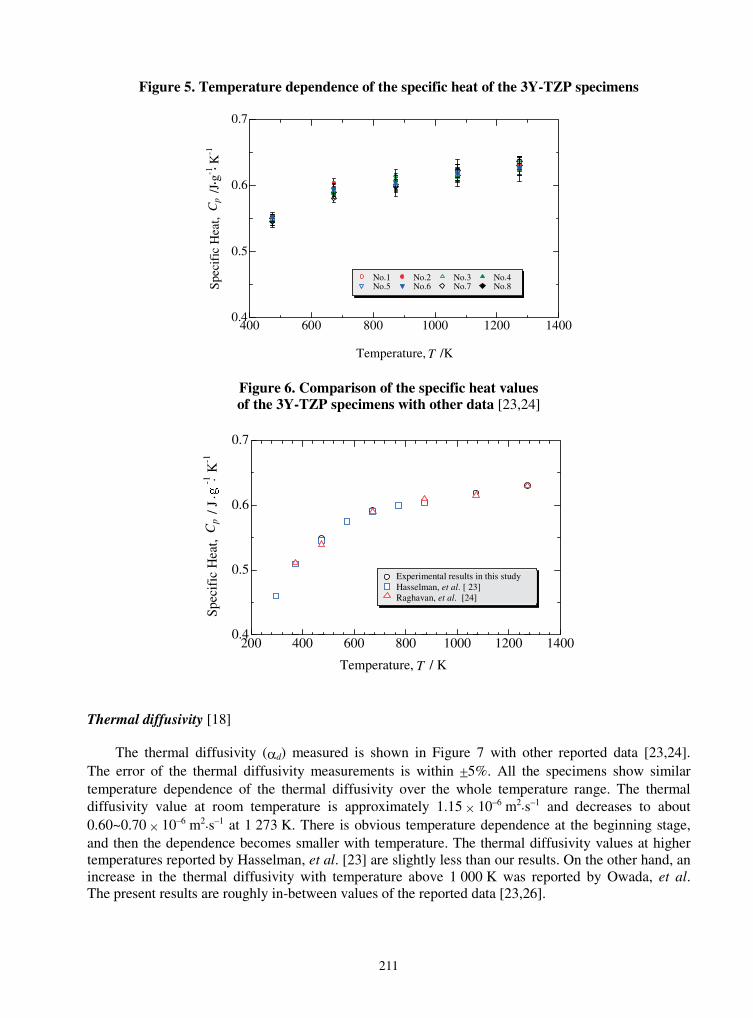
211
Figure 5. Temperature dependence of the specific heat of the 3Y-TZP specimens
400 600 800 1000 1200 14000.4
0.5
0.6
0.7
Temperature,
Cp
No.1 No.2 No.3 No.4 No.5 No.6 No.7 No.8
/J g
-1 K
-1
/K
.
.
T
Spec
ific
Hea
t,
Figure 6. Comparison of the specific heat values of the 3Y-TZP specimens with other data [23,24]
200 400 600 800 1000 1200 14000.4
0.5
0.6
0.7
Temperature,
/ J
-1 K
-1C
p
/ K
Experimental results in this study Hasselman et al. 20) Raghavan et al. 24)
.
.
Spec
ific
Hea
t,
T
Thermal diffusivity [18]
The thermal diffusivity (�d) measured is shown in Figure 7 with other reported data [23,24]. The error of the thermal diffusivity measurements is within �5%. All the specimens show similar temperature dependence of the thermal diffusivity over the whole temperature range. The thermal diffusivity value at room temperature is approximately 1.15 � 10–6 m2s–1 and decreases to about 0.60~0.70 � 10–6 m2s–1 at 1 273 K. There is obvious temperature dependence at the beginning stage, and then the dependence becomes smaller with temperature. The thermal diffusivity values at higher temperatures reported by Hasselman, et al. [23] are slightly less than our results. On the other hand, an increase in the thermal diffusivity with temperature above 1 000 K was reported by Owada, et al.The present results are roughly in-between values of the reported data [23,26].
Experimental results in this study Hasselman, et al. [ 23] Raghavan, et al. [24]
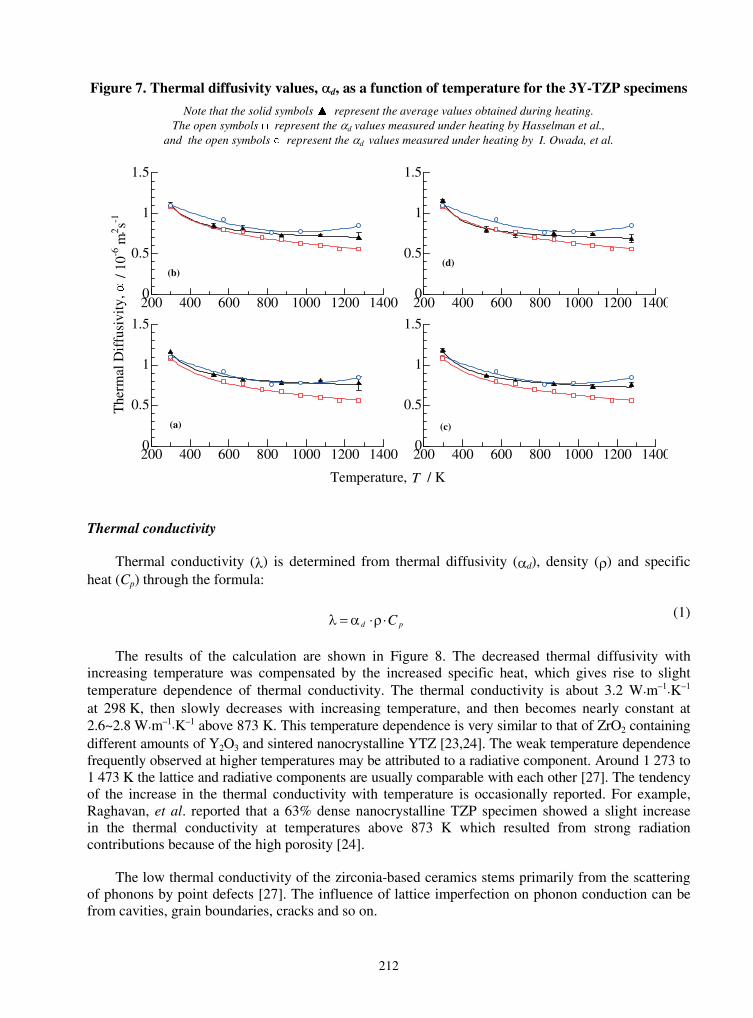
212
Figure 7. Thermal diffusivity values, �d, as a function of temperature for the 3Y-TZP specimens
Note that the solid symbols �represent the average values obtained during heating. The open symbols �represent the �d values measured under heating by Hasselman et al.,��
and�the open symbols �represent the �d values measured under heating by�I. Owada, et al.
200 400 600 800 1000 1200 14000
0.5
1
1.5
(a)
The
rmal
Dif
fusi
vity
,/ 1
0-6 m
2 s-1
.
200 400 600 800 1000 1200 14000
0.5
1
1.5
(c)
200 400 600 800 1000 1200 14000
0.5
1
1.5
(d)
Temperature, / KT
200 400 600 800 1000 1200 14000
0.5
1
1.5
(b)
Thermal conductivity
Thermal conductivity (�) is determined from thermal diffusivity (�d), density (�) and specific heat (Cp) through the formula:
pd C�� � (1)
The results of the calculation are shown in Figure 8. The decreased thermal diffusivity with increasing temperature was compensated by the increased specific heat, which gives rise to slight temperature dependence of thermal conductivity. The thermal conductivity is about 3.2 Wm–1K–1
at 298 K, then slowly decreases with increasing temperature, and then becomes nearly constant at 2.6~2.8 Wm–1K–1 above 873 K. This temperature dependence is very similar to that of ZrO2 containing different amounts of Y2O3 and sintered nanocrystalline YTZ [23,24]. The weak temperature dependence frequently observed at higher temperatures may be attributed to a radiative component. Around 1 273 to 1 473 K the lattice and radiative components are usually comparable with each other [27]. The tendency of the increase in the thermal conductivity with temperature is occasionally reported. For example, Raghavan, et al. reported that a 63% dense nanocrystalline TZP specimen showed a slight increase in the thermal conductivity at temperatures above 873 K which resulted from strong radiation contributions because of the high porosity [24].
The low thermal conductivity of the zirconia-based ceramics stems primarily from the scattering of phonons by point defects [27]. The influence of lattice imperfection on phonon conduction can be from cavities, grain boundaries, cracks and so on.

213
Figure 8. Thermal conductivity values as a function of temperature for the 3Y-TZP specimens
Solid symbols represent those data calculated from experimental data and open symbols represent those obtained from fitting thermal diffusivity curves
Effects of grain boundary related changes on thermal conductivity
Grain boundaries play a very important role in superplastic deformations, as grain boundary sliding is one of the main deformation mechanisms for zirconia-based ceramics. Superplastic deformations result in the concurrent grain growth in the deformed specimens, which brings about change in grain boundary area per unit volume. Theoretically, it is inferred that the thermal conductivity of yttria-stabilised zirconias with very small grain sizes is lower than that of those coarse zirconias [24], since grain boundary can inhibit heat conduction additionally. In this experiment, the grain boundary area per unit volume of the deformed specimens is at least about 10% less than that of the un-deformed specimen at least. However, at each temperature, the thermal conductivity value was almost independent of the average grain size within the range of 0.4~0.5 m, which might not be small enough to affect the thermal conductivity. Consequently the grain size dependence of the thermal conductivity was not well pronounced. On the other hand, other characteristics of the grain boundary can affect thermal conduction. Strong segregation of Y3+ to the grain boundaries of zirconia-based ceramics, which was thought to be favourable for superplastic deformation, has been reported [28]. The cations can be assumed to go into the zirconia lattice which results in greater scattering of the lattice vibrations. In fact, the decrease in the thermal conductivity of Y-TZP with increasing Y2O3 content has been found. The amount of Y3+ segregation can increase with the deformation. It is inevitable that this kind of numerous cations can cause additional scattering of phonon. An alternative explanation can be put forward for such effect [29]. Although yttria cations may be practically soluble in lattice of zirconia, the segregated cations locate at the periphery of the grains, i.e. in a segregated layer. Because the vibration of these enriched cations at the grain boundary area can be strengthened through raising temperature, there is a possibility that the characteristic microstructure at grain boundaries of 3Y-TZP may affect the phonon mean free path. However, grain boundary scattering of lattice vibrations should have less influence on the thermal conductivity than the phonon mean free path shortening at higher temperatures.
200 400 600 800 1000 1200 14000
1
2
3
4
Temperature, T/K
(b) No.1 No.2
200 400 600 800 1000 1200 14000
1
2
3
4
(c) No.3 No.4
200 400 600 800 1000 1200 14000
1
2
3
4
(d) No.5 No.6
200 400 600 800 1000 1200 14000
1
2
3
4
(a) No.7 No.8The
rmal
Dif
fusi
vity
, ��/
10-6�m
2 s-1

214
The results of different thermal conductivity measurements made on zirconia-based ceramics have been scattered, though within a certain amount, which may be attributed to different composition as well as experimental procedures.
Effects of cavities
The effective thermal conductivity, �e, values obtained in the present study are slightly smaller than in other reported data [21,24]. This can be explained by the thermal resistance caused by the deformation-induced cavities. As is well known, various lattice imperfections give rise to a lack of harmony and result in phonon scattering. Strengthened phonon-phonon scattering with increasing temperature can lead to the decrease in the phonon mean free path and further affect the thermal conductivity [30]. Pores or cavities are one of the most effective factors to affect the phonon scattering. Therefore, the thermal conductivity values obtained are plotted in Figure 9 as a function of Vc. As shown in the figure, the cavity dependence of 3Y-TZP is not very pronounced at room temperature, while the thermal conductivity at higher temperatures is fairly dependent on the cavities although the experimental data are somewhat scattered at higher temperatures.
Several theories on the evaluation of thermal conductivity have been published and used to explain experimental data for thermal conductivity of porous materials. The following relation:
c
ce V.
V
501
10 �
�� �
(2)
is an expression known as Maxwell-Eucken’s equation, where �e(Wm–1K–1) is the effective thermal conductivity, and �0 is the thermal conductivity for the completely dense matrix material. It is assumed that pores are far apart so that mutual interaction between pores can be neglected. Some other expressions showed good agreement with the Maxwell-Eucken’s equation when such factors as shape and orientation of pores were simplified and the contribution of convection and a radiative component to the thermal conduction were neglected. For example, Schulz proposed a simple model by assuming closed spherical pores [31]. For a low porosity condition (Vc � 10%), the effect of porosity on the thermal conductivity of solid composites can be described as follows:
� � 51
0 1 .
ce V�� �(3)
Schulz’s equation shows a quite similar correlation with Eq. (2) within a certain porosity range. After analysing some published theories on the thermal conductivity of two-phase materials, Kawashima, et al. came up with a modified effective-medium theory for the thermal conductivity of porous Ni/YSZ particulate composites and provided a relationship between the thermal conductivity and porosity [32]:
� �� � %VVV ccce 6703212
10 ����� �
(4)
This correlation predicted the experimental data well in their study. Because the thermal radiation and convection within pores are extremely weak, the thermal conductivity of the pores themselves is often very small compared with that of the matrix material. Thus, the effect of temperature is usually neglected in many empirical equations.

215
A modified Loeb’s formula, which put temperature as a variable, was proposed based on the measurements on un-irradiated UO2 fuel: [33]
� �ce V��� � 10
(5)
where � is an empirical parameter expressed as a function of temperature, � = 2.6 – 0.5 � 10–5T, and T is temperature in �C.
The curves calculated from Eqs. (2) to (4) are shown in Figure 9. It is interesting to note that the curves calculated from the above three Eqs. (2) to (4) do not fit well with the experimental data in the present study. Why can’t the well-employed expressions explain the measured result satisfactorily? One of the reasons may be that these equations are applicable only for a limited range of materials. That is to say, it is difficult for one expression to accurately predict the thermal conduction behaviour of different porous materials. Another reason may be that pores or cavities with different properties probably have different effects on thermal conductivity. Schulz [31] took such parameters as the shape, orientation, structure type, distribution of the pores and porosity into consideration when he studied the thermal conductivity of porous composites. However, these factors can be neglected or simplified for the present 3Y-TZP specimens, since the deformation-induced cavities are sphere-like, very fine
Figure 9. Relationships between the thermal conductivity and volume fraction of cavities of the 3Y-TZP specimens at different temperatures
0 1 2 3 41
2
3
4
The
rmal
Con
duct
ivity
,
298K
/ W m
-1 K
-1
Volume Fraction of Cavities,
e= 0[1-Vc)/(1+0.5Vc)e= 0(1-Vc)
1.5
e=0.5 0(1-Vc)(2-3Vc)e= 0(1- Vc)
Vc
e
1
2
3
4
523K
e= 0[1-Vc)/(1+0.5Vc)e= 0(1-Vc)
1.5
e=0.5 0(1-Vc)(2-3Vc)e= 0(1- Vc)
1
2
3
4
673K
(%)
e= 0[1-Vc)/(1+0.5Vc)e= 0(1-Vc)
1.5
e=0.5 0(1-Vc)(2-3Vc)e= 0(1- Vc)
.
.
0 1 2 3 41
2
3
4873K
e= 0[1-Vc)/(1+0.5Vc)e= 0(1-Vc)
1.5
e=0.5 0(1-Vc)(2-3Vc)e= 0(1- Vc)
1
2
3
4
1073K
e= 0[1-Vc)/(1+0.5Vc)e= 0(1-Vc)
1.5
e=0.5 0(1-Vc)(2-3Vc)e= 0(1- Vc)
1
2
3
4
1273K
e= 0[1-Vc)/(1+0.5Vc)e= 0(1-Vc)
1.5
e=0.5 0(1-Vc)(2-3Vc)e= 0(1- Vc)
216
and distributed quite uniformly in the deformed specimens. What should be emphasised is the size of the cavities. Residual pores of sintered ceramics are often very large in size, and cellular pores in refractory materials are often more than 1 mm in diameter. On the contrary, the deformation-induced cavities in the present 3Y-TZP are much smaller than these pores. The presence of nanocavities at the grain boundary triple points in the superplastically deformed materials has been confirmed, meaning that there is larger total cavity surface area in superplastically deformed 3Y-TZP than ordinary sintered or refractory ceramics for the same porosity or Vc value. Obviously, additional thermal resistance may be caused by those small cavities located at the grain boundary triple points. Thus, phonon scattering can be affected more strongly in the deformed 3Y-TZP than general porous ceramics. Therefore, the above empirical Eqs. (2) to (4) can not satisfactorily explain the experimental data in this study.
In the present study, the measured data were found to agree well with the modified Loeb’s Eq. (5), in which the empirical parameter, �, indicating the contribution of cavity scattering to the thermal conductivity, was expressed as a function of absolute temperature. The �0 value was obtained according to the fitting curve of thermal diffusivity of the un-deformed specimen. It is assumed that all the cavities in the deformed 3Y-TZP specimens are spherical and Vc is independent of the shape and size of cavities. Fitting equations of the relationship between the volume fraction of cavities and the effective thermal conductivity at different temperatures are listed in Table 3. The cavity dependence of the thermal conductivity is comparatively weaker at room temperature than at other temperatures. The � can be expressed as follows: � = -0.1 + 6.9 � 10–3T – 3.7 � 10–6T2 (298 K < T < 1 273 K, 0 � Vc � 4%). On the whole, the above Eq. (5) can show the contribution of the cavity scattering to the thermal conductivity. Although the � values at 523 K and 1 073 K deviate somewhat from the fitting curve, no explanation can be given here. Generally, the cavity dependence of the thermal conductivity is not very high at room temperature, and then the effect of the cavities on the thermal conductivity increases with temperature, because the vibration of these enriched cations at the grain boundary area can be strengthened with raising temperature. Meanwhile, a radiative component, usually neglected at low or middle temperatures, becomes significant at higher temperatures. When the effect of other factors on heat transfer does not change, with increasing temperatures, the photon conductivity fraction of the total thermal conductivity of the ceramic substances gradually becomes large. Thus, � may tend to decrease slightly above approximately 1 000 K. The larger Vc of the 3Y-TZP from further superplastic deformations will be helpful to verify the cavity dependence.
Table 3. Fitting equations of the relationship between the volume fraction of cavities and the effective thermal conductivity of the 3Y-TZP specimens at different temperatures
Temperature, K Fitting equations 298 K �e = 3.19 (1-1.2Vc)523 K �e = 3.01 (1-3.3Vc)673 K �e = 2.95 (1-3.0Vc)873 K �e = 2.87 (1-3.0Vc)
1 073 K �e = 2.85 (1-2.3Vc)1 273 K �e = 2.85 (1-3.2Vc)
Thermal expansion [19]
Linear thermal expansions, �L/L0, are shown as a function of temperature in Figure 10. The fitting equations are listed in Table 4. By setting �L/L0 = 0 at 300 K, these data were fitted to a second order polynomial function of temperature by the least-squares method from 700 K to 1 473 K. The difference between experimental results and fitting data is less than 0.3%.
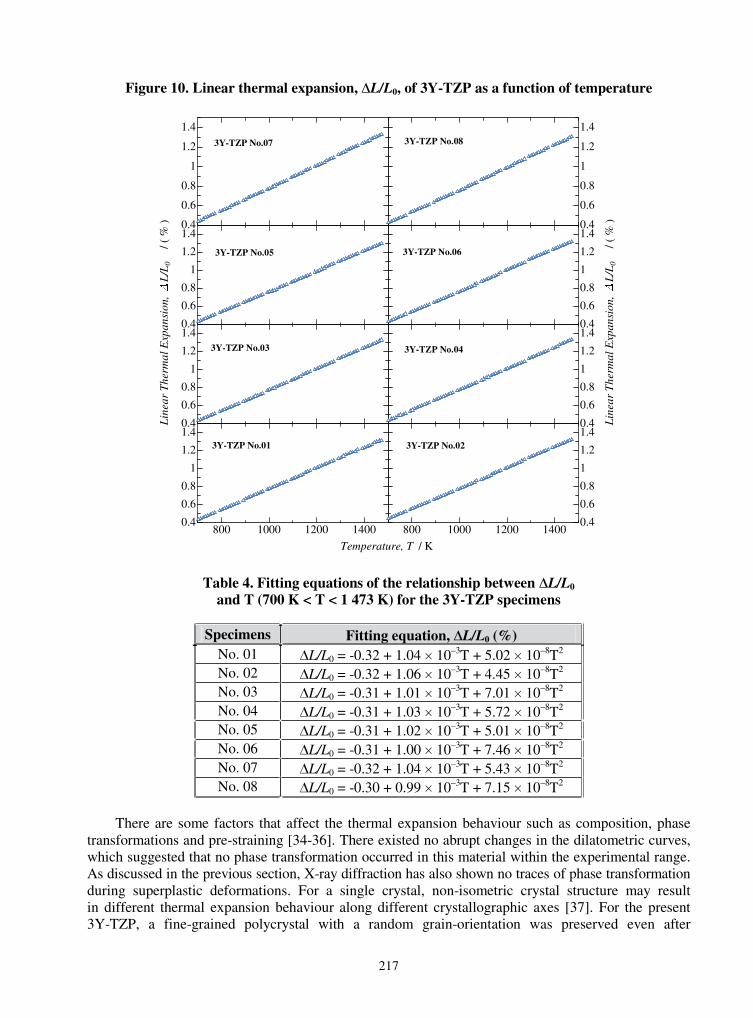
217
Figure 10. Linear thermal expansion, �L/L0, of 3Y-TZP as a function of temperature
800 1000 1200 14000.4
0.6
0.8
1
1.2
1.43Y-TZP No.01
Lin
ear
The
rmal
Exp
ansi
on,
L/L
0
Temperature, T
/ ( %
)
/ K
800 1000 1200 14000.4
0.6
0.8
1
1.2
1.43Y-TZP No.02
0.4
0.6
0.8
1
1.2
1.43Y-TZP No.03
0.4
0.6
0.8
1
1.2
1.43Y-TZP No.04
0.4
0.6
0.8
1
1.2
1.4
3Y-TZP No.05
Lin
ear
The
rmal
Exp
ansi
on,
L/L
0/ (
% )
0.4
0.6
0.8
1
1.2
1.4
3Y-TZP No.06
0.4
0.6
0.8
1
1.2
1.43Y-TZP No.07
0.4
0.6
0.8
1
1.2
1.43Y-TZP No.08
Table 4. Fitting equations of the relationship between �L/L0
and T (700 K < T < 1 473 K) for the 3Y-TZP specimens
Specimens Fitting equation, �L/L0 (%) No. 01 �L/L0 = -0.32 + 1.04 � 10–3T + 5.02 � 10–8T2
No. 02 �L/L0 = -0.32 + 1.06 � 10–3T + 4.45 � 10–8T2
No. 03 �L/L0 = -0.31 + 1.01 � 10–3T + 7.01 � 10–8T2
No. 04 �L/L0 = -0.31 + 1.03 � 10–3T + 5.72 � 10–8T2
No. 05 �L/L0 = -0.31 + 1.02 � 10–3T + 5.01 � 10–8T2
No. 06 �L/L0 = -0.31 + 1.00 � 10–3T + 7.46 � 10–8T2
No. 07 �L/L0 = -0.32 + 1.04 � 10–3T + 5.43 � 10–8T2
No. 08 �L/L0 = -0.30 + 0.99 � 10–3T + 7.15 � 10–8T2
There are some factors that affect the thermal expansion behaviour such as composition, phase transformations and pre-straining [34-36]. There existed no abrupt changes in the dilatometric curves, which suggested that no phase transformation occurred in this material within the experimental range. As discussed in the previous section, X-ray diffraction has also shown no traces of phase transformation during superplastic deformations. For a single crystal, non-isometric crystal structure may result in different thermal expansion behaviour along different crystallographic axes [37]. For the present 3Y-TZP, a fine-grained polycrystal with a random grain-orientation was preserved even after
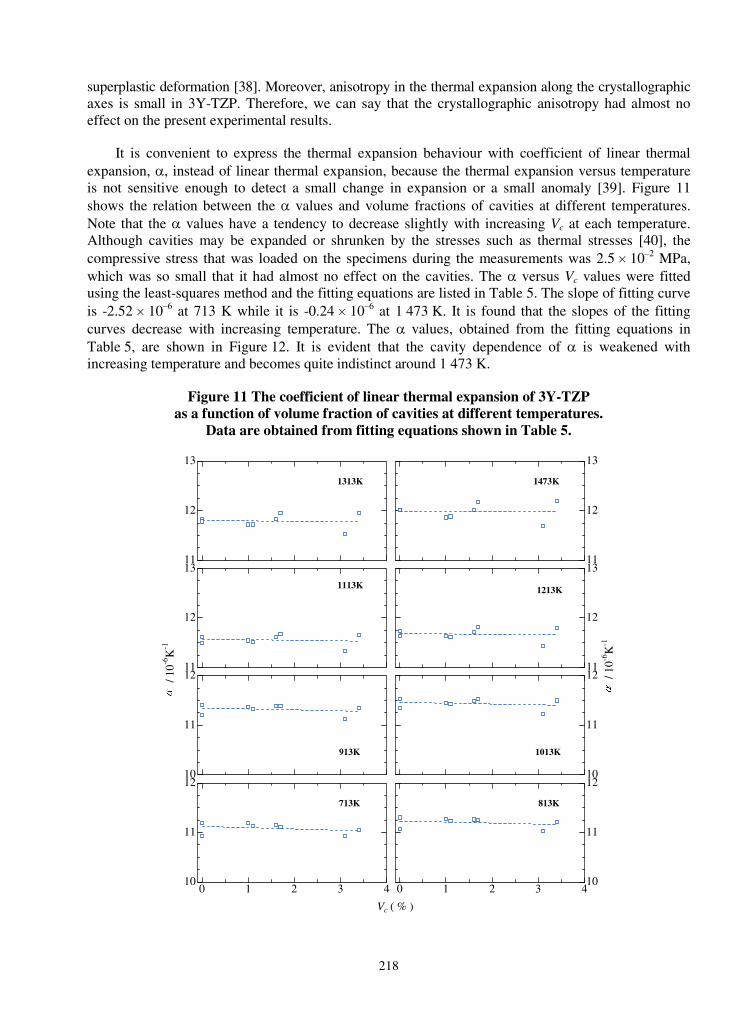
218
superplastic deformation [38]. Moreover, anisotropy in the thermal expansion along the crystallographic axes is small in 3Y-TZP. Therefore, we can say that the crystallographic anisotropy had almost no effect on the present experimental results.
It is convenient to express the thermal expansion behaviour with coefficient of linear thermal expansion, �, instead of linear thermal expansion, because the thermal expansion versus temperature is not sensitive enough to detect a small change in expansion or a small anomaly [39]. Figure 11 shows the relation between the � values and volume fractions of cavities at different temperatures. Note that the � values have a tendency to decrease slightly with increasing Vc at each temperature. Although cavities may be expanded or shrunken by the stresses such as thermal stresses [40], the compressive stress that was loaded on the specimens during the measurements was 2.5 � 10–2 MPa, which was so small that it had almost no effect on the cavities. The � versus Vc values were fitted using the least-squares method and the fitting equations are listed in Table 5. The slope of fitting curve is -2.52 � 10–6 at 713 K while it is -0.24 � 10–6 at 1 473 K. It is found that the slopes of the fitting curves decrease with increasing temperature. The � values, obtained from the fitting equations in Table 5, are shown in Figure 12. It is evident that the cavity dependence of � is weakened with increasing temperature and becomes quite indistinct around 1 473 K.
Figure 11 The coefficient of linear thermal expansion of 3Y-TZP as a function of volume fraction of cavities at different temperatures.
Data are obtained from fitting equations shown in Table 5.
0 1 2 3 410
11
12
Vc
713K
( % )
0 1 2 3 410
11
12
813K
10
11
12
913K
11
12
13
1473K
10
11
12
1013K
11
12
13
1113K
/ 10-6
K-1
11
12
13
1213K
11
12
13
1313K
/ 10-6
K-1
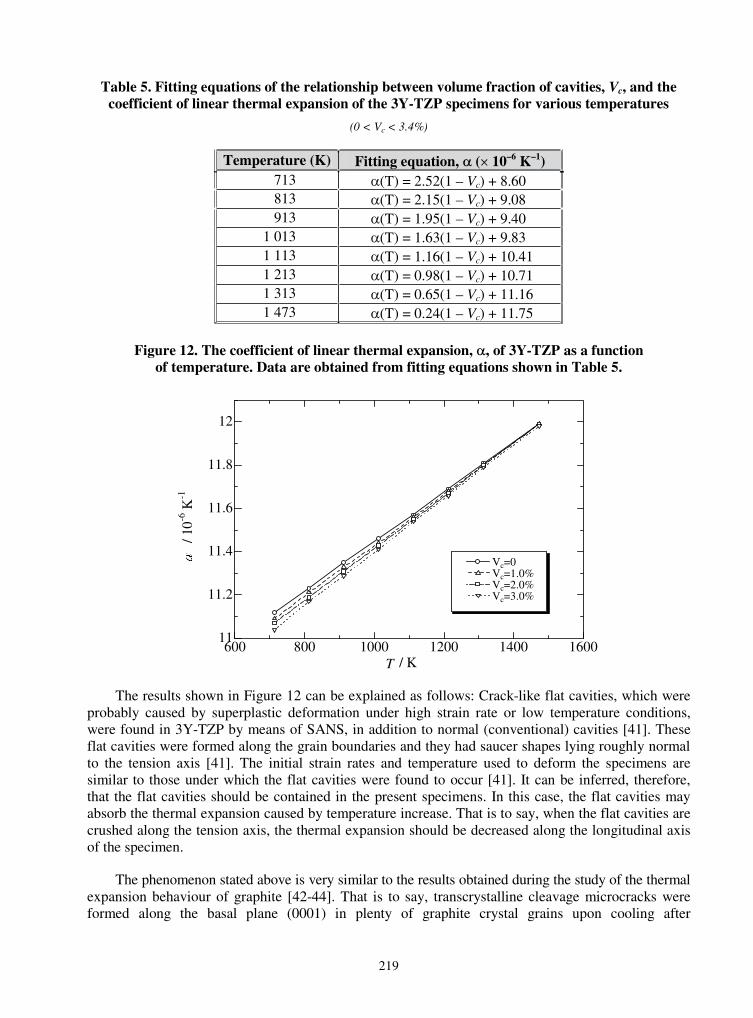
219
Table 5. Fitting equations of the relationship between volume fraction of cavities, Vc, and the coefficient of linear thermal expansion of the 3Y-TZP specimens for various temperatures
(0 < Vc < 3.4%)
Temperature (K) Fitting equation, � (� 10–6 K–1)713 �(T) = 2.52(1 – Vc) + 8.60 813 �(T) = 2.15(1 – Vc) + 9.08 913 �(T) = 1.95(1 – Vc) + 9.40
1 013 �(T) = 1.63(1 – Vc) + 9.83 1 113 �(T) = 1.16(1 – Vc) + 10.41 1 213 �(T) = 0.98(1 – Vc) + 10.71 1 313 �(T) = 0.65(1 – Vc) + 11.16 1 473 �(T) = 0.24(1 – Vc) + 11.75
Figure 12. The coefficient of linear thermal expansion, �, of 3Y-TZP as a function of temperature. Data are obtained from fitting equations shown in Table 5.
600 800 1000 1200 1400 160011
11.2
11.4
11.6
11.8
12
/ 10-6
K-1
T / K
Vc=0 Vc=1.0% Vc=2.0% Vc=3.0%
The results shown in Figure 12 can be explained as follows: Crack-like flat cavities, which were probably caused by superplastic deformation under high strain rate or low temperature conditions, were found in 3Y-TZP by means of SANS, in addition to normal (conventional) cavities [41]. These flat cavities were formed along the grain boundaries and they had saucer shapes lying roughly normal to the tension axis [41]. The initial strain rates and temperature used to deform the specimens are similar to those under which the flat cavities were found to occur [41]. It can be inferred, therefore, that the flat cavities should be contained in the present specimens. In this case, the flat cavities may absorb the thermal expansion caused by temperature increase. That is to say, when the flat cavities are crushed along the tension axis, the thermal expansion should be decreased along the longitudinal axis of the specimen.
The phenomenon stated above is very similar to the results obtained during the study of the thermal expansion behaviour of graphite [42-44]. That is to say, transcrystalline cleavage microcracks were formed along the basal plane (0001) in plenty of graphite crystal grains upon cooling after

220
graphitisation. The coefficient of linear thermal expansion, �g, of polycrystalline graphite can be expressed by �g = R�a + (1 – R)��c, where �c is the coefficient of linear thermal expansion perpendicular to the basal plane and �a is the coefficient parallel to the basal plane of graphite single crystal, R is a preferred orientation parameter and � is the accommodation coefficient smaller than unity [43]. When there exist such microcracks, an apparent �c value is reduced owing to the closing of the microcracks, which appears in a decrease in the � value, resulting in a decrease in the �g value [43]. This kind of process has been named as “accommodation”.
An effect of the flat cavities in the present study may be similar to that of the accommodation of the cleavage microcracks found in graphite. That is to say, it is probable that the thermal expansion along the tension axis was reduced by the crushing and/or closing of the flat cavities, which led to the apparent decrease in the � value. Because the measurement was carried out during heating, the flat cavities would be gradually crushed and the space, which could absorb the thermal expansion, would decrease, i.e. the cavity dependence of � weakened with increasing temperature. Moreover, it seemed that the spaces of the flat cavities would be almost lost at around 1 473 K and accordingly the cavity dependence of � disappeared at 1 473 K.
Regarding the effect of thermal history on the flat cavities, although the accommodation due to closing of the flat cavities would be almost lost at around 1 473 K, the flat cavities seems to close incompletely. This is because the data for the second trial agreed well with those of the initial measurement. The following facts support the above idea: (1) The flat cavities survived in the specimens despite the fact that the specimens were pulled to 70% elongation at 1 723 K and were then cooled with furnace cooling to room temperature [41]. (2) The highest temperature for the thermal expansion measurement was 1 473 K and the specimens were held at 1 473 K for only 600 s.To find out a proper annealing condition to close the flat cavities completely should be a future task.
Let consider the average thickness of the gaps of flat cavities. It can be estimated roughly from the difference in the � values for specimens with Vc =0% and 3.0%. For example, the difference at 713 K is approximately 1 � 10–7 K–1 from Figure 11. Since the thermal linear expansion at 300 K was set to be zero and the initial specimen length was 15 mm, the difference in the expanded lengths at 1 473 K should be about 1.76 m, if the difference in the � values at 713 K is used. Since the average interval of flat cavities along the tensile direction has been estimated to be about 4 m by SANS [41], the number of flat cavities along the specimen length is roughly 3 700 pieces, if the flat cavities are assumed to be forming a line along the tensile direction. Then the average gap thickness of the flat cavities is estimated to be about 0.48 nm. This value is quite small in comparison with the gap, approximately 3 nm, of crack-like cavities observed by TEM [45]. However, the actual average gap thickness of the flat cavities may be larger than 0.48 nm, perhaps, in the order same with that observed by Wang, et al., since the flat cavities are not forming a line along the tensile direction. After all, such cavities with thickness of roughly 3 nm or less are too small to identify by SEM.
If there existed sufficient number of the flat cavities, it is reasonable that when Vc becomes large, so does the number of the flat cavities. It seems that the conventional cavities would have almost no effect on the thermal expansion, which agrees with the result that gross open pores play no noticeable role in the accommodation of thermal expansion in graphite [42-44].
Thermal barrier coatings of yttria-stabilised zirconia containing 100% tetragonal phase have shown � values similar to the present ones which are about 11.0~12.0 � 10–6 K–1 at 500~1 250 K [46]. In the thermal expansion of nanocrystalline Ni-P alloys having different grain sizes, � was shown to decrease with an increase in the average grain size from 7.5 nm to 127 nm [47]. In the present study, the average grain size was in the range from 0.41 m to 0.48 m which was dependent on the amount
221
of deformation, temperature and strain rate. Since the difference in the grain boundary area of the present specimens is much less than that of Ni-P alloys, the grain size dependence of � in the 3Y-TZP must be not obvious. In addition, the � value showed little dependence on the grain aspect ratio, which was 0.94 before deformation and increased to 1.07~1.13 after deformation, within the present experiment.
Conclusions
Superplastic tensile deformations were conducted on the 3 mol% yttria-stabilised tetragonal zirconia polycrystals (3Y-TZP) under different conditions in order to get the specimens with different microstructural characteristics. Then, the effects of the superplastic deformations on the specific heat, thermal diffusivity, thermal conductivity and thermal expansion were investigated. The main results obtained are as follows:
� The formation of cavities, concurrent grain growth and change in grain aspect ratio caused by the superplastic deformations were observed while no phase transformation occurred, i.e., original t-phase was preserved.
� The superplastic deformations had almost no effects on the specific heat of the specimens, i.e. the specific heat was independent of microstructural evolution. This is probably because phase transformation and others that may change the specific heat would not occur during the deformation.
� The thermal diffusivity and thermal conductivity values were quite sensitive to deformation-induced cavities, which would decrease the thermal diffusivity/thermal conductivity values. It seems that phonon scattering due to the existence of a number of fine cavities is responsible for the decrease in the thermal conductivity. The effective thermal conductivity measured in the present study can be expressed with a modified Leob’s equation as a function of Vc and temperature, which is as follows:
� � 2630 T1073T1096101 �� ����� ���� � ...,Vce
where � is an empirical parameter indicating the contribution of cavity scattering.
� The linear thermal expansion (CTE) values were around 11.1 � 10–6 K–1 at 700 K and about 12.1 � 10–6 K–1 at 1 473 K and showed an approximately linear increase with temperature from 700 K to 1 473 K. The CTE values were slightly dependent on the deformation-induced cavities and decreased with increasing the volume fraction of cavities. It was inferred that crack-like flat cavities could accommodate the thermal expansion and consequently resulted in low CTE values. The effect of cavities was also dependent on temperature, and gradual closing of the flat cavities with temperature seemed to be responsible for the decrease in the cavity dependence of CTE.
� Changes in the average grain size and grain aspect ratio of the 3Y-TZP specimens caused by the superplastic deformations had almost no effect on the thermophysical properties within the present experimental range.
222
REFERENCES
[1] Motohashi, Y., Yosetsu-Gakkaishi, 68, pp. 105-108 (1999).
[2] Shibata, T., Y. Motohashi, M. Ishihara, S. Baba and K. Hayashi, JAERI-Review 2000-008, pp. 1-31 (2000).
[3] Clinard Jr., F.W., D.L. Rohr and W.A. Ranken, J. Am. Ceram. Soc., 60 [5-6], pp. 287-288 (1977).
[4] Ohno, H., T. Nagasaki, Y. Katano, J. Tateno and H. Katsuta, Journal of Nuclear Materials,155-157, p. 372 (1988).
[5] Hiura, N., T. Yamaura, Y. Motohashi and M. Kobiyama, Trans. At. Energy. Soc. Japan, 1 [2], pp. 202-208 (2002).
[6] Berman, R.M., M.C. Bleiberg and W. Yeniscavich, Journal of Nuclear Materials, 2, pp. 129-140 (1960).
[7] Stachowiak, G.B., G.W.Stachowiak and P. Evans, Wear, 241, pp. 220-227 (2000).
[8] Sickafus, K.E., et al., Journal of Nuclear Materials, 274, pp. 66-77 (1999).
[9] Sickafus, K.E., et al., Nucl. Instr. and Meth. in Phys. Res., B141, pp.358-365 (1998).
[10] Sasajima, N., et al., Nucl. Instr. and Meth. in Phys. Res., B141, pp. 487-493 (1998).
[11] Burnett, P.J. and T.F. Page, Am. Ceram. Soc. Bull., 65 [10], pp. 1393-1398 (1986).
[12] Hasegawa, H., T. Hioki and O. Kamigaito, J. Mater. Sci. Lett., 4, pp. 1092-1094 (1985).
[13] Naguib, H.M. and R. Kelly, Journal of Nuclear Materials, 35, 293-305 (1970).
[14] Baufeld, B., et al., J. Am. Ceram. Soc., 76 [12], pp. 3163-3166 (1993).
[15] Motohashi, Y., M. Nemoto, K. Funami and T. Sakuma, Mater. Sci. Forum, 304-306, pp. 669-674 (1999).
[16] Motohashi, Y., N. Sugeno, S. Koyama and T. Sakuma, Mater. Sci. Forum, 243-245, pp. 399-404 (1997).
[17] Wan, C., T. Shibata, S. Baba, M. Ishihara, T. Hoshiya and Y. Motohashi, Netsu Bussei, 16 [2], pp. 58-63 (2002).
[18] Wan, C., Y. Motohashi, T. Shibata, S. Baba, M. Ishihara and T. Hoshiya, Materials Transactions, 43 [10], pp. 2473-2479 (2002).

223
[19] Wan, C., Y. Motohashi and S. Harjo, Materials Transactions, 44 [5], pp. 1053-1056 (2003).
[20] Netsuryousokutei�Netsubunseki Hondobukku, Maruzen Press, Tokyo, pp. 129-146 (1998).
[21] Touloukian, Y.S. and E.H. Buyco, Thermophysical Properties of Matter, 5, pp. 26-27 (1970).
[22] Application Report, Rigaku Corporation, T042 (2000).
[23] Hasselman, D.P.H., L.F. Johnson, L.D. Bentsen, R. Syed, H.L. Lee and M.V. Swain, Am.Ceram. Soc. Bull., 66, pp. 799-806 (1987).
[24] Raghavan, S., H. Wang, R.B. Dinwiddle, W.D. Porter and M.J. Mayo, Scripta Materialia, 39, pp. 1119-1125 (1998).
[25] Swain, M.V., et al., J. Mater. Sci. Lett., 5, pp. 799-802 (1986).
[26] Owada, I., Y. Nishino, T. Kushida, J. Nakamura and T. Matsuda, JAERI-Tech., 94-028 pp. 1-25.
[27] Klemens, P.G., Physica, B 263-264, pp. 102-104 (1999).
[28] Thavorniti, P., Y. Ikuhara and T. Sakuma, J. Am. Ceram. Soc., 81, pp. 875-883 (1998).
[29] Garvie, R.C., J. Mater. Sci. Lett. 11, p. 1365 (1976).
[30] Klemens, P.G. and M. Gell, Mater. Sci. and Engi., A245, pp. 143-149 (1998).
[31] Schulz, B., High Temp. High Pressures, 13, pp. 649-660 (1981).
[32] Kawashima, T. and M. Hishimuma, Mater. Trans., JIM 37, pp. 1518-1524 (1996).
[33] Brandt, R., G. Neuer, J. Non-Equilib. Thermodyn., 1, p. 3 (1976).
[34] “Thermophysical Properties of Matter”, Thermal Expansion Non-metallic Solids, Vol. 13, Y.S. Touloukian, R.K. Kirbby, R.E. Taylor and T.Y.R. Lee, Y.S. Touloukian, C.Y. Ho, Eds., Plenum Press, New York, pp. 176 (1977).
[35] Elomari, S., R. Boukhili and D.J. Lloyd, Acta Mater., 44, pp. 1873-1882 (1996).
[36] Tiefenbach, A., S. Wagner, R. Oberacker and B. Hoffmann, J. Euro. Ceram. Soc., 22, pp. 337-345 (2002).
[37] Kingery, W.D., H.K. Bowen and D.R. Uhlmann, Introduction to Ceramics, 2nd ed., Wiley, New York, p. 594 (1976).
[38] Harjo, S., Y. Motohashi and N. Kojima, J. Ceram. Soc. Japan, Vol. 111, No. 9 (2003).
[39] Hayashi, H., M. Watanabe and H. Inada, Thermochimica Acta, 359, pp. 77-85 (2000).
[40] Motohashi, Y., T. Ogawa, C. Wan, T. Sakuma and K. Funami, J. Mater. Processing Tech., 117 [3] (2001). CD-ROM Version.
[41] Harjo, S., J. Saroun, Y. Motohashi, et al., to be submitted to Mater. Trans.

224
[42] Sutton, A.L. and V.C. Howard, J. Nucl. Mater., 7, pp. 58-71 (1962).
[43] Price, R.J. and J.C. Bokros, J. Appl. Phys., 36, pp. 1897-1906 (1965).
[44] Baxter, R.I., R.D. Rawlings, N. Iwashita and Y. Sawada, Carbon, 38, pp. 441-449 (2000).
[45] Wang, Z.C., N. Ridley and T.J. Davies, J. Mater. Sci., 34, pp. 2695-2702 (1999).
[46] Brandon, J.R. and R. Taylor, Surf. Coat. Tech., 39/40, pp. 143-151 (1989).
[47] Sui, M.L. and K. Lu, Nano Structured Materials, 6, pp. 651-654 (1995).
225
FABRICATION OF TAILORED CERAMICS BY COLLOIDAL PROCESSING AND THEIR APPLICATION
Yoshio Sakka, Tohru S. Suzuki, Tetsuo Uchikoshi, Kenjiro Hiraga National Institute for Materials Science, Japan
Taiju Shibata and Masahiro Ishihara Japan Atomic Energy Research Institute, Japan
Abstract
Two types of tailored ceramics were prepared by colloidal processing. First, colloidal processing was applied to obtain dense and homogeneous alumina- and zirconia-based ceramics with fine-grained microstructure. Large tensile elongation exceeding 550% was achieved for 10 vol.% zirconia-dispersed Al2O3 at 1 773 K and high-strain-rate (above 10–2 s–1) superplastic zirconia-based ceramics were achieved by adding TiO2 and MgO. In the second process, a high magnetic field was applied during slip casting of alumina suspension to produce textured microstructure. A green body with a slight degree of crystallographic orientation was obtained and the degree of texture increased as temperature was increased. After densification, alumina grains grow to yield ceramics with textured grains and high degrees of crystallographic orientation. This processing can be applied to other ceramics having asymmetric unit cell, such as SiC, Si3N4, etc.
226
Introduction
Two types of tailored ceramics were prepared using colloidal processing. One is superplastic alumina-based and zirconia-based ceramics with fine-grained microstructure and the other is highly textured alumina prepared under a magnetic field.
Superplasticity provides the possibility of high-temperature deformation processing of dense ceramics and has the double advantages of greater shape formability and better dimensional accuracy. The following qualities are reportedly necessary to achieve superplasticity: fine grain size, reduction of residual defects, homogeneous microstructure and the inhibition of grain growth during high-temperature deformation [1-7]. At first, dense and homogeneous zirconia-dispersed alumina was prepared by colloidal processing and excellent superplastic properties were achieved. However, the superplastic ceramics were only formed at relatively low strain rates around 10–4 s–1 and at higher temperatures above 1 400�C [7]. Therefore, the application of superplasticity to the manufacturing process is limited. Recently, we reported that the deformation rate was enhanced and high-strain-rate superplasticity was established by adding a small amount of Al2O3 to the 3YTZ (3 mol% Y2O3-doped ZrO2) system [8,9]. This is explained by the enhancement of cation diffusion and homogeneous fine-grained microstructure. The objective of this study is to fabricate excellent high-strain-rate superplastic zirconia ceramics by adding TiO2 and MgO to 3Y-TZ. Here, MgO was added to stabilise the tetragonal phase of the 3Y-TZ system [10] and the addition of TiO2 is believed to enhance the cation diffusion due to the replacement of ZrO2 [11,12].
The controlled development of texture is one of the most effective means of improving physical and mechanical properties. �-alumina of a rhombohedral structure shows anisotropic susceptibility, but this anisotropy has up to now been more or less ignored due to its very low value [13]. However, the development of a superconducting magnet extends to the potential application to strong magnetic fields [14,15]. In a high magnetic field the energy of crystal anisotropy becomes comparable to or larger than the energy of thermal motion [13,16]. In this paper, we demonstrate that the highly textured microstructure of pure dense alumina can be fabricated by colloidal processing under a strong magnetic field, followed by heating [16].
In this meeting, we would like to discuss the possibility of the application of these tailored ceramics to the atmosphere of high-temperature irradiation.
Experimental procedure
Powder treatment
Three kinds of high-purity spherical �-alumina powders were used; TMDAR (mean particle size: 0.15 �m, Taimei Chemicals Ltd), SS-03 (0.47 �m, Sumitomo Chemicals), and SS-05 (0.66 �m). The zirconia powder used was 3 mol% Y2O3 doped tetragonal ZrO2 (TZ) powder (60 nm, Tosoh Corp.). TiO2 (30 nm, Nanotek) and MgO (50 nm, Ube Industry) powders were used for additives of TZ. To obtain well-dispersed suspensions, an appropriate amount of ammonium polycarboxylate (ALON A-6114, Toagosei Chem.) was added to improve colloidal stability by electrosteric repulsion. Here, re-dispersion is necessary because fine particles tend to agglomerate due to van der Waals attraction. We have shown that ultrasonication effectively disperses fine Al2O3 and ZrO2 particles [17]. To avoid long-range segregation during slip casting, the solid content of each suspension was adjusted to exceed 30 vol.%.

227
Tensile test
The suspensions of Al2O3-ZrO2 were consolidated by slip casting and treated by cold isostatic pressing (CIP) at 400 MPa to improve packing density. In conventional dry processing, the same powders are mixed in a ball mill with a high-purity alumina ball and ethanol. After drying, they were pressed at 20 MPa and finally subjected to CIP at 400 MPa. Sintering was performed in air at fixed temperatures. Bone-shaped flat tensile specimens with gauge lengths of 5 to 10 mm were machined and tensile tested at fixed temperatures, at an initial strain rate of 1.7 � 10–4 to 1.2 � 10–2 s–1.
Textured ceramics
A magnetic field in the range of 0-10 T was applied to the suspension during slip casting. The direction of the magnetic field was parallel and perpendicular to the direction of the fluid flow. The green compacts were heated over the temperature range 1 073-2 073 K for 2 h. Grain size measurements were made on the surface perpendicular to the magnetic field using the linear intercept method. The degree of crystalline texture was determined using the following: P = I006/(I006 + I110), where I006 and I110 are the X-ray diffraction intensities from the 006 and the 100 reflections on the bottom surface, respectively.
Results and discussion
Superplastic ceramics
Superplastic ZrO2 dispersed alumina
The relative densities of the sintered bodies of 10 vol.% TZ-dispersed Al2O3 sintered at 1 673 K for 2 h prepared by colloidal processing (sample C) and by conventional dry processing (sample D) were 99.6% and 99.5%, respectively. The lower sintering temperature resulted in fine-grained microstructures with an average Al2O3 grain size of 0.45 �m in both samples. The sintering temperature was about 100 K lower and the grain size about half that determined in earlier studies [18-20]. The ageing of sample D at 1 773 K resulted in an alumina grain size of 0.94 mm and relative densities higher than 99.7% (sample D�).
The creep parameters defined by the following semi-empirical equation were evaluated at a true strain rate of 0.1 [18]:
pndA ���rateStrain (1)
where A is a material constant, � and d are the stress and the average alumina grain size, n is the stress exponent, and p is the grain size exponent. No difference was seen in the creep parameters of samples C and D, where n = 2.0, p = 2.0 and the activation energy was 750 kJ/mol. Figure 1 compares the tensile flow curves of the three samples. In the conventional dry processed samples (D and D�), the reduction of grain size from 0.94 to 0.45 �m decreases the flow stress, but does not lead to a further increase in the tensile ductility. In the colloidal processed sample, however, the tensile ductility reaches 550%. Figure 2 shows photos after elongation at fixed temperatures. The grain growth, density and creep parameters of C and D are almost identical. Hence, other microstructural factors must be involved in the difference in elongation.

228
Figure 1. Comparison of tensile flow curves
0
5
10
15
20
25
30
35
40
0 100 200 300 400 500 600Engineering strain (%)
Tru
e st
ress
, �t
/ MPa
Conventional0.45�m
1773K
1.7×10⁻⁴ s-1
0.2 0.6 1.8True strain
Colloidal processing0.45�m
1.41.0
Conventional0.95�m
Figure 2. Photos before and after elongation at fixed temperatures
�Before deformation
Deformed at 1 673 K
Deformed at 1 723 K
Deformed at 1 773 K
For the same volume fraction of TZ particles, the average second-phase diameter in sample C is smaller than that in sample D, and the numerical density of the particles is about two times higher in C (142 �m3) than in D (61 �m3) [15]. Another difference was observed in the size distribution and fraction of residual cavities. The numerical densities of cavities in C (area fraction: 0.15%) were less than 40% of those in D (area fraction: 0.29%). The total area fraction of residual cavities differs by only 0.14%, which closely agrees with the data of density measurement, although higher numerical densities of cavities should lead to the acceleration of damage accumulation [2]. Figure 3 compares the cavitation damage of three samples during deformation at 1 773 K. The uniform dispersion of fine TZ particles and reduced numerical density of residual cavities are additional prerequisties for large tensile ductility in TZ-dispersed alumina.
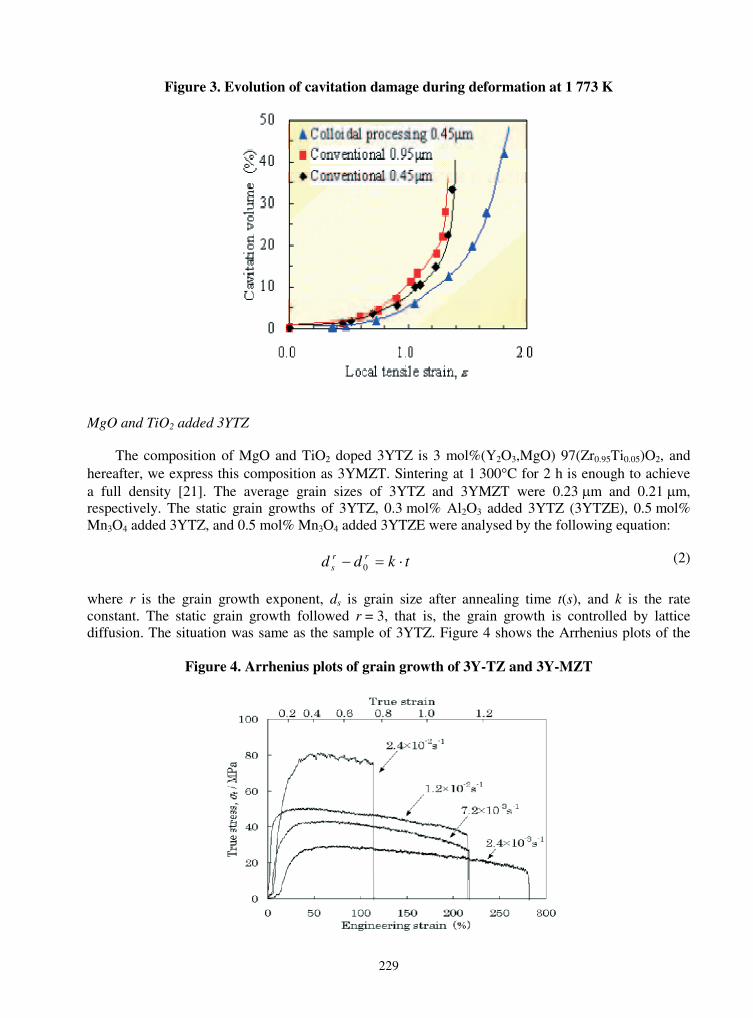
229
Figure 3. Evolution of cavitation damage during deformation at 1 773 K
MgO and TiO2 added 3YTZ
The composition of MgO and TiO2 doped 3YTZ is 3 mol%(Y2O3,MgO) 97(Zr0.95Ti0.05)O2, and hereafter, we express this composition as 3YMZT. Sintering at 1 300�C for 2 h is enough to achieve a full density [21]. The average grain sizes of 3YTZ and 3YMZT were 0.23 �m and 0.21 �m, respectively. The static grain growths of 3YTZ, 0.3 mol% Al2O3 added 3YTZ (3YTZE), 0.5 mol% Mn3O4 added 3YTZ, and 0.5 mol% Mn3O4 added 3YTZE were analysed by the following equation:
tkdd rrs �� 0
(2)
where r is the grain growth exponent, ds is grain size after annealing time t(s), and k is the rate constant. The static grain growth followed r = 3, that is, the grain growth is controlled by lattice diffusion. The situation was same as the sample of 3YTZ. Figure 4 shows the Arrhenius plots of the
Figure 4. Arrhenius plots of grain growth of 3Y-TZ and 3Y-MZT
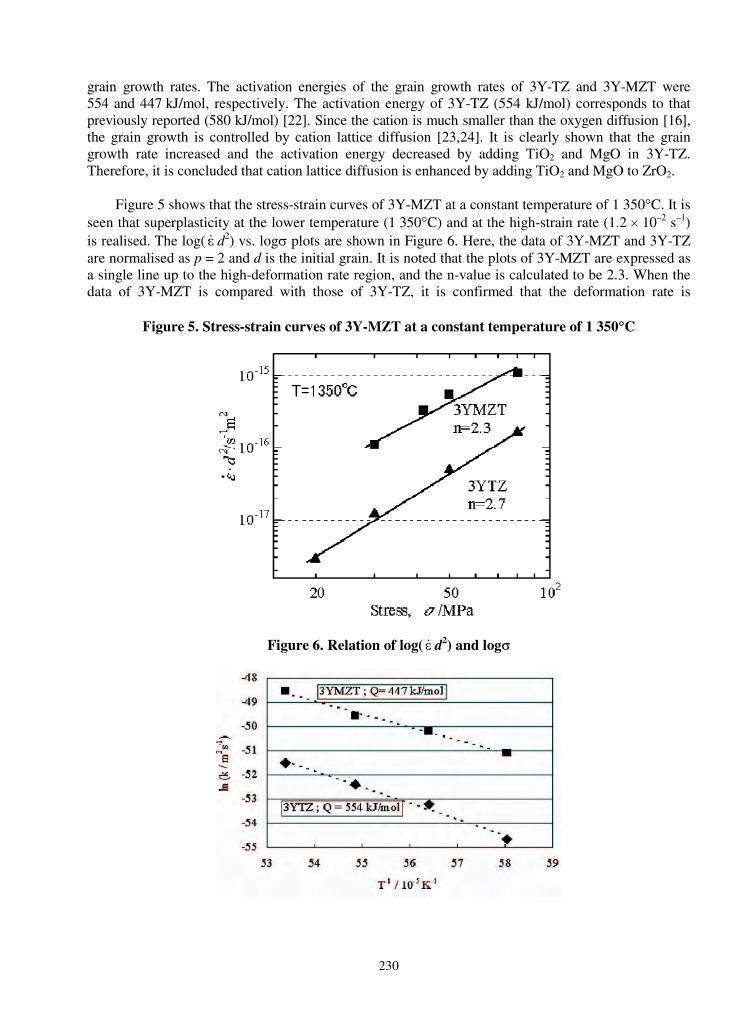
230
grain growth rates. The activation energies of the grain growth rates of 3Y-TZ and 3Y-MZT were 554 and 447 kJ/mol, respectively. The activation energy of 3Y-TZ (554 kJ/mol) corresponds to that previously reported (580 kJ/mol) [22]. Since the cation is much smaller than the oxygen diffusion [16], the grain growth is controlled by cation lattice diffusion [23,24]. It is clearly shown that the grain growth rate increased and the activation energy decreased by adding TiO2 and MgO in 3Y-TZ. Therefore, it is concluded that cation lattice diffusion is enhanced by adding TiO2 and MgO to ZrO2.
Figure 5 shows that the stress-strain curves of 3Y-MZT at a constant temperature of 1 350�C. It is seen that superplasticity at the lower temperature (1 350�C) and at the high-strain rate (1.2 � 10–2 s–1)is realised. The log( � d2) vs. log� plots are shown in Figure 6. Here, the data of 3Y-MZT and 3Y-TZ are normalised as p = 2 and d is the initial grain. It is noted that the plots of 3Y-MZT are expressed as a single line up to the high-deformation rate region, and the n-value is calculated to be 2.3. When the data of 3Y-MZT is compared with those of 3Y-TZ, it is confirmed that the deformation rate is
Figure 5. Stress-strain curves of 3Y-MZT at a constant temperature of 1 350�C
Figure 6. Relation of log( � d2) and log�

231
remarkably enhanced by adding TiO2 and MgO. The apparent activation energy of 3Y-MZT in the temperature range of 1 325-1 400�C was determined as 411 kJ/mol. This value obtained is smaller than that of 3Y-TZ (580 kJ/mol) [12] and corresponds to that of grain growth rate of 3Y-MZT (447 kJ/mol). These results also indicate that the cation lattice diffusion is enhanced by adding TiO2
and MgO.
As stated above, the grain growth rate is enhanced by adding TiO2 and MgO. Therefore, a large grain growth occurred during the tensile test, and the flow stress increased. This seems to be a disadvantage for the superplasticity. Nevertheless, it is confirmed that the tensile ductility of 3Y-MZT is 216% at the lower temperature of 1 350�C and at the high strain rate of 1.2 � 10–2 s–1. By adding TiO2 and MgO, the grain growth is enhanced and the plastic flow is disturbed. On the other hand, the accommodation process is also enhanced due to the enhancement of cation lattice diffusion [25]. Hence, the relationship between grain growth and the accommodation process are trade-offs. In this case (at high- strain rate and low-temperature), the second one is more effective.
Textured alumina
Figure 7 illustrates the XRD profiles of the specimen which was compacted by slip casting of 40 vol.% solids suspension of TMDAR alumina in 10 T, followed by sintering at 1 873 K for 2 h. The direction of the magnetic field was parallel to the fluid. In the surface perpendicular to the magnetic field (VT), the intensities of (00l) peaks are very high. By contrast, in the surface parallel to the magnetic field (VS), the intensities of (hk0) peaks are very large. This demonstrates that a crystalline texture with the c-axis parallel to the magnetic field had been developed by slip casting in a strong magnetic field followed by heating. This phenomenon was also observed when the direction of the magnetic field was perpendicular to the fluid. Figure 8 shows SEM images of the specimen shown in Figure 7. In the case of the sample slip-casted without magnetic field, slightly plate-like grains appeared randomly distributed in un-textured material [16]. In Figure 8, the platelet grains are oriented perpendicularly to the magnetic field. When the direction of the applied magnetic field was varied as H � the fluid flow, we also confirmed that platelet grains aligned perpendicular to the magnetic field after heating.
Figure 7. XRD patterns of alumina prepared by slip casting in 10 T and sintered at 1 873 K
(012
) (104
)(1
10)
(113
)
(024
)
(006
)
(116
) (018
)(2
14)
(300
)
(101
0)
(02
10)
(001
2)
20 40 60 80 1002� / degree
a.u.
slipcasting
H
VT
VSVS
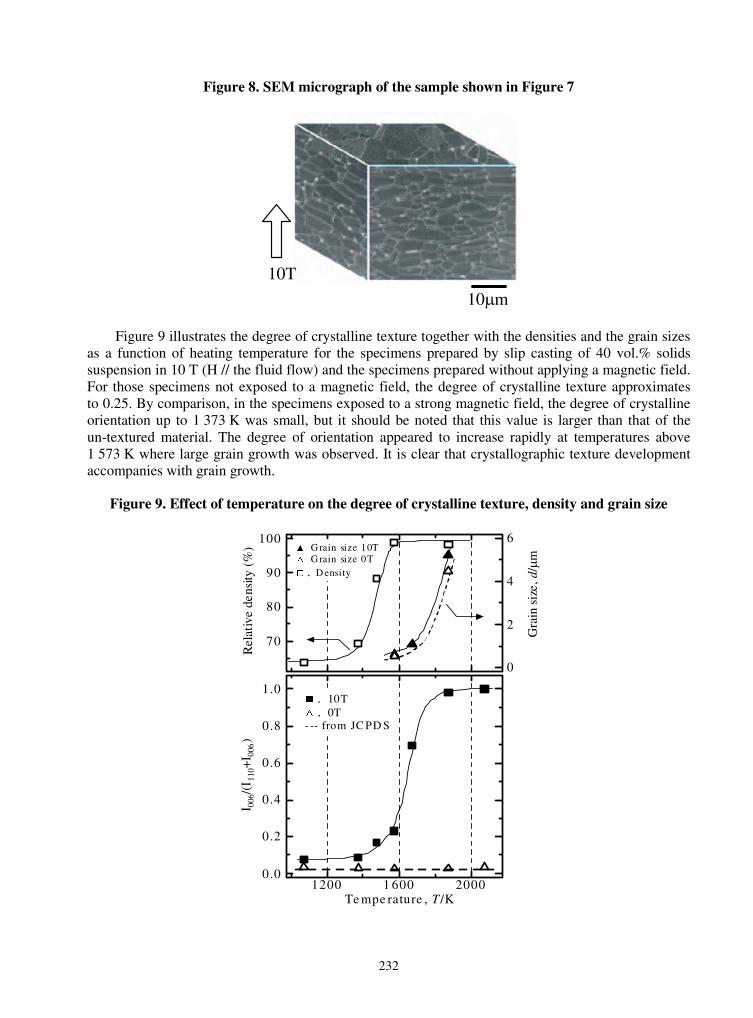
232
Figure 8. SEM micrograph of the sample shown in Figure 7
10�m
10T
Figure 9 illustrates the degree of crystalline texture together with the densities and the grain sizes as a function of heating temperature for the specimens prepared by slip casting of 40 vol.% solids suspension in 10 T (H // the fluid flow) and the specimens prepared without applying a magnetic field. For those specimens not exposed to a magnetic field, the degree of crystalline texture approximates to 0.25. By comparison, in the specimens exposed to a strong magnetic field, the degree of crystalline orientation up to 1 373 K was small, but it should be noted that this value is larger than that of the un-textured material. The degree of orientation appeared to increase rapidly at temperatures above 1 573 K where large grain growth was observed. It is clear that crystallographic texture development accompanies with grain growth.
Figure 9. Effect of temperature on the degree of crystalline texture, density and grain size
Te mpe rature , T /K
I 006
/(I 1
10+
I 006
)
1200 1 600 20000.0
0.2
0.4
0.6
0.8
1.0
Gra
in s
ize,
d/�
m
Rel
ativ
e de
nsity
(%
)
70
80
90
100
0
2
4
6
D ensity
G rain size 10T G rain size 0T
10T0T
--- from JC PD S

233
In the previous paper [26], we have shown the effect of solids content of alumina suspensions and applied magnetic field on the degree of crystalline orientation. The degree of orientation increased rapidly at a certain magnetic field, but the degree of orientation was strongly dependent on the solid content. We have concluded that the solid content, i.e. viscosity of suspension, must be low as each particle can rotate easily in strong magnetic fields. Figure 10 shows the effect of particle sizes and heating temperatures on the degree of orientation for three kinds of alumina prepared by slip casting of 30 vol.% solids suspension in 10 T. The degree of orientation after slip casting and heating at low temperatures depends on the particle size. At first the degree of orientation of a large particle is larger than that of a small particle, which is explained by the fact that the energy of anisotropy is proportional to particle volume. However, the degree of orientation of a small particle increases at lower temperatures than that of a large particle due to the difference in grain growth rate.
Figure 10. Effect of particle sizes and heating temperatures on the degree of orientation for three kinds of alumina prepared by slip casting of 30 vol.% solid suspensions in 10 T
This process can be applied to fabricate the textured SiC, Si3N4, etc., which might be useful for the atmosphere of high-temperature irradiation.
Summary
� TZ-dispersed Al2O3 was prepared by colloidal processing and low-temperature sintering. Large tensile elongation exceeding 550% can be obtained for 10 vol.% TZ-dispersed Al2O3.Their creep parameters were similar to those of samples prepared by conventional dry processing. The excellent superplasticities achieved are due to the reduction of residual defects, and the fine-grained and homogeneous microstructures.
� Low-temperature and high-strain rate superplastic ceramic was established for tetragonal zirconia (3YTZ) doped with magnesia and titania. This is due to the following factors: (i) dense, homogeneous microstructure and fine grain-sized zirconia polycrystals were prepared by colloidal processing and low-temperature sintering, (ii) enhancement of cation lattice diffusion by doping titania and magnesia.
� Highly textured alumina ceramics were prepared by slip casting in a high magnetic field and subsequent heating. The degree of orientation depends on particle size, magnetic field and concentration of suspension. This process technique confers several advantages and it was possible for this type of processing to be applied to other non-cubic ceramics.

234
REFERENCES
[1] Wakai, F., S. Sakaguchi and Y. Matsuno, Adv. Ceram. Mater., 1, 259 (1986).
[2] Nieh, T.J. and J. Wadsworth, Acta Metall. Mater., 38, 1121 (1990).
[3] Primdahl, S., A. Tholen and T.G. Langdon, Acta Metall. Mater.,43, 1211 (1995).
[4] Kajiwara, K., Y. Yoshizawa and T. Sakuma, Acta Metall. Mater., 43, 1235 (1995).
[5] Owen, D.M. and A.H. Chokshi, Acta Metall. Mater., 46, 667 (1998).
[6] Jimenez-Melendo, M., A. Dominguez-Rodoriguez and A. Bravo-leon, J. Am. Ceram. Soc., 81, 2761 (1998).
[7] Sakka, Y. and K. Hiraga, Nippon Kagaku Kaishi, 497 (1999).
[8] Suzuki, T.S., Y. Sakka, K. Nakano and K. Hiraga, Scripta Mater., 43, 705 (2000).
[9] Sakka, Y., T.S. Suzuki, K. Morita, K. Nakano and K. Hiraga, Scripta Mater., 44, 2075 (2001).
[10] Sakka, Y., Y. Oishi and K. Ando, Bull. Chem. Soc. Jpn., 55, 420 (1982).
[11] Kondo, T., Y. Takigawa, Y. Ikuhara and T. Sakuma, Mater. Trans., JIM, 39, 1108 (1998).
[12] Oka, M., N. Tabuchi and T. Takashi, Mater. Sci.Forum, 304-306, 451 (1999).
[13] Uyeda, C., Jpn. J. Appl. Phys. 32, L268 (1993).
[14] Beaugnon, E. and R. Tournier, Nature, 349, 470 (1991).
[15] Sassa, K., T. Morikawa and S. Asai, J. Japan Inst. Met., 61, 1283 (1997).
[16] Suzuki, T.S., Y. Sakka and K. Kitazawa, Adv. Eng. Mater., 3, 490 (2001).
[17] Suzuki, T.S., Y. Sakka, K. Nakano and K. Hiraga, J. Am. Ceram. Soc. 84, 2132 (2001).
[18] Hiraga, K., K. Nakano, T.S. Suzuki and Y. Sakka, Scripta Mater., 39, 1273 (1998).
[19] Nakano, K., T.S. Suzuki, K. Hiraga and Y. Sakka, Scripta Mater., 38, 33 (1998).
[20] Hiraga, K., T.S. Suzuki, Y. Sakka and K. Nakano, J. Am. Ceram. Soc., 85, 2763 (2002).
[21] Sakka, Y., T. Matsumoto, T.S. Suzuki, K. Morita, B-N. Kim, K. Hiraga, Adv. Eng. Mater., 5, 130 (2003).
235
[22] Nieh, T. and J. Wadsworth, J. Am. Ceram. Soc., 72, 1469 (1989).
[23] Sakka, Y., Y. Oishi, K. Ando and S. Morita, J. Am. Ceram. Soc., 24, 2610 (1991).
[24] Sakka, Y., Y. Oishi and K. Ando, J. Mater. Sci., 17, 3101 (1982).
[25] Morita, K. and K. Hiraga , Acta Mater., 50, 1075 (2002).
[26] Sakka, Y., T.S. Suzuki and K. Kitazawa, Key Eng. Mater., 206-213, 349 (2002).

237
SESSION V
Development of In-core Material Characterisation and Instrumentation Method
Chairs: P. Billot, T. Terai
239
TOWARDS IN SITU MONITORING AND CHARACTERISATION OF MATERIAL SURFACES UNDER IRRADIATION AT ELEVATED TEMPERATURES
M. Yamawaki1, K. Yamaguchi2, G-N. Luo2 T. Terai1 and M. Ishihara3
1Graduate School of Engineering, The University of Tokyo 2Tokai Research Establishment, Japan Atomic Energy Research Institute 3Oarai Research Establishment, Japan Atomic Energy Research Institute
Abstract
Several in situ and ex situ experimental devices have been developed, aimed at measuring the surface and/or properties of materials, both metals and ceramics, under ion or neutron irradiation at elevated temperatures. Special emphasis was laid on to developing a work function (WF) measurement system in this environment. Initially, a “high-temperature Kelvin probe” was successfully applied to studying the WF change of lithium ceramics, such as Li4SiO4, Li2ZrO3, Li2TiO3, Li2O and LiAlO2, by varying the chemical compositions of surrounding gas phase at elevated temperatures around 1 000 K (no irradiations in these experiments). Although the this Kelvin probe employs a Pt electrode, which enables to measure WF in the wide range of oxygen potentials, due to structural problems it cannot be operated under leak-tight conditions. Therefore, another type of measurement system was designed to investigate WF change under ion beam irradiation. Two independent systems were developed to measure WF change of materials due to irradiation at low energies (< 1 keV) and high energies (> 1 MeV) ranges. Both systems employ the same probe tip (reference electrode) so the experimental results can be cross-checked, if necessary. The electric charges in the vacuum chamber significantly affected the measurement via Kelvin probe. An “error deduction” method was proposed and was shown to effectively eliminate the influence due to charging effects. Recently, a biased shielding mechanism was constructed and was found to effectively confine charges within its hollow body and eliminate the harmful influence on the WF measurements with the probe. The results obtained so far indicate that the previous treatment by error deduction method is valid in the low fluence range where the charging effect is minute. However, neither system has been tested in the higher fluence range nor tested under neutron irradiation. Moreover, since in these tests the temperature was kept low (< 400 K), it is yet to be seen whether the current heating system equipped with a resistive heater is compatible with the WF measurement.
The above-mentioned experiences provide valuable information for constructing a device for in situ monitoring and characterisation of a material surface under neutron irradiation. For an example, the surface of lithium ceramics can be monitored by a Kelvin probe while generating and recovering tritium at elevated temperatures, so that the relation of the two phenomena can be examined experimentally. Devices used for measuring thermoelectric power, such as the high-temperature Kelvin probe and the Seebeck probe, which cannot be adjusted in a reactor, are to be used for ex situ measurement only.

240
Introduction
Several in situ and ex situ experimental devices have been developed, aimed at measuring the surface and/or bulk properties of materials, both metals and ceramics, under ion or neutron irradiation at elevated temperatures. Special effort was devoted to developing a work function (WF) measurement system in this environment. Initially, a “high-temperature Kelvin probe” was successfully applied to studying the WF change of lithium ceramics, such as Li4SiO4, Li2ZrO3, Li2TiO3, Li2O and LiAlO2, by varying the chemical compositions of the surrounding gas phase at elevated temperatures around 1 000 K (no irradiations in these experiments) [1]. Although this Kelvin probe employs a Pt electrode, which enables to measure WF over the wide range of oxygen potentials, due to structural problems it cannot be operated under leak-tight conditions. Thus, another type of measurement system was designed to investigate WF change under ion beam irradiation. Two independent systems were developed to measure WF change of materials due to irradiation at ranges of low (< 1 keV) and high (> 1 MeV) energies. Both systems employ the same probe tip (reference electrode) so the experimental results can be cross-checked, if necessary. The electric charges in the vacuum chamber significantly affected the measurement via Kelvin probe [2]. An “error deduction” method was proposed and was shown to effectively eliminate the influence due to charging effects.
Recently, a biased shielding mechanism was constructed to confine charges within its hollow body and eliminate the harmful influence on the WF measurements with the probe. One of the aims of the present study is to verify the effectiveness of the shield. The latest experimental results of the WF measurement under ion beam irradiationare then presented, and a discussion ensues concerning the feasibility of in situ monitoring and the characterisation of material surfaces under neutron irradiation at elevated temperatures, such as in the High-temperature Test Reactor (HTTR), Oarai, Japan.
Measures to reduce charging effect on Kelvin probe
Experimental
An ideal means of reducing the charging effect on the Kelvin probe for WF measurement is to completely block charge sources, in combination with a separate chamber to store a stable reference sample for timely checking of the probe’s WF. In view of our practical situation, a biased shielding was employed in the experiments using the ion beam facility at the High Fluence Irradiation Facility, The University of Tokyo (HIT), as shown in Figure 1. In the centre is the grounded sample holder. In the upstream and downstream sides of the ion beam stand two biased shields. Each shield consists of a biased cover and a grounded body. The covers are arranged as close to the sample holder as possible to form a narrow gap between them, whereas the bodies are extended into the connecting ducts to both upstream and downstream chambers. With this configuration, the charges generated during irradiation should be confined effectively within the shields when bias voltage is applied onto the covers. After irradiation, the bias will be cancelled and the measurement will not be affected by the bias.
Four experiments, i.e. irradiation of He+ and H+ on Ni and W, were made using this biased shielding system to try to eliminate the harmful charging effect. The two experiments concerning irradiation on Ni did not achieve good results due to instability of the Kelvin probe (KP) system, and the fluctuation of the output signal was so large that it was difficult to obtain reliable data; an averaging treatment was even employed so that manual recording of data could be performed.
For the remaining two experiments, both concerning the irradiation on W, one was completely successful (H+), and the other only partially so (He+). To know the work function (WF) change of W

241
Figure 1. Biased shielding system used in this study
Ion Beam Faraday
Grounded sample holder
DC
Sample
Insulator
under He+ irradiation at small fluence range, a beam current of 0.05 �A was first adopted; a usually used beam current of 0.5 �A was then applied. However, the KP became unstable after switching to the larger current and reliable recording was impossible.
Results and discussion
Compared to the previous shielding without bias that led to a change in the reference level of about -200 mV, the shielding biased to +350 V ensures an almost unchanged reference level (as shown in Figure 2), clear evidence of no charging occurring in the space. In other words, the shielding has effectively confined the secondary electrons emitted from the ion beam irradiated area within the shielding duct. Thus the WF changes of the samples can be simply obtained from the samples themselves, and have nothing to do with the references, as shown in Figure 3.
Both 1 MeV He+ and H+ induced a gradual WF decrease at small fluence, in total over 400 mV. But an increase over 100 mV was found as the fluence of H+ was increased, followed by saturation [Figure 3(a)], whereas such an increase was not observed in the case of He+ [Figure 3(b)], perhaps, for one reason, due to insufficient fluence in the experiment. The variation of the WF changes versus the fluence can be shown more clearly in Figure 4, where two curves obtained without using biased shielding are also presented for comparison.
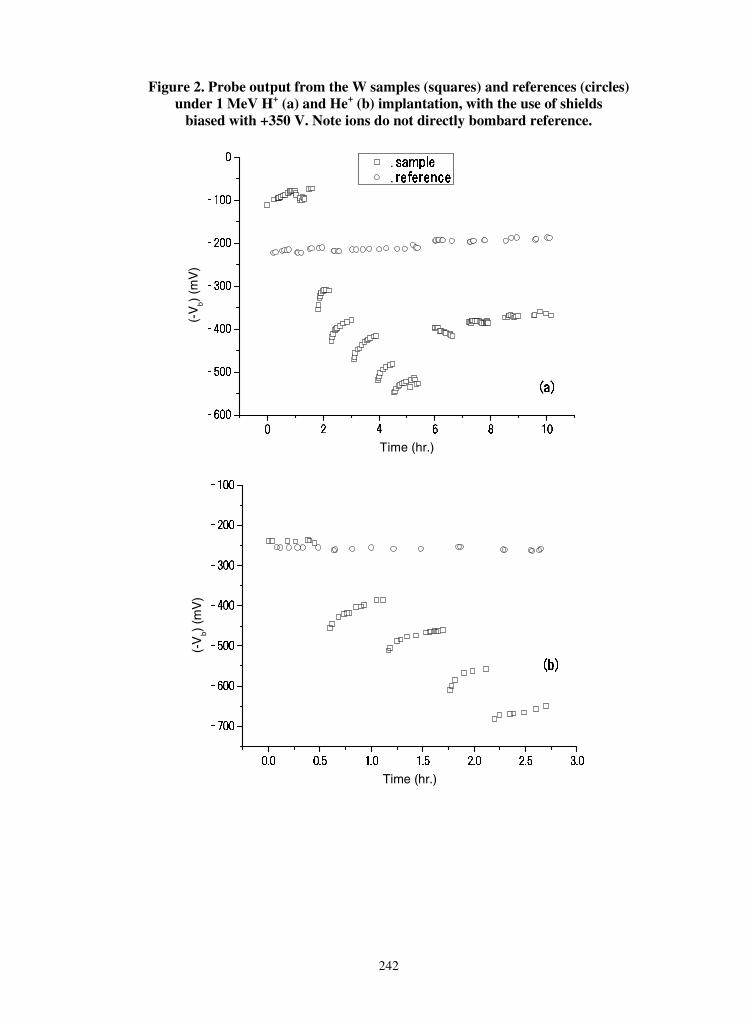
242
Figure 2. Probe output from the W samples (squares) and references (circles) under 1 MeV H+ (a) and He+ (b) implantation, with the use of shields
biased with +350 V. Note ions do not directly bombard reference.
(-V
b)
(mV
)
Time (hr.)
(-V
b) (m
V)
Time (hr.)
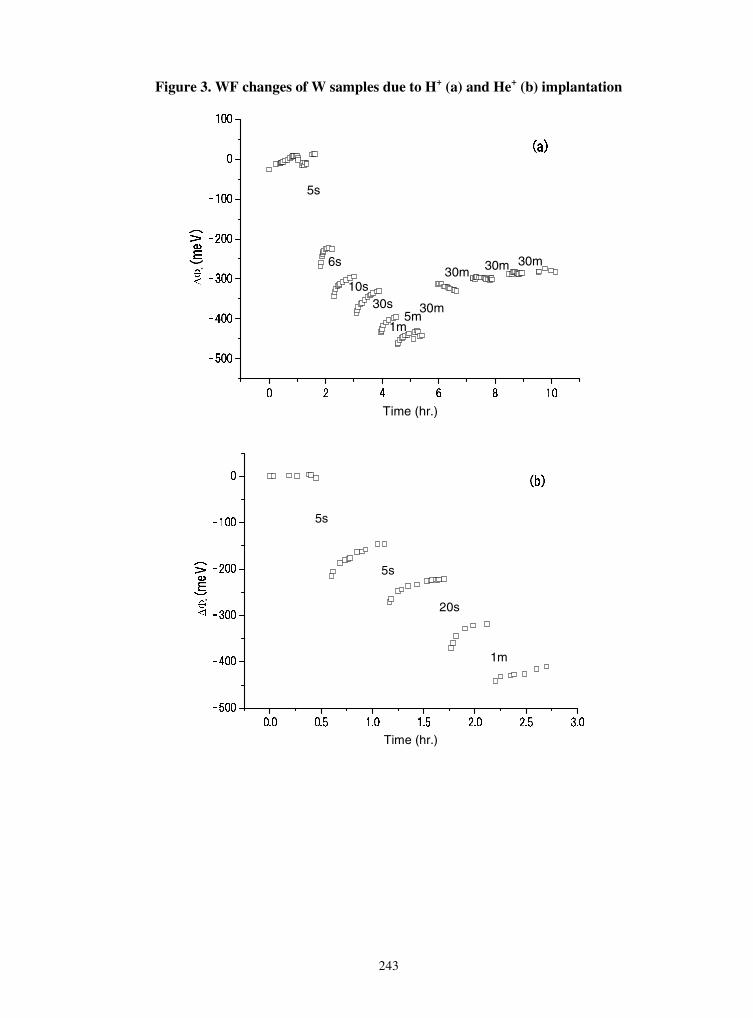
243
Figure 3. WF changes of W samples due to H+ (a) and He+ (b) implantation
30m
30m30m30m
5m1m
30s10s
6s
5s
��
Time (hr.)
1m
20s
5s
5s
��
Time (hr.)
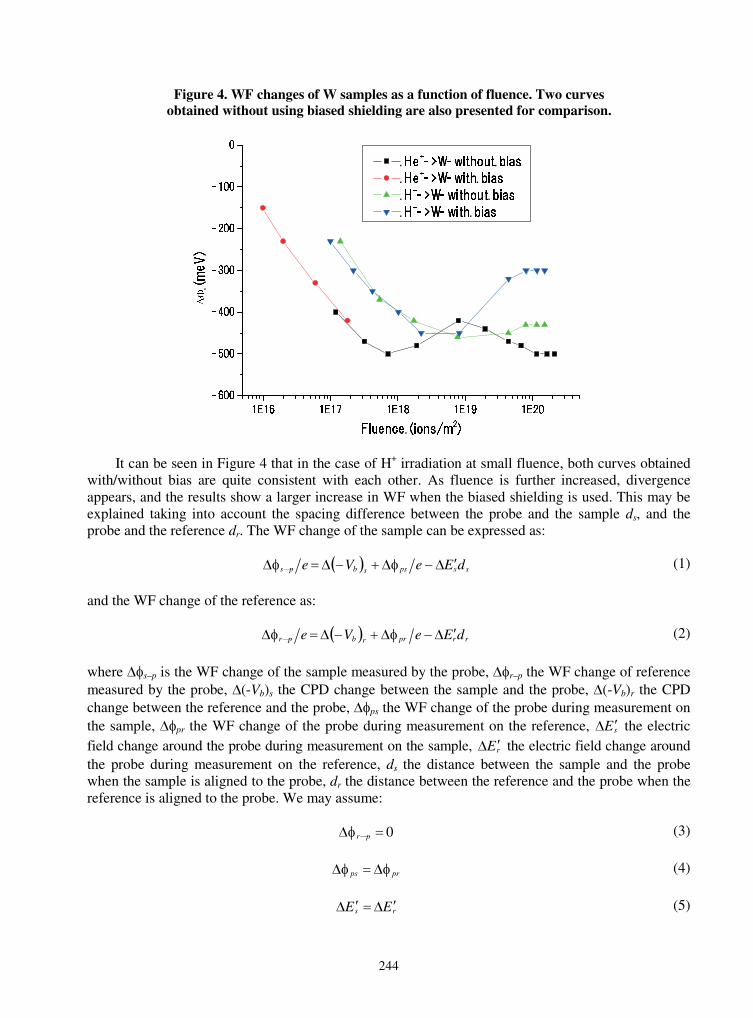
244
Figure 4. WF changes of W samples as a function of fluence. Two curves obtained without using biased shielding are also presented for comparison.
��
It can be seen in Figure 4 that in the case of H+ irradiation at small fluence, both curves obtained with/without bias are quite consistent with each other. As fluence is further increased, divergence appears, and the results show a larger increase in WF when the biased shielding is used. This may be explained taking into account the spacing difference between the probe and the sample ds, and the probe and the reference dr. The WF change of the sample can be expressed as:
� � sspssbps dEeVe ������
(1)
and the WF change of the reference as:
� � rrprrbpr dEeVe ������
(2)
where �s–p is the WF change of the sample measured by the probe, �r–p the WF change of reference measured by the probe, (-Vb)s the CPD change between the sample and the probe, (-Vb)r the CPD change between the reference and the probe, �ps the WF change of the probe during measurement on the sample, �pr the WF change of the probe during measurement on the reference, sE � the electric field change around the probe during measurement on the sample, rE � the electric field change around the probe during measurement on the reference, ds the distance between the sample and the probe when the sample is aligned to the probe, dr the distance between the reference and the probe when the reference is aligned to the probe. We may assume:
0��� pr (3)
prps ��� (4)
rs EE ��� (5)
245
Eq. (3) signifies that no changes occur on the reference because it is not irradiated. Eqs. (4) and (5) are based on the fact that there is only one probe used in the experiment, and that the source of the charging effect is the same, i.e. the charges build up onto the insulating components of the probe.
We may further assume the same distance from the probe to the facing sample and to the facing reference, i.e. ds = dr = d. Therefore, the following holds:
� � � �rbsbps VVe ���
(6)
But this might not be true. If ds and dr, are not equal, then Eq. (6) becomes:
� � � � dEVVe rbsbps ����
(7)
where d = ds dr, and rs EEE ����� . It is the final term, dE � , that results in the divergence at large fluence for H+ irradiation on W in Figure 3. The sign of the term depends on the two components, shown to be minus in our case.
For the biased shielding, E� = 0 (no charging), and (-Vb)r = 0 (as indicated in Figure 2). The WF change assumes:
� �sbps Ve ���
(8)
This provides us with much more reliable results without the need for any mathematical post-treatment.
The good incidence of the two curves at low fluence also suggest that the previous mathematical treatment (“error deduction” method [2]) applied to the data set obtained without bias is satisfactory, and E small enough for low fluence. With increasing fluence, more and more charges build up on
the probe, and E becomes larger and larger. Thus the influence from the final term of the Eq. (7)
may not be neglected. If the sign of this term is minus, the results can be reasonably explained.
In Figure 4, the data obtained this time with bias at low fluence extends the range of the data obtained without bias into a smaller fluence. They join each other quite well around the fluence of 1 � 1017 ions m–2, although they were indeed obtained at fluxes different by a factor of 10. Unfortunately, the data was not acquired for higher fluence in the case of with bias. According to the above analysis of H+ irradiation, it might be speculated that the absolute value of the WF changes measured with bias would be smaller than those without bias for larger fluence. The fact that the two curves join smoothly implies once again the applicability of the mathematical treatment to the shielding without bias at low fluence range.
Considerations on the cause of WF change
Figure 5 shows the results previously obtained on Ni samples implanted with 1 MeV H+ and He+
without biased shielding, respectively. At small fluence, both kinds of ions induce monotonic decrease in the work function changes. As the fluence is further increased, saturation occurs for H+, whereas such saturation has not yet appeared for He+, and does not until the maximum fluence for the experiment is used.

246
Figure 5. Work function changes of Ni induced by 1 MeV H+
and He+ implantation, without the use of biased shielding
-700
-600
-500
-400
-300
-200
-100
0
1E+16 1E+17 1E+18 1E+19 1E+20 1E+21
Fluence (ions/m2)
�����
�������
�����
To explain the WF change behaviour of the metals, a surface structure model is put forward as follows [3]. A metal surface consists of two layers naturally, i.e. oxide layer on the bulk, and relatively loosely bound adsorbed layer on the oxide, composed of C, H, O and other impurities in various forms. In Figures 4 and 5, the decreases in the WF at low fluence may be induced by the electronic processes that dominate energy transfer at the surfaces from the MeV incident ions, judging from the calculation results using the computer code SRIM 2000.39 [4] (as indicated in Table 1) where Se and Sn denote the electronic and nuclear stopping powers, respectively. The energy transferred to the lattice via the electronic processes may be high enough to desorb the adsorbed species. Thus the WF decreases were observed due to a decrease in the surface dipole moment. The final saturation may be reached as a consequence of the balance between the desorption from the surface and the adsorption from the residual gases. The electronic stopping powers of He ions are over six times higher than those of H ions for both metals, which explains the larger decreases in WF induced by He ions at low fluence. The increase in the WF of W due to further H+ implantation might be attributed to complicated interactions between W and hydrogen like diffusion, trapping, and surface processes, which may change W surface and induce the WF variation. Further experiments with biased shielding are needed to check the mechanism behind the observed phenomena, including WF measurements of W implanted by He+,and Ni by H+ and He+, and tests on other kinds of metals.
Table 1. SRIM [4] results for 1 MeV ions, where the stopping powers, Se and Sn, are expressed in eV/Å
Target Nickel TungstenIon He+ H+ He+ H+
Se 70 11.4 76.1 12.6Sn 0.13 0.01 0.16 0.012

247
A road-map for in situ monitoring and characterisation of material properties under neutron irradiation
As mentioned earlier, the starting points for the construction of in situ monitoring and characterisation system to investigate the change of material properties under irradiation at elevated temperatures were the “high-temperature Kelvin probe” and two independent in vacuo Kelvin probe systems. Although the former type of probe is capable of measuring the WF change at elevated temperatures, it cannot be employed under leak-tight conditions. This poses a difficult problem if one tries to measure WF change of the surface of Li ceramics under neutron irradiation (such as in HTTR) where the release of tritium occurs concurrently. If the system is compatible with high vacuum, the problem of tritium leakage should not occur. Since commercially available Kelvin probes normally operate in vacuo, an employment of the latter type of probes seemed to be the correct approach. However, the performance of the Kelvin probes was found to be quite sensitive to the presence of space charges of just any kind. So, the greater part of present authors’ effort was centred on reducing the harmful effect due to charging. The results obtained so far indicate that the treatment by error deduction method proposed by the present authors [2] is at least valid in the low fluence range where the charging effect is minute. It remains to be seen whether the system with bias shielding mechanism is also applicable at higher fluence range as well as under exposure to neutron irradiation. Moreover, since in the tests performed thus far the temperature was kept low (< 400 K), it is yet to be seen whether the heating system equipped with resistive heater is compatible with WF measurement. Figure 6 summarises a road map towards the completion of in situ monitoring and characterisation system based on the aforementioned facts.
Figure 6. Road map schematically showing present status and future problems for development of in situ monitoring and characterisation system in nuclear reactor
High-T probes• Kelvin probe• Seebeck probe, etc.
Kelvin probes installedin vacuum system• High energy (� 1 MeV)• Low energy (� 1 keV)
“In-situ” monitoring andcharacterization system inHTTR• WF measurement• tritium recovery• others
Temperature
Fluence
• Chemical stability ofprobes at highertemperatures unknown.
• Not compatible withvacuum system ? gasleakage
• Durability of probe tips athigher fluence unknown.
• Method of heatingunsolved.
• Any other source of noisein reactor?
High-T probes• Kelvin probe• Seebeck probe, etc.
Kelvin probes installedin vacuum system• High energy (� 1 MeV)• Low energy (� 1 keV)
In situ monitoring andcharacterisation system inHTTR• WF measurement• Tritium recovery• Others
Temperature
Fluence
• Chemical stability ofprobes at highertemperatures unknown.
• Not compatible withvacuum system � gasleakage
• Durability of probe tips athigher fluence unknown.
• Method of heatingunsolved.
• Any other source of noisein reactor?
When such a device would be constructed, it would be viewed as shown in Figure 7, for an example. The surface of lithium ceramics can be monitored by a Kelvin probe while generating and recovering tritium at elevated temperatures, so that the relation of WF change vs. tritium release processes can be examined experimentally. For this purpose, neutron beam should be collimated so that
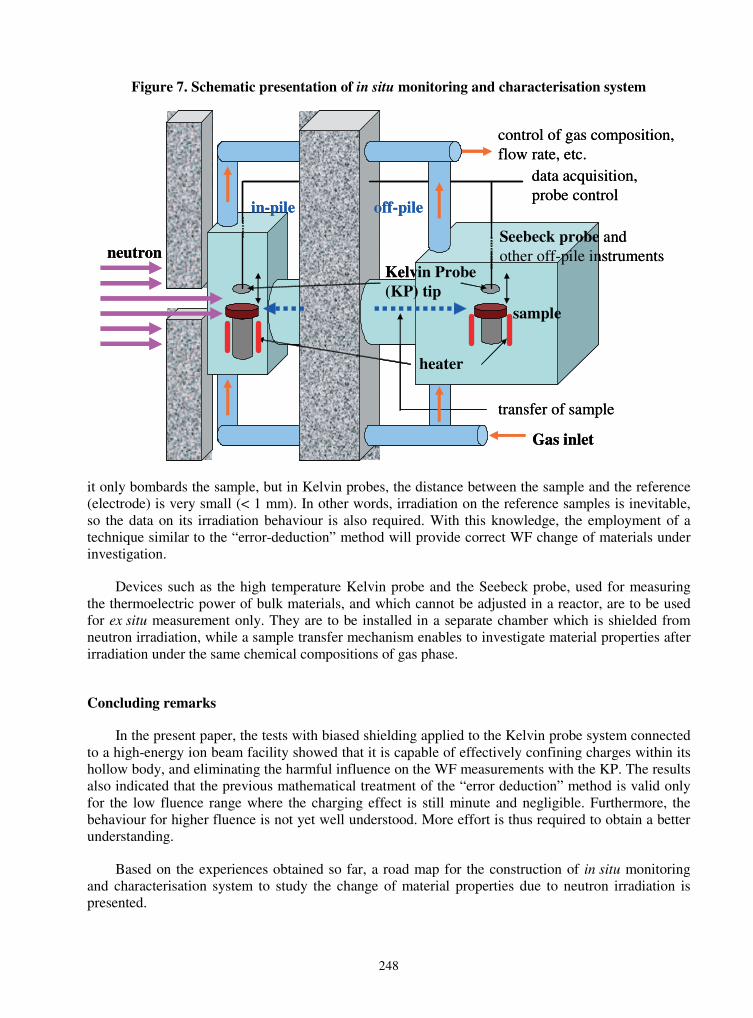
248
Figure 7. Schematic presentation of in situ monitoring and characterisation system
neutron
Gas inlet
sample
Kelvin Probe (KP) tip
transfer of sample
data acquisition, probe control
control of gas composition, flow rate, etc.
Seebeck probe and other off-pile instruments
in-pile off-pile
heater
neutron
Gas inlet
sample
Kelvin Probe (KP) tip
transfer of sample
data acquisition, probe control
control of gas composition, flow rate, etc.
Seebeck probe and other off-pile instruments
in-pile off-pile
heater
it only bombards the sample, but in Kelvin probes, the distance between the sample and the reference (electrode) is very small (< 1 mm). In other words, irradiation on the reference samples is inevitable, so the data on its irradiation behaviour is also required. With this knowledge, the employment of a technique similar to the “error-deduction” method will provide correct WF change of materials under investigation.
Devices such as the high temperature Kelvin probe and the Seebeck probe, used for measuring the thermoelectric power of bulk materials, and which cannot be adjusted in a reactor, are to be used for ex situ measurement only. They are to be installed in a separate chamber which is shielded from neutron irradiation, while a sample transfer mechanism enables to investigate material properties after irradiation under the same chemical compositions of gas phase.
Concluding remarks
In the present paper, the tests with biased shielding applied to the Kelvin probe system connected to a high-energy ion beam facility showed that it is capable of effectively confining charges within its hollow body, and eliminating the harmful influence on the WF measurements with the KP. The results also indicated that the previous mathematical treatment of the “error deduction” method is valid only for the low fluence range where the charging effect is still minute and negligible. Furthermore, the behaviour for higher fluence is not yet well understood. More effort is thus required to obtain a better understanding.
Based on the experiences obtained so far, a road map for the construction of in situ monitoring and characterisation system to study the change of material properties due to neutron irradiation is presented.
249
REFERENCES
[1] Suzuki, A., K. Yamaguchi, T. Terai, M. Yamawaki, Fusion Eng. Des., 49-50, 681-688 (2000), and references therein.
[2] Luo, G-N., K. Yamaguchi, T. Terai, M. Yamawaki, Rev. Sci. Instrum., 72(5), 2350-2357 (2001).
[3] Luo, G-N., K. Yamaguchi, T. Terai, M. Yamawaki, Surf. Sci., 505, 14-24 (2002).
[4] http://www.srim.org.
251
IN-REACTOR OPTICAL DOSIMETRY IN HIGH-TEMPERATURE ENGINEERING TEST REACTOR (HTTR)
T. Shikamaa, K. Toha, M. Ishiharab, M. Naruia,S. Nagataa, S. Babab, B. Tsuchiyaa, N. Shamotoc, T. Kakutab
aInstitute for Materials Research, Tohoku University, Sendai, 980-8577 Japan bJapan Atomic Energy Research Institute, Oarai, 311-1394 Japan
cFujikura Co. Ltd, Sakura, Chiba, 285-8550 Japan
Abstract
The applicability of fused silica core optical fibres to in-reactor dosimetry was demonstrated at elevated temperatures and a special irradiation rig was developed for realising high-temperature optical dosimetry in a high-temperature test reactor (HTTR) at the Oarai Research Establishment of JAERI (Japan Atomic Energy Research Institute). The paper will describe the present status of preparation for the high-temperature dosimetry in HTTR, utilising radiation-resistant optical fibres and radioluminescent materials. Temperature measurement with a high-speed response is the main target for the present optical dosimetry, which could be applied for monitoring transient behaviours of the HTTR. This could be realised by measuring the intensity of thermoluminescence and black body radiation in the infrared region. For monitoring reactor powers, optical measurements in the visible region are essential. At present, the measurement of the intensity of Cerenkov radiation is the most promising area of study. Other possibilities with radioluminescent materials having luminescent peaks in the visible region are under consideration. One of the candidates will be silica, which has a robust radioluminescent peak at 450 nm.
252
Introduction
A high-temperature gas-cooled reactor (HTGR) is a nuclear fission reactor cooled by means of high-temperature helium gas, with a graphite moderator. It has unique features such as having high thermal efficiency and being secure from nuclear proliferation. It can provide a high-temperature gas for chemical processing and producing hydrogen for a hydrogen fuel cell system. Resultantly, it will expand the utilisation fields of nuclear energy. One of technical issues to be resolved for development of the HTGR is to establish a relevant dosimetry system compatible with its high-temperature environment.
As dosimetric sensors and signal transporting systems in the HTGR, a fused silica core optical fibre (optical fibre) has several advantages over other proven dosimetric systems. The optical fibre system is, in principle, refractory, namely compatible with a high-temperature environment, as its constituent fused silica is refractory, and is free from technical problems related to electrical insulation. This is important in proven electrical instrumentations but is very difficult to realise above 900 K. At present, there is no realistic technical solution for electrical sensors, such as a fission chamber and a self-powered detector, to be used in the HTGR.
In the present study, behaviours of optical fibres at elevated temperatures and in a fission reactor core environment were studied. Based on obtained results, it was judged that a reactor dosimetry with optical fibres is realistic in a high-temperature engineering test reactor (HTTR), a prototype of the HTGR, developed by the Japan Atomic Energy Research Institute (JAERI). The HTTR will operate at 1 120-1 220 K with a thermal neutron flux of about 1 � 1026 n/m2s and a gamma-ray dose rate of 100 Gy/s. The paper describes the present status of optical dosimetry in the HTTR.
Behaviours of optical fibres at elevated temperatures and in a fission reactor
In the present study, a highly pure fused silica core optical fibre (the pure fibre) and an 800 ppm OH-doped fused silica core optical fibre (the OH doped fibre) were selected as candidates for HTTR application, based on accumulated irradiation tests in gamma-cells and in fission reactors [1-10]. First, the candidate optical fibres of about 1 meter long were heated up to 1 100 K in air and in a helium environment in an electric furnace, for up to about 30 days.
Plastic jackets were removed from the optical fibres and then the optical fibres were sheathed in a thin stainless steel tube for mechanical protection. This treatment did not degrade the mechanical and optical purity of the optical fibres, and the optical fibres withstood heating tests and irradiation tests extended for more than a month, without breaking.
An optical transmission loss is plotted as a function of the heating time in Figure 1 at 1 070 K. Degradation of the optical transmissivity was not observed for about 30 days up to 1 120 K. In the course of raising the temperature, thermoluminescence was observed in the wavelength range longer than 1 000 nm. The spectra are composed of a continuous component and several peaks. The OH-doped fibre had more eminent peak-like components. The intensities of the luminescence from the pure and the OH-doped fibres were plotted as a function of temperature in Figure 2, along with that from a sapphire (single crystal alumina (Al2O3)) block attached at the end of the optical fibre. The luminescence intensity (L) in the wavelength, 1 300-1 600 nm, depends on the temperature (T), with the relationship:
� �kTBAL �� exp (1)
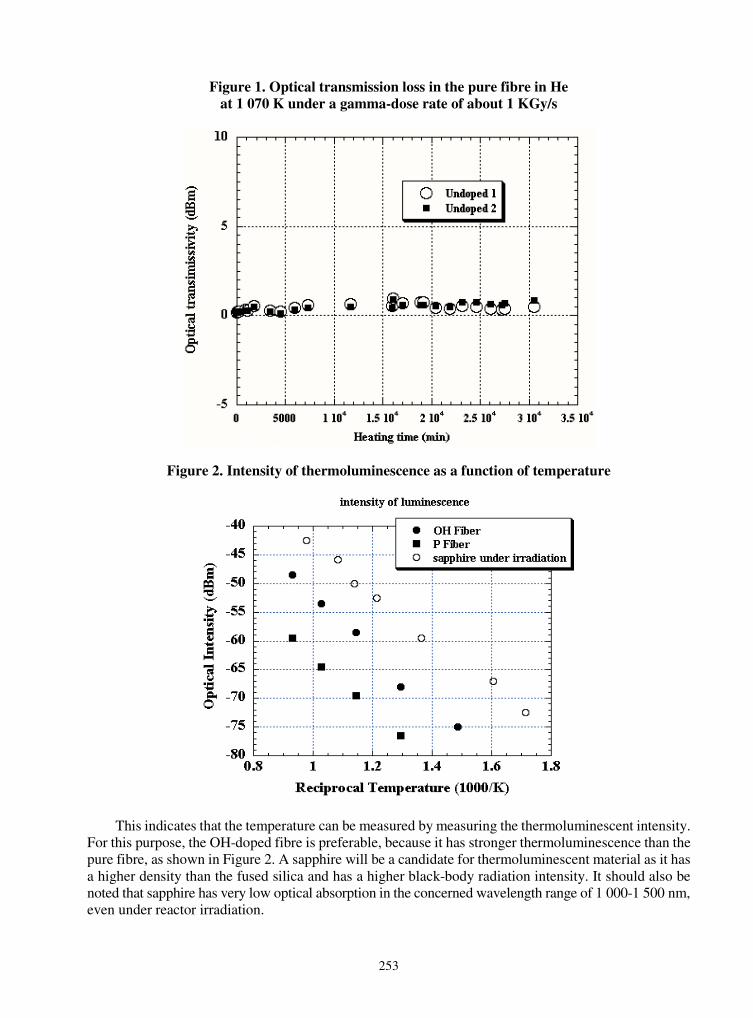
253
Figure 1. Optical transmission loss in the pure fibre in He at 1 070 K under a gamma-dose rate of about 1 KGy/s
Figure 2. Intensity of thermoluminescence as a function of temperature
This indicates that the temperature can be measured by measuring the thermoluminescent intensity. For this purpose, the OH-doped fibre is preferable, because it has stronger thermoluminescence than the pure fibre, as shown in Figure 2. A sapphire will be a candidate for thermoluminescent material as it has a higher density than the fused silica and has a higher black-body radiation intensity. It should also be noted that sapphire has very low optical absorption in the concerned wavelength range of 1 000-1 500 nm, even under reactor irradiation.
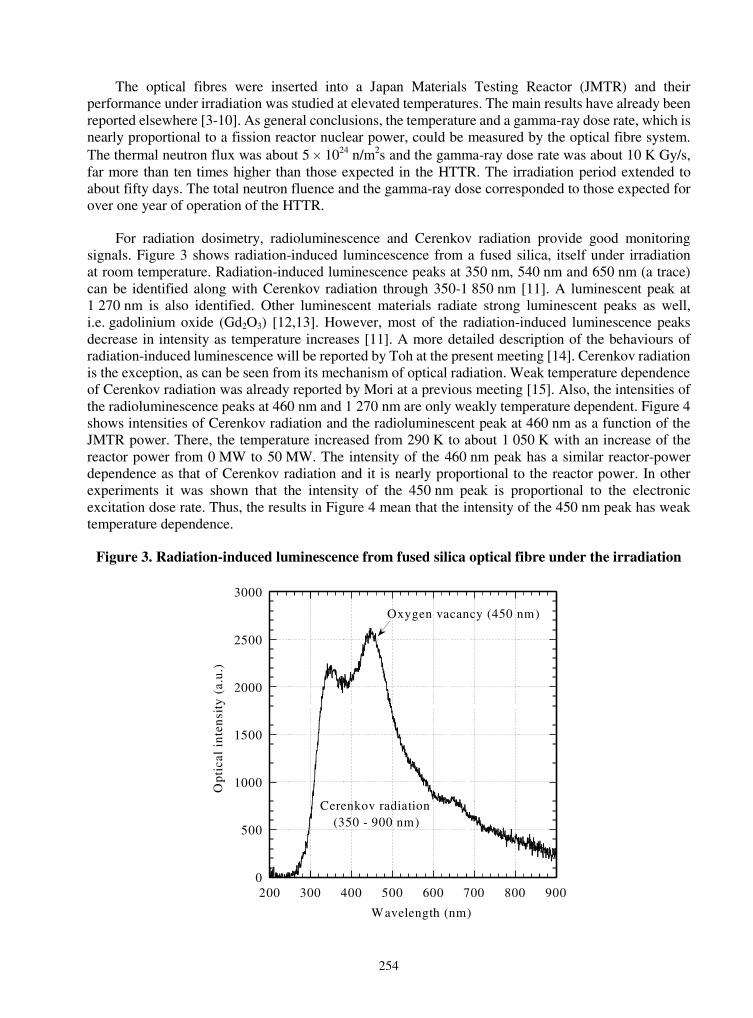
254
The optical fibres were inserted into a Japan Materials Testing Reactor (JMTR) and their performance under irradiation was studied at elevated temperatures. The main results have already been reported elsewhere [3-10]. As general conclusions, the temperature and a gamma-ray dose rate, which is nearly proportional to a fission reactor nuclear power, could be measured by the optical fibre system. The thermal neutron flux was about 5 � 1024 n/m2s and the gamma-ray dose rate was about 10 K Gy/s, far more than ten times higher than those expected in the HTTR. The irradiation period extended to about fifty days. The total neutron fluence and the gamma-ray dose corresponded to those expected for over one year of operation of the HTTR.
For radiation dosimetry, radioluminescence and Cerenkov radiation provide good monitoring signals. Figure 3 shows radiation-induced lumincescence from a fused silica, itself under irradiation at room temperature. Radiation-induced luminescence peaks at 350 nm, 540 nm and 650 nm (a trace) can be identified along with Cerenkov radiation through 350-1 850 nm [11]. A luminescent peak at 1 270 nm is also identified. Other luminescent materials radiate strong luminescent peaks as well, i.e. gadolinium oxide (Gd2O3) [12,13]. However, most of the radiation-induced luminescence peaks decrease in intensity as temperature increases [11]. A more detailed description of the behaviours of radiation-induced luminescence will be reported by Toh at the present meeting [14]. Cerenkov radiation is the exception, as can be seen from its mechanism of optical radiation. Weak temperature dependence of Cerenkov radiation was already reported by Mori at a previous meeting [15]. Also, the intensities of the radioluminescence peaks at 460 nm and 1 270 nm are only weakly temperature dependent. Figure 4 shows intensities of Cerenkov radiation and the radioluminescent peak at 460 nm as a function of the JMTR power. There, the temperature increased from 290 K to about 1 050 K with an increase of the reactor power from 0 MW to 50 MW. The intensity of the 460 nm peak has a similar reactor-power dependence as that of Cerenkov radiation and it is nearly proportional to the reactor power. In other experiments it was shown that the intensity of the 450 nm peak is proportional to the electronic excitation dose rate. Thus, the results in Figure 4 mean that the intensity of the 450 nm peak has weak temperature dependence.
Figure 3. Radiation-induced luminescence from fused silica optical fibre under the irradiation
0
500
1000
1500
2000
2500
3000
200 300 400 500 600 700 800 900
Opt
ical
in
ten
sity
(a.
u.)
Wavelength (nm)
Oxygen vacancy (450 nm)
Cerenkov radiation (350 - 900 nm)
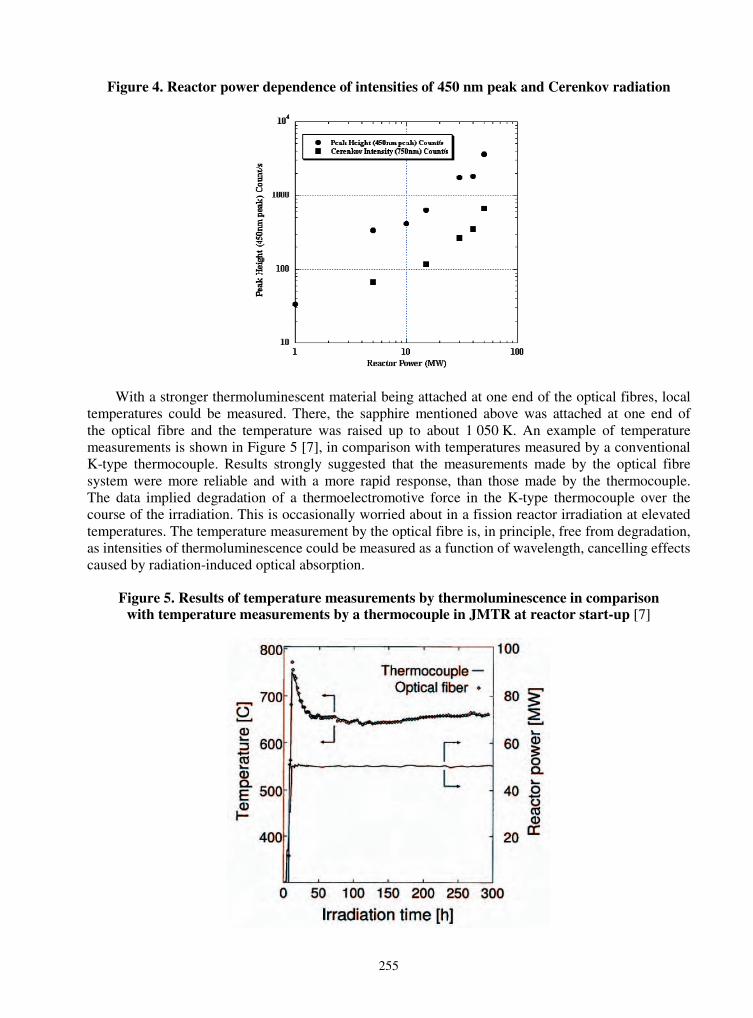
255
Figure 4. Reactor power dependence of intensities of 450 nm peak and Cerenkov radiation
With a stronger thermoluminescent material being attached at one end of the optical fibres, local temperatures could be measured. There, the sapphire mentioned above was attached at one end of the optical fibre and the temperature was raised up to about 1 050 K. An example of temperature measurements is shown in Figure 5 [7], in comparison with temperatures measured by a conventional K-type thermocouple. Results strongly suggested that the measurements made by the optical fibre system were more reliable and with a more rapid response, than those made by the thermocouple. The data implied degradation of a thermoelectromotive force in the K-type thermocouple over the course of the irradiation. This is occasionally worried about in a fission reactor irradiation at elevated temperatures. The temperature measurement by the optical fibre is, in principle, free from degradation, as intensities of thermoluminescence could be measured as a function of wavelength, cancelling effects caused by radiation-induced optical absorption.
Figure 5. Results of temperature measurements by thermoluminescence in comparison with temperature measurements by a thermocouple in JMTR at reactor start-up [7]

256
Installation of the optical fibre dosimetric system in HTTR
Figure 6 shows a structure of the HTTR. Its core is confined in a pressure vessel, the inside of which is filled with a 4 MPa high-temperature helium gas. Its complicated structures and solid graphite moderators make instrumentations very difficult in a reactor core region, though there is a feed-through mechanism in stand pipes at the top of pressure vessel. Figure 7 shows the structure of an irradiation unit used in the present study and the means of its installation into the reactor core. Three irradiation rigs were attached at the end of the irradiation unit as shown in Figure 7. A primary mission of one irradiation rig is to carry out in-core creep rupture tests of structural materials of fission nuclear systems with full size large specimens. The success of the creep tests in the HTTR depends strongly on reliable temperature measurements. A thin tube with a 2-mm outer diameter was inserted at the centre of the irradiation unit and the optical fibres were accommodated inside this tube. The irradiation unit was inserted into the replaceable reflector region shown in Figure 8. A nuclear fuel region forms a cylindrical shape in the HTTR and the HTTR has a relatively flat neutron and gamma intensity profile in the core region. The HTTR was planned to start its latest operation by the end of 2003 and the applicability of the optical fibre dosimetric system would have been demonstrated there. Then, the temperature measuring system by the optical fibre would have played a crucial role in demonstrating the safety of the HTTR under a transient scheme such as a coolant-flow lost trouble. However, some troubles in the HTTR rendered it necessary to postpone the operation. Over the course of handling the licensing procedures for higher temperature operation, however, the importance of detailed temperature measurements was reconfirmed, particularly under transient operational schemes. Thus, the optical fibre dosimetric systems are expected to play a more and more important role in forthcoming HTTR operations.
Figure 6. Structure of high-temperature engineering test reactor (HTTR) at Oarai Research Establishment in Japan Atomic Energy Research Institute

257
Figure 7. Structure of irradiation rig for installation of the optical fibre dosimetric system
Figure 8. Cross-sectional view of core region of HTTR
Three places, replaceable reflector region A in the figure, can be used for accommodation of instrumented rig, just the first layer outside of the fuel region
258
Conclusion
The applicability of an optical dosimetric system in the core region of a high-temperature gas-cooled reactor (HTGR) system was demonstrated. Temperature could be measured in the range of 600-1 100 K by thermoluminescence, and nuclear power can be monitored by measuring Cerenkov radiation and other radioluminescence peaks. A special irradiation rig was prepared for installation of optical fibre systems in the high-temperature engineering test reactor (HTTR) for in-core dosimetry. The optical dosimetric system will be tested in an actual operating HTTR next year, at which time it willplay an important role in evaluating the safety aspects of the HTTR in steady-state operation mode as well as transient operation mode.
Acknowledgements
A part of the present work was carried out with the financial and technical support of the HTTR utilisation/promotion programme. The authors would like to express their sincere thanks to both Dr. T. Kikuchi and Director S. Shiozawa for their invaluable support.
REFERENCES
[1] Shikama, T., T. Kakuta, M. Narui, T. Sagawa, N. Shamoto, T. Uramoto, K. Sanada and H. Kayano, “Behavior of Radiation-resistant Optical Fibers under Irradiation in a Fission Reactor”, J. Nucl. Mater., 212-215, 421-425 (1994).
[2] Shikama, T., M. Narui, T. Kakuta, H. Kayano, T. Sagawa and K. Sanada, “Study of Optical Radiation from SiO2 during Reactor Irradiation”, Nucl. Instr. Methds, B91, 342-345 (1994).
[3] Shikama, T., T. Kakuta, M. Narui, T. Sagawa and H. Kayano, “Optical Properties in Fibers during Irradiation in a Fission Reactor”, J. Nucl. Mater., 225, 324-327 (1995).
[4] Shikama, T., T. Kakuta, M. Narui, T. Sagawa, B.F.H. Jensesn, S. Nakazawa and H. Kayano, “In Situ Radioluminescence from Sapphire under Fission Reactor Irradiation”, ASTM-STP, 1325, 1077-1086 (1997).
[5] Shikama, T., “Study of Dynamic Radiation Effects in Ceramics in Fission Reactor”, Radiation Effects & Defects in Solids, 144, 63-83 (1998).
[6] Shikama, T., T. Kakuta, M. Narui and T. Sagawa, “Growth of Optical Transmission Loss at 850 nm in Silica Core Optical Fibers during Fission Reactor Irradiation”, J. Nucl. Mater., 253 180-189 (1998).
[7] Jensen, F., T. Kakuta, T. Shikama, T. Sagawa, M. Narui and M. Nakazawa, “Optical Measurements of High Temperatures for Material Investigations in Nuclear Reactor Environments”, Fusion Eng. and Design, 42C, 449-454 (1998).

259
[8] Kakuta, T., T. Shikama, M. Narui and T. Sagawa, “Behavior of Optical Fibers under Heavy Irradiation”, Fusion Eng. and Design, 42B, 201-205 (1998).
[9] Yamamoto, S. and T. Shikama, “Studies of Radiation Effects in Optical Components for ITER Diagnostics”, SPIE-3872, 2-10 (1999).
[10] Kakuta, T., T. Shikama and N. Shamoto, “Development of Radiation-resistant Optical Fibers for Visible Application”, SPIE-3872, 11-16 (1999).
[11] Nagata, S., B. Tsuchiya, K. Toh, T. Shikama, “Ion Induced Luminescence of Silica Glasses and Optical Fibers”, presented at SPIE-2003, San Diego, August (2003).
[12] Toh, K., T. Shikama, S. Nagata, B. Tsuchiya, T. Kakuta, T. Hoshiya, M. Ishihara, “Search for Radioluminescent Materials Working at Elevated Temperature”, presented at ANS-TOFE international meeting, Washington DC, November, 2002, to be published in J. Nucl. Technol.
[13] Toh, K., T. Shikama, S. Nagata, B. Tsuchiya, T. Kakuta, “Infrared Luminescence of Rare Earth Oxide Materials”, presented at SPIE-2003, San Diego, August (2003).
[14] Toh, K., S. Nagata, B. Tshuchiya, T. Suzuki, T. Shikama, M. Ishihara, M. Fujitsuka, T. Tanabe and S. Yamamoto, “Study on High-temperature Radio-luminescent Ceramics for HTTR Applications”, these proceedings.
[15] Mori, C., et al., presented at the 2nd Information Exchange Meeting on Basic Studies of High-temperature Engineering, Paris, September (2002).
261
STUDY ON HIGH-TEMPERATURE RADIOLUMINESCENT CERAMICS FOR HTTR APPLICATION
K. Toh, S. Nagata, B. Tsuchiya, T. Suzuki, T. ShikamaInstitute for Materials Research, Tohoku University
Sendai, 980-8577, Japan
M. IshiharaOarai Research Establishment, Japan Atomic Research Institute
Oarai, 311-1394, Japan
M. Fujitsuka, T. TanabeNational Institute for Materials Science
Tsukuba, Ibaraki 305-0003, Japan
S. YamamotoTakasaki Radiation Chemistry Research Establishment, Japan Atomic Research Institute
Takasaki, Gunma 370-1292, Japan
Abstract
Radioluminescence from rare-earth oxide materials itself was measured in the visible wavelength range and the range from 1 000-3 000 nm in an ion beam accelerator and a fission reactor of Japan Materials Testing Reactor (JMTR). Through proton beam irradiation, luminescent peaks, which attributed to the electron transition between the energy levels of rare-earth ions, were observed in europium oxide and erbium oxide. In erbium oxide, peaks at 560, 660 and 1 540 nm were observed by the proton beam irradiation, and the complicated luminescence peaks around 1 800 and 2 000 nm were observed by the proton beam irradiation and at the reactor full power operation of 50 MW. The peaks at 560, 660 and 1 540 nm are attributed to the electron transition between the energy levels of Er3+ ions. The complicated luminescences observed in JMTR were quenched as the irradiation time elapsed, though the intensity was not changed by the irradiation of the proton beam of 2.6 � 1013 p/cm2s. It was considered that the precursors for the complicated luminescent peaks around 1 800 and 2 000 nm disappeared under neutron irradiation.

262
Introduction
Many attractive features are required for radiation flux monitors in fusion and fission reactor cores. Monitors require good radiation resistance, high temperature resistance, a wide dynamic range, a wide and detailed detection area and robustness against electrical noises. Furthermore, monitors require simplicity and compactness for easy maintenance. According to these requirements, we propose optical instrumentation using scintillators with fused silica optical fibres. The electronic excitation dose rate is measured by the intensity of the radioluminescence, which is be transmitted from scintillators to an optical detector by an optical fibre. The optical fibres are free of the constraints linked to the application of high electrical voltage and the worry of malfunction caused by degradation of electrical insulations subject to heavy irradiation is thus eliminated.
Recent advances in the development of radiation-resistant fused silica core optical fibres give optical diagnostics far better prospects with regard to burning fusion devices such as the International Thermonuclear Experimental Reactor (ITER) [1]. Among several optical diagnostics, one utilising radiation-induced luminescence will be a candidate to measure nuclear photon intensity (being proportional to a nuclear fusion reaction rate) and a particle flux incoming to the first wall [2-5].
In the present study, radioluminescent materials were searched for, to apply them at elevated temperatures in heavy irradiation environments. The irradiation tests for some ceramic materials (rare-earth oxide) were carried out in an ion beam accelerator and in a fission reactor. The luminescences from rare-earth oxides were measured in the wavelength range from 300 to 800 nm, and from 1 000 to 3 000 nm. The present paper will describe luminescent spectra and the behaviour of observed luminescence as functions of irradiation time.
Experimental set-up
Irradiation at an ion beam accelerator
An experimental set-up for an ion beam irradiation is shown in Figure 1. The experiment was carried out in a chamber with a base pressure of 10–6 Torr, connected to a 1.7 MV tandem accelerator, at the Laboratory for Development Research of Advance Materials, Institute for Materials Research, Tohoku University. An ion beam of 1 MeV proton was used in this experiment, the flux of which was 2.6 � 1013 p/cm2s. The irradiation was carried out at room temperature.
Figure 1. Experimental set-up for the measurement of luminescence in a tandem accelerator
Charged particles
Optical fiberDetector
Specimens
Chamber
Charged particles
Optical fiberDetector
Specimens
Chamber
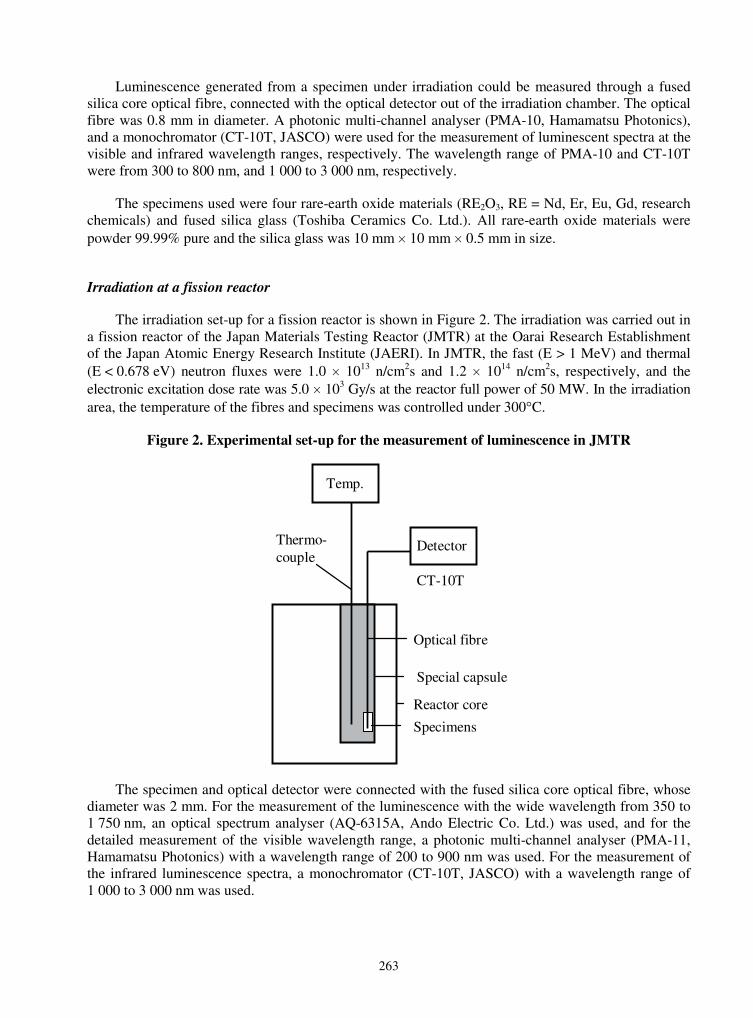
263
Luminescence generated from a specimen under irradiation could be measured through a fused silica core optical fibre, connected with the optical detector out of the irradiation chamber. The optical fibre was 0.8 mm in diameter. A photonic multi-channel analyser (PMA-10, Hamamatsu Photonics), and a monochromator (CT-10T, JASCO) were used for the measurement of luminescent spectra at the visible and infrared wavelength ranges, respectively. The wavelength range of PMA-10 and CT-10T were from 300 to 800 nm, and 1 000 to 3 000 nm, respectively.
The specimens used were four rare-earth oxide materials (RE2O3, RE = Nd, Er, Eu, Gd, research chemicals) and fused silica glass (Toshiba Ceramics Co. Ltd.). All rare-earth oxide materials were powder 99.99% pure and the silica glass was 10 mm � 10 mm � 0.5 mm in size.
Irradiation at a fission reactor
The irradiation set-up for a fission reactor is shown in Figure 2. The irradiation was carried out in a fission reactor of the Japan Materials Testing Reactor (JMTR) at the Oarai Research Establishment of the Japan Atomic Energy Research Institute (JAERI). In JMTR, the fast (E > 1 MeV) and thermal (E < 0.678 eV) neutron fluxes were 1.0 � 1013 n/cm2s and 1.2 � 1014 n/cm2s, respectively, and the electronic excitation dose rate was 5.0 � 103 Gy/s at the reactor full power of 50 MW. In the irradiation area, the temperature of the fibres and specimens was controlled under 300�C.
Figure 2. Experimental set-up for the measurement of luminescence in JMTR
Detector
CT-10T
Temp.
Optical fibre
Special capsule
Reactor core
Thermo-couple
Specimens
The specimen and optical detector were connected with the fused silica core optical fibre, whose diameter was 2 mm. For the measurement of the luminescence with the wide wavelength from 350 to 1 750 nm, an optical spectrum analyser (AQ-6315A, Ando Electric Co. Ltd.) was used, and for the detailed measurement of the visible wavelength range, a photonic multi-channel analyser (PMA-11, Hamamatsu Photonics) with a wavelength range of 200 to 900 nm was used. For the measurement of the infrared luminescence spectra, a monochromator (CT-10T, JASCO) with a wavelength range of 1 000 to 3 000 nm was used.

264
Specimens irradiated in the fission reactor were three rare-earth oxide materials (RE2O3, RE = Nd, Ho, Er, research chemicals) whose purities were all 99.99%. All specimens were powder-type. It should be noted that the luminescence of the optical fibre itself was observed along with luminescence from specimens.
Results and discussions
Luminescence in visible wavelength range
Luminescent spectra of erbium oxide, europium oxide and gadolinium oxide in the wavelength range of 300-800 nm under proton beam irradiation are shown in Figures 3, 4 and 5, respectively. Optical intensities of erbium oxide in the wavelength of 560 and 660 nm are shown in Figure 6 as a function of irradiation time. A structure responsible for the luminescence decreased with the irradiation time as implied in Figure 6. Luminescence in a visible wavelength range was not observed in neodymium oxide during proton beam irradiation. In the JMTR irradiation, luminescence was not observed in all rare-earth oxide materials in the wavelength range 200-900 nm. A luminescent peak at 450 nm was observed during proton beam irradiation as well as during the JMTR irradiation. This luminescence is from a fused silica core optical fibre.
The peaks of Er2O3 at 560 and 660 nm are attributed to the electron transition between energy levels of Er3+ ions, namely, the transition between 4F9/2 and 4I15/2, and 4S3/2 and 4I15/2, respectively. In the luminescent spectrum of Eu2O3, one can see several peaks. These peaks were also attributed to the electron transition between energy levels of Eu3+ ions [6,7]. The sharp large peak at 610 nm was 5D0 � 7F2 luminescence and the peak at 710 nm was 5D0 � 7F4 luminescence. The 5D0 � 7F1 and 5D0 � 7F3 luminescence were observed at 596 and 650 nm, respectively. In the luminescent spectrum of Gd2O3, one can see several sharp peaks in the wavelength range 480-740 nm. However, the luminescence of the electron transition between reported energy levels of Gd3+ ions appears in a shorter wavelength range, i.e. it appears in the large luminescent peak around 350 nm, ascribed to the electron transition of 6P � 8S [8,9]. Therefore, it was concluded that the sharp peaks observed in our experiment were not a result of the electron transition of Gd3+ions, but rather resulted from another unknown factor, for example, a small amount of another element, ligand and so on.
Figure 3. Luminescence spectrum of erbium oxide under proton beam irradiation
0
50
100
150
200
250
300
350
300 400 500 600 700 800
Op
tica
l in
ten
sity
(cp
s)
Wavelength (nm)
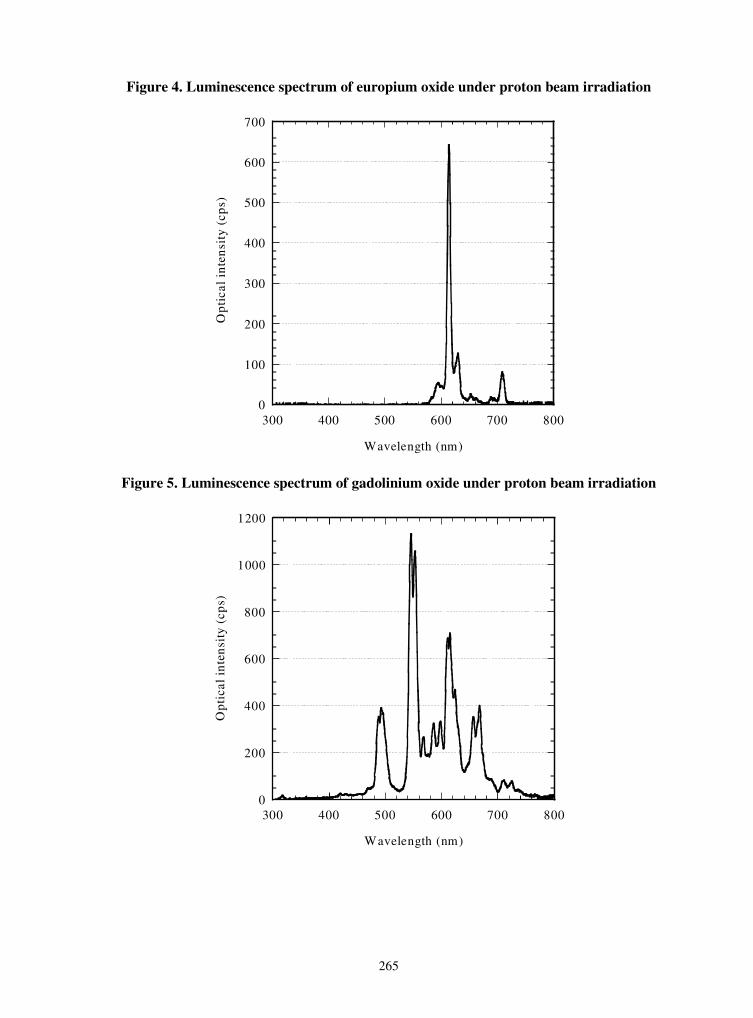
265
Figure 4. Luminescence spectrum of europium oxide under proton beam irradiation
0
100
200
300
400
500
600
700
300 400 500 600 700 800
Op
tica
l in
ten
sity
(cp
s)
Wavelength (nm)
Figure 5. Luminescence spectrum of gadolinium oxide under proton beam irradiation
0
200
400
600
800
1000
1200
300 400 500 600 700 800
Opt
ical
in
ten
sity
(cp
s)
Wavelength (nm)
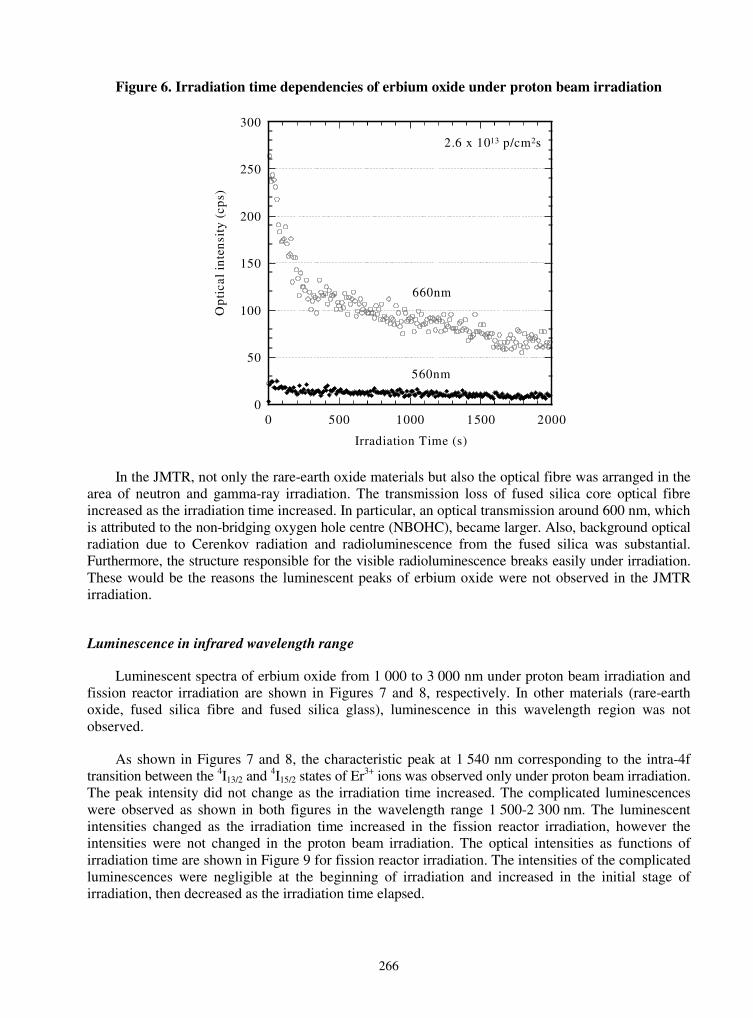
266
Figure 6. Irradiation time dependencies of erbium oxide under proton beam irradiation
0
50
100
150
200
250
300
0 500 1000 1500 2000
Op
tica
l in
ten
sity
(cp
s)
Irradiation Time (s)
660nm
560nm
2.6 x 10¹³ p/cm2s
In the JMTR, not only the rare-earth oxide materials but also the optical fibre was arranged in the area of neutron and gamma-ray irradiation. The transmission loss of fused silica core optical fibre increased as the irradiation time increased. In particular, an optical transmission around 600 nm, which is attributed to the non-bridging oxygen hole centre (NBOHC), became larger. Also, background optical radiation due to Cerenkov radiation and radioluminescence from the fused silica was substantial. Furthermore, the structure responsible for the visible radioluminescence breaks easily under irradiation. These would be the reasons the luminescent peaks of erbium oxide were not observed in the JMTR irradiation.
Luminescence in infrared wavelength range
Luminescent spectra of erbium oxide from 1 000 to 3 000 nm under proton beam irradiation and fission reactor irradiation are shown in Figures 7 and 8, respectively. In other materials (rare-earth oxide, fused silica fibre and fused silica glass), luminescence in this wavelength region was not observed.
As shown in Figures 7 and 8, the characteristic peak at 1 540 nm corresponding to the intra-4f transition between the 4I13/2 and 4I15/2 states of Er3+ ions was observed only under proton beam irradiation. The peak intensity did not change as the irradiation time increased. The complicated luminescences were observed as shown in both figures in the wavelength range 1 500-2 300 nm. The luminescent intensities changed as the irradiation time increased in the fission reactor irradiation, however the intensities were not changed in the proton beam irradiation. The optical intensities as functions of irradiation time are shown in Figure 9 for fission reactor irradiation. The intensities of the complicated luminescences were negligible at the beginning of irradiation and increased in the initial stage of irradiation, then decreased as the irradiation time elapsed.

267
Figure 7. Luminescence spectrum of erbium oxide under proton beam irradiation
0
5
10
15
20
25
1000 1500 2000 2500 3000
Opt
ical
int
ensi
ty (
a.u.
)
Wavelength (nm)
4I13/2 - 4I15/2
Proton beam
Figure 8. Luminescence spectrum of erbium oxide in JMTR
-0.5
0
0.5
1
1.5
2
2.5
1000 1500 2000 2500 3000
0
3.2x10¹⁹
5.1x10²⁰
2.0x10²⁰
3.1x10²⁰
Opt
ical
int
ensi
ty (
a.u.
)
Wavelength (nm)
JMTR

268
Figure 9. Irradiation time dependencies of erbium oxide in JMTR
0
0.5
1
1.5
2
0 100 200 300 400 500 600 700
1800nm
2000nm
Opt
ical
int
ensi
ty (
a.u.
)
Elapsed time (h)
We consider that there were precursors for the infrared luminescence that were not confirmed in this paper. Further, the change of the optical intensities in the infrared wavelength range in the JMTR was caused by the disappearance of the precursors by the neutrons irradiation. It is considered that the disappearance is caused by the atomic displacement of Er and/or O by neutrons.
Conclusions
Luminescences from four rare-earth oxides (RE2O3, RE = Nd, Er, Eu, Gd) and fused silica glass were observed under an ion beam irradiation and three rare-earth oxides (RE2O3, RE = Nd, Ho, Er) and those from fused silica core optical fibre were observed under fission reactor irradiation. The material that showed luminescence was Er2O3, Eu2O3, and Gd2O3 under the ion beam irradiation. The luminescent peaks of Er2O3 at 560 and 660 nm were observed only under proton beam irradiation and the peaks corresponded to the electron transition of Er3+ ions. The luminescent peaks of Eu2O3 at 596, 610, 650 and 710 nm were attributed to the electron transition between energy levels of Eu3+ ions from 5D0 to 7FJ (J = 0, 1, 2, 3 and 4), respectively. However, the peaks of the Gd2O3 did not correspond to an electron transition between intrinsic energy levels of Gd3+ ions.
The infrared luminescent peak of Er2O3 at 1 540 nm observed only under proton beam corresponded to the intra-4f transition between the 4I13/2 and 4I15/2 states of Er3+ ions. It was considered that the precursors of these luminescences attributed to the electron transition between the energy levels of Er3+ ions were extinguished by the neutron irradiation in the JMTR. On the other hand, the complicated luminescent peaks in the infrared wavelength range were observed both under ion beam and fission reactor irradiations. The peaks did not correspond to an electron transition between reported energy levels in the erbium oxide. Intensities of these peaks were negligible at the beginning and increased in the initial stage of irradiation and then decreased as the irradiation time increased in the JMTR. These changes may be caused by the reaction between neutrons and precursors for defects responsible for the luminescent peaks.

269
REFERENCES
[1] Yamamoto, S., “Radiation Effects on Diagnostic Components”, ITER-EDA, Design Description Document, WBS 5.5M, ITER-JWS-Garching, Germany (1998).
[2] Shikama, T., M. Narui, T. Kakuta, H. Kayano, T. Sagawa, and K. Sanada, “Study of Optical Radiation from SiO2 during Reactor Irradiation”, Nucl. Instr. and Meth., B 91, pp. 342-345, (1994).
[3] Shikama, T., T. Kakuta, M. Narui, T. Sagawa and H. Kayano, “Optical Properties in Fibers during Irradiation in a Fission Reactor”, J. Nucl. Mater., 225, pp. 324-327 (1995).
[4] Kakuta, T., T. Shikama, M. Narui, T. Sagawa, “Behavior of Optical Fibers under Heavy Irradiation”, Fus. Eng. and Des., 41, pp. 201-205 (1998).
[5] Kakuta, T., K. Sakasai, T. Shikama, M. Narui, T. Sagawa, “Absorption and Fluorescence Phenomena of Optical Fibers under Heavy Neutron Irradiation”, J. Nucl. Mater., 258-263, pp. 1893-1896 (1998).
[6] Chen, G., R.G. Haire and J.R. Peterson, “Effect of Temperature on the Luminescence from Eu2O3”, J. Solid State Chem., 102, p. 126 (1993).
[7] Mochizuki, S., Y. Suzuki, T. Nakanishi, K. Ishi, “Valence-change- and Defect-induced White Luminescence of Eu2O3”, Physica B, 308-310, p. 1046 (2001).
[8] Daoud, M., D. Zambon, R. Mahiou, A. Ammar and B. Tanouti, “Spectroscopic Properties of Trivalent Gadolinium in Diphosphate CsYP2O7”, Mater. Res. Bull., 33, p. 597 (1998).
[9] Kumar, A., D.K. Rai, S.B. Rai, “Luminescence of Gd3+ Ions Doped in Oxyfluoroborate Glass”, Solid State Communications, 117, p. 387 (2001).
271
LIST OF PARTICIPANTS
FRANCE
Mr. Philippe BILLOT CEA Saclay Nuclear Energy Division Bât. 121 F-91190,Gif-sur-Yvette
Tel: +33 1 69 08 68 56 Fax: +33 1 69 08 58 92 Eml: [email protected]
Dr. Pierre GUILLERMIER FRAMATOME ANP 10, rue Juliette Récamier F-69456 Lyon Cedex 06
Tel: +33 4 72 74 84 05 Fax: +33 4 72 74 73 40 Eml: [email protected]
JAPAN
Ms. Jun AIHARA Dept. of Advanced Nuclear Heat Technology High Temperature Irradiation Research GroupOarai Research Establishment Japan Atomic Energy Research Institute 3607 Oarai-machi, Higasi-ibaraki-gun
Tel: +81 29-264-8711 Fax: +81 29-264-8712 Eml: [email protected]
Dr. Osamu BABA Director General Oarai Research Establishment Japan Atomic Energy Research Institute Oarai-machi, Ibaraki-ken 311-1394
Tel: +81 29-264-8201 Fax: +81 29-264-8471 Eml: [email protected]
Dr. Motokuni ETO RIST, Database Division Tokai-mura, Ibaraki-ken 319-1196
Tel: +81 29-282-5017,or-8352 Ext. 32 Fax: +81 29-283-3811 Eml: [email protected]
Dr. Satoshi HANAWA Japan Atomic Energy Research Institute 3607 Niihori,Narita-cho,Oarai-machi 311-1394, Ibaraki-ken
Tel: +81 29-264-8349 Fax: +81 29-264-8480 Eml: [email protected]
Dr. Kimio HAYASHI Blanket Irradiation and Analysis Laboratory Japan Atomic Energy Research Institute 3607 Niibori, Narita-cho, Oarai-machi Ibaraki-ken, 311-1394
Tel: +81 29-264-8360 Fax: +81 29-264-8480 Eml: [email protected]

272
Mr. Tomohiro HOJO Ibaraki University Bunkyou, Mito-shi, Ibaraki-ken 310-8512
Tel: +81 29-228-8357 Fax: +81 29-228-8357 Eml: [email protected]
Dr. Taiji HOSHIYA Japan Nuclear Cycle Development Institute Oarai Engineering Center Advanced Technology Division 4002, Narita, Oarai, Ibaraki 311-1393
Tel: +81-29-267-4141 Ext. 5917 Fax: +81-29-297-7148 Eml: [email protected]
Dr. Masahiro ISHIHARA High Temperature Irradiation Laboratory Japan Atomic Energy Research Institute Oarai-machi, Ibaraki-ken 311-1394
Tel: +81 29-264-8734 or 8605 Fax: +81 29-264-8712 Eml: [email protected]
Prof. Shiori ISHINO Dept. of Applied Science Tokai University 1117, Kitakaname, Hiratsuka-shi Kanagawa-ken 259-1292
Tel: +81 33-488-2756/+81 46-358 1211 Fax: +81 33-488-0589/+81 463 50 2017 Eml: [email protected]
Mr. Tatsuo IYOKU Department of HTTR Project Oarai Research Establishment Japan Atomic Energy Research Institute Narita-cho, Oarai-machi Ibaraki-ken 311-1394
Tel: +81 29 264 8530 Fax: +81 29 264 8486 Eml: [email protected]
Ms. Tomoko KAWASAKI Administrative Chief of Staff Dept. of Advanced Nuclear Heat Technology Oarai Research Establishment Japan Atomic Energy Research Institute 3607 Oarai-machi Higasi-ibaraki-gun 311-1934
Tel: +81 29-264-8701 Fax: +81 29-264-8608 Eml: [email protected]
Mr. Ken-ichi KUBOTA Toshiba Corporation 8, Shinsugita-cho,Isogo-ku Yokohama 235-8523
Tel: +81 45-770-2406 Fax: +81 45-770-2317 Eml: [email protected]
Dr. Akira KURUMADA Ibaraki University 4-12-1, Nakanarusawa, Hitachi-shi Ibaraki-ken, 316-8511
Tel: +81 294-38-5038 Fax: +81 294-38-5047 Eml: [email protected]
Dr. Tadashi MARUYAMA The Wakasa Wan Energy Research Center Nagatani, Tsuruga, Fukui 914-0192
Tel: +81 770-24-2300 Fax: +81 770-24-5605 Eml: [email protected]
273
Prof. Chizuo MORI Aichi Institute of Technology Yachigusa 1247, Yagusa-cho Toyota-shi 470-0392
Tel: +81 565-48-8121 Fax: +81 565-48-0010 Eml: [email protected]
Prof. Yoshinobu MOTOHASHI The Research Center for Superplasticity Faculty of Engineering, Ibaraki University 4-12-1 Nakanarusawa, Hitachi-shi Ibaraki-ken 316-8511
Tel: +81 294-38-5032 Fax: +81 294-38-5032 Eml: [email protected]
Mr. Hitoshi MUTO Administrative Manager Dept. of Advanced Nuclear Heat Technology Oarai Research Establishment Japan Atomic Energy Research Institute 3607 Oarai-machi Higasi-ibaraki-gun 311-1934
Tel: +81 29-264-8700 Fax: +81 29-264-8608 Eml: [email protected]
Dr. Takeshi OHSHIMA Japan Atomic Energy Research Institute 1233 Watanuki, Takasaki-shi Gunma-ken 370-1292
Tel: +81 27-346-9346 Fax: +81 27-346-9687 Eml: [email protected]
Prof. Tatsuo OKU The University of the Air 2-1-1 Bunkyo, Mito-shi Ibaraki-ken 310-0056
Tel: +81 29-228-8542 Fax: +81 29-228-0685 Eml: [email protected]
Dr. Yoshio SAKKA National Institute for Materials Science 1-2-1, Sengen, Tsukuba-shi, Ibaraki 305-0047
Tel: +81 29-859-2461 Fax: +81 29-859-2401 Eml: [email protected]
Dr. Shusaku SHIOZAWA Dept.of Advanced Nuclear Heat Technology JAERI Naritamachi Niihori 3607, Oarai-machi Ibaraki-ken 311-1394
Tel: +81 29-264-8603 Fax: +81 29-264-8608 Eml: [email protected]
Dr. Kenya SUYAMA Department of Fuel Cycle Safety Research Japan Atomic Energy Research Institute 2-4 Shirakata-Shirane, Tokai-mura Naka-gun, Ibaraki-ken 319-1195
Tel: +81 29-282-5834 Fax: +81 29-282-6479 Eml: [email protected]
Mr. Masashi TAKAHASHI Nuclear Fuel Industries, Ltd. Tokai Works Advanced Reactor Fuels Department 3135-41, Muramatsu, Tokai-mura Naka-gun, Ibaraki-ken 319-1196
Tel: +81 29-287-8211 Fax: +81 29-287-8223 Eml: [email protected]
274
Prof. Takayuki TERAI Dept. of Quantum Engineering and Systems Science University of Tokyo 7-3-1 Hongo, Bunkyo-ku, Tokyo 113-8656
Tel: +81 35-841-7010 Fax: +81 35-689-7349 Eml: [email protected]
Dr. Kentaro TOH Institute for Materials Research Tohoku University 2-1-1 Katahira, Aobaku, Sendai 980-8577
Tel: +81 22-215-2063 Fax: +81 22-215-2061 Eml: [email protected]
Mr. Nobumasa TSUJI Fuji Electric Co., Ltd. Energy & Electric Systems Company Nuclear Power & Radiation Systems Div. 1-1 Tanabeshinden, Kawasaki-ku Kawasaki-shi, 210-9530
Tel: +81 44-329-2194 Fax: +81 44-329-2178 Eml: [email protected]
Dr. Tetsuo UCHIKOSHI National Institute for Material Science Fine Particle Processing Group 1-2-1 Sengen, Tsukuba, Ibaraki 305-0047
Tel: +81 44-329-2194 Fax: +81 29-859-2401 Eml: [email protected]
Mr. Masatoshi YAMAJI Dept. of Advanced Nuclear Heat Technology High Temperature Irradiation Research GroupOarai Research Establishment Japan Atomic Energy Research Institute 3607 Oarai-machi Higasi-ibaraki-gun 311-1394
Tel: +81 29-264-8735 Fax: +81 29-264-8741 Eml: [email protected]
Prof. Michio YAMAWAKI Tokai University, School of Engineering 1117 Kitakaname, Hiratsuka-shi Kanagawa-ken, 289-1292
Tel: +81-463-58-1211, Ext. 4153 Fax: +81-463-50-2017 Eml: [email protected] [email protected]
KOREA
Dr. Se-Hwan CHI Korea Atomic Energy Research Institute (KAERI)
Tel: +82 42-868-2385 Fax: +82 42-868-8346 Eml: [email protected]
NETHERLANDS
Dr. Jaap G. VAN DER LAAN MMI/Materials, Monitoring & Inspection NRG/Nuclear Research & Consultancy GroupP.O. Box 25, 1755 ZG Petten
Tel: +31 224 56 4744 Fax: +31 224 56 8883 Eml: [email protected]
275
Mr. Willem Frederik Geert VAN ROOIJEN Delft University of Technology P.O. Box 5042 2600 GA Delft Mekelweg 15 2629 JB Delft
Tel: +31 15-27-84041 Fax: +31 15-27-86422 Eml: [email protected]
RUSSIAN FEDERATION
Dr. Albert S. CHERNIKOV The Federal State Unitarian Enterprise Research Institute Scientific Industrial Association “Lutch” 24, Zheleznodorozhnaya St. Podolsk, Moscow Region, 142100
Tel: +7 095 715 9876 Fax: +7 096 7 637097 Eml: [email protected]
Mr. Alexander G. CHUDIN Department for Atomic Power Ministry of the Russian Federation on Atomic Energy Staromonetny 26 109180 Moscow
Tel: +7 (095) 239 27 95 Fax: +7 (095) 953 30 53 +7 (095) 239-25-88 Eml: [email protected]
UNITED KINGDOM
Mr. Nick BLACKBURN Health & Safety Executive Nuclear Installations Inspectorate St Peter’s House, Balliol Rd., Bootle
Tel: +44 151-951-3818 Fax: +44 151-951-4163 Eml: [email protected]
Mr. Michael Wyn DAVIES NNC Ltd. Booths Hall, Chelford Road Knutsford, Cheshire WA16 8QZ
Tel: +44 156-584-3238 Fax: +44 156-584-3878 Eml: [email protected]
Dr. Alex FOK Manchester School of Engineering University of Manchester Oxford Road, Manchester M13 9PL
Tel: +44 161-275-4327 Fax: +44 161-275-4328 Eml: [email protected]
Mr. Graham HALL Nuclear Graphite Research Group Manchester School of Engineering University of Manchester Simon Building, Oxford Road Manchester M13 9PL
Tel: +44 161-274-4445 Fax: Eml: [email protected]
Mr. Matt HOLT Department of Engineering The University of Hull Cottingham Road, HU6 7RX, Hull
Tel: +44 148-246-5064 Fax: Eml: [email protected]
276
Dr. Masatoshi KURODA Nuclear Graphite Research Group Manchester School of Engineering University of Manchester Oxford Road, Manchester M13 9PL
Tel: +44 161-275-4391 Fax: +44 161-275-4328 Eml: [email protected]
Dr. Barry MARSDEN Manchester School of Engineering The University of Manchester Oxford Road, Manchester M13 9PL
Tel: +44 161-275-4399 Fax: +44 161-275-4328 Eml: [email protected]
Dr. Martin METCALFE British Nuclear Fuels Ltd. Research and Technology Berkeley Centre Berkeley, Gloucestershire GL13 9PB
Tel: +44 145-381-2637 Fax: +44 145-381-2911 Eml: [email protected]
Dr. Paul MUMMERY University of Manchester Oxford Road, Manchester M13 9PL
Tel: +44 161-200-3686 Fax: +44 161-200-3586 Eml: [email protected]
Dr. Gareth NEIGHBOUR Dept. of Engineering University of Hull Cottingham Road, Hull HU6 7RX
Tel: +44 148-246-6535 Fax: +44 148-246-6664 Eml: [email protected]
Dr. Anthony WICKHAM Consultant Cwmchwefru,Llanafanfawr Builth Wells, LD2 3PW Powys
Tel: +44 159-786-0244 Fax: +44 159-786-0244 Eml: [email protected]
UNITED STATES OF AMERICA
Dr. Timothy D. BURCHELL Carbon Materials Technology Group Oak Ridge National Laboratory Bethel Valley Road P.O. Box 2008,Oak Ridge TN 37831-6088
Tel: +1 (865) 576-8595 Fax: +1 (865) 576-8424 Eml: [email protected]
Dr. Peter Jarod PAPPANO Oak Ridge National Laboratory 1 Bethel Valley Road P.O. Box 2008, Oak Ridge, TN 37831
Tel: +1 865-576-3844 Fax: +1 865-576-8424 Eml: [email protected]
Dr. Makuteswara SRINIVASAN US Nuclear Regulatory Commission 11545 Rockville Pike Mail Stop: T10-E10 Rockville, MD 20852-2738
Tel: +1 301-415-6356 Fax: +1 301-415-5074 Eml: [email protected]

277
INTERNATIONAL ORGANISATIONS
Dr. Mabrouk METHNANI International Atomic Energy Agency Wagramer Strasse 5 Box 100, A-1400 Vienna
Tel: +43 1 2600-22810 Fax: +43 1 2600-29598 Eml: [email protected]
Dr. Claes NORDBORG OECD/NEA Data Bank Le Seine Saint-Germain 12 boulevard des Iles F-92130 Issy-les-Moulineaux
Tel: +33 (1) 4524 1090 Fax: +33 (1) 4524 1110 Eml: [email protected]

ALSO AVAILABLE
NEA Publications of General Interest
NEA News ISSN 1605-9581 Yearly subscription: ��������������������¥ 5 500
Nuclear Energy Today ISSN 9264-10328-7 Price : ��� ������������ ���¥ 2 700
Nuclear Science
Nuclear Production of Hydrogen Second Information Exchange Meeting, Argonne, Illinois, USA, 2-3 October 2003 (2004) ISBN 92-64-10770-3 Price: ����������� ��������¥ 8 300
Physics of Plutonium Recycling Volume VII – BWR MOX Benchmark – Specification and Results (2003) ISBN 92-64-19905-5 Price: �������������������¥ 5 500 Volume VI – Multiple Pu Recycling in Advanced PWRs (2002) ISBN 92-64-19957-8 Price: �������������������¥ 5 250
Utilisation and Reliability of High Power Proton Accelerators (2003) Workshop Proceedings, Santa Fe, New Mexico, USA, 12-16 May 2002ISBN 92-64-10211-6 Price: ��������������������¥ 11 500
Advanced Reactors with Innovative Fuels Workshop Proceedings, Chester, UK, 22-24 October 2001 (2002) ISBN 92-64-19847-4 Price: �� �������� ���������¥ 15 000
Accelerator-driven Systems (ADS) and Fast Reactors (FR) in Advanced Nuclear Fuel Cycles (2002)ISBN 92-64-18482-1 Free: paper or web.
Actinide and Fission Product Partitioning and Transmutation (2003)Proceedings of the Seventh Information Exchange Meeting, Jeju, Republic of Korea, 14-16 October 2002 ISBN 92-64-02125-6 Free: paper or web.
Benchmark on Beam Interruptions in an Accelerator-driven System (2003)Final Report on Phase I Calculations ISBN 92-64-02138-8 Free: paper or web.
Benchmark on Deterministic Transport Calculations Without Spatial Homogenisation (2003)A 2-D/3-D MOX Fuel Assembly Benchmark ISBN 92-64-02139-6 Free: paper or web.
Burn-up Credit Criticality Benchmark (2003) Free: paper or web.Phase IV-A: Reactivity Prediction Calculations for Infinite Arrays of PWR MOX Fuel Pin Cells ISBN 92-64-02123-XPhase IV-B: Results and Analysis of MOX Fuel Depletion Calculations ISBN 92-64-02124-8
CD-ROM Complete Collection of Published Reports (as of May 2003) Free on request.
Plutonium Management in the Medium Term (2003) ISBN 92-64-02151-5 Free: paper or web.
Pressurised Water Reactor Main Steam Line Break (MSLB) Benchmark Free: paper or web.Volume IV: Results of Phase III on Coupled Core-plant Transient Modelling (2003) ISBN 92-64-02152-3
VVER-1000 Coolant Transient Benchmark (2003) Phase I (V1000CT-1) – Vol. I: Main Coolant Pump (MCP) Switching On – Final Specifications ISBN 92-64-18496-1 Free: paper or web.
Order form on reverse side.

ORDER FORM
OECD Nuclear Energy Agency, 12 boulevard des Iles, F-92130 Issy-les-Moulineaux, France Tel. 33 (0)1 45 24 10 15, Fax 33 (0)1 45 24 11 10, E-mail: [email protected], Internet: www.nea.fr
Qty Title ISBN Price Amount
Total*
* Prices include postage fees.
❑ Payment enclosed (cheque payable to OECD Publications).
Charge my credit card ❑ VISA ❑ Mastercard ❑ American Express
Card No. Expiration date Signature
Name
Address Country
Telephone Fax

OECD PUBLICATIONS, 2, rue André-Pascal, 75775 PARIS CEDEX 16
PRINTED IN FRANCE
(66 2004 06 1 P) – No. 53557 2004