basic information - csav.com · in brazil’s companhia libra de navegaçao s.a. and uruguay’s...
TRANSCRIPT


Basic Information
Corporate NameCompañía Sud Americana de Vapores S.A. Ticker Code Vapores
Chilean Taxpayer ID 90.160.000-7
Type of Entity Publicly listed corporation
Securities Registry Number 76
Legal Address Santiago and Valparaíso, Chile
IncorporationCompañía Sud Americana de Vapores S.A. was incorporated by public instrument dated October 4, 1872, signed before the Valparaíso notary, Mr. Julio Cesár Escala. This was authorized by Supreme Decree No. 2,347 dated October 9, 1872. These documents were registered on page 486, No. 147 and page 497 No. 148, respectively, of the Valparaíso Chamber of Commerce on October 15, 1872.
OfficesSantiagoHendaya 60, 14th floor, Office 1401, Las CondesPostal Code 7550188P.O. Box 186 – Mail 34Telephone: (56-2) 2588 6000Fax: (56-2) 2331 5153
Websitewww.csav.com
Shareholder ServicesDCV Registros S.A.Huérfanos 770 22nd floor, Santiago, ChileTelephone: (56-2) 2393 [email protected]
Investor RelationsFelipe RodríguezInvestor RelationsTelephone: (56-2) 2588 [email protected]

1
Founded in 1872
Letter from the Chairman
Corporate Governance
Activities and Businesses History CSAV Profile Shipping Industry Regulatory Framework
CSAV in 2015 Income Statement Analysis Lines of Business Other Activities General Information Ownership, Stock Performance and Other Related Matters CSAV Subsidiaries and Associates
Consolidated Financial Statements Independent Auditors’ Report Consolidated Classified Statement of Financial Position Consolidated Statement of Comprehensive Income Statement of Changes in Net Equity Consolidated Statement of Cash Flows Notes to the Consolidated Financial Statements Reasoned Analysis Material Events
Summarized Financial Statements of Subsidiaries
Responsibility Statement
2
4
6 6 8
814
15151821 282835
47485052545556
136150
155
160

2
ANNU
AL R
EPOR
T
2015
Letter from the Chairman
2
MEM
ORI
A A
NU
AL
20
15
Dear Shareholders:
Once again, this year was marked by substantial volatility in international financial markets and weak global trade, affecting the shipping industry and CSAV’s lines of business.
In this context, CSAV recorded a US$14.7 million loss at the consolidated level. In large part, the result is attributable to the dilution-related loss of US$83.9 million recorded to reflect the reduction in CSAV’s ownership interest in Hapag-Lloyd AG (HLAG). During HLAG’s November 2015 initial public offering on the Frankfurt and Hamburg exchanges, CSAV reduced its ownership interest in the company from 34% to 31.35%.
HLAG’s IPO, a very meaningful company milestone, will allow more efficient access to capital and financial markets. The IPO placement price was negatively impacted by high volatility in stock prices and in the world’s leading stock indexes, which have been somewhat depressed since mid-2015. We expect these trends to reverse once markets regain some normality and world trade resumes more stable growth.
Our container shipping business was successfully transferred to HLAG, thereby harnessing synergies and improving operations, as expected. However, a weakened international scene particularly impacted results in the second half of 2015.
Despite unfavorable market conditions, HLAG recorded profit for the year of US$123.9 million and achieved an EBITDA margin of 9.4% in 2015.
Overall, CSAV’s direct lines of business have faced distinctly negative circumstances. The trend is particularly pronounced in vehicle trades to Chile and Peru, where shipping demand has dropped significantly.
In 2015, sales revenue from services operated by the company totaled US$183.1 million, down US$52.2 million (22%) from the prior year. This drop is explained by the aforementioned slowdown and reduced freight rates, primarily in the vehicle transport business. However, through its operating efficiency programs, the company reduced cost of sales and expenses associated with the other transportation services it provides. These reductions more than offset the drop in revenue, thereby reducing operating losses in this segment.
2
ANNU
AL R
EPOR
T
2015

33
CSAV returned its last two chartered vessels this year, thus ending solid bulk transport operations. Similarly, in an effort to maintain shipping operations that converge on a point of equilibrium and due to the high operating costs and risks associated, refrigerated bulk transport service on specialized carriers or reefers was discontinued at the end of the 2015 fruit season.
In financing activities, the company successfully completed the capital increase begun in 2014, raising a total of US$396 million (US$163 million in 2015). These funds were used to subscribe HLAG’s December 2014 capital increase and finance certain lines of credit used to complete the transaction with the German company.
In August 2015, the company fully prepaid its outstanding Chilean bonds (denominated in UF), refinancing with a long-term loan in US dollars. Finally, the company obtained a loan of US$29.7 million from its parent company, Quiñenco S.A., to finance its purchase of additional shares during HLAG’s IPO.
Management developed new processes and information systems to manage business more efficiently and ease dependence on existing systems for container shipping services. Along the same lines, as of mid-2015 the company consolidated its headquarters in Santiago, relocating functions and personnel from Valparaíso.
This year presented considerable challenges for everyone; however, our strategy has definitely left us in a better position to face the uncertain, volatile global conditions. This is not by chance; CSAV owes its accomplishments to shareholder support and employee commitment. Our employees strive to provide the best quality service for our customers, while increasing efficiency and innovating to provide solutions that fit the company’s new organizational and operational structure. We aim to meet our customers’ need for efficient shipping services at competitive prices.
I would especially like to reiterate my sincere gratitude and recognize all the people on the CSAV team. Thank you for your valuable service and commitment to the company. Also, thank you to our customers for their trust and to our shareholders for their steadfast, continued support of our development plans at Compañía Sud Americana de Vapores.
Sincerely,
Francisco Pérez MackennaChairman of the Board

4
ANNU
AL R
EPOR
T
2015
Corporate Governance
Board of DirectorsThe current board was elected at the Company’s ordinary shareholders’ meeting on April 29, 2013, for a period of three years.
4
Directors’ Committee
MEMBERS• Víctor Toledo Sandoval, Chairman of the Committee, Independent Director• Canio Corbo Lioi, Independent Director• Gonzalo Menéndez Duque, Non-independent Director
The CSAV Directors’ Committee is regulated by Article 50 bis of Law 18,046 (The Corporations Law). Its current members, who have served for the past three years, were elected at the board meeting held on April 29, 2013. At the May 28, 2013 meeting of the Directors’ Committee, Víctor Toledo Sandoval was appointed chairman. The committee also appointed the company’s General Counsel, Pablo Bauer Novoa, as its secretary.
The following members of management also regularly attend and are entitled to participate in Directors’ Committee meetings: Chief Executive Officer, Óscar Hasbún Martínez; Chief Financial Officer, Nicolás Burr García de la Huerta, who was replaced by Rafael Ferrada Moreira; and Controller, Claudio Salgado Martínez (since joining CSAV in April 2015). Likewise, the Deputy Manager of Accounting, Taxes and Management Control, Tomás Tafra Rioja, participates in meetings when the financial statements are reviewed.
For a summarized version of the 2015 management report, see the chapter on general information.
CHAIRMAN Francisco Pérez Mackenna Commercial Engineer Board member since April 2011 Chilean National ID: 6.525.286-4
VICE CHAIRMAN Andrónico Luksic Craig Financial Investor Board member since April 2013 Chilean National ID: 6.062.786-K
BOARD MEMBERS Juan Antonio Álvarez Avendaño Lawyer Board member since March 2011 Chilean National ID: 7.033.770-3
Juan Francisco Gutiérrez Irarrázaval Lawyer Board member since April 2012 Chilean National ID: 6.693.164-1
Hernán Büchi Buc Civil Engineer Board member since April 2012 Chilean National ID: 5.718.666-6
Gonzalo Menéndez DuqueCommercial Engineer Board member since April 2011 Chilean National ID: 5.569.043-K
Arturo Claro Fernández Agronomist Board member since April 1987 Chilean National ID: 4.108.676-9
Christoph Schiess Schmitz Commercial Engineer and Bachelor of Commerce Board member since April 1996 Chilean National ID: 6.371.875-0
Canio Corbo Lioi Civil Engineer Board member since April 2009 Chilean National ID: 3.712.353-6
Víctor Toledo Sandoval Commercial Engineer Board member since April 2011 Chilean National ID: 5.899.818-4
José De Gregorio Rebeco Civil Engineer Board member since April 2012 Chilean National ID: 7.040.498-2
SECRETARY TO THE BOARDPablo Bauer NovoaLawyer Chilean National ID: 7.710.011-3
The composition of the Board has remained unchanged over the last three years.

55
Organizational Chart
Chief Financial Officer
Senior Vice President, Automobiles Comptroller
Senior Vice President, NorgisticsGeneral Counsel
Chief Executive Officer
Board of Directors
Directors’ Committee
Management
KEY EXECUTIVES
Óscar Eduardo Hasbún Martínez Chief Executive OfficerAppointed March 31, 2012Commercial Engineer Chilean Tax ID: 11.632.255-2
Rafael Ferrada Moreira Chief Financial Officer Appointed March 27, 2015 Commercial Engineer Chilean Tax ID: 10.302.911-2
Hernán Martínez FermandoisSenior Vice President, AutomobilesAppointed February 27, 2015Industrial EngineerChilean Tax ID: 14.243.645-0
Pablo Bauer Novoa General Counsel Appointed March 14, 2013LawyerChilean Tax ID: 7.710.011-3

6
ANNU
AL R
EPOR
T
2015
Activities and Businesses
History
Founded in Valparaíso on October 9, 1872, through the merger of Compañía Chilena de Vapores and Compañía Nacional de Vapores, Compañía Sud Americana de Vapores S.A. is one of the world’s oldest shipping companies. Originally, it was the only connection to Chile’s far-removed regions. In 1873, the company began international expansion offering service to Callao, Peru, and later to Panama. After the Panama Canal opened in 1914, CSAV expanded its services to New York, which then intensified with the withdrawal of European shipping companies during World War I.
Following the global economic crisis in 1929, CSAV deployed three aerodynamic vessels in 1938, which enabled it to strengthen its New York service and extend it to Europe. At the end of World War II in 1945, the company experienced vigorous growth and added ports in Germany, Belgium, the Netherlands and England. During this period, the holds in some vessels were converted to refrigerated chambers, enabling the company to transport fruit on its regular services to the United States and Europe.
Sudamericana Agencias Aéreas y Marítimas S.A. (SAAM) was incorporated by the company in 1961 to launch its air and shipping agency business. In 1979, newly issued Decree Law 3,059 (Merchant Navy Law) led to an era of great dynamism and growth for the company’s businesses. New routes were launched in 1984 and its existing services to Northern Europe, the Far East and Japan, the Mediterranean, America, the Pacific and Southeast Asia were modified. Meanwhile, specialized services for refrigerated, vehicle and bulk cargo continued to experience significant growth.
Beginning in the early 1990s, the company enjoyed greater opportunities as most Latin American countr ies opened up their markets. CSAV and its subsidiaries, therefore, increased their business in the region with improved services, new routes and complementary business lines, mostly related to container shipping.
In 1997, CSAV began transporting chemical produc ts wi th in Chi le and to other countries on South America’s west coast.
The company expanded its container shipping business internationally in 1999 and 2000. It acquired a controlling interest in Brazil’s Companhia Libra de Navegaçao S.A. and Uruguay’s Montemar Marítima S.A., which operate in several markets between South America’s east coast, the United States and Europe. Similarly, the company extended its operations to include east-west routes (Asia-Europe, Transpacific and Transatlantic) af ter acquir ing the assets of Norasia Container Lines Ltd. and Norasia China Ltd.
Between 2005 and 2007, CSAV extended its network of own agencies and received 13 container ships under a shipbuilding program of 22 vessels ordered in 2003. It also intensified operations through its subsidiary, SAAM, winning concessions for several Chilean ports.
In 2008, the company began to experience the effects of the most important worldwide crisis since the Great Depression of 1929. As CSAV is a highly-globalized company, it felt severe effects from the significant contraction in global trade, especially in the second half of the year. As a result, in 2009, the company underwent a profound financial
restructuring process, which included a capital increase, renegotiation of shipbuilding contrac ts and addit ional f inancing.
Freight rate margins in 2011, excluding fuel costs, reached their lowest levels on record. At the same time, shipping demand slowed during the year, while CSAV was expanding operations, which aggravated the situation.
In this complex setting, the company prepared plans to financially strengthen and restructure operations. The biggest change began in April 2011, when Quiñenco—a Luksic Group holding company—acquired a stake in the company. Toward the end of the second quarter, the company was jointly controlled by Quiñenco S.A. and the Claro Group’s Marítima de Inversiones S.A., each with approximately 20.6%.
Also in 2011, CSAV received four 8,000-teu vessels from South Korea’s Samsung Heavy Industries and one 6,600-teu vessel from CSBC in Taiwan.
The process of restructuring the company’s operations included streamlining services, s i gn i n g a d d i t i o n a l j o i n t o p e r a t i n g agreements , purchas ing ins tead o f char ter ing vessels and changing the organizational structure. Under the plan, large losses were necessary in 2011 and 2012, but its positive results became apparent in the second quarter of 2012. The restructuring process was completed that year, having successfully met its objectives and transformed CSAV into an efficient operator with a capital and asset structure appropriate to its size.
*1 Twenty-foot Equivalent Unit. Cargo capacity of one standard 20-foot (6.1m) container.
6
Actividades y negocios
6
ANNU
AL R
EPOR
T
2015
7
Activities and Businesses
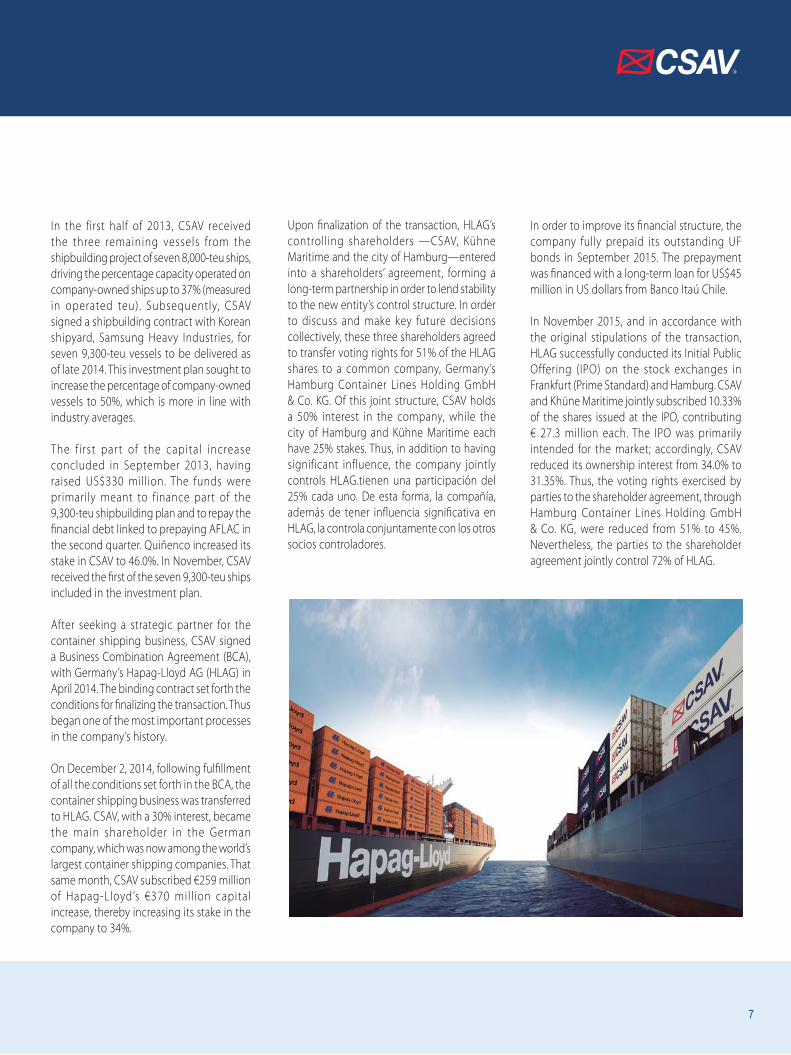
In the first half of 2013, CSAV received the three remaining vessels from the shipbuilding project of seven 8,000-teu ships, driving the percentage capacity operated on company-owned ships up to 37% (measured in operated teu). Subsequently, CSAV signed a shipbuilding contract with Korean shipyard, Samsung Heavy Industries, for seven 9,300-teu vessels to be delivered as of late 2014. This investment plan sought to increase the percentage of company-owned vessels to 50%, which is more in line with industry averages.
The f irst par t of the capital increase concluded in September 2013, having raised US$330 million. The funds were primarily meant to finance part of the 9,300-teu shipbuilding plan and to repay the financial debt linked to prepaying AFLAC in the second quarter. Quiñenco increased its stake in CSAV to 46.0%. In November, CSAV received the first of the seven 9,300-teu ships included in the investment plan.
After seeking a strategic partner for the container shipping business, CSAV signed a Business Combination Agreement (BCA), with Germany’s Hapag-Lloyd AG (HLAG) in April 2014. The binding contract set forth the conditions for finalizing the transaction. Thus began one of the most important processes in the company’s history.
On December 2, 2014, following fulfillment of all the conditions set forth in the BCA, the container shipping business was transferred to HLAG. CSAV, with a 30% interest, became the main shareholder in the German company, which was now among the world’s largest container shipping companies. That same month, CSAV subscribed €259 million of Hapag-Lloyd’s €370 mill ion capital increase, thereby increasing its stake in the company to 34%.
Upon finalization of the transaction, HLAG’s controlling shareholders —CSAV, Kühne Maritime and the city of Hamburg—entered into a shareholders’ agreement, forming a long-term partnership in order to lend stability to the new entity’s control structure. In order to discuss and make key future decisions collectively, these three shareholders agreed to transfer voting rights for 51% of the HLAG shares to a common company, Germany’s Hamburg Container Lines Holding GmbH & Co. KG. Of this joint structure, CSAV holds a 50% interest in the company, while the city of Hamburg and Kühne Maritime each have 25% stakes. Thus, in addition to having significant influence, the company jointly controls HLAG.tienen una participación del 25% cada uno. De esta forma, la compañía, además de tener influencia significativa en HLAG, la controla conjuntamente con los otros socios controladores.
In order to improve its financial structure, the company fully prepaid its outstanding UF bonds in September 2015. The prepayment was financed with a long-term loan for US$45 million in US dollars from Banco Itaú Chile.
In November 2015, and in accordance with the original stipulations of the transaction, HLAG successfully conducted its Initial Public Offering (IPO) on the stock exchanges in Frankfurt (Prime Standard) and Hamburg. CSAV and Khüne Maritime jointly subscribed 10.33% of the shares issued at the IPO, contributing € 27.3 million each. The IPO was primarily intended for the market; accordingly, CSAV reduced its ownership interest from 34.0% to 31.35%. Thus, the voting rights exercised by parties to the shareholder agreement, through Hamburg Container Lines Holding GmbH & Co. KG, were reduced from 51% to 45%. Nevertheless, the parties to the shareholder agreement jointly control 72% of HLAG.
7

8
ANNU
AL R
EPOR
T
2015
Shipping Industry
Global shipping has experienced considerable growth in recent decades, as a result of economic progress and globalization, the development of exports from Asian economies and the deregulation of foreign trade in general, and shipping in particular.
The shipping industry is very competitive and is known for its sensitivity to economic fluctuations. Growth in capacity lags behind the growth in demand and causes high volatility in freight rates and vessel charter rates.
Competition in container shipping
Container shipping began in the early sixties and has grown quickly and steadily since. It is the main method of international transport today, offering a wide and varied range of products. The industry’s development has been heavily influenced by:
a) GlobalizationAn increase in goods sold internationally, service outsourcing and, particularly, relocation of manufacturing to areas with lower production costs (mostly in Asia), has sustained ongoing growth in demand for maritime shipping. Additionally, container shipping has grown in recent years as a result of economic growth and increased production in recently industrialized countries, primarily in Asia and Latin America.
b) Logistical efficiencyContainer shipping reduces transit time, cargo damage and handling costs; shortens the time ships spend in port; and facilitates intermodal transport. Additionally, industry investment in larger ships, ports, intermodal infrastructure, containers and information systems has driven down transportation costs and increased operational efficiency.
c) Innovative solutions for temperature-sensitive cargoSpecialized solutions for temperature-sensitive cargo, like perishables and pharmaceuticals, are another factor behind growth in container shipping. Refrigerated containers offer a high quality, efficient transportation alternative to specialized vessels, which they are replacing.
CSAV Profile
Compañía Sud Americana de Vapores S.A. is a ship-ping company based in Chile. Following a merger in December 2014, it is the main shareholder in German shipping company HLAG-one of the world’s largest container shipping lines.
Founded in 1872, CSAV is a publicly traded company listed on the Chilean stock exchange since 1893.
CSAV conducts its main line of business-container shipping-through its ownership interest in HLAG, which it accounts for using the equity method. As of December 31, 2015, the investment in HLAG represented nearly 80% of the company’s total consolidated assets.
CSAV, the largest shareholder, holds a 31.35% interest in the German company and is party to the shareholder agreement that controls HLAG through a company in which CSAV holds 50%. Thus the company exercises significant influence and joint control over HLAG.
HLAG operates a global network connecting every continent with more than 120 service routes and close to 350 offices in 117 countries. As of year-end 2015, it operated a fleet of 177 container ships with a total capacity of 966,000 teu and a container inventory of more than 1.6 million teu.
CSAV directly provides other maritime transport services, primarily vehicle and liquid bulk cargo, and offers freight forwarder and logistics services through its subsidiary, Norgistics.
Nearly six ships currently operate on CSAV’s three current vehicle transport routes from Asia, Europe and North America to South America (primarily the west coast). Through its subsidiaries, CSAV operates chemical transport services (liquid bulk) on South America’s west coast; it also offers freight forwarder and logistics services for all types of cargo, focusing on trades to and from Latin America.
8
ANNU
AL R
EPOR
T
2015

9
The majority of global trade is conducted via maritime transport, as vessels connect the different continents and markets. Significantly, containers cover a broad spectrum of cargo, from commodities to semi-finished and retail products. Thus, global growth and increased transport volumes are hugely important to the container shipping industry.
The container shipping industry’s world-wide transport volume is correlated to global GDP (gross domestic product). With the exception of 2009 and 2012, growth in container shipping volume has exceeded GDP growth.
Global container shipping markets are typically classified into east-west, north-south and other routes, including intra-Asia. The highest volumes are transported along the east-west and intra-Asia routes. The primary east-west routes are the transatlantic, transpacific and far east. The north-south routes are more fragmented and present more opportunity for high growth and profitability. Among the north-south routes, those connecting Latin America with the rest of the world stand out.
As of the end of 2015, the global container shipping fleet had a capacity of 19.7 million teu. In recent years, the proportion of new shipbuilding orders has remained around 20% of the existing fleet; however, the world-wide fleet was only growing between 6 and 8% annually.
Global Growth in Container Shipments and GDP
(%)
100
150
200
250
300
2000 2001 2002 2003 2004 2005 2006 2007 2008 2009 2010 2011 2012 2013 2014 2015
Source: Clarkson Research, Feb-16
0%
20%
40%
60%
80%
2000 2001 2002 2003 2004 2005 2006 2007 2008 2009 2010 2011 2012 2013 2014 2015 2016 0
5
10
15
20
25
*Growth base of 100 in 2010(1) Source: Clarkson Research, Container Intelligence Monthly, Feb-16
(2) Source: IMF, World Economic Outlook, Jan-16
Global container shipments (TEU) Global GDP
Fleet Orders Ratio of Orders/Fleet
Global Container Shipping Fleet and Shipbuilding Orders
Orders/FleetM
illio
ns o
f TEU

10
ANNU
AL R
EPOR
T
2015
Scrapping vessels is one of the factors keeping the global fleet at reasonable, efficient levels. The new locks at the Panama Canal, scheduled to open in 2016, will make it possible for ships with capacity exceeding 13,000 teu to cross the canal. As a result, less efficient ships, like so-called Panamax ships, with approximate capacity of 5,100 teu, could be scrapped.
Scrapping rates slowed in 2015, partially as a result of slow steaming, a fuel efficiency practice that requires a larger number of ships to maintain the same service frequency.
When the available transport capacity on a route cannot be efficiently utilized, shipping companies tend to delay the departure or trips for their routes, by temporarily removing these ships from service. There was an increase in idle capacity last year, reaching 6.8% of the total fleet in December 2015. The ships included in this figure are primarily 3,000-teu vessels.
16
18
20
22
24
26
28
30
0
100
200
300
400
500
2000
2001
2002
2003
2004
2005
2006
2007
2008
2009
2010
2011
2012
2013
2014
2015
Global Container Ship Scrapping Rates
Source: Alphaliner, Feb-16
Average age (years)
Scrapping Average vessel age
Thou
sand
s of T
EU
0%
3%
6%
9%
12%
15%
0
Idle Container Shipping Fleet
Source: Alphaliner, Feb-16
Thou
sand
s of T
EU
Idle fleet % of total fleet
% of total fleet
Jan-
2010
Mar
-201
0
May
-201
0
Jul-2
010
Aug
-201
0
Oc t
-201
0
Dec
-201
0
Feb-
2011
Apr-
2011
Jun-
2011
Aug-
2011
Sept
-201
1
Nov
-201
1
-201
2
Mar
-201
2
May
-201
2
Jul-2
012
Aug-
2012
Oct
-201
2
Dec
-201
2
Feb-
2013
Apr-
2013
Jun-
2013
Jul-2
013
Sept
-201
3
Nov
-201
3
Jan-
2014
Mar
-201
4
May
-201
4
Jun-
2014
Aug-
2014
Oct
-201
4
Dec
-201
4
Feb-
2015
Apri-
2015
Jun-
2015
Jul-2
015
Sept
-201
5
Nov
-201
5
Jan
500
1,000
1,500

11
In the container shipping industry, costs are primarily related to: fuel, in-port activities, canals and terminals, logistics and container movement, and vessel and container leasing. In recent years, transportation costs had climbed significantly, mainly driven by fuel costs. However, fuel prices began to fall in the second half of 2014, partially offsetting the steady decrease in freight rates.
The challenging market conditions of recent years have caused highly volatile container freight rates, which reached historic lows in late 2015.
In this industry, alliances are a very common. Parties to these cooperation agreements share ship capacity on one or more routes. The four main alliances are 2M, G6, CHYNE and Ocean 3.
The shipping industry has also experienced a trend toward consolidation among its leading companies. In 2014, Hapag-Lloyd and CSAV combined their container shipping businesses, becoming the world’s fourth largest operator. Recently, possible transactions or business combinations between CMA-CGM and APL as well as COSCO and China Shipping Container Lines have been announced.
Alliance Members2M Maersk, MSCG6 Hapag-Lloyd, OOCL, NYK, Hyundai, MOL, APL, COSCOCHYHE K-Line, Yang Ming, Hanjin, EvergreenOcean 3 CMA CGM, CSCL, UASC
Source: MSD Transmodal, Sep-15; Alphaliner, Sep-15
0
200
400
600
800
0
500
[USB/ Ton]
Fuel price (1)Expo Shanghai spot freight ratei (2)
Jan/2
010
Apr/2
010
Jul/2
010
Oct/2
010
Jan/2
011
Apr/2
011
Jul/2
011
Oct/2
011
Jan/2
012
Apr/2
012
Jul/2
012
Oct/2
012
Dec/2
012
Mar/2
013
Jun/
2013
Dec/2
013
Sep/
2013
Mar/2
014
Jun/
2014
Sep/
2014
Dec/2
014
Mar/2
015
Jun/
2015
Sep/
2015
Dec/2
015
1,000
1,500
2,000
(1) Source: Rotterdam Platts Index (2) Source: Shanghai Containerized Freight Index
SCFI and Fuel Prices
US$/
TEU

12
ANNU
AL R
EPOR
T
2015
Competition in other transport services
Vehicle transport is CSAV’s main business within the other transport services segment. Like other areas of maritime transport, this line of business has faced significant volatility since the 2008 financial crisis. Global demand for vehicles has been affected by the economic conditions in different countries and changes in manufacturing countries. In recent years, China has become one of the largest markets for automobile sales as well as one of the world’s main manufacturers.
Supply of vehicle transport services continues to be dominated by Japanese and Korean shipping companies, which together hold about 65% market share.
0 2000 2001 2002 2003 2004 2005 2006 2007 2008 2009 2010 2011 2012 2013 2014 2015
PCC
The global vehicle transport capacity has grown consistently during the last few years, showing decreases only in 2010 and 2011 as a result of the 2008 financial crisis. On the other hand, PCC vessels (Pure Car Carrier) have increased their average size, growing from a capacity of around 4,000 vehicles in 2008 to about 6,000 vehicles in 2015.
World-wide, maritime vehicle trade is estimated at a total of 26.7 million units for 2015, up 1% from 2014, a year of steady volume without major variation. However, imports to South America fell 5%, bringing the four-year cumulative decrease to almost 33%.
The world-wide sluggishness of vehicle transport in recent years contrasts with the strong growth experienced between 2002 and 2007, when annual growth was about 10%. The 2009 global economic crisis brought a collapse of almost 30% in vehicle transport. Due to economic difficulties in several regions, volume still has not returned to pre-recession levels.
Source: Clarkson Research
Average PCC vessel size
Vehicle Transport Capacity in PCC Vessels
Tota
l cap
acity
(tho
usan
ds o
f veh
icle
s)
Total capacity (thousands of vehicles) Average vessel size (number of vehicles)
1,000
2,000
3,000
4,000
5,000
6,000
0
5001,0001,5002,0002,5003,0003,5004,000
Source: Clarkson Research
-40%
-30%
-20%
-10%
0%
10%
20%
30%
2006 2007 2008 2009 2010 2011 2012 2013 2014 2015
p p
Annual growth (%)OtherEurope and Intra-Europe
North AmericaAsiaSouth America
Global Maritime Trade
Thou
sand
s of v
ehicl
es
0
5,000
10,000
15,000
20,000
25,000
30,000

13
After several years of sustained growth, the Chilean and Peruvian markets began to reflect a persistent drop in sales in 2014. This year, sales for light and heavy vehicles are estimated to have fallen 13% and 10%, respectively, below the previous year.
On a global level, the main carriers’ market share—measured in operated capacity in vehicle transport on PCC vessels- remained relatively stable. CSAV’s operated capacity fell due to deteriorated market conditions, thereby reducing its global market share. However, it remained one of the leading carriers in South America’s west coast markets.
Market Share: Vehicle Transport in PCC ShipsDecember 2014 December 2015
Ranking OperatorCapacity
[No. of vehicles] Ranking OperatorCapacity
[No. of vehicles]1 NYK 661,000 17.20% 1 NYK 668,000 16.80%
2 Eukor 553,000 14.40% 2 MOL 573,000 14.40%
3 MOL 498,000 13.00% 3 Eukor 497,600 12.50%
4 K-Line 447,000 11.60% 4 K-Line 471,000 11.80%
5 Glovis 365,000 9.50% 5 WWL 345.000 8.70%
6 WWL 350,000 9.10% 6 Glovis 337,000 8.50%
7 Höegh 248,000 6.50% 7 Höegh 264,000 6.60%
8 Grimaldi 202,000 5.30% 8 Grimaldi 247,000 6.20%
14 CSAV 30,000 0.80% 15 CSAV 22,500 0.60% Source: Hesnes Shipping, Feb-16
231 379
463 506 556 507 439 21
35
43 42
39 31
28
0
100
200
300
400
500
600
700
2009 2010 2011 2012 2013 2014 2015
Light vehicles Heavy vehicles
Vehicle Sales in Chile and Peru
Thou
sand
s of v
ehicl
es
Source: ANAC and ARAPER

14
ANNU
AL R
EPOR
T
2015
Regulatory Framework
Governmental regulation—international treaties, legal standards and each country ’s national regulations—significantly impact the countries where the company operates or has established a presence. However, it is impossible to reasonably quantify the cost of ongoing compliance with these regulations. Nor can their impact on the company’s earnings or the value of its assets and investments, including its interest in HLAG, be measured. Nevertheless, the company expects to be able to retain or obtain the permits and authorizations necessary to operate.
The shipping business in Chile is mainly governed by the following laws:
• Law 18,680 dated January 11, 1988, which replaced the latest version of the Third Book of the Chilean Commercial Code, which was first issued in 1865. The current version of the Third Book was modified by Law 20,667 of 2013, which regulates insurance contracts, and Law 20,720 of 2014, which replaced the existing bankruptcy regime with a law on reorganization and liquidation.
• Decree Law 2,222, dated May 31, 1978, which replaced the existing Navigation Law of 1878. The DL was amended by Law 18,011, dated July 1, 1981; Law 18,454, dated November 11, 1985; Law 18,680, dated January 11, 1988; Law 18,692, dated February 19, 1988; Law 19,929, dated February 11, 2004; and Law 20,070, dated November 8, 2005. These regulations contain standards related to environmental issues, like maritime contamination, among other matters.
• Decree Law 3,059, dated December 22, 1979, containing the new Merchant Navy Law, which includes standards for cabotage reservation and special regulatory and tax standards.
There are also a number of regulations governing various shipping matters, such as shipbuilding and repairs, collision prevention, registering of vessels and marine craft, pilotage and ships’ agents. In environmental matters, in addition to the Navigation Law, Chile has ratified the International Convention for the Prevention of Pollution from Ships of 1973 (MARPOL) and the International Convention on Civil Liability for Oil Pollution Damage (1969) and its 1992 Protocol, even though CSAV does not operate in bulk oil transport services.
Several international provisions apply to aspects of the shipping business. These include environmental regulations referring to shipbuilding and operation, the carriage of goods by sea, responsibility for collisions, salvage of vessels and marine crafts (like those mentioned above and below), anti-terrorism and anti-collusion regulations, and immunities and exemptions. Thus, it is important to note the prohibitions set forth in Articles 101 and 102 of the Treaty on the Functioning of the European Union and block exemptions to these joint agreements or “consortiums” in terms of regulations issued by the European Commission, as well as the standards of the US Shipping Act (1984) and Federal Maritime Commission regulations, to which shipping operations to and from those countries are subject, as well as the United Nations treaty, Convention on a Code of Conduct for Liner Conferences.
Finally, in shipping safety and prevention matters, the safety standards adopted by the UN-dependent International Maritime Organization (IMO) are also relevant, as is the need to submit to inspection and register with classification societies. Ships are required to maintain their class. To do so, they must be maintained according to the rules of the classification society.

15
CSAV in 2015
Income Statement Analysis
In 2015, CSAV recorded a net loss of US$14.7 million, down US$403.4 million from the previous year. The drop is primarily due to the 2014 result of US$388.7 million, reflecting completion of the transaction with HLAG.
The US$6.5 million loss recorded in the HLAG joint venture in 2015 was largely due to the fact that the dilution loss of US$83.9 million exceeded the equity-accounted share of HLAG’s profits and the positive impact of amortization of the Purchase Price Allocation recorded during the year.
CSAV records the equity method value of the results attributable to the owners of HLAG and the effect of the PPA on the initial investment in HLAG, as determined upon closing the transaction on December 2, 2014 (in accordance with IAS 28). HLAG reported profit attributable to the owners of the company of US$123.9 million for the year 2015 and also recognized the positive impact of PPA amortization for the year 2015. The company applied the equity method value to these figures: 34.0% until the third quarter of 2015 and 31.35% after the IPO for the fourth quarter of 2015. Thus, the company recorded US$43.5 million for its share of HLAG’s profit in 2015 and US$ 33.9 million for its share of PPA amortization for the period. This was offset by the US$83.9 million dilution loss.
Revenue from other transport services amounted to US$183.1 million for the year ended December 31, 2015, which represents a drop of US$52.5 million relative to the prior year. This drop is explained mainly by reduced activity and demand for vehicle transport services in markets on the west coast of South America, combined with reduced freight rates in this business. Another
contributing factor stems from the indexation of a portionof freight rates to variations in fuel prices: Recent drops in fuel pr ices have resulted in decreased revenue.
The drop in revenue is also due, although to a lesser degree, to reduced activity in the freight forwarding business as a result of reduced volumes and low container shipping freight rates in South American markets, as well as decreased revenue from the solid bulk transport business reflecting the company’s plans to exit this business. This plan was executed in the third quarter of 2015, with the last bulk carrier being returned to its owners.
Cost of sales amounted to US$180.2 million for the year ended December 31, 2015, which represents a decrease of US$56.9 million over the same period in 2014. This drop in operating costs is in line with reduced market activity as well as CSAV’s smaller scale in the vehicle transport business and, to a lesser extent, to the effects of the freight forwarding and solid bulk transport businesses, as mentioned above. The decrease in cost of sales is also triggered by the lower average fuel prices seen during 2015, which fell close to 42% compared to the same period in 2014. However, as mentioned above, since a portion of sales have fuel price indexation clauses, some of the positive effect on costs was partially offset by reduced revenue.
Administrative expenses totaled US$ 19.7 million; US$15.4 million correspond to the other transport services segment and US$4.3 million to container shipping. The increase of US$0.5 million over the same period in 2014 reflects the costs associated with managing the investment in HLAG.

16
ANNU
AL R
EPOR
T
2015
1616
ANNU
AL R
EPOR
T
2015
Cargo Summary
Year Paying tons (1) Transport volume (teu) (2) Revenue (ThUS$) (3)
Vessel Operating Days (4)
Annual Equivalent Vessels (5)
1999 12,638,896 594,412 1,079,760 22,601 61.9
2000 19,020,536 941,150 1,743,761 26,955 73.9
2001 18,535,821 1,045,388 1,735,112 25,648 70.3
2002 19,134,362 1,086,777 1,674,948 26,431 72.4
2003 20,737,238 1,338,545 2,135,539 28,476 78.0
2004 21,045,372 1,607,083 2,685,886 32,770 89.5
2005 29,805,926 2,075,484 3,901,974 39,118 107.2
2006 31,879,141 2,212,582 3,859,266 40,408 110.7
2007 29,295,480 2,129,040 4,150,992 38,166 104.6
2008 30,008,427 2,191,428 4,886,841 40,751 111.3
2009 24,873,331 1,790,381 3,027,860 39,656 108.7
2010 39,061,840 2,894,164 5,214,623 56,464 154.7
2011 40,518,697 3,127,650 4,795,916 54,170 148.4
2012 27,586,889 1,933,411 3,431,782 28,285 77.5
2013 29,965,546 1,879,260 3,205,950 24,369 66.8
2014* 24,761,364 1,774,150 2,741,455 19,446 57.3
2015 1,141,741 0 183,086 2,991 8.2
*The 2014 data includes eleven months of operations for the container shipping business (retained by CSAV as of December 2, 2014) and twelve months of operations for the rest of the company.
(1) Paying tons: freight charge unit, basically a thousand kilos or, if measured by volume, a cubic meter or 40 cubic feet. This calculation includes all CSAV services (container services, vehicles, refrigerated bulk cargo, dry and liquid bulk cargo).
(2) Transport volume: full containers.(3) Revenue is expressed in nominal terms.(4) Vessel operating days: includes all CSAV services (container services, vehicles, refrigerated bulk cargo, dry and liquid bulk cargo).(5) Annual equivalent vessels: vessel operating days divided by days in the year.

1717
Key Financial Indicators
Statement of Financial Position (US$ million) 2015 (1) 2014 (1) 2013 (1) 2012 (1) 2011 (1) 2010 (1) 2009 2008 2007 2006 2005 2004 2003 2002 2001
Property, plant and equipment 24.7 25.3 1,225.0 1,307.8 1,579.4 1,242.7 664.8 614.6 416.6 280.0 272.1 245.3 272.1 262.3 264.3
Total assets 2,237.0 2,210.6 2,377.1 2,482.6 3,179.5 3,218.2 1,951.8 1,862.3 1,951.4 1,736.5 1,778.3 1,608.9 1,277.9 1,079.5 1,034.4
Total liabilities 176.3 310.7 1,350.4 1,617.1 2,575.2 957.7 1,344.2 1,018.9 1,058.2 975.5 922.9 842.0 687.2 554.4 535.6
Total equity 2,060.7 1,899.9 1,026.7 865.5 604.3 1,387.5 590.6 824.3 879.8 748.2 827.0 746.4 568.6 502.4 482.6
Statement of Income (2) (US$ million) 2015 (1) 2014 (1) 2013 (1) 2012 (1) 2011 (1) 2010 (1) 2009 2008 2007 2006 2005 2004 2003 2002 2001
Revenue 183.1 2,741.5 3,206.0 3,431.8 4,795.9 5,214.6 3,027.9 4,886.8 4,150.9 3,859.2 3,902.0 2,685.9 2,135.5 1,674.9 1,735.3
Cost of sales (180.2) (2,752.2) (3,210.4) (3,388.4) (5,630.5) (4,742.0) (3,357.8) (4,688.6) (3,786.5) (3,794.5) (3,424.5) (2,285.2) (1,862.9) (1,418.6) (1,491.7)
Operating income (loss)(3) (10.2) 641.0 (221.2) (196.8) (1,107.3) 221.2 (599.7) (133.5) 54.1 (232.3) 159.1 140.1 66.5 34.7 19.1
Non-operating income (loss)(4) (7.9) (107.9) (27.5) (44.0) (11.2) (3.4) (107.3) 121.5 99.9 155.5 7.7 88.8 15.0 16.5 16.8
Profit (loss) attributable to owners of the company (14.7) 388.7 (169.0) (313.6) (1,249.8) 170.8 (668.9) (38.6) 116.9 (58.2) 132.3 207.1 72.3 36.8 26.1
Earnings (loss) per share attributable to the owners of the company (US$*100) (0.0) 2.3 (1.1) (3.6) (43.8) 8.4 (44.6) (5.1) 15.9 (7.9) 18.0 28.2 9.8 5.0 3.5
Other Indicators 2015 (1) 2014 (1) 2013 (1) 2012 (1) 2011 (1) 2010 (1) 2009 2008 2007 2006 2005 2004 2003 2002 2001
Return on average assets % (0.7) 17.6 (7.0) (11.1) (39.1) 6.3 (35.1) (2.0) 6.4 (3.3) 7.8 14.3 6.1 3.5 2.5
Return on average equity % (0.7) 20.5 (17.9) (42.7) (125.5) 16.8 (94.5) (4.5) 14.4 (7.4) 16.8 31.5 13.5 7.5 5.4
Current liquidity ratio 1.3 0.4 0.8 0.9 0.6 1.5 0.9 1.4 1.7 1.8 2.0 2.0 1.7 1.4 1.8
Debt ratio 0.1 0.2 1.3 1.9 4.3 1.3 2.3 1.2 1.2 1.3 1.1 1.1 1.2 1.1 1.1
(1) The financial statements for 2010 to 2015 have been prepared under International Financial Reporting Standards (IFRS).(2) The Statement of Income for 2011 has been re-stated, with SAAM considered as a discontinued operation.(3) Operating results for 2001 to 2009 prepared under Chilean GAAP. Operating income (loss) for 2010 to 2015 prepared under IFRS.(4) Non-operating results for 2001 to 2009 prepared under Chilean GAAP. Profit (loss) before tax for 2010 to 2015, less operating income, prepared under IFRS.

18
ANNU
AL R
EPOR
T
2015
Lines of Business
Container Shipping Services
CSAV provides container shipping services through its investment in HLAG. While CSAV has significant influence over and jointly controls HLAG, the joint venture is an independently managed company.
HLAG is a global container shipping company that provides services, directly and through its joint operating agreements, like Grand Alliance and G6. The company’s fleet of 180 container ships totals more than 1.6 million teu.
Its services are categorized into main and feeder lines. Most services are main lines, providing intercontinental transport services on large vessels. Meanwhile feeder lines connect intercontinental service ports with other smaller ports.
HLAG operates an expansive direct network, with service on three major east-west routes: far east (Europe-Asia), transpacific (Asia-North America) and transatlantic (Europe-North America). Beyond the main east-west lines, its extensive list of feeder lines includes: intra-Asia, from and within Latin America, intra-Europe and intra-America (which include lines originally operated by CSAV). It also offers services to and from Africa, Australia and New Zealand. In order to extend coverage to include certain connections not offered by main lines, connections with other carriers are offered and third-party local delivery services are used.
HLAG is also among the world leaders in refrigerated transport, with a large, modern fleet of refrigerated containers and specialized personnel around the world. Global refrigerated cargo strategy and business priorities are coordinated by a team in Hamburg and regional offices. A wide range of technology diversifies the company’s product line, enabling it to offer specialized handling of commodities, like climate control, separation of food and non-food cargo, as well as remote monitoring.
Additionally, since the acquisition of CP Ships Ltd. in 2005, HLAG holds a contract with the United States government that seeks to ensure transport capacity for cargo that must be transferred under the US flag. These ships operate on regular routes on which only a portion of the cargo transported is from the US government.
As of year-end 2015, HLAG had a fleet of 177 container ships with combined capacity of 966,000 teu. Its ships average nearly 5,500 teu, almost 9% above average (calculated on the basis of the world’s 20 largest operators). HLAG owns 54% of its fleet (including ships under finance leases) and currently has ships under construction that are equivalent to nearly 5.4% of transport capacity.
Its fleet of containers, 40% of which are company-owned, has a capacity of more than 1.6 million teu.
HLAG is organized into four regions (Asia, North America, South America and Europe), each of which is divided into areas and sub areas. These units operate to and from one or more locations, with employees at regional offices overseeing the everyday operations required to keep the business running.
HLAG has nearly 350 offices in 117 countries around the world and approximately 9,500 employees (including about 1,500 officers and crew members). A large portion of these areas are served through company-owned agencies; however, external agencies may be used in lower-volume locations. Regional offices are located in Singapore, New Jersey, Valparaíso and Hamburg.
Additionally, HLAG has shared service centers in India and China, which provide support for some of the business’ operating processes.
HLAG currently offers more than 120 services around the world.

19
a) Vehicle and automobile transport
These services operate specialized Pure Car and Truck Carrier (PCTC) vessels which allow vehicles to be driven on and off using ramps (roll on - roll off ). The most important markets for CSAV are Chile and Peru.
The 2015 service structure reflects materialization of joint operating agreements on routes from Europe and the east coast of the United States to the west coast of South America. These agreements aim to mitigate the effects of decreased volume, primarily in the Chilean and Peruvian markets.
Structure of vehicle and automobile transport servicesGeographic Area Services
Asia – West Coast of South America
The service is operated in partnership with Compañía Marítima Chilena S.A. (CMC), Kawasaki Kisen Kaisha Ltd (K-Line) and Nippon Yusen Kaisha Ltd (NYK), through the Shin Nanseikai consortium, with 6,500 and 4,900-RT ships. Serves routes from China and Japan to Chile and Peru.
ast Coast of South America - West Coast of South America
The service is operated independently by CSAV with 4,900-RT ships serving routes from Brazil and Argentina to Chile, Peru and Ecuador..
Northern Europe - East Coast of the USA and Mexico - West Coast of South America
The service is operated in partnership with NYK, with 6,500 and 4,900 RT ships, serving the transatlantic markets (from Europe to the USA), from Europe, the USA and Mexico to the west coast of South America..
Other Transport Services
In 2015, CSAV operates shipping services for vehicles, trucks and automobiles, refrigerated bulk cargo, and liquid and dry bulk cargo.
Services on the west coast of South America
b) Liquid bulk transport These services transport liquid bulk cargo, principally sulfuric acid, on the west coast of South America.
CSAV operates two specialized chemical vessels, Bow Andes and Bow Condor, the latter of which joined the fleet at the end of 2013. They are operated through two subsidiaries, Odjfell y Vapores S.A. and OV Bermuda Limited, in partnership with Odjfell Tankers of Norway.
Connecting South America’s west coast with the world.

20
ANNU
AL R
EPOR
T
2015
c) Solid bulk transport
In 2015, as a result of losses triggered by negative market conditions observed over several years, the company ceased operations in this line of business. It has been reducing its market share and exposure since 2011.
In mid-2015, CSAV returned its final leased carrier—which had, in turn, been subleased to other operators—to the ship’s owner, thus definitively withdrawing from this business.
It is worth noting that CSAV recorded a loss of US$18.7 million in 2014 after selling its full stake in DBHH, a Monaco-based company that operated 11 Supramax bulk carriers.
d) Refrigerated cargo transport
CSAV has operated bulk refrigerated cargo services (on pallets) from Chile to the east and west coasts of the United States on specialized refrigerated ships (reefer vessels). This type of transport has steadily declined around the world as refrigerated containers gain popularity. The available supply of this type of vessel has dropped significantly to adjust to weaker demand.
As a result, CSAV restructured its reefer bulk cargo business in 2015, shifting from a model of operating vessels to a role as logistics broker and freight forwarder through its subsidiary, Norgistics.
e) Freight forwarding and logistics services
CSAV provides freight forwarding and logistics services for all types of cargo through its subsidiary Norgistics, and focuses on trades to and from Latin America.
The subsidiary had primarily operated with CSAV container shipping transport. However, in 2015, it began implementing a plan to develop and expand its operations independently by establishing business relationships with the world’s leading maritime transport companies. Norgistics also has its own network of agents in Chile, China, Mexico and Peru.
Complementary Information
No CSAV suppliers individually represented more than 10% of total purchases during 2015. Similarly, there were no customers who individually represented more than 10% of total revenue last year.
The main brands used by the company in 2015 were: CSAV, Odfjell y Vapores and Norgistics.
The company does not own any patents, licenses, franchises, royalties and/or property concessions; it only holds registered trademarks. In December 2014, the company granted HLAG an indefinite license, without associated royalties, to use the CSAV brand as part of the container shipping business transfered to HLAG.

21
Other Activities
Commercial Management
In 2015, the company worked actively on commercial management, seeking to consolidate and increase its market share in important markets, primarily, vehicle imports to Chile and Peru. As a result of these efforts and the new contracts signed during the year, CSAV managed to keep market share around 15% in those markets.
Information Technology
Given the transfer of the container shipping business at the end of 2014, the main IT challenge for 2015 was preparing, developing and implementing new operations, transactions and accounting systems (ERP). This new IT platform, implemented in January 2016, integrates financial accounting software (ERP SAP) with operating and transactional software suitable to the new reality of CSAV’s shipping businesses. For the freight forwarding and logistics businesses, implementation of an integrated accounting and operating software concluded this year.
Fixed Capital Investment
Regular maintenance was performed in the first quarter of 2015. Bow Andes and Bow Condor, ships specially designed for bulk liquid transport and owned by subsidiaries Odjfell y Vapores S.A. and OV Bermuda Limited, respectively, entered the Valparaíso pier owned by Sociedad de Iberoamericana de Reparaciones Navales (SOCIBER). This process must be performed every two and a half years in order to preserve the ship’s proper operation and useful life.
Other Investments
In September 2015, HLAG informed the market of its intention to register its stock in the regulated market segment on the Frankfurt (Prime Standard) and Hamburg stock exchanges under the local code (WKN) HLAG47 and international code (ISIN) DE000HLAG475.
This process culminated with the IPO on November 6, 2015, fulfilling one of the shareholders’ commitments made as part of the merger of CSAV and HLAG’s container shipping business. Through its IPO, HLAG raised EUR 265 million (equivalent to nearly US$300 million), which will enable it to invest in ships and containers as well as improve its capital structure.
CSAV subscribed 1,366,991 new HLAG shares, equivalent to US$30 million, bringing CSAV’s ownership interest in the German company to 31.35% and maintaining its position as the main shareholder of one of the world’s largest container shipping companies. CSAV’s contribution was funded through a US$30 million loan from its parent company, Quiñenco S.A.
Since the HLAG IPO was primarily directed at the market and CSAV only subscribed 10.33% (less than its ownership interest prior to the IPO), the company reduced its ownership interest from 34.0% to 31.35%. The dilution of its ownership interest in HLAG, in addition to the impact that the prevailing negative conditions on international markets at the time of the IPO had on placement price, resulted in an accounting loss of US$83.9 million for CSAV.
Financing
Chilean and international financial markets experienced significant volatility in 2015.
This year, CSAV successfully completed the capital increase begun in 2014.The company refinanced its bonds in UF and funded its participation in the HLAG’s IPO on the German stock market using the following types of financing:
a) The US$ 400 million capital increase approved at the August 2014 shareholders’ meeting began in December 2014. The processes ended successfully in February 2015 after raising US$396 million, US$165 million of which was subscribed in 2015. In December 2014, funds from this capital increase were used to subscribe EUR 259 million of the capital increase in HLAG (of EUR 370 million total) following the merger of the container shipping business and to cover costs related to the transaction. Following this capital increase, CSAV’s stake in the German shipping company rose from 30% to 34%.
b) In the context of the transaction with HLAG, CSAV signed a US$50 million loan with Itaú Unibanco S.A. in June 2014. Then, in November 2014, CSAV secured a line of credit of up to US$180 million with the same bank. As of December 2014, it had drawn down US$74.36 million from that line, as a bridge loan to finance the capital increase in HLAG in December 2014. In February 2015, both debts to Itaú Unibanco S.A., totaling US$124 million, were repaid with funds from the CSAV capital increase, which ended in February 2015.

22
ANNU
AL R
EPOR
T
2015
In ChileBanco de Chile Scotiabank SudAmericanoBanco Itaú Banco Santander ChileHSBC Banco SecurityBanco Bice JP Morgan
AbroadCitibank N.A. HSBCItaú Unibanco S.A. BNP Paribas S.A.DNB Bank ASA Goldman Sachs
c) In July 2015, CSAV’s Board of Directors authorized full prepayment of the UF-denominated, Series A bonds on the local market. The Company prepaid the bonds in September 2015 by drawing down its full US$45 million line of credit from Banco Itaú Chile in August 2015. This new loan improved the term of the financing and eliminated foreign exchange rate risk.
d) In October 2015, CSAV subscribed a line of credit with Quiñenco S.A. for up to US$30 million. The line of credit was drawn down entirely in November 2015 to finance the subscription of 1,366,991 shares for a total of EUR 27.34 million at the HLAG IPO on the Frankfurt and Hamburg stock exchanges.
The main banks that operate with CSAV and subsidiaries:
Risk Factors and Management
CSAV’s investment in Hapag-Lloyd is its main asset and, although the market risks facing the container shipping business do not directly affect the company, they could indirectly impact it if they affect: CSAV’s investment in the joint venture, future dividends from the company and, consequently, the equity or results for the period. Therefore, even though CSAV contributed its entire container shipping business to HLAG in 2014, the main market risks are still related to the container shipping business segment. HLAG has an independent management team that controls and manages its risks autonomously and in accordance with the standards of a publicly-listed and regulated company in Germany.
Market Risk
In the direct operation of its retained business (other transport services segment), the principal risks that CSAV faces stem
from the possibility of deteriorating demand for transport, anincrease in the supply of transport capacity, a drop in rates and a rise in oil prices. Variation in interest and exchange rates are other market risk factors faced by the company.
In terms of demand for maritime transport services, the main risk comes from the global economic situation and the impact of global slowdown on the company’s current routes, especially on the South American routes. Slowed economic development in South America would lead to lower demand for maritime transport services, which could affect the company’s operations and accentuate competition in the industry.
In the vehicle transport business (the primary service operated and possibly the most exposed to market conditions), demand is highly concentrated. Globally, the customers are almost exclusively the vehicle manufacturers themselves. In order to mitigate fluctuation in demand for services, the company holds contracts with a significant portion of its customers that include freight rates that are either fixed or indexed to variations in fuel prices.
In terms of supply, there is a risk that new ship construction will exceed future demand and thus produce an imbalance in shipping companies’ operated capacity. Excess capacity can negatively impact freight rates and asset usage. CSAV maintains a product offering in line with market demand and its customer needs. In order to adapt supply, the company operates a flexible fleet of ships, with leasing contracts offering a wide range of terms. Consequently, the greatest challenge facing the company is establishing a fleet strategy (company-owned or leased) that is coherent with the market’s variable freight rates. Since the price of fuel is one of the main costs associated with maritime transport, price fluctuations directly impact the industry’s financial performance. The price of oil has dropped considerably since the last quarter of 2014; however, it continues to be volatile.
A portion of the CSAV freight sales are indexed to fuel price variations. The company takes out fuel price hedges for other, fixed-price sales. CSAV takes out fuel price hedges for those transport contracts with terms and conditions of sale that allow for an adequate hedge.

23
The company cannot ensure that the hedges will completely mitigate the negative impact of a rise in fuel prices or bunker adjustment factor or other price variations that affect performance, like foreign exchange or interest rates.
In terms of interest rate risk, as of December 31, 2015, all of the company’s liabilities were at floating, LIBOR-indexed rates. The LIBOR has remained stable, although the future curve indicates a slight upward trend.
The majority of the company’s revenue and operating costs are expressed in US dollars (the CSAV Group’s functional currency). For certain significant operations in other currencies, the company has used interest rate hedges.
Furthermore, the company reduced its exposure to variations in the foreign exchange rate by fully prepaying its UF bonds (exposed to the variation in the Chilean peso), positively affecting exchange differences for 2015. CSAV also maintains a financing structure in Euros with the subsidiary that holds the investment in HLAG. Thus, variation in the exchange rate of the Euro can positively or negatively affect results and deferred tax assets.
Risks inherent to the line of business
The risks inherent to the line of business are primarily related to the processes of operating ships, the company’s joint services and commercial activities, as well as personnel and related assets. Environmental impact and regulatory changes in the markets where it operates also pose risks to the business.
The risks of operating ships include the possibility of accidents and maritime disasters with environmental consequences, death, loss or damage to property and cargo, among others. These can be caused by mechanical failures, human error, war, terrorism, piracy, adverse weather conditions, stoppages and other problems with workers who provide in-port services, especially those who are unionized or part of collective bargaining agreements or contracts.
CSAV has joint operating agreements with other shipping companies. These agreements allow it to offer customers a geographic scope and departure frequency that would be impossible using only its own fleet of operated ships. However, if these agreements were to change or end, there are risks that have the potential to adversely affect business.
The company operates in numerous countries and is, therefore, exposed to risks related to strikes, political instability and other events that could lead to business interruptions or asset deterioration (company-owned or leased). Such events could result in partial or total closure of ports or waterways, like the Panama Canal.
Transport operations to and from the Chilean and Peruvian markets are also associated with economic conditions in those markets. Future development of the Chilean and Peruvian economies could adversely affect and endanger the company’s ability to continue providing efficient, competitive services. Activity is subject to the impact of governments on many aspects of the private sector—changes in tax, labor, monetary and other types of policy—which impact domestic economies. CSAV does not control and cannot predict how intervention and government policies will affect the economy of the countries where it operates, like Chile or Peru.
As a shipping company, CSAV is subject to a wide variety of laws, regulations as well as national and international agreements related to operating permits and environmental requirements for shipping activities. These laws, regulations and agreements can change substantially, affecting the company’s performance and ability to comply.
CSAV is currently under investigation for infringements to free trade regulations (filed in several material events beginning September 14, 2012) and is subject to the impact these proceedings could have in the different jurisdictions where the company’s vehicle transport business operates. In 2013, CSAV’s Board of Directors established a US$30 million provision for future amounts the company will have to pay as a result of these proceedings.
As of year-end 2015, the company had been fined in some jurisdictions in the United States, Brazil, China and South Africa. In Chile, it is exempt from fines due to the provisions set forth in article 39 bis of DL211 (for more detail regarding these investigations, see note 36 (b) of the attached financial statements). The remainder of the provisioned amount continues to be an estimation of these disbursements, calculated under fair value criteria and current accounting regulations.

24
ANNU
AL R
EPOR
T
2015
containing important information for investors, which is regularly updated and allows subscribers and the market in general to be constantly informed about the company’s development.
The company also publishes a quarterly Investor Report, which analyzes the results and material events for the quarter.
Since 2014, quarterly presentations have been made via the web. The Chief Executive Officer and Chief Financial Officer at CSAV explain the quarterly results and respond to questions from investors and analysts following the company.
Operations and Logistics
Shipping operations
Due to deteriorated market conditions in 2015, vehicle transport and liquid bulk operations focused on improving efficiency in fleet use and operating costs. The main objective was to maintain a service offering and scale of operations in accordance with market demand; consequently, it reduced the number of ships operated and focused on seeking joint operating agreements.
In recent years, CSAV has implemented operating practices, like slow steaming, adapting MDO (Marine Diesel Oil) fuel consumption on several legs of its routes to meet the environmental regulations of the different countries.
ISO Certifications
Given the structural changes to the company in 2014 as a result of the transaction with HLAG and the existence of IS0 9001 and 14001 at that time, CSAV had to consider modifying the scope of its integrated management system in 2015.
As a result and in order to continue guaranteeing customers internationally recognized services, it established a new scope of operations: managing international maritime transport of vehicles from the port of origin to the destination port.
This change was reported to LRQA, the certifying body. The QMS maintenance, EMS and scope reduction audits were performed in October. In the auditor’s opinion, the management system was adequately maintained and in the process of adapting the organization’s new structure and size.
Risk Management Mechanisms
CSAV manages its own risks related to internal processes, like operating, financial and management risks, primarily through a program that includes internal and independent audits as well as management policies and procedures.
The internal audit plan was updated to reflect CSAV’s new business reality. This was a two-phase process: defining comprehensive risk management policies and creating a risk matrix for the company. The first phase ended in 2015, with definition and board approval of the general guidelines for comprehensive risk management. The second phase, creation of a risk matrix and operational flow charts, will be finalized in the second half of 2016.
CSAV has an insurance plan to protect its own fleet, with policies covering hull and machinery, war, strike and other maritime risks. Likewise, it includes the necessary protection and indemnity insuranceto cover potential liability for damage to cargo, bodily injury for crew members, damage to third parties and liability for pollution, among others, like coverage for the company’s other fixed assets.
Risk Rating
To improve its financing structure and reduce exposure to exchange rate fluctuations, on September 10, 2015, the company prepaid the UF-denominated bonds issued in 2003. The prepayment was financed with a long-term, floating rate loan in US dollars from Banco Itaú in the amount of US$45 million.
In 2015, Feller Rate Clasificadora de Riesgo Ltda. raised CSAV’s solvency rating from BB+ (2014) to BBB- with a stable outlook. Subsequently, Fitch Ratings, which replaced Humphreys Limitada among the company’s risk raters, also assigned a BBB- with a stable outlook, thereby ratifying Feller Rate’s rating.
This year, CSAV voluntarily submitted to risk rating by an international firm. Standard & Poor’s also improved its rating from the prior year’s B- to a B+ with stable outlook in 2015, reflecting clear expectations of improved cash flows and debt structure for the company.
Investor Relations
The company created an investor relations department in 2009, to provide fluid information to the market and ensure process transparency. Its website (www.csav.com) has since added a section

25
The audit recommendation was to renew ISO 9001:2008 and ISO 14001:2004 certification.
CSAV leases the operated fleet it uses for vehicle transport. As such, the company does not have assets invested in ship ownership. Likewise, the company provided its refrigerated cargo services in leased reefer vessels.
For liquid bulk cargo, the company operates two subsidiary-owned vessels.
Own vessel operating days
The fleet owned by the company and its subsidiaries had a consolidated total of 737 available days in 2015, and was available for commercial operations for 686 days, equivalent to 93.1% of total available time. During the period, 51 days were used for normal maintenance tasks-scheduled dry-dock repairs performed on its two liquid bulk cargo ships.
Own vessel management
Southern Shipmanagement (SSM), an HLAG subsidiary with 33 years of experience specializing in this business, provides technical management of the company’s fleet.
This technical operator has documented management systems that are subject to constant revision and have compliance certification with the International Management Code for the Safe Operation of Ships and for Pollution Prevention (ISM Code) issued by the International Maritime Organization and the International Ship and Port Facility Security (ISPS) Code. They also have their procedures audited and certified according to the international quality standards ISO 9001-2008 and ISO 14001:2004.
All of this results in a highly efficient operation with great technical reliability, which provides operational security and protection to vessels and reliable service for customers.
Liquid bulk transport ships Bow Andes and Bow Condor
The CSAV Fleet, including subsidiaries, as of December 31, 2015
Vessel Owner%
OwnershipDwt(*)
(tons) Type of VesselGRT
(tons)Speed (knots) Year Built
Bow Andes Subsidiary 51% 16,020 Chemical Carrier 9,549 14.4 2000
Bow Condor Subsidiary 50% 16,121 Chemical Carrier 9,208 13.5 2000
(*) Dwt is the vessel’s dead weight, measured in tons.(**) GRT: Gross Registered Tonnage

26
ANNU
AL R
EPOR
T
2015
Personnel Management
Creating a new organizational structure in accordance with CSAV’s new business reality was the main challenge facing the personnel area in 2015. Furthermore, CSAV relocated its headquarters from Valparaíso to Santiago. The tremendous commitment of all the employees enabled this objective to be achieved.
Accrued remuneration for the company’s key senior executives in 2015 totaled US$2,870,018, including US$1,248,714 in variable remuneration and bonuses paid during the year. On the other hand, remuneration received by key senior executives in 2015 reached US$2,070,018, which includes US448,714 in variable remuneration.
In 2014, remuneration expense for the company’s key senior executives (excluding December 2014 for personnel corresponding to the container shipping operations transfered to HLAG) totaled US$9,358,730, US$4,284,645 of which was variable remuneration. On the other hand, remunerations received during the year totaled US$11,467,116, which includes US$6,393,031 in variable remuneration.
Variable remuneration is subject to performance targets and commercial, operating and financial indicators. It is granted to those executives who directly impact those targets and is set by the company’s Board of Directors.
Managers and Key
Executives
Professionals and
TechniciansEmployees
(Chile) Total
CSAVChilean 5 51 0 56Foreign 0 2 0 2
Total 5 53 0 58
Subsidiaries Chilean 1 40 0 41Foreign 0 63 0 63
Total 1 103 0 104
TotalChilean 6 91 0 97Foreign 0 65 0 65
Total 6 156 0 162
CSAV Global StaffCSAV and subsidiary staff was 162 as of December 31, 2015.
26
ANNU
AL R
EPOR
T
2015

27
Diversity
The composition of CSAV personnel as of December 31, 2015, is shown below:
Gender Age Nationality Years of Service
M F < 30 30 to 40
41 to 50
51 to 60
61 to 70 > 70 Chilean Foreign < 3 3 to
66 to
99 to 12 > 12
Senior Management 6 0 0 0 5 0 1 0 6 0 2 2 0 1 1Personnel 76 80 44 80 19 8 5 0 91 65 106 23 9 3 15
Total 82 80 44 80 24 8 6 0 97 65 108 25 9 4 16
The composition of the company’s Board of Directors is as follows:
Gender Age Nationality Years of Service
M F < 30 30 to 40
41 to 50
51 to 60
61 to 70
> 70 Chilean Foreign < 3 3 to
66 to
99 to 12 > 12
CSAV Board of Directors 11 0 0 0 0 5 4 2 11 0 1 7 1 0 2
Salary Gap by Gender
The following table shows the portion of the average gross base salary earned by women relative to men at each responsibility level within the company.
PositionSenior Management Not applicableDeputy Managers Not applicableArea Heads and Senior Specialists 74.4%Supervisors and Specialists 79.8%Coordinators 101.5%Administrative personnel 93.2%
Total 90.5%
This analysis does not apply to senior and deputy management levels as no women hold these positions.
27

28
ANNU
AL R
EPOR
T
2015
General Information
Ownership, Stock Performance and Other Related Matters Shareholders
The company had 30,696,876,188 single series shares, all fully subscribed, paid, and distributed among 3,538 shareholders, as of December 31, 2015. Of these, 4,851,373,731 were subscribed and paid in 2015 as part of the US$400 million CSAV capital increase concluded on February 3, 2015, giving a total of 11,644,000,001 subscribed and paid shares.
In 2015, the company’s capital was legally reduced by 416,497,180 shares, in conformity with the provisions of article 27 of the Corporations Law and 62 of the Corporations Regulation. These treasury shares, acquired when dissenting shareholders exercised their appraisal right as a result of the agreement adopted at the extraordinary shareholders’ meeting on March 21, 2014, had been owned for a year without being sold.
The company’s 12 largest shareholders, as of December 31, 2015, were as follows:
Shareholder Number of Shares Ownership Interest (%)
Inversiones Rio Bravo S.A. 10,357,358,400 33.74%Quiñenco S.A. 6,244,061,051 20.34%Marítima de Inversiones S.A. 1,993,930,139 6.50%Banco Itaú on behalf of foreign investors 1,936,681,899 6.31%Banco de Chile on behalf of non-resident third parties 1,358,623,066 4.43%BTG Pactual Chile S.A. C de B 1,266,641,802 4.13%Bolsa de Comercio de Santiago Bolsa de Valores 582,385,186 1.90%Inmobiliaria Norte Verde S.A. 580,048,910 1.89%Moneda S.A. AFI for Pionero Investment Fund 476,520,000 1.55%Banchile C de B S.A. 428,473,812 1.40%AFP HABITAT S.A. for Pension Fund C 424,537,335 1.38%Philtra Limitada 396,248,570 1.29%
Control
As defined in Chapter XV of Law 18,045, the Luksic Group exercises control over the company through the companies Quiñenco S.A. and its subsidiaries, Inversiones Río Bravo S.A. and Inmobiliaria Norte Verde S.A. As of December 31, 2015, its ownership interest totaled 55.97%.
Shareholder Number of Shares Ownership Interest (%)Inversiones Rio Bravo S.A. 10,357,358,400 33.74%Quiñenco S.A. 6,244,061,051 20.34%Inmobiliaria Norte Verde S.A. 580,048,910 1.89%Total 17,181,468,361 55.97%

29
81.4% of Quiñenco S.A. is owned by Andsberg Inversiones Ltda., Ruana Copper A.G. Agencia Chile, Inversiones Orengo S.A., Inversiones Consolidadas Ltda., Inversiones Salta S.A., Inversiones Alaska Ltda., Inmobiliaria e Inversiones Río Claro S.A. and Inversiones Río Claro Ltda. The Luksburg Foundation indirectly controls 100% of Andsberg Inversiones Ltda., 100% of Ruana Copper A.G. Agencia Chile and 99.76% of Inversiones Orengo S.A.
Andronico Mariano Luksic Craig (Chilean National ID 6.062.786-K) and family control 100% of Inversiones Consolidadas Ltda., Inversiones Salta S.A. and Inversiones Alaska Ltda. Andrónico Luksic Craig’s family holds 100% in Inversiones Salta S.A. Inmobiliaria e Inversiones Río Claro S.A. and Inversiones Río Claro Ltda. are indirectly controlled by the Emian Foundation, in which the successors of the Late Mr. Guillermo Antonio Luksic Craig† (Chilean National ID 6.578.597-8) have interests.
There is no shareholder agreement between the controllers of the company.
Shareholding
As of December 31, 2015, Vice Chairman Andrónico Luksic Craig held stakes in CSAV through the companies with controlling interests in CSAV. Director Christoph Schiess Schmitz had a 1.83% interest in CSAV through various legal entities. Directors Juan Antonio Alvarez Avendaño, Arturo Claro Fernandez and Francisco Perez Mackenna directly and indirectly hold 15,455,828; 44,628 and 41 shares, respectively.
The other senior executives do not own shares in the company.
Stock Market Statistics
The company’s shares are traded on the Santiago Stock Exchange, the Chilean Electronic Exchange and the Valparaíso Stock Exchange.
Quarterly market trading statistics
Year Number of Shares Traded Trading Value (Ch$) Average Price
(Ch$/share)Market Presence
(%):2013First Quarter 1,119,936,200 57,051,912,847 50.94 100.00%Second Quarter 575,401,062 23,582,748,581 40.98 99.44%Third Quarter 2,744,571,635 68,915,005,629 25.11 99.44%Fourth Quarter 1,150,593,578 29,874,111,912 25.96 98.89%2014First Quarter 898,393,893 25,588,601,659 28.48 98.89%Second Quarter 775,735,631 20,377,269,993 26.27 96.67%Third Quarter 1,035,409,424 26,381,802,147 25.48 96.11%Fourth Quarter 537,646,459 12,308,981,751 22.89 95.56%2015First Quarter 2,002,916,699 44,117,226,345 22.03 97.78%Second Quarter 707,796,830 16,164,329,490 22.84 98.89%Third Quarter 1,439,572,869 28,053,377,344 19.49 99.44%Fourth Quarter 1,296,508,127 21,168,624,539 16.33 99.44%
Source: DCV

30
ANNU
AL R
EPOR
T
2015
Dividend Policy
At the ordinary shareholders’ meeting held on April 16, 2004, the shareholders established a dividend policy of distributing 30% of earnings. This policy was also reconfirmed at the ordinary shareholders’ meetings held on April 15, 2005, April 19, 2006, April 24, 2007, April 25, 2008, April 21, 2009, April 16, 2010, April 8, 2011, April 20, 2012, April 29, 2013, April 25, 2014, and April 24, 2015. These meetings also authorized the Board to define the timing and value of interim dividends.
Dividend Payments
No dividends have been paid in the last three years.
Profit Distribution
The loss attributable to owners of the parent company for the year ended December 31, 2015, was US$14,654,224. Given the loss recorded for the year, the company recorded a negative balance of US$1,160 million in distributable net profits for the year ended December 31, 2015.
Equity
CSAV’s equity as of December 31, 2015, was as follows:
Issued capital US$ 3,201,791,515Retained earnings (accumulated losses) US$ (1,160,265,297)Treasury shares US$ -Other reserves US$ 903,661Total US$ 2,042,429,879
According to these figures, the book value of each share was US$0.0665 as of December 31, 2015.
Board Compensation
At the ordinary shareholders’ meeting held on April 24, 2015, shareholders agreed to a UF 100 per meeting fee for attendance at board meetings, with a maximum of one meeting per month, except for the chairman who receives double that of a director. As of January 1, 2015, 3% of distributed dividends for 2015 would be shared by the Board, either as a minimum mandatory or additional dividend. Without a minimum or maximum, this sum is to be distributed in equal shares amongst the directors, except for the chairman who would receive double the amount payable to each director. Therefore, each director shall receive one twelfth of that 3%, and the chairman two twelfths.
In the event of a change in the composition of the Board of Directors, the aforementioned 3% of dividends will be proportionally distributed between the former director and his/her replacement according to the number of months that each held the position.
30
ANNU
AL R
EPOR
T
2015

31
Each director on the Directors’ Committee receive an attendance fee of UF 33.33 for each committee meeting attended and a variable amount of one third of the distributed dividends payable to him as director for the year, i.e. his twelfth, plus a third of his twelfth.
The annual operating budget for the Directors’ Committee and its advisors, is equal to the sum of its members’ annual compensation.
The total amount paid by CSAV in fees, profit sharing and other compensation during 2015 is detailed as follows:
Board of Directors’ Compensation, 2015-2014
Chilean National ID Director Attendance Fee Variable Portion Special Allowance Annual Total2015 2014 2015 2014 2015 2014 2015 2014US$ US$ US$ US$ US$ US$ US$ US$
7.033.770-3 Juan Antonio Álvarez Avendaño 46,020 50,360 166,667 - - - 212,687 50,360 5.718.666-6 Hernán Büchi Buc 46,020 50,393 166,667 - - - 212,687 50,393 4.108.676-9 Arturo Claro Fernández 42,094 46,287 166,667 - - - 208,761 46,287 3.712.353-6 Canio Corbo Lioi 49,913 50,414 166,667 - - - 216,580 50,414 7.040.498-2 José De Gregorio Rebeco 46,087 50,361 166,667 - - - 212,754 50,361 6.693.164-1 Juan Francisco Gutiérrez Irarrázaval 38,372 42,180 166,667 - - - 205,039 42,180 6.062.786-K Andrónico Luksic Craig 30,474 16,932 166,667 - - - 197,141 16,932 5.569.043-K Gonzalo Menéndez Duque 48,698 46,275 166,667 - - - 215,365 46,275 6.525.286-4 Francisco Pérez Mackenna 92,081 100,786 333,333 - 456,341 - 881,755 100,786 6.371.875-0 Christoph Schiess Schmitz 30,554 37,590 166,667 - - - 197,221 37,590 5.899.818-4 Víctor Toledo Sandoval 44,651 50,396 166,667 - - - 211,318 50,396
Total 514,964 541,974 2,000,000 (1) - 456,341 - 2,971,305 541,974
Note (1): This amount corresponds to the variable portion of the Board of Directors’ annual compensation. At the ordinary shareholders’ meeting on April 25, 2014, it was agreed that the Board’s participation in net profit for 2014, reflected herein on a cash basis, would be a maximum of US$2 million. At the time of payment, the company’s disbursement for this profit sharing exceeded the aforementioned US$2 million maximum by US$12,044. This is explained by variations in the observed dollar exchange rate between April 24, 2015, the date of the ordinary shareholders’ meeting where 2014 earnings were approved, and April 27, 2015, the date of payment in Chilean pesos.
Advisors to the Board
Advisor Type of Advisory ServiceAmount Paid
2015 2014US$ US$
Alberto Aleman Zubieta Advisory services for the Board 80,000 90,000Total 80,000 90,000
Directors’ Committee Compensation, 2015 and 2014
Chilean National ID Director Attendance Fee Variable Portion Special Allowance Annual Total2015 2014 2015 2014 2015 2014 2015 2014US$ US$ US$ US$ US$ US$ US$ US$
3.712.353-6 Canio Corbo Lioi 12,712 17,815 55,556 - - - 68,268 17,815 5.569.043-K Gonzalo Menéndez Duque 13,947 20,771 55,556 - - - 69,503 20,771 5.899.818-4 Víctor Toledo Sandoval 13,947 20,758 55,556 - - - 69,503 20,758
Total 40,606 59,344 166,667 (2) - - - 207,273 59,344
Note (2): This amount corresponds to the variable portion of Directors’ Committee’s annual compensation: participation in net profit for 2014, as agreed at the ordinary shareholders’ meeting on April 25, 2014 and reflected herein on a cash basis. At the time payment, the company’s disbursement for this profit sharing was US$1,004 greater. This is explained by a variation in the observed dollar exchange rate between April 24, 2015, the date of the ordinary shareholders’ meeting where 2014 earnings were approved, and April 27, 2015, the date of payment in Chilean pesos.

32
ANNU
AL R
EPOR
T
2015
Activities of the Directors’ Committee
During 2015, the committee held fourteen meetings, numbered 159 to 172 inclusive. The matters addressed were as follows:
1. Meeting 159, held on January 29, 2015. Approved the annual report on the committee’s performance during 2014. Reviewed the selection and hiring process for CSAV’s new controller and recommended coordinating activities with HLAG and complementing the control systems and risk matrices of both companies. Heard reports on management’s activities related to the Company being subpoenaed by the National Economic Prosecutor’s Office to appear before Chile’s Antitrust Court, as a result of the investigation into the car carrier business, which began in September 2012 and in which the company is collaborating. Reviewed the 2014 accounting close process, including provisionally determining the accounting profit of the transaction with HLAG.
2. Meeting 160, held on February 26, 2015. Reviewed the main aspects of the process to determine the fair value of the assets, liabilities and equity of HLAG (Purchase Price Allocation or PPA), according to a report from PricewaterhouseCoopers, as related to the 2014 accounting close process. Reviewed the proposals from external audit firms (KPMG, EY and PwC) for the 2015 audit. Formulated observations to the proposal regarding matters like audit hour estimates, total price and safeguards to independence to be clarified by management in the next session. Examined proposals from risk rating agencies. The committee agreed to recommend that the Board of Directors propose Fitch Ratings and Feller-Rate at the next ordinary shareholders’ meeting. Heard presentations on the change of IT system for CSAV’s retained businesses, for data archiving, shipping and operating services and the financial-accounting system. Heard a report on certification of CSAV’s crime prevention model under Law 20,393, which was granted by BH Compliance for a period of two years.
3. Meeting 161, held on March 19, 2015. The Consolidated Financial Statements for the year ended December 31, 2014, were analyzed, prior to their presentation to the shareholders at the ordinary shareholders’ meeting for 2015. The committee received representatives from the external audit firm KPMG, who responded to inquiries from the directors about the financial statements. Deliberations continued regarding the proposal of an external audit firm to the Board of Directors. They agreed to recommend KPMG and, as an alternate, Ernst & Young, so that the Board could present its proposal at the ordinary 2014 shareholders’ meeting. Related-party transactions conducted under the policy for customary transactions were reported upon.
4. Meeting 162, held on April 22, 2015. The committee reviewed the economic conditions of the temporary contracts between CSAV (and subsidiaries) and HLAG (and subsidiaries). As part of the process of combining the container shipping business, the contracts establish services and payments between related parties. Examined, as a related-party transaction referred to in Title XVI of Law 18,046, the background information and conditions related to proposing additional compensation for the Chairman of the Board and an additional bonus for the Chief Executive Officer in the amount of UF 12,500 each. Established the targets and objectives tied to payment, the most important of which is the successful integration of the container shipping business with HLAG and harnessing synergies in the combined entity. The committee deemed necessary the hiring of external audit firm, KPMG, to conduct a special audit of payments made to CSAV managers and executives (senior executives) in recent years.
5. Meeting 163, held on May 15, 2015. Reviewed and approved the 2015 internal audit plan, presented by the controller. The plan focuses on CSAV’s critical processes, including hiring external auditors to audit third-party agencies. The plan also includes creation of a new risk matrix and management system at CSAV. Reviewed the Interim Consolidated Financial Statements as of March 31, 2014, and their notes, particularly those related to the announcement of results in two business segments, container shipping and other transport services, including all the retained operations like those related with accounting for the results of the investment in HLAG.
6. Meeting 164, held on June 24, 2015. Reviewed the related-party transactions conducted in accordance with the CSAV customary transactions policy as of March 31, 2015. Heard a presentation on the internal audit of the fuel purchasing process, progress on the private payroll audit and creation of the new risk matrix, among other matters.
7. Meeting 165, held on July 29, 2015. Heard KPMG’s presentation of the conclusions of the special audit of private payroll, which determined that payments to managers and senior executives had been legitimate and authorized. Heard a presentation on the legal contingencies (lawsuits) against the company and its subsidiaries as of June 30, 2015, and the corresponding provisions made when appropriate. Heard a presentation on the internal audit of Norgistics accounts receivable and progress on the risk matrix for the investment in HLAG and vehicle transport.
8. Meeting 166, held on August 27, 2015. Reviewed the Interim Consolidated Financial Statements as of June 30, 2015, their notes and the Independent Auditors’ Report, including the presentation by

33
12. Meeting 170, held on November 19, 2015. Reviewed the Interim Consolidated Financial Statements as of September 30, 2015 and their notes. Heard a presentation by representatives from external audit firm, KPMG, on the scope of the audit plan and work plan through the end of the audit, which includes an audit of significant accounting entries, like impairment testing on the investment in HLAG, given the market value reached at the IPO. The Controller presented progress on the 2015 audit plan, reports issued and those being drafted, as well as other projects in which the Division of the Controller is involved, including the new risk matrix and risk management with Coso ERM, on which Deloitte is consulting.
13. Meeting 171, held on December 16, 2015. Reviewed a letter from KPMG to management, in relation to internal control over the preparation and presentation of financial information for the audit of the Consolidated Financial Statements as of December 31, 2015. KPMG executives also made a presentation to the Committee regarding this matter. The letter reported that no important weaknesses or significant deficiencies had been detected in relation to accounting practices, maintenance of an effective accounting management system or maintenance of an internal control system. At the same meeting and in compliance with the Board’s request of the committee and director Juan Francisco Gutiérrez Irarrázaval, in session No. 5688 on November 20, 2015, the committee conducted a preliminary assessment of CSAV’s corporate governance practices, those CSAV intends to adopt, those it is in the process of adopting and those it has not adopted because the company does not deem them appropriate or desirable given the current characteristics of CSAV’s business. All of the aforementioned assessments are based on the corporate government practices detailed in SVS General Character Standard No. 385, dated June 8, 2015.
14. Meeting 172, held on December 21, 2015. Reviewed CSAV’s strategic risks and new risk management and control policy, all drafted on the basis of the new risk matrix, using the Coso ERM and with consulting services from Deloitte. Examined the employee remuneration system and compensation plan, with assistance from the head of human resources. Recommended a market study of the salary structure, taking into account industry standards that are comparable and appropriate for CSAV’s current reality.
representatives of the external audit firm, KPMG, on the scope and results of the limited review of the Interim Consolidated Financial Statements as of June 30, 2015. Reviewed information related to a related-party transaction: Sale and transfer to SAAM S.A. of CSAV’s minority interest, equivalent to a 1% interest, in subsidiaries: Sociedad Matriz SAAM S.A., Inmobiliaria San Marco Limitada and Inversiones San Marco Limitada. Reviewed independent valuations of those companies’ main assets. The committee, with Mr. Menéndez abstaining, agreed to report favorably on the transaction to the Board of Directors. The Controller reported on the internal audits of controls on rates for Norgistics and subsidiary operations in Mexico, as well as progress on improvements to internal control in the human resources area (based on the private payroll audit) and creation of a new risk matrix and management system.
9. Meeting 167, held on September 25, 2015. Heard a report on the conditions of third-party transactions conducted in accordance with the customary transactions policy as of June 30, 2015. Continued reviewing the report on the internal audit of Norgistics and observations pending from prior reports. Reviewed progress on all the projects in which the Division of the Controller is involved, particularly finalizing the risk matrix for the investment in HLAG and vehicle transport, including the corresponding flow charts, subprocesses, identified risks and associated controls, as well as those responsible for each control. Heard reports on BH Compliance’s first monitoring of the crime prevention model under Law 20,393.
10. Meeting 168, held on October 22, 2015. Reviewed information on related-party transactions referred to in Title VXI of Law No. 18,046, specifically authorizing Quiñenco S.A. to grant CSAV a US$30 million line of credit to finance a contribution for the same amount to HLAG’s IPO. Examined the credit conditions in light of a comparable transaction recently conducted by the company and in the broader context of the HLAG IPO, concluding, with Mr. Menéndez abstaining, that there are no objections or qualms about the operation as it was described. Reported favorably to the Board of Directors.
11. Meeting 169, held on October 28, 2015. Heard a report on the internal audit of SAAM S.A., the agency in Chile, and the plan to correct audit observations in November 2015. The Committee was also informed of the progress on the 2015 audit plan and other projects in which the Division of the Controller is involved-especially the reformulation of internal processes, SAP implementation, as the financial-accounting system and creation of new risk matrix and risk management system-aiming to comply with SVS General Character Standard No. 385 on Corporate Governance Practices.

34
ANNU
AL R
EPOR
T
2015
Main Properties
The company’s main properties are listed below, by current use.
Property, Plant and Equipment
City Use Registration Address Usable floor area (m2)
Santiago AGF Office Building Property No. 214 - 150 Hendaya 60 Floor 13 471
Santiago AGF Office Building Property No. 214 - 151 Hendaya 60 Floor 14 577
Santiago AGF Office Building Property No. 214 - 152 Hendaya 60 Floor 14 471
Valparaíso Other Properties Property No. 37 - 110 Pje. Ross 149 Apt. 1109 39
Valparaíso Warehouse Building Property No. 90 - 22 Tomás Ramos 22 1,046
Valparaíso LandProperty No. 8 - 001 /
8 - 002Blanco 509 to 529 and
541 to 545 1,480
LimacheStaff
Recreational FacilityProperty No. 322 - 1 Av. Eastman 1047
Montecarmelo Country Club
178,000
Santos (Brazil) Offices Cep 11013 - 919 Rua Brás Cubas, 37 office 46 153
Investment Properties
City Use Registration Address Usable floor area (m2)
Santiago AGF Office Building Property No. 214 - 142 Hendaya 60 Floor 9 471
Santiago AGF Office Building Property No. 214 - 144 Hendaya 60 Floor 10 471
Santiago AGF Office Building Property No. 214 - 146 Hendaya 60 Floor 11 471
Santiago AGF Office Building Property No. 214 - 147 Hendaya 60 Floor 12 577
Santiago AGF Office Building Property No. 214 - 148 Hendaya 60 Floor 12 471
Santiago AGF Office Building Property No. 214 - 149 Hendaya 60 Floor 13 577
Valparaíso Valparaíso Office Building Property No. 8 - 004 Plaza Sotomayor 50 5,978
Valparaíso Tecnopacífico Office Building Property No. 12 - 43 Blanco 937 Floor 4 396
Valparaíso Tecnopacífico Office Building Property No. 12 - 44 Blanco 937 Floor 4 396
Valparaíso Tecnopacífico Office Building Property No. 12 - 45 Blanco 937 Floor 5 396
Valparaíso Tecnopacífico Office Building Property No. 12 - 46 Blanco 937 Floor 5 396
Iquique Offices Property No. 255 - 19 Aníbal Pinto 444 76
Corporate Structure

35
Corporate Structure
CSAV Subsidiaries and Associates

36
ANNU
AL R
EPOR
T
2015
Chilean SubsidiariesCompany Name Odjfell y Vapores S.A. Type of Entity Corporation
CSAV's Interest (%) 51% The remaining 49% is owned by Odfjell SE.
Business Description Maritime shipping and trade within Chile and abroad; the acquisition of maritime vessels and providing shipping services.
Significant Trading Relations, Contracts and Events Intragroup administrative services
Capital as of December 31, 2015 US$1,033,439.45
Profit for 2015 US$144,354.95
Board
Chairman: Óscar Hasbún Martínez (CSAV's CEO) Directors:Rafael Ferrada Moreira (CSAV's CFO) Kristian MørchLuis Salomon S.
Chief Executive Officer Rafael Ferrada Moreira (CSAV's CFO)
Company Name Norgistics Holding S.A. Type of Entity Corporation
CSAV's Interest (%) 99% The remaining interest is owned by Global Commodity Investments Inc.
Business Description Investing and participating in Chilean or foreign companies involved in logistics services, shipping agencies or sea, air, land or multimodal transport services.
Significant Trading Relations, Contracts and Events Intragroup administrative services
Capital as of December 31, 2015 US$5,000,000.00
Profit for 2015 US$857,402.16
Board
Chairman: Óscar Hasbún Martínez (CSAV's CEO)Directors:Gonzalo Baeza Solsona (Norgistics Chile's CEO)Rafael Ferrada Moreira (CSAV's CFO)
Chief Executive Officer Gonzalo Baeza Solsona (Norgistics Chile's CEO)
Company Name Euroatlantic Container Line S.A. Type of Entity Corporation
CSAV's Interest (%) 99.9% The remaining interest is owned by Global Commodity Investments Inc.
Business Description Maritime transport, its technical and administrative support, and any service that complements or relates to mari-time transport. This company was dormant this year.
Significant Trading Relations, Contracts and Events Intragroup administrative services
Capital as of December 31, 2015 US$2,274.69
Loss for 2015 US$(2,124.08)
Board
Chairman:Óscar Hasbún Martínez (CSAV's CEO)Directors:Rafael Ferrada Moreira (CSVA's CFO) Pablo Bauer Novoa (CSAV's General Counsel)
Chief Executive Officer Rafael Ferrada Moreira (CSVA's CFO)

37
Company Name Compañía Naviera Río Blanco S.A. Type of Entity Corporation
CSAV's Interest (%) 99% The remaining interest is owned by Global Commodity Investments Inc.
Business DescriptionMaritime transport, as vessel owner or vessel charterer or by any other means, both in Chile and abroad, entering into shipping contracts, chartering and leasing vessels; the acquisition of any maritime vessel; providing services related to maritime transport and trade. This company was dormant this year.
Significant Trading Relations, Contracts and Events Intragroup administrative services
Capital as of December 31, 2015 US$3,550,000.00
Loss for 2015 US$(11,654.56)
Board
Chairman:Óscar Hasbún Martínez (CSAV's CEO)Directors:Rafael Ferrada Moreira (CSVA's CFO) Pablo Bauer Novoa (CSAV's General Counsel)
Chief Executive Officer Rafael Ferrada Moreira (CSVA's CFO)
Company Name CSAV Austral SpA Type of Entity Dividends per Share
CSAV's Interest (%)
CSAV 50.01% and CSAV Germany Container GmbH 49.99% (The capital is separated into two series of preferred shares: series A, with rights to vote and to receive a dividend of US$0.01 per share, and series B, without voting rights, but with rights to receive a preferred dividend being the remainder of the distributable dividend. CSAV owns 5,001 series A shares, therefore, this investment is not reported in the consolidated financial statements).
Business Description Maritime, land and air transport and provide shipping services.
Significant Trading Relations, Contracts and Events N/A
Capital as of December 31, 2015 US$342,043.24
Loss for 2015 US$(2,537,602.54)
Board
Chairman:Andrés Kulka Kuperman Directors:Héctor Arancibia Sánchez Christian Seydewitz Munizaga Sergio Hurtado (Alternate)
Chief Executive Officer Héctor Arancibia Sánchez
Foreign SubsidiariesCompany Name Corvina Shipping Co. S.A. Type of Entity Corporation
CSAV's Interest (%) 100%
Business Description
a. Purchase, sell, charter and general administration of vessels and operation of shipping lines, in Panama or anywhere in the world. b. Maritime agencies and maritime operations in general, in Panama or abroad. c. Purchase, sell, barter, lease and trade real estate or personal property, goods and any other related commercial or financial operation, and invest in other Panamanian or foreign companies. d. Purchase and trade stocks and shares and, in general, undertake any other business, maritime, financial or real estate transactions permitted by the laws of the Republic of Panama, or that may be permitted in the future. This is a holding company within the CSAV group.
Significant Trading Relations, Contracts and Events Intragroup administrative services
Capital as of December 31, 2015 US$49,600,000.00
Loss for 2015 US$(160,038.12)
Board
Chairman:Orelys Massiel Cedeño B. Directors:Olga Quintero Rafael Ferrada Moreira (CSAV's CFO)Pablo Bauer Novoa (CSAV's General Counsel) Óscar Hasbún Martínez (CSAV's CEO)Mirtha C. de Fernández
Chief Executive Officer N/A

38
ANNU
AL R
EPOR
T
2015
Company Name Tollo Shipping Co. S.A. Type of Entity Corporation
CSAV's Interest (%) 100%
Business Description
a. Purchase, sell, charter and general administration of vessels and operation of shipping lines, in Panama or anywhere in the world.b. Maritime agencies and maritime operations in general, in Panama or abroad. c. Purchase, sell, barter, lease and trade real estate or personal property, goods and any other related commercial or financial operation, and invest in other Panamanian or foreign companies. d. Purchase and trade stocks and shares and, in general, undertake any other business, maritime, financial or real estate transactions permitted by the laws of the Republic of Panama, or that may be permitted in the future. This is a holding company within the CSAV group.
Significant Trading Relations, Contracts and Events Intragroup administrative services
Capital as of December 31, 2015 US$358,477,466.78
Profit for 2015 US$21,027,517.71
Board
Chairman: Orelys Massiel Cedeño B. Directors:Olga Quintero Rafael Ferrada Moreira (CSAV's CFO)Pablo Bauer Novoa (CSAV's General Counsel) Óscar Hasbún Martínez (CSAV's CEO)Mirtha C. de Fernández
Chief Executive Officer N/A
Company Name Norgistics (China) Ltd. (Shenzhen) Type of Entity Limited Liability Company
CSAV's Interest (%) 100%
Business Description Booking and stuffing containers, repairing and maintaining containers, coordinating operations with terminals and warehouses, receiving cargo and contracting services from transportation companies.
Significant Trading Relations, Contracts and Events Documentation services for HLAG
Capital as of December 31, 2015 US$1,000,000.00
Profit for 2015 US$159,894.67
Board
Chairman: Gonzalo Baeza Solsona (Norgistics Chile's CEO)Director: José Tomás Robinson Sylleros (Chief Financial Officer at Norgistics Chile)Jackie Lan
Chief Executive Officer Jackie Lan
Company Name CSAV Germany Container Holding GmbH Type of Entity Limited Liability Company.
CSAV's Interest (%) 100%
Business Description Ownership and management of investments in companies, especially those dedicated to container shipping.
Significant Trading Relations, Contracts and Events N/A
Capital as of December 31, 2015 US$84,449.71 without considering share premium reserves created on the subscription of shares at a price above their nominal value.
Profit for 2015 US$51,847,458.51
Management Óscar Hasbún Martínez (CSAV's CEO) Pablo Bauer Novoa (CSAV's General Counsel)
Chief Executive Officer N/A

39
CSAV Subsidiaries and AssociatesCompany Name Hapag-Lloyd AG
Type of Entity Publicly traded corporation.
CSAV's Interest (%)31.35%, represented by 37,032,743 shares owned by the company through CSAV Germany Container Holding GmbH. As described in the chapter on material events and the attached notes to the financial statements, particularly Note 15, the company acquired 1,366,991 shares at the HLAG IPO.
Investment as a percentage of total consolidated assets (%) 80.5%
Business Description
Participate in maritime trade through liner services, undertake logistics operations, undertake shipping, vessel brokering, freight brokering, storage and agency services, and, if applicable, operate terminals, buy, sell, develop, improve and lease property, provide data-processing services, and all other commercial activities related to the foregoing, unless that requires prior approval. The main business is shipping containers on owned and chartered vessels.
Significant trading relations
Prior to closing this transaction on December 2, 2014, it also signed various service contracts to take effect after the merger of HLAG and CSAV's container shipping businesses. These contracts were designed to allow both companies to operate normally during the months following transaction closure and, if necessary, select independent alternatives for future operations. The main services provided by HLAG to CSAV were: (i) shipping agency services in different jurisdictions for vehicle transport and refrigerated bulk cargo services, and (ii) information technology services, infrastructure and support. The main services provided by CSAV to HLAG were leased offices in Santiago and Valparaiso.
Significant contracts and eventsThis year, HLAG conducted its IPO on the stock exchanges in Frankfurt and Hamburg, a process during which the company made an additional investment of US$30 million. Further details are reported in the chapter on material events in 2014 and in the attached notes to the financial statements, in particular Note 15.
Capital as of December 31, 2015 €118,110,917, divided into 118,110,917 shares with a nominal value of €1, subscribed and paid in full, without considering share premium reserves created on the subscription of shares at a price above their nominal value.
Board
Supervisory Board:Michael Behrendt (Chairman)Karl-Heinz BiesoldAndreas BahnHorst BaierOliver BringeRenate CommerellJutta DiekampKarl GernandtÓscar Hasbún Martínez (CSAV's CEO)Dr. Rainer Klemmt-NissenArnold LipinskiFrancisco Pérez Mackenna (Chairman of CSAV's Board of Directors)
Executive Board:Rolf Habben Jansen (CEO)Nicolas Burr (CFO)Thorsten Haeser (CCO)Anthony J. Firmin (COO)
Chief Executive Officer Rolf Habben Jansen
Chilean CompaniesCompany Name Norgistics Chile S.A.Business Description Logistics services
Significant Trading Relations, Contracts and Events Intragroup administrative services, leasing office space and sea freight brokering.
Capital US$1,000,000
Board
Chairman:Óscar Hasbún Martínez (CSAV's CEO)Directors:Rafael Ferrada Moreira (CSAV's CFO)Gonzalo Baeza Solsona
Chief Executive Officer Gonzalo Baeza Solsona

40
ANNU
AL R
EPOR
T
2015
Panamenian Companies
Company Name CSAV Sud Americana de Vapores S.A.Business Description Ship-owner and operator, shipping agency and in general all financial and commercial operations.
Significant Trading Relations, Contracts and Events Intragroup administrative services
Capital US$10,000
Board
Chairman:Orelys Massiel Cedeño B. Directors:Mirtha C. de Fernández Olga Quintero de MartínezRafael Ferrada Moreira (CSAV's CFO)Gonzalo Baeza Solsona (Norgistics Chile's CEO)Óscar Hasbún Martínez (CSAV's CEO)
Chief Executive Officer N/A
Company Name Global Commodity Investments Inc.Business Description Ship-owner and operator, shipping agency and in general all financial and commercial operations.
Significant Trading Relations, Contracts and Events N/A
Capital US$10,000
Board
Chairman:Orelys Massiel Cedeño B. Directors:Mirtha C. de Fernández Olga Quintero de MartínezRafael Ferrada Moreira (CSAV's CFO) Óscar Hasbún Martínez (CSAV's CEO)Pablo Bauer Novoa (CSAV's General Counsel)
Chief Executive Officer N/A
Company Name Lennox Ocean Shipping Co. S.A.Business Description Ship-owner and operator, shipping agency and in general all financial and commercial operations.
Significant Trading Relations, Contracts and Events Container and equipment leasing This company was dormant this year.
Capital US$10,000
Board
Chairman: Orelys Massiel Cedeño B. Directors:Mirtha C. de Fernández Olga Quintero de MartínezRafael Ferrada Moreira (CSAV's CFO)Óscar Hasbún Martínez (CSAV's CEO)Pablo Bauer Novoa (CSAV's General Counsel)
Chief Executive Officer N/A
Company Name Maritime Shipping Trading Inc.Business Description Ship-owner and operator, shipping agency and in general all financial and commercial operations.
Significant Trading Relations, Contracts and Events N/A
Capital US$10,000
Board
Chairman: Alejandro Pedraza M. Directors: Diego Atilio Galindo García Dionisio Romero P. Luis Romero B. Andrés Kulka K. Gonzalo Baeza Solsona (Norgistics Chile's CEO)
Chief Executive Officer N/A

41
Companies in other jurisdictions Company Name Maritime Shipping & Trading International Inc. (Marshall Islands)
Business Description Ship-owner and operator, shipping agency and in general all financial and commercial operations. This company was dormant this year.
Significant Trading Relations, Contracts and Events N/A
Capital US$10,000
Board
Chairman: Alejandro Pedraza M. Directors: Diego Atilio Galindo García Dionisio Romero P. Luis Romero B. Andrés Kulka K. Gonzalo Baeza Solsona (Norgistics Chile's CEO)
Chief Executive Officer N/A
Company Name Navibras Comercial Maritima e Afretamentos Ltda. (Brazil)Business Description Shipping agency
Significant Trading Relations, Contracts and Events N/A
Capital US$1,229,387.19
ManagementFelipe De La MazaLuigi Ferrini Maria Cristina Cescon Avedissian
Chief Executive Officer N/A
Company Name Norgistics Brasil Transportes Ltda. (Brazil)
Business Description Customs agent, coordinating operations with terminals and warehouses, receiving cargo and contracting services from transportation companies.
Significant Trading Relations, Contracts and Events Intragroup administrative services and sea freight brokering In the process of voluntary liquidation
Capital US$427,042.70
Board Clovis Caldas (Liquidator)
Chief Executive Officer N/A
Company Name Odfjell & Vapores Ltd. (Bermuda)
Business Description Ship-owner and operator, shipping agency and in general all financial and commercial operations. This company was dormant this year.
Significant Trading Relations, Contracts and Events N/A
Capital US$12,000
Board
Chairman: Timothy Counsell Directors: Rafael Ferrada (CSAV's CFO)Terje IversenVictor Richards
Chief Executive Officer N/A

42
ANNU
AL R
EPOR
T
2015
42
MEM
ORIA
ANU
AL
201
5
Company Name Norgistics (China) Limited (Hong Kong)
Business Description
Coordination of sea, air, rail or river transportation services using own or third-party resources; promotion and coordination with cargo terminals, warehouses, customs warehouses; coordination and promotion of consolida-tion and deconsolidation of import and export cargo in containers; long-haul and coastal shipping using sea and land transportation companies and undertaking related activities for itself or on behalf of third parties, such as port operator, stevedoring, logistics operator, cargo transfer agent, freight, warehousing of merchandise and containers; rental, sub-rental and repair of containers; palletization of cargo; stuffing and stripping of containers; road and rail transportation of cargo in general; shipping and customs clearance; import and export; administration and provi-sion of intermodal, road, rail and shipping services in terminals.
Significant Trading Relations, Contracts and Events Sea freight brokering
Capital US$1,282.05
Management
Chairman: Gonzalo Baeza Solsona (Norgistics Chile's CEO)Director: José Tomás Robinson Sylleros (Chief Financial Officer at Norgistics Chile)
Chief Executive Officer Jackie Lan
Company Name Norgistics México S.A. de C.V. (Mexico)
Business Description Non-vessel operating common carrier (NVOCC), freight forwarder and land transport broker Sea and intermodal freight brokering
Significant Trading Relations, Contracts and Events N/A
Capital US$2,756,251.97
Management
Chairman:Óscar Hasbún Martínez (CSAV's CEO)Directors:Rafael Ferrada Moreira (CSAV's CFO)Gonzalo Baeza Solsona (Norgistics Chile's CEO)Alternates:Luis Fernando Arango CamposJaime Andrés Schirmer Sutter
Chief Executive Officer Gonzalo Baeza Solsona (Norgistics Chile's CEO)
Company Name Norgistics Lojistik Hizmetleri A.S. (Turkey)Business Description Non-vessel operating common carrier (NVOCC), freight forwarder and land transport broker
Significant Trading Relations, Contracts and Events In the process of voluntary liquidation
Capital US$177,605.68
Management Liquidator: Müjdat İbrahim Enç
Chief Executive Officer Liquidator: Müjdat İbrahim Enç

4343
Company Name OV Bermuda Ltd. (Bermuda)Business Description International maritime shipping and trade; the acquisition of maritime vessels and providing shipping services.
Significant Trading Relations, Contracts and Events Intragroup administrative services
Capital US$5,500,000
Management
Directors: Tom HaugenRafael Ferrada (CSAV's CFO)Victor Richards
Chief Executive Officer N/A
Company Name Norgistics Perú SAC (Peru)
Business Description
Foreign trade and customs services, including imports and exports, international transport, international procure-ment and sales, general agent and representative of maritime, air and terrestrial carriers in Peru, port agent in Peru, vessel brokerage and air carrier or third party representative, stevedoring agent in Peru, international agent for air, land sea or multimodal cargo.
Significant Trading Relations, Contracts and Events N/A
Capital US$305,000.00
Management
Luis Fernando Arango Campos Gonzalo Baeza Solsona (Norgistics Chile's CEO)José Tomás Robinson Sylleros Roberto Fernández
Chief Executive Officer Gonzalo Baeza Solsona (Norgistics Chile's CEO)
Company Name Hamburg Container Lines Holding GmbH & Co. KG (Germany)Business Description Manage its assets and exercise its voting rights through its interest in HLAG, as agreed by its shareholders.
Significant Trading Relations, Contracts and Events N/A
Capital EUR 200,000.00
Board Managing Shareholder: HCL Holding Verwaltungs GmbH
Chief Executive Officer N/A
Notes: A. The commercial relationships between the subsidiaries, associates and the parent company are detailed by nature and value in the consolidated financial statements. Contracts between the company and its subsidiaries are at arms’ length conditions and do not exceed normal operating requirements.
B.-Currencies
Ch$ : Chilean pesos R$ : Brazilian real
US$ : US dollar HKD : Hong Kong dollar
Ar$ : Argentinean peso EUR : Euro
ECS : Ecuadorian sucres YTL : Turkish lire
N/S : Peruvian new sols M$ : Mexican peso

44
ANNU
AL R
EPOR
T
2015
Summary of Subsidiaries
Holding Company
C
ompa
ñía
Sud
Amer
icana
de
Vapo
res S
.A.
T
ollo
Shi
ppin
g Co
. S.A
.
Corv
ina
Ship
ping
Co.
S.A
.
Glob
al C
omm
odity
Inve
stm
ents
Inc.
Odfje
ll SE
Odfje
ll Che
mica
l Tan
kers
II AS
H
apag
-Llo
yd A
G
Norg
istics
Hol
ding
S.A
.
Norg
istics
Chi
le S
.A.
CSAV
Ger
man
y Con
tain
er H
oldi
ng G
mbH
Oth
er
T
otal
Company
Navibras Comercial Marítima e Afretamentos Ltda. Brazil 99.9962% 0.0038% 100%
Tollo Shipping Co. S.A. Panama 100% 100%
Maritime Shipping Trading Inc. Panama 50% 50% 100%
Corvina Shipping Co. S.A. Panama 100% 100%
CSAV Sud Americana de Vapores S.A. Panama 100% 100%
Global Commodity Investments Inc. Panama 100% 100%
Lennox Ocean Shipping Co. S.A. Panama 100% 100%
CSAV Austral SpA Chile 50.01% 49.99% 100%
Euroatlantic Container Line S.A. Chile 99.9% 0.1% 100%
Compañía Naviera Río Blanco S.A. Chile 99% 1% 100%
Norgistics Holding S.A. Chile 99% 1% 100%
Norgistics Chile S.A. Chile 1% 99% 100%
Norgistics (China) Ltd. Shenzhen China 100% 100%
Norgistics (China) Limited Hong Kong China 100% 100%
Norgistics Brasil Transportes Ltda. Brazil 99.99% 0.01% 100%
Norgistics Mexico S.A. de C.V. Mexico 1% 99% 100%
Norgistics Lojistick Himetleri A.S. Turkey 100% 100%
Norgistics Peru SAC Peru 99.993% 0.007% 100%
Maritime Shipping & Trading International Inc. Marshall Islands 50% 50% 100%
CSAV Germany Container Holding GmbH Germany 100% 100%
Hapag-Lloyd AG Germany 31.35% 68.65% 100%
Hamburg Container Lines Holding GmbH & Co. KG Germany 50% 50% 100%
Odjfell y Vapores S.A. Chile 51% 49% 100%
OV Bermuda Ltd. Bermuda 50% 50% 100%
Odfjell & Vapores Ltd. Bermuda 50% 50% 100%

45
Investment as a Percentage of Parent Company’s Assets
Holding Company
Com
pañí
a Sud
Am
erica
na d
e Vap
ores
S.A
..
Tollo
Ship
ping
Co.
S.A.
Corv
ina S
hipp
ing
Co. S
.A.
Glob
al Co
mm
odity
Inve
stmen
ts In
c.
Norg
istics
Hol
ding
S.A.
Norg
istics
Chi
le S.
A.
CSAV
Ger
man
y Con
tain
er H
oldi
ng G
mbH
Company
Navibras Comercial Marítima e Afretamentos Ltda. 0.02% 0.00%
Tollo Shipping Co. S.A. -28.43%
Maritime Shipping Trading Inc. 0.12%
Corvina Shipping Co. S.A. 33.09%
CSAV Sud Americana de Vapores S.A. -0.16%
Global Commodity Investments Inc. 0.05%
Lennox Ocean Shipping Co. S.A. 6.41%
CSAV Austral SpA 0.09%
Euroatlantic Container Line S.A. 0.00% 0.00%
Compañía Naviera Río Blanco S.A. -0.06% -3.63%
Norgistics Holding S.A. 0.14% 8.69%
Norgistics Chile S.A. 2.38% 24.16%
Norgistics (China) Ltd. Shenzhen 0.07%
Norgistics (China) Limited Hong Kong 44.86%
Norgistics Brasil Transportes Ltda. -5.46% 0.00%
Norgistics Mexico S.A. de C.V. 2.16% 21.94%
Norgistics Lojistick Himetleri A.S. 1.11%
Norgistics Peru SAC -1.90% 0.00%
Maritime Shipping & Trading International Inc. 0.02%
CSAV Germany Container Holding GmbH 38.98%
Hapag-Lloyd AG 99.98%
Hamburg Container Lines Holding GmbH & Co. KG 0.01%
Odjfell y Vapores S.A. 0.29%
OV Bermuda Ltd. 1.66%
Odfjell & Vapores Ltd. 0.01%

46
ANNU
AL R
EPOR
T
2015

47
Consolidated Financial StatementsAs of December 31, 2015 and 2014
CONTENSIndependent Auditors’ ReportConsolidated Classified Statement of Financial PositionConsolidated Statement of Comprehensive IncomeStatement of Changes in Net EquityConsolidated Statement of Cash FlowsNotes to the Consolidated Financial StatementsReasoned AnalysisMaterial EventsSummarized Financial Statements of SubsidiariesResponsibility Statement
Figures expressed in thousands of US dollars (ThUS$)
20152015

48
ANNU
AL R
EPOR
T
2015

49

50
ANNU
AL R
EPOR
T
2015
Consolidated Statement of Financial Position
The attached notes 1-40 are an integral part of these consolidated financial statements
ASSETS As of
December 31, 2015
As of December 31,
2014
Note ThUS$ ThUS$
CURRENT ASSETS
Cash and cash equivalents 7 52,388 45,667
Other non-financial assets 13 3,954 5,759
Trade and other receivables 9 17,112 23,401
Receivables from related parties 10 1,288 11,169
Inventories 11 2,238 4,564
Current tax assets 20 3,189 3,294
Total current assets 80,169 93,854
NON-CURRENT ASSETS
Other financial assets 8 1,550 1,664
Other non-financial assets 13 121 42
Trade receivables 9 - 12
Receivables from related parties 10 - 463
Equity method investments 15 1,792,538 1,765,183
Intangible assets other than goodwill 16 95 7
Goodwill 17 17 4,392
Property, plant and equipment 18 24,727 25,286
Investment property 19 12,853 12,286
Deferred tax assets 21 313,648 307,384
Total non-current assets 2,145,549 2,116,719
TOTAL ASSETS 2,225,718 2,210,573

51
Consolidated Statement of Financial Position
The attached notes 1-40 are an integral part of these consolidated financial statements
LIABILITIES AND EQUITY As of
December 31, 2015
As of December 31,
2014
Note ThUS$ ThUS$
CURRENT LIABILITIES
Other financial liabilities 22 3,039 133,219
Trade and other payables 23 27,934 44,388
Payables to related parties 10 4,020 9,440
Other current provisions 24 22,355 70,566
Current tax liabilities 20 439 314
Employee benefits provisions 26 1,119 3,324
Other non-financial liabilities 25 2,361 5,305
Total current liabilities 61,267 266,556
NON-CURRENT LIABILITIES
Other financial liabilities 22 47,604 42,869
Payables to related parties 10 30,000 -
Other non-current provisions 24 33,748 -
Deferred tax liabilities 21 1,949 1,068
Other non-financial liabilities 25 211 223
Total non-current liabilities 113,512 44,160
TOTAL LIABILITIES 174,779 310,716
EQUITY
Issued capital 28 3,201,792 3,057,552
Accumulated losses 28 (1,160,265) (1,145,464)
Treasury shares 28 - (20,908)
Other reserves 28 903 (1,113)
Equity attributable to owners of the Company 2,042,430 1,890,067
Non-controlling interests 14 8,509 9,790
TOTAL EQUITY 2,050,939 1,899,857
TOTAL LIABILITIES AND EQUITY 2,225,718 2,210,573

52
ANNU
AL R
EPOR
T
2015
Consolidated Statement of Income
The attached notes 1-40 are an integral part of these consolidated financial statements
STATEMENT OF INCOME
For the year ended December 31,
2015 2014
Profit (loss) for the year Note ThUS$ ThUS$
Revenue 29 183,086 235,280
Cost of sales 29 (180,221) (237,126)
Gross profit 2,865 (1,846)
Other income 2,178 1,855
Administrative expenses 29 (19,650) (19,157)
Other expenses 30 (8) (1,345)
Other gains 30 1,578 846,117
Operating profit (loss) (13,037) 825,624
Finance income 31 283 1,246
Finance costs 31 (3,916) (5,063)
Share of loss of equity method associates and joint ventures 15 (6,488) (86,743)
Exchange differences 32 3,159 15,036
Loss on indexed assets and liabilities (936) (2,570)
Profit (loss) before tax (20,935) 747,530
Income tax benefit (expense) from continuing operations 21 5,876 (127,459)
Profit (loss) from continuing operations (15,059) 620,071
Loss from discontinued operations 35 - (230,831)
Profit (loss) for the year (15,059) 389,240
Profit (loss) attributable to:
Profit (loss) attributable to owners of the Company 14 (14,654) 388,706
Profit attributable to non-controlling interests 14 (405) 534
Profit (loss) for the year (15,059) 389,240
Basic earnings per share
Basic earnings (loss) per share from continuing operations 34 (0.0005) 0.0362
Basic earnings (loss) per share from discontinued operations 34 - (0.0135)
Basic earnings (loss) per share 34 (0.0005) 0.0227

53
Consolidated Statement of Income
The attached notes 1-40 are an integral part of these consolidated financial statements
STATEMENT OF COMPREHENSIVE INCOME For the year ended
December 31, 2015 2014
ThUS$ ThUS$
Profit (loss) for the year (15,059) 389,240
Components of other comprehensive income, before tax
Exchange differences on translation of foreign operations
Loss from exchange differences on translation of foreign operations, before tax (17,228) (143)
Other comprehensive loss, before tax, exchange differences on translation of foreign operations (17,228) (143)
Cash flow hedges
Gain (loss) on cash flow hedges, before tax 1,063 (1,518)
Other comprehensive income (loss), before tax, cash flow hedges 1,063 (1,518)
Other comprehensive income, before tax, actuarial gains (losses) on defined-benefit plans 15,210 -
Other components of other comprehensive loss, before tax (955) (1,661)
Income taxes relating to components of other comprehensive income
Income tax relating to cash flow hedges (142) 343
Total income tax relating to components of other comprehensive income (loss) (142) 343
Other comprehensive loss (1,097) (1,318)
Total comprehensive income (loss) (16,156) 387,922
Total comprehensive income (loss) attributable to:
Total comprehensive income (loss) attributable to owners of the Company (15,751) 387,526
Total comprehensive income (loss) attributable to non-controlling interests (405) 396
Total comprehensive income (loss) (16,156) 387,922

54
ANNU
AL R
EPOR
T
2015
Statement of Changes in Equity
For the year ended December 31, 2015
Other reserves
Issued Capital
Treasury Shares
Translation
Reserve
Cash Flow Hedge Reserve
Reserve for Actuarial
Gains and Losses on Defined-Benefit Plans
Other Miscellaneous
Reserves
Total Other
Reserves
(Accumulated Losses)
Equity Attributable to Owners of the Company
Non-Controlling
Interests
Total Equity
ThUS$ ThUS$ ThUS$ ThUS$ ThUS$ ThUS$ ThUS$ ThUS$ ThUS$ ThUS$ ThUS$
Opening balance as of January 1, 2015
3,057,552 (20,908) 287 (1,261) - (139) (1,113) (1,145,464) 1,890,067 9,790 1,899,857
-
Changes in equity - - - - - - - - - - -
Comprehensive income (loss) - - - - - - -
Profit (loss) for the year - - - - - - - (14,654) (14,654) (405) (15,059)
Other comprehensive income (loss) - - (17,228) 921 15,210 - (1,097) - (1,097) - (1,097)
Total comprehensive income (loss) - - (17,228) 921 15,210 - (1,097) (14,654) (15,751) (405) (16,156)
Equity issuance 165,148 - - - - - - - 165,148 - 165,148
Dividends - - - - - - - - - (735) (735)
Decrease for transfer of treasury shares (20,908) 20,908 - - - - - - - - - Increases (decreases) due to transfers and other changes
- - - - - 3,113 3,113 (147) 2,966 (141) 2,825
Total changes in equity 144,240 20,908 (17,228) 921 15,210 3,113 2,016 (14,801) 152,363 (1,281) 151,082
Closing balance as of December 31, 2015 3,201,792 - (16,941) (340) 15,210 2,974 903 (1,160,265) 2,042,430 8,509 2,050,939
For the year ended December 31, 2014
Other Reserves
Issued Capital
Treasury Shares
Translation
Reserve
Cash Flow Hedge Reserve
Reserve for
Actuarial Gains and Losses on Defined-Benefit Plans
Other Miscellaneous
Reserves
Total Other
Reserves
(Accumulated Losses)
Equity Attributable
to Owners of the
Company
Non-Controlling
Interests
Total Equity
ThUS$ ThUS$ ThUS$ ThUS$ ThUS$ ThUS$ ThUS$ ThUS$ ThUS$ ThUS$ ThUS$
Opening balance as of January 1, 2014
2,630,781 - (3,484) 2,098 (8) (1,667) (3,061) (1,611,297) 1,016,423 10,311 1,026,734
-
Changes in equity
Comprehensive income (loss) -
Profit (loss) for the year - - - - - - - 388,706 388,706 534 389,240
Other comprehensive income (loss) - - (5) (1,175) - - (1,180) - (1,180) (138) (1,318)
Total comprehensive income (loss) - - (5) (1,175) - - (1,180) 388,706 387,526 396 387,922
Equity issuance 428,478 428,478 428,478
Decrease for transfer of treasury shares - (20,908) - - - - - - (20,908) - (20,908)
Increase (decrease) due to transfers and other changes (1,707) - 3,776 (2,184) 8 1,528 3,128 77,127 78,548 (917) 77,631
Total changes in equity 426,771 (20,908) 3,771 (3,359) 8 1,528 1,948 465,833 873,644 (521) 873,123
Closing balance as of December 31, 2014 3,057,552 (20,908) 287 (1,261) - (139) (1,113) (1,145,464) 1,890,067 9,790 1,899,857
The attached notes 1-40 are an integral part of these consolidated financial statements

55
Consolidated Statement of Cash Flows
Statement of Cash Flows
For the years ended December 31,
2015 2014
Note ThUS$ ThUS$ Cash flows provided by (used in) operating activities
Proceeds from operating activities Proceeds from sales of goods and services 215,604 2,780,649 Other proceeds from operating activities 341 70,883
Payments for operating activities Payments to suppliers for goods and services (231,580) (2,988,946) Payments to and on behalf of employees (9,569) (139,405)
Cash flows used in operating activities (25,204) (276,819) Income taxes refunded (359) (4,694) Other cash inflows (outflows) (564) 142
Net cash flows used in operating activities (26,127) (281,371) Cash flows provided by (used in) investing activities
Cash flows from the loss of control of subsidiaries - (86,647) Other payments to acquire interests in joint ventures 15 (29,701) (243,109) Proceeds from the sale of property, plant and equipment - 343 Acquisitions of property, plant and equipment 18 (2,947) (120,311) Acquisitions of intangible assets - (55) Interest received 172 - Dividends received 48 2,515 Other cash inflows - 280
Net cash flows used in investing activities (32,428) (446,984) Cash flows provided by (used in) financing activities
Payments to purchase or redeem treasury shares - (20,908) Proceeds from issuance of other equity instruments 28 162,704 428,551 Proceeds from related party loans 10 30,000 - Proceeds from long-term loans 44,783 479,716 Loan repayments (165,941) (270,793) Interest paid (3,222) (39,799) Dividends paid 14 (735) - Other cash outflows - (9,485)
Net cash flows provided by financing activities 67,589 567,282 Increase in cash and cash equivalents before effect of exchange rate changes 9,034 (161,073)
Effect of exchange rate changes on cash and cash equivalents (2,313) 5,081 Increase (decrease) in cash and cash equivalents 6,721 (155,992)
Cash and cash equivalents at beginning of year 7 45,667 201,659 Increase (decrease) in cash and cash equivalents 6,721 (155,992) Cash and cash equivalents at end of year 7 52,388 45,667
The attached notes 1-40 are an integral part of these consolidated financial statements
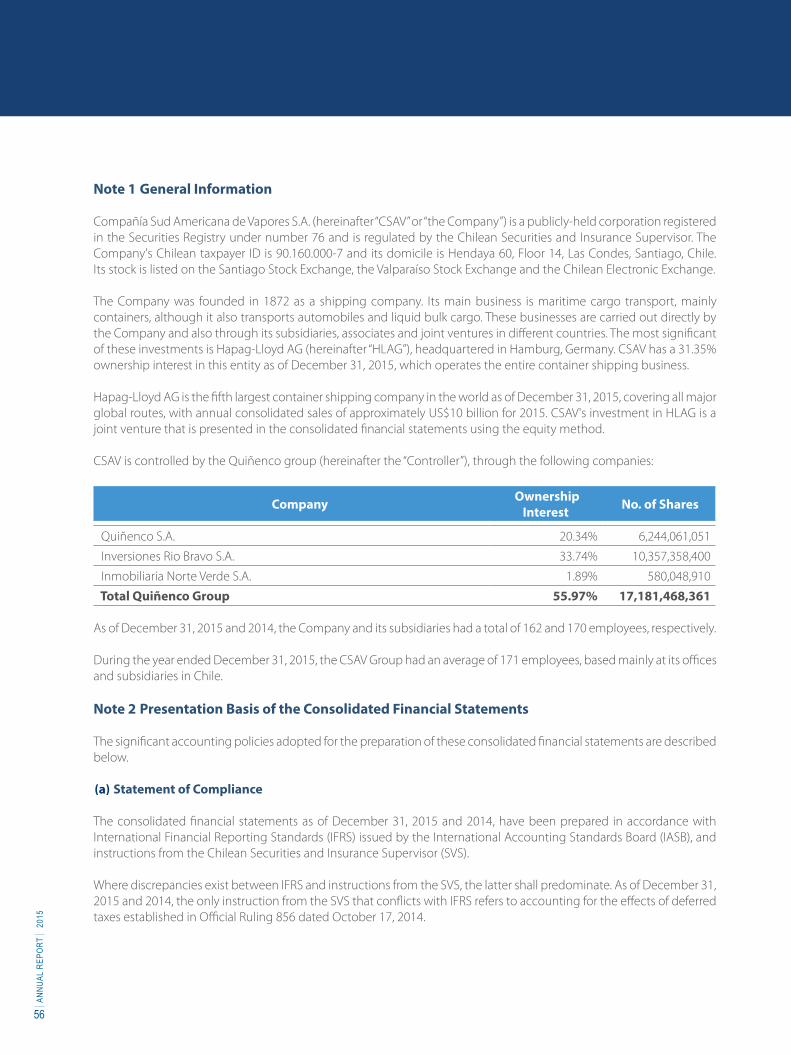
56
ANNU
AL R
EPOR
T
2015
Note 1 General Information
Compañía Sud Americana de Vapores S.A. (hereinafter “CSAV” or “the Company”) is a publicly-held corporation registered in the Securities Registry under number 76 and is regulated by the Chilean Securities and Insurance Supervisor. The Company's Chilean taxpayer ID is 90.160.000-7 and its domicile is Hendaya 60, Floor 14, Las Condes, Santiago, Chile. Its stock is listed on the Santiago Stock Exchange, the Valparaíso Stock Exchange and the Chilean Electronic Exchange.
The Company was founded in 1872 as a shipping company. Its main business is maritime cargo transport, mainly containers, although it also transports automobiles and liquid bulk cargo. These businesses are carried out directly by the Company and also through its subsidiaries, associates and joint ventures in different countries. The most significant of these investments is Hapag-Lloyd AG (hereinafter “HLAG”), headquartered in Hamburg, Germany. CSAV has a 31.35% ownership interest in this entity as of December 31, 2015, which operates the entire container shipping business.
Hapag-Lloyd AG is the fifth largest container shipping company in the world as of December 31, 2015, covering all major global routes, with annual consolidated sales of approximately US$10 billion for 2015. CSAV's investment in HLAG is a joint venture that is presented in the consolidated financial statements using the equity method.
CSAV is controlled by the Quiñenco group (hereinafter the “Controller”), through the following companies:
Company Ownership Interest No. of Shares
Quiñenco S.A. 20.34% 6,244,061,051
Inversiones Rio Bravo S.A. 33.74% 10,357,358,400
Inmobiliaria Norte Verde S.A. 1.89% 580,048,910
Total Quiñenco Group 55.97% 17,181,468,361
As of December 31, 2015 and 2014, the Company and its subsidiaries had a total of 162 and 170 employees, respectively.
During the year ended December 31, 2015, the CSAV Group had an average of 171 employees, based mainly at its offices and subsidiaries in Chile.
Note 2 Presentation Basis of the Consolidated Financial Statements
The significant accounting policies adopted for the preparation of these consolidated financial statements are described below.
(a) Statement of Compliance
The consolidated financial statements as of December 31, 2015 and 2014, have been prepared in accordance with International Financial Reporting Standards (IFRS) issued by the International Accounting Standards Board (IASB), and instructions from the Chilean Securities and Insurance Supervisor (SVS).
Where discrepancies exist between IFRS and instructions from the SVS, the latter shall predominate. As of December 31, 2015 and 2014, the only instruction from the SVS that conflicts with IFRS refers to accounting for the effects of deferred taxes established in Official Ruling 856 dated October 17, 2014.

57
This ruling establishes a mandatory, one-time exception to the regulator-mandated framework of preparing and presenting financial reporting under IFRS. This ruling instructs supervised entities to: “account for differences in deferred tax assets and liabilities arising as a direct effect of the increase in the corporate income tax rate introduced by Law 20,780 against equity during the respective period.” Thus changing the framework for preparing and presenting financial reporting adopted up until the issuance of this ruling, since IFRS state that they must be adopted wholly, explicitly and without reserves. This produces a significant difference in CSAV's consolidated financial statements as of December 31, 2014 compared to those prepared by strictly applying IFRS, but has no impact on the consolidated financial statements as of December 31, 2015, as the results for 2014 have already been accounted for in equity.
The consolidated financial statements as of December 31, 2015, presented in this report were approved by the Company's board of directors on March 28, 2016.
In the preparation of these consolidated financial statements as of December 31, 2015, management has utilized to the best of its knowledge its information and understanding of the standards and interpretations applied and the current facts and circumstances.
(b) Basis of Preparation of the Consolidated Financial Statements
These consolidated financial statements have been prepared on a historical cost basis, except for items recognized at fair value such as derivative instruments. The carrying amounts of assets and liabilities hedged with transactions that qualify for hedge accounting are adjusted to reflect changes in the fair value in relation to the hedged risks.
These consolidated financial statements are expressed in United States dollars, which is the functional currency of the CSAV Group. The figures in these statements have been rounded to thousands of United States dollars (ThUS$).
The accounting policies defined by CSAV and adopted by all consolidated subsidiaries, including certain critical accounting estimates for quantifying some assets, liabilities, income, expenses and commitments, have been used in the preparation of these consolidated financial statements. The areas that involve a greater degree of judgment or complexity, or the areas in which the assumptions and estimates are significant for the consolidated financial statements are detailed as follows:
1. The evaluation of possible impairment losses on certain assets.2. The assumptions used in the actuarial calculation of employee benefits liabilities (Note 26).3. The useful life of material and intangible assets (Notes 16, 18 and 19).4. The criteria used in the valuation of certain assets (such as derivative instruments, deferred tax assets, etc.).5. The probability that certain liabilities and contingencies (provisions) will materialize and their valuations (Note 24).6. The probability of recovery of deferred tax assets (Note 21).
These estimates are made on the basis of the best available information about the matters being analyzed. In any event, it is possible that future events may make it necessary to modify such estimates in future periods. If necessary, such modifications would be made prospectively, such that the effects of the change would be recognized in future financial statements.

58
ANNU
AL R
EPOR
T
2015
Transaction with Hapag-Lloyd AG and Discontinued Operations
A material event was filed on April 16, 2014, where the Company reported that it had signed a binding agreement with HLAG, known as the Business Combination Agreement (hereinafter the “BCA”), by virtue of which CSAV committed to contribute its entire container shipping business to HLAG in exchange for a 30% interest in HLAG after the business combination. See Note 40 to CSAV's consolidated financial statements as of December 31, 2014, for more information on this transaction.
Signing the BCA required the Company to present its financial statements in accordance with IFRS 5 starting with the consolidated financial statements as of June 30, 2014, by separating the assets, liabilities, results and cash flows belonging to the discontinued activities (which would be contributed to HLAG) from the continuing activities. This also held true for the consolidated financial statements as of September 30, 2014.
A material event was filed on December 2, 2014, where the Company reported that the transaction had been completed by contributing to HLAG 100% of its interests in the company “CSAV Germany Container GmbH”, which as of that date controlled all assets, liabilities and personnel for CSAV's container shipping business. As consideration for this contribution, CSAV subscribed shares representing 30% of the shares issued by HLAG as of that date.
Consequently, as of December 31, 2014 and December 31, 2015, the Company does not possess any assets or liabilities related to discontinued operations in the container shipping business, as it disposed of these in exchange for its interest in HLAG, which is currently the Company's main asset.
In accordance with IFRS 5, in order to make the results for the year ended December 31, 2014, comparable with the results for the year ended December 31, 2015, the Company presents its consolidated statement of income for the year ended December 31, 2014, showing separate results for continuing operations and discontinued operations, which is consistent with the financial statements for the six preceding periods.
The results of the discontinued operations are detailed in Note 35 of these consolidated financial statements. The aggregate results (i.e. the sum of continuing and discontinued operations) are also included in this note in order to provide a comparison with years prior to December 31, 2014.

59
(c) New Accounting Pronouncements
(c.1) The following new standards and interpretations have been issued but application is not yet mandatory:
New IFRS Date of Mandatory Application
IFRS 9 Financial InstrumentsAnnual periods beginning on or after January 1, 2018. Earlier application is permitted.
IFRS 14 Regulatory Deferral AccountsAnnual periods beginning on or after January 1, 2016. Earlier application is permitted.
IFRS 15 Revenue from Contracts with CustomersAnnual periods beginning on or after January 1, 2018. Earlier application is permitted.
IFRS 16 LeasesAnnual periods beginning on or after January 1, 2019. Earlier application is permitted.
Amendments to IFRS
IAS 1 Presentation of Financial Statements: Disclosure Initiative. Annual periods beginning on or after January 1, 2016. Earlier application is permitted.
IFRS 11 Joint Arrangements Accounting for Acquisitions of Interests in Joint Operations
Annual periods beginning on or after January 1, 2016. Earlier application is permitted.
IAS 16 Property, Plant and Equipment and IAS 38 Intangible Assets: Clarification of Acceptable Methods of Depreciation and Amortization
Annual periods beginning on or after January 1, 2016. Earlier application is permitted.
IFRS 10 Consolidated Financial Statements and IAS 28 Investments in Associates and Joint Ventures: Sale or Contribution of Assets between an Investor and its Associate or Joint Venture
Effective date deferred indefinitely.
IAS 27, Separate Financial Statements, IFRS 10, Consolidated Financial Statements and IFRS 12: Disclosures of Interests in Other Entities. Applying the Consolidation Exception
Annual periods beginning on or after January 1, 2016.
IAS 41 Agriculture and IAS 16 Property, Plant and Equipment Bearer Plants Annual periods beginning on or after January 1, 2016. Earlier application is permitted.
IAS 27 Separate Financial Statements, Equity Method in Separate Financial Statements
Annual periods beginning on or after January 1, 2016. Earlier application is permitted.
New standards, amendments and interpretations are applicable to annual periods beginning on or after 1 January 2016, and have not been applied in the preparation of these consolidated financial statements. CSAV does not intend to apply these standards early.
A standard that may be relevant to the Group is IFRS 16: Leases, issued on January 13, 2016, which requires that all leases are accounted for in company financial statements from January 1, 2019. Companies with operating leases will have more assets but also greater debt. If the portfolio of company leases is substantial, then the effect on the company's financial statements will be substantial. This standard is effective for annual periods beginning on or after January 1, 2019. Earlier application is permitted, provided that IFRS 15 is also applied.

60
ANNU
AL R
EPOR
T
2015
Management believes that these amendments will be adopted in its financial statements for the period that will begin on January 1, 2019. Management has not had the opportunity to consider the potential impact of adopting these amendments and does not plan to adopt them early.
Note 3 Summary of Significant Accounting Policies
3.1 Consolidation Basis
(a) Subsidiaries
Subsidiaries are all of the entities over which CSAV has control.
Control is achieved when the Company has exposure, or rights, to variable returns from the investor’s involvement with the investee and has the ability to use its power over the investee to affect the amount of the investor’s returns. Specifically, the Company controls an investee if and only if it has all of the following elements:
(i) power over the investee (i.e. existing rights that give it the ability to direct the relevant activities of the investee);
(ii) exposure, or rights, to variable returns from its involvement with the investee
(iii) the ability to use its power over the investee to affect the amount of the investor’s returns.
When the Company has less than the majority of the voting rights in an investee, it still has power over the investee when these voting rights are sufficient to give it the practical ability to unilaterally direct the investee’s relevant activities. The Company considers all of the facts and circumstances in evaluating whether the voting rights in an investee are sufficient to give it power, including:
(a) the size of its holding of voting rights relative to the size and dispersion of holdings of other vote holders; (b) potential voting rights held by the investor, other vote holders or other parties; (c) rights from other contractual agreements; and (d) any additional facts and circumstances that indicate that the investor has, or does not have, the current ability to unilaterally direct the relevant activities when decisions need to be made.
The Company will reevaluate whether or not it has control in an investee if the facts and circumstances indicate that there have been changes in one or more of the three elements of control mentioned above.
A subsidiary will be consolidated from the date on which the investor obtains control of the investee and consolidation shall cease when control over the investee is lost.
The acquisition method is used to account for the acquisition of subsidiaries by the CSAV Group. Based on this method, the acquisition cost is the fair value of the assets delivered, equity instruments issued and liabilities incurred or assumed at the date of exchange. The excess of the acquisition cost over the fair value of the Group’s share in the net identifiable assets acquired is recognized as acquired goodwill. If the acquisition cost is lower than the fair value of the net assets of the acquired subsidiary, the identification and measurement of the acquiring company’s identifiable assets, liabilities and contingent liabilities, as well as the measurement of the acquisition cost, shall be reconsidered. Any remaining difference will be recognized directly in profit or loss.

61
Subsidiaries are consolidated using the line-by-line method for all of their assets, liabilities, income, expenses and cash flows.
Non-controlling interests in subsidiaries are included in the total equity of the CSAV group.
Intercompany transactions, balances and unrealized gains on transactions between entities of the CSAV Group are eliminated during the consolidation process. Unrealized losses are also eliminated, unless the transaction provides evidence of an impairment of the asset transferred. When necessary in order to ensure consistency with the policies adopted by the CSAV Group, the accounting policies of its subsidiaries are modified.
(b) Associates
Associates are defined as all entities over which the CSAV Group exercises significant influence but over which it has no control, generally with an ownership interest between 20% and 50% of the voting rights. Investments in associates are accounted for using the equity method and are initially recognized at their acquisition cost, which requires assigning a value to these assets, commonly known as PPA (Purchase Price Allocation). The CSAV Group’s investments in associates include acquired goodwill identified in the acquisition, net of any accumulated impairment loss identified in that investment.
The CSAV Group’s share in the losses or profits subsequent to the acquisition of its associates is recognized in profit or loss, and its share in movements of equity reserves, including other comprehensive income, subsequent to the acquisition is recorded as reserves. Accumulated movements subsequent to the acquisition are recorded against the carrying amount of the investment. When the CSAV Group’s share of the losses of an associate is equal to or greater than its ownership interest in that associate, including any other uninsured receivable, the Company does not recognize additional losses, unless it has incurred obligations that exceed the invested capital.
(c) Joint Arrangements
Joint ventures are entities in which the Group exercises control over its activities through contractual agreements with other shareholders and that require the unanimous consent of the parties sharing control.
Investments in joint ventures are accounted for using the equity method and are initially recognized at their acquisition cost, which requires assigning a value to these assets, commonly known as PPA (Purchase Price Allocation). The cost of investments in joint ventures includes any reasonable transaction costs.
The Company’s share in the losses or profits subsequent to the acquisition of its joint ventures is recognized in profit or loss, and its share in movements of equity reserves, including other comprehensive income, subsequent to the acquisition is recorded as reserves. Accumulated movements subsequent to the acquisition are recorded against the carrying amount of the investment. When the CSAV Group’s share of the losses of a joint venture is equal to or greater than its ownership interest in that associate, including any other uninsured receivable, the Company does not recognize additional losses, unless it has incurred obligations that exceed the invested capital.

62
ANNU
AL R
EPOR
T
2015
3.2 Entities Included in Consolidation
These consolidated financial statements include the assets, liabilities, results and cash flows of the parent company and its subsidiaries, which are listed in the table below. Significant transactions between group companies that are consolidated have been eliminated.
Ownership Interest as of December 31,
Taxpayer ID Number Company
2015 2014 Direct Indirect Total Direct Indirect Total
Foreign Corvina Shipping Co. S.A. and Subsidiaries 100.00 - 100.00 100.00 - 100.00
89.602.300-4 CSAV Austral SpA (1) 50.01 - 50.01 50.01 - 50.01
Foreign Norgistics (China) Ltd. 100.00 - 100.00 100.00 - 100.00
96.840.950-6 Odfjell y Vapores S.A. 51.00 - 51.00 51.00 - 51.00
Foreign Tollo Shipping Co. S.A. and Subsidiaries 100.00 - 100.00 100.00 - 100.00
76.028.729-6 Norgistics Holding S.A. and Subsidiaries 99.00 1.00 100.00 99.00 1.00 100.00
96.838.110-5 Euroatlantic Container Line S.A. 99.90 0.10 100.00 99.90 0.10 100.00
96.838.050-7 Compañía Naviera Rio Blanco S.A. 99.00 1.00 100.00 99.00 1.00 100.00
Foreign CSAV Germany Container Holding GmbH 100.00 - 100.00 48.00 52.00 100.00
(1) On August 1, 2014, this company changed its name from “Empresa de Transporte Sudamericana Austral Ltda.” to “CSAV Austral SPA” and CSAV came to hold 5,001 series A shares, which cannot be consolidated given their characteristics.
3.3 Segment Reporting
An operating segment is defined as a component of an entity’s business for which separate financial information is available and is reviewed regularly by the Company’s senior management.
Segment information is presented according to CSAV’s main business lines, which have been identified as: (i) container shipping and (ii) other transport services.
3.4 Foreign Currency Transactions
(a) Presentation and Functional Currency
The items included in the financial statements of each of the entities of the CSAV Group are valued using the currency of the primary economic environment in which the entity operates (“functional currency”). The consolidated financial statements are expressed in US dollars, which is both the functional and presentation currency of the CSAV Group.
(b) Transactions and Balances
Transactions in foreign currency are converted to the Company’s functional currency using the exchange rate in force as of the date of the transaction. Losses and gains in foreign currency arising from settling these transactions and from converting monetary assets and liabilities denominated in foreign currencies using year-end exchange rates are recorded in profit or loss.

63
Currency exchange differences for non-monetary items such as equity instruments kept at fair value through profit and loss are presented as part of the gain or loss in fair value. Currency exchange differences for non-monetary items such as equity instruments classified as available-for-sale financial assets are included in net equity, in the revaluation reserve.
(c) Conversion of CSAV Group Entities to Presentation Currency
The results and the financial situation of all CSAV Group entities (none of which uses the currency of a hyperinflationary economy) that use a functional currency other than the presentation currency are converted to the presentation currency as follows:
(i) The assets and liabilities of each statement of financial position presented are converted at the closing exchange rate as of the reporting date.
(ii) The income and expenses of each income statement account are converted at the average exchange rate, unless the average is not a reasonable approximation of the cumulative effect of the exchange rates in force on the transaction dates, in which case income and expenses are converted on the dates of the transactions.
(iii) Cash flows are translated in accordance with the provisions of point (ii) above.
(iv) All resulting translation differences are recognized as a separate component of net equity, within “translation reserve” in other equity reserves.
In consolidation, exchange differences arising from the conversion of a net investment in foreign entities or Chilean entities with a functional currency other than the functional currency of the Group, and of other instruments in foreign currency that are designated as hedges for those investments, are recorded in other comprehensive income. When an investment is sold or disposed of, these exchange differences are recognized in profit or loss as part of the loss or gain on the sale or disposal.
Adjustments to acquired goodwill and to fair value arising from the acquisition of a foreign entity are treated as assets and liabilities of the foreign entity and converted at the year-end exchange rate, as appropriate.
3.5 Property, Plant and Equipment
Property, plant and equipment are measured at acquisition cost, less accumulated depreciation and impairment losses. In addition, the acquisition cost must include financial expenses that are attributable to the acquisition, and they shall be recorded until the asset in question is operating.
Subsequent costs are included in the value of the asset or recognized as a separate asset, only when it is likely that its future economic benefits will flow to the Company and the cost of the component can be determined reliably. The value of the replaced component is derecognized while other repairs and maintenance are charged to profit or loss for the year in which they are incurred. When significant parts of an item of property, plant and equipment have different useful lives among themselves, these parts shall be recorded as separate components.

64
ANNU
AL R
EPOR
T
2015
Depreciation is recognized in income, using the straight-line method based on the estimated useful life of each component of an item of property, plant and equipment, starting from the date on which the asset becomes available for use.
The estimated useful lives for assets are as follows:
Buildings 40 to 100 yearsMachinery and operating equipment 5 to 14 yearsContainers 13 to 14 yearsVessels 16 to 25 yearsLeasehold facilities and improvements Term of leaseFurniture and supplies 3 to 10 yearsComputer equipment 2 to 3 years
At each consolidated financial statement year-end, the residual value and useful life of the assets are reviewed, and adjusted where necessary.
When the value of an asset is greater than its estimated recoverable amount, its value is immediately lowered to its recoverable amount.
Losses and gains on the sale of property, plant and equipment are calculated by comparing the income obtained with the carrying amount and are recorded net in the income statement.
Property (land or buildings) used to earn rentals and/or for capital appreciation, rather than for use in the production of services or for administrative purposes, is presented within “investment property” (in section 3.6 below).
3.6 Investment Property
Investment property is property (land or buildings or parts of buildings) held by the Company as owner or lessee under a finance lease to earn rentals or for capital appreciation or both, rather than for use in the production or supply of goods or services or for administrative purposes or sale in the ordinary course of business.
Investment property is recognized as an asset only when: (i) it is probable that the future economic benefits that are associated with the property will flow to the Company; and (ii) the cost of the property can be reliably measured.
The CSAV Group records investment property at acquisition cost, less accumulated depreciation and impairment losses. In addition, the acquisition cost must include financial expenses that are directly attributable to the acquisition, and they shall be recorded as such until the asset in question is operating.
The simple reclassification of land or buildings from property, plant and equipment to investment property will not generate any gains or losses for the Company since both items are valued at historical cost and, therefore, will be recorded at the same amount for which they were recorded originally.
Losses and gains on the sale of investment property are calculated by comparing the income obtained with the carrying amount and are recorded net in the consolidated income statement.

65
3.7 Intangible Assets
Only those intangible assets whose costs can be reasonably objectively estimated and those assets from which it is likely that economic benefits will be obtained in the future are recognized for accounting purposes. Such intangible assets shall be initially recognized at acquisition or development cost, and they shall be valued at cost less the corresponding accumulated amortization and any impairment losses incurred, for those intangible assets with a finite useful life.
For intangible assets with a finite useful life, amortization is recognized in profit or loss, using the straight-line method based on the estimated useful life, starting from the date on which the asset is available for use or on a different date that better represents its usage.
Intangible assets with an indefinite useful life and goodwill are not amortized but impairment testing is performed on an annual basis.
The intangible assets held by the CSAV Group and the corresponding periods of amortization are summarized as follows:
Class Minimum MaximumAcquired goodwill IndefiniteDevelopment costs 3 years 4 yearsComputer software 3 years 4 years
(a) Software
Acquired software licenses are capitalized on the basis of costs incurred to acquire them and prepare them for use. These intangible assets are amortized over their estimated useful lives.
(b) Patents, Trademarks and Other Rights
These assets are presented at historical cost. These rights have no defined useful life and, therefore, are not amortized. However, the indefinite useful life is subject to periodic review in order to determine whether the indefinite useful life is still applicable. 3.8 Goodwill
Goodwill represents the difference between the acquisition cost and the value of the CSAV Group’s share of the net acquired assets and liabilities of the subsidiary, associate or joint venture, measured as of the acquisition date. Acquired goodwill is presented separately in the statement of financial position and is tested for impairment on an annual basis and valued at cost less accumulated impairment losses. Goodwill related to acquisitions of associates and joint ventures is included in the investment value and tested for impairment as a whole. Gains and losses related to the sale of an investment include in the cost the carrying amount of acquired goodwill related to the investment that was sold.

66
ANNU
AL R
EPOR
T
2015
Acquired goodwill is allocated to cash-generating units for impairment testing purposes. The allocation is made for those cash-generating units that are expected to benefit from the business combination or acquisition in which such acquired goodwill was generated.
Negative goodwill arising from the acquisition of an investment or business combination is recorded in accordance with Note 3.1 section a).
3.9 Borrowing Costs
Borrowing costs incurred for the construction of any qualified asset (an asset that necessarily takes a substantial period of time to get ready for use) are capitalized over the period of time needed to complete and prepare the asset for its intended use. Other borrowing costs are recorded in profit or loss as finance costs.
3.10 Asset Impairment Losses
(a) Non-Financial Assets
Assets that have an indefinite useful life (e.g. goodwill and intangible assets with indefinite useful lives) are not amortized and are tested for impairment on an annual basis.
Assets that are amortized are tested for impairment whenever an event or change in circumstances indicates that the carrying amount may not be recoverable. If this is the case, an impairment loss is recognized for the amount by which the asset’s carrying amount exceeds its recoverable amount.
The recoverable amount is the greater of: (i) the fair value of an asset or cash generating unit (CGU) less costs to sell; and (ii) the value in use. To determine its value in use, future cash flows estimated for the asset or CGU are discounted to their present value using a before-tax discount rate that reflects the current market valuations over the cost of money and the specific risks that apply to the asset or business.
To conduct impairment testing, assets or CGUs are grouped by operating segment, as indicated in Note 6 of these consolidated financial statements.
Non-financial assets other than acquired goodwill for which an impairment loss has been recorded are reviewed at each year-end in case the loss has been reversed, in which case the reversal may never be greater than the original impairment amount.
Impairment of acquired goodwill is not reversed.
(b) Financial Assets
A financial asset that is not recorded at fair value through profit and loss is evaluated at each period-end in order to determine whether there is objective evidence of impairment. A financial asset is impaired if there is objective evidence that a loss event has occurred after the initial recognition of the asset, and that this loss event has had a negative effect on the asset’s future cash flows that can be reliably estimated.
Objective evidence that financial assets are impaired may include delay or default by a debtor or issuer, restructuring of an amount owed to CSAV in terms that would not be considered in other circumstances, indications that a debtor or issuer will declare bankruptcy, or the disappearance of an active market for an instrument, among other evidence.

67
In addition, for an investment in an equity instrument, a significant or prolonged decrease in the fair value of the asset, below its cost, may be considered objective evidence of impairment.
In evaluating impairment, CSAV uses historical trends of probability of noncompliance, the timing of recoveries and the amount of the loss incurred, all adjusted according to management’s judgment as to whether under the prevailing economic and credit conditions it is likely that the actual losses will be greater or lesser than the losses indicated by historical trends.
Impairment losses related to trade and other receivables, which are valued at amortized cost, are calculated as the difference between the assets’ carrying amounts and their estimated recoverable amounts.
This estimate is determined based on the age of the receivables as indicated in Note 9. Losses are recognized in profit or loss and are reflected in a provision within trade receivables. When a subsequent event causes the amount of the impairment loss to decrease, such decrease is reversed in profit or loss.
3.11 Financial Instruments
Financial instruments are classified and valued according to the following categories:
(a) Non-derivative Financial Assets
The CSAV Group classifies its non-derivative financial assets into the categories listed below, according to the purpose for which such assets were acquired. Management determines the classification of financial assets upon initial recognition.
(i) Financial assets at fair value through profit and loss
Financial assets at fair value through profit and loss are financial assets held for trading purposes or designated as such upon initial recognition. A financial asset is classified in this category if acquired principally to sell in the short term.
Assets in this category are classified as current assets. This category also includes investments in shares, debt instruments, time deposits, derivatives not designated as hedges and other financial investments.
(ii) Trade and other receivables
Trade receivables are initially recognized at fair value and subsequently at amortized cost, less impairment losses. Impairment of trade accounts receivable is recorded when there is objective evidence that the CSAV Group will not be able to collect all of the amounts owed to it in accordance with the original terms of the accounts receivable, as described in Note 3.10 b).
In the income statement, the subsequent recovery of previously charged off amounts is credited to cost of sales.
(iii) Held-to-maturity financial assets
Held-to-maturity financial assets are non-derivative financial assets with fixed or determinable payments and a fixed maturity date that the Group’s management intends to and is capable of holding to maturity. If the CSAV Group were to sell more than an insignificant amount of held-to-maturity financial assets, the entire category would be reclassified as available for sale. These available-for-sale financial assets are included in non-current assets, except those assets maturing in less than 12 months from the reporting date, which are classified as current assets.

68
ANNU
AL R
EPOR
T
2015
(iv) Available-for-sale financial assets
Available-for-sale financial assets are non-derivative financial assets that are designated in this category or not classified in any other category. They are included in non-current assets unless management intends to dispose of the investment in the 12 months following the reporting date, and they are recorded at fair value through profit and loss.
(v) Cash and cash equivalents
Cash and cash equivalents include cash held internally and in banks; time deposits in credit entities; other highly liquid, short-term investments with an original term of three months or less; and bank overdrafts. In the statement of financial position, bank overdrafts are classified as external resources in current liabilities.
(b) Non-derivative Financial Liabilities
(i) Trade and other payables
Accounts payable to suppliers are initially recognized at fair value and subsequently, if applicable, at amortized cost using the effective interest method.
(ii) Interest-bearing loans and other financial liabilities
Loans, bonds payable and other financial liabilities of a similar nature are initially recognized at fair value, net of the costs incurred in the transaction. Subsequently, they are valued at amortized cost and any difference between the funds obtained (net of costs to obtain them) and repayment value are recognized in the income statement over the life of the debt using the effective interest rate method. (c) Issued Capital
The Company’s subscribed and paid shares are classified within equity under issued capital.
Incremental costs directly attributable to the issuance of new shares are presented in net equity as a deduction, net of taxes, from the income obtained in the placement. Until the Company’s shareholders approve the deduction of these costs against issued capital, they are recorded within other equity reserves.
(d) Derivative Financial Instruments and Hedging Activities
Derivative financial instruments used to hedge risk exposure in foreign currency purchases, fuel purchases and interest rates are initially recognized at fair value.
After initial recognition, derivative financial instruments are periodically measured at fair value, and any changes are recorded as described below:

69
(i) Accounting Hedges
The CSAV Group documents the relationship between hedge instruments and the hedged items at the beginning of the transaction, as well as its risk management objectives and strategy for carrying out diverse hedge transactions. The Company also documents its evaluation, both initially and on an ongoing basis, of whether the derivatives that are used in hedging transactions are highly effective at offsetting changes in fair value or in the cash flows from the hedged items.
Derivative financial instruments that satisfy hedge accounting criteria are initially recognized at fair value plus (less) the transaction costs that are directly attributable to contracting or issuing the instrument, as appropriate.
Changes in the fair value of these instruments shall be recognized directly in equity, to the extent that the hedge is effective. When it is not effective, changes in fair value shall be recognized in profit or loss.
If the instrument no longer satisfies hedge accounting criteria, the hedge shall be discontinued prospectively. Any accumulated gains or losses that were previously recognized in equity will remain until the forecasted transactions occur.
(ii) Economic Hedges
Derivative financial instruments that do not satisfy hedge accounting criteria are classified and valued as financial assets or liabilities at fair value through profit and loss.
(ii) Economic Hedges (continued)
The fair values of derivative instruments used for hedging purposes are shown in Note 12. Movements in the hedge reserve within equity are shown in Note 28. The total fair value of the hedge derivative is classified as a non-current asset or liability if the remaining maturity of the hedged item is greater than 12 months and as a current asset or liability if the remaining maturity of the hedged item is less than 12 months.
3.12 Inventories
Inventory is valued at its cost or net realizable value, whichever is lower. The cost is determined by the “first-in-first-out,” or FIFO, method and includes the acquisition cost and other costs incurred in bringing it to its place and conditions of use.
The net realizable value is the estimated sales value in the normal course of business, less estimated selling costs.
3.13 Current and Deferred Income Taxes
Income taxes for the year include current income taxes and deferred income taxes. Taxes are recognized directly in profit or loss except for certain items recognized directly in equity.
Current income taxes are calculated based on each country’s tax laws in force as of the reporting date.

70
ANNU
AL R
EPOR
T
2015
Deferred taxes are calculated in accordance with the liability method over the differences that arise between the tax basis of assets and liabilities and their carrying amount in the financial statements. However, if the deferred taxes arise from the initial recognition of a liability or an asset in a transaction other than a business combination, which at the time of the transaction neither affected the accounting result nor the tax gain or loss, it is not accounted for. Deferred taxes are determined using tax rates (and laws) that have been enacted or approved as of the date of the statement of financial position and that are expected to be applied when the corresponding deferred tax asset or liability is realized.
Deferred tax assets are recognized to the extent that it is likely that future tax benefits are available with which to effectively offset these differences.
Deferred taxes generated by temporary differences arising from investments in subsidiaries and associates are provisioned for, unless the timing of the reversal of the temporary differences is controlled by the Company and it is likely that the temporary difference will not be reversed in the foreseeable future.
On September 29, 2014, the Tax Reform Law (Law 20,780) was passed in Chile. This law defines the default tax regime applicable to the Company and the corporate income tax rate that will apply to companies by default between 2014 and 2018. It also allows companies to choose between one of two tax regimes (attributed or semi-integrated), which will be subject to different tax rates beginning in 2017.
The default tax regime applicable to the Company as from January 1, 2017 is the semi-integrated system, and the Company currently sees no reason to change it.
However, the Company could decide to choose a regime other than the default regime within the last three months of 2016. The change must be approved in an extraordinary shareholders’ meeting with a quorum of at least two thirds of the shares issued with voting rights and shall take effect by filing a statement signed by the Company, accompanied by the minutes from that meeting summarized in a public instrument.
The Chilean Government submitted a bill to the National Congress on December 15, 2015 that simplifies the tax reform mentioned above. This bill proposes that the semi-integrated system is obligatory for corporations such as CSAV.
Deferred taxes are measured at tax rates expected to be applied when temporary differences are reversed, using rates that apply by default as of the balance sheet date, as indicated below:
Year Tax Rate
2014 21.0%
2015 22.5%
2016 24.0%
2017 25.5%
2018 27.0%

71
3.14 Employee Benefits
(a) Post-employment and other long-term benefits
In order to determine the present value of post-employment and other long-term benefits, a risk-free interest rate is used. This actuarial calculation is performed by a qualified mathematician using the projected unit credit method.
Actuarial gains and losses arising from defined-benefit plans are recognized directly in equity, as other comprehensive income (losses).
(b) Contract termination indemnity
Commitments undertaken in a formal detailed plan, either in order to terminate the contract of an employee before normal retirement age or to provide termination benefits, are recognized directly in profit or loss.
(c) Short-term benefits and incentives
The CSAV Group recognizes a provision for short-term benefits and incentives when it is contractually obligated to do so or when past practice has created an implicit obligation.
3.15 Provisions
The CSAV Group recognizes provisions when the following requirements are satisfied:
(a) there is a current obligation, whether legal or implicit, as a result of past events;
(b) it is likely that an outflow of resources will be needed to settle the obligation; and
(c) the amount has been reliably estimated.
In the case of a service contract that is considered onerous, a provision will be recognized and charged to income for the year, for the lesser of the cost of settling the contract and the net cost of continuing it.
Provisions for restructuring purposes are recognized to the extent that the CSAV Group has approved a formal detailed plan for restructuring an operation, and that such restructuring has been internally reported or has already begun.
Provisions are not recorded for future operating losses except for the onerous contracts mentioned above.
These provisions are valued at the present value of the disbursements that are expected to be necessary to settle the obligation using, if applicable, a discount rate that reflects the current market assessments of the time value of money and the specific risks of the obligation.
3.16 Other Non-Financial Liabilities
This item includes liabilities that are not of a financial nature and do not qualify as any other specific type of liability.
For the Company, the most relevant liabilities recorded within this account are those related to income from voyages in transit (i.e. those that have not yet reached their destination as of the reporting date).

72
ANNU
AL R
EPOR
T
2015
3.17 Revenue and Cost of Sales
Operating revenues and cost of sales derived from the provision of maritime transport services are recognized in income considering the percentage of completion of the service as of the reporting date, as long as the result can be reliably estimated.
The provision of services can be reliably measured as long as the following conditions are met:
(a) The amount of the revenues can be reliably measured;(b) It is likely that the economic benefits from the transaction will flow to the entity;(c) The percentage of completion of the transaction as of the reporting date can be reliably measured;(d) The costs incurred by the transaction and the costs to complete it can be reliably measured.
When the results of services provided cannot be sufficiently reliably estimated, in accordance with the requirements stated above, the revenues are recognized only to the extent that the expenses incurred can be recovered.
Revenue and costs related to subletting vessels are recognized in profit or loss on an accrual basis. Revenue and cost of sales from other services related to the maritime business are recognized in profit or loss on an accrual basis. Operating revenues are recognized net of standard discounts and bonuses.
3.18 Discontinued Operations
The preparation criteria for discontinued operations are described in Note 2b.
3.19 Finance Income and Costs
Finance income is accounted for based on its effective rate. Finance costs are recognized in profit or loss when accrued, except for costs incurred to finance the construction or development of qualified assets that are capitalized.
Finance costs are capitalized starting from the date on which knowledge about the asset to be constructed is obtained. The amount of the capitalized finance costs (before tax) for the year is determined by applying the effective interest rate of the loans in force during the year in which financial expenses were capitalized to the qualified assets.
3.20 Leases
Lease contracts in which substantially all risks and rewards of ownership of the leased assets are transferred to the companies of the CSAV Group are classified as finance leases. All other leases are classified as operating leases.
For finance leases, at the start of the contract an asset is recognized in property, plant and equipment, and a financial liability is recognized for the lesser between the fair value of the leased asset and the present value of the minimum lease payments.
For operating leases, installments are recognized on a straight-line basis as expenses during the term of the lease.

73
3.21 Determination of Fair Value
Some of the CSAV Group’s accounting policies and disclosures require that the fair value of certain financial assets be determined as follows:
(a) Financial Assets
The fair value of financial assets at fair value through profit and loss and available-for-sale financial assets is determined at market value.
(b) Trade and other receivables
Considering that almost all trade receivables have a term of less than 90 days, their fair value is not estimated to differ significantly from their carrying amount.
(c) Derivatives
The fair value of derivative contracts is based on their quoted price.
3.22 Earnings (Loss) per Share
Basic earnings (loss) per share are calculated as the ratio between net profit (loss) for the year divided by the daily weighted average number of common shares outstanding during the year.
3.23 Dividend Distributions
The distribution of dividends to the Company’s shareholders is recognized as a liability in CSAV’s annual consolidated accounts in the year in which they become payable. The Company’s policy is to distribute 30% of distributable net profits.
Until there is a positive balance of distributable net profits as of year-end (i.e. the initial balance plus the results for the year), the Company will not distribute dividends to its shareholders. This calculation is shown in Note 28 g) to the consolidated financial statements.
3.24 Environmental Issues
Disbursements related to environmental protection are charged to the income statement when incurred.
Note 4 Changes in Accounting Policies and Estimates
The consolidated financial statements as of December 31, 2015, do not present any changes in policies or accounting estimates that may affect their comparability with the prior year.

74
ANNU
AL R
EPOR
T
2015
Note 5 Financial Risk Management
The container business is CSAV’s largest asset, through its investment in the joint venture HLAG. Although CSAV is not directly exposed to the financial risks of the container industry as an operator, it is indirectly exposed, because these risks affect the value of CSAV’s investment in that joint venture and the associated dividend flow. They also affect HLAG’s capital requirements, which may result in CSAV having to subscribe to capital increases, or seeing its stake diluted if it chooses not to subscribe.
CSAV’s investment in HLAG represents 81% of its total consolidated assets, as of December 31, 2015. HLAG is a German public limited company (Aktiengesellschaft or AG) and it is listed on the Frankfurt and Hamburg stock exchanges. It is exclusively dedicated to transporting cargo in containers and provides these services on all significant global routes.
Although CSAV has significant influence over HLAG and jointly controls it together with two other major partners, this German company has an independent management team that controls and manages its risks autonomously and in accordance with the standards of a publicly-listed company in Germany.
The businesses that CSAV operates directly are vehicle transport, bulk liquids and logistics. These are exposed to various financial risks that include: (a) Business Risk, (b) Credit Risk, (c) Liquidity Risk and (d) Market Risk. The Company seeks to minimize the potential effects of these risks through the use of financial derivatives or by establishing internal financial risk management policies.
(a) Business Risk
The main business risks for the company are those related to the balance of supply and demand for maritime transport, geographical markets and fuel prices (bunkers).
(i) Supply-Demand Equilibrium
The demand for maritime transport is highly correlated with global economic growth. However, maritime transport supply is a function of installed capacity, the delivery rate for newly constructed vessels and the vessel scrapping or obsolescence rate. The container transport and vehicle transport businesses are affected positively or negatively by changes in these variables.
There is a mismatch between demand and supply in the container transport business, which is reflected in installed capacity growing faster than global demand. This has resulted low utilization of vessels, and volatile or low prices for vessel charters and freight tariffs. During recent months this unbalanced situation has deteriorated, and resulted in the detained fleet growing to the highest levels seen over the past five years. This imbalance between supply and demand with respect to global freight volumes can differ for each route and service provided by HLAG.
A similar situation occurs for the maritime transport services directly operated by CSAV (vehicle transport and bulk liquids) in which supply and demand imbalances can cause volatility and reduced vessel charter and freight tariffs.
The imbalance between supply and demand can affect to a greater or lesser extent shipping operators depending on their operating fleet (antiquity, fuel consumption and versatility, among other characteristics), the proportion of their fleet that is owned and the proportion chartered (operational leverage) in comparison to the industry. This

75
can negatively impact the results and the financial position of operators when charter tariffs are not correlated with freight tariffs before fuel costs (before bunker surcharges), or when there is limited capacity to change the operated fleet or its fuel consumption.
(ii) Geographical Markets
The HLAG joint venture has a significant share of the container transport business across all global routes, and it distributes its operations across various geog raphical markets. This implies that this business does not expose the Company to a restricted group of geographical markets, reducing the risk of exposure to local situations and allowing the joint venture to compensate for particular market contingencies on certain routes.
The transport services directly operated by CSAV expose the company to changes within South American markets, and particularly to those on the west coast of the sub-continent. These markets suffered a marked fall in imports during 2015, which affected local ship operators and resulting in significant imbalances between transport supply and demand on these routes.
(iii) Fuel Prices
An important component of the transport industry’s cost structure is fuel, which is usually called “bunkers” within the maritime shipping industry. The Company uses fuels called IFO 380, IFO 580 and MGO/LS in its vessels.
Most of CSAV’s maritime freight sales are carried out through contracts at fixed prices and a percentage of those tariffs are subject to price adjustments, in accordance with changes in the cost of fuel or Bunker Adjustment Factor (“BAF”). Although contracts may contain the BAF surcharge, it is usually known. However, it may be affected by temporary differences between its calculation and application. The Company covers that portion of the expected fuel consumption that is subject to fixed freight tariffs through derivative contracts, which significantly compensates for volatility in fuel prices.
In order to curtail possible upward volatility in the months after making a BAF adjustment, the Company purchased fuel purchase options to mitigate potential price hikes during 2015.
For fixed-price sales and contracts without a BAF, or the portion of sales with a BAF clause that limits its coverage, the Company purchases fuel hedges over the term of the corresponding contract, so that the fuel (bunker) cost is fixed and matched in volume and term to the corresponding maritime freight contract.
For example, for transport services directly operated by the Company during 2015, an increase in fuel prices of US$10 per metric ton of fuel would have had a negative impact of around ThUS$ 728 on the Company’s results. This value is based on the volume of fuel consumed by the Company and assumes that BAF surcharges cannot be passed on to customers and fuel hedges have not been purchased. Effective BAF surcharges and fuel hedges significantly reduce this exposure.
The container transport business is exclusively operated by HLAG, and its Management autonomously manages the financial risks associated with this business, under the framework of the instruments offered by the industry and in accordance with the standards of a publicly-listed company in Germany.

76
ANNU
AL R
EPOR
T
2015
(b) Credit Risk Credit risk is derived from the CSAV Group’s exposure to (i) potential losses resulting mainly from non-fulfillment of obligations by customers, third-party agencies and carriers with which the Company has signed vessel lease and/or slot sale agreements and (ii) counterparty risk in the case of financial assets with banks and (iii) counterparty risk in the case of financial hedges with banks or other institutions.
(i) Accounts Receivable
The Company has a strict credit policy for managing its portfolio of accounts receivable. Most of the Company’s customers are direct customers. This policy is based on lines of credit and payment terms granted on the basis of an individual analysis of the solvency, payment capacity, and general references of each customer, the industry and the customer’s market, as well as its payment history with the Company.
These lines of credit are reviewed on an annual basis, and special care is taken so that the conditions offered, with respect to both amounts and terms, are appropriate given market conditions and expected volumes. Payment behavior and the percentage of utilization of such credit are monitored on an ongoing basis.
Agencies that represent CSAV are constantly monitored to ensure that the administrative, commercial, operational and collection processes, and their relationship with suppliers comply with agreed contract terms. Furthermore, there is a rigorous policy to create an uncollectable provision for any debt carrying a material credit risk or which is over 180 days overdue, even when such an invoice or debt may be recoverable according to historical information.
Regarding vessel and slot leases to third parties, the Company supports its agreements using Charter Party and Slot Charter Agreements drafted using industry standard models that appropriately cover its interests. CSAV leases vessels to third parties and slots to other shipping companies, always taking into consideration the counterparty’s creditworthiness. In the case of slot charters, CSAV often leases slots from the same shipping companies to which it leases its own slots on other voyages and services, which significantly reduces the risk of default.

77
The Company’s maximum credit risk exposure from accounts receivable corresponds to the total of these accounts net of impairment, as detailed below:
As of December 31, 2015
As of December 31, 2014
Note ThUS$ ThUS$ Trade receivables 9 18,486 23,593
Impairment of trade receivables 9 (1,761) (2,013) Trade receivables, net 16,725 21,580 Other receivables 9 387 1,821
Impairment of other receivables 9 - - Other receivables, net 9 387 1,821 Total receivables, net 17,112 23,401
The Company records provisions when there is evidence of impairment of trade receivables, based on the following criteria:
Provisioning Criteria for Receivables FactorReceivables over 180 days 100%
Legal collections, checks issued with insufficient funds and other similar concepts 100%
High risk customers and agencies, according to each case and market conditions 100%
During the year, the provision for impairment of accounts receivable has reported the following movements:
As of December 31, 2015
As of December 31, 2014
ThUS$ ThUS$ Opening balance 2,013 14,556 Increase (decrease) in impairment for the year (252) 213 Increase (decrease) in impairment of discontinued operations - (6,412) Deconsolidation of discontinued operations - (6,344) Impairment of accounts receivable, closing balance (Note 9) 1,761 2,013
(ii) Financial Assets
The Company has a policy for managing its financial assets, which includes time deposits and repurchase agreements. It has its current accounts and investments in financial institutions with risk classification of “investment grade”.

78
ANNU
AL R
EPOR
T
2015
The carrying amount of these financial assets represents the maximum exposure to counterparty risk, as detailed as follows:
As of
December 31, 2015
As of December 31,
2014
Note ThUS$ ThUS$
Bank balances and time deposits 7 52,376 45,644
Total 52,376 45,644
(iii) Hedging Positions
As part of its risk management policy, the Company has interest rate, exchange rate and fuel price hedges. These hedge positions are contracted through financial institutions that are highly regarded in the industry or have “investment grade” risk ratings. Its positions as of December 31, 2015 and 2014, are detailed as follows:
Valuation
As of December 31,
2015
As of December 31,
2014
Note ThUS$ ThUS$
Goldman Sachs (JANY) Fuel Oil Swaps 12 (175) -
Koch Supply & Trading Fuel Oil Swaps 12 (819) -
Banco Santander Cross Currency Forward 12 - (1,100)
Banco Chile Cross Currency Forward 12 - (525)
Total (994) (1,625)
(c) Liquidity Risk
Liquidity risk refers to the Company’s exposure to business or market factors that may affect its ability to generate income and cash flow, including the effect of contingencies and regulatory requirements associated with its business.
CSAV is not directly exposed to the container business, as has been explained at the beginning of this note, but indirectly as main shareholder of HLAG. This limits the Company’s liquidity risk to the expected flow of dividends or any additional capital required by this joint venture.
The Company has medium and long term borrowing mainly to finance the investment in HLAG.
CSAV has sufficient liquidity to cover its direct transport services. However, and in light of the risks described above, CSAV has the following line of credit to be used if needed:
· Committed line of credit for up to US$30,000,000 with Tanner Servicios Financieros S.A. through assignment of credit, which expires in December 2016. As of December 31, 2015, this credit line has not been drawn down.
The Company’s liquidity risk as of December 31, 2015 includes contractual maturities of its financial liabilities, including estimated interest payments, as detailed below:
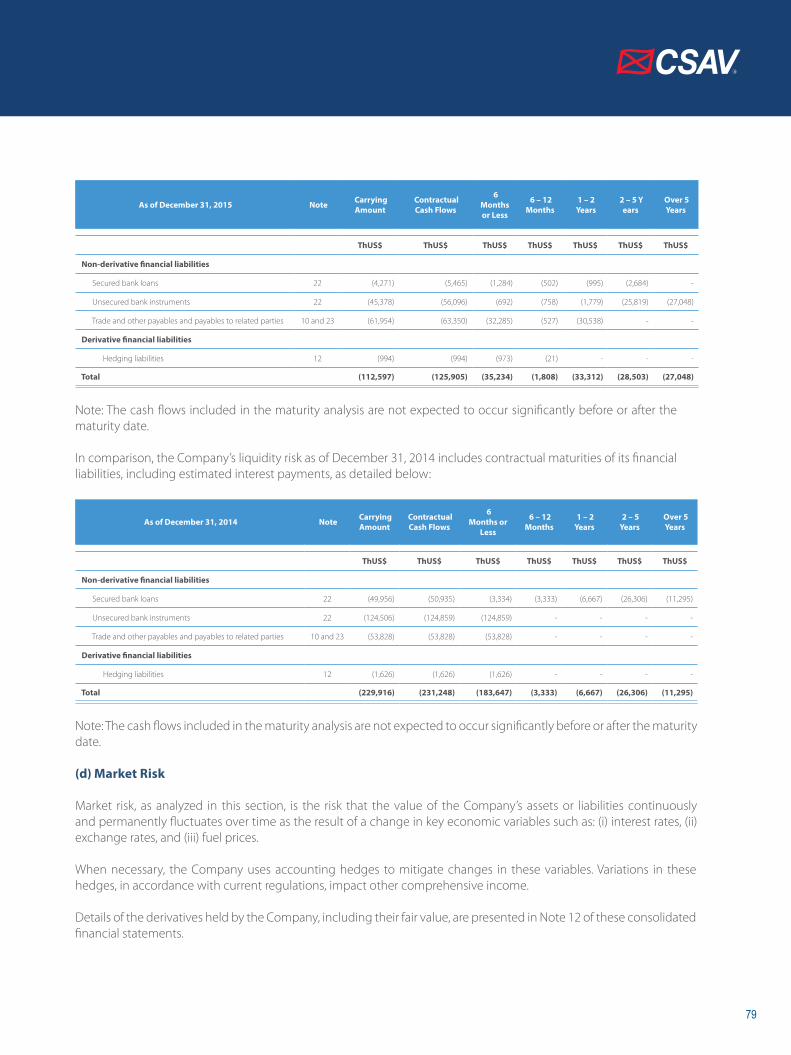
79
As of December 31, 2015 Note Carrying Amount
Contractual Cash Flows
6 Months or Less
6 – 12 Months
1 – 2 Years
2 – 5 Years
Over 5 Years
ThUS$ ThUS$ ThUS$ ThUS$ ThUS$ ThUS$ ThUS$
Non-derivative financial liabilities
Secured bank loans 22 (4,271) (5,465) (1,284) (502) (995) (2,684) -
Unsecured bank instruments 22 (45,378) (56,096) (692) (758) (1,779) (25,819) (27,048)
Trade and other payables and payables to related parties 10 and 23 (61,954) (63,350) (32,285) (527) (30,538) - -
Derivative financial liabilities
Hedging liabilities 12 (994) (994) (973) (21) - - -
Total (112,597) (125,905) (35,234) (1,808) (33,312) (28,503) (27,048)
Note: The cash flows included in the maturity analysis are not expected to occur significantly before or after the maturity date.
In comparison, the Company’s liquidity risk as of December 31, 2014 includes contractual maturities of its financial liabilities, including estimated interest payments, as detailed below:
As of December 31, 2014 Note Carrying Amount
Contractual Cash Flows
6 Months or
Less
6 – 12 Months
1 – 2 Years
2 – 5 Years
Over 5 Years
ThUS$ ThUS$ ThUS$ ThUS$ ThUS$ ThUS$ ThUS$
Non-derivative financial liabilities
Secured bank loans 22 (49,956) (50,935) (3,334) (3,333) (6,667) (26,306) (11,295)
Unsecured bank instruments 22 (124,506) (124,859) (124,859) - - - -
Trade and other payables and payables to related parties 10 and 23 (53,828) (53,828) (53,828) - - - -
Derivative financial liabilities
Hedging liabilities 12 (1,626) (1,626) (1,626) - - - -
Total (229,916) (231,248) (183,647) (3,333) (6,667) (26,306) (11,295)
Note: The cash flows included in the maturity analysis are not expected to occur significantly before or after the maturity date.
(d) Market Risk
Market risk, as analyzed in this section, is the risk that the value of the Company’s assets or liabilities continuously and permanently fluctuates over time as the result of a change in key economic variables such as: (i) interest rates, (ii) exchange rates, and (iii) fuel prices.
When necessary, the Company uses accounting hedges to mitigate changes in these variables. Variations in these hedges, in accordance with current regulations, impact other comprehensive income.
Details of the derivatives held by the Company, including their fair value, are presented in Note 12 of these consolidated financial statements.

80
ANNU
AL R
EPOR
T
2015
(i) Interest rate fluctuations
Interest rate fluctuations impact the Company’s floating rate obligations. All of the Company’s financial obligations are at variable (Libor) rates and have not been hedged.
As of December 31, 2015 and 2014, the Company’s net asset and liability position in interest-bearing financial instruments, by type of interest, is detailed as follows:
As of December 31, 2015
As of December 31, 2014
Note ThUS$ ThUS$
Financial assets at fixed rates:
Time deposits 7 37,303 15,280
Total financial assets at fixed rates 37,303 15,280
Financial assets at variable rates:
Cash on hand and bank balances 7 15,085 30,387
Other financial assets 8
Total financial assets at variable rates 15,085 30,387
Total financial assets 52,388 45,667
Financial liabilities at fixed rates:
Bonds payable 22 - (44,799)
Total financial liabilities at fixed rates - (44,799)
Financial liabilities at variable rates:
Bank loans 22 (49,649) (129,663)
Hedging liabilities 22 (994) (1,626)
Loans from related parties 10 (30,133) -
Total financial liabilities at variable rates (80,776) (131,289)
Total financial liabilities (80,776) (176,088)
Net fixed-rate position 37,303 (29,519)
Net variable-rate position (65,691) (100,902)

81
The Company does not hedge interest rates on loans with variable interest rates based on Libor. The potential effect of interest rate fluctuations on variable-rate financial instruments (assets and liabilities) held by CSAV as of December 31, 2015, that are not hedged is shown in the following table. The variation considers: (i) an increase of 1% in the 6-month Libor rate, which is used for variable-rate financial liabilities, and (ii) an increase of 1% in the overnight Libor rate, which is primarily used to invest cash surpluses. The combined effect on the Company’s results would be the following:
For the years ended
December 31, 2015 2014
ThUS$ ThUS$
Effect on profit or loss of
increase of 100 basis points in 180-day LIBOR and overnight LIBOR (68) (547)
(ii) Exchange rate fluctuations
The Company’s functional currency is the US dollar, which is the currency in which most of its operating income and expenses are denominated, as well as the currency used by most of the global shipping industry. However, the Company also has income and costs in other currencies, such as Chilean pesos and Euros.
Most of the Company’s assets and liabilities are denominated in US dollars. However, the Company has certain assets and liabilities in other currencies, which are detailed in Note 33 to these consolidated financial statements.
The Company does not have any exchange rate hedges as of December 31, 2015, and reduces its risk from exchange rate variations by regularly converting into US dollars any balances in local currency that exceed payment requirements in that currency.
The following table shows the maximum exposure risk to foreign currency fluctuations of the Company’s non-U.S. dollar-denominated financial assets and liabilities as of December 31, 2015 and 2014 (see Note 12 Hedge Assets and Liabilities):
As of December 31, 2015 Euro Real Peso / UF Other Total
ThUS$ ThUS$ ThUS$ ThUS$ ThUS$
Cash and cash equivalents 890 43 842 1,816 3,591
Trade and other receivables (current and non-current) - 95 481 3,013 3,589
Receivables from related parties (current and non-current) - 19 157 2 178
Tax assets - - 6 1,025 1,031
Trade payables and tax liabilities (current and non-current) (109) (2,401) (3,342) (4,848) (10,700)
Payables to related parties (current and non-current) - (26) (411) (1,726) (2,163)
Net exposure 781 (2,270) (2,267) (718) (4,474)

82
ANNU
AL R
EPOR
T
2015
As of December 31, 2014 Euro Real Peso / UF Other Total
ThUS$ ThUS$ ThUS$ ThUS$ ThUS$
Cash and cash equivalents 1,921 149 16,095 921 19,086
Other financial assets (current and non-current) - - 368 - 368
Trade and other receivables (current and non-current) 47 42 3,628 5,562 9,279
Receivables from related parties (current and non-current) 9,356 29 1,783 1 11,169
Unsecured bank instruments - - (43,764) - (43,764)
Trade payables and tax liabilities (current and non-current) (3,166) (564) (5,172) (3,102) (12,004)
Payables to related parties (current and non-current) - (6) (252) (169) (427)
Net exposure 8,158 (350) (27,314) 3,213 (16,293)
The potential effect of a 10% depreciation in the US dollar (US$) with respect to other important currencies to which the Company is exposed as of December 31, 2015, would have an estimated effect of ThUS$ 497 on the Company’s results for 2015, keeping all other variables constant.
Note 6 Segment Reporting
The Company’s operating segments have been determined in accordance with IFRS 8, based on the main business lines developed by the CSAV Group. These activities are reviewed routinely by the Company’s senior management using regularly available information in order to: (i) measure each business’s performance; (ii) evaluate its risks; and (iii) allocate the resources that each business requires.
In determining the operating segments to report, certain segments have been grouped together because they share similar economic characteristics, services and processes, as well as a common regulatory environment, as stipulated in IFRS 8. The information routinely examined by CSAV’s senior management consists of the results and management information for each of the operating segments, whether operated directly by CSAV or its domestic or foreign subsidiaries, associates and joint ventures.
Although the Company’s management and accounting reports may have different classifications and viewpoints, they are both determined using the policies described in Note 3 of these consolidated financial statements. As a result, there are no differences in the totals in measurements of results, assets and liabilities for each segment and the accounting criteria applied in preparing the consolidated financial statements.
In accordance with the preceding paragraphs, the CSAV Group has identified the following two operating segments as of December 31, 2015:
(i) Container shipping: These are the container shipping services operated by HLAG, represented by the investment in that joint venture, plus certain assets and liabilities related to the container shipping business that are still controlled by CSAV (deferred assets, financial liabilities and others).
(ii) Other transport services: These are the transport services directly operated by CSAV and its subsidiaries, such as the vehicle transport, bulk liquids and logistics services.

83
For the year ended December 31, 2015
Container Shipping Other
Transport Services Total
ThUS$ ThUS$ ThUS$ Revenue - 183,086 183,086 Cost of sales - (180,221) (180,221) Gross profit - 2,865 2,865 Other income - 2,178 2,178 Administrative expenses (4,250) (15,400) (19,650) Other expenses - (8) (8) Other gains 1,374 204 1,578 Operating loss (2,876) (10,161) (13,037) Finance income - 283 283 Finance costs (3,628) (288) (3,916) Share of loss of associates (6,488) - (6,488) Exchange differences 4,260 (1,101) 3,159 Loss on indexed assets and liabilities (936) - (936) Loss before tax (9,668) (11,267) (20,935) Income tax benefit (expense) from continuing operations (1,148) 7,024 5,876 Loss from continuing operations (10,816) (4,243) (15,059) Profit (loss) from discontinued operations - - - Loss for the year (10,816) (4,243) (15,059) Profit (loss) attributable to: Loss attributable to owners of the Company (10,816) (3,838) (14,654) Loss attributable to non-controlling interests - (405) (405) Loss for the year (10,816) (4,243) (15,059)
For the year ended December 31, 2014
Container Shipping Other
Transport Services Total ThUS$ ThUS$ ThUS$
Revenue - 235,280 235,280 Cost of sales - (237,126) (237,126) Gross profit - (1,846) (1,846) Other income - 1,855 1,855 Administrative expenses (3,288) (15,869) (19,157) Other expenses - (1,345) (1,345) Other gains (losses) 864,411 (18,294) 846,117 Operating profit (loss) 861,123 (35,499) 825,624 Finance income - 1,246 1,246 Finance costs (3,125) (1,938) (5,063) Share of profit (loss) of associates (87,380) 637 (86,743) Exchange differences 7,361 7,675 15,036 Loss on indexed assets and liabilities (2,570) - (2,570) Profit (loss) before tax 775,409 (27,879) 747,530 Income tax benefit (expense) from continuing operations (129,393) 1,934 (127,459) Profit (loss) from continuing operations 646,016 (25,945) 620,071 Loss from discontinued operations (230,831) - (230,831) Profit (loss) for the year 415,185 (25,945) 389,240 Profit (loss) attributable to: Profit (loss) attributable to owners of the Company 414,714 (26,008) 388,706 Profit attributable to non-controlling interests 471 63 534 Profit (loss) for the year 415,185 (25,945) 389,240

84
ANNU
AL R
EPOR
T
2015
Assets and liabilities by segment as of December 31, 2015 and 2014, are summarized as follows:
As of December 31, 2015 As of December 31, 2014
Container Shipping
Other Transport Services
Total Container Shipping
Other Transport Services
Total
ThUS$ ThUS$ ThUS$ ThUS$ ThUS$ ThUS$Assets per segment 255,883 177,297 433,180 261,629 183,761 445,390Associates and joint ventures 1,792,527 11 1,792,538 1,765,172 11 1,765,183Liabilities per segment 94,456 80,323 174,779 195,008 115,708 310,716Net assets 1,953,954 96,985 2,050,939 1,831,793 68,064 1,899,857
Revenue detailed by geographical area is as follows:
Other Transport Services For the years ended
December 31,
2015 2014
ThUS$ ThUS$ Asia 44,347 34,957 Europe 39,484 52,776 North and South America 99,255 147,547 Total 183,086 235,280
The Company uses the following criteria to measure income, assets and liabilities within each reported segment: (i) income for the segment is composed of revenue and expenses related to operations that are directly attributable to the reporting segment; (ii) income was recorded based on measurement of revenue and expenses according to the criteria defined in Note 3 of these consolidated financial statements (Note 3.16); and (iii) the assets and liabilities reported for the operating segment consist of all assets and liabilities that directly partake in services or operations, and those directly attributable to the segment.
Note 7 Cash and Cash Equivalents
Cash and cash equivalents are detailed in the following table:
As of December 31, 2015
As of December 31, 2014
ThUS$ ThUS$
Cash on hand 12 23 Bank balances 15,073 30,364 Time deposits 37,303 15,280 Total 52,388 45,667
As of December 31, 2015, and December 31, 2014, the Company does not have any funds classified as cash and cash equivalents that are not freely available.

85
As of December 31, 2015 and 2014, cash and cash equivalents are detailed as follows:
As of December 31, 2015
As of December 31, 2014
Currency ThUS$ ThUS$ US$ 48,797 26,581 Chilean peso 842 16,095 Euro 890 1,921 Real 43 149 Yen - 7 Other currencies 1,816 914 Total 52,388 45,667
Note 8 Other Financial Assets
Other financial assets are detailed as follows:
Current Non-Current
As of
December 31, 2015
As of December 31,
2014
As of December 31,
2015
As of December 31,
2014
ThUS$ ThUS$ ThUS$ ThUS$
Other financial instruments - - 1,550 1,664
Total other current financial assets - - 1,550 1,664
Note 9 Trade and Other Receivables
Trade and other receivables are detailed as follows:
Current Non-Current
As of
December 31, 2015
As of December 31,
2014
As of December 31,
2015
As of December 31,
2014
ThUS$ ThUS$ ThUS$ ThUS$ Trade receivables 18,486 23,593 - - Impairment of trade receivables (1,761) (2,013) - - Trade receivables, net 16,725 21,580 - - Other receivables 387 1,821 - 12 Impairment of other receivables - - - - Other receivables, net 387 1,821 - 12 Total receivables, net 17,112 23,401 - 12
Trade receivables are derived mainly from operations linked to the provision of services related to the maritime transport business, logistics operations and other similar activities.
Most current trade receivables are due within three months from the reporting date of the consolidated financial statements.

86
MEM
ORIA
ANU
AL
201
5
Other receivables primarily include prepayments to suppliers and agents, recoverable expenses, receivables from ship owners and receivables from personnel, among others.
The fair value of trade and other receivables does not differ significantly from their carrying amount.
The CSAV Group records provisions when there is evidence of impairment of trade receivables, based on the criteria described in Note 3.10 of these consolidated financial statements, which are summarized below:
Impairment of Receivables Factor
Receivables over 180 days 100%
Legal collections, checks issued with insufficient funds and other similar concepts 100%
High risk customers and agencies, according to each case and market conditions 100%
Trade and other receivables are detailed by maturity in the following table:
As of December 31, 2015 As of December 31, 2014
No. of Customers ThUS$ No. of Customers ThUS$
Current 156 6,352 243 13,343
Due between 1 and 30 days 73 4,696 72 500
Due between 31 and 60 days 93 1,831 46 4,425
Due between 61 and 90 days 42 1,909 33 3,522
Due between 91 and 120 days 43 935 17 729
Due between 121 and 150 days 57 329 20 21
Due between 151 and 180 days 46 1,060 65 861
Total 17,112 23,401
Changes in impairment losses on trade and other receivables are detailed as follows:
As of
December 31, 2015
As of December 31,
2014
ThUS$ ThUS$
Opening balance 2,013 14,556
Increase (decrease) in impairment for the year (252) 213
Decrease in impairment of discontinued operations - (6,412)
Deconsolidation of discontinued operations - (6,344)
Closing balance 1,761 2,013
Once the pre-legal and legal collections steps have been exhausted, the assets are written off against the provision that was recorded. The CSAV Group only uses the allowance method and not the direct write-off method in order to better control and visualize these accounts.

87
Note 10 Balances and Transactions with Related Parties
The net balance of accounts receivable from and payable to non-consolidated related parties is detailed in the following table:
Current Non-Current
As of December 31, 2015
As of December 31, 2014
As of December 31, 2015
As of December 31,
2014
ThUS$ ThUS$ ThUS$ ThUS$
Receivables from related parties 1,288 11,169 - 463
Payables to related parties (4,020) (9,440) (30,000) -
Total (2,732) 1,729 (30,000) 463
Related party receivables:
Receivables from related parties arise from routine business transactions carried out under market conditions, with respect to price and payment.No write-offs or provisions have been recorded during the year for receivables from related parties.
As of December 31, 2015, the Company has no non-current receivables from related parties.
Payables to related parties:
Payables to related parties arise from routine business transactions carried out under market conditions, with respect to price and payment.
The Company signed a contract for a line of credit of ThUS$ 30,000 denominated and payable in US dollars with its parent company Quiñenco S.A. on October 23, 2015, which was disbursed in its entirety on November 9, 2015. This loan will be repaid in one installment at maturity, which will be 18 months after the loan contract was signed. Interest will be paid on a semi-annual basis, with interest accruing at a variable rate of 6 months Libor plus 2.5%. The accrued interest on this loan was ThUS$ 133 as of December 31, 2015 and is presented as a current liability, while the capital is presented as a non-current liability, as follows:
Taxpayer ID of Debtor Debtor
Country of
Debtor
Taxpayer ID of Creditor Creditor Country of
Creditor Currency Repayments Current Portion
Non-Current Portion
Total Debt
Average Annual Interest Rate
ThUS$ ThUS$ ThUS$ Nominal Effective
90.160.000-7
Compañía Sud
Americana de Vapores S.A.
Chile 91,705,000-7 Quiñenco
S.A.Chile US$ At maturity 133 30,000 30,133
LB 6M+2.5%
3.1%

88
ANNU
AL R
EPOR
T
2015
Receivables from related parties are summarized as follows:
Current Non-Current
Taxpayer ID Number Country Company Transaction Relationship Currency
12.31.2015
ThUS$
12.31.2014
ThUS$
12.31.2015
ThUS$
12.31.2014
ThUS$
Foreign Panama CSAV Ships S.A. (1) Current account Common shareholder and/or director US$ - 1 - -
Foreign Panama CNP Holding S.A. (1) Other payments Common shareholder and/or director US$ - 3 - -
Foreign Brazil Companhia Libra de Navegacao S.A. (1) Current account Common shareholder and/or director US$ 20 8 - -
Foreign Panama Corvina Maritime Holding S.A. (1) Current account Common shareholder and/or director US$ - 159 - -
76.380.217-5 Chile CSAV Agenciamiento Marítimo SpA (1) Current account Common shareholder and/or director US$ - 1,174 - -
89.602.300-4 Chile CSAV Austral SpA (1) Current account Common shareholder and/or director US$ 99 - - 463
Foreign Germany CSAV Germany Container GmbH (1) Current account Common shareholder and/or director US$ - 9,405 - -
Foreign India CSAV Group (India) Private Ltd. (1) Current account Common shareholder and/or director US$ 5 5 - -
Foreign Hong Kong CSAV Group Agencies (Hong Kong) (1) Current account Common shareholder and/or director US$ 104 22 - -
Foreign Netherlands CSAV North & Central Europe B.V. (1) Current account Common shareholder and/or director US$ 155 8 - -
Foreign Germany CSAV North & Central Europe GmbH (1) Current account Common shareholder and/or director US$ 81 121 - -
Foreign Spain Compañía Sud. de Vapores Agencia Marítima S.L (1) Current account Common shareholder and/or director US$ 39 - - -
76.380.217-5 Chile Hapag-Lloyd Chile SpA (1) Current account Common shareholder and/or director US$ 756 - - -
Foreign Panama Lanco Investments International Co. S.A. Current account Common shareholder and/or director US$ - 116 - -
94.660.000-8 Chile Marítima de Inversiones S.A. Services Common shareholder and/or director US$ - 2 - -
Foreign Brazil Norgistics Brasil Operador Multimodal Ltda. (1) Current account Common shareholder and/or director US$ 29 49 - -
87.987.300-2 Chile Southern Shipmanagement (Chile) Ltda. (1) Current account Common shareholder and/or director US$ - 96 - -
Total 1,288 11,169 - 463
(1) After closing of the transaction with HLAG these parties are not subsidiaries of CSAV, but of HLAG, and through it CSAV affiliates. Therefore, their balances are presented as related parties.
Payables to related parties are summarized as follows:
Current Non-Current
Taxpayer ID Number Country Company Transaction Relationship Currency
12.31.2015
ThUS$ 12.31.2014
ThUS$
12.31.2015 ThUS$
12.31.2014 ThUS$
Foreign Mexico Agencias Grupo CSAV (México) S.A de C.V. Current account Common shareholder and/or director US$ 11 302 - -
Foreign Uruguay Compañía Libra de Navegación S.A. (Uruguay) (1) Current account Common shareholder and/or director US$ - 30 - -
Foreign Spain Compañía Sud. de Vapores Agencia Marítima S.L (1) Current account Common shareholder and/or director US$ - 109 - -
Foreign Peru Consorcio Naviero Peruano S.A. Current account Common shareholder and/or director US$ 81 337 - -
Foreign Malaysia CSAV Agency (Malaysia) Sdn. Bhd. (1) Current account Common shareholder and/or director US$ - 3 - -
Foreign United States CSAV Agency LLC (1) Current account Common shareholder and/or director US$ 79 258 - -
Foreign Argentina CSAV Argentina S.A. (1) Current account Common shareholder and/or director US$ 107 242 - -
89.602.300-4 Chile CSAV Austral SpA (1) Current account Common shareholder and/or director US$ - 819 - -
Foreign Turkey CSAV Denizcilik Acentai A.S. (1) Current account Common shareholder and/or director US$ - 6 - -
Foreign China CSAV Group (China) Shipping Co. Ltd. (1) Current account Common shareholder and/or director US$ 146 60 - -
Foreign Colombia CSAV Group Agency Colombia Ltda. (1) Current account Common shareholder and/or director US$ - 168 - -
Foreign Hong Kong CSAV Group ( Hong Kong ) Ltda. Current account Common shareholder and/or director US$ 104 - - -
Foreign Belgium CSAV North & Central Europe N.V (1) Current account Common shareholder and/or director US$ 2 30 - -
76.380.217-5 Chile Hapag-Lloyd Chile SpA (1) Current account Common shareholder and/or director US$ 143 3,058 - -
Foreign Dubai CSAV Shipping LLC (1) Current account Common shareholder and/or director US$ - 61 - -
Foreign ENGLAND CSAV UK & Ireland Limited (1) Current account Common shareholder and/or director US$ - 2 - -
Foreign Ecuador Ecuaestibas S.A. Current account Common shareholder and/or director US$ 19 55 - -
96.915.330-0 Chile Iquique Terminal Internacional S.A. Current account Common shareholder and/or director US$ 74 64 - -
Foreign Malta Norasia Container Lines Ltd. Current account Common shareholder and/or director US$ 1,322 1,197 - -
91.705.000-7 Chile Quiñenco S.A. Lines of Credit Parent company US$ 133 - 30,000 - 96.798.520-
1 Chile SAAM Extraportuarios S.A. Current account Common shareholder and/or director US$ 5 - - -
Foreign Panama Southern Shipmanagement Co S.A. Current account Common shareholder and/or director US$ 190 488 - -
87.987.300-2 Chile Southern Shipmanagement (Chile) Ltda. (1) Current account Common shareholder and/or director US$ 61 - - -
92.048.000-4 Chile Sudamericana, Agencias Aéreas y Marítimas SA. Current account Common shareholder and/or director US$ 1,445 2,132 - -
Foreign Peru Tramarsa S.A. Current account Common shareholder and/or director US$ 86 19 - -
82.074.900-6 Chile Transbordadora Austral Broom S.A. Current account Common shareholder and/or director US$ 12 - - -
Total 4,020 9,440 30,000 -
(1) After closing of the transaction with HLAG these parties are not subsidiaries of CSAV, but of HLAG, and through it CSAV affiliates. Therefore, their balances are presented as related parties.

89
Transactions with related parties:
The Company classifies as transactions with related parties those that represent more than 0.1% of Group consolidated costs, which include cost of sales and administrative expenses.
The following table details transactions with related parties:
For the year ended
Company Taxpayer ID Number Country Relationship Transaction
Dec 31, 2015 Dec 31, 2014
ThUS$ ThUS$
Agencias Grupo CSAV (Mexico) SA. de CV (1) Foreign Mexico Common shareholder and/or director Services provided 118 (2,086)
Agrosuper S.A. 76.129.263-3 Chile Common shareholder and/or director Maritime services provided - 2,805
Antofagasta Terminal Internacional S.A. 99.511.240-K Chile Common shareholder and/or director Port services received (304) (4,492)
Companhia Libra de Navegacao S.A.(1) Foreign Brazil Common shareholder and/or director Other services (2,690) -
Compañía Electrometalúrgica S.A. 90.320.000-6 Chile Common shareholder and/or director Maritime services provided - 731
Compañía Sud Americana de Vapores Agencia Maritima (1) Foreign Spain Common shareholder and/or director Services received (194) (11)
Consorcio Naviero Peruano S.A. Foreign Peru Associated Agency services received (21) (2,922)
CSAV Agency LLC (New Jersey) (1) Foreign USA Common shareholder and/or director Services provided 354 -
Hapag-Lloyd Chile SpA (1) 76.380.217-5 Chile Common shareholder and/or director Real estate lease (1,784) 322
Hapag-Lloyd Chile SpA (1) 76.380.217-5 Chile Common shareholder and/or director Administrative and other services (1,154) (174)
Falabella Retail S.A. 77.261.280-K Chile Common shareholder and/or director Maritime services provided - 2,757
Iquique Terminal Internacional SA 96.915.330-0 Chile Common shareholder and/or director Port services received (460) -
Norasia Container Lines LTDA. Foreign Malta Common shareholder and/or director Administrative services provided (5) (8,207)
Quimetal Industrial S.A. 87.001.500-3 Chile Common shareholder and/or director Maritime services provided - 176
Quiñenco S.A. 91.705.000-7 Chile Shareholder Interest accrued (133) -
SAAM S.A. 92.048.000-4 Chile Common shareholder and/or director Maritime services provided 183 1,198
SAAM S.A. 92.048.000-4 Chile Common shareholder and/or director Services received (534) (10,768)
San Antonio Terminal Internacional S.A. 96.908.970-K Chile Common shareholder and/or director Port services received (5) (9,537)
San Vicente Terminal Internacional S.A. 96.908.930-0 Chile Common shareholder and/or director Port services received - (3,348)
Servicio de Procesamiento Naviero Foreign Uruguay Common shareholder and/or director Administrative services received - (2)
Sociedad Quimica Minera Chile S.A. 93.007.000-9 Chile Common shareholder and/or director Maritime services provided - 325
Southern Shipmanagement (Chile) Ltda. 87.987.300-2 Chile Common shareholder and/or director Real estate lease 12 241
Southern Shipmanagement (Chile) Ltda. 87.987.300-2 Chile Common shareholder and/or director Administrative services provided (4,173) (767)
Southern Shipmanagement CO. S.A. Foreign Panama Common shareholder and/or director Administrative services provided (4,256) -
Terminal Portuario de Arica S.A. 99.567.620-6 Chile Common shareholder and/or director Port services received (11) (430)
Trabajos Marítimos S.A. Foreign Peru Common shareholder and/or director Agency services (478) (321)
(1) After closing of the transaction with HLAG these parties are not subsidiaries of CSAV, but of HLAG, and through it CSAV affiliates. Therefore, their transactions are presented as related parties.
Remuneration of Board of Directors and Key Personnel
(a) Board Compensation
During the year ended December 31, 2015, the Company’s directors have received ThUS$ 556 (ThUS$ 601 during the year ended December 31, 2014) for attending board and committee meetings.
In addition the Company has paid ThUS$ 456 as special remuneration to the Chairman of the Board during 2015.
(b) Remuneration of Key Personnel
Key personnel include executives who define the CSAV Group’s strategic policies and have a direct impact on the results of the business.

90
ANNU
AL R
EPOR
T
2015
Compensation of the parent company’s key management personnel amounts to ThUS$ 2,428 for the year ended December 31, 2015 (ThUS$ 6,365 for the year ended December 31, 2014).
For the years ended December 31,
2015 2014
ThUS$ ThUS$
Short-term employee benefits 2,337 6,294
Other benefits 91 71
Total 2,428 6,365
On average 18 CSAV executives were classified as key personnel during the year ended December 31, 2014. During the year ended December 31, 2015, only six executives, on average, were classified as key personnel. The remaining executives were transferred to the corporate structure of HLAG upon transaction close.
The Company has not given any guarantees on behalf of key management personnel.
The Company does not have any compensation plans for key management personnel based on share price.
Note 11 Inventories
The Company’s inventories as of December 31, 2015 and 2014 are detailed as follows:
As of
December 31, 2015
As of December 31,
2014
ThUS$ ThUS$
Fuel 2,158 4,475
Lubricants 69 78
Other inventories 11 11
Total 2,238 4,564
The items included under fuel are on vessels in operation that will be consumed in the normal course of services provided. These items are valued in accordance with Note 3.12.
The cost of fuel consumed was ThUS$ 27,393 for the year ended December 31, 2015 and ThUS$ 51,084 for the year ended December 31, 2014, under continuing operations.
The cost of fuel consumed during the year ended December 31, 2014 under discontinued operations was ThUS$ 482,248.

91
Note 12 Hedge Assets and Liabilities
Hedge assets and liabilities are presented under other current financial assets and other current financial liabilities, respectively, detailed as follows:
As of December 31, 2015 As of December 31, 2014
Assets Liabilities Assets Liabilities
Note ThUS$ ThUS$ ThUS$ ThUS$
Current
Fuel swaps (a) 22 - (994) - -
Cross currency forwards (c) 22 - - - (1,625)
Total - (994) - (1,625)
Explanatory notes for the table above:
(a) Fuel price hedging contracts
As of December 31, 2015, the CSAV Group has the following fuel price hedge contracts:
As of December 31, 2015
Derivative Institution Date of Agreement
Date of Maturity Currency Recognized
in Equity
Recognized in Profit or
Loss Total
Swap Koch Supply & Trading Apr-2015 IV - 2015 US$ - (321) (321)
Swap Koch Supply & Trading May-2015 IV - 2015 US$ - (354) (354)
Swap Koch Supply & Trading Oct-2015 IV - 2015 US$ - (84) (84)
Swap Koch Supply & Trading Oct-2015 II - 2016 US$ (819) - (819)
Swap Goldman Sachs (JANY) Jun-2015 IV - 2015 US$ - (538) (538)
Swap Goldman Sachs (JANY) Oct-2015 II - 2016 US$ (98) - (98)
Swap Goldman Sachs (JANY) Dec-2015 IV - 2016 US$ (77) - (77)
Total (994) (1,297) (2,291)
As of December 31, 2014, the CSAV Group did not have any fuel price hedge contracts.
(b) Interest rate hedges
As of December 31, 2015 and 2014, the Group has not contracted any interest rate swaps to hedge part of its exposure to variable interest rates.

92
ANNU
AL R
EPOR
T
2015
(c) Exchange rate hedges
As of December 31, 2015 As of December 31, 2014
Derivative Institution Date of Agreement
Date of Maturity Currency Recognized in
Equity Recognized in Profit or Loss Total Recognized
in Equity
Recognized in Profit or
Loss Total
Forwards Banco Santander Dec-2014 I - 2015 US$ - 2,393 2,393 (1,100) - (1,100)
Forwards Banco de Chile Dec-2014 I - 2015 US$ - 903 903 (525) - (525)
Total - 3,296 3,296 (1,625) - (1,625)
As may be inferred from the table above, the CSAV Group had no exchange rate hedge contracts as of December 31, 2015.
Note 13 Other Non-Financial Assets
Other non-financial assets are detailed as follows::
Other Non-Financial Assets As of December 31, 2015
As of December 31, 2014
Current ThUS$ ThUS$
Insurance 37 100
Prepaid vessel charters 3,327 4,825
Capitalized in-transit expenses 336 242
Other 254 592
Total current 3,954 5,759
Non-Current ThUS$ ThUS$
Other 121 42
Total non-current 121 42
Insurance is insurance premiums for property and vessels policies that remain in effect after the date these financial statements were closed.
Prepaid vessel charters is for vessels operated by the CSAV group, according to the contractual terms and conditions with ship owners, and are normally consumed within the following 30 to 60 days.
The item “other” includes fees for lighthouses and buoys and other customary duties and advances related to the providing maritime transport services.

93
Note 14 Investments in Subsidiaries
(a) Consolidated Subsidiaries:
The company has investments in subsidiaries, as detailed in Note 3 of these consolidated financial statements, which have been consolidated in these financial statements.
Ownership Interest as of December 31,
Taxpayer ID Company 2015 2014
Direct Indirect Total Direct Indirect Total
Foreign Corvina Shipping Co. S.A. and Subsidiaries 100.00 - 100.00 100.00 - 100.00
89.602.300-4 CSAV Austral SpA (1) 50.01 - 50.01 50.01 - 50.01
Foreign Norgistics (China) Ltd. 100.00 - 100.00 100.00 - 100.00
96.840.950-6 Odfjell y Vapores S.A. 51.00 - 51.00 51.00 - 51.00
Foreign Tollo Shipping Co. S.A. and Subsidiaries 100.00 - 100.00 100.00 - 100.00
76.028.729-6 Norgistics Holding S.A. and Subsidiaries 99.00 1.00 100.00 99.00 1.00 100.00
96.838.110-5 Euroatlantic Container Line S.A. 99.90 0.10 100.00 99.90 0.10 100.00
96.838.050-7 Compañía Naviera Rio Blanco S.A. 99.00 1.00 100.00 99.00 1.00 100.00
Foreign CSAV Germany Container Holding GmbH 100.00 - 100.00 48.00 52.00 100.00
(1) On August 1, 2014, this company changed its name from “Empresa de Transporte Sudamericana Austral Ltda.” to “CSAV Austral SPA” and CSAV now holds 5,001 series A shares, which cannot be consolidated given their characteristics.
(b) Summarized financial information:
Summarized financial information for the Company’s subsidiaries as of December 31, 2015 and 2014, is detailed as follows:
As of December 31, 2015
Company Name Current Assets
Non-Current Assets
Current Liabilities
Non-Current Liabilities Revenue Profit (Loss)
for the Year
ThUS$ ThUS$ ThUS$ ThUS$ ThUS$ ThUS$
Tollo Shipping Co. S.A. and Subsidiaries 111,522 8,686 760,180 3,393 7,677 20,551
Corvina Shipping Co. S.A. and Subsidiaries 757,761 48 6,480 - 32,491 (160)
Odfjell y Vapores S.A. 6,641 9,621 1,641 1,604 8,486 144
Norgistics (China) Ltd. 2,338 31 849 - 3,907 160
Norgistics Holding S.A. and Subsidiaries 5,775 977 3,472 - 15,550 855
Euroatlantic Container Line S.A. 117 - 120 - - (2)
Compañía Naviera Rio Blanco S.A. 24 974 2,364 - - (12)
CSAV Germany Container Holding GmbH 216 1,792,528 907,464 - - 51,847

94
ANNU
AL R
EPOR
T
2015
As of December 31, 2014
Company Name Current Assets
Non-Current Assets
Current Liabilities
Non-Current Liabilities Revenue
Profit (Loss) for the Year
ThUS$ ThUS$ ThUS$ ThUS$ ThUS$ ThUS$
Tollo Shipping Co. S.A. and Subsidiaries 9,164 1,539,847 1,951,553 4,286 18,761 7,064
Corvina Shipping Co. S.A. and Subsidiaries 1,321,108 42 19,660 - 36,675 (19,373)
Odfjell y Vapores S.A. 6,987 9,605 1,020 911 8,224 221
Norgistics (China) Ltd. 3,057 64 997 - 5,770 217
Norgistics Holding S.A. and Subsidiaries 9,003 1,025 7,570 - 22,800 (1,597)
Euroatlantic Container Line S.A. 116 - 117 - - (6)
Compañía Naviera Rio Blanco S.A. 23 974 2,147 204 - (16)
Summarized information regarding subsidiaries with non-controlling interests:
As of December 31, 2015 As of December 31, 2014
Odfjell y Vapores S.A.
Maritime Shipping & Trading
International Inc.
Maritime Shipping Trading
Inc.
OV Bermuda
LimitedTotal Odfjell y
Vapores S.A.
Maritime Shipping & Trading
International Inc.
Maritime Shipping Trading
Inc.
OV Bermuda Limited
Total
Non-controlling interest % 49% 50% 50% 50% ThUS$ 49% 50% 50% 50% ThUS$
Current assets 6,641 41 332 2,524 9,538 6,987 41 1,672 2,810 11,510
Non-current assets 9,621 - - 8,650 18,271 9,605 - - 8,420 18,025
Current liabilities 1,641 - 54 3,840 5,535 1,020 1 1,388 2,056 4,465
Non-current liabilities 1,604 - - 3,393 4,997 911 - - 4,286 5,197
Net assets 13,017 41 278 3,941 17,277 14,661 40 284 4,888 19,873
Total non-controlling interests 6,378 21 139 1,971 8,509 7,184 20 142 2,444 9,790

95
Summarized information regarding subsidiaries with non-controlling interests:
As of December 31, 2015 As of December 31, 2014
Odfjell y Vapores
S.A.
Maritime Shipping & Trading
International Inc.
Maritime Shipping
Trading Inc.
OV Bermuda
LimitedTotal
Odfjell y Vapores
S.A.
Maritime Shipping & Trading
International Inc.
Maritime Shipping
Trading Inc.
OV Bermuda
LimitedTotal
Non-controlling interest % 49% 50% 50% 50% ThUS$ 49% 50% 50% 50% ThUS$
Revenue 8,486 - 63 7,613 16,163 8,224 - 3,237 8,543 20,004
Profit (loss) for the year 144 1 (7) (943) (805) 221 (1) 4 (94) 130
Total comprehensive income 144 1 (7) (943) (805) 221 (1) 4 (94) 130
Profit (loss) attributable to non-controlling interests
71 1 (4) (473) (405) 108 (1) 2 (47) 62
Net cash flows provided by (used in) operating activities
2,159 (15) (308) 1,811 3,647 3,006 (1) (71) 640 3,574
Net cash flow provided by (used in) investing activities
(1,478) - - (1,458) (2,936) (1) - - - (1)
Net cash flows provided by (used in) financing activities, before minority dividends
- - - - - - - - - -
Net cash flows provided by (used in) financing activities
(1,500) - - 462 (1,038) - - - (1,041) (1,041)
Note: The consolidated statement of income for 2014, the non-controlling interest in “CSAV Group Agencies South Africa Ltd.” and “SSM Panama Group” until November 2014, when both subsidiaries were transferred to HLAG. The non-controlling interest in these subsidiaries under discontinued operations (Note 35) was ThUS$ 472, and when added to the ThUS$ 62 associated with continuing operations presented in the table above, arrive at a total of ThUS$ 534.
(c) Movements in investments:
c.1) During the year ended December 31, 2015, the CSAV Group has not acquired or sold any investments in subsidiaries.
c.1.1) Other movements in subsidiaries in 2015:
Tollo Shipping Co. S.A. transferred to Sud Americana Company of Vapors S.A. (CSAV) its 52% stake in the subsidiary CSAV Germany Container Holding GmbH on April 8, 2015. CSAV had a 48% stake in this company prior to the transfer, and therefore now owns 100%. This transaction did not have any effect on CSAV’s results or consolidated assets and liabilities.

96
ANNU
AL R
EPOR
T
2015
In the remaining subsidiaries, no purchases, sales or contributions between the parent company and/or the Group’s subsidiaries, or any other type of corporate restructuring processes, have taken place that should be disclosed, other than operating changes in specific existing companies.
c.1.2) Dividends paid by subsidiaries in 2015:
During 2015, the subsidiary Odfjell y Vapores S.A. paid a total of ThUS$ 735 in dividends to non-controlling interests as indicated in the statement of changes in equity and the consolidated statement of cash flows.
c.2) During the year ended December 31, 2014, no purchases or sales of investments in subsidiaries took place, except for the Transaction close with HLAG under the BCA on December 2, where the Company transferred to HLAG the subsidiary “CSAV Germany Container GmbH” (hereinafter “CCCO”) and all other container shipping subsidiaries owned by the Group as of that date. The consideration for this contribution is the 30% interest in HLAG that CSAV received in exchange and, therefore, there was no amount collected or rights receivable for the contribution of CCCO and its subsidiaries.
c.2.1) Other movements in subsidiaries in 2014
As part of the Business Combination Agreement (BCA) between CSAV and HLAG, and as explained in Note 40 of the consolidated financial statements as of December 31, 2014, the following transactions have taken place between the Group companies that are subsidiaries of CSAV:
(i) On February 27, 2014, the new subsidiary, Corvina Maritime Holding Inc., was formed with contributions from Corvina Shipping CO S.A., of its investments in Rahue Investment Co. S.A., Maule Shipping Co. S.A., Malleco Shipping Co. S.A., Lanco Investment International Co. S.A. and Sea Lion Shipping Co S.A., plus some net intercompany balances receivable and payable outstanding as of December 31, 2013. Subsequently, Corvina Shipping Co. S.A. sold its 100% interest in Corvina Maritime Holding Inc. to Tollo Shipping Co. S.A. (hereinafter Tollo).
(ii) On May 20, 2014, CSAV purchased 20 shares of the Chilean company CSAV Inversiones Navieras S.A. (hereinafter “CINSA”) from the Panamanian company Corvina Maritime Holding Inc. As a result, from that date CSAV is the sole shareholder of CINSA. This transaction resulted in the merger and absorption of CINSA by CSAV, making CSAV a direct shareholder in CINSA’s subsidiaries.
(iii) On April 16, 2014, the companies CSAV Germany Container GmbH (hereinafter CCCO) and CSAV Germany Container Holding GmbH (hereinafter CGCH) were formed and were wholly owned by CSAV. As part of the merger process mentioned in this section, during the year CSAV contributed to CCCO all of the subsidiaries acquired in the merger process with CINSA, as indicated above, as well as its interest in the companies Compañía Sud Americana de Vapores GmbH, CSAV Agency LLC, CSAV Austral SPA and Compañía Libra de Navegacao S.A., together with other assets owned by CSAV and novated liabilities.
(iv) During the year and after incorporating CCCO, Tollo transferred to this company all of its assets and liabilities related to CSAV’s container shipping business, becoming its majority shareholder with close to 52% of its share capital.
(v) On December 2, 2014 (the Transaction close) CSAV and Tollo contributed to HLAG all of their interests in CCCO, receiving as consideration a 30% interest in the combined entity.
(vi) On December 3, 2014, CSAV and Tollo contributed and sold to CGCH the 30% interest they each held in HLAG.
As these transactions took place among entities under common control, all contributions and transfers in points (i) to (iv) and (vi) had no impact on consolidated profit and loss.

97
c.2.2) Dividends paid by subsidiaries in 2014
During the year 2014, the Group subsidiaries did not pay any dividends to their non-controlling interests.
Note 15 Equity Method Investments
Movements in investments in associates and joint ventures as of December 31, 2015, are detailed as follows:
Name of Associate or Joint Venture Country
Currency
Direct and Indirect
Ownership Interest
Opening Balance
Capital Movements
and Dividends
Result due to
Dilution of Stake
Share of
Profit (Loss)
Share of Other Comprehensive
Income
Interest in
Other Equity
Reserves
Closing Balance as of December 31,
2015
ThUS$ ThUS$ ThUS$ ThUS$ ThUS$ ThUS$ ThUS$
Odfjell & Vapores Ltd. (Bermuda) Bermuda US$ 50.00% 11 - - - - - 11
Hamburg Container Lines Holding Germany Euro 50.00% 123 - - (8) (13) - 102
Hapag-Lloyd A.G. Germany Euro 31.35% 1,765,049 29,701 (83,919) 77,439 (1,457) 5,612 1,792,425
Total 1,765,183 29,701 (83,919) 77,431 (1,470) 5,612 1,792,538
Movements in CSAV’s investment in the Hapag-Lloyd AG (HLAG) joint venture during the year ended December 31, 2015, are detailed as follows:
(a) Capital Increase HLAG carried out a capital increase on November 6 through an initial public offer of shares, (hereinafter IPO), which consisted in issuing 13,228,680 shares, of which 1,366,991 shares were subscribed and paid by the subsidiary CSAV Germany Container Holding GmbH at a value of Euro 20 per share, equivalent in total to ThUS$ 29,701. This transaction diluted CSAV’s stake in HLAG by 2.65%, to a share value less than the book value, which caused a loss in CSAV’s stake in HLAG, due to a reduction in the value of the investment equivalent to ThUS$ 83,919.
(b) Share of Profit (Loss): Profit attributable to the owners of the controller of HLAG for the year ended December 31, 2015, was ThUS$ 123,900. To this amount, CSAV must add the fair value adjustment of the assets and liabilities of HLAG, based on the PPA (Purchase Price Allocation) report performed upon acquisition. That adjustment for the year ended December 31, 2015, amounts to a gain of ThUS$ 101,334 on the figure reported by HLAG. Thus, the joint venture reported total profit of ThUS$ 225,234 for the purpose of calculating CSAV’s equity method value. Considering the ownership percentage for each quarter, a profit of ThUS $ 77,439 is obtained.
(c) Share of other comprehensive income (loss) and other reserves: HLAG recorded other comprehensive income (in US dollars) for the year ended December 31, 2015, of ThUS$ 45,500 from revaluing its defined benefit plans (at CSAV’s ownership percentage: ThUS$ 15,710), a loss of ThUS$ 51,100 for exchange differences (at CSAV’s ownership percentage: ThUS$ 17,064), and a loss of ThUS$ 1,300 on cash flow hedges (at CSAV’s ownership percentage: ThUS$ 397), giving a total loss of ThUS$ 4,300 and a loss of ThUS$ 1,457 for CSAV’s ownership percentage in the other comprehensive loss of the joint venture. In addition, the Company recognized its participation in other equity increases at HLAG for a total of ThUS$ 5,612 during the year, explained by a business combination within the HLAG consolidation group and by the costs of the capital increase disclosed by HLAG within other reserves.

98
ANNU
AL R
EPOR
T
2015
Movements in investments in associates and joint ventures as of December 31, 2014, are detailed as follows:
Name of Associate or Joint Venture Country Currency
Direct and Indirect
Ownership Interest
Opening Balance
Capital Movements and Dividends
Share of Profit (Loss)
Other Variations
Closing Balance as of December 31,
2014
ThUS$ ThUS$ ThUS$ ThUS$ ThUS$
Dry Bulk Handy Holding Inc. (1) Monaco US$ 50.00% 2,733 - 536 (3,269) -
Odfjell & Vapores Ltd. (Bermuda) Bermuda US$ 50.00% 17 - (6) - 11
Vogt & Maguire Shipbroking Ltd. (1) England Pound 50.00% 145 (167) 107 (85) -
Hamburg Container Lines Holding Germany Euro 50.00% - 123 - - 123
Hapag-Lloyd A.G. (2) Germany Euro 34.00% - 1,852,429 (87,380) - 1,765,049
Total 2,895 1,852,385 (86,743) (3,354) 1,765,183
Discontinued Operations
Consorcio Naviero Peruano S.A. Peru US$ 47.97% 10,237 - 3,808 (11,697) -
Total 10,237 - 3,808 (11,697) -
(1) In June 2014, the Company sold its interest in these companies, generating a net loss of ThUS$ 18,656, which is presented within the account “other gains (losses)” in the consolidated statement of income for the year ended December 31, 2014.
(2) The Group acquired 30% of HLAG on December 2, 2014, and an additional 4% at a later date through the capital increase described in point 3 below.
(3) The figure ThUS$ 1,852,429 can be broken down as follows: (i) the acquisition of 30% of HLAG on December 2, 2014, valued at ThUS$ 1,530,900 and (ii) a capital increase in HLAG subscribed by the subsidiary CSAV Germany Container Holding GmbH on December 19, 2014, consisting of a cash contribution of ThUS$ 243,109 paid in euros and a contribution in kind (accounts receivable) of ThUS$ 78,420.

99
Summarized financial information regarding associates and joint ventures as of December 31, 2015:
Name of Associate or Joint Venture Ownership Interest
Current Assets
Non-Current Assets
Current Liabilities
Non-Current Liabilities Revenue Cost of Sales
Profit (Loss) for the Year
(2)
ThUS$ ThUS$ ThUS$ ThUS$ ThUS$ ThUS$ ThUS$
Odfjell & Vapores Ltd. (Bermuda) 50.00% 23 - - - - - -
Hamburg Container Lines Holding GmbH & Co. KG 50.00% 180 30 7 - - - (9)
Hapag-Lloyd AG. (1) 31.35% 1,704,800 10,363,700 2,613,300 3,958,400 10,029,400 (9,147,200) 123,900
(1) (*) This information comes directly from the consolidated financial statements of HLAG in US$ and, therefore, does not include the effects of the PPA performed by CSAV.(2) Profit (loss) attributable to the owners of the controller for each associate and joint venture.
Summarized financial information regarding associates and joint ventures as of December 31, 2014:
Name of Associate or Joint Venture Ownership Interest
Current Assets
Non-Current Assets
Current Liabilities
Non-Current Liabilities Revenue Cost of Sales
Profit (Loss) for the Year
(2)
ThUS$ ThUS$ ThUS$ ThUS$ ThUS$ ThUS$ ThUS$
Odfjell & Vapores Ltd. (Bermuda) 50.00% 23 - - - - - (12)
Hamburg Container Lines Holding GmbH & Co. KG 50.00% 246 - - - - - -
Hapag-Lloyd AG. (1) 34.00% 2,194,464 10,092,297 2,680,907 4,537,705 9,180,929 (9,195,200) (800,446)
(1) (*) This information comes directly from the consolidated financial statements of HLAG in US$ and, therefore, does not include the effects of the PPA performed by CSAV.(2) Profit (loss) attributable to the owners of the controller for each associate and joint venture.
Note 16 Intangible Assets Other than Goodwill
The following table shows the detail of intangible assets other than goodwill, as of December 31, 2015 and 2014:
As of December 31, 2015 As of December 31, 2014
Gross Value Accumulated Amortization Net Value Gross Value Accumulated
Amortization Net Value
ThUS$ ThUS$ ThUS$ ThUS$ ThUS$ ThUS$
Patents, trademarks and other rights, net 123 (31) 92 - - -
Computer software 28 (25) 3 28 (21) 7
Total intangible assets 151 (56) 95 28 (21) 7

100
ANNU
AL R
EPOR
T
2015
The movements in intangible assets other than goodwill, for the years ended December 31, 2015 and 2014 are as follows:
Movements as of December 31, 2015 Patents,
Trademarks and Other Rights
Computer Software
Total Intangible Assets
ThUS$ ThUS$ ThUS$
Opening net balance as of January 1, 2015 - 7 7
Other increases (decreases) 116 - 116
Amortization for the year (24) (4) (28)
Closing net balance as of December 31, 2015 92 3 95
(1) The value of ThUS$ 116 arises from reclassifying goodwill paid by Norgistics Brazil Transportes Ltda. to buy its freight forwarding division, to intangible assets on reclassifying it to a commercial right.
Movements as of December 31, 2014 Patents,
Trademarks and Other Rights
Computer Software
Total Intangible Assets
ThUS$ ThUS$ ThUS$
Opening net balance as of January 1, 2014 36 309 345
Additions - 9 9
Amortization for the year (9) (9)
Disposal for transaction (36) (302) (338)
Closing net balance as of December 31, 2014 - 7 7
Note 17 Goodwill
Goodwill is detailed as follows:
As of December 31, 2015
As of December 31, 2014
ThUS$ ThUS$
Navibras Comercial Marítima e Afretamentos Ltda. - 1,117
Compañía Naviera Rio Blanco S.A. - 3,142
Norgistics Holding S.A. 17 17
Norgistics Brasil Transportes Ltda. - 116
Total 17 4,392

101
The movement in goodwill for the years ended December 31, 2015 and 2014, is as follows:
As of December 31, 2015
As of December 31, 2014
ThUS$ ThUS$
Opening balance as of January 1 4,392 103,294
Additions for the year - 4,392
Other movements (116) -
Impairment loss (4,259) (103,294)
Closing balance as of December 31 17 4,392
Goodwill has been generated in the acquisition of subsidiaries and businesses that have enabled the Company to operate its business segments.
During the year ended December 31, 2015, Other movements include the reclassification of acquired goodwill asset arising from the purchase of Norgistics Brasil Transportes Ltda.’s freight forwarding division to a commercial right for ThUS$ 116.
During 2015 the Company decided to provide against impairment losses associated with goodwill on its investments and the investments of Tollo Shipping Co. S.A. in subsidiaries Compañía Naviera Rio Blanco S.A. and Navibras Comercial Marítima e Afretamentos Ltda. This provision resulted in a loss of ThUS$ 4,259 within Other gains (losses) in the consolidated statement of income.
As explained in Note 3.8, each year the Company performs an evaluation that allows it to validate the value of acquired goodwill by estimating and sensitizing the future cash flows of each business segment discounted to a cost-of-capital rate.
Note 18 Property, Plant and Equipment
Property, plant and equipment (PPE) are summarized as follows:
As of December 31, 2015 As of December 31, 2014
Gross PP&E
Accumulated Depreciation Net PP&E Gross
PP&E Accumulated Depreciation Net PP&E
ThUS$ ThUS$ ThUS$ ThUS$ ThUS$ ThUS$ Land 2,142 - 2,142 2,142 - 2,142 Buildings 4,270 (1,225) 3,045 4,829 (1,011) 3,818 Machinery and equipment 16 (16) - 16 (16) - Office equipment 207 (98) 109 176 (45) 131 Vessels 22,536 (4,270) 18,266 22,135 (4,116) 18,019 Transportation equipment 29 (29) - 29 (24) 5 Other 1,406 (241) 1,165 1,394 (223) 1,171 Total 30,606 (5,879) 24,727 30,721 (5,435) 25,286

102
ANNU
AL R
EPOR
T
2015
The items Land and Buildings include land, constructions and facilities belonging to the CSAV Group that are used for its normal operations. Machinery includes machinery acquired by the Group that is used to provide services. Vessels includes ships owned by the Group and all of their components.
As of the date these consolidated financial statements were closed, the Company and its subsidiaries had not detected any signs of impairment in its property, plant and equipment. Certain operating assets with long-term useful lives, mainly vessels, are valued using the present value of their operating cash flow. As a result, the current short-term negative market conditions do not significantly affect their value.
The details and movements of property, plant and equipment as of December 31, 2015, are as follows:
As of December 31, 2015 Land
Buildings, Net
Machinery and Equipment,
Net
Office Equipment,
Net
Vessels, Net
Transportation Equipment, Net
Other Property, Plant and
Equipment, Net
Total Property, Plant and
Equipment, Net
ThUS$ ThUS$ ThUS$ ThUS$ ThUS$ ThUS$ ThUS$ ThUS$
Opening balance 2,142 3,818 - 131 18,019 5 1,171 25,286
Additions - - - 8 2,734 - 13 2,755
Depreciation expense - (80) - (30) (2,487) (5) (19) (2,621)
Reclassified to/from investment property - (693) - - - - - (693)
Total changes - (773) - (22) 247 (5) (6) (559)
Closing balance 2,142 3,045 - 109 18,266 - 1,165 24,727
The details and movements of property, plant and equipment as of December 31, 2014, are as follows:
As of December 31, 2014 Construction in Progress Land
Buildings,
Net
Machinery and
Equipment, Net
Office Equipment,
Net
Vessels, Net
Transportation Equipment, Net
Other Property, Plant and
Equipment, Net
Total Property, Plant and
Equipment, Net
ThUS$ ThUS$ ThUS$ ThUS$ ThUS$ ThUS$ ThUS$ ThUS$ ThUS$
Opening balance 57,447 2,142 16,326 41,780 4,891 1,099,581 103 2,786 1,225,056
Additions 122,390 - - 1 552 - 107 660 123,710
Disposals (sale of assets) - - - (488) (350) (14) (105) (957)
Depreciation expense - - (192) - (343) (2,276) (6) (13) (2,830)
Depreciation expense for discontinued operations
- - (3) (2,686) (1,462) (42,715) (51) (521) (47,438)
Increase (decrease) due to changes in exchange rates
- - - - (24) - - (69) (93)
Reclassified to/from investment property
- - (12,299) - - - - - (12,299)
Disposal for transaction (97,012) - (29) (38,395) (3,529) (1,119,397) (134) (1,286) (1,259,782)
Other increases (decreases) (82,825) - 15 (212) 396 82,826 - (281) (81)
Total changes (57,447) - (12,508) (41,780) (4,760) (1,081,562) (98) (1,615) (1,199,770)
Closing balance - 2,142 3,818 - 131 18,019 5 1,171 25,286
Note: As of December 31, 2015 and 2014, the Company has classified part of its property, plant and equipment that is no longer used directly in its operations but is leased to third parties as investment property, as detailed in Note 19.

103
(a) Commitments for the purchase and building of vessels and other property, plant and equipment:
(i) Vessels under construction
As of December 31, 2015, the Company has no current shipbuilding contracts.
(b) Additional information on property, plant and equipment
As of the date these consolidated financial statements were closed, the Company had mortgages on certain assets to guarantee financial obligations. The following items of property, plant and equipment serve to guarantee financial obligations:
(i) M/N Bow Condor owned by the subsidiary OV Bermuda Limited, for a loan from DNB Bank ASA.
Note 19 Investment Property
The details and movements of investment property as of December 31, 2015 and 2014, are as follows:
As of December 31, 2015 Buildings, Net Total Investment Property
ThUS$ ThUS$ Opening balance 12,286 12,286 Transfers to (from) PPE 693 693 Depreciation expense (126) (126) Total changes 567 567
Closing balance 12,853 12,853
As of December 31, 2014 Buildings, Net Total Investment Property
ThUS$ ThUS$ Opening balance - - Transfers to (from) PPE 12,299 12,299 Depreciation expense (13) (13) Total changes 12,286 12,286
Closing balance 12,286 12,286
As of December 31, 2014, the Company had classified part of its property, plant and equipment that is not directly used in its operations but is leased to third parties as investment property (see Note 18) in accordance with the accounting policy described in Note 3 section 3.6 of these consolidated financial statements.
During the years ended December 31, 2015 and 2014, the Company has disclosed revenues associated with its investment properties of ThUS$ 2,084 and ThUS$ 1,033 respectively.
The estimated fair value of the Company’s investment property as of December 31, 2015 was ThUS$ 19,514, which is greater than its book value.

104
ANNU
AL R
EPOR
T
2015
Note 20 Current Tax Assets and Liabilities
The balances of current and non-current tax assets and liabilities are detailed as follows:
Current tax assets:
Current Tax Assets As of December 31, 2015
As of December 31, 2014
ThUS$ ThUS$
Current tax receivables
VAT recoverable 834 798
Monthly provisional tax payments 270 169
Recoverable income taxes 2,085 1,439
Other tax credits - 888
Total current tax assets 3,189 3,294
Current tax liabilities:
Current Tax Liabilities As of December 31, 2015
As of December 31, 2014
ThUS$ ThUS$
Current tax payables
Income taxes payable 438 306
VAT payable 1 8
Total current tax liabilities 439 314
Note 21 Current and Deferred Income Taxes
(a) In Chile, profits from investments in foreign companies are levied with Corporate Income Tax (“Impuesto a la Renta de Primera Categoría”) in the year in which profits are obtained. The Company received dividends from Norgistics China of ThUS$ 662 in 2015, which form part of taxable income. However, the Company had a net tax loss as of December 31, 2015, so has not made any provisions for corporate income tax.
On May 20, 2014, CSAV purchased 20 shares of the Chilean company CSAV Inversiones Navieras S.A. (hereinafter CINSA) from the Panamanian company Corvina Maritime Holding Inc. As a result, from that date CSAV is the sole shareholder of CINSA. In conformity with article 103 No.2 of Law 18,046, CINSA was fully dissolved on May 31, 2014, and its assets, liabilities, rights and obligations, including tax rights and obligations, were transferred to CSAV.
(b) As of December 31, 2015, CSAV has not recorded an income tax provision because it has estimated tax losses of ThUS$ 1,141,891 (ThUS$ 1,119,187 as of December 31, 2014).

105
(c) As of December 31, 2015 and 2014, the Company has not recorded any accumulated earnings and profits or any retained non-taxable earnings. It has recorded a provision of ThUS$ 13 as of December 31, 2015 (ThUS$ 50 as of December 31, 2014) for Article 21 tax (tax on disallowable expenditure).
(d) Deferred taxes
Deferred tax assets and liabilities are offset if the right to set-off has been legally recognized, and if the deferred taxes are associated with the same tax authority, and if the type of temporary differences is equivalent. The offset amounts are as follows:
The detail of deferred tax assets as of December 31, 2015 and 2014 are as follows:
Temporary Differences
Deferred Tax Assets
As of December 31, 2015
As of December 31, 2014
ThUS$ ThUS$
Vacation accrual - -
Tax losses 307,051 298,368
Provisions 6,359 8,240
Post-employment obligations - -
Revaluation of financial instruments 238 -
Revaluation of PP&E - -
Depreciation - -
Tax credits - -
Amortizations - -
Accruals - 23
Other - 753
Total 313,648 307,384
The detail of deferred tax liabilities as of December 31, 2015 and 2014 are as follows:
Temporary Differences
Deferred Tax Liabilities
As of December 31, 2015
As of December 31, 2014
ThUS$ ThUS$
Revaluation of PP&E - (577)
Depreciation (1,604) (435)
Accruals - (2)
Other (345) (54)
Total (1,949) (1,068)

106
ANNU
AL R
EPOR
T
2015
Movements in deferred tax assets and liabilities during the year ended December 31, 2015 were as follows:
Temporary Differences on Assets Opening
Balance as of January 1,
2015
Recognized in Profit (Loss)
Recognized in Equity
Other Variations
Closing Balance as of December 31,
2015
ThUS$ ThUS$ ThUS$ ThUS$ ThUS$ Tax losses 298,368 8,683 - - 307,051 Provisions 8,240 (1,881) - 6,359 Post-employment obligations - - - - - Revaluation of financial instruments - 346 (108) - 238 Revaluation of PP&E - - - - - Depreciation - - - - - Tax credits - - - - - Amortizations - - - - - Accruals 23 (23) - - - Other deferred taxes 753 (753) - - - Total deferred tax assets 307,384 6,372 (108) - 313,648
Temporary Differences on Liabilities Opening
Balance as of January 1,
2015
Recognized in Profit (Loss)
Recognized in Equity
Other Variations
Closing Balance as of December 31,
2015
ThUS$ ThUS$ ThUS$ ThUS$ ThUS$ Revaluation of PP&E 577 (577) - - - Depreciation 435 881 288 - 1,604 Amortizations - - - - - Accruals 2nd (2) - - - Other deferred taxes 54 291 - 345 Total deferred tax liabilities 1,068 593 288 - 1,949
Movements in deferred tax assets and liabilities during the year ended December 31, 2014 were as follows:
Temporary Differences on Assets Opening
Balance as of January 1,
2014
Recognized in Profit (Loss)
Recognized in Equity
Other Variations
Closing Balance as of December 31,
2014
ThUS$ ThUS$ ThUS$ ThUS$ ThUS$ Vacation provision 179 (179) - - - Tax losses 387,397 (117,027) 76,988 (48,990) 298,368 Provisions 14,715 (6,505) - 30 8,240 Post-employment obligations 70 - - (70) - Revaluation of financial instruments 110 (343) 343 (110) - Revaluation of PP&E 4 - - (4) - Depreciation 221 - - (221) - Tax credits 18 - - (18) - Amortizations 31 - - (31) - Accruals 141 7 - (125) 23 Other deferred taxes 2,200 (1,206) - (241) 753 Total deferred tax assets 405,086 (125,253) 77,331 (49,780) 307,384

107
Temporary Differences on Liabilities Opening
Balance as of January 1,
2014
Recognized in Profit (Loss)
Recognized in Equity
Other Variations
Closing Balance as of December 31,
2014
ThUS$ ThUS$ ThUS$ ThUS$ ThUS$ Revaluation of PP&E 679 (260) - 158 577 Depreciation 435 - - - 435 Amortizations - - - - - Accruals 2nd - - - 2 Other deferred taxes 1,223 (1,140) - (29) 54 Total deferred tax liabilities 2,339 (1,400) - 129 1,068
(e) Effect of current and deferred income taxes on profit or loss
For the years ended December 31,
2015 2014
ThUS$ ThUS$ Current income tax expense Current tax expense 56 (3,064) Tax on disallowable expenditure (*) (19) (30) Adjustments to prior year taxes (175) (1) Other tax expenses 235 (511) Total current tax benefit (expense), net 97 (3,606)
Deferred tax expense Origin and reversal of temporary differences 6,372 (123,640) Reversal of deferred tax assets - (16) Other deferred tax expenses (593) (197) Total deferred tax benefit (expense), net 5,779 (123,853) Income tax benefit (expense) 5,876 (127,459)
Income tax benefit (expense), continuing operations 5,876 (127,459) Income tax expense, discontinued operations - (16,401)
(*) Article 21 of Income Tax Law.

108
ANNU
AL R
EPOR
T
2015
(a) Taxes recognized in profit or loss by foreign and Chilean entities:
For the years ended December 31,
2015 2014
ThUS$ ThUS$ Current tax expense: Current tax expense, net, foreign (115) (3,629) Current tax expense, net, Chilean 212 23 Current tax benefit (expense), net 97 (3,606)
Deferred tax expense: Deferred tax benefit, foreign - - Deferred tax benefit (expense), Chilean 5,779 (123,853) Deferred tax benefit (expense), net 5,779 (123,853)
Income tax benefit (expense), net 5,876 (127,459)
Income tax benefit(expense), continuing operations 5,876 (127,459) Income tax expense, discontinued operations - (16,401)
(b) Reconciliation of Effective Tax Rate
An analysis and reconciliation of the income tax rate calculated in accordance with Chilean tax legislation and of the effective tax rate are detailed below:
Reconciliation of Effective Tax Rate As of December 31, 2015 As of December 31,
2014
ThUS$ ThUS$ Profit (loss) for the year (15,059) 389,240 Loss from discontinued operations - (230,831) Total income tax benefit (expense) 5,876 (127,459) Profit (loss) before tax (20,935) 747,530 Reconciliation of effective tax rate 22,50% 4,710 21.00% (156,981)
Tax effect of rates in other jurisdictions 78.85% 16,507 1.13% (8,482) Tax effect of non-taxable revenue 2.02% 422 (2.61%) 19,515 Tax calculated with applicable rate 15.49% 3,242 (2.40%) 17,970 Other increase (decrease) in statutory taxes 90.78% (19,005) (0.07%) 519 Total adjustments to tax benefit using statutory rate 5.57% 1,166 (3.95%) 29,522 Income tax benefit (expense) using effective rate 28.07% 5,876 17.05% (127,459)
Income tax (expense) benefit, continuing operations 5,876 (127,459) Income tax expense, discontinued operations - (16,401)
(f)
(g)

109
Law No. 20,780, published on September 29, 2014, modified the corporate tax rate applicable to profits obtained in 2014 and subsequent years, leaving the rate at 20%. The calculation of current and deferred income taxes takes into account these new tax rates as detailed in Note 3.13 of these consolidated financial statements.
Note 22 Other Financial Liabilities
Other financial liabilities are detailed as follows:
Other Financial Liabilities As of December 31, 2015
As of December 31, 2014
Current Current
ThUS$ ThUS$
Bank loans (a) 2,045 125,378
Bonds payable (b) - 6,216
Hedging liabilities (Note 12) 994 1,625
Total current 3,039 133,219
Other Financial Liabilities As of December 31, 2015
As of December 31, 2014
Non-Current Non-Current
ThUS$ ThUS$
Bank loans (a) 47,604 4,286
Bonds payable (b) - 38,583
Total Non-Current 47,604 42,869
(a) Current bank loans:
As of December 31, 2015
Taxpayer ID of Debtor
Name of Debtor
Country of Debtor
Taxpayer ID of Creditor
Creditor Entity (Bank)
Country of
Creditor Currency Repayments Up to
90 Days
Over 90 Days up to 1
Year
Current Portion
ThUS$ ThUS$ ThUS$
Foreign OV Bermuda Limited Bermuda Foreign DNB Bank ASA (1) Norway US$ Semi-annual - 878 878
Foreign OV Bermuda Limited Bermuda Foreign Odfjell Chemical Tankers
III (2) Norway US$ Annual - 758 758
90.160.000-7 Compañía Sud Americana
de Vapores S.A. Chile 76.645.030-K Banco Itau Chile Chile US$ Semi-annual 409 - 409
Total 409 1,636 2,045

110
ANNU
AL R
EPOR
T
2015
As of December 31, 2014
Taxpayer ID of Debtor Name of Debtor
Country of
Debtor
Taxpayer ID of Creditor Creditor Entity (Bank) Country of
Creditor Currency Repayments Up to 90 Days
Over 90 Days up to 1
Year Current Portion
ThUS$ ThUS$ ThUS$
Foreign OV Bermuda Limited. Bermuda Foreign DNB Bank ASA (1) Norway US$ Semi-annual - 872 872
90.160.000-7 Compañía Sudamericana
de Vapores S.A. Chile Foreign
Banco Itaú Unibanco S.A. Nassau Branch
Bahamas US$ At maturity 50,081 - 50,081
90.160.000-7 Compañía Sudamericana
de Vapores S.A. Chile Foreign
Banco Itaú Unibanco S.A. Nassau Branch
Bahamas US$ Semi-annual 74,425 - 74,425
Total 124,506 872 125,378
(1) DNB Bank ASA is a banking entity related to Odfjell Chemical Tankers III, which is one of the shareholders of OV Bermuda Limited.
(2) Odfjell Chemical Tankers III is a shareholder of OV Bermuda Limited.
(b) Non-current bank loans:
As of December 31, 2015
Taxpayer ID of Debtor Name of Debtor
Country of
Debtor
Taxpayer ID of Creditor
Creditor Entity (Bank)
Country of Creditor Currency
Repayments 1 to 2 years
2 to 3 years
3 to 5 years
5 to 10 years
Non-current portion
Total Debt Average Annual Interest Rate
ThUS$ ThUS$ ThUS$ ThUS$ ThUS$ ThUS$ Nominal Effective
Foreign OV Bermuda Limited. Bermuda Foreign DNB Bank ASA (1) Norway US$ Semi-annual 849 2,544 - - 3,393 4,271 LB 3M+2.9% LB 3M+2.9%
Foreign OV Bermuda Limited. Bermuda Foreign Odfjell Chemical Tankers III Norway US$ Annual - - - - - 758 LB 6M+3.5% LB 6M+3.5%
90.160.000-7 Compañía Sud Americana de Vapores S.A. Chile 76.645.030-K Banco Itau Chile Chile US$ Semi-annual - - 19,650 24,561 44,211 44,620 LB 6M+2.5% LB 6M+2.5%
Total - 849 2,544 19,650 24,561 47,604 49,649
(1) Banco Itaú loan is presented net of initial prepaid costs. Face value of the loan is ThUS$ 45,000
As of December 31, 2014
Taxpayer ID of Debtor Name of Debtor
Country of
Debtor
Taxpayer ID of
Creditor Creditor Entity (Bank)
Country
of Creditor
Currency Repayments 1 to 2
years 2 to 3 years
3 to 5 years
Non-current portion
Total Debt Average Annual Interest Rate
ThUS$ ThUS$ ThUS$ ThUS$ ThUS$ Nominal Effective
Foreign OV Bermuda Limited.
Bermuda Foreign DNB Bank ASA (1)
Norway
US$ Semi-annual 857 857 2,572 4,286 5,158 LB 3M+2.9% LB 3M+2.9%
90.160.000-7 Compañía Sudamericana de Vapores S.A. Chile Foreign Banco Itaú Unibanco S.A. Nassau Branch
Bahamas US$ At maturity - - - - 50,081 2.6356% 2.6356%
90.160.000-7 Compañía Sudamericana de Vapores S.A. Chile Foreign Banco Itaú Unibanco S.A. Nassau Branch
Bahamas US$ Semi-annual - - - - 74,425 2.1120% 2.1120%
Total 857 857 2,572 4,286 129,664
(1) DNB Bank ASA is a banking entity related to Odfjell Chemical Tankers III, which is a shareholder of OV Bermuda Limited.

111
Certain financial obligations place restrictions on management or on the fulfillment of certain financial indicators, as described in Note 36 to these consolidated financial statements.
CSAV has financial debt and liquidity lines that are subject to restrictions or compliance indicators. As of December 31, 2015 these were:
1. Bank loan with Banco Itaú Chile for US$ 45,000,000 fully drawn down.
2. Committed line of credit with Tanner Servicios Financieros S.A., which is fully available and has not been drawn down.
3. Loan from Quiñenco S.A.(1) for US$ 30,000.000, fully drawn down.
As of December 31, 2015, the Company has complied with all applicable financial covenants set forth in its financial obligations, as follows.
Financial Entity Covenant Condition As of December 31, 2015
As of December 31, 2014
Bank loan - Banco Itaú Chile (US$ 45,000,000)
(Consolidated) Leverage Ratio
No greater than 1.3 0.08 N/A
(Consolidated) Unencumbered
Assets Greater than 1.3 26.33 N/A
Total Assets Minimum of ThUS$ 1,800,000 (2) ThUS$ 2,234,596 N/A
Credit Assignment Tanner Servicios Financieros (US$ 60,000,000)
(Consolidated) Leverage Ratio
No greater than 1.3 0.03 0.10
Total Equity Minimum ThUS$ 350,000 ThUS$ 2,059,817 ThUS$ 1,899,857
Loan Quiñenco S.A. (1) (US$ 30,000,000)
(Consolidated) Leverage Ratio
No greater than 1.3 0.08 N/A
(Consolidated) Unencumbered
Assets Greater than 1.3 26.33 N/A
Total Assets Minimum of ThUS$ 1,800,000 (2) ThUS$ 2,234,596 N/A
(1) Quiñenco S.A. is CSAV’s parent company, so the loan granted by this entity is disclosed within Payables to related parties. The details of this loan are described in Note 10.
(2) This limit may be adjusted proportionally if the Company is required to decrease its total assets, due to the application of accounting standards, but not due to the disposal, transfer or assignment of assets.
(c) Bonds payable:
On September 10, 2015, the Company fully repaid the bearer, virtual and indexed bonds denominated in Unidades de Fomento (UF) that were placed in Chile. As a result, as of December 31, 2015, the Company had no outstanding bonds payable.

112
ANNU
AL R
EPOR
T
2015
As of December 31, 2014 its bond rates and maturities were as follows:
CurrentAs of December 31, 2014
Registry Number Series Currency
Nominal Amount Placed
Contractual Interest Rate
Repayments Issuing Company Country of
Issuer Up to 90 Days Over 90 days Total current
ThUS$ ThUS$ ThUS$
274 A-1 U.F. 950,000 0.06 Semi-annual Compañía Sud Americana
de Vapores S.A. Chile 505 2,523 3,028
274 A-2 U.F. 1,000,000 0.06 Semi-annual Compañía Sud Americana
de Vapores S.A. Chile 531 2,657 3,188
Total 1,036 5,180 6,216
Non-CurrentAs of December 31, 2014
Registry Number Series Currency
Nominal Amount Placed
Contractual Interest
Rate
Repayments Issuing Company Country
of Issuer Between 1 and 2 years
Between 2 and 3 years
Between 3 and 5 years
Between 5 and 10 years
Total Non-Current
ThUS$ ThUS$ ThUS$ ThUS$ ThUS$
274 A-1 U.F. 950,000 0.06 Semi-annual Compañía Sud Americana de
Vapores S.A. Chile 2,398 2,398 4,797 9,205 18,798
274 A-2 U.F. 1,000,000 0.06 Semi-annual Compañía Sud Americana de
Vapores S.A. Chile 2,524 2,524 5,048 9,689 19,785
Total 4,922 4,922 9,845 18,894 38,583
Note 23 Trade and Other Payables
Accounts payable are summarized as follows:
Accounts payable primarily represent amounts owed to regular service providers in the Group’s normal course of business, which are detailed as follows:
As of December 31, 2015
As of December 31, 2014
ThUS$ ThUS$
Consortia and other 2,997 1,885
Operating expenses 24,282 31,226
Containers - 311
Administrative services 351 4,217
Dividends 50 58
Other payables 254 6,691
Total 27,934 44,388
Other payables include withholding, other miscellaneous payables, and as of December 31, 2014 payables associated with the transaction costs with HLAG.

113
Note 24 Provisions
Current provisions as of December 31, 2015, are as follows:
Current Restructuring Legal Claims Onerous Contracts
Other Provisions Total
ThUS$ ThUS$ ThUS$ ThUS$ ThUS$
Opening balance as of January 1, 2015 - 51,956 8,912 9,698 70,566
Provisions during the year - 4,113 491 1,063 5,667
Provisions used - (7,600) (8,913) (3,617) (20,130)
Increase (decrease) due to changes in exchange rates - - - - -
Transfer to non-current provisions - (30,622) - (3,126) (33,748)
Closing balance as of December 31, 2015 - 17,847 490 4,018 22,355
Current provisions as of December 31, 2014, are as follows:
Current Restructuring Legal Claims Onerous Contracts
Other Provisions Total
ThUS$ ThUS$ ThUS$ ThUS$ ThUS$
Opening balance as of January 1, 2014 789 58,829 55,863 10,047 125,528
Provisions during the year - 20,080 47,116 9,538 76,734
Provisions used (789) (16,839) (62,360) (1,184) (81,172)
Reversal of unused provisions - - - (24) (24)
Increase due to changes in exchange rates - - - 71 71
Disposal for transaction (10,114) (31,707) (8,750) (50,571)
Closing balance as of December 31, 2014 - 51,956 8,912 9,698 70,566
Non-current provisions as of December 31, 2015, are detailed as follows:
Non-Current Restructuring Legal Claims Onerous Contracts
Other Provisions Total
ThUS$ ThUS$ ThUS$ ThUS$ ThUS$
Opening balance as of January 1, 2015 - - - - -
Initial transfer from current provisions - 38,751 - - 38,751
Transfer to current provisions - (5,003) - - (5,003)
Other increases (decreases) - - - - -
Closing balance as of December 31, 2015 - 33,748 - - 33,748

114
ANNU
AL R
EPOR
T
2015
Provisions for legal claims correspond mainly to estimated disbursements for legal claims related to transported cargo and lawsuits and other legal proceedings to which the Company is exposed, including those related to investigations carried out by anti-monopoly authorities in the car carrier business, as indicated in Note 36 to these consolidated financial statements.
Within onerous contracts, the Company provisions estimates of services (in-transit voyages or contracts) for which there is reasonable certainty that the revenue obtained will not cover the costs incurred at the end of the voyage and, therefore, the voyages or contracts are expected to end with operating losses. These provisions are expected to be used within the current year, based on the Company’s business cycle. Nevertheless, new provisions may be made in future periods.
As of December 31, 2015, provisions for legal claims and other provisions include certain possible contingent liabilities imposed on CSAV as a result of merging its container shipping business with HLAG. However, the Company may question the validity or amount of these liabilities in the future. Other provisions also includes some estimated costs for the transaction with HLAG that have not been paid as of the reporting date.
As of the reporting date, all amounts provisioned by the Company and its subsidiaries have been classified as either current or non-current based on the best estimate of the timing of their use or consumption.
Note 25 Other Non-Financial Liabilities
Other non-financial liabilities are detailed as follows:
Current As of December 31, 2015
As of December 31, 2014
ThUS$ ThUS$
Revenue in transit 2,361 5,305
Total current 2,361 5,305
Non-Current As of December 31, 2015
As of December 31, 2014
ThUS$ ThUS$
Other non-financial liabilities 211 223
Total non-current 211 223
Revenue in transit is marine transport bills issued as of the date these consolidated financial statements were closed associated with voyages that have not reached their final destination or completed the transport service. These amounts are presented in profit or loss once the voyages have been completed, normally within the following 30 days.

115
Note 26 Employee Benefit Obligations
a) Employee benefits expense for the year:
For the years ended December 31,
2015 2014
ThUS$ ThUS$
Salaries and wages 6,291 113,582
Short-term employee benefits 765 10,879
Post-employment benefit obligation expense - 3,005
Other personnel expenses - 4,306
Total employee benefits expense 7,056 131,772
b) Employee benefits provision
As of December 31, 2015
As of December 31, 2014
ThUS$ ThUS$
Vacations payable 369 538
Other benefits 750 2,786
Total employee benefits provision 1,119 3,324
The Company had not made any employee benefits provisions classified as non-current as of December 31, 2015 and 2014.
Note 27 Financial Assets and Liabilities
The details the carrying value and fair value of consolidated financial assets and liabilities are as follows:
Current Non-Current Fair Value
Financial Asset Description Note
As of December 31,
2015
As of December 31,
2014
As of December 31,
2015
As of December 31,
2014
As of December 31,
2015
As of December 31,
2014 ThUS$ ThUS$ ThUS$ ThUS$ ThUS$ ThUS$
Cash and cash equivalents 7 52,388 45,667 - - 52,388 45,667
Other financial assets 8 - - 1,550 1,664 1,550 1,664
Trade and other receivables 9 17,112 23,401 - 12 17,112 23,413
Receivables from related parties
10 1,288 11,169 - 463 1,288 11,632
Total 70,788 80,237 1,550 2,139 72,338 82,376
a)
b)

116
ANNU
AL R
EPOR
T
2015
Current Non-Current Fair Value
Financial LiabilityDescription Note
As of December 31,
2015
As of December 31,
2014
As of December 31,
2015
As of December 31,
2014
As of December 31,
2015
As of December 31,
2014
ThUS$ ThUS$ ThUS$ ThUS$ ThUS$ ThUS$
Bank loans 22 2,045 125,378 47,604 4,286 49,649 129,664
Bonds Payable 22 - 6,216 - 38,583 - 44,799
Hedging liabilities 22 994 1,625 - - 994 1,625
Trade and other payables 23 27,934 44,388 - - 27,934 44,388
Payables to related parties 10 4,020 9,440 30,000 - 34,020 9,440
Total 34,993 187,047 77,604 42,869 112,597 229,916
The average interest rates used to determine the fair value of financial liabilities as of December 31, 2015 and 2014 are summarized below:
As of December 31, 2015 As of December 31, 2014
Variable rate financial liabilities Libor + 2.54% Libor + 2.16%
Fixed rate financial liabilities - 5.87%
Other financial assets and liabilities are recorded at fair value or their carrying amount is a reasonable approximation of their fair value.
Bank loans have been valued in accordance with IFRS 13 using level 2 of the valuation ranking (i.e. market interest rates for similar transactions).
All other financial assets and liabilities have been valued in accordance with IFRS 13 using level 1 of the valuation ranking (i.e. market value).
Note 28 Equity and Reserves
(a) Changes in Capital - 2015
(i) Issued Capital
As of December 31, 2015, capital amounts to US$ 3,201,791,515.08, equivalent to 30,696,876,188 subscribed and paid shares.
(ii) Capital increase agreements
During 2015, the Company has not agreed to carry out any capital increases, reductions, adjustments or deductions of any type.

117
At the date these consolidated financial statements were closed the Company did not have any treasury shares resulting from shareholders exercising their appraisal right in 2014, which have not been deducted from its share capital, according to Article 27 of the Companies Law.
(b) Changes in Capital - 2014
(i) Issued Capital
As of December 31, 2014, capital amounts to US$ 3,057,552,305.61, equivalent to 26,261,999,637 subscribed and paid shares.
(ii) Capital increase agreements
1) In an Extraordinary General Shareholders' meeting held on March 21, 2014, the shareholders agreed to the following:
a. To recognize the capital reduction, in conformity with article 26 of the Corporations Law, of the goodwill of US$ 170,346,318.89 resulting from placing 6,750,000,000 shares, issued as part of the capital increase approved by shareholders at the extraordinary shareholders’ meeting held April 29, 2013, leaving paid-in capital at US$ 2,630,780,726.4, divided into 15,467,953,531 single-series shares with no par value;
b. To subtract US$ 1,705,923.20 from paid-in capital for share issue and placement expenses so that the balance of this account is US$ 2,629,074,803.20, divided into 15,467,953,531 single-series shares with no par value;
c. To increase capital from US$ 2,629,074,803.20, divided into 15,467,953,531 single-series shares with no par value, fully subscribed and paid, to US$ 2,829,074,803.20, divided into 20,318,205,931 single-series shares with no par value; The Company will increase capital by US$ 200,000,000 by issuing 4,850,252,400 shares, which must be subscribed and paid by March 21, 2017; and
d. To adopt the reforms to the Company’s by-laws and any other agreements that are necessary or appropriate in order to carry out any of the decisions made by shareholders.
2) In an Extraordinary General Shareholders' meeting held August 22, 2014, shareholders agreed to the following:
a. To render null and void the 848,832,564 shares pending placement (totaling US$ 35,001,583) not registered in the SVS Securities Registry that were part of the capital increase approved at the Extraordinary Shareholders’ meeting held March 21, 2014, canceling the issuance of these shares and leaving the Company’s capital at the amount effectively subscribed and paid of US$2,794,073,220.20, divided into 19,469,373,367 single-series shares with no par value. For all intents and purposes, this will not be considered a capital reduction, in conformity with Article 20 of Corporations Law;
b. To capitalize the share premium of US$ 32,275,450.14, in conformity with Article 26 of the Corporations Law, resulting from placing 4,001,419,836 shares, issued as part of the capital increase approved by shareholders at the Extraordinary Shareholders’ Meeting held March 21, 2014. This value is net of issuance and placement costs of US$ 334,184, leaving paid-in capital at US$ 2,826,348,670.34, divided into 19,469,373,367 fully paid and subscribed single-series shares with no par value.
c. To increase capital from US$ 2,826,348,670.34, divided into 19,469,373,367 single-series shares with no par value, fully subscribed and paid, to US$ 3,226,348,670.34, divided into 32,569,373,367 single-series shares with no par value; The capital increase of US$ 400,000,000 will take place through a rights issuance of 13,100,000,000 shares, which must be issued, subscribed and paid by August 22, 2017;

118
ANNU
AL R
EPOR
T
2015
d. To adopt the reforms to the Company’s by-laws and any other agreements that are necessary or appropriate in order to carry out any of the decisions made by shareholders. (c) Movements in shares for 2015 and 2014
As of December 31, 2015, the Company's shares are detailed as follows:
Series Number of Subscribed Shares
Number of Paid Shares Number of Voting Shares
Single 30,696,876,188 30,696,876,188 30,696,876,188
As of December 31, 2015
As of December 31, 2014
Number of Shares Common Stock Common Stock
Issued as of January 1 26,261,999,637 15,467,953,531
From capital increase 4,851,373,731 10,794,046,106
Shares canceled (416,497,180) -
Issued as of December 31 30,696,876,188 26,261,999,637
As indicated in section d) of this note, during 2014 the Company repurchased 416,497,180 treasury shares from its shareholders, as a result of appraisal rights exercised during the HLAG transaction. All these shares were canceled in 2015 as detailed below.
(d) Treasury shares An Extraordinary Shareholders meeting was held on March 21, 2014 to approve the business combination with HLAG involving the container shipping business. At that meeting, 84.5% of shareholders present and represented approved the merger, opening a 30 day period for dissenting shareholders to exercise their right of withdrawal, which could not be exercised by more than 5% of all shares in order for the merger to proceed. This period ended on April 20, 2014, at which time the appraisal right had been exercised for 2.7% of CSAV shares.
As a result of this process, on May 2, 2014, the Company began to repurchase shares from shareholders who exercised their appraisal right. As of December 31, 2014, the Company had repurchased 416,497,180 shares with a disbursement of ThUS$ 20,908. As of December 31, 2015 these treasury shares had been wholly canceled and withdrawn from share capital as the one year period had expired, as defined in Article 27 of Corporations Law.
(e) Share Issuance CostsAs of December 31, 2015, share issuance costs from capital increases amount to ThUS$ 2,658 (ThUS$ 139 as of December 31, 2014) and are presented within the equity account “other miscellaneous reserves” until shareholders vote to capitalize them at an extraordinary shareholders' meeting.

119
(f) Other ReservesOther reserves are detailed as follows:
As of December 31,
2015As of December 31,
2014
ThUS$ ThUS$
Translation reserve (16,941) 287
Cash flow hedge reserve (340) (1,261)
Reserve for gains and losses on defined-benefit plans 15,210 -
Other miscellaneous reserves (1) 2,974 (139)
Total reserves 903 (1,113)
(1) This account includes the costs detailed in point e) above, together with other miscellaneous reserves.
Explanation of movements:
Translation Reserve
The translation reserve includes all exchange differences that arise from the translation of the financial statements of foreign operations from functional currency to reporting currency in accordance with IAS 21.
The balance and movement of the translation reserve are explained as follows:
As of December
31, 2015As of December
31, 2014
ThUS$ ThUS$
Opening balance as of January 1 287 (3,484)
Variation in associates (Note 15) (17,077) -
Amount realized for transfers - 3,776
Subsidiaries and other investments (151) (5)
Closing balance as of December 31 (16,941) 287
Cash Flow Hedge Reserve
The hedge reserve includes the effective portion of the net accumulated effect on fair value of cash flow hedging instruments related to hedged transactions that have not yet taken place. The movement during the year is explained by the realization of accounting hedges recognized in equity at the beginning of the year.

120
ANNU
AL R
EPOR
T
2015
The balance and movement of this reserve are explained below:
As of December 31,
2015As of December 31,
2014
ThUS$ ThUS$
Opening balance as of January 1 (1,261) 2,098
Amount realized for transfers 1 (2,184)
Variation in associates (Note 15) 397 (1,175)
Deferred tax on hedges (142)
Increase from hedge derivatives 665
Closing balance as of December 31 (340) (1,261)
Reserve for Profits and Losses on Defined Employee Benefit Plans
The reserve for actuarial gains on post-employment benefits consists of the variation in the actuarial values of the post-employment benefits provision.
The balance and movement of this reserve are explained below:
As of December 31,
2015As of December 31,
2014
ThUS$ ThUS$
Opening balance as of January 1 - (8) Increase from variations in value of post-employment provision - 8 Variation in associates (Note 15) 15,210 - Closing balance as of December 31 15,210 -
Other Miscellaneous Reserves
The balance and movements of this reserve are explained below:
As of December 31,
2015As of December 31,
2014
ThUS$ ThUS$ Opening balance as of January 1 (139) - Share issue expenses (2,499) (139) Variation in associates (Note 15) 5,612 - Closing balance as of December 31 2,974 (139)
(g) Dividends and Retained Earnings (Accumulated Losses)
CSAV's dividend policy, which is summarized in Note 3.23 of these consolidated financial statements, establishes that profits are to be distributed in accordance with instructions in SVS Ruling 1945, which is detailed as follows: As of December 31, 2015 and 2014, the Company has not recorded provisions for the minimum mandatory dividend because it has accumulated financial losses.

121
Distributable net profits are determined on the basis of “profit attributable to owners of the Company” presented in the consolidated income statement for each reporting period. This profit shall be adjusted, if necessary, to reflect all gains resulting from unrealized variations in the fair value of certain assets and liabilities as of year end. Thus, these gains will be incorporated into the determination of net distributable income in the year in which they are realized or accrued.
The Company has decided to maintain adjustments from first-time adoption of IFRS, included in retained earnings as of December 31, 2009, as non-distributable profits or gains. For the purpose of determining the balance of distributable retained earnings or accumulated losses, separate records are kept for these first-time adoption adjustments and they are not considered in determining that balance. Nevertheless, when any of the amounts considered in the first-time adjustments are realized or accrued, as indicated above, they are included in the determination of net distributable income for the respective year.
The following table details how distributable net profits as of December 31, 2015 and 2014, are determined:
As of December
31, 2015As of December
31, 2014
ThUS$ ThUS$ Initial distributable profit (1,286,095) (1,674,801) Profit (loss) attributable to owners of the Company (14,654) 388,706 Distributable net loss (1,300,749) (1,286,095)
Accumulated losses (1,160,265) (1,145,464)
Note 29 Revenue, Cost of Sales and Administrative Expenses
Revenue and cost of sales are detailed in the following table:
Continuing Operations Discontinued Operations Total
For the year ended December 31,
For the year ended December 31,
For the year ended December 31,
2015 2014 2015 2014 2015 2014
Revenue ThUS$ ThUS$ ThUS$ ThUS$ ThUS$ ThUS$
Revenue from transport services 179,721 196,378 - 2,318,836 179,721 2,515,214
Other revenue 3,365 38,902 - 187,339 3,365 226,241
Total revenue from ordinary activities 183,086 235,280 - 2,506,175 183,086 2,741,455
Cost of sales
Cargo, intermodal and other related costs (38,928) (64,015) - (1,018,354) (38,928) (1,082,369)
Vessel charter, port, canal and other related expenses
(102,782) (112,088) - (880,230) (102,782) (992,318)
Fuel expenses (27,393) (51,084) - (482,248) (27,393) (533,332)
Other costs (11,118) (9,939) - (134,278) (11,118) (144,217)
Total cost of sales (180,221) (237,126) - (2,515,110) (180,221) (2,752,236)
As indicated in Note 3.16, since the implementation of International Financial Reporting Standards (IFRS), revenue and cost of sales for maritime services in-transit are recognized in the income statement based on the degree of completion.

122
ANNU
AL R
EPOR
T
2015
For vessels not included in onerous contracts, income is recognized only to the extent that the related costs (incurred) can be recovered, and as a result the Company recognizes income and expenses for the same amount, taking a position with a neutral effect on its margin.
This effect implied recognizing net income of ThUS$ 176 for the year ended December 31, 2015, and less income of ThUS$ 255 for the year ended December 31, 2014, which form part of revenues and cost of sales, as indicated above.
Should the Company determine that a voyage or contract will produce a loss, it shall be provisioned in cost of sales (onerous contract) without recording its income and expenses separately (Note 24).
The breakdown of administrative expenses is detailed as follows:
Continuing Operations Discontinued Operations Total
For the year ended December 31,
For the year ended December 31,
For the year ended December 31,
2015 2014 2015 2014 2015 2014
ThUS$ ThUS$ ThUS$ ThUS$ ThUS$ ThUS$
Personnel payroll expenses (7,056) (6,691) - (116,154) (7,056) (122,845)
Consultancy and other services (6,080) (5,486) - (20,453) (6,080) (25,939)
Communications and reporting expenses (1,927) (2,670) - (9,298) (1,927) (11,968)
Depreciation and amortization (284) (267) - (2,574) (284) (2,841)
Other (4,303) (4,043) - (31,486) (4,303) (35,529)
Total administrative expenses (19,650) (19,157) - (179,965) (19,650) (199,122)
As described in Note 6 of these consolidated financial statements regarding operating segments, the administrative expenses for continuing operations has been separated for the purposes of control and measuring the management of each CSAV business segment. During the year ended December 31, 2015 total administrative expenditure was ThUS$ 19,650, the container shipping business segment represents ThUS$ 4,250 and the other transport services business segment (which includes vehicle transport, bulk liquids and others) represents ThUS$ 15,400, being 22% and 78% of total administration expenditure, respectively. These percentages were 17% and 83% respectively during the year ended December 31, 2014.
Note 30 Other Expenses and Other Gains (Losses)
(a) Other expenses
"Other expenses" for the year ended December 31, 2015 of ThUS$ 6 mainly related to other operating activities of subsidiaries.
"Other expenses" for the year ended December 31, 2014 of ThUS$ 1,338 mainly related to other operating activities of Tollo Shipping Co. S.A. and subsidiaries.
(b) Other gains (losses)
During the year ended December 31, 2015 this account included:

123
(i) The reversal of certain liabilities recorded by CSAV related to the closing of the transaction with HLAG. As of December 31, 2015 the Company is reasonable sure that these will not result in contingencies or cash disbursements. The total effect of this reversal is a gain of ThUS$ 5,529.
(ii) The impairment loss on the acquired goodwill associated with investments made by CSAV and Tollo Shipping Co. S.A. in the subsidiaries Navibras Comercial Marítima e Afretamentos Ltda. and Compañía Naviera Rio Blanco S.A. of ThUS$ 4,259, as explained in Note 17 of these consolidated financial statements.
(iii) Other profits from CSAV and its subsidiaries of ThUS$ 308.
For the year ended December 31, 2014, this account includes:
(i) A loss on the sale of the 50% interest held by Corvina Shipping Co. S.A. in the joint venture with Dry Bulk Handy Inc., of ThUS$ 18,578.
(ii) A loss on the sale of the 50% interest held by Tollo Shipping Co. S.A. in the joint venture Vogt & Maguire Shipbroking Ltd., of ThUS$ 78.
(iii) The net gain before tax on the transaction with HLAG explained in detail in Note 40 section e) to these consolidated financial statements of ThUS$ 864,411 as of December 31, 2014.
(iv) Other profits from the businesses retained by CSAV and its subsidiaries of ThUS$ 362.
Note 31 Finance Income and Costs
Finance income and costs are detailed as follows:
Continuing Operations
Discontinued Operations Total
For the year ended December 31,
For the year ended December 31,
For the year ended December 31,
2015 2014 2015 2014 2015 2014
Financial income ThUS$ ThUS$ ThUS$ ThUS$ ThUS$ ThUS$
Interest income from time deposits 179 1,207 - 309 179 1,516
Other finance income 104 39 - 187 104 226
Total finance income 283 1,246 - 496 283 1,742
Finance Costs
Interest expense on financial obligations (2,343) (4,593) - (33,080) (2,343) (37,673)
Interest expense on other financial instruments - (469) - (717) - (1,186)
Other finance expenses (1,573) (1) - (51) (1,573) (52)
Total finance costs (3,916) (5,063) - (33,848) (3,916) (38,911)

124
ANNU
AL R
EPOR
T
2015
Note 32 Exchange Differences
Exchange differences generated by items in foreign currency, other than differences generated by financial investments at fair value through profit and loss, were credited (charged) to profit or loss for the year according to the following table:
Continuing Operations
Discontinued Operations Total
For the year ended December 31,
For the year ended December 31,
For the year ended December 31,
2015 2014 2015 2014 2015 2014
ThUS$ ThUS$ ThUS$ ThUS$ ThUS$ ThUS$
Cash and cash equivalents (2,410) 8,474 - - (2,410) 8,474
Trade and other receivables, net (1,023) (2,919) - - (1,023) (2,919)
Receivables from related parties 169 331 - 8,779 169 9,110
Current tax receivables (50) (246) - - (50) (246)
Other assets 105 (5) - 5 105 -
Other financial assets (20) (24) - 24 (20) -
Total assets (3,229) 5,611 - 8,808 (3,229) 14,419
Interest-bearing loans 5,250 6,135 - (1,219) 5,250 4,916
Trade and other payables 964 4,191 - 6,420 964 10,611
Payables to related parties 160 (853) - 19,464 160 18,611
Provisions - (4) - 66 - 62
Tax payables - (42) - (8) - (50)
Other liabilities 14 (2) - 157 14 155
Post-employment benefits obligation - - - 102 - 102
Total liabilities 6,388 9,425 - 24,982 6,388 34,407
Total exchange differences 3,159 15,036 - 33,790 3,159 48,826

125
Note 33 Foreign Currency
As of December 31,
2015As of December 31,
2014 Current Assets
Currency ThUS$ ThUS$
Cash and cash equivalents
CLP 842 16,095 US$ 48,797 26,581 EUR 890 1,921 BRL 43 149 YEN - 7
OTHER 1,816 914
Other non-financial assets
US$ 3,899 5,694 EUR - - BRL 16 24
OTHER 39 41
Trade and other receivables
CLP 481 3,628 US$ 13,523 14,122 EUR - 47 BRL 95 42
OTHER 3,013 5,562
Receivables from related parties
CLP 157 1,783 US$ 1,110 9,356 EUR - - BRL 19 29
OTHER 2 1 Inventories US$ 2,238 4,564
Current tax assets
CLP 6 320 US$ 2,158 2,018 BRL - 2
OTHER 1,025 954
Total current assets
CLP 1,486 21,826 US$ 71,725 62,335 EUR 890 1,968 BRL 173 246 YEN - 7
OTHER 5,895 7,472 Total 80,169 93,854

126
ANNU
AL R
EPOR
T
2015
Non-Current Assets As of December 31,
2015As of December 31,
2014
Currency ThUS$ ThUS$
Other financial assets CLP - 368 US$ 1,550 1,296
Other non-financial assets US$ 97 7 EUR 2
OTHER 22 35 Trade receivables CLP - 12 Receivables from related parties US$ - 463
Equity method investments US$ 1,792,436 1,765,060 EUR 102 123
Intangible assets other than goodwill BRL 92 - OTHER 3 7
Goodwill US$ 17 4,276 BRL - 116
Property, plant and equipment
US$ 24,644 16,775 EUR - 8,420 BRL 27 16
OTHER 56 75 Investment property US$ 12,853 12,286
Deferred tax assets US$ 312,998 306,734 OTHER 650 650
Total non-current assets
CLP - 380 US$ 2,144,595 2,106,897 EUR 104 8,543 BRL 119 132
OTHER 731 767 Total 2,145,549 2,116,719
TOTAL ASSETS
CLP 1,486 22,206 US$ 2,216,320 2,159,876 EUR 994 19,867 BRL 292 378 YEN - 7
OTHER 6,626 8,239 Total 2,225,718 2,210,573

127
Current Liabilities As of December 31, 2015 As of December 31, 2014
Under 90 Days
90 Days to 1 Year Total Under 90
days90 Days to 1 Year Total
Currency ThUS$ ThUS$ ThUS$ ThUS$ ThUS$ ThUS$
Other financial liabilitiesUF - - - 1,036 5,180 6,216
US$ 660 2,379 3,039 126,131 872 127,003
Trade and other payables
CLP 3,342 - 3,342 4,780 - 4,780US$ 17,473 200 17,673 32,843 214 33,057EUR 109 - 109 3,166 - 3,166BRL 2,401 - 2,401 558 5 563YEN - - - - - -
OTHER 3,951 458 4,409 2,409 413 2,822
Payables to related parties
CLP 411 - 411 252 - 252US$ 1,857 - 1,857 8,240 773 9,013BRL 26 - 26 6 - 6
OTHER 1,726 - 1,726 169 - 169
Other provisions
CLP - - - 789 - 789US$ 22,239 - 22,239 69,777 - 69,777EUR 40 40
OTHER 76 - 76 - - -
Current tax liabilitiesUS$ - - 27 12 39BRL - - 1 - 1
OTHER - 439 439 4 270 274
Employee benefits provisions
CLP 1,079 - 1,079 - - -US$ 40 - 40 3,267 - 3,267EUR - - - 51 - 51BRL - - - - - -
OTHER - - - 6 - 6
Other non-financial liabilities
CLP - - - 373 - 373US$ 2,361 - 2,361 1,079 3,734 4,813BRL - - - 113 - 113
OTHER - - - 6 - 6
Total current liabilities
UF - - - 1,036 5,180 6,216CLP 4,832 - 4,832 6,194 - 6,194US$ 44,630 2,579 47,209 241,364 5,605 246,969EUR 149 - 149 3,217 - 3,217BRL 2,427 - 2,427 678 5 683YEN - - - - - -
OTHER 5,753 897 6,650 2,594 683 3,277 Total 57,791 3,476 61,267 255,083 11,473 266,556

128
ANNU
AL R
EPOR
T
2015
Non-Current Liabilities
As of December 31, 2015 As of December 31, 2014
1 to 3 years
3 to 5 years
5 to 10 years Total 1 to 3
years3 to 5 years
5 to 10 years Total
Currency ThUS$ ThUS$ ThUS$ ThUS$ ThUS$ ThUS$ ThUS$ ThUS$
Other financial liabilitiesUF - 9,844 9,845 18,894 38,583
US$ 1,386 21,746 24,472 47,604 1,714 2,572 - 4,286
Payables to related parties US$ 30,000 - - 30,000 - - - -
Other provisions US$ 33,748 - - 33,748 - - - -
Deferred tax liabilities US$ 1,949 - - 1,949 1,068 - - 1,068
Other non-financial liabilities US$ 211 - - 211 223 - - 223
Total non-current liabilitiesUF - - - - 9,844 9,845 18,894 38,583
US$ 67,294 21,746 24,472 113,512 3,005 2,572 - 5,577
Total 67,294 21,746 24,472 113,512 12,849 12,417 18,894 44,160
TOTAL LIABILITIES
UF - 44,799
CLP 4,832 6,194
US$ 160,721 252,546
EUR 149 3,217
BRL 2,427 683
OTHER 6,650 3,277
Total 174,779 310,716
Note 34 Earnings (Loss) per Share
Earnings (loss) per share as of December 31, 2015 and 2014 are calculated as follows:
For the year ended
December 31, 2015
For the year ended December 31,
2014
Profit (loss) attributable to owners of the Company (14,654) 388,706 Loss from discontinued operations - (230,831) Weighted average number of shares 30,358,617,220 17,097,003,966
Earnings (loss) per share US$ (0.0005) 0.0227 Loss per share for discontinued operations US$ - (0.0135)

129
Number of subscribed and paid shares For the year ended December 31, 2015
For the year ended December 31, 2014
Issued as of January 1 26,261,999,637 15,467,953,531 From capital increase 4,851,373,731 10,379,538,726 Shares canceled (416,497,180) 414,507,380 Issued as of December 31 30,696,876,188 26,261,999,637
Weighted average number of shares 30,358,617,220 17,097,003,966
Note 35 Discontinued Operations
A material event was filed on April 16, 2014, where the Company reported that it had signed a binding BCA with HLAG, which committed CSAV to contribute its entire container shipping business to HLAG in exchange for a 30% interest in HLAG after the business combination. See Note 40 to CSAV's consolidated financial statements as of December 31, 2014, for more information on this transaction.
The BCA required the Company to present its financial statements in accordance with IFRS 5 starting with the interim consolidated financial statements as of June 30, 2014, by separating the assets, liabilities, results and cash flows belonging to the discontinued activities (which would be contributed to HLAG) from those pertaining to continuing activities. This also held true for the consolidated financial statements as of September 30, 2014.
A material event was filed on December 2, 2014, where the Company reported that the transaction had been completed by contributing to HLAG all of its interests in the subsidiary “CSAV Germany Container GmbH”, which as of that date controlled all assets, liabilities and personnel for CSAV's container shipping business. As consideration for this contribution, CSAV subscribed to shares representing 30% of the shares issued by HLAG as of that date.
Consequently, as of December 31, 2014 and December 31, 2015, the Company does not possess any assets or liabilities related to the discontinued operations transferred to HLAG, which were transferred on December 2, 2014 in exchange for its interest in HLAG, which is currently the Company's main asset.
In accordance with IFRS 5, in order to make the financial statements for the year ended December 31, 2014 comparable with those for previous years, the Company presents its consolidated statement of income for the year ended December 31, 2014, showing separate results for continuing operations and discontinued operations, which is consistent with the financial statements for the six preceding periods.
This note contains the detailed statements of income and cash flow for discontinued operations, as well as the combined detailed statement of income for both continued and discontinued operations.

130
ANNU
AL R
EPOR
T
2015
The statements of income and cash flow for discontinued operations are presented below:
(a) Income Statement
For the year ended December 31, 2014
STATEMENT OF INCOME Discontinued Operations
Continuing Operations Total
Profit (loss) for the year Note ThUS$ ThUS$ ThUS$
Revenue 29 2,506,175 235,280 2,741,455
Cost of sales 29 (2,515,110) (237,126) (2,752,236)
Gross loss (8,935) (1,846) (10,781)
Other income (2,355) 1,855 (500)
Administrative expenses 29 (179,965) (19,157) (199,122)
Other expenses 30 (67) (1,345) (1,412)
Other gains 30 6,659 846,117 852,776
Net operating income (loss) (184,663) 825,624 640,961
Finance income 31 496 1,246 1,742
Finance costs 31 (33,848) (5,063) (38,911)
Share of loss of equity method associates and joint ventures 3,807 (86,743) (82,936)
Exchange differences 497 15,036 15,533
Loss on indexed assets and liabilities (719) (2,570) (3,289)
Profit (loss) before tax (214,430) 747,530 533,100
Income tax expense 21 (16,401) (127,459) (143,860)
Profit (loss) for the year (230,831) 620,071 389,240
Profit (loss) attributable to:
Owners of the company (231,303) 620,009 388,706
Non-controlling interests 472 62 534
Profit (loss) for the year (230,831) 620,071 389,240

131
(b) Statement of Cash Flows
The statement of cash flows is detailed as follows:
For the year ended December 31, 2014
STATEMENT OF CASH FLOWS Discontinued Operations
Continuing Operations Total
ThUS$ ThUS$ ThUS$
Cash flows used in operating activities (221,546) (59,825) (281,371)
Cash flows used in investing activities (117,278) (329,706) (446,984)
Cash flows provided by financing activities 263,208 304,074 567,282
Effect of exchange rate changes on cash and cash equivalents (3,955) 9,036 5,081
Net cash flows for the year (79,571) (76,421) (155,992)
Note 36 Contingencies and Commitments
(a) Guarantees Granted
(i) Bank guarantees: The Company and its subsidiaries have not granted any bank guarantees as of December 31, 2015.
(ii) Guarantee Notes: There are minor guarantees, mainly associated to rental of premises in subsidiaries, whose disclosure is not necessary for the interpretation of these financial statements.(iii) Guarantee Shares: CSAV has provided 1,366,991 HLAG shares in guarantee for the loan contract concluded with its parent company Quiñenco S.A. These shares are the shares subscribed by the subsidiary CSAV Germany Container Holding GmbH in HLAG during the capital increase associated with its initial public share offer (IPO) on the of Frankfurt and Hamburg stock markets in November 2015.
(b) Other Legal Contingencies
The Company is a defendant in certain lawsuits and arbitration claims relating to cargo transport, mainly seeking compensation for damages and losses. Most of these potential losses are covered by insurance policies. The Company has recorded sufficient provisions to cover the estimated amount of likely contingencies not covered by insurance (see Note 24).
In connection with investigation proceedings carried out as a result of infringements to free competition regulations within the car carrier business referred to in a material event filed on September 14, 2012, as well as those currently in progress in other jurisdictions, the Board of Directors decided to make a provision for ThUS$ 40,000 from the first quarter of 2013 to cover any potential amounts that the Company may be forced to pay in the future as a result of these proceedings, based on car carrier business volumes covering multiple routes that the Company operates worldwide. Such provisioned amount is an estimate of potential disbursements on the basis of good judgment. The Company does not currently have sufficient background information to predict the termination date of these proceedings, with the exception of the investigations conducted by the following authorities, whose status is explained below:

132
ANNU
AL R
EPOR
T
2015
1. On February 27, 2014, CSAV signed a plea agreement with the United States Department of Justice (DOJ), where CSAV agreed to pay a fine of ThUS$ 8,900, which is covered by the provision already recorded by the Company. The first two payments totaling ThUS$ 4,500, not including legal expenses, were made in May 2014 and 2015. A fine imposed by the United States Federal Maritime Commission (hereinafter FMC) of ThUS$ 625 was paid during 2014. The next payments to the DOJ, due each year, are for similar amounts until the Company has paid the full ThUS$8,900 mentioned previously. Some vehicle buyers, vehicle distributors and freight forwarders or direct contract holders have filed a class action suit "on their own behalf and on behalf of those in a similar situation" based on investigations by the DoJ against a group of companies engaged in the car carrier business, including the Company and its former agency in New Jersey, for damages and losses suffered directly by contracting freight services or indirectly by buying imported cars in the United States. Given the early stage of these lawsuits and the defense's arguments thus far, the Company cannot yet estimate whether there will be any impact beyond the amount provisioned. These class action suits were consolidated in the District Court of New Jersey. However, in late August 2015 the court ruled that they should be decided by the FMC, based on a motion filed by the Company. There are pending appeals against this ruling. Similar class action suits have been filed in Canada against the Company. However, the Canadian Competition Bureau closed its investigation of the Company without pressing any charges. Therefore, and given the fact that these lawsuits are in their initial stages, it is impossible to estimate whether it will have any economic impact on the Company.
2. On January 27, 2015, the Chilean Economic Prosecutor's Office (FNE) issued a summons against several shipping companies, including CSAV, for violating letter a) of Article 3 of Decree Law 211 of 1973, regarding the Defense of Free Competition (“DL 211”), in the car carrier business (the “Summons”). As indicated in the Summons and set forth in Article 39 bis of DL 211, the Company is exempt from fines relating to the practices referred to in the Summons given its cooperation with the FNE's investigation, so this event has no financial impact on CSAV's results. The Summons is being processed by Chile's Antitrust Court.
3. On November 25, 2015 the Court of the Administrative Council for the Economic Defense of Brazil (CADE) approved a suspension agreement (compromisso de cessação) previously agreed between the Company and the General Superintendent of CADE, which obliged the Company to pay a fine of approximately ThUS$ 1,822, which was covered by the provision referred to above.
4. On December 9, 2015 the South African Competition Tribunal approved a consent agreement between CSAV and the South African Competition Commission, which commits the Company to pay a fine equivalent to approximately ThUS$ 566, which was also covered by the provision referred to above.
5. The Company actively collaborated with an investigation initiated in China in June 2015. On December 15, 2015 the Prices and Antimonopoly Supervising Office of the National Commission for Development and Reforms of the Republic of China (NDRC) fined CSAV approximately ThUS$ 475, out of total fines of approximately ThUS$ 62,860 applied to eight international shipping companies. This fine of ThUS$ 475 is also covered by the provision referred to above.
As of December 31, 2015, claims have been filed against CSAV as a result of the merger of its container shipping business with HLAG. All legal contingencies related to the operations of the container shipping business are presently the legal and financial responsibility of HLAG, including legal expenses and possible disbursements, even when CSAV is party to the claim. The Company has established provisions for other contingencies not related to this business where it believes disbursements to be reasonably likely. The Company nevertheless retains the right to question the appropriateness or

133
value of such liabilities in the future. The value and classification of the Company's provisions is disclosed in Note 24 of these consolidated financial statements. In particular, the Company contributes to the "NYSA-ILA" Pension Fund through its container business that is now operated by HLAG. This fund covers the longshoremen for the states of New York and New Jersey, who wants to impose and collect a Fund withdrawal liability of approximately ThUS$ 12,000. The Company promptly challenged this claim and is processing its challenge.
(c) Operating Restrictions
The financing agreements signed by Compañía Sud Americana de Vapores S.A. and its subsidiaries include the following restrictions:
(i) Loan from Bank Itau Chile: a) Keep consolidated borrowing at a level where the ratio of Total Liabilities / Total Equity does not exceed 1.3. b) Keep assets free of encumbrances at least 130% of consolidated financial liabilities. c) Quiñenco S.A. must be the Company's controller, or must hold at least 37.4% of its subscribed and paid capital.
(ii) Credit assignment contract with Tanner Servicios Financieros S.A. for a committed line of credit expiring in December 2016 for up to ThUS$ 30,000. a) Maintain minimum consolidated equity of ThUS$ 350,000. b) Maintain a consolidated leverage ratio where consolidated financial debt to total equity is not greater than 1.3. c) Quiñenco S.A. shall remain the Company's controller for the duration of the agreement.
(iii) Loan from Quiñenco S.A.: a) Keep consolidated borrowing at a level where the ratio of Total Liabilities / Total Equity does not exceed 1.3. b) Keep assets free of encumbrances at least 130% of consolidated financial liabilities.
Additionally, loan contracts oblige the Company to comply with certain positive restrictions, such as complying with the law, paying taxes, maintaining insurance, and other similar matters, and also to obey certain negative restrictions, such as not furnishing chattel mortgages, except those authorized by the respective contract, not undergoing corporate mergers, except those authorized, or not selling fixed assets. Without prejudice to the foregoing, the loan from Quiñenco S.A. is guaranteed with an authorized pledge and other encumbrances over 1,366,991 HLAG shares, which is the number of shares acquired by the Company when HLAG issued its initial public offer of shares on the stock exchange that financed this loan.
(d) Mortgages for Financial Commitments.
The Company has mortgages on certain assets in order to guarantee its financial obligations, as detailed as follows:
Creditor Debtor Guarantee Committed Assets Book Value
of Committed Assets
Outstanding Balance on Debt as
of Year End
ThUS$ ThUS$
DNB Bank ASA Bow Cóndor Naval mortgage Vessel 9,883 5,158

134
ANNU
AL R
EPOR
T
2015
Note 37 Operating Lease Commitments
As of December 31, 2015, the Company charters, under an operating lease system, 6 vessels (9 as of December 2014) and has no lease commitments for containers or other maritime shipping equipment.
CSAV's charter term for vessels normally varies between three months and two years. The majority of the charter tariffs are fixed.
The cost of staffing and operating a vessel, known as its “running cost”, varies between US$ 7,000 and US$ 9,000 per day. These can be contracted together with the chartered vessel (time charter) or separately from the chartered vessel (bareboat charter). This note contains the total cost of commitments regarding chartered vessels. Therefore, time charter commitments include their running costs, as these are an integral part of the Company's obligations.
The following table presents the future minimum non-cancelable payments at nominal value for vessel charters as of December 31, 2015:
Total
Commitments Total Revenue Net Total
ThUS$ ThUS$ ThUS$
Less than one year 10,073 - 10,073
One to three years 32,713 - 32,713
Total 42,786 - 42,786
The table above excludes all charter expenses that have already been provisioned as of the date of these financial statements as part of the restructuring process. If vessels have been chartered of sub-chartered to third parties, these future minimum non-cancelable receipts are offset against charter commitments.
Note 38 Environmental Issues
Due to the nature of its services, the Company has not incurred any material expenses related to improving and/or investing in production processes, verification and compliance with regulations on industrial processes and facilities or any other matter that could directly or indirectly impact environmental protection efforts.
Note 39 Sanctions
During the years ended December 31, 2015 and 2014, neither the Company nor its subsidiaries, directors and managers have been sanctioned by the SVS. The Company and its subsidiaries have not received any significant fines from other administrative entities or jurisdictions, other than those indicated in Note 36 of these consolidated financial statements.
Note 40 Events after the Reporting Period
Between the closing date and issuance of these consolidated financial statements, the following significant event occurred and the Company has decided to present it as a subsequent event:

135
(a) Enactment of Law 20,899 simplifying the 2014 Tax Reform.
On 8 February 2016 Law 20,899 was published that simplifies the tax regime imposed by Law 20,780 (2014 Tax Reform). It restricts the option originally established in respect of the attributed tax regime to certain contributors.
In summary, the law establishes that the attributed tax regime applies only to sole proprietorships, individual companies with limited liability, communities, partnerships and simplified corporations, when the latter two are formed exclusively of natural persons domiciled and resident in Chile or by foreign taxpayers. The partially integrated regime applies to all remaining contributors, such as corporations, corporations without limitations, or partnerships, whose partners are not exclusively natural persons resident in Chile or foreign taxpayers. Both schemes will come into effect from 1 January 2017.
As described in the preceding paragraphs, the partially integrated tax system applies to CSAV. The valuation of the Company's deferred taxes, including the reversal of temporary differences, has been carried out using this tax system. Therefore, the enactment of this law has not changed these consolidated financial statements, but rather confirms the estimates contained therein regarding deferred tax assets.

136
ANNU
AL R
EPOR
T
2015
1. Analysis of Financial Position
a) Statement of Financial Position
The following table details the Company’s main asset and liability accounts as of each period end:
ASSETS December 31 2015
December 312014
MM US$ MM US$ Current assets 80.2 93.9 Non-current assets 2,145.5 2,116.7 Total assets 2,225.7 2,210.6
LIABILITIES AND EQUITY December 312015
December 31 2014
MM US$ MM US$ Total current liabilities 61.3 266.6 Non-current liabilities 113.5 44.2 Equity attributable to the owners of the Company 2,042.4 1,890.0 Equity attributable to non-controlling interests 8.5 9.8 Total liabilities and equity 2,225.7 2,210.6
As of December 31, 2015, total assets increased by MMUS$ 15.1 compared to December 31, 2014. This variation is explained by an increase of MMUS$ 28.8 in non-current assets, offset by a decrease of MMUS$ 13.7 in current assets.
The increase of MMUS$ 28.8 in non-current assets is explained mainly by an increase of MMUS$ 27.4 in equity method investments. This change is explained mainly by the increase in the investment in Hapag-Lloyd AG (hereinafter HLAG) of US$ 29.7 million made as part of that company’s IPO on the German stock exchange. This increase was partially offset by the effect of the dilution loss, net of CSAV’s share of the profit (loss) from this joint venture.
On November 6, 2015, HLAG went public in Germany, raising almost MMUS$ 287 (MMEUR$ 265). This IPO was directed mainly towards the market. However, in order to support the IPO and demonstrate its commitment to HLAG, CSAV participated in the capital increase by subscribing 1,366,991 new shares of HLAG (equivalent to MMEUR$ 27.3 or MMUS$ 29.7), corresponding to10.33% of the first issuance placed in the IPO. As a result, CSAV’s interest in HLAG decreased from 34.01% before the IPO to 31.35% after the IPO at a placement price below the book value of the shares that CSAV held as of that date. Therefore, the Company had to reflect a dilution loss of MMUS$ 83.9.
Following the IPO, CSAV is still a majority shareholder and maintains the Shareholder Agreement signed with HLAG’s other controlling partners, Kühne Maritime and the City of Hamburg.
ANNUAL ANALYSIS

137
HLAG’s results and the rest of its equity movements are accounted for using the equity method and recorded within equity method investments. In 2015, CSAV recorded a profit of MMUS$ 77.4 for its share of the profit (loss) from the HLAG joint venture, including the effects of the PPA. For more information, see Note 15 to these consolidated financial statements.
The following table summarizes the movements in the investment in HLAG:
Detail of Movements in CSAV’s Investment in HLAG
MM US$ Balance as of December 31, 2014 1,765.0
Share of HLAG’s Profit 43.5Effect of PPA on Profit 33.9
Total Share of HLAG’s Profit 77.4Share of Other Comprehensive Income (1.5)Dilution Loss from IPO (83.9)Subscription of Capital Increase in IPO 29.7Other Changes in Equity 5.6Balance as of December 31, 2015 1,792.4
The decrease in current assets of MMUS$ 13.7 is explained by decreases in receivables from related parties (MMUS$ 9.9), trade and other receivables (MMUS$ 6.3), other financial assets (MMUS$ 1.8), inventories (MMUS$ 2.3) and current tax assets (MMUS$ 0.1), partially offset by an increase in cash and cash equivalents (MMUS$ 6.7).
As of December 31, 2015, total liabilities decreased by MMUS$ 136.0 compared to December 31, 2014. This variation is explained by a decrease of MMUS$ 205.3 in current liabilities, offset by an increase of MMUS$ 69.3 in non-current liabilities. The decrease in current liabilities of MMUS$ 205.3 is explained by drops in other current financial liabilities of MMUS$ 130.1, other provisions of MMUS$ 48.2, trade and other payables of MMUS$ 16.5 and payables to related parties of MMUS$ 5.5. The sharp decrease in other current financial liabilities resulted from the first quarter repayment of the bridge loans used to finance CSAV’s capital contribution to HLAG made in December 2014 and the prepayment of its UF bonds in August 2015. The decrease in other provisions is explained mainly by MMUS$ 33.7 (net) reclassified as non-current during the period and MMUS$ 14.5 in provisions consumed during the period.
The increase in non-current liabilities of MMUS$ 69.3 is explained primarily by the aforementioned reclassification of MMUS$ 33.7 in other provisions as non-current, an increase in other non-current financial liabilities of MMUS$ 4.7 mainly as a result of the long-term loan for US$ 45 million secured from Banco Itaú to finance the full prepayment of its UF bonds and the increase in payables to related parties of MMUS$ 30 as a result of the loan taken out by the Company from its parent company, Quiñenco S.A., to finance its participation in HLAG’s IPO.

138
ANNU
AL R
EPOR
T
2015
As of December 31, 2015, equity increased by MMUS$ 151.1 compared to December 31, 2014. This variation is explained primarily by the capital increase subscribed and paid during the first quarter of 2015 for MMUS$ 165.1, partially offset by the loss of MMUS$ 14.7 recorded for the year 2015 and the positive effect in other reserves of MMUS$ 2.0 mainly from CSAV’s share of HLAG’s other comprehensive income and other changes in equity, and the issuance costs from CSAV’s most recent capital increase that have been recorded in other miscellaneous reserves awaiting approval to capitalize at the next extraordinary shareholders’ meeting.
b) Statement of Income
For the Year Ended
December 31, 2015
For the Year Ended
December 31, 2014
MM US$ MM US$ Revenue 183.1 235.3Cost of sales (180.2) (237.1)
Gross profit (loss) 2.9 (1.8)Administrative expenses (19.7) (19.2)Other operating expenses 3.8 846.6
Operating profit (loss) (13.0) 825.6EBITDA (5.9) 756.9
Finance costs, net (3.6) (3.9)Share of profit (loss) of equity method associates and joint ventures (6.5) (86.7)Exchange differences and other non-operating expenses 2.1 12.6
Income tax expense (benefit) 5.9 (127.5)Profit (loss) after taxes (15.1) 620.1
Profit (loss) from continuing operations (15.1) 620.1Loss from discontinued operations - (230.8)
Profit (loss) attributable to owners of the company (14.7) 388.7
The loss attributable to the owners of the Company of MMUS$ 14.7 for the year 2015, represents a reduction of MMUS$ 403.4 over the same period in 2014. This variation is explained mainly by the operating losses reported by the transport services operated directly by CSAV and the dilution loss in its investment in HLAG as a result of the capital increase carried out by this company in 2015 as part of its IPO.
The Company recorded an operating loss of MMUS$ 13.0 for the year ended December 31, 2015, which represents a decrease of MMUS$ 838.6 over the same period in 2014. This net difference is explained almost entirely by the gain of MMUS$ 864.0 recorded upon closing the transaction with HLAG and, to a lesser extent, to the improvement of MMUS$ 25.4 in results from other continuing activities, explained mainly by the loss of MMUS$ 18.7 that CSAV recorded in 2014 from the sale of its interest in the joint venture Dry Bulk Handy Holding (DBHH).
However, it is important to mention that during the year 2015, and despite the unfavorable conditions prevailing in the market, CSAV posted gross profit of MMUS$ 2.9, compared to a loss of MMUS$ 1.8 in 2014.

139
CSAV’s income statement reflects revenue of MMUS$ 183.1 for the period ended December 31, 2015, which represents a drop of MMUS$ 52.2 over the same period in 2014. This drop is explained mainly by reduced activity and demand for vehicle transport services in markets on the west coast of South America (see chart “Vehicle Sales in Chile and Peru”), combined with reduced freight rates in this business. Another contributing factor stems from the indexation of a portion of freight rates to variations in fuel prices: Recent drops in fuel prices during the year have resulted in decreased revenue.
The drop in revenue is also explained, although to a lesser degree, by the reduced activity in the freight forwarding business as a result of reduced volumes and low container shipping freight rates in South American markets, as well as decreased revenue from the solid bulk transport business due to the company’s strategy to exit this business. This strategy concluded with the last bulk carrier chartered by CSAV being redelivered to its owners during the third quarter of 2015.
Cost of sales amounted to MMUS$ 180.2 for the period ended December 31, 2015, which represents a decrease of MMUS$ 56.9 over the same period in 2014. This drop in operating costs is in line with reduced market activity as well as CSAV’s smaller scale in the vehicle transport business and, to a lesser extent, to the effects of the freight forwarding and solid bulk transport businesses, as mentioned above. The decrease in cost of sales can also be explained by the lower average fuel prices seen during 2015, which fell close to 42% compared to the same period in 2014. However, as mentioned above, since a portion of sales have fuel price indexation clauses, some of the positive effect on costs was partially offset by reduced revenue.
On the other hand, although to a lesser extent, the drop in fuel prices was partially offset in cost of sales because a portion of its sales uses fixed-priced contracts, and thus the company recorded greater expenses as a result of the evolution of fuel prices during the year. Administrative expenses amounted to MMUS$ 19.7, which represents an increase of MMUS$ 0.5 over the same period in 2014, explained by the costs of managing the investment in HLAG. Of this amount, MMUS$ 15.4 is related to other transport services, and MMUS$ 4.3 is related to the container shipping segment.
379 463 506 556 507
439
35
43 42
39 31
28
0
100
200
300
400
500
600
700
2010 2011 2012 2013 2014 2015
Light Vehicles Heavy Vehicles
Vehicle Sales in Chile and Peru
Tho
usa
nd
s o
f Veh
icle
s
Source: ANAC (Chile) and ARAPER (Peru)

140
ANNU
AL R
EPOR
T
2015
Other operating income amounted to MMUS$ 3.8 for the period ended December 31, 2015, which represents a decrease of MMUS$ 842.8 over the gain of MMUS$ 846.6 recorded for the same period in 2014. This difference is explained almost entirely by the aforementioned result from the transaction with HLAG in 2014.
In share of profit (loss) from equity method associates and joint ventures, CSAV recorded a loss of MMUS$ 6.5, which is explained almost entirely by the results of the investment in HLAG.
This negative result of MMUS$ 6.5 in the share of the HLAG joint venture is explained mainly by the fact that the dilution loss of MMUS$ 83.9 mentioned above was greater than CSAV’s share of HLAG’s profit for the year 2015 and the positive effects of the PPA recognized during the year.
According to the equity method, which applies to a joint venture, CSAV reflects in profit or loss its direct share of the profit or loss attributable to the owners of HLAG and also the effect on profit or loss of the amortization of purchase price allocation (PPA), determined as of transaction close on December 2, 2014 (in accordance with IAS 28). HLAG reported profit attributable to the owners of the company of MMUS$ 123.9 for the year 2015 and also recognized a positive MMUS$ 101.3 for PPA amortization for the year 2015. The company applied the equity method value to these figures: 34.0% until the third quarter of 2015 and 31.35% after the IPO for the fourth quarter of 2015. Thus, CSAV recorded a gain of MMUS$ 43.5 for its direct share of HLAG’s results and profit of MMUS$ 33.9 for its share of the PPA amortization for the year.
During 2015 CSAV recognized an income tax benefit of MMUS$ 5.9, arising mainly from the effect of variations in the euro exchange rate on the financing structure between Group subsidiaries related to the investment in HLAG, and, to a lesser extent, from the company’s operating losses for the year and changes in tax rates on deferred tax assets.
Therefore, the loss attributable to the owners of the Company of MMUS$ 14.7 represents a reduction of MMUS$ 403.4 over the same period in 2014. Bear in mind that during 2014 the Company recorded a gain of MMUS$ 864 from the transaction close with HLAG, which was partially offset by the tax effect of this transaction and the loss of MMUS$ 230.8 from the container shipping operations classified as discontinued until transaction close.
c) Operating Results by Segment
• Container Shipping: These are the container shipping services operated by HLAG, represented by the investment in that joint venture, plus certain assets and liabilities related to the container shipping business that are still controlled by CSAV (deferred asset, financial liabilities and others).
• Other Transport Services: This includes CSAV’s operations in car carrier services (mainly to markets on the west coast of South America), liquid bulk transport on the west coast of South America and logistics and freight forwarder operations through the Norgistics subsidiaries. In 2015 CSAV redelivered its last leased bulk carrier and discontinued bulk solid operations. It also restructured operations providing refrigerated cargo transport on reefer vessels, transferring these services to the Norgistics subsidiaries. Until 2014, the logistics and freight forwarding businesses, operated by the Norgistics subsidiaries, mainly served as support services for the container shipping business. After the transaction with HLAG was closed, Norgistics began operating these businesses completely independently. HLAG is now merely one of its suppliers in providing its logistics and freight forward services.

141
In 2015, the container shipping business recorded a loss of MMUS$ 10.8, explained mainly by the already mentioned loss recorded on the investment in HLAG and the administrative expenses related to this segment.
Other Transport Services 2015 2014 Change
MMUS$ MMUS$ MMUS$Revenue 183.1 235.3 (52.2)Cost of sales (180.2) (237.1) 56.9
Gross profit (loss) 2.9 (1.8) 4.7Administrative expenses (15.4) (15.9) 0.5Other operating expenses 2.3 (17.8) 20.1
Operating loss (10.2) (35.5) 25.3Finance costs, net - (0.7) 0.7Share of profit (loss) of equity method associates - 0.6 (0.6)Exchange differences and other (1.0) 7.8 (8.8)Income tax benefit 7.0 1.9 5.1
Loss from continuing operations (4.2) (25.9) 21.7Profit (loss) from discontinued operations ‐ ‐ ‐Profit (loss) attributable to non-controlling interests (0.4) 0.1 (0.5)
Loss attributable to owners of the company (3.8) (26.0) 22.2
The following chart shows the income statement by segment for the year ended December 31, 2015 (more details in note 6 to the financial statements):
Container Shipping 2015 2014 Change
MMUS$ MMUS$ MMUS$Revenue ‐ ‐ ‐Cost of sales ‐ ‐ ‐
Gross profit (loss) ‐ ‐ ‐Administrative expenses (4.3) (3.3) (1.0)Other operating expenses 1.4 864.4 (863.0)
Operating profit (loss) (2.9) 861.1 (864.0)Finance costs, net (3.6) (3.1) (0.5)Share of profit (loss) of equity method associates (6.5) (87.4) 80.9Exchange differences and other 3.3 4.8 (1.5)Income tax expense (1.1) (129.4) 128.3
Profit (loss) from continuing operations (10.8) 646.0 (656.8)Loss from discontinued operations ‐ (230.8) (230.8)Loss attributable to non-controlling interests ‐ (0.5) (0.5)
Profit (loss) attributable to owners of the company (10.8) 414.7 (425.5)

142
ANNU
AL R
EPOR
T
2015
Other transport services posted a loss of MMUS$ 3.8 during 2015, which represents an improvement of MMUS$ 22.2 over 2014. This improved result is explained mainly by the gross profit of MMUS$ 2.9 recorded by CSAV for 2015 (versus a loss of MMUS$ 1.8 in 2014) - attained despite unfavorable market conditions - and, as mentioned previously, by the loss of MMUS$ 18.6 on the sale of the company’s interest in DBHH during 2014. 2. Difference between Commercial and Book Values of Assets
The financial statements as of December 31, 2015, have been prepared in conformity with International Financial Reporting Standards (IFRS) as approved by the Chilean Securities and Insurance Supervisor, the regulatory agency that supervises the Company. Given the long-term nature of the Company’s assets as well as the nature of the services it provides and the shipping industry in general, it is possible to determine the true relationship between the book and economic values of the Company’s principal assets in the framework of IFRS provisions defined for such purpose, which have been adopted for these financial statements.
3. Market Analysis
a) Container Shipping Segment
The Company participates in the container shipping business through its investment in HLAG (accounted for as a joint venture). Although CSAV has significant influence over HLAG and jointly controls it together with other major partners, the joint venture has an independent management team that controls and manages its risks autonomously and in accordance with the standards of a publicly-listed and regulated company in Germany.
The container shipping industry continues to face volatile and generally adverse market conditions, characterized by:
• Lingering fragile and volatile global economic conditions that have resulted in low growth in demand for container transport. In particular, sluggish growth in China, the rest of Asia, Europe and Latin America have negatively affected global transport volumes.
• An oversupply of capacity as a result of shipbuilding orders during the years before the 2009 crisis. Although shipbuilding orders have stabilized at more reasonable levels, weaker demand for shipping during 2015 has generated excess supply. In 2016, the opening of the new Panama canal expansion may affect the supply and demand equilibrium along global shipping routes.
• Volatility in bunker prices, which is the industry’s main consumable. Prices remained high until the end of 2014 and have since fallen considerably like other commodities.
For several years now, the largest global shipping companies have independently taken a series of important measures to reverse these negative conditions and the changes in operating paradigms they are facing. These measures have included suspending and restructuring transport services; increasing their idle fleet and suspending voyages (in late 2015, the industry experienced the highest idle fleet levels seen since 2010); implementing super slow steaming on a global level; focusing on reducing operating costs; increasing productivity and asset use; and more efficiently using fuel.

143
In recent years, shipping companies have increased joint operating agreements in order to improve customer service levels while generating economies of scale and economies of network that would otherwise have been unreachable if operating independently. These efforts have been significant and have resulted in the formation of major global operating alliances through consortia such as 2M, Ocean Three and G6 (HLAG is a member of the latter). Currently, there is also a growing push from certain players to consolidate the industry (e.g. COSCO with China Shipping and CMA CGM with APL) as well as to restructure global joint operating alliances.
Despite operating improvements attained and efforts to streamline the industry implemented by shipping companies, freight rates net of fuel costs (“ex-bunker rates”) are still below historical levels along most routes and much lower than levels that the industry could presently consider a sustainable equilibrium. This situation has not allowed the industry as a whole to attain normal profitability levels. However, some competitors have posted positive results, thanks to their economies of scale and economies of network as well as their healthy capital structures. Nevertheless, the current low freight rates and modest growth in demand could change this situation.
Regarding the asset reinvestment process, the main global operators are driving container vessel investment plans aimed at better adjusting to the new operating paradigms. These plans are focused on boosting efficiency, reducing fuel consumption, operating as part of consortia or global operating alliances and adapting their fleets to the new Panama canal. Vessels under construction total 20% of the current operating fleet.
However, all industry players continue to face a challenging scenario. Drops in container freight rates and their high volatility in recent months have only been partially offset by reduced bunker prices.
0
200
400
600
800
1,000
1,200
1,400
1,600
1,800
Dec
-09
Apr
-10
Aug
-10
Dec
-10
Apr
-11
Aug
-11
Dec
-11
Apr
-12
Dec
-12
Apr
-13
Dec
-13
Apr
-14
Dec
-14
Apr
-15
Dec
-15
SCFI - RTM Margin Rotterdam Platts(1) SCFI(2)
Avg. Margin
2010 = 918
Avg. Margin
2011 = 392
Avg. Margin 2012 = 605
Avg. Margin 2013 = 480
Avg. Margin
2014 = 536 Avg. Margin 2015 = 468
Aug
-12
Aug
-13
Aug
-14
Aug
-15

144
ANNU
AL R
EPOR
T
2015
b) Other Transport Services Segment
The different shipping sub-segments operated by CSAV in 2015, such as transporting vehicles and refrigerated, solid bulk and liquid bulk cargo, have also been affected by weaker global demand for transport, excess supply and volatile bunker prices.
The car carrier business has experienced volatile demand since the financial crisis of 2008. Supply continues to be dominated by Japanese and Korean shipping companies, which account for about 65% of the market.
Global demand for vehicles is positively or negatively affected by the economic conditions in different countries and changes in manufacturing countries. In recent years, China has replaced other major manufacturing countries as one of the largest producers. In 2015 global demand for shipping has been impacted by the weak global economic conditions that have affected production and global exports.
Nevertheless, the global vehicle transport industry grew consistently during the last few years, showing decreases only in 2010 and 2011 as a result of the 2008 financial crisis. Until now, the year 2015 has exhibited weaker global demand. On the other hand, PCTC vessels (“Pure Car and Truck Carriers”) have increased their average size, growing from a capacity of around 4,200 vehicles in 2008 to about 4,900 vehicles in 2014, in order to increase economies of scale and operating efficiency.
CSAV transports vehicles mainly from Asia, the United States and Europe to Chilean and Peruvian markets. These markets have been strongly affected by the economic performance of both countries and, thus, vehicle imports have fallen significantly since 2014. During 2015, sales of light vehicles in these markets fell 13% while trucks and buses decreased by 10% as compared to the same period last year. This trend, coupled with more conservative inventory management by dealers, has negatively impacted both volumes and freight rates in CSAV’s vehicle transport operations. (see chart “Vehicle Sales in Chile and Peru” on page 6).
The logistics and freight forward businesses are closely related to the evolution of the container shipping business and freight rates. In recent quarters, the east and west coast markets of South America have not evolved favorably given the region’s poor economic performance.
The Company’s liquid bulk transport business is focused primarily on moving sulfuric acid along the west coast of South America. Demand in this business is primarily related to mining production and has evolved stably.
The global refrigerated bulk cargo business (reefer vessels) has lost market share over the past few years as a result of increasing use of refrigerated containers. The available supply of this type of vessel has dropped significantly to adjust to weaker demand, thereby increasing dependence on a few suppliers for vessel leases. As a result, CSAV has decided to cease operating vessels in this business and offer its clients transport solutions for the 2016 fruit season through its Norgistics subsidiaries in lieu of operating specialized refrigerated carriers.
The solid bulk carrier business has been strongly affected since the financial crisis of 2008. The industry has considerable overcapacity and shipping and vessel charter rates have remained very low. CSAV decided to reduce its exposure to this business by selling its interest in DBHH during the second quarter of 2014 and redelivering in 2015 all of the chartered vessels it operated or sub-chartered to third parties. As of December 31, 2015, CSAV has already redelivered all of its chartered vessels and, therefore, is no longer exposed to this business.

145
4. Analysis of Statement of Cash Flows The following table details the main components of cash flows for each period:
The net variation in cash and cash equivalents, equivalent to net cash flows, was an inflow of MMUS$ 6.7 for the period ended December 31, 2015, which represents an increase of MMUS$ 162.7 over the same period in 2014. It is important to point out that the Company’s cash flows for the year 2014 include its discontinued operations (CSAV’s container shipping business).
Operating activities generated a negative net flow of MMUS$ 26.2 for the period ended December 31, 2015, which represents an improvement of MMUS$ 255.2 over the same period in 2014. This negative flow can be mainly explained by the operating results and administrative expenses posted by other transport services, as well as by payments to cover closing costs for the transaction with HLAG, disbursements related to investigations by antitrust regulators in the car carrier business and payments to close the solid bulk transport business. Most of these payments were provisioned and, thus, did not affect profit for the period.
Investing activities generated a negative net flow of MUS$ 32.3 for the period ended December 31, 2015, which represents an improvement of MUS$ 414.7 over the same period in 2014. This flow is explained mainly by the company’s subscription of shares in HLAG’s IPO (MMUS$ 29.7) and, to a lesser extent, to major maintenance performed on liquid bulk carriers owned by the company. Other factors from 2014 include the Company’s participation in a capital increase in HLAG in December of that year and installment payments on the construction of container ships.
December 31,
2015 2014
MMUS$ MMUS$Cash flows from operating activities (26.1) (281.4)
Operating cash flows (25.2) (276.8)Income taxes and other (0.9) (4.6)
Cash flows from investing activities (32.4) (447.0)Loss of control of subsidiaries or other businesses - (86.6)Acquisition of interest in joint ventures (29.7) (243.1)Purchases and sales of property, plant and equipment (2.9) (120.3)Other 0.2 3.0
Cash flows from financing activities 67.5 567.3Payment to purchase treasury shares - (20.9)Issuance of shares 162.7 428.6Loans obtained from and paid to related parties 30.0 -Loans obtained and paid (121.2) 208.9Interest payments (3.2) (39.8)Other (0.8) (9.5)
Effect of change in exchange rate (2.3) 5.1Net cash flows 6.7 (156.0)

146
ANNU
AL R
EPOR
T
2015
Financing activities generated a positive net flow of MMUS$ 67.5 for the period ended December 31, 2015, which represents a decrease of MMUS$ 499.8 over the same period in 2015. This variation is explained mainly by the effect of decreased proceeds from loans obtained net of reduced loan payments (MMUS$ 330.1), reduced proceeds from issuances of other equity instruments (MMUS$ 265.9), the amount drawn down from the loan from Quiñenco S.A. in 2015, classified as loans from related parties, to finance the Company’s participation in HLAG’s IPO (MMUSD$ 30.0), payments made in 2014 to acquire shares from shareholders exercising their appraisal right (MMUS$ 20.9), and a reduction in interest paid (MMUS$ 36.6).
5. Analysis of Market Risk
The Company’s investment in HLAG is presently its primary asset (80.5% of total assets as of December 31, 2015). Therefore, although the market risks of the container shipping business are not directly reflected in CSAV’s financial statements, they are indirectly reflected since the effects are ultimately presented in the value of CSAV’s investment in that joint venture, in the dividends it can receive from that company and in the effects on equity and profit or loss for the period. Therefore, even though CSAV contributed its entire container shipping business to HLAG in 2014, the main business risks continue to be related to container shipping.
As mentioned previously, HLAG has an independent management team that controls and manages its risks autonomously and in accordance with the standards of a publicly-listed and regulated company in Germany.
The principal risks that the Company faces from the segments it continues to operate directly (other transport services segment) stem from the possibility of deteriorating demand for ocean transport, an increase in supply, a drop in freight rates and a rise in oil prices. Other risks that may affect the industry include heightened competition, asset obsolescence, environmental risks and regulatory changes.
On the demand side, risk comes primarily from the global economic conditions and the impact of global economic slowdown. As of January 2016, the International Monetary Fund (IMF) is forecasting a 0.3% contraction in global GDP growth (3.1% for 2015 compared to 3.4% in 2014). In other words, no major change in demand is expected in the short term. South America continues to perform weakly. For 2016, the IMF predicts a slight recovery, forecasting GDP growth of 3.4%. The organization is also forecasting growth in global trade (products and services) of 3.4% for 2016 versus 2.6% in 2015.
On the supply side, there is the risk that new vessel construction exceeds future demand, thus exacerbating the imbalance.
In addition, the main risk in the vehicle transport business stems from the weakness of key markets for CSAV (west coast of South America) and global balance of supply and demand for maritime shipping.

147
The price of oil has dropped considerably since the last quarter of 2014. However, it continues to be volatile and there is no certainty as to how it will evolve in the future. A portion of freight sales is indexed to fuel price variations. The Company takes out fuel price hedges for other, fixed-price sales.
In relation to interest rate risks, as of December 31, 2015, all of the Company’s liabilities were at floating rates indexed to the Libor, which has remained stable, although the future curve indicates a slight upward trend.
Regarding exchange rate volatility, most of the Company’s income and expenses are denominated in US dollars. As of December 31, 2015, certain assets and liabilities are denominated in other currencies. As indicated in Note 5 to the consolidated financial statements, in early 2015 the Company hedged its exchange rate risks (Chilean peso to US dollar) on loans for the capital increase underway at that time, which were paid in February 2015. Similarly, before the Company fully prepaid its UF bonds, it had liabilities exposed to the depreciation of the Chilean peso, which positively affected exchange differences for the year 2015.
6. Financial Ratios
As of December 31, 2015, the Company’s principal ratios have performed as follows:
a) Liquidity Ratios
Liquidity Ratios December 31,
2015December 31,
2014
Current Liquidity =Current Assets
1.308 0.352Current Liabilities
Acid-Test Ratio =Cash and Cash Equivalents
0.855 0.171Current Liabilities
· Current Liquidity: This ratio increased in comparison to December 2014, due to a decrease in current assets (MMUS$ 13.7) and a sharp decline in current liabilities (MMUS$ 205.3).
· Acid-Test Ratio: This ratio increased in comparison to December 2014, due to an increase in cash (MMUS$ 6.7) and a decline in current liabilities (MMUS$ 205.3).

148
ANNU
AL R
EPOR
T
2015
b) Leverage Ratios
Leverage Ratios December 31,2015
December 31,2014
Leverage = Total Liabilities 0.085 0.164Equity
Short-Term Leverage = Current Liabilities 0.351 0.858Total Liabilities
Long-Term Leverage = Non-Current Liabilities 0.649 0.142Total Liabilities
Financial Expense Coverage = Profit (Loss) before
4.833 192.692 Tax and InterestFinance Costs
• Leverage: This ratio decreased as compared to December 2014 due to a decrease in total liabilities (MMUS$ 135.9) mainly as a result of prepaying the bridge loan in February 2015, and an increase in equity (MMUS$ 151.0) primarily attributable to profit for the period and the portion of the capital increase subscribed and paid in early 2015.
• Short-Term Leverage: This ratio decreased as compared to December 2014 because the decrease in current liabilities (MMUS$ 205.2) is greater than the decrease in total liabilities (MMUS$ 135.9).
• Long-Term Leverage: Unlike the short-term index, this ratio increased in comparison to December 2014 and June 2014 as the weight of current liabilities decreased.
• Financial Expense Coverage: This ratio decreased considerably with respect to December 2014, mainly due to a decrease in profit before taxes and interest of MMUS$ 768.9, which can be explained to a large extent by the before-tax gain of MMUS$ 777 recorded in December 2014 as a result of the transaction with HLAG.
c) Profitability Ratios
Profitability Ratios December 31,2015
December 31, 2014
Return on Equity = Profit (Loss) Attributable to Owners
-0.007 0.266Average Equity
Return on Assets = Profit (Loss) Attributable to Owners
-0.007 0.169Average Assets
Return on Operating Assets =Operating Profit (Loss)
-0.007 0.340Average Operating Assets *
Dividend Yield =Dividends Paid in
0.000 0.000 Last 12 MonthsMarket Value of Stock
Earnings (Loss) per Share =Profit (Loss) Attributable to Owners
-0.0005 0.0227 Number of Shares
Market Value of Stock (Ch$) 13.7 22.4
*Average Operating Assets: Total assets less deferred taxes and intangible assets.

149
· Return on Equity: This ratio fell as compared to December 2014 due to a decrease in profit for the period of MMUS$ 403.4, partially offset by an increase in average equity of MMUS$ 512.1.
· Return on Assets: This ratio decreased as compared to December 2014 due to a decrease in profit for the period of MMUS$ 403.4 and a decrease in average assets of MMUS$ 75.7.
· Return on Operating Assets: This ratio decreased as compared to December 2014 due to a decrease in operating profit of MMUS$ 654.0 and an increase in average operating assets of MMUS$ 21.8.
· Dividend Yield: This index remained constant because no dividends were distributed in 2014 and 2015.
· Earnings per Share: Earnings per share decreased as compared to December 2014 because of a decrease in profit for the period of MMUS$ 403.4 and an increase of 13,599 million in the number of shares.
· Market Value of Stock: The share value posted a strong variation of 39% over December 2014.
d) Activity Ratios
Activity Ratios December 31, 2015
December 31, 2014
Inventory Turnover =Fuel Costs Average
8.235 13.375Inventories
Inventory Permanence =Average Inventories * 360
43.717 26.717Fuel Costs
· Inventory Turnover: As of December 31, 2015, there is a drop in this indicator with respect to the same period in 2014. For comparison purposes, the figure for fuel costs as of December 31, 2014, includes 11 months of container shipping activities.
· Inventory Permanence: As of December 31, 2015, there is an increase in this indicator with respect to the same period in 2014. For comparison purposes, the figure for fuel costs as of December 31, 2014, includes 11 months of container shipping activities.

150
ANNU
AL R
EPOR
T
2015
Material Events Compañía Sud Americana de Vapores S.A. (CSAV) reported the following material events for 2015 to the Superintendency of Securities and Insurance:
1. On January 28, 2015, CSAV reported having learned of a summons from the National Economic Prosecutor’s Office against several shipping companies, including CSAV, for violating letter a) of article 3 of Decree Law 211 of 1973, regarding the Defense of Free Competition (DL 211), in the car carrier business.
The above is related to the material event filed on September 14, 2012, in which the Board of Directors instructed management to fully collaborate with any investigation intended to identify the existence of illegal, anti-competitive practices related to cooperation agreements on matters of price and client distribution entered into by shipping companies in the car carrier business.
As indicated in the summons and set forth in article 39 bis of DL 211, CSAV is exempt from fines related to the aforementioned practices. Therefore, this event has no financial impact on CSAV’s results.
2. On September 28, 2015, CSAV reported that at the extraordinary board meeting held on September 24, 2015, the directors in attendance unanimously agreed to commit, once HLAG announced its intent to go public, to participating in the US$500 million capital increase that HLAG planned to conduct in 2015 as part of its initial public offering (IPO).
On the same date, HLAG informed the market of its intent to register its shares on the regulated market segment (Prime Standard) in the Frankfurt and Hamburg exchanges and to offer the first issuance of US$400 million in paid shares to institutional investors and the general public. An additional US$100 million would be contributed in equal parts by CSAV and Kühne Maritime GmbH. Furthermore, TUI-Hapag Beteiligungs GmbH (TUI) would sell a portion of its shares during the IPO, which also included an over-allotment option (Greenshoe Option). A copy of the press release issued by HLAG on that date can be found in the Investor Relations (IR) section of the company web page (www.hapag-lloyd.com).
CSAV’s commitment to contribute US$50 million to HLAG’s capital increase was subject to market conditions allowing successful placement of the IPO’s first and second issuances. The specific terms and conditions of CSAV’s commitment were set forth in the Cornerstone Investor Agreement, which was under negotiation at the time. Loans would be taken out to fund CSAV’s contribution to HLAG.
Neither the exact launch date for the IPO nor the share placement price had been announced.
CSAV reported that the financial impact of the HLAG IPO and CSAV’s subscription of US$50 million in shares could not be reasonably quantified at that time; however, it could be reported once the placement price of HLAG shares was announced.
3. On October 14, 2015, the following was reported as a material event to complement the event reported on September 28, 2015: HLAG announced the terms of its initial public offering (IPO), following approval of the prospectus by the German financial regulator (BaFin). The price range for HLAG shares was set between EUR 23 and EUR 29 per share.

151
Underwriters would offer shares to investors during the period between October 15 and October 27, 2015. HLAG would determine the final placement price on the basis of a book building process. The price was expected to be communicated on the same date (October 27).
The IPO included a rights issuance in order to raise US$300 million (approximately EUR 265 million), of which CSAV and Kühne Maritime GmbH were committed to subscribing the equivalent of US$30 million each. HLAG shares owned by TUI-Hapag Beteiligungs GmbH (“TUI”) valued at up to US$60 million (approximately EUR 53 million) would be offered subject to exercise of a placement option to be agreed upon jointly by TUI and HL. This was in addition to the underwriters’ option of offering up to an additional US$50 million (approximately EUR 44.2 million) in TUI-owned HLAG shares as a stabilizing measure in the event of over-allotment (Greenshoe Option).
Shares were expected to be allocated based on the order book on October 27. Trading of shares on the regulated market segment (Prime Standard) in the Frankfurt and Hamburg stock exchanges was expected to commence on October 30.
HLAG decided to proceed with its plan to hold the IPO in 2015 based on HLAG management and shareholders’ estimation that the benefits—improving access to capital markets and increasing the liquidity of HLAG shares—outweighed the impact of adverse market conditions on the placement price range. Consequently and as a result of the challenging conditions facing the German and international market at the time, the size of the IPO was readjusted so that the US$300 million raised would enable HLAG to carry out ship and container investment projects that were on hold while also making it possible to maintain adequate free float.
A copy of the press release issued by HLAG on that date and the entire text of the IPO prospectus can be found in the Investor Relations (IR) section of the company web page (www.hapag-lloyd.com).
As of that date, CSAV had signed the Cornerstone Investor Agreement, by virtue of which it had committed to contributing US$30 million to the HLAG capital increase. The reduction from the US$50 million originally reported was a result of the readjusted size of the IPO and in order to maintain adequate free float. The obligation had been subject to the condition that the IPO be placed within the price range previously set.
CSAV’s contribution to HLAG would be funded via a loan of up to US$30 million granted by CSAV’s parent company, Quiñenco S.A. Loan conditions were still under negotiation and required advance approval by the directors of both companies, in conformity with the provisions of Title XVI of the Corporations Law.
Since CSAV would not subscribe the full number of shares available to it in the first issuance of HLAG shares, given its 34% ownership and the price range set for the HLAG IPO, the Company was expected to record a dilution loss of between US$38 million and US$64 million. These estimates were based on the high (EUR 29) and low (EUR 23) set for HLAG shares. The real loss would be confirmed on October 27, when the final placement price was set and would also depend on the applicable current dollar/euro exchange rate. The estimated loss range would also be corrected in that announcement. Finally, the loss would be reflected in the consolidated financial statements dated December 31, 2015, which CSAV must prepare and publish in accordance with current standards, included herein.

152
ANNU
AL R
EPOR
T
2015
4. On October 30, 2015, the following was reported as a material event to complement the events reported on September 28, 2015 and October 14, 2015: Given the volatilities of the market, HLAG had adjusted the price range for shares in its IPO. The new price range had been set at between EUR 20 and EUR 22 per share (previously EUR 23 and EUR 29 per share). Prior to this announcement, the share offering period had been postponed to between October 27 to November 3, 2015.
The new structure of the IPO still allowed HLAG to raise cash capital contributions of approximately US$300 million (nearly EUR 265 million). The company’s main shareholders, CSAV and Kühne Maritime GmbH, both reaffirmed their commitment to subscribe paid shares for the equivalent of US$30 million each in accordance with their corresponding Cornerstone Investor agreements. Thus, CSAV had once again supported the possibility of HLAG accessing liquidity on capital markets to fund investment projects. At the same time, it was taking its main asset public with adequate free float, in keeping with the material event reported on October 14, 2015.
The new IPO structure retained the underwriters’ option of offering up to an additional EUR 40 million in TUI-owned HLAG shares as a stabilizing measure in the event of over-allotment (Greenshoe Option). However, it omitted TUI’s original option of placing additional TUI-owned shares valued at approximately US$60 million.
HLAG would determine the final placement price on the basis of a book building process. The price was expected to be communicated on the same date (November 3). Trading of shares on the regulated market segment (Prime Standard) in the Frankfurt and Hamburg stock exchanges was expected to commence on November 6.
The estimated impact of dilution of CSAV’s participation in HLAG had to be updated to reflect the new price range for HLAG shares. As reported in the material event dated October 14: Since CSAV would not be subscribing the full number of HLAG shares available to it (up to 34% of current share capital) and given the new price range for the IPO, the company was expected to record a dilution loss of between approximately US$66 million and US$84 million. The real loss would be confirmed on November 3, after the final placement price was set. It would also depend on the dollar/euro exchange rate applicable on the date of acquisition of shares at the IPO. The loss would be reflected in the consolidated financial statements dated December 31, 2015, which CSAV must prepare and publish in accordance with current standards, included herein.
5. On November 3, 2015, the following was reported as a material event to complement the events reported on September 28, 2015 and October 14 and 30, 2015: In the context of its IPO, HLAG set the share placement price at EUR 20 per share.
Thus, the HLAG IPO concluded with the placement of 15,212,978 shares totaling approximately EUR 304 million. Of those, 13,228,677 were paid, first issuance shares totaling approximately EUR 265 million, which HLAG planned to invest in ships and containers. The remaining 1,984,301 shares (approximately EUR 39 million), owned by TUI-Hapag Beteiligungs GmbH (“TUI”), were placed by virtue of an option provided to underwriters in order to cover over-allotment of shares (Greenshoe Option).
153
In accordance with its commitment—set forth in the Cornerstone Investor Agreement—to subscribe shares equal to US$30 million, CSAV was assigned 1,366,991 new shares of HL, totaling approximately EUR 27.34 million—the equivalent of 10.33% of the first issuance shares placed at the IPO. As a result, CSAV’s capital interest in HLAG dropped from 34.01% before the IPO to 31.35% of post-IPO share capital.
On November 6, HLAG stock began trading on the regulated market segment in the Frankfurt (Prime Standard) and Hamburg exchanges under the local code (WKN) HLAG47 and the international code (ISIN) DE000HLAG475.
By virtue of the above and as reported in the material event dated October 30, the dilution loss for CSAV was estimated at approximately US$84 million. The amount could be corrected based on the dollar/euro exchange rate applicable on the date of share acquisition at the IPO on November 6. The loss would be reflected in the consolidated financial statements dated December 31, 2015, which CSAV must prepare and publish in accordance with current standards, included herein.
According to the consolidated financial statements dated December 31, 2015, included herein, the aforementioned dilution loss totaled US$83.9 million. Summary of Comments and Proposals
There are no directors’ committee or shareholder comments or proposals regarding the course of business which, pursuant the third paragraph of Article 74 of Law 18,046, must be included in this annual report.

154
ANNU
AL R
EPOR
T
2015

