basic financial statements - boston
TRANSCRIPT

City of BostonMassachusetts
Basic FinancialStatements
Fiscal Year Ended June 30, 2019
Martin J. Walsh, MayorEmme Handy, Chief of Administration and Finance & Collector TreasurerMaureen Joyce, City Auditor

City of BostonBasic Financial Statements → Fiscal Year Ended June 30, 2019
TABLE OF CONTENTS
FINANCIAL SECTIONIndependent Auditors’ Report � � � � � � � � � � � � � � � � � � � � � � � � � � � � � � � � � � � � � � � � � A-1
Management’s Discussion and Analysis (Unaudited) � � � � � � � � � � � � � � � � � � � � � � � A-3
Basic Financial Statements:
GOVERNMENT-WIDE FINANCIAL STATEMENTS
Statement of Net Position � � � � � � � � � � � � � � � � � � � � � � � � � � � � � � � � � � � � � � � � � � � � A-15
Statement of Activities� � � � � � � � � � � � � � � � � � � � � � � � � � � � � � � � � � � � � � � � � � � � � � � A-18
FUND FINANCIAL STATEMENTS
Balance Sheet – Governmental Funds � � � � � � � � � � � � � � � � � � � � � � � � � � � � � � � � � � A-20
Reconciliation of the Balance Sheet of the Governmental Funds to the Statement of Net Position � � � � � � � � � � � � � � � � � � � � � � � � � � � � � � � � � � � � � � � � � � � � A-21
Statement of Revenues, Expenditures, and Changes in Fund Balances – Governmental Funds � � � � � � � � � � � � � � � � � � � � � � � � � � � � � � � � � � � � � � � � � � � � � � � � A-22
Reconciliation of the Statement of Revenues, Expenditures, and Changes in Fund Balance of Governmental Funds to the Statement of Activities � � � � � � � � � A-23
Statement of Revenues and Expenditures – Budgetary Basis, General Fund – Budget and Actual � � � � � � � � � � � � � � � � � � � � � � � � � � � � � � � � � � � � � � � � � � � � � � � � � � A-24
Statement of Net Position – Proprietary Fund� � � � � � � � � � � � � � � � � � � � � � � � � � � � A-25
Statement of Revenues, Expenses, and Changes in Net Position – Proprietary Fund� � � � � � � � � � � � � � � � � � � � � � � � � � � � � � � � � � � � � � � � � � � � � � � � � � � � A-26
Statement of Cash Flows – Proprietary Fund � � � � � � � � � � � � � � � � � � � � � � � � � � � � � A-27
Statement of Fiduciary Net Position – Fiduciary Funds� � � � � � � � � � � � � � � � � � � � � A-28
Statement of Changes in Fiduciary Net Position – Fiduciary Funds � � � � � � � � � � � A-29
Notes to the Basic Financial Statements � � � � � � � � � � � � � � � � � � � � � � � � � � � � � � � A-30
Required Supplementary Information (Unaudited):Schedules of OPEB Contributions � � � � � � � � � � � � � � � � � � � � � � � � � � � � � � � � � � � � � � A-68
Schedules of Changes in Net OPEB Liability � � � � � � � � � � � � � � � � � � � � � � � � � � � � � � A-69
Schedule of City’s Proportionate Share of the Net Pension Liability – Boston Retirement System � � � � � � � � � � � � � � � � � � � � � � � � � � � � � � � � � � � � � � � � � � � � � � � � � � A-70
Schedule of City’s Contributions – Boston Retirement System � � � � � � � � � � � � � � A-70
FINANCIAL SECTIONIndependent Auditors’ Report � � � � � � � � � � � � � � � � � � � � � � � � � � � � � � � � � � � � � � � � � A-1
Management’s Discussion and Analysis (Unaudited) � � � � � � � � � � � � � � � � � � � � � � � A-3
Basic Financial Statements:
GOVERNMENT-WIDE FINANCIAL STATEMENTS
Statement of Net Position � � � � � � � � � � � � � � � � � � � � � � � � � � � � � � � � � � � � � � � � � � � � A-15
Statement of Activities� � � � � � � � � � � � � � � � � � � � � � � � � � � � � � � � � � � � � � � � � � � � � � � A-17
FUND FINANCIAL STATEMENTS
Balance Sheet – Governmental Funds � � � � � � � � � � � � � � � � � � � � � � � � � � � � � � � � � � A-19
Reconciliation of the Balance Sheet of the Governmental Funds to the Statement of Net Position � � � � � � � � � � � � � � � � � � � � � � � � � � � � � � � � � � � � � � � � � � � � A-20
Statement of Revenues, Expenditures, and Changes in Fund Balances – Gov-ernmental Funds � � � � � � � � � � � � � � � � � � � � � � � � � � � � � � � � � � � � � � � � � � � � � � � � � � � A-21
Reconciliation of the Statement of Revenues, Expenditures, and Changes in Fund Balance of Governmental Funds to the Statement of Activities � � � � � � � � � A-22
Statement of Revenues and Expenditures – Budgetary Basis, General Fund – Budget and Actual � � � � � � � � � � � � � � � � � � � � � � � � � � � � � � � � � � � � � � � � � � � � � � � � � � A-23
Statement of Net Position – Proprietary Fund� � � � � � � � � � � � � � � � � � � � � � � � � � � � A-26
Statement of Revenues, Expenses, and Changes in Net Position – Propri-etary Fund� � � � � � � � � � � � � � � � � � � � � � � � � � � � � � � � � � � � � � � � � � � � � � � � � � � � � � � � � A-27
Statement of Cash Flows – Proprietary Fund� � � � � � � � � � � � � � � � � � � � � � � � � � � � � A-28
Statement of Fiduciary Net Position – Fiduciary Funds� � � � � � � � � � � � � � � � � � � � � A-29
Statement of Changes in Fiduciary Net Position – Fiduciary Funds � � � � � � � � � � � A-30
Notes to the Basic Financial Statements � � � � � � � � � � � � � � � � � � � � � � � � � � � � � � � A-31
Required Supplementary Information (Unaudited):Schedules of OPEB Contributions � � � � � � � � � � � � � � � � � � � � � � � � � � � � � � � � � � � � � � A-69
Schedules of Changes in Net OPEB Liability � � � � � � � � � � � � � � � � � � � � � � � � � � � � � � A-70
Schedule of City’s Proportionate Share of the Net Pension Liability – Boston Retirement System � � � � � � � � � � � � � � � � � � � � � � � � � � � � � � � � � � � � � � � � � � � � � � � � � � A-71
Schedule of City’s Contributions – Boston Retirement System � � � � � � � � � � � � � � A-71

City of BostonBasic Financial Statements → Fiscal Year Ended June 30, 2019A-1
Financial Section → INDEPENDENT AUDITORS’ REPORT

A-2City of BostonBasic Financial Statements → Fiscal Year Ended June 30, 2019
Financial Section → INDEPENDENT AUDITORS’ REPORT

Financial Section → MANAGEMENT’S DISCUSSION AND ANALYSIS
City of BostonBasic Financial Statements → Fiscal Year Ended June 30, 2019A-3
MANAGEMENT’S DISCUSSION AND ANALYSIS
(Unaudited)
The City of Boston (the City) provides this Management’s Discussion and Analysis to present additional information to the readers of the City’s basic financial statements. This narrative overview and analysis of the financial activities of the City is for the fiscal year ended June 30, 2019. Readers are encouraged to consider this information in conjunction with the additional information that is furnished in the City’s Comprehensive Annual Financial Report (CAFR).
OVERVIEW OF THE FINANCIAL STATEMENTS
This discussion and analysis is intended to serve as an introduction to the City’s financial statements. The City’s basic financial statements include three components: 1) Government-wide Financial Statements, 2) Fund Financial Statements, and 3) Notes to the Financial Statements. This report also contains required supplementary information regarding historical pension information and other postemployment benefit (OPEB) plan information. The components of the financial statements are described in the following sections.
Basic Financial Statements
The basic financial statements include two types of financial statements that present different views of the City – the Government-wide Financial Statements and the Fund Financial Statements� The Notes to the Basic Financial Statements supplement the financial statement information and clarify line items that are part of the financial statements.
Government-wide Financial Statements
The Government-wide Financial Statements provide a broad view of the City’s operations in a manner similar to a private sector business. The statements provide both short-term and long-term information about the City’s financial position, which assists in assessing the City’s economic condition at the end of the fiscal year. These are prepared using the economic resources measurement focus and the accrual basis of accounting. This basically means they follow methods that are similar to those used by most businesses. They take into account all revenues and expenses connected with the fiscal year even if cash involved has not been received or paid. The Government-wide Financial Statements include two statements:
● The Statement of Net Position presents all of the government’s assets and deferred outflows of resources and liabilities and deferred inflows of resources, with the difference between them reported as net position. Over time, increases or decreases in the City’s net position may serve as a useful indicator of whether the financial position of the City is improving or deteriorating.
● The Statement of Activities presents information showing how the government’s net position changed during the most recent fiscal year. All changes in net position are reported as soon as the underlying event giving rise to the change occurs, regardless of the timing of related cash flows. Thus, revenues and expenses are reported in this statement for some items that will not result in cash flows until future fiscal periods (such as uncollected taxes and earned but unused vacation leave). This statement also presents a comparison between direct expenses and program revenues for each function of the City.
Both the above financial statements present two separate sections as described below.
● Governmental Activities – The activities in this section are mostly supported by taxes and intergovernmental revenues (federal and state grants). Most services normally associated with city government fall into this category, including general government, human services, public safety, public works, property and development, parks and recreation, library, schools, public health programs, state and district assessments, and debt service.
● Discretely Presented Component Units – These are legally separate entities for which the City has financial accountability but function independent of the City. For the most part, these entities operate similar to private sector businesses. The City’s four discretely presented component units are the Boston Public Health Commission, the Boston Development & Planning Agency, the Economic Development Industrial Corporation, and the Trustees of the Boston Public Library.
Financial Section → MANAGEMENT’S DISCUSSION AND ANALYSIS
A-4City of BostonBasic Financial Statements → Fiscal Year Ended June 30, 2019
Complete financial statements of the individual component units can be obtained from their respective administrative offices. Additional information about the City’s component units is presented in the Notes to the Financial Statements.
The Government-wide Financial Statements can be found immediately following this discussion and analysis.
Fund Financial Statements
A fund is a grouping of related accounts that is used to maintain control over resources that have been segregated for specific activities or objectives. The City, like other local governments, uses fund accounting to ensure and demonstrate compliance with finance-related legal requirements.
The Fund Financial Statements focus on individual parts of the City government, reporting the City’s operations in more detail than the Government-wide Financial Statements. All of the funds of the City can be divided into three categories. It is important to note that these fund categories use different accounting approaches and should be interpreted differently. The three categories of funds are:
Governmental Funds – Most of the basic services provided by the City are financed through governmental funds. Governmental funds are used to account for essentially the same functions reported as governmental activities in the Government-wide Financial Statements. However, unlike the Government-wide Financial Statements, the Governmental Fund Financial Statements focus on near term inflows and outflows of spendable resources. They also focus on the balances of spendable resources available at the end of the fiscal year. Such information may be useful in evaluating the government’s near term financing requirements. This approach is known as using the flow of current financial resources measurement focus and the modified accrual basis of accounting. Under this approach, revenues are recorded when cash is received or when susceptible to accrual (i.e., measurable and available to liquidate liabilities of the current period). Expenditures are generally recorded when liabilities are incurred, except for those related to long-term liabilities, which are recorded when due and payable. These statements provide a detailed short term view of the City’s finances to assist in determining whether there will be adequate financial resources available to meet the current needs of the City.
Because the focus of governmental funds is narrower than that of the Government-wide Financial Statements, it is useful to compare the information presented for governmental funds with similar information presented for governmental activities in the Government-wide Financial Statements. By doing so, readers may better understand the long term impact of the government’s near term financing decisions. Both the governmental fund balance sheet and the governmental fund statement of revenues, expenditures, and changes in fund balances provide a reconciliation to facilitate this comparison between governmental funds and the governmental activities. These reconciliations are presented on the page immediately following each governmental fund financial statement.
The City presents four columns in the governmental fund balance sheet and in the governmental fund statement of revenues, expenditures, and changes in fund balances. The City’s three major governmental funds are the General Fund, the Special Revenue Fund, and the Capital Projects Fund. All non-major governmental funds are combined in the “Other Governmental Funds” column on these statements. The Governmental Fund Financial Statements can be found immediately following the Government-wide Financial Statements.
Of the City’s governmental funds, the General Fund is the only fund for which a budget is legally adopted. The Statement of Revenues and Expenditures – Budgetary Basis is presented after the governmental fund financial statements. This statement provides a comparison of the General Fund original and final budget and the actual expenditures for the current and prior year on a budgetary basis.
In accordance with state law and regulations, the City’s legally adopted General Fund budget is prepared on a “budgetary” basis instead of U.S. generally accepted accounting principles (GAAP). Among the key differences between these two sets of accounting principles are that “budgetary” records property tax as it is levied, while GAAP records it as it becomes susceptible to accrual, “budgetary” records certain activities and transactions in the General Fund that GAAP records in separate funds, and “budgetary” records any amount raised to cover a prior year deficit as an expenditure and any available funds raised from prior year surpluses as a revenue, while GAAP ignores these impacts from prior years. The difference in accounting principles inevitably leads to varying results in excess or deficiency of revenues over expenditures. Additional information and a reconciliation of “budgetary” to GAAP statements is provided in note 4 to the Financial Statements.
Financial Section → MANAGEMENT’S DISCUSSION AND ANALYSIS
City of BostonBasic Financial Statements → Fiscal Year Ended June 30, 2019A-5
Proprietary Funds – These funds are used to show activities that operate more like those of commercial enterprises. Like the Government-wide Financial Statements, Proprietary Fund Financial Statements use the economic resources measurement focus and accrual basis of accounting. There are two types of proprietary funds – enterprise funds and internal service funds. Enterprise funds charge fees for services provided to outside customers including local governments. Enterprise Funds provide the same type of information as the business-type activities of the Government-wide Financial Statements within governmental activities, only in more detail. Currently, the City does not have any enterprise funds. The Internal Service Fund provides health insurance services predominantly to other funds, departments or agencies of the City. Therefore, its activities are included in the Government-wide financial statements within governmental activities.
The Proprietary Funds Financial Statements can be found immediately following the Governmental Fund Financial Statements.
Fiduciary Funds – These funds are used to account for resources held for the benefit of parties outside the City government. Fiduciary funds are not reflected in the Government-wide Financial Statements because the resources of these funds are not available to support the City’s own programs. The accounting used for fiduciary funds is much like that used for proprietary funds. They use the economic resources measurement focus and accrual basis of accounting.
The City’s fiduciary funds are the Employee Retirement Fund (the Boston Retirement System), which accounts for the transactions, assets, liabilities, and net position of the City employees’ pension plan; the Other Postemployment Benefits (OPEB) Trust Fund, which is an irrevocable trust established for the accumulation of assets to reduce the liability associated with the City’s obligation for other postemployment benefits; and the Private Purpose Trust and Agency Funds, which include money held and administered by the City on behalf of third parties.
The Fiduciary Funds Financial Statements can be found immediately following the Proprietary Fund Financial Statements.
Notes to the Financial Statements
The notes provide additional information that is essential to a full understanding of the data provided in the Government-wide and the Fund Financial Statements. The Notes to the Financial Statements can be found immediately following the Fiduciary Funds Financial Statements.
Required Supplementary Information
The basic financial statements are followed by a section of required supplementary information, which includes a schedule of funding progress and a schedule of employer contributions for the OPEB Trust Fund, a schedule of changes in net OPEB liability and related ratios, a schedule of the City’s proportionate share of the net pension liability of the Boston Retirement System, and a schedule of the City’s contributions to the Boston Retirement System.
CURRENT YEAR FINANCIAL IMPACTS
● The City of Boston’s OPEB obligation significantly impacts the Government-wide financial results. The most recent valuation of the City’s OPEB obligation as of June 30, 2017, estimated that the total OPEB liability of the City increased by $61.1 million to $2.4 billion. This increase was largely a result of increasing costs.
● In fiscal year 2019, the City’s contribution to the OPEB Trust Fund ($180.7 million) for retiree health benefits includes $40.0 million in advance funding toward reducing the OPEB liability. The Actuarially Determined Contribution (ADC) was not met in 2019, resulting in an increase in the net OPEB obligation. In fiscal year 2020, the City has also appropriated $40.0 million in advance funding toward reducing the OPEB liability.
● In fiscal year 2019, the City elected to change its measurement date for OPEB from a beginning of year measurement date to an end of year measurement date. As a result of the change in measurement date, beginning net position of the governmental activities as of July 1, 2018 was restated (reduced) by approximately $217.6 million.
Financial Section → MANAGEMENT’S DISCUSSION AND ANALYSIS
A-6City of BostonBasic Financial Statements → Fiscal Year Ended June 30, 2019
● The City of Boston’s net pension liability significantly impacts the Government-wide financial results. The City is required to report its proportionate share of the collective net pension liability, deferred outflows of resources, deferred inflows of resources, and pension expense. Based on the measurement of the Boston Retirement System’s net pension liability as of December 31, 2018, the City’s proportionate share of that net pension liability increased by $377.53 million and the net pension liability for the City’s non contributory plan as of June 30, 2019 increased by $6.4 million resulting in a total net pension liability of $1.76 billion.
GOVERNMENT-WIDE FINANCIAL ANALYSIS
This analysis is based on the Statement of Net Position and the Statement of Activities found directly after Management’s Discussion and Analysis�
Government-wide Highlights
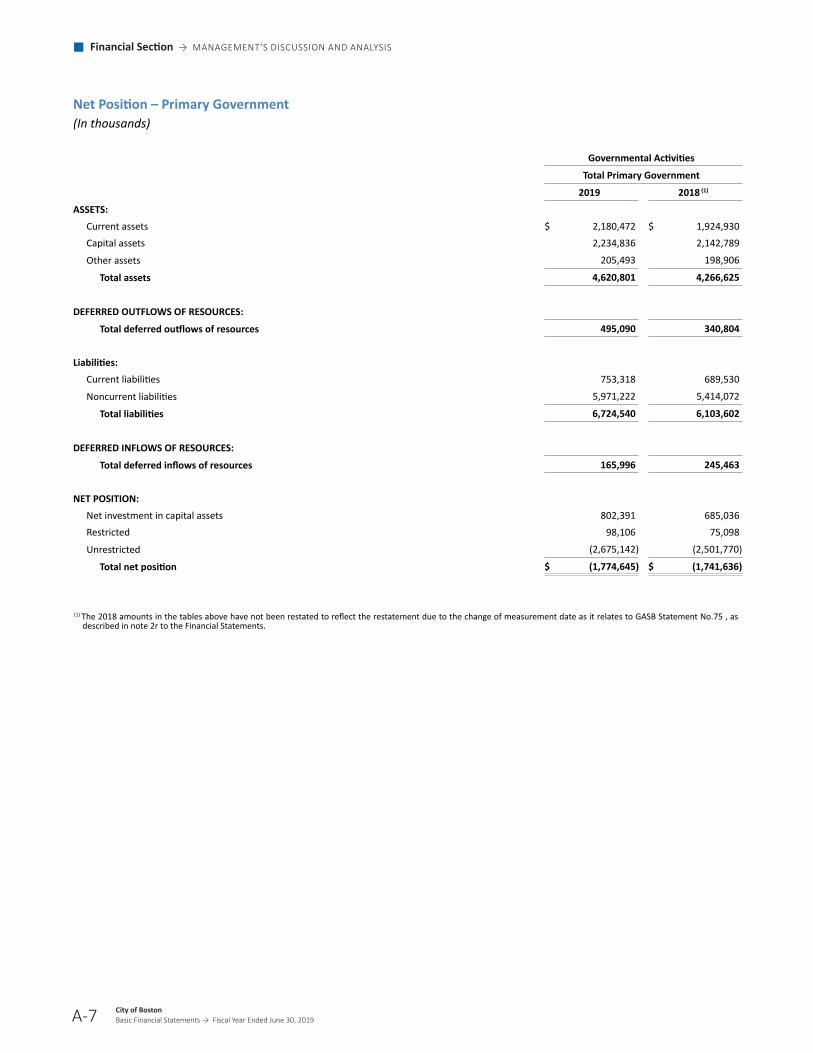
Net Position – Primary Government – The total liabilities and deferred inflows of resources of the City exceeded its assets and deferred outflows of resources at fiscal year ended June 30, 2019 in a net deficit of $1.77 billion (presented as net position). At year end, the City had a deficit in governmental activities unrestricted net position in the amount of $2.68 billion.
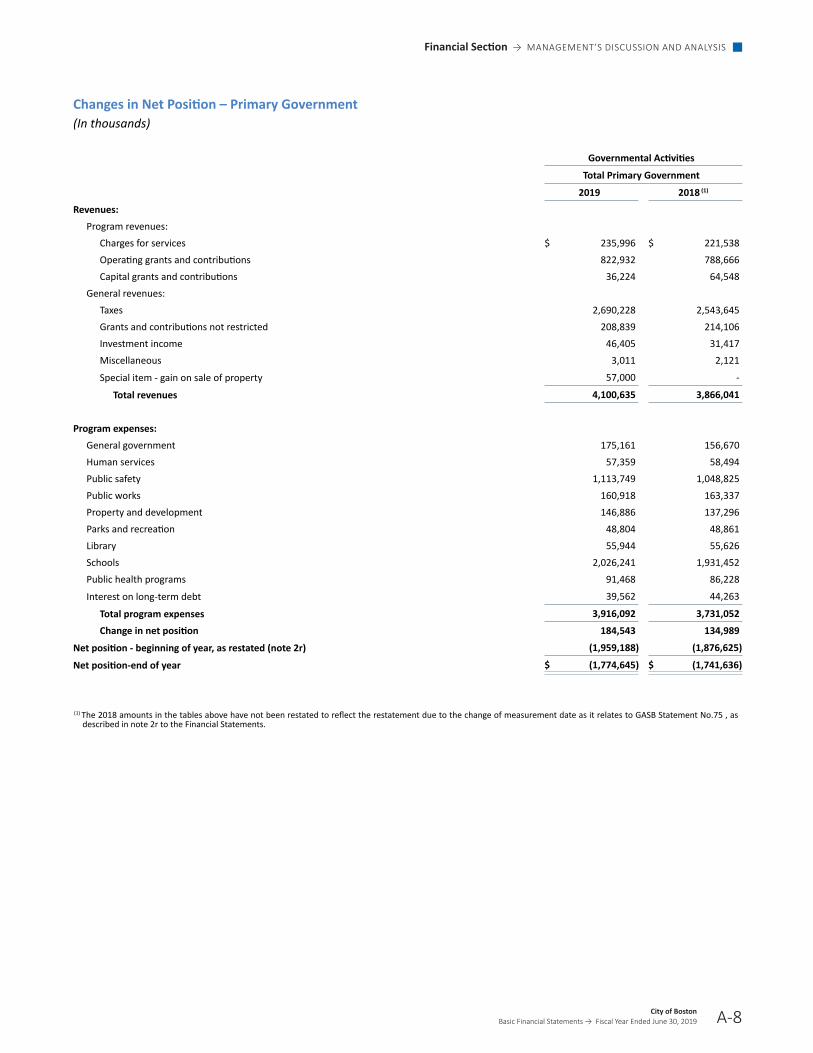
Changes in Net Position – Primary Government – The City’s total net position increased by $184.5 million from the amount reported in fiscal year 2018.
Net Position
As noted earlier, net position may serve over time as a useful indicator of a government’s financial position. The City’s net deficit totaled $1.77 billion at the end of 2019, compared to a net deficit of $1.96 billion (restated) reported at the end of the previous year.
The components of net position comprise the following: the investment in capital assets such as land, buildings, equipment, and infrastructure (road, bridges, and other immovable assets), less any related debt used to acquire those assets that are still outstanding – this amount is $0.8 million indicating that the net book value of the City’s capital assets exceeds the amount of related capital debt outstanding. The City uses these capital assets to provide services to citizens; consequentially, these assets are not available for future spending. Although the City’s investment in its capital assets is reported net of related debt, it should be noted that the resources needed to repay this debt must be provided from other sources, since the capital assets themselves cannot be used to liquidate these liabilities.
A portion of the City’s governmental activities net position, $98.1 million, represents restricted net position, or resources that are subject to external restrictions on how they may be used. Internally imposed designations of resources are not presented as restricted net assets. The unrestricted net position increased by $173.4 million from the 2018 restated amount of $2.50 billion.
Financial Section → MANAGEMENT’S DISCUSSION AND ANALYSIS
City of BostonBasic Financial Statements → Fiscal Year Ended June 30, 2019A-7
Net Position – Primary Government(In thousands)
Governmental Activities
Total Primary Government
2019 2018 (1)
ASSETS: Current assets $ 2,180,472 $ 1,924,930Capital assets 2,234,836 2,142,789
Other assets 205,493 198,906
Total assets 4,620,801 4,266,625
DEFERRED OUTFLOWS OF RESOURCES:
Total deferred outflows of resources 495,090 340,804
Liabilities:
Current liabilities 753,318 689,530
Noncurrent liabilities 5,971,222 5,414,072
Total liabilities 6,724,540 6,103,602
DEFERRED INFLOWS OF RESOURCES:
Total deferred inflows of resources 165,996 245,463
NET POSITION:
Net investment in capital assets 802,391 685,036Restricted 98,106 75,098
Unrestricted (2,675,142) (2,501,770)
Total net position $ (1,774,645) $ (1,741,636)
(1) The 2018 amounts in the tables above have not been restated to reflect the restatement due to the change of measurement date as it relates to GASB Statement No.75 , as
described in note 2r to the Financial Statements.
Financial Section → MANAGEMENT’S DISCUSSION AND ANALYSIS
A-8City of BostonBasic Financial Statements → Fiscal Year Ended June 30, 2019
Changes in Net Position – Primary Government(In thousands)
Governmental Activities
Total Primary Government
2019 2018 (1)
Revenues: Program revenues:
Charges for services $ 235,996 $ 221,538Operating grants and contributions 822,932 788,666Capital grants and contributions 36,224 64,548
General revenues: Taxes 2,690,228 2,543,645Grants and contributions not restricted 208,839 214,106Investment income 46,405 31,417Miscellaneous 3,011 2,121
Special item - gain on sale of property 57,000 -
Total revenues 4,100,635 3,866,041
Program expenses:
General government 175,161 156,670Human services 57,359 58,494Public safety 1,113,749 1,048,825Public works 160,918 163,337Property and development 146,886 137,296Parks and recreation 48,804 48,861Library 55,944 55,626Schools 2,026,241 1,931,452Public health programs 91,468 86,228
Interest on long-term debt 39,562 44,263
Total program expenses 3,916,092 3,731,052
Change in net position 184,543 134,989
Net position - beginning of year, as restated (note 2r) (1,959,188) (1,876,625)
Net position-end of year $ (1,774,645) $ (1,741,636)
(1) The 2018 amounts in the tables above have not been restated to reflect the restatement due to the change of measurement date as it relates to GASB Statement No.75 , as
described in note 2r to the Financial Statements.

Financial Section → MANAGEMENT’S DISCUSSION AND ANALYSIS
City of BostonBasic Financial Statements → Fiscal Year Ended June 30, 2019A-9
Revenues - Governmental ActivitiesRevenues - Governmental Activities
Fiscal Year 2019Fiscal Year 2019
65.6 %65.6 %65.6 %65.6 %
26.7 %26.7 %26.7 %26.7 %
7.7 %7.7 %7.7 %7.7 %
Taxes and Payments in Lieu of TaxesTaxes and Payments in Lieu of Taxes Program RevenuesProgram Revenues OtherOther

Financial Section → MANAGEMENT’S DISCUSSION AND ANALYSIS
A-10City of BostonBasic Financial Statements → Fiscal Year Ended June 30, 2019
Revenues - Governmental ActivitiesRevenues - Governmental Activities
Fiscal Year 2019Fiscal Year 2019
65.6 %65.6 %65.6 %65.6 %
26.7 %26.7 %26.7 %26.7 %
7.7 %7.7 %7.7 %7.7 %
Taxes and Payments in Lieu of TaxesTaxes and Payments in Lieu of Taxes Program RevenuesProgram Revenues OtherOther
Expenses - Governmental Activities FY 2019Expenses - Governmental Activities FY 2019
(in thousands)(in thousands)
$2,026,241$2,026,241$2,026,241$2,026,241
$1,113,749$1,113,749$1,113,749$1,113,749
$175,161$175,161$175,161$175,161 $160,918$160,918$160,918$160,918
$440,023$440,023$440,023$440,023
SchoolsSchools Public SafetyPublic Safety GeneralGeneral
GovernmentGovernment
Public WorksPublic Works OtherOther
00
500,000500,000
1,000,0001,000,000
1,500,0001,500,000
2,000,0002,000,000
2,500,0002,500,000

Financial Section → MANAGEMENT’S DISCUSSION AND ANALYSIS
City of BostonBasic Financial Statements → Fiscal Year Ended June 30, 2019A-11
Governmental Activities
The City’s governmental activities net position increased by $184.5 million over the prior fiscal year. The following net changes occurred during the course of operations in fiscal year 2019. In the assets accounts, cash and investments increased by $255.5 million, receivables increased by $14.3 million, and capital assets increased by $92.0 million. In the liability accounts, there was an increase in warrants and accounts payable of $40.6 million and an increase in accrued liabilities by $40.4 million. Additionally, an increase of $61.1 million was recorded relative to the City’s other postemployment benefit obligation and an increase of $383.9 million was recorded relative to the City’s net pension liability in 2019.
During fiscal year 2019, the City’s revenues increased by 6.3%. The City’s largest sources of revenues were property taxes, excise taxes, and payment in lieu of taxes of $2.69 billion (66.5% of total revenues) and $1.10 billion of program revenues (27.1% of total revenues). Taxes increased by $146.6 million from the previous year. Program revenues increased by $20.4 million for fiscal year 2019. This is largely due to increases in operating grants and contributions. The City’s expenses cover a range of services. The largest expenses were for schools ($2.03 billion), public safety ($1.11 billion), general government ($175.2 million), public works ($160.9 million), and property and development ($146.9 million). In 2019, governmental activities expenses exceeded program revenues (i.e., user charges, operating grants, and capital grants) by $2.82 billion. This shortfall was covered primarily through taxes ($2.69 billion) and unrestricted grants and contributions ($208.8 million).
Comparative data on these revenues and expenses is itemized in the reporting of the Changes in Net Position – Primary Government earlier in this Management Discussion and Analysis.
FINANCIAL ANALYSIS OF THE CITY’S FUND STATEMENTS
This analysis is based on the Governmental and Proprietary Fund Financial Statements. As noted earlier, the City uses fund accounting to ensure and demonstrate compliance with finance related legal requirements.
Fund Highlights
Governmental Funds – Fund Balances – as of the close of fiscal year 2019, the City’s governmental funds reported a combined ending fund balance of $1.83 billion, an increase of $213.60 million from the prior year. Of this total amount, $794.6 million represents the unassigned fund balance. The increase in fund balance is largely due to an increase in property and excise taxes, investment income and intergovernmental revenue.
Governmental Funds
The focus of the City’s governmental funds is to provide information on near term inflows, outflows, and balances of spendable resources. Such information is useful in assessing the City’s financial requirements. In particular, unassigned fund balance may serve as a useful measure of a government’s financial position at the end of the fiscal year.
General Fund – Fund Balance – The General Fund is the chief operating fund of the City. The City’s General Fund – Fund Balance Policy states in part to maintain a GAAP unassigned fund balance in the General Fund that is 15%, or higher, of GAAP General Fund operating expenditures for the fiscal year. The GAAP unassigned fund balance at the end of fiscal year 2019 was $794.6 million, which represents approximately 23.1% of GAAP General Fund operating expenditures.
However, because the City is required to follow the statutory basis of accounting rather than GAAP for determining the amount of unassigned fund balance that can be appropriated, it is the statutory (not the GAAP) fund balance that is used to calculate “free cash”. Free cash is the amount of statutory fund balance in the General Fund, as certified by the Commonwealth of Massachusetts’ Department of Revenue, which is available for appropriation and is generated when actual revenues, on a cash basis, exceed budgeted amounts and encumbrances are less than appropriations, or both.

Financial Section → MANAGEMENT’S DISCUSSION AND ANALYSIS
A-12City of BostonBasic Financial Statements → Fiscal Year Ended June 30, 2019
The City has established the General Fund-Fund Balance Policy to ensure that the City maintains adequate levels of fund balance to mitigate current and future risks (i.e., revenue shortfalls and unanticipated expenditures). The policy in full states that the City shall maintain a GAAP Unassigned Fund Balance in the General Fund that is 15% or higher than the current fiscal year’s GAAP General Fund Operating Expenditures. The City shall only consider the certification of Free Cash (as defined by the Commonwealth of Massachusetts’ Department of Revenue) in years where the appropriation of Free Cash shall not cause the fiscal year’s GAAP Unassigned Fund Balance to go below 15% of the fiscal year’s GAAP General Fund Operating Expenditures, while maintaining a Budgetary Unassigned Fund Balance at 10% or higher of Budgetary Operating Expenditures. The City shall only consider the appropriation of Certified Free Cash to offset: (1) certain fixed costs such as pension contributions and related post-retirement health benefits; and/or (2) to fund extraordinary and non-recurring events as determined and certified by the City Auditor.
Special Revenue Fund – Fund Balance – The Special Revenue Fund accounts for the proceeds of specific revenue sources that are restricted or committed to expenditures for predefined purposes. The fiscal year 2019 Special Revenue Fund balance is reported at $261.0 million, a $13.6 million increase from fiscal year 2018.
Capital Projects Fund – Fund Balance – The Capital Projects Fund accounts for financial resources to be used for the acquisition or construction of major capital facilities, other than those financed by proprietary funds and trust funds. The fiscal year 2019 Capital Projects Fund balance is $274.5 million, a $91.2 million increase from fiscal year 2018 due to the issuance of bonds and the sale of property in the current year�
Other Governmental Funds – Fund Balance – Other Governmental Funds account for assets held by the City in permanent trust funds, as well as the activities related to DSRC and FBDC. The fiscal year 2019 Other Governmental Funds fund balance is $106.1 million, a $4.2 million increase from fiscal year 2018.
Internal Service Fund
The City’s Internal Service Fund accounts for the City’s self-insurance program for health benefits provided by Blue Cross Blue Shield, Harvard Pilgrim Health Care, and Tufts for City employees and their dependents. The Internal Service Fund is included as part of the governmental activities in the government-wide financial statements.
Budgetary Highlights
General Fund budgetary highlights include ending fiscal year 2019 with a $22.6 million surplus. There were no material variances between the original budget and final budget amounts. Unfavorable variances from the final budget to actual results occurred in public safety and judgments and claims.
Favorable results were reported for General Fund revenue sources, including $25.7 million in payments in lieu of taxes, $15.0 million in departmental and other revenue, $54.9 million in excises and $25.4 million in investment income. Other available funds shows a revenue deficit of $78.5 million, however, this is primarily a result of not transferring $22.5 million of parking meter funds and $40.00 million of free cash from the general fund.
CAPITAL ASSETS AND LONG-TERM OBLIGATIONS
Capital Assets
The City’s investment in capital assets for its governmental activities, as of June 30, 2019, has a net book value of $2.23 billion, made up of costs totaling $4.45 billion less accumulated depreciation of $2.22 billion. This investment in capital assets includes land, buildings, improvements, equipment, infrastructure, and construction in progress. Infrastructure assets are items that are normally immovable and have value only to the City, such as roads, bridges, streets, sidewalks, drainage systems, lighting systems, and similar items.
The total increase in the City’s investment in capital assets for the current fiscal year was approximately $92.0 million in terms of net book value. However, actual expenditures to purchase or construct capital assets and contributions of capital assets were $236.8 million for the fiscal year. Most of this amount was used for the purpose of constructing or reconstructing buildings and building improvements and infrastructure. Depreciation charges for the year totaled $144.66 million. Additional information on the City’s capital assets can be found in note 8 to the Financial Statements.
Financial Section → MANAGEMENT’S DISCUSSION AND ANALYSIS
City of BostonBasic Financial Statements → Fiscal Year Ended June 30, 2019A-13
Long Term Obligations
Debt Administration – The authority of the City to incur debt is governed by federal and state laws that restrict the amounts and purposes for which a municipality can incur debt. At year end, the City had $1.33 billion in General Obligations Bonds principal outstanding – an increase of $20.8 million over last year.
On March 19, 2019, the City issued $145.1 million in Series A general obligation bonds to finance various capital projects in the City. In conjunction with the City’s annual bond offering, the rating service bureau Moody’s Investors Service reaffirmed the City’s bond ratings at Aaa and the rating service bureau Standard & Poor’s reaffirmed the bond rating to AAA. General Obligation Bonds are backed by the full faith and credit of the City, including the City’s power to levy additional taxes to ensure repayment of debt. Accordingly, all general obligation debt currently outstanding has been approved by a vote of the City Council.
Notes and Leases Payable and Other Long Term Obligations – The City’s general long term notes and leases and other long term obligations increased $471.7 million, or 12.7%, during the current fiscal year. Key factors for this increase are an increase in the net pension liability of $383.9 million and an increase in the net OPEB obligation of $61.1 million.
Additional information on the City’s long term debt obligations can be found in note 10 to the Financial Statements.
NEW ACCOUNTING STANDARDS
The GASB has issued Statement No� 83 “Certain Asset Retirement Obligations.” This Statement addresses accounting and financial reporting for certain asset retirement obligations (AROs). An ARO is a legally enforceable liability associated with the retirement of a tangible capital asset. A government that has legal obligations to perform future asset retirement activities related to its tangible capital assets should recognize a liability based on the guidance in this Statement. This Statement was implemented in fiscal 2019 without any material impact.
The GASB has issued Statement No� 88 “Certain Disclosures Related to Debt, including Direct Borrowings and Direct Placements”� The primary objective of this Statement is to improve the information that is disclosed in notes to government financial statements related to debt, including direct borrowings and direct placements. It also clarifies which liabilities governments should include when disclosing information related to debt. This Statement was implemented in fiscal 2019 without any material impact�
FUTURE PRONOUNCEMENTS
The GASB has issued Statement No� 84 “Fiduciary Activities.” The objective of this Statement is to improve guidance regarding the identification of fiduciary activities for accounting and financial reporting purposes and how those activities should be reported. This Statement establishes criteria for identifying fiduciary activities of all state and local governments. The focus of the criteria generally is on (1) whether a government is controlling the assets of the fiduciary activity and (2) the beneficiaries with whom a fiduciary relationship exists. Separate criteria are included to identify fiduciary component units and postemployment benefit arrangements that are fiduciary activities. The requirements of this statement will take effect for financial statements starting with the fiscal year that ends December 31, 2019.
The GASB has issued Statement No� 87 “Leases.” The objective of this Statement is to better meet the information needs of financial statement users by improving accounting and financial reporting for leases by governments. This Statement increases the usefulness of governments’ financial statements by requiring recognition of certain lease assets and liabilities for leases that previously were classified as operating leases and recognized as inflows of resources or outflows of resources based on the payment provisions of the contract. It establishes a single model for lease accounting based on the foundational principle that leases are financings of the right to use an underlying asset. Under this Statement, a lessee is required to recognize a lease liability and an intangible right-to-use lease asset, and a lessor is required to recognize a lease receivable and a deferred inflow of resources, thereby enhancing the relevance and consistency of information about governments’ leasing activities. The requirements of this statement will take effect for financial statements starting with the fiscal year that ends December 31, 2020. Earlier application is encouraged.
Financial Section → MANAGEMENT’S DISCUSSION AND ANALYSIS
A-14City of BostonBasic Financial Statements → Fiscal Year Ended June 30, 2019
The GASB has issued Statement No� 89 “Accounting for Interest Cost Incurred before the End of a Construction Period”� The objectives of this Statement are (1) to enhance the relevance and comparability of information about capital assets and the cost of borrowing for a reporting period and (2) to simplify accounting for interest cost incurred before the end of a construction period. The requirements of this statement will take effect for financial statements starting with the fiscal year that ends December 31, 2020. Earlier application is encouraged.
The GASB has issued GASB Statement No. 90, “Majority Equity Interests-an amendment of GASB Statements No. 14 and No. 61”. The primary objectives of this Statement are to improve the consistency and comparability of reporting a government’s majority equity interest in a legally separate organization and to improve the relevance of financial statement information for certain component units.The requirements of this statement will take effect for financial statements starting with the fiscal year that ends December 31, 2019. Earlier application is encouraged.
The GASB has issued Statement No. 91 “Conduit Debt Obligations”. The primary objectives of this Statement are to provide a single method of reporting conduit debt obligations by issuers and eliminate diversity in practice associated with (1) commitments extended by issuers, (2) arrangements associated with conduit debt obligations, and (3) related note disclosures. This Statement achieves those objectives by clarifying the existing definition of a conduit debt obligation; establishing that a conduit debt obligation is not a liability of the issuer; establishing standards for accounting and financial reporting of additional commitments and voluntary commitments extended The requirements of this statement will take effect for financial statements starting with the fiscal year that ends December 31, 2021. Earlier application is encouraged.
REQUESTS FOR INFORMATION
This financial report is designed to provide a general overview of the City’s finances for all of the City’s citizens, taxpayers, customers, investors, and creditors. Questions concerning any of the information provided in this report or requests for additional information should be addressed to: City of Boston, Auditing Department, Boston City Hall, Room M 4, Boston, MA 02201. Alternatively, these requests may also be made through email, by contacting the Auditing Department at [email protected]�
Financial Section → GOVERNMENT-WIDE FINANCIAL STATEMENTS
City of BostonBasic Financial Statements → Fiscal Year Ended June 30, 2019A-15
See accompanying notes to the basic financial statements
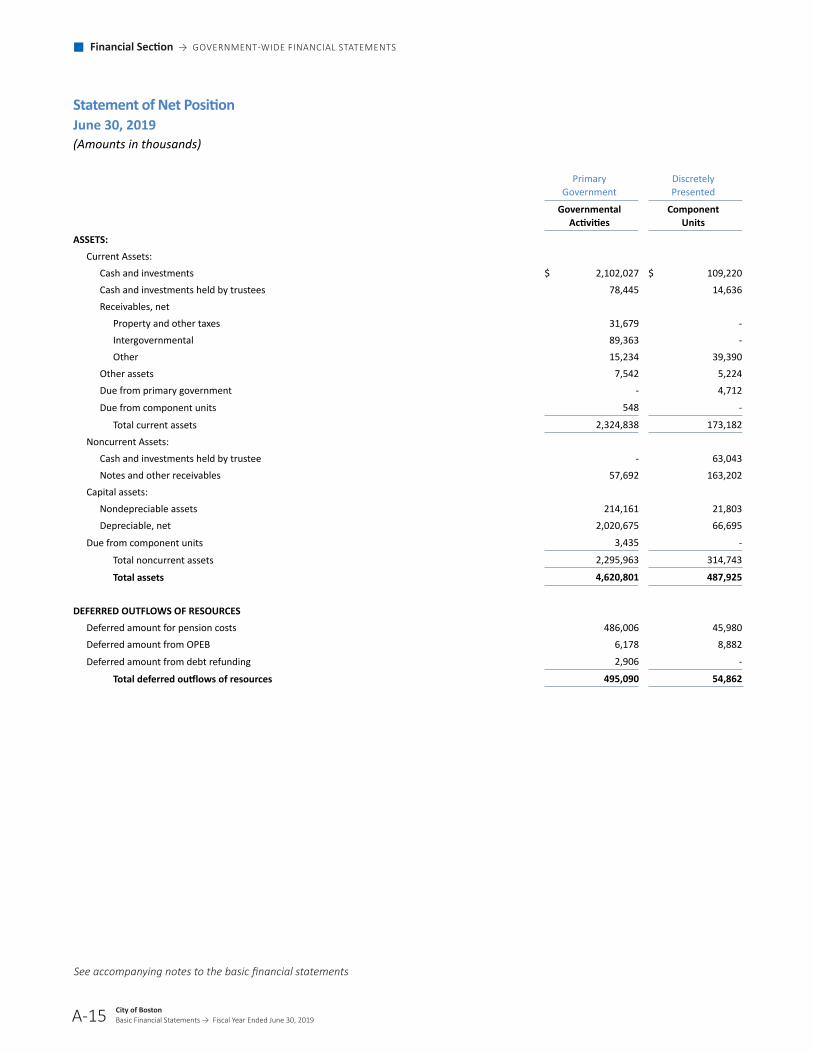
Statement of Net Position
June 30, 2019
(Amounts in thousands)
Primary
Government Discretely Presented
Governmental
Activities Component
Units
ASSETS: Current Assets:
Cash and investments $ 2,102,027 $ 109,220Cash and investments held by trustees 78,445 14,636Receivables, net
Property and other taxes 31,679 -Intergovernmental 89,363 -Other 15,234 39,390
Other assets 7,542 5,224Due from primary government - 4,712
Due from component units 548 -
Total current assets 2,324,838 173,182
Noncurrent Assets: Cash and investments held by trustee - 63,043Notes and other receivables 57,692 163,202
Capital assets: Nondepreciable assets 214,161 21,803Depreciable, net 2,020,675 66,695
Due from component units 3,435 -
Total noncurrent assets 2,295,963 314,743
Total assets 4,620,801 487,925
DEFERRED OUTFLOWS OF RESOURCES
Deferred amount for pension costs 486,006 45,980Deferred amount from OPEB 6,178 8,882
Deferred amount from debt refunding 2,906 -
Total deferred outflows of resources 495,090 54,862
Financial Section → GOVERNMENT-WIDE FINANCIAL STATEMENTS
A-16
See accompanying notes to the basic financial statements
City of BostonBasic Financial Statements → Fiscal Year Ended June 30, 2019
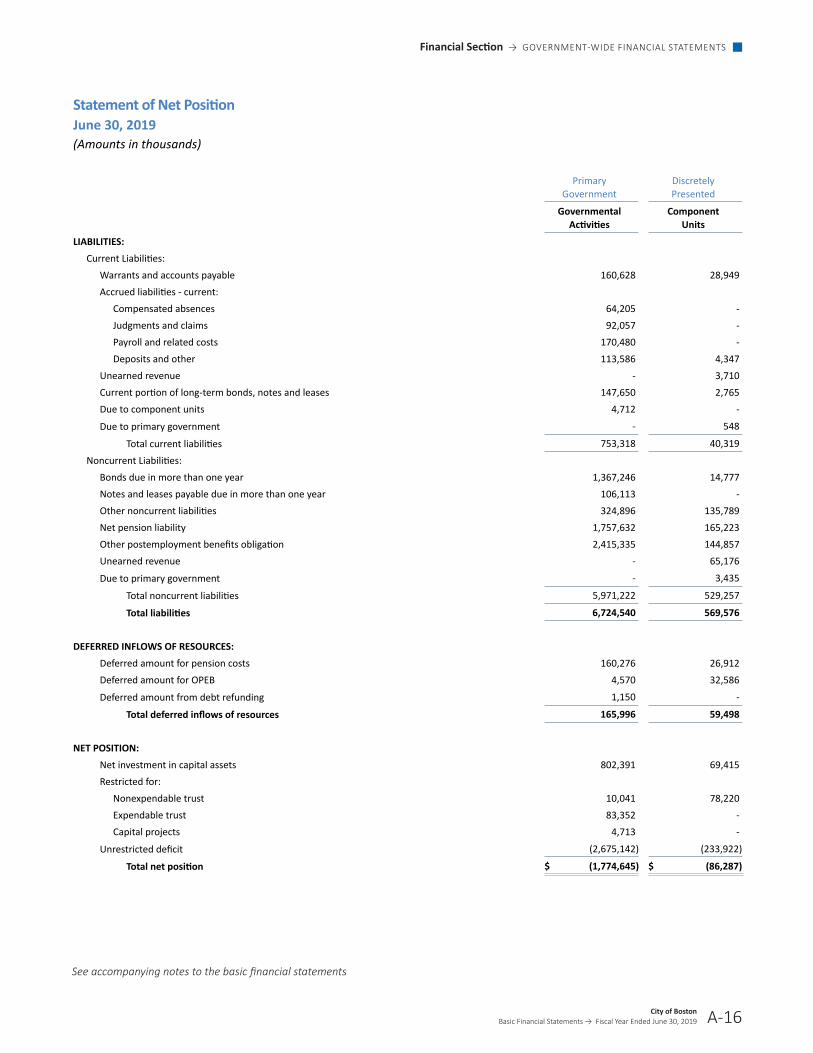
Statement of Net Position June 30, 2019 (Amounts in thousands)
Primary
Government Discretely Presented
Governmental
Activities Component
Units
LIABILITIES: Current Liabilities:
Warrants and accounts payable 160,628 28,949Accrued liabilities - current:
Compensated absences 64,205 -Judgments and claims 92,057 -Payroll and related costs 170,480 -Deposits and other 113,586 4,347
Unearned revenue - 3,710Current portion of long-term bonds, notes and leases 147,650 2,765Due to component units 4,712 -
Due to primary government - 548
Total current liabilities 753,318 40,319
Noncurrent Liabilities: Bonds due in more than one year 1,367,246 14,777Notes and leases payable due in more than one year 106,113 -Other noncurrent liabilities 324,896 135,789Net pension liability 1,757,632 165,223Other postemployment benefits obligation 2,415,335 144,857Unearned revenue - 65,176
Due to primary government - 3,435
Total noncurrent liabilities 5,971,222 529,257
Total liabilities 6,724,540 569,576
DEFERRED INFLOWS OF RESOURCES:
Deferred amount for pension costs 160,276 26,912Deferred amount for OPEB 4,570 32,586
Deferred amount from debt refunding 1,150 -
Total deferred inflows of resources 165,996 59,498
NET POSITION:
Net investment in capital assets 802,391 69,415Restricted for:
Nonexpendable trust 10,041 78,220Expendable trust 83,352 -Capital projects 4,713 -
Unrestricted deficit (2,675,142) (233,922)
Total net position $ (1,774,645) $ (86,287)

Financial Section → GOVERNMENT-WIDE FINANCIAL STATEMENTS
City of BostonBasic Financial Statements → Fiscal Year Ended June 30, 2019A-17
Financial Section → GOVERNMENT-WIDE FINANCIAL STATEMENTS
A-18
See accompanying notes to the basic financial statements
City of BostonBasic Financial Statements → Fiscal Year Ended June 30, 2019
Statement of ActivitiesYear Ended June 30, 2019(Amounts in thousands) Program Revenues
Operating Capital Grants Charges for Grants and and
Functions/Programs Expenses Service Contributions ContributionsPrimary Government:
Governmental activities: General government $ 175,161 $ 28,243 $ 39,592 $ 3,308Human services 57,359 326 10,089 -Public safety 1,113,749 158,455 54,171 -Public works 160,918 28,609 - 19,493Property and development 146,886 8,382 94,834 -Parks and recreation 48,804 596 952 -Library 55,944 - 2,235 -Schools 2,026,241 11,385 621,059 13,423Public health programs 91,468 - - -
Interest on long-term debt 39,562 - - -
Total primary government $ 3,916,092 $ 235,996 $ 822,932 $ 36,224
Component Units: Boston Public Health Commission $ 181,325 $ 42,284 $ 41,884 $ 1,575Boston Planning & Development Agency 26,437 11,316 11,266 -Trustees of the Public Library of the City of Boston 10,984 3,297 13,501 -
Economic Development and Industrial Corporation of Boston 32,356 33,614 12,364 -
Total component units $ 251,102 $ 90,511 $ 79,015 $ 1,575 General Revenues: Taxes: Property taxes, levied for general purposes Excises Payments in lieu of taxes Grants and contributions not restricted Investment income City appropriation Miscellaneous Special item - gain on sale of property Total general revenues Change in net position Net position - beginning of year, as restated (note 2r) Net position - end of year

Financial Section → GOVERNMENT-WIDE FINANCIAL STATEMENTS
City of BostonBasic Financial Statements → Fiscal Year Ended June 30, 2019 A-18
Financial Section → GOVERNMENT-WIDE FINANCIAL STATEMENTS
City of BostonBasic Financial Statements → Fiscal Year Ended June 30, 2019A-19
See accompanying notes to the basic financial statements
Net (Expense) Revenue and Changes in Net
Position
Governmental Component
Activities Units $ (104,018) $ - (46,944) - (901,123) - (112,816) - (43,670) - (47,256) - (53,709) - (1,380,374) - (91,468) -
(39,562) -
$ (2,820,940) $ - $ - $ (95,582) - $ (3,855) - $ 5,814
- 13,622
$ - $ (80,001)
$ 2,338,507 $ - 264,703 - 87,018 - 208,839 - 46,405 974 - 88,759 3,011 2,758
57,000 15,371
3,005,483 107,862 184,543 27,861
(1,959,188) (114,148)
$ (1,774,645) $ (86,287)

Financial Section → FUND FINANCIAL STATEMENTS
City of BostonBasic Financial Statements → Fiscal Year Ended June 30, 2019A-19
Financial Section → FUND FINANCIAL STATEMENTS
A-20
See accompanying notes to the basic financial statements
City of BostonBasic Financial Statements → Fiscal Year Ended June 30, 2019
Balance Sheet
Governmental Funds
June 30, 2019
(Amounts in thousands)
General Special
Revenue Capital Projects
Other Governmental
Funds
Total Governmental
Funds
ASSETS
Cash and investments $ 1,434,468 $ 255,096 $ 297,463 $ 12,659 $ 1,999,686Cash and investments held by trustees 364 - 17,994 60,087 78,445Receivables, net:
Property and other taxes 31,679 - - - 31,679Intergovernmental 6,629 72,723 10,011 - 89,363
Departmental and other 15,085 24,117 - 33,724 72,926
Total receivables 53,393 96,840 10,011 33,724 193,968Due from other funds 1,111 357 - 8,682 10,150
Due from component units 3,983 - - - 3,983
Total assets $ 1,493,319 $ 352,293 $ 325,468 $ 115,152 $ 2,286,232
LIABILITIES
Warrants and accounts payable $ 67,915 $ 24,738 $ 46,278 $ 255 $ 139,186Accrued liabilities:
Payroll and related costs 170,480 - - - 170,480Deposits and other 32,231 65,217 - 162 97,610
Due to other funds 168 1,299 - 8,683 10,150
Due to component unit 4,712 - - - 4,712
Total liabilities $ 275,506 $ 91,254 $ 46,278 $ 9,100 $ 422,138
DEFERRED INFLOWS OF RESOURCES
Revenue not considered available 31,203 - 4,713 - 35,916
Total deferred inflows of resources $ 31,203 $ - $ 4,713 $ - $ 35,916
FUND BALANCES
Nonspendable - - - 10,041 10,041Restricted - 64,405 274,477 96,011 434,893Assigned 392,000 196,634 - - 588,634
Unassigned 794,610 - - - 794,610
Total fund balances 1,186,610 261,039 274,477 106,052 1,828,178
Total liabilities, deferred inflows
of resources and fund balances $ 1,493,319 $ 352,293 $ 325,468 $ 115,152 $ 2,286,232

Financial Section → FUND FINANCIAL STATEMENTS
City of BostonBasic Financial Statements → Fiscal Year Ended June 30, 2019 A-20
Financial Section → FUND FINANCIAL STATEMENTS
City of BostonBasic Financial Statements → Fiscal Year Ended June 30, 2019A-21
See accompanying notes to the basic financial statements
Reconciliation of the Balance Sheet
Governmental Funds to the Statement of Net Position
June 30, 2019
(Amounts in thousands) Total fund balance - governmental funds. $ 1,828,178 Amounts reported for governmental activities in the statement of net position are different because:
Capital assets used in governmental activities are not financial resources and therefore are not reported in the governmental fund financial statements
2,234,836
Certain revenues of the government-wide financial statements are earned but not considered available in the governmental fund financial statements
35,916
Internal service funds are included in the government-wide financial statements 82,304
Some liabilities are not due and payable in the current period and therefore are not reported in the funds.
Those liabilities consist of
General obligation bonds and notes (1,394,566)Capital leases (64,096)Bond issue premiums/discounts, net (162,347)Deferred bond refunding losses/gain, net 1,756Accrued interest on bonds (15,973)Compensated absences (231,859)Landfill (6,592)Judgments and claims (215,073)Other postemployment benefits, net of deferred amounts (2,413,727)Net pension liability, net of deferred amounts (1,452,902)
Pollution remediation (500)
Net position of governmental activities $ (1,774,645)
Financial Section → FUND FINANCIAL STATEMENTS
City of BostonBasic Financial Statements → Fiscal Year Ended June 30, 2019A-21
Financial Section → FUND FINANCIAL STATEMENTS
A-22
See accompanying notes to the basic financial statements
City of BostonBasic Financial Statements → Fiscal Year Ended June 30, 2019
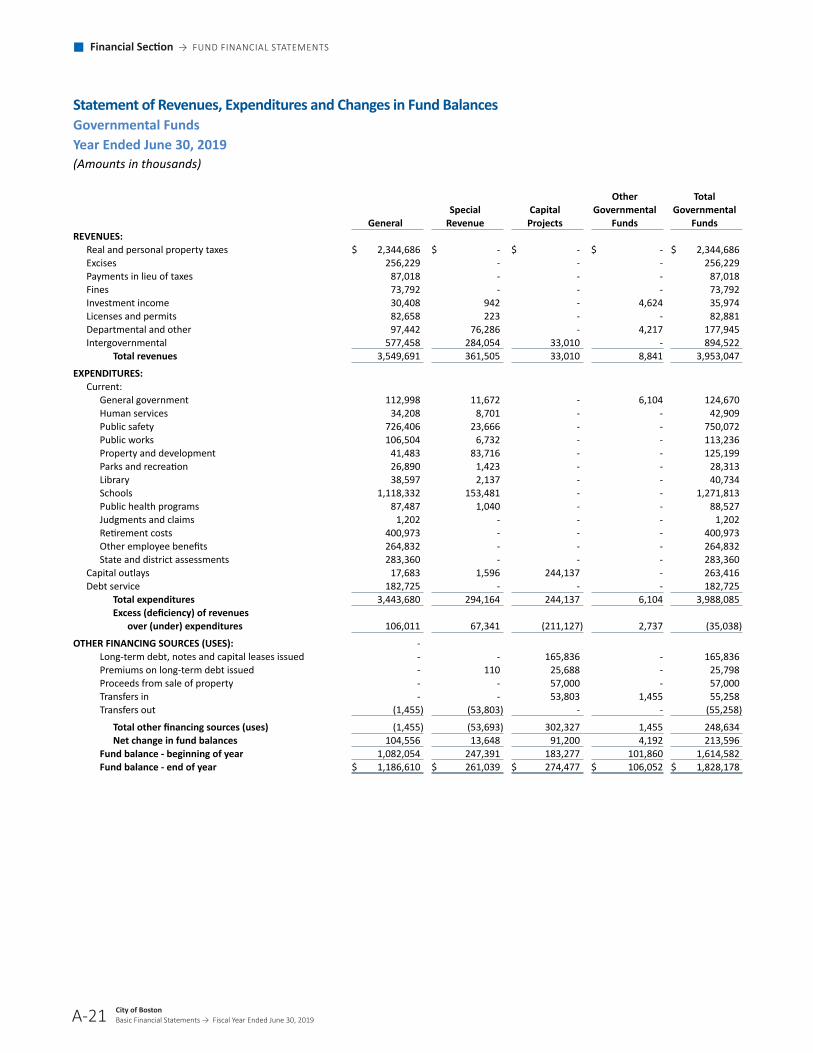
Statement of Revenues, Expenditures and Changes in Fund BalancesGovernmental Funds
Year Ended June 30, 2019
(Amounts in thousands)
General Special
Revenue Capital
Projects
Other Governmental
Funds
Total Governmental
FundsREVENUES:
Real and personal property taxes $ 2,344,686 $ - $ - $ - $ 2,344,686Excises 256,229 - - - 256,229Payments in lieu of taxes 87,018 - - - 87,018Fines 73,792 - - - 73,792Investment income 30,408 942 - 4,624 35,974Licenses and permits 82,658 223 - - 82,881Departmental and other 97,442 76,286 - 4,217 177,945Intergovernmental 577,458 284,054 33,010 - 894,522
Total revenues 3,549,691 361,505 33,010 8,841 3,953,047
EXPENDITURES: Current:
General government 112,998 11,672 - 6,104 124,670Human services 34,208 8,701 - - 42,909Public safety 726,406 23,666 - - 750,072Public works 106,504 6,732 - - 113,236Property and development 41,483 83,716 - - 125,199Parks and recreation 26,890 1,423 - - 28,313Library 38,597 2,137 - - 40,734Schools 1,118,332 153,481 - - 1,271,813Public health programs 87,487 1,040 - - 88,527Judgments and claims 1,202 - - - 1,202Retirement costs 400,973 - - - 400,973Other employee benefits 264,832 - - - 264,832State and district assessments 283,360 - - - 283,360
Capital outlays 17,683 1,596 244,137 - 263,416Debt service 182,725 - - - 182,725
Total expenditures 3,443,680 294,164 244,137 6,104 3,988,085Excess (deficiency) of revenues over (under) expenditures 106,011 67,341 (211,127) 2,737 (35,038)
OTHER FINANCING SOURCES (USES): - Long-term debt, notes and capital leases issued - - 165,836 - 165,836Premiums on long-term debt issued - 110 25,688 - 25,798Proceeds from sale of property - - 57,000 - 57,000Transfers in - - 53,803 1,455 55,258Transfers out (1,455) (53,803) - - (55,258)
Total other financing sources (uses) (1,455) (53,693) 302,327 1,455 248,634Net change in fund balances 104,556 13,648 91,200 4,192 213,596
Fund balance - beginning of year 1,082,054 247,391 183,277 101,860 1,614,582Fund balance - end of year $ 1,186,610 $ 261,039 $ 274,477 $ 106,052 $ 1,828,178

Financial Section → FUND FINANCIAL STATEMENTS
City of BostonBasic Financial Statements → Fiscal Year Ended June 30, 2019 A-22
Financial Section → FUND FINANCIAL STATEMENTS
City of BostonBasic Financial Statements → Fiscal Year Ended June 30, 2019A-23
See accompanying notes to the basic financial statements
Reconciliation of the Statement of Revenues,
Expenditures and Changes in Fund Balance
Governmental Funds to the Statement of Activities
Year Ended June 30, 2019
(Amounts in thousands)
Net change in fund balances - total governmental funds 213,596
Amounts reported for governmental activities in the statement of activities are different because:
Governmental funds report capital outlays as expenditures In the statement of activities, the cost of those assets is depreciated over their estimated useful lives Capital outlays and contributions of capital assets $236,794 exceeded depreciation expense $(144,655) and loss on disposals $(92)
92,047
Certain revenues in the statement of activities that are not reported as revenues in the governmental funds as they are not considered available
(5,458)
Issuances of long-term debt $(165,834) increase long-term liabilities in the statement of net position, but are included in the operating statement of the governmental funds. Repayment of bonds, notes and lease principal $152,171 are expenditures in the governmental funds, but reduce long-term liabilities in the statement of net position. This is the amount by which issuances exceed repayments
(13,663)
Decreases in bond premiums net $(12,872) decrease the long-term liabilities in the statement of net position, but are included in the operating statement of the governmental funds. Decreases in deferred loss on refunding, net $(695) decrease the long-term liabilities in the statement of net position, but are included in the operating statement of the governmental funds
(13,564)
Some expenses reported in the statement of activities do not require the use of current financial resources and therefore are not reported as expenditures in the governmental funds. This amount represents the increase in liabilities for other postemployment benefits $49,618, workers compensation $2,833, net pension liability, net of deferred amounts $18,504 compensated absences $4,164, judgments and claims $19,850 offset by a decrease in landfill closure and post-closure costs $(365) and interest payable $(5,278)
(89,326)
Net operating income from the internal service fund, which is presented in the statement of activities, but not in the governmental funds
911
Change in net position of governmental activities $ 184,543

Financial Section → FUND FINANCIAL STATEMENTS
City of BostonBasic Financial Statements → Fiscal Year Ended June 30, 2019
Financial Section → FUND FINANCIAL STATEMENTS
A-24
See accompanying notes to the basic financial statements
City of BostonBasic Financial Statements → Fiscal Year Ended June 30, 2019
Statement of Revenues and Expenditures
Budgetary Basis
General Fund – Budget and Actual
Year Ended June 30, 2019 (with comparative actual amounts for 2018)
(Amounts in thousands)
2019
Original Budget Final Budget Actual
Favorable (Unfavorable)
Variance 2018
Actual
REVENUES AND OTHER AVAILABLE FUNDS:
Real and personal property taxes, net $ 2,316,649 $ 2,316,649 $ 2,320,883 $ 4,234 $ 2,191,992Excises 201,290 201,290 256,219 54,929 264,814Commonwealth of Massachusetts 446,950 446,950 434,357 (12,593) 439,708Departmental and other revenue 68,774 68,774 83,739 14,965 79,590Fines 68,745 68,745 73,931 5,186 63,389Payments in lieu of taxes 63,016 63,016 88,745 25,729 83,634Investment income 5,000 5,000 30,408 25,408 15,390Licenses and permits 66,260 66,260 82,596 16,336 74,508Miscellaneous 267 267 267 - 267
Other available funds 78,450 78,450 - (78,450) -
Total revenues and other available funds 3,315,401 3,315,401 3,371,145 55,744 3,213,292
EXPENDITURES: General government 118,214 124,048 122,973 1,075 111,283Human services 35,721 34,196 34,129 67 35,954Public safety 719,525 718,947 740,556 (21,609) 694,457Public works 115,000 113,308 113,251 57 115,758Property and development 41,829 43,923 43,881 42 39,402Parks and recreation 26,708 30,783 30,768 15 28,793Library 38,180 38,664 38,664 - 35,758Schools 1,126,705 1,126,705 1,126,676 29 1,093,290Boston Public Health Commission 87,967 87,967 87,967 - 79,563Judgments and claims 5,000 5,000 18,234 (13,234) 19,513Other employee benefits 275,419 265,325 265,164 161 262,902Retirement costs 246,285 266,850 266,797 53 236,968Debt requirements 186,751 176,975 176,857 118 170,514
State and district assessments 292,097 282,710 282,617 93 267,949
Total expenditures 3,315,401 3,315,401 3,348,534 (33,133) 3,192,104
Excess of revenues and other available funds over expenditures $ - $ - $ 22,611 $ 22,611 $ 21,188
A-25

Financial Section → FUND FINANCIAL STATEMENTS
City of BostonBasic Financial Statements → Fiscal Year Ended June 30, 2019
Financial Section → FUND FINANCIAL STATEMENTS
City of BostonBasic Financial Statements → Fiscal Year Ended June 30, 2019A-25
See accompanying notes to the basic financial statements
Statement of Net Position
Proprietary Fund
June 30, 2019
(Amounts in thousands)
Internal Service
ASSETS: Current assets:
Cash and cash equivalents $ 102,341
Total current assets 102,341
Noncurrent assets:
Other assets 7,539
Total noncurrent assets 7,539
Total assets $ 109,880
LIABILITIES:
Current liabilities:
Accrued liabilities 27,576
Total current liabilities $ 27,576
NET POSITION:
Unrestricted 82,304
Total net position $ 82,304
A-26
Financial Section → FUND FINANCIAL STATEMENTS
City of BostonBasic Financial Statements → Fiscal Year Ended June 30, 2019
Financial Section → FUND FINANCIAL STATEMENTS
A-26
See accompanying notes to the basic financial statements
City of BostonBasic Financial Statements → Fiscal Year Ended June 30, 2019
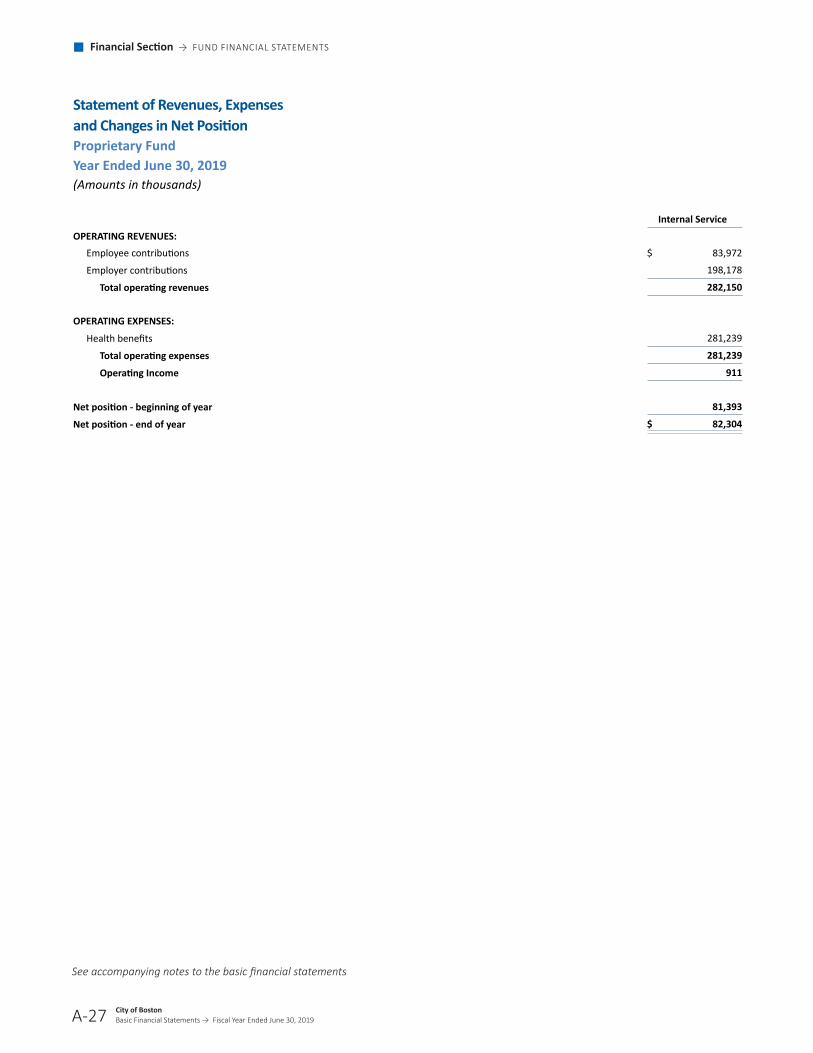
Statement of Revenues, Expenses
and Changes in Net Position
Proprietary Fund
Year Ended June 30, 2019
(Amounts in thousands)
Internal Service
OPERATING REVENUES: Employee contributions $ 83,972
Employer contributions 198,178
Total operating revenues 282,150
OPERATING EXPENSES:
Health benefits 281,239
Total operating expenses 281,239
Operating Income 911
Net position - beginning of year 81,393
Net position - end of year $ 82,304
A-27

Financial Section → FUND FINANCIAL STATEMENTS
City of BostonBasic Financial Statements → Fiscal Year Ended June 30, 2019
Financial Section → FUND FINANCIAL STATEMENTS
City of BostonBasic Financial Statements → Fiscal Year Ended June 30, 2019A-27
See accompanying notes to the basic financial statements
Statement of Cash Flows
Proprietary Funds
Year Ended June 30, 2019
(Amounts in thousands)
Internal Service
CASH FLOWS FROM OPERATING ACTIVITIES: Cash received from employees and employer $ 286,599
Cash paid to vendors (273,638)
Net cash provided by operating activities 12,961
Cash and cash equivalents- beginning of year 89,380
Cash and cash equivalents- end of year $ 102,341
RECONCILIATION OF OPERATING INCOME TO NET CASH
PROVIDED BY OPERATING ACTIVITIES: Operating Income $ 911Adjustments to reconcile operating income to net cash used in operating activities:
Changes in operating assets and liabilities: Other assets 4,449
Accounts payable and accrued liabilities 7,601
Net cash provided by operating activities $ 12,961
A-28

Financial Section → FUND FINANCIAL STATEMENTS
City of BostonBasic Financial Statements → Fiscal Year Ended June 30, 2019
Financial Section → FUND FINANCIAL STATEMENTS
A-28
See accompanying notes to the basic financial statements
City of BostonBasic Financial Statements → Fiscal Year Ended June 30, 2019
Statement of Fiduciary Net Position
Fiduciary Funds
June 30, 2019
(Except Employee Retirement Plan, which is as of December 31, 2018)
(Amounts in thousands)
Pension and OPEB Trust
Funds
Private- Purpose
Trusts Agency Funds
ASSETS:
Cash and cash equivalents $ 917,022 $ 141,559 $ 10,759Receivables:
Interest and dividends 8,381 - -Securities sold 23,048 - -Employer contributions 17,189 - -
Other 5,480 1,177 -
Total receivables 54,098 1,177 -Prepaid Expenses 1,415 - -
Other Assets - 30 -Investments, at fair value:
Short term: Domestic 87,863 - -International 13,783 - -
Equity: Domestic 1,011,726 - -International 1,312,889 - -
Fixed-income: Domestic 888,559 - -International 292,081 - -
PRIT Pooled Fund 1,481,521 - -Real estate 484,640 - -
Alternative 533,171 - -
Total investments 6,106,233 - -
Securities lending short-term collateral investment pool 149,987 - -
Total assets 7,228,755 142,766 10,759
LIABILITIES: Accounts payable, accrued expenses and other liabilities 17,264 1,992 10,759Securities purchased 40,189 - -
Collateral held on securities lending 149,883 - -
Total liabilities 207,336 1,992 10,759
NET POSITION RESTRICTED FOR:
Pension Benefits 6,402,954 - -OPEB Benefits 618,465
-
-
Other Purposes -
140,774
-
Total Net Position Restridted $ 7,021,419 $ 140,774 $ -
A-29
Financial Section → FUND FINANCIAL STATEMENTS
City of BostonBasic Financial Statements → Fiscal Year Ended June 30, 2019
Financial Section → FUND FINANCIAL STATEMENTS
City of BostonBasic Financial Statements → Fiscal Year Ended June 30, 2019A-29
See accompanying notes to the basic financial statements
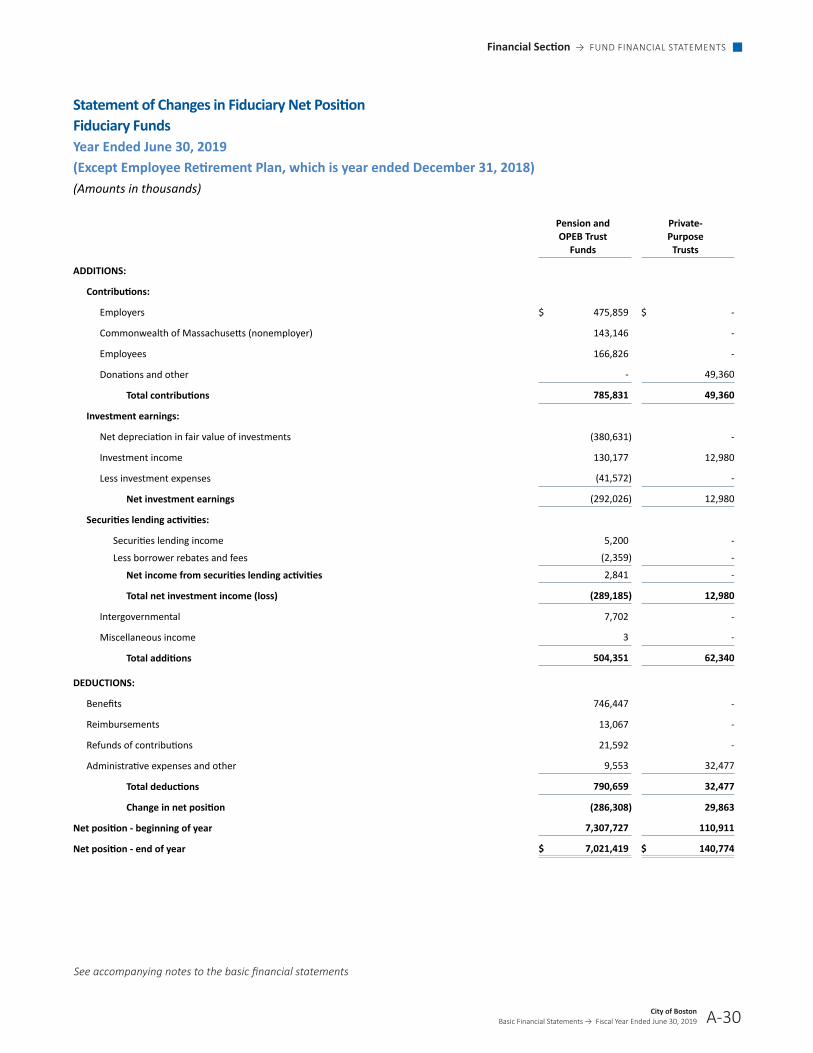
Statement of Changes in Fiduciary Net Position Fiduciary Funds Year Ended June 30, 2019 (Except Employee Retirement Plan, which is year ended December 31, 2018) (Amounts in thousands)
Pension and OPEB Trust
Funds
Private- Purpose
Trusts
ADDITIONS: Contributions:
Employers $ 475,859 $ - Commonwealth of Massachusetts (nonemployer) 143,146 - Employees 166,826 - Donations and other - 49,360
Total contributions 785,831 49,360 Investment earnings:
Net depreciation in fair value of investments (380,631) - Investment income 130,177 12,980 Less investment expenses (41,572) -
Net investment earnings (292,026) 12,980 Securities lending activities:
Securities lending income 5,200 - Less borrower rebates and fees (2,359) -
Net income from securities lending activities 2,841 -
Total net investment income (loss) (289,185) 12,980 Intergovernmental 7,702 - Miscellaneous income 3 -
Total additions 504,351 62,340
DEDUCTIONS: Benefits 746,447 - Reimbursements 13,067 - Refunds of contributions 21,592 - Administrative expenses and other 9,553 32,477
Total deductions 790,659 32,477 Change in net position (286,308) 29,863
Net position - beginning of year 7,307,727 110,911 Net position - end of year $ 7,021,419 $ 140,774
A-30
Financial Section → NOTES TO THE FINANCIAL STATEMENTS
City of BostonBasic Financial Statements → Fiscal Year Ended June 30, 2019
Financial Section → NOTES TO THE FINANCIAL STATEMENTS
A-30City of BostonBasic Financial Statements → Fiscal Year Ended June 30, 2019
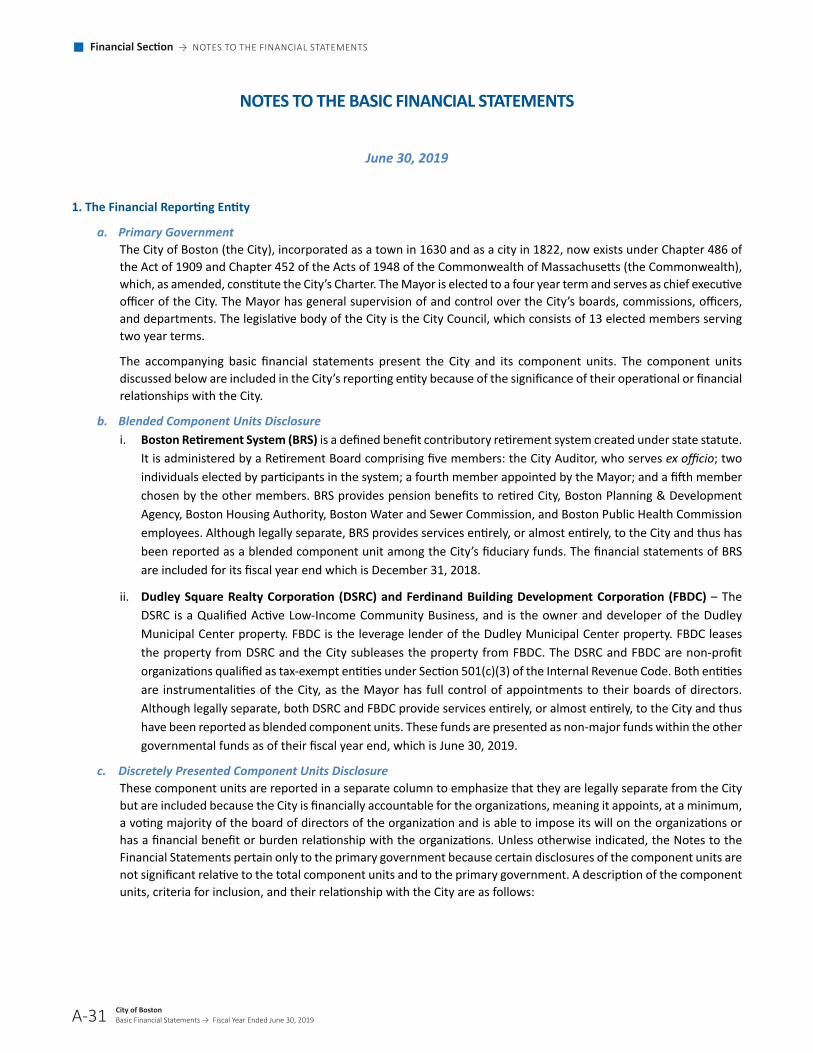
NOTES TO THE BASIC FINANCIAL STATEMENTS
June 30, 2019
1. The Financial Reporting Entity
a. Primary Government The City of Boston (the City), incorporated as a town in 1630 and as a city in 1822, now exists under Chapter 486 of the Act of 1909 and Chapter 452 of the Acts of 1948 of the Commonwealth of Massachusetts (the Commonwealth), which, as amended, constitute the City’s Charter. The Mayor is elected to a four year term and serves as chief executive officer of the City. The Mayor has general supervision of and control over the City’s boards, commissions, officers, and departments. The legislative body of the City is the City Council, which consists of 13 elected members serving two year terms.
The accompanying basic financial statements present the City and its component units. The component units discussed below are included in the City’s reporting entity because of the significance of their operational or financial relationships with the City.
b. Blended Component Units Disclosure i� Boston Retirement System (BRS) is a defined benefit contributory retirement system created under state statute.
It is administered by a Retirement Board comprising five members: the City Auditor, who serves ex officio; two individuals elected by participants in the system; a fourth member appointed by the Mayor; and a fifth member chosen by the other members. BRS provides pension benefits to retired City, Boston Planning & Development Agency, Boston Housing Authority, Boston Water and Sewer Commission, and Boston Public Health Commission employees. Although legally separate, BRS provides services entirely, or almost entirely, to the City and thus has been reported as a blended component unit among the City’s fiduciary funds. The financial statements of BRS are included for its fiscal year end which is December 31, 2018.
ii� Dudley Square Realty Corporation (DSRC) and Ferdinand Building Development Corporation (FBDC) – The DSRC is a Qualified Active Low-Income Community Business, and is the owner and developer of the Dudley Municipal Center property. FBDC is the leverage lender of the Dudley Municipal Center property. FBDC leases the property from DSRC and the City subleases the property from FBDC. The DSRC and FBDC are non-profit organizations qualified as tax-exempt entities under Section 501(c)(3) of the Internal Revenue Code. Both entities are instrumentalities of the City, as the Mayor has full control of appointments to their boards of directors. Although legally separate, both DSRC and FBDC provide services entirely, or almost entirely, to the City and thus have been reported as blended component units. These funds are presented as non-major funds within the other governmental funds as of their fiscal year end, which is June 30, 2019.
c. Discretely Presented Component Units Disclosure These component units are reported in a separate column to emphasize that they are legally separate from the City but are included because the City is financially accountable for the organizations, meaning it appoints, at a minimum, a voting majority of the board of directors of the organization and is able to impose its will on the organizations or has a financial benefit or burden relationship with the organizations. Unless otherwise indicated, the Notes to the Financial Statements pertain only to the primary government because certain disclosures of the component units are not significant relative to the total component units and to the primary government. A description of the component units, criteria for inclusion, and their relationship with the City are as follows:
A-31

Financial Section → NOTES TO THE FINANCIAL STATEMENTS
City of BostonBasic Financial Statements → Fiscal Year Ended June 30, 2019
Financial Section → NOTES TO THE FINANCIAL STATEMENTS
City of BostonBasic Financial Statements → Fiscal Year Ended June 30, 2019A-31
i� Boston Planning & Development Agency (BPDA) – The BPDA is legally separate from the City and a body politic and corporate constituting the City’s redevelopment authority and exercising the powers of a planning board for the City. The BPDA is governed by a five-member board, four of whom are appointed by the Mayor and confirmed by the City Council, and one of whom is appointed by the Governor of Massachusetts (same board members as the EDIC). The BPDA receives a significant amount of intergovernmental revenue, which is used solely for capital projects that are under the oversight of the BPDA. In accordance with GASB Statement No. 61, the BPDA is presented as a discrete component unit of the City.
ii� Economic Development and Industrial Corporation of Boston (EDIC) – The EDIC is legally separate from the City and a body politic and corporate and an instrumentality of the Commonwealth. The EDIC is governed by a five-member board, four of whom are appointed by the Mayor and confirmed by the City Council, and one of whom is appointed by the Governor of Massachusetts (same board members as the BPDA). The EDIC receives a significant amount of intergovernmental revenue, including grants and contracts with the City for jobs and community service activities. In accordance with GASB Statement No. 61, the EDIC is presented as a discrete component unit of the City.
iii� Boston Public Health Commission (BPHC) – The BPHC is legally separate from the City and a body politic and corporate and an instrumentality of the Commonwealth. The BPHC is governed by a seven-member board, six of whom are appointed by the Mayor and confirmed by the City Council, and one of whom is the chief executive officer of the Boston Medical Center. The BPHC receives the majority of its funding from a City appropriation, Emergency Management Services and other third party billings, and federal and state grants. The BPHC expects that the City will continue to provide support for the public health programs of the BPHC. In accordance with GASB Statement No. 61, the BPHC is presented as a discrete component unit of the City.
iv. Trustees of the Public Library of the City of Boston (TPL) – The TPL is legally separate from the City of Boston and is a non-profit organization qualified as a tax-exempt entity under Section 501(c)(3) of the Internal Revenue Code. The trustees of the TPL are appointed by the Mayor and the TPL places substantial reliance upon the City to fund its daily operations. In addition, the Library receives significant support through state and federal government appropriations and private sources. In accordance with GASB Statement No. 61, the TPL is presented as a discrete component unit of the City.
The financial statements of the discretely presented component units are included for their respective fiscal year ends, which is June 30, 2019.
Audited financial statements of these discretely presented component units can be obtained through the City Auditor’s office, Room M 4, City Hall Plaza, Boston, Massachusetts 02201. In addition, condensed financial statements for the discretely presented component units are included in note 20�
d. Related Organizations The Mayor is also responsible for appointing members of the governing bodies of the Boston Housing Authority, Boston Industrial Development Finance Authority, and Boston Water and Sewer Commission; however, the City’s accountability for these organizations does not extend beyond making these appointments.
A-32
Financial Section → NOTES TO THE FINANCIAL STATEMENTS
City of BostonBasic Financial Statements → Fiscal Year Ended June 30, 2019
Financial Section → NOTES TO THE FINANCIAL STATEMENTS
A-32City of BostonBasic Financial Statements → Fiscal Year Ended June 30, 2019
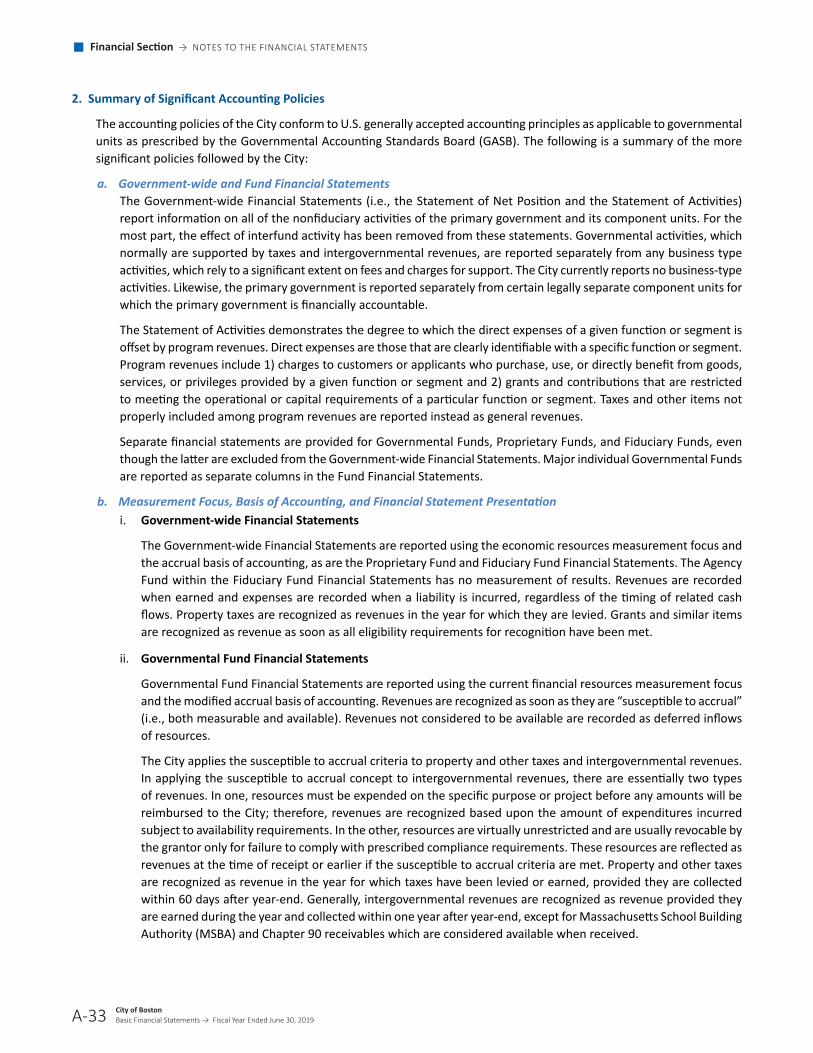
2. Summary of Significant Accounting Policies
The accounting policies of the City conform to U.S. generally accepted accounting principles as applicable to governmental units as prescribed by the Governmental Accounting Standards Board (GASB). The following is a summary of the more significant policies followed by the City:
a. Government-wide and Fund Financial Statements The Government-wide Financial Statements (i.e., the Statement of Net Position and the Statement of Activities) report information on all of the nonfiduciary activities of the primary government and its component units. For the most part, the effect of interfund activity has been removed from these statements. Governmental activities, which normally are supported by taxes and intergovernmental revenues, are reported separately from any business type activities, which rely to a significant extent on fees and charges for support. The City currently reports no business-type activities. Likewise, the primary government is reported separately from certain legally separate component units for which the primary government is financially accountable.
The Statement of Activities demonstrates the degree to which the direct expenses of a given function or segment is offset by program revenues. Direct expenses are those that are clearly identifiable with a specific function or segment. Program revenues include 1) charges to customers or applicants who purchase, use, or directly benefit from goods, services, or privileges provided by a given function or segment and 2) grants and contributions that are restricted to meeting the operational or capital requirements of a particular function or segment. Taxes and other items not properly included among program revenues are reported instead as general revenues.
Separate financial statements are provided for Governmental Funds, Proprietary Funds, and Fiduciary Funds, even though the latter are excluded from the Government-wide Financial Statements. Major individual Governmental Funds are reported as separate columns in the Fund Financial Statements.
b. Measurement Focus, Basis of Accounting, and Financial Statement Presentationi� Government-wide Financial Statements
The Government-wide Financial Statements are reported using the economic resources measurement focus and the accrual basis of accounting, as are the Proprietary Fund and Fiduciary Fund Financial Statements. The Agency Fund within the Fiduciary Fund Financial Statements has no measurement of results. Revenues are recorded when earned and expenses are recorded when a liability is incurred, regardless of the timing of related cash flows. Property taxes are recognized as revenues in the year for which they are levied. Grants and similar items are recognized as revenue as soon as all eligibility requirements for recognition have been met.
ii� Governmental Fund Financial Statements
Governmental Fund Financial Statements are reported using the current financial resources measurement focus and the modified accrual basis of accounting. Revenues are recognized as soon as they are “susceptible to accrual” (i.e., both measurable and available). Revenues not considered to be available are recorded as deferred inflows of resources�
The City applies the susceptible to accrual criteria to property and other taxes and intergovernmental revenues. In applying the susceptible to accrual concept to intergovernmental revenues, there are essentially two types of revenues. In one, resources must be expended on the specific purpose or project before any amounts will be reimbursed to the City; therefore, revenues are recognized based upon the amount of expenditures incurred subject to availability requirements. In the other, resources are virtually unrestricted and are usually revocable by the grantor only for failure to comply with prescribed compliance requirements. These resources are reflected as revenues at the time of receipt or earlier if the susceptible to accrual criteria are met. Property and other taxes are recognized as revenue in the year for which taxes have been levied or earned, provided they are collected within 60 days after year-end. Generally, intergovernmental revenues are recognized as revenue provided they are earned during the year and collected within one year after year-end, except for Massachusetts School Building Authority (MSBA) and Chapter 90 receivables which are considered available when received.
A-33
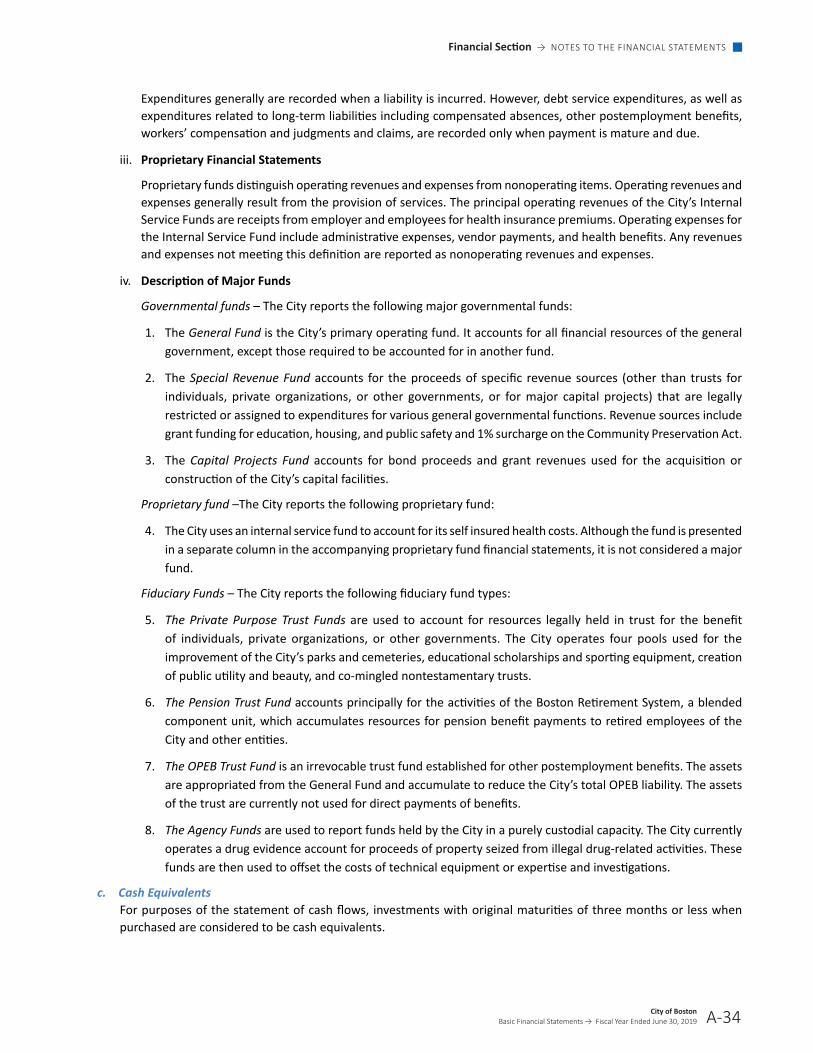
Financial Section → NOTES TO THE FINANCIAL STATEMENTS
City of BostonBasic Financial Statements → Fiscal Year Ended June 30, 2019
Financial Section → NOTES TO THE FINANCIAL STATEMENTS
City of BostonBasic Financial Statements → Fiscal Year Ended June 30, 2019A-33
Expenditures generally are recorded when a liability is incurred. However, debt service expenditures, as well as expenditures related to long-term liabilities including compensated absences, other postemployment benefits, workers’ compensation and judgments and claims, are recorded only when payment is mature and due.
iii� Proprietary Financial Statements
Proprietary funds distinguish operating revenues and expenses from nonoperating items. Operating revenues and expenses generally result from the provision of services. The principal operating revenues of the City’s Internal Service Funds are receipts from employer and employees for health insurance premiums. Operating expenses for the Internal Service Fund include administrative expenses, vendor payments, and health benefits. Any revenues and expenses not meeting this definition are reported as nonoperating revenues and expenses.
iv. Description of Major Funds
Governmental funds – The City reports the following major governmental funds:
1� The General Fund is the City’s primary operating fund. It accounts for all financial resources of the general government, except those required to be accounted for in another fund.
2� The Special Revenue Fund accounts for the proceeds of specific revenue sources (other than trusts for individuals, private organizations, or other governments, or for major capital projects) that are legally restricted or assigned to expenditures for various general governmental functions. Revenue sources include grant funding for education, housing, and public safety and 1% surcharge on the Community Preservation Act.
3� The Capital Projects Fund accounts for bond proceeds and grant revenues used for the acquisition or construction of the City’s capital facilities.
Proprietary fund –The City reports the following proprietary fund:
4� The City uses an internal service fund to account for its self insured health costs. Although the fund is presented in a separate column in the accompanying proprietary fund financial statements, it is not considered a major fund�
Fiduciary Funds – The City reports the following fiduciary fund types:
5� The Private Purpose Trust Funds are used to account for resources legally held in trust for the benefit of individuals, private organizations, or other governments. The City operates four pools used for the improvement of the City’s parks and cemeteries, educational scholarships and sporting equipment, creation of public utility and beauty, and co-mingled nontestamentary trusts.
6� The Pension Trust Fund accounts principally for the activities of the Boston Retirement System, a blended component unit, which accumulates resources for pension benefit payments to retired employees of the City and other entities.
7� The OPEB Trust Fund is an irrevocable trust fund established for other postemployment benefits. The assets are appropriated from the General Fund and accumulate to reduce the City’s total OPEB liability. The assets of the trust are currently not used for direct payments of benefits.
8� The Agency Funds are used to report funds held by the City in a purely custodial capacity. The City currently operates a drug evidence account for proceeds of property seized from illegal drug-related activities. These funds are then used to offset the costs of technical equipment or expertise and investigations.
c. Cash Equivalents For purposes of the statement of cash flows, investments with original maturities of three months or less when purchased are considered to be cash equivalents.
A-34

Financial Section → NOTES TO THE FINANCIAL STATEMENTS
City of BostonBasic Financial Statements → Fiscal Year Ended June 30, 2019
Financial Section → NOTES TO THE FINANCIAL STATEMENTS
A-34City of BostonBasic Financial Statements → Fiscal Year Ended June 30, 2019
d. Basis of Investment Valuation Investments generally are presented in the accompanying basic financial statements at fair value. Where applicable, fair values are based on quotations from national securities exchanges, except for certain investments of BRS, which are described in notes 5 and 11. Further, income from investments is recognized in the same fund as the related investments.
The City invests in the Massachusetts Municipal Depository Trust (MMDT) Cash Portfolio, which is an external investment pool and is not SEC-registered. The fund is state-regulated and is valued at amortized cost.
e. Interfund Receivables and Payables Activity between funds that are representative of lending/borrowing arrangements outstanding at the end of the fiscal year are referred to as either “due to/from other funds” (i.e., the current portion of interfund loans) or “advances to/from other funds” (i.e., the noncurrent portion of interfund loans). All other outstanding balances between funds are reported as “due to/from other funds.”
f. Uncollectible Tax and Other Receivables All receivables are shown net of an allowance for uncollectibles. Amounts considered to be uncollectible are based on the type and age of the related receivable.
g. Capital Assets Capital assets include property, plant, equipment, and infrastructure assets (e.g., roads, bridges, sidewalks, and similar items), and intangible assets such as easements, land use rights, computer software, trademarks and patents. Capital assets are reported in the governmental activities column in the Government-wide Financial Statements. Capital assets are defined by the City as assets with an initial, individual cost of more than $25,000 and an estimated useful life in excess of one year. Such assets are recorded at historical cost or estimated historical cost if purchased or constructed. Donated capital assets are recorded at acquisition value at the date of donation. Any significant construction commitments are encumbered at year end in the City’s Capital Projects Fund.
The costs of normal maintenance and repairs that do not add to the capacity or efficiency of the asset or materially extend assets’ useful lives are not capitalized.
Capital assets of the primary government are depreciated using the straight line method over the following estimated useful lives:
Assets Years Buildings 30 Building improvements 30 Infrastructure 30 Land improvements - major 30 Land improvements - playgrounds 15 Computer upgrades 10 Equipment and machinery 10 Intangible assets, computer software and licenses 5 Computers and related equipment 3 Furniture and fixtures 3 Motor vehicles 3
A-35

Financial Section → NOTES TO THE FINANCIAL STATEMENTS
City of BostonBasic Financial Statements → Fiscal Year Ended June 30, 2019
Financial Section → NOTES TO THE FINANCIAL STATEMENTS
City of BostonBasic Financial Statements → Fiscal Year Ended June 30, 2019A-35
h. Compensated Absences Employees are granted sick and vacation leave in varying amounts. Upon retirement, termination, or death, certain employees are compensated for unused sick and vacation leave (subject to certain limitations) at their then current rates of pay. Public Safety employees are compensated for unused personal leave in addition to sick and vacation leave. The portion of the liability related to unused sick and vacation time that has matured or is due as of June 30, 2019 is recorded in the Governmental Fund Financial Statements. The entire amount of the liability is reported in governmental activities in the Government-wide Financial Statements. The liability for vacation leave is based on the amount earned but not used; for sick leave, it is based on the amount accumulated at the balance sheet date that would be paid upon termination (vesting method). The liability for both amounts is calculated based on the pay or salary rates in effect at the balance sheet date.
i. Long Term Obligations and Related Costs Long-term debt and other long term obligations are reported as liabilities in the Government-wide Statement of Net Position. Bond premiums and discounts are capitalized and amortized over the life of the bonds using the straight line method, which approximates the effective interest method. The unamortized portion is presented in the Government-wide Statement of Net Position as a component of bonds payable. Bond issuance costs are reported as expenses when incurred.
The Governmental Fund Financial Statements recognize bond premiums and discounts, as well as bond issuance costs, during the period incurred. The face amount of debt issued is reported as other financing sources. Premiums received on debt issuances are reported as other financing sources while discounts on debt issuances are reported as other financing uses. Issuance costs, whether or not withheld from the actual debt proceeds received, are reported as debt service expenditures.
j. Pensions For purposes of measuring the net pension liability, deferred outflows of resources and deferred inflows of resources related to pensions, and pension expense, information about the fiduciary net position of the BRS and additions to/deductions from the BRS fiduciary net position have been determined on the same basis as they are reported by BRS. For this purpose, benefit payments (including refunds of employee contributions) are recognized when due and payable in accordance with the benefit terms. Investments are generally reported at fair value.
k. Postemployment Benefits Other Than Pensions (OPEB) For purposes of measuring the net OPEB liability, deferred outflows of resources and deferred inflows of resources related to OPEB, and OPEB expense, information about the fiduciary net position of the Other Postemployment Benefit Trust Fund (the Plan) and additions to/deductions from Plan’s fiduciary net position have been determined on the same basis as they are reported by the Plan. For this purpose, the Plan recognizes benefit payments when due and payable in accordance with the benefit terms. Investments are generally reported at fair value.
l. Deferred Outflows of Resources and Deferred Inflows of Resources Deferred outflows of resources are defined as a consumption of net assets by the government that is applicable to a future reporting period. Deferred inflows of resources are defined as an acquisition of net assets by the government that is applicable to a future reporting period. Deferred outflows of resources increase net position, similar to assets, and inflows of resources decrease net position, similar to liabilities.
m. Net Position and Fund Balance In the Government-wide and Proprietary Fund Financial Statements, net position is reported in the following categories:
Net investment in capital assets: Capital assets, net of accumulated depreciation, and outstanding principal balances of debt attributable to the acquisition, construction, or improvement of those assets.
Restricted: Net position the use of which is subject to constraints imposed by external parties, including creditors, grantors, and laws and regulations of other governments, or imposed by City Charter or enabling legislation. Nonexpendable amounts are required to remain intact under such constraints.
Unrestricted: Remaining net position not considered net investment in capital assets or restricted.
A-36

Financial Section → NOTES TO THE FINANCIAL STATEMENTS
City of BostonBasic Financial Statements → Fiscal Year Ended June 30, 2019
Financial Section → NOTES TO THE FINANCIAL STATEMENTS
A-36City of BostonBasic Financial Statements → Fiscal Year Ended June 30, 2019
For purposes of net position classification, when both restricted and unrestricted resources are available for use, it is the City’s policy to use restricted resources first, then unrestricted resources as they are needed.
In the Governmental Fund Financial Statements, fund balance is reported in the following categories:
Nonspendable: Amounts that cannot be spent because they are either not in spendable form or they are legally or contractually required to remain intact.
Restricted: Amounts the use of which is subject to constraints imposed by external parties, including creditors, grantors, and laws and regulations of other governments, or imposed by City Charter or enabling legislation.
Committed: Amounts that can only be used for specific purposes pursuant to constraints imposed by formal action of the government’s highest level of decision-making authority. For the City, this formal action takes the form of statutes which are passed by the City Council and approved by the Mayor.
Assigned: Amounts that are constrained by the City’s intent for use for specific purposes, but are considered neither restricted or committed. Under M.G.L. Chapter 190, Acts of 1982, the City Auditor has the authority to assign amounts to be used for specific purposes on behalf of the City.
Unassigned: Amounts in the general fund that are not otherwise constrained for a specific purpose more narrow than the general operations of the City. The City maintains a formal policy that unassigned fund balance in the General Fund be at least 15 percent of the current year’s General Fund GAAP basis operating expenditures.
For purposes of fund balance classification, when both restricted and unrestricted resources are available for use, it is the City’s policy to use restricted resources first, then unrestricted resources as they are needed. When unrestricted resources are used, committed resources are used first, followed by assigned and unassigned resources, respectively.
n. Tax Abatement Refunds Matured tax abatement refunds that are due and payable at June 30 have been recorded as a liability in the General Fund. A liability for estimated future tax abatement refunds has been recorded in the Government-wide Statement of Net Position.
o. Landfill Closure and Postclosure Care Costs State and federal regulations require the City to place a final cover on its Gardner Street landfill site when it stops accepting waste and to perform certain maintenance and monitoring functions at the site for 30 years after closure. At June 30, 2019, 100% of the Gardner Street landfill had been capped.
The total current cost of landfill closure and postclosure care is an estimate, subject to changes resulting from inflation, deflation, technology, or other changes in applicable laws or regulations. Such costs are recognized as expenditures in the General Fund to the extent that they are due or matured and are expected to be paid with expendable available financial resources. The total liability is reported in the Government-wide Statement of Net Position. Expenditures related to the Gardner Street landfill site postclosure care in fiscal year 2019 were $365 thousand.
p. Use of Estimates The preparation of the accompanying basic financial statements in conformity with U.S. generally accepted accounting principles requires management to make estimates and assumptions that affect the reported amounts of assets and liabilities and disclosure of contingent assets and liabilities at the date of the financial statements and the reported amounts of revenues and expenses during the reporting period. Actual results could differ from those estimates.
q. Adoption of Accounting Pronouncements The City adopted GASB Statement No. 83 “Certain Asset Retirement Obligations.” This Statement addresses accounting and financial reporting for certain asset retirement obligations (AROs). An ARO is a legally enforceable liability associated with the retirement of a tangible capital asset. A government that has legal obligations to perform future asset retirement activities related to its tangible capital assets should recognize a liability based on the guidance in this Statement. This Statement was implemented in fiscal 2019 without any material impact.
A-37

Financial Section → NOTES TO THE FINANCIAL STATEMENTS
City of BostonBasic Financial Statements → Fiscal Year Ended June 30, 2019
Financial Section → NOTES TO THE FINANCIAL STATEMENTS
City of BostonBasic Financial Statements → Fiscal Year Ended June 30, 2019A-37
The City adopted GASB Statement No. 88 “Certain Disclosures Related to Debt, including Direct Borrowings and Direct Placements”. The primary objective of this Statement is to improve the information that is disclosed in notes to government financial statements related to debt, including direct borrowings and direct placements. It also clarifies which liabilities governments should include when disclosing information related to debt. This Statement was implemented in fiscal 2019 without any material impact.
r. Restatement for Change in Measurement Date- GASB Statement No. 75The City elected to change its measurement date for OPEB from a beginning of year measurement date to an end of year measurement date. As a result of the change in measurement date, the beginning net position of the governmental activities was restated as follows (in thousands):
Governmental Activities Beginning Net Position as previously reported $ (1,741,636)
Effect of change in measurement date of OPEB Liability (217,552) Beginning Net Position, as restated $ (1,959,188)
3. Short Term Debt
During fiscal year 2019, the City had no short term debt issued or outstanding.
4. Budgetary Data
The General Fund is the only fund for which a budget is legally adopted. The budgets for all departments included in the General Fund of the City, except the School Department, are prepared under the direction of the Mayor and City Council. The School Department budget is prepared under the direction of the School Committee.
Original and supplemental appropriations are submitted by the Mayor, approved by the City Council, and lapse at year-end unless encumbered. The legal level of control over appropriations is at the department level. Amendments to the original budget must be approved by the City Council, except for a reallocation of appropriations of up to $3.0 million, which the Mayor may approve. Further, the City Auditor, with the approval of the Mayor, may make transfers from any appropriation to any other appropriation for purposes of eliminating deficits before closing the books for the fiscal year. After the close of the fiscal year, the City Auditor may, with the approval of the Mayor, apply any income, taxes, and funds not disposed of and make transfers from any appropriation to any other appropriation for the purpose of closing the accounts for the fiscal year.
The City must establish its property tax rate each year so that the resulting property tax levy will comply with the limits required by Proposition 2 1/2 (note 6). The tax levy must equal the sum of (a) the aggregate of all annual appropriations for expenditures; plus (b) the reserve accounts described in the following paragraph; plus (c) provision for the prior fiscal years’ deficits, if any; less (d) the aggregate of all non-property tax revenues projected to be received by the City, including available funds, in amounts certified or approved by the Commonwealth for tax rate purposes.
In accordance with the 1986 amendments to the Funding Loan Act of 1982, the City has established two reserve funds. The first is a budget reserve fund, which is required to be funded in stages to a final level of 2 1/2% of the prior year’s overall departmental appropriations, except the School Department, by the beginning of fiscal year 1990. It is available to be applied to extraordinary and unforeseen expenditures. The second is a separate reserve fund of 1% to 2-1/2% of the current year appropriation of the School Department to be applied to over-expenditures in that department.
The City’s General Fund budget is prepared on a basis other than accounting principles generally accepted in the United States of America (GAAP). The “actual” results column in the Statement of Revenues and Expenditures – Budgetary Basis – General Fund is presented on a “budgetary basis” to provide a meaningful comparison of actual results with the budget. The major differences between the budget and GAAP basis, where applicable, are that:
A-38
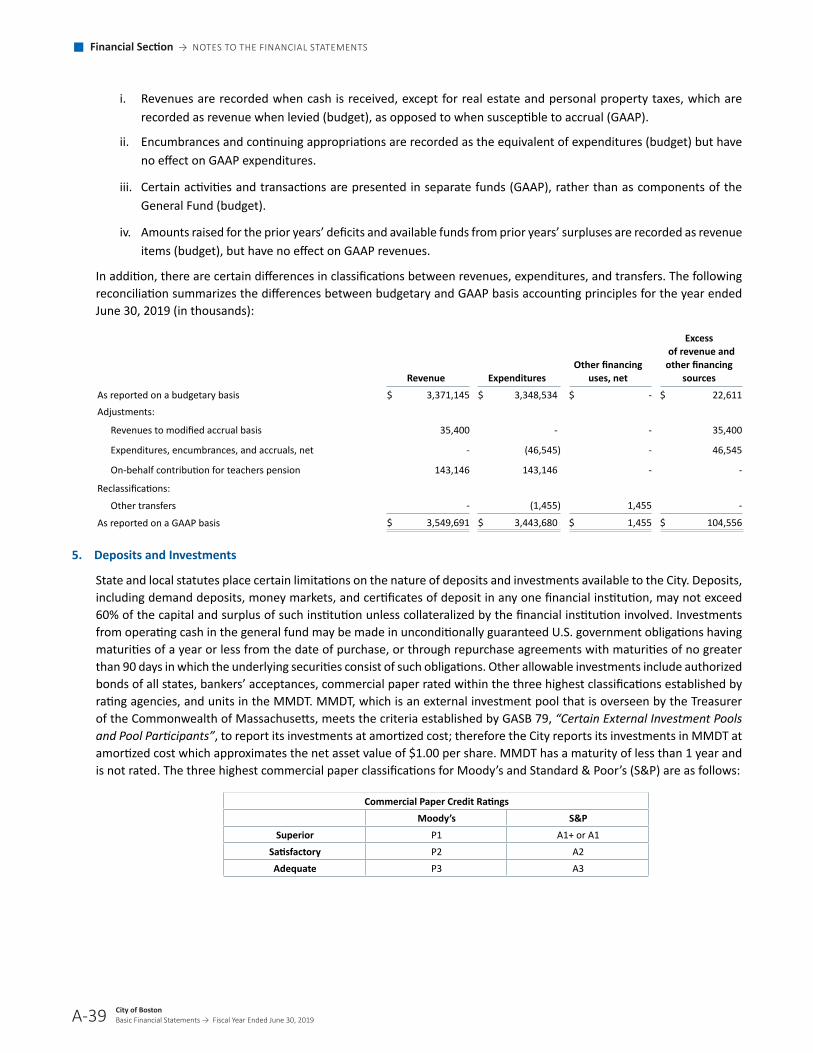
Financial Section → NOTES TO THE FINANCIAL STATEMENTS
City of BostonBasic Financial Statements → Fiscal Year Ended June 30, 2019
Financial Section → NOTES TO THE FINANCIAL STATEMENTS
A-38City of BostonBasic Financial Statements → Fiscal Year Ended June 30, 2019
i� Revenues are recorded when cash is received, except for real estate and personal property taxes, which are recorded as revenue when levied (budget), as opposed to when susceptible to accrual (GAAP).
ii� Encumbrances and continuing appropriations are recorded as the equivalent of expenditures (budget) but have no effect on GAAP expenditures.
iii� Certain activities and transactions are presented in separate funds (GAAP), rather than as components of the General Fund (budget).
iv. Amounts raised for the prior years’ deficits and available funds from prior years’ surpluses are recorded as revenue items (budget), but have no effect on GAAP revenues.
In addition, there are certain differences in classifications between revenues, expenditures, and transfers. The following reconciliation summarizes the differences between budgetary and GAAP basis accounting principles for the year ended June 30, 2019 (in thousands):
Revenue Expenditures Other financing
uses, net
Excess of revenue and other financing
sources
As reported on a budgetary basis $ 3,371,145 $ 3,348,534 $ - $ 22,611
Adjustments:
Revenues to modified accrual basis 35,400 - - 35,400
Expenditures, encumbrances, and accruals, net - (46,545) - 46,545
On-behalf contribution for teachers pension 143,146 143,146 - -
Reclassifications:
Other transfers - (1,455) 1,455 -
As reported on a GAAP basis $ 3,549,691 $ 3,443,680 $ 1,455 $ 104,556
5. Deposits and Investments
State and local statutes place certain limitations on the nature of deposits and investments available to the City. Deposits, including demand deposits, money markets, and certificates of deposit in any one financial institution, may not exceed 60% of the capital and surplus of such institution unless collateralized by the financial institution involved. Investments from operating cash in the general fund may be made in unconditionally guaranteed U.S. government obligations having maturities of a year or less from the date of purchase, or through repurchase agreements with maturities of no greater than 90 days in which the underlying securities consist of such obligations. Other allowable investments include authorized bonds of all states, bankers’ acceptances, commercial paper rated within the three highest classifications established by rating agencies, and units in the MMDT. MMDT, which is an external investment pool that is overseen by the Treasurer of the Commonwealth of Massachusetts, meets the criteria established by GASB 79, “Certain External Investment Pools and Pool Participants”, to report its investments at amortized cost; therefore the City reports its investments in MMDT at amortized cost which approximates the net asset value of $1.00 per share. MMDT has a maturity of less than 1 year and is not rated. The three highest commercial paper classifications for Moody’s and Standard & Poor’s (S&P) are as follows:
Commercial Paper Credit Ratings Moody’s S&P Superior P1 A1+ or A1 Satisfactory P2 A2 Adequate P3 A3
A-39
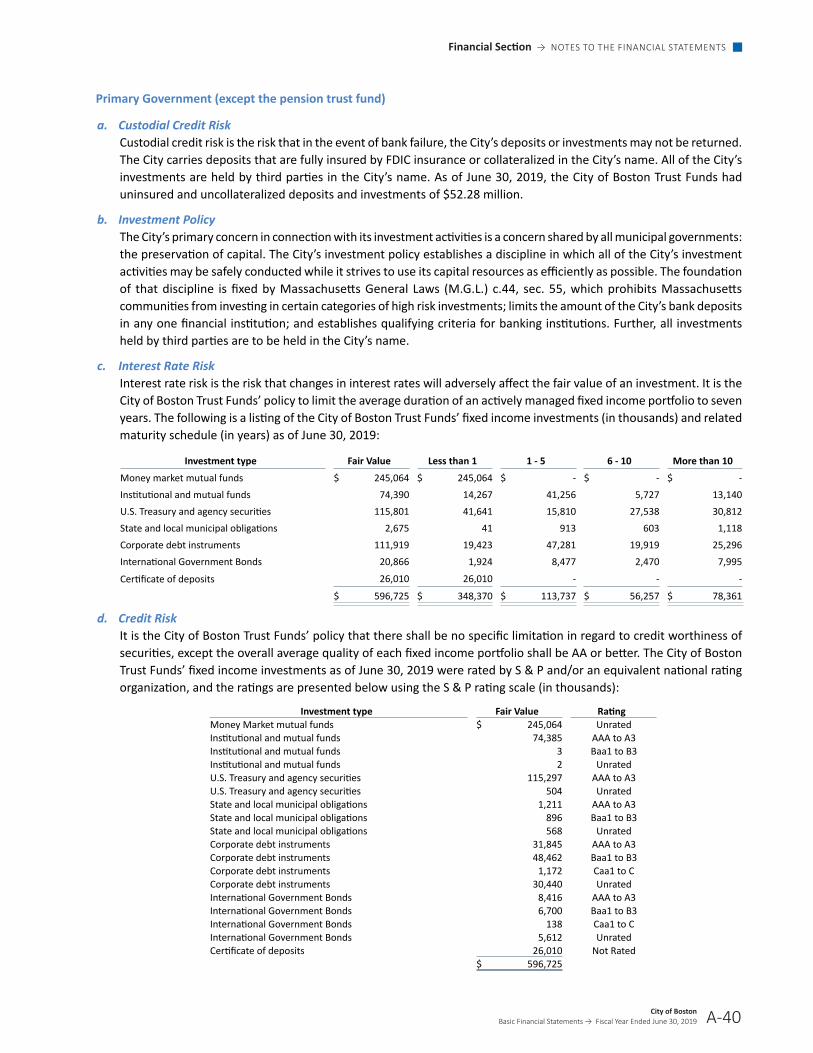
Financial Section → NOTES TO THE FINANCIAL STATEMENTS
City of BostonBasic Financial Statements → Fiscal Year Ended June 30, 2019
Financial Section → NOTES TO THE FINANCIAL STATEMENTS
City of BostonBasic Financial Statements → Fiscal Year Ended June 30, 2019A-39
Primary Government (except the pension trust fund)
a. Custodial Credit Risk Custodial credit risk is the risk that in the event of bank failure, the City’s deposits or investments may not be returned. The City carries deposits that are fully insured by FDIC insurance or collateralized in the City’s name. All of the City’s investments are held by third parties in the City’s name. As of June 30, 2019, the City of Boston Trust Funds had uninsured and uncollateralized deposits and investments of $52.28 million.
b. Investment Policy The City’s primary concern in connection with its investment activities is a concern shared by all municipal governments: the preservation of capital. The City’s investment policy establishes a discipline in which all of the City’s investment activities may be safely conducted while it strives to use its capital resources as efficiently as possible. The foundation of that discipline is fixed by Massachusetts General Laws (M.G.L.) c.44, sec. 55, which prohibits Massachusetts communities from investing in certain categories of high risk investments; limits the amount of the City’s bank deposits in any one financial institution; and establishes qualifying criteria for banking institutions. Further, all investments held by third parties are to be held in the City’s name.
c. Interest Rate Risk Interest rate risk is the risk that changes in interest rates will adversely affect the fair value of an investment. It is the City of Boston Trust Funds’ policy to limit the average duration of an actively managed fixed income portfolio to seven years. The following is a listing of the City of Boston Trust Funds’ fixed income investments (in thousands) and related maturity schedule (in years) as of June 30, 2019:
Investment type Fair Value Less than 1 1 - 5 6 - 10 More than 10
Money market mutual funds $ 245,064 $ 245,064 $ - $ - $ -
Institutional and mutual funds 74,390 14,267 41,256 5,727 13,140
U.S. Treasury and agency securities 115,801 41,641 15,810 27,538 30,812
State and local municipal obligations 2,675 41 913 603 1,118
Corporate debt instruments 111,919 19,423 47,281 19,919 25,296
International Government Bonds 20,866 1,924 8,477 2,470 7,995
Certificate of deposits 26,010 26,010 - - -
$ 596,725 $ 348,370 $ 113,737 $ 56,257 $ 78,361
d. Credit Risk It is the City of Boston Trust Funds’ policy that there shall be no specific limitation in regard to credit worthiness of securities, except the overall average quality of each fixed income portfolio shall be AA or better. The City of Boston Trust Funds’ fixed income investments as of June 30, 2019 were rated by S & P and/or an equivalent national rating organization, and the ratings are presented below using the S & P rating scale (in thousands):
Investment type Fair Value Rating Money Market mutual funds $ 245,064 Unrated Institutional and mutual funds 74,385 AAA to A3 Institutional and mutual funds 3 Baa1 to B3 Institutional and mutual funds 2 Unrated U.S. Treasury and agency securities 115,297 AAA to A3 U.S. Treasury and agency securities 504 Unrated State and local municipal obligations 1,211 AAA to A3 State and local municipal obligations 896 Baa1 to B3 State and local municipal obligations 568 Unrated Corporate debt instruments 31,845 AAA to A3 Corporate debt instruments 48,462 Baa1 to B3 Corporate debt instruments 1,172 Caa1 to C Corporate debt instruments 30,440 Unrated International Government Bonds 8,416 AAA to A3 International Government Bonds 6,700 Baa1 to B3 International Government Bonds 138 Caa1 to C International Government Bonds 5,612 Unrated Certificate of deposits 26,010 Not Rated $ 596,725
A-40

Financial Section → NOTES TO THE FINANCIAL STATEMENTS
City of BostonBasic Financial Statements → Fiscal Year Ended June 30, 2019
Financial Section → NOTES TO THE FINANCIAL STATEMENTS
A-40City of BostonBasic Financial Statements → Fiscal Year Ended June 30, 2019
e. Concentration RiskThe City adheres to the provisions of M.G.L. c. 44, sec. 55 when managing concentration risk. M.G.L. c. 44, sec. 55 contains several restrictions limiting where and under what circumstances the City may deposit its funds. No investments in a single issuer exceeded 5% of the City’s investment portfolio.
f. Foreign Currency RiskForeign currency risk is the risk that changes in exchange rates will adversely affect the fair value of an investment or a deposit. As of June 30, 2019, the City of Boston Trust Funds held international equity mutual funds valued at $108.1 million. Although these investments are not denominated in a foreign currency, the underlying securities are denominated in various foreign currencies.
g. Fair Value HierarchyInvestments are measured at fair value on a recurring basis. Recurring fair value measurements are those that GASB statements require or permit in the Statement of Net Position or Balance Sheet at the end of each reporting period. Fair value measurements are categorized based on the valuation inputs used to measure an asset’s fair value: Level 1 inputs are quoted prices in active markets for identical assets or liabilities that the reporting entity has the ability to access at the measurement date; Level 2 inputs are other than quoted prices in Level 1 that are observable for the asset or liability, or similar assets or liabilities either directly or indirectly through corroboration with observable market data; Level 3 inputs are significant unobservable inputs that are supported by little or no market activity and that are significant to the fair value of the assets or liabilities.
The following is a description of the valuation methodologies used for assets measured at fair value.
Money market funds: Valued at the daily closing price as reported by the fund. Money market funds held by the Pool of the money market fund and the City are open-end money market funds that are registered with the Securities and Exchange Commission. The money market funds held by the City and classified as Level 1 are deemed to be actively traded�
Institutional and mutual funds: Valued at the daily closing price as reported by the fund. Institutional and mutual funds held by the City are open-end funds that are registered with the Securities and Exchange Commission. The institutional and mutual funds held by the Pool and classified as Level 1 are deemed to be actively traded. If market quotations are not readily available, the funds are valued by the pricing method determined by investment managers which determines valuations using methods based upon market transactions for comparable securities.
Equity securities: Consist primarily of corporate stocks traded on U.S. and non-U.S. active security exchanges. Stocks traded on active exchanges and valued at quoted market prices and documented trade history for identical assets are categorized within Level 1 of the fair value hierarchy. If market quotations are not readily available, the stocks may be valued using pricing models maximizing the use of observable inputs for similar securities and are classified as Level 2.
US. Treasury and agency securities: Securities issued by the U.S. government, its agencies, authorities and instrumentalities are valued using quoted prices, documented trade history in the security, and pricing models maximizing the use of observable inputs determined by investment managers.
Corporate debt instruments: Valued either by using pricing models maximizing the use of observable inputs for similar securities or valued by the investment manager.
International government bonds: Bonds issued by foreign governments that are valued using quoted prices, documented history in the security, and pricing models maximizing the use of observable inputs determined by investment managers.
The preceding methods described may produce a fair value calculation that may not be indicative of net realizable value or reflective of future fair values. Furthermore, although the City believes its valuation methods are appropriate and consistent with other market participants, the use of different methodologies or assumptions to determine if the fair value of certain financial instruments could result in a different fair value measurement at the reporting date. The City of Boston Trust Funds have the following recurring fair value measurements as of June 30, 2019 (in thousands):
A-41
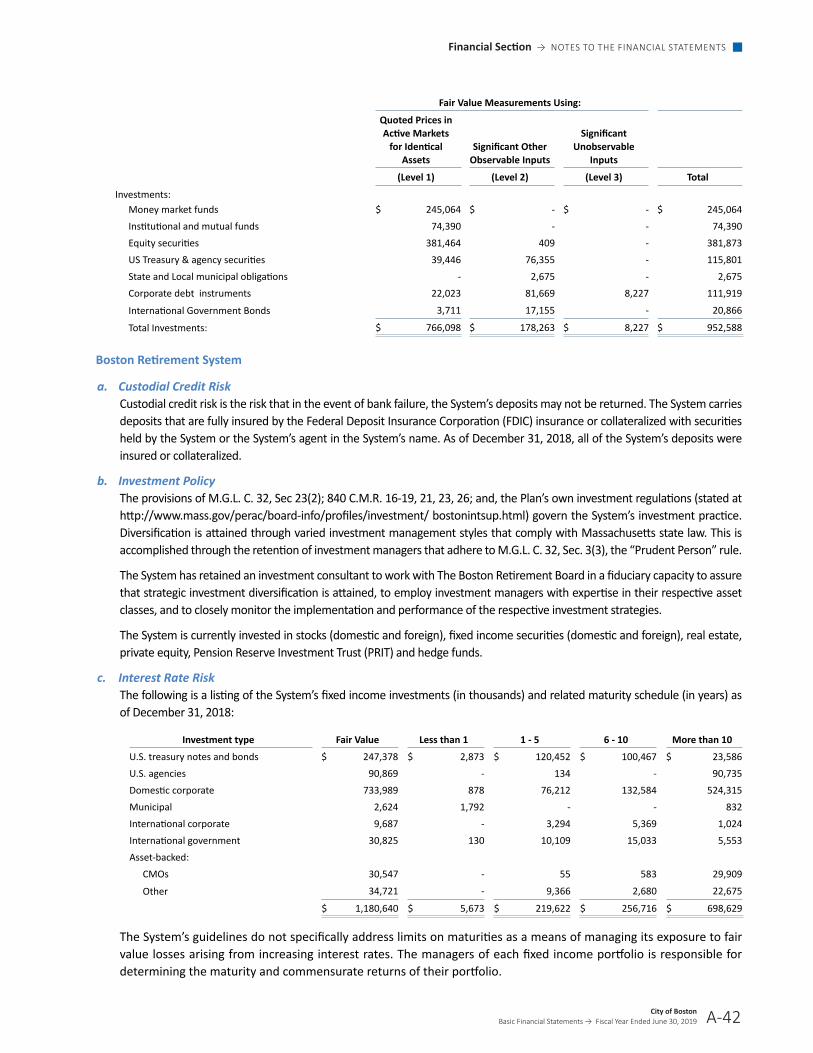
Financial Section → NOTES TO THE FINANCIAL STATEMENTS
City of BostonBasic Financial Statements → Fiscal Year Ended June 30, 2019
Financial Section → NOTES TO THE FINANCIAL STATEMENTS
City of BostonBasic Financial Statements → Fiscal Year Ended June 30, 2019A-41
Fair Value Measurements Using:
Quoted Prices in Active Markets
for Identical Assets
Significant Other Observable Inputs
Significant Unobservable
Inputs
(Level 1) (Level 2) (Level 3) Total
Investments:
Money market funds $ 245,064 $ - $ - $ 245,064
Institutional and mutual funds 74,390 - - 74,390
Equity securities 381,464 409 - 381,873
US Treasury & agency securities 39,446 76,355 - 115,801
State and Local municipal obligations - 2,675 - 2,675
Corporate debt instruments 22,023 81,669 8,227 111,919
International Government Bonds 3,711 17,155 - 20,866
Total Investments: $ 766,098 $ 178,263 $ 8,227 $ 952,588
Boston Retirement System
a. Custodial Credit Risk Custodial credit risk is the risk that in the event of bank failure, the System’s deposits may not be returned. The System carries deposits that are fully insured by the Federal Deposit Insurance Corporation (FDIC) insurance or collateralized with securities held by the System or the System’s agent in the System’s name. As of December 31, 2018, all of the System’s deposits were insured or collateralized.
b. Investment Policy The provisions of M.G.L. C. 32, Sec 23(2); 840 C.M.R. 16-19, 21, 23, 26; and, the Plan’s own investment regulations (stated at http://www.mass.gov/perac/board-info/profiles/investment/ bostonintsup.html) govern the System’s investment practice. Diversification is attained through varied investment management styles that comply with Massachusetts state law. This is accomplished through the retention of investment managers that adhere to M.G.L. C. 32, Sec. 3(3), the “Prudent Person” rule.
The System has retained an investment consultant to work with The Boston Retirement Board in a fiduciary capacity to assure that strategic investment diversification is attained, to employ investment managers with expertise in their respective asset classes, and to closely monitor the implementation and performance of the respective investment strategies.
The System is currently invested in stocks (domestic and foreign), fixed income securities (domestic and foreign), real estate, private equity, Pension Reserve Investment Trust (PRIT) and hedge funds.
c. Interest Rate Risk The following is a listing of the System’s fixed income investments (in thousands) and related maturity schedule (in years) as of December 31, 2018:
Investment type Fair Value Less than 1 1 - 5 6 - 10 More than 10
U.S. treasury notes and bonds $ 247,378 $ 2,873 $ 120,452 $ 100,467 $ 23,586
U�S� agencies 90,869 - 134 - 90,735
Domestic corporate 733,989 878 76,212 132,584 524,315
Municipal 2,624 1,792 - - 832
International corporate 9,687 - 3,294 5,369 1,024
International government 30,825 130 10,109 15,033 5,553
Asset-backed:
CMOs 30,547 - 55 583 29,909
Other 34,721 - 9,366 2,680 22,675
$ 1,180,640 $ 5,673 $ 219,622 $ 256,716 $ 698,629
The System’s guidelines do not specifically address limits on maturities as a means of managing its exposure to fair value losses arising from increasing interest rates. The managers of each fixed income portfolio is responsible for determining the maturity and commensurate returns of their portfolio.
A-42

Financial Section → NOTES TO THE FINANCIAL STATEMENTS
City of BostonBasic Financial Statements → Fiscal Year Ended June 30, 2019
Financial Section → NOTES TO THE FINANCIAL STATEMENTS
A-42City of BostonBasic Financial Statements → Fiscal Year Ended June 30, 2019
The collateralized mortgage obligations (CMOs) held by the System as of December 31, 2018 are highly sensitive to changes in interest rates�
d. Credit Risk The System allows investment managers to apply discretion under the “Prudent Person” rule. Investments are made, as a prudent person would be expected to act with discretion and intelligence, to seek reasonable income, preserve capital, and, in general, avoid speculative investments.
The System’s fixed income investments as of December 31, 2018 were rated by S & P and/or an equivalent national rating organization and the ratings are presented below (in thousands) using the S & P rating scale:
Investment type Fair
Value AAA AA A BBB BB B CCC Not
rated
U�S� agencies $ 90,869 $ 134 $ - $ - $ - $ - $ - $ - $ 90,735
Domestic corporate 733,989 796 4,639 21,508 45,685 20,648 28,880 29,581 582,252
Municipal 2,624 - 2,270 111 243 - - - -
International corporate 9,687 372 532 436 1,539 4,079 2,242 307 180
International government 30,825 758 1,963 3,297 10,647 3,072 3,039 700 7,349
Asset-backed:
CMOs 30,547 2,298 - 21 - - - - 28,228
Other 34,721 13,092 4,374 960 960 298 - 47 14,990
$ 933,262 $ 17,450 $ 13,778 $ 26,333 $ 59,074 $ 28,097 $ 34,161 $ 30,635 $ 723,734
In addition to the above schedule, the System has approximately $247.3 million invested in U.S. government securities, which are not rated as they are explicitly guaranteed by the U.S. government.
e. Concentration Risk Other than the Pension Reserves Investment Trust (PRIT) fund, the System has no investments, at fair value, except for pooled funds, that exceed 5% of the System’s total investments as of December 31, 2018. The System adheres to the provisions of M.G.L. c. 32, sec. 23(2); 840 C.M.R. 16-19, 21, 23, 26; and the Plan’s own investment regulations when managing concentration risk.
f. Foreign Currency Risk Foreign currency risk is the risk that changes in exchange rates will adversely affect the fair value of an investment or a deposit. Similar to the investments in domestic equities, the System employs or encourages its investment advisor to employ diversification, asset allocation, and quality strategies.
A-43
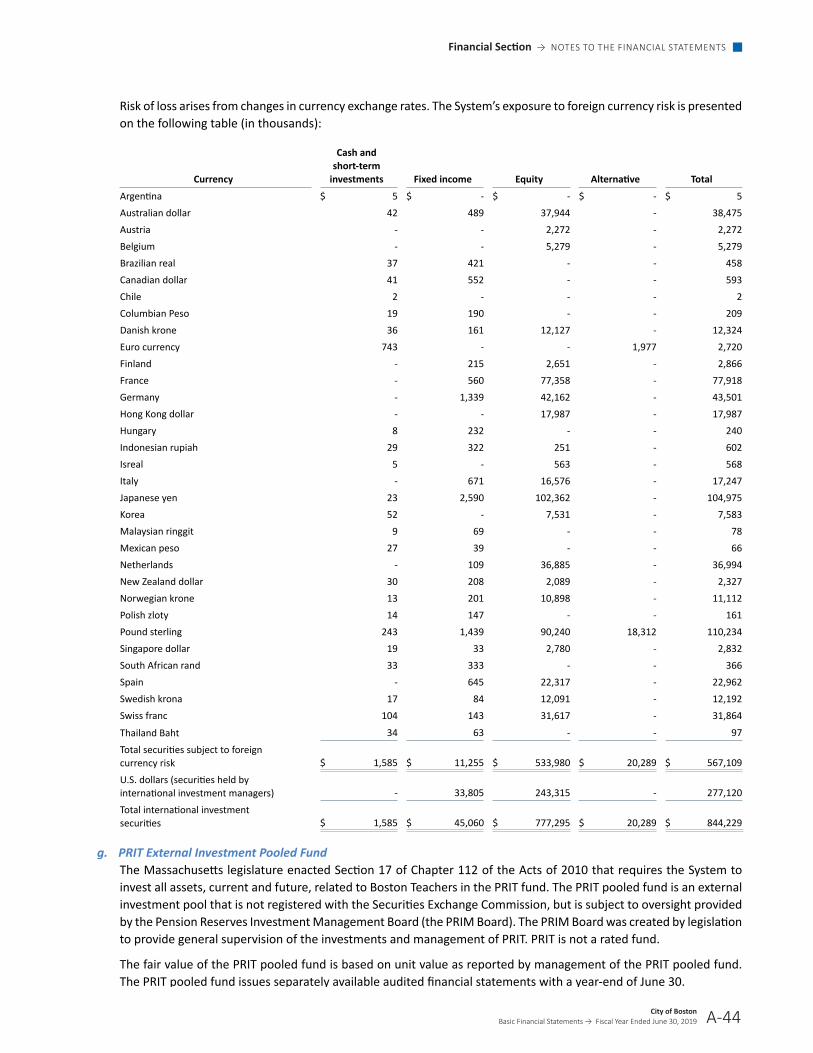
Financial Section → NOTES TO THE FINANCIAL STATEMENTS
City of BostonBasic Financial Statements → Fiscal Year Ended June 30, 2019
Financial Section → NOTES TO THE FINANCIAL STATEMENTS
City of BostonBasic Financial Statements → Fiscal Year Ended June 30, 2019A-43
Risk of loss arises from changes in currency exchange rates. The System’s exposure to foreign currency risk is presented on the following table (in thousands):
Currency
Cash and short-term
investments Fixed income Equity Alternative Total
Argentina $ 5 $ - $ - $ - $ 5
Australian dollar 42 489 37,944 - 38,475
Austria - - 2,272 - 2,272
Belgium - - 5,279 - 5,279
Brazilian real 37 421 - - 458
Canadian dollar 41 552 - - 593
Chile 2 - - - 2
Columbian Peso 19 190 - - 209
Danish krone 36 161 12,127 - 12,324
Euro currency 743 - - 1,977 2,720
Finland - 215 2,651 - 2,866
France - 560 77,358 - 77,918
Germany - 1,339 42,162 - 43,501
Hong Kong dollar - - 17,987 - 17,987
Hungary 8 232 - - 240
Indonesian rupiah 29 322 251 - 602
Isreal 5 - 563 - 568
Italy - 671 16,576 - 17,247
Japanese yen 23 2,590 102,362 - 104,975
Korea 52 - 7,531 - 7,583
Malaysian ringgit 9 69 - - 78
Mexican peso 27 39 - - 66
Netherlands - 109 36,885 - 36,994
New Zealand dollar 30 208 2,089 - 2,327
Norwegian krone 13 201 10,898 - 11,112
Polish zloty 14 147 - - 161
Pound sterling 243 1,439 90,240 18,312 110,234
Singapore dollar 19 33 2,780 - 2,832
South African rand 33 333 - - 366
Spain - 645 22,317 - 22,962
Swedish krona 17 84 12,091 - 12,192
Swiss franc 104 143 31,617 - 31,864
Thailand Baht 34 63 - - 97
Total securities subject to foreign currency risk $ 1,585 $ 11,255 $ 533,980 $ 20,289 $ 567,109
U.S. dollars (securities held by international investment managers) - 33,805 243,315 - 277,120
Total international investment securities $ 1,585 $ 45,060 $ 777,295 $ 20,289 $ 844,229
g. PRIT External Investment Pooled Fund The Massachusetts legislature enacted Section 17 of Chapter 112 of the Acts of 2010 that requires the System to invest all assets, current and future, related to Boston Teachers in the PRIT fund. The PRIT pooled fund is an external investment pool that is not registered with the Securities Exchange Commission, but is subject to oversight provided by the Pension Reserves Investment Management Board (the PRIM Board). The PRIM Board was created by legislation to provide general supervision of the investments and management of PRIT. PRIT is not a rated fund.
The fair value of the PRIT pooled fund is based on unit value as reported by management of the PRIT pooled fund. The PRIT pooled fund issues separately available audited financial statements with a year-end of June 30.
A-44

Financial Section → NOTES TO THE FINANCIAL STATEMENTS
City of BostonBasic Financial Statements → Fiscal Year Ended June 30, 2019
Financial Section → NOTES TO THE FINANCIAL STATEMENTS
A-44City of BostonBasic Financial Statements → Fiscal Year Ended June 30, 2019
On July 1, 2010, the System transferred 27% of its assets, or $1.1 billion, to the PRIT pooled fund. As of December 31, 2018, the System had the following amounts invested in the PRIT fund (in thousands):
General allocation account $ 1,481,521
Cash fund 143,278 Total PRIT pooled funds $ 1,624,799
h. Derivatives The System trades financial instruments with off balance sheet risk in the normal course of its investing activities to assist in managing exposure to market risks. The System uses forward foreign currency contracts to hedge against the risk of future foreign currency fluctuations. As of December 31, 2018, the System had 20 forward foreign currency contracts with a net notional amount of $4,093,590 and fair value of $37,663.
i. Securities Lending The Public Employment Retirement Administration Commission of Massachusetts (PERAC) has issued supplemental regulations that permit the System to engage in securities lending transactions. Securities lending is an investment management enhancement that utilizes certain existing securities of the Plan to earn additional income. These transactions are conducted by the System’s custodian, which lends certain securities owned by the System to other broker dealers and banks pursuant to a form of loan agreement. The System and the borrowers maintain the right to terminate all securities lending transactions on demand�
Securities lending involves the loaning of securities to approved banks and broker-dealers. In return for the loaned securities, the custodian, prior to or simultaneous with delivery of the loaned securities to the borrower, receives collateral in the form of cash (including both U.S. and foreign currency) or U.S. government securities, sovereign debt of foreign countries, and irrevocable bank letters of credit as collateral to serve as a safeguard against possible default of any borrower on the return of the loan. The custodian does not have the ability to pledge or sell collateral unless the borrower defaults. Borrowers are required to deliver collateral in the amounts equal to not less than 100% of the market value of the loaned securities. The collateral is marked to market on a daily basis. In the event the counterparty is unable to meet its contractual obligation under the securities lending arrangement, the Plan may incur losses equal to the amount by which the market value of the securities differs from the amount of collateral held. The Plan mitigates credit risk associated with securities lending arrangements by monitoring the fair value of the securities loaned on a daily basis, with additional collateral obtained or refunded as necessary. At December 31, 2018, the System had no credit risk exposure to borrowers because the amounts the System owed the borrowers exceeded the amounts owed to the System.
The System does not impose any restrictions on the amount of securities lent on its behalf by the custodian. There were no failures by any borrowers to return loaned securities or pay distributions thereon and there were no losses from a default of the borrowers or the custodian for the year ended December 31, 2018� The cash collateral received by the custodian on each loan was invested, together with the cash collateral of other qualified tax-exempt plan lenders, in a collective investment pool. The relationship between the average maturities of the investment pool and loans was affected by the maturities of the loans made by other plans that invested cash collateral in the collective investment pool, which the System could not determine.
The Plan maintains full ownership rights to the securities loaned and, accordingly, classifies loaned securities as investments. At December 31,2018, the fair value of securities loaned by the System amounted to $270.4 million, against which was held collateral of $278.6 million as follows (in thousands):
Short-term collateral investment pool $ 149,883 Noncash collateral 128,707 Total $ 278,590
j. Commitments At December 31, 2018, the System had contractual commitments to provide $291 million of additional funding to private equity funds, and $95 million to real estate funds.
A-45

Financial Section → NOTES TO THE FINANCIAL STATEMENTS
City of BostonBasic Financial Statements → Fiscal Year Ended June 30, 2019
Financial Section → NOTES TO THE FINANCIAL STATEMENTS
City of BostonBasic Financial Statements → Fiscal Year Ended June 30, 2019A-45
k. Fair Value Measurements The Plan categorizes its fair value measurements within the fair value hierarchy established by generally accepted accounting principles. The Plan has the following recurring fair value measurements as of December 31, 2018 (in thousands):
Fair Value Measurements Using:
Quoted Prices in Active Markets
for Identical Assets
Significant Other
Observable Inputs
Total at December
31, 2018 (Level 1) (Level 2)
Short-term:
Domestic $ 87,863 $ 87,863 $ -
International 13,783 13,783 -
Total short-term 101,646 101,646 -
U.S. equities:
Large cap core 559,086 559,086 -
Large cap growth 91,133 91,133 -
Large cap value 93,927 93,927 -
Small cap core 87,535 87,535 -
Small cap growth 85,079 85,079 -
Small cap value 94,966 94,966 -
Total U.S. equities 1,011,726 1,011,726 -
International equities 1,312,889 1,312,889 -
Fixed income securities:
U.S. treasury securities 247,378 247,378 -
Corporate debt securities 733,989 630,268 103,721
Global multi-sector fixed income 40,512 - 40,512
Municipal 2,624 - 2,624
Collateralized mortgage obligations 30,547 - 30,547
Other asset backed securities 34,721 - 34,721
U�S� Agencies 90,869 - 90,869
Total fixed income securities 1,180,640 877,646 302,994
Total investments by fair value level 3,606,901 3,303,907 302,994
Government external investment pool:
PRIT fund 1,481,521
Investments measured at the net asset value (NAV):
Hedge fund of funds 239,768
Private equity funds 293,403
Private real estate funds 484,640
Total investments measured
at the NAV 1,017,811
Total investments at fair value $ 6,106,233
A-46

Financial Section → NOTES TO THE FINANCIAL STATEMENTS
City of BostonBasic Financial Statements → Fiscal Year Ended June 30, 2019
Financial Section → NOTES TO THE FINANCIAL STATEMENTS
A-46City of BostonBasic Financial Statements → Fiscal Year Ended June 30, 2019
Fixed income and equity securities classified in Level 1 of the fair value hierarchy are valued using prices quoted in active markets for those securities. Fixed income securities classified in Level 2 of the fair value hierarchy are valued using a matrix pricing technique. Matrix pricing is used to value securities based on the securities’ relationship to benchmark quoted prices.
The PRIT pooled fund is an external investment pool that is not registered with the Securities and Exchange Commission, but is subject to oversight provided by the Pension Reserves Investment Management Board (the PRIM Board). The PRIM Board was created by legislation to provide general supervision of the investments and management of PRIT. PRIT is not a rated fund. The fair value of the PRIT pooled fund is based on unit value as reported by management of the PRIT pooled fund. The PRIT fund issues separately available audited financial statements with a year-end of June 30. The Plan is required to provide a 30-day redemption notice for this investment.
The valuation method for investments measured at the net asset value (NAV) per share (or its equivalent) is presented on the following table (in thousands):
Investments Measured at the NAV
Fair Value Unfunded
Commitments Redemption Frequency
Redemption Notice Period
Global multi-strategy hedge fund of funds1 $ 239,768 $ - Quarterly 60-90 days
Real estate funds2 484,640 94,855 - -
Private equity funds3 293,403 290,802 - -
1. Global Multi-strategy Hedge Fund of Funds. This type includes investments in 6 hedge funds that invest in other hedge fund managers. Management of each hedge fund is given full discretion to invest with direct hedge fund managers. The fair value of the investments in this type has been determined using the NAV per share of the investments.
2. Real Estate Funds. This type includes 32 real estate funds that invest primarily in U.S. commercial real estate. The fair values of the investments in this type have been determined using the NAV per share (or its equivalent) of the System’s ownership interest in partners’ capital. Distributions from each fund will be received as the underlying investments of the funds are liquidated. It is expected that the underlying assets of the funds will be liquidated over the next 7 to 10 years.
3. Private Equity Funds. This type includes 58 private equity funds that invest primarily in U.S. companies. These investments can never be redeemed with the funds; instead, the nature of the investments in this type is that distributions are received through the liquidation of the underlying assets of the funds. It is expected that the underlying assets of the funds will be liquidated over the next 7 to 10 years.
6. Property Taxes
Real and personal property taxes are based on values assessed as of each January 1. By law, all taxable property must be assessed at 100% of fair cash value. Also by law, property taxes must be levied at least 30 days prior to their due date. Once levied, these taxes are recorded as receivables, net of estimated uncollectible balances. Property tax revenues have been recorded using the accrual and modified accrual basis of accounting as described in note 2.
The City bills and collects its property taxes on a quarterly basis following the January 1 assessment. The due dates for those quarterly tax billings are August 1, November 1, February 1, and May 1. Property taxes that remain unpaid after the respective due dates are subject to penalties and interest charges.
Based on the City’s experience, most property taxes are collected during the year in which they are assessed. Liening of properties on which taxes remain unpaid occurs annually. On December 11, 2018, all properties with unpaid fiscal year 2018 property taxes were liened. The City ultimately has the right to foreclose on all properties where the taxes remain unpaid�
A statewide property tax limitation known as “Proposition 2 1/2” limits the amount of increase in the property tax levy in any fiscal year. Generally, Proposition 2 1/2 limits the total levy to an amount not greater than 2 1/2% of the total assessed value of all taxable property within the City. Secondly, the tax levy cannot increase by more than 2 1/2% of the prior year’s levy plus the taxes on property newly added to the tax rolls. Certain provisions of Proposition 2 1/2 can be overridden by a citywide referendum.
A-47

Financial Section → NOTES TO THE FINANCIAL STATEMENTS
City of BostonBasic Financial Statements → Fiscal Year Ended June 30, 2019
Financial Section → NOTES TO THE FINANCIAL STATEMENTS
City of BostonBasic Financial Statements → Fiscal Year Ended June 30, 2019A-47
7� Receivables
Receivables as of year end for the City’s individual major governmental funds and nonmajor governmental funds, including the applicable allowances for uncollectible accounts, are as follows (in thousands):
General Special
revenue Capital
projects
Other nonmajor
funds Total
Receivables:
Property taxes $ 16,974 $ - $ - $ - $ 16,974
Motor vehicle/boat excise 35,707 - - - 35,707
Intergovernmental 6,629 72,723 10,011 - 89,363
Departmental and other 15,085 24,117 - 33,724 72,926
Tax Title and possession 60,818 - - - 60,818
Gross receivables 135,213 96,840 10,011 33,724 275,788
Less allowance for uncollectibles (81,820) - - - (81,820)
Net total receivables $ 53,393 $ 96,840 $ 10,011 $ 33,724 $ 193,968
a. Long Term Receivable The City participates in the Commonwealth’s school building assistance program, which is administered by the MSBA. The MSBA provides financial assistance (up to 80% of total costs) to the City to build and/or renovate schools. As of June 30, 2019, under this program, the City was due funds totaling $2.5 million.
In the General Fund, the receivable is offset by deferred inflows of resources because the revenue is not considered available. The final scheduled paydown of $2.5 million is due in fiscal year 2020.
Notes Receivable
Section 108 is the loan guarantee provision of the Community Development Block Grant (CDBG) program. Section 108 provides communities with a source of financing for economic development, housing rehabilitation, public facilities, and large scale physical development projects. Housing and Urban Development (HUD) provides grants or loans to local governments, which in turn provides loans to developers. As of June 30, 2019, under this program, the City determined that $24 million was collectible. This amount is recorded in the City’s Special Revenue fund.
b. Tax Abatement Programs The City enters into tax abatement agreements that meet the reporting requirements of GASB Statement No. 77 “Tax Abatement Disclosures”. Below are descriptions of the tax abatement programs and the amount of real estate taxes that were abated for each program during the fiscal year.
Chapter 121A
Chapter 121A of the Massachusetts General Laws authorizes a local government in cooperation with its redevelopment authorities to suspend the imposition of real and personal property taxes, betterments and special assessments on properties determined to be “blighted” in order to encourage the redevelopment of residential, commercial, civic, recreational, historic or industrial projects by Chapter 121A Corporations. The City receives two principal sources of revenue from Chapter 121A Corporations. The first consists of an excise, as determined under Section 10 of Chapter 121A, that each Chapter 121A Corporation must pay to the Commonwealth that is then distributed to the City. The second form of revenue consists of payments as required by a contract between the City and Chapter 121A Corporations as authorized by Chapter 121A, Section 6A that provide for additional revenue beyond the excise provided under Section 10 of Chapter 121A.
A-48
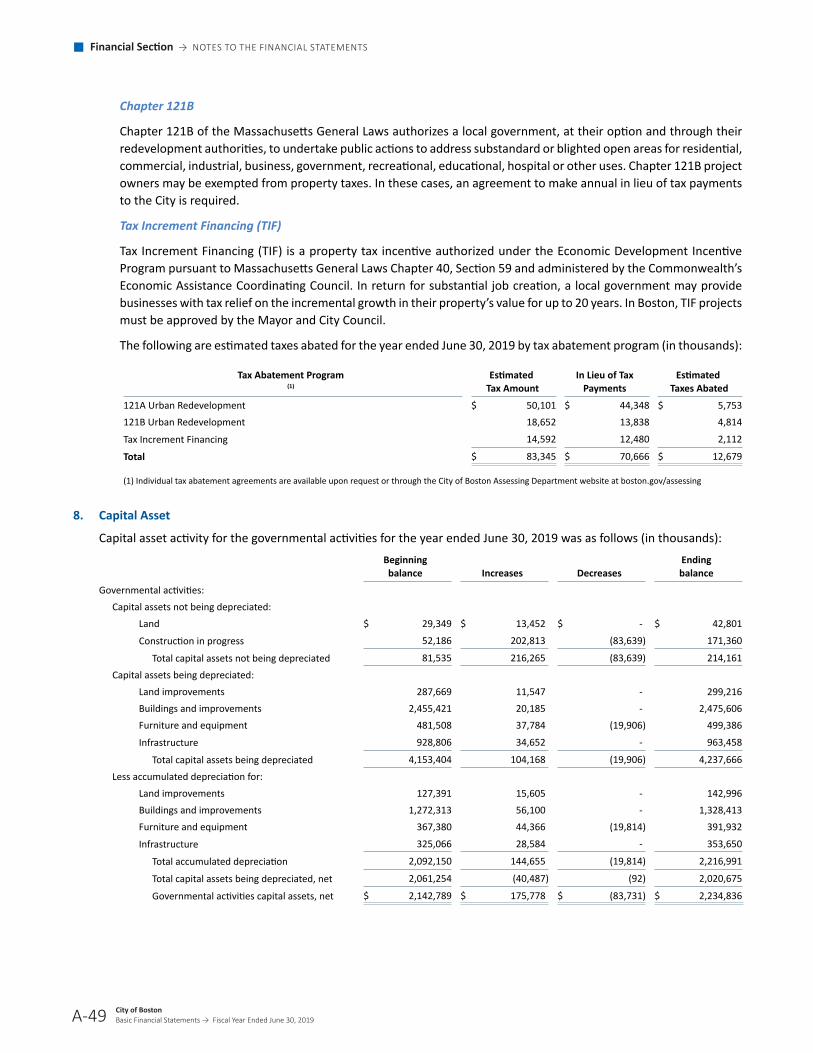
Financial Section → NOTES TO THE FINANCIAL STATEMENTS
City of BostonBasic Financial Statements → Fiscal Year Ended June 30, 2019
Financial Section → NOTES TO THE FINANCIAL STATEMENTS
A-48City of BostonBasic Financial Statements → Fiscal Year Ended June 30, 2019
Chapter 121B
Chapter 121B of the Massachusetts General Laws authorizes a local government, at their option and through their redevelopment authorities, to undertake public actions to address substandard or blighted open areas for residential, commercial, industrial, business, government, recreational, educational, hospital or other uses. Chapter 121B project owners may be exempted from property taxes. In these cases, an agreement to make annual in lieu of tax payments to the City is required.
Tax Increment Financing (TIF)
Tax Increment Financing (TIF) is a property tax incentive authorized under the Economic Development Incentive Program pursuant to Massachusetts General Laws Chapter 40, Section 59 and administered by the Commonwealth’s Economic Assistance Coordinating Council. In return for substantial job creation, a local government may provide businesses with tax relief on the incremental growth in their property’s value for up to 20 years. In Boston, TIF projects must be approved by the Mayor and City Council.
The following are estimated taxes abated for the year ended June 30, 2019 by tax abatement program (in thousands):
Tax Abatement Program (1)
Estimated Tax Amount
In Lieu of Tax Payments
Estimated Taxes Abated
121A Urban Redevelopment $ 50,101 $ 44,348 $ 5,753
121B Urban Redevelopment 18,652 13,838 4,814
Tax Increment Financing 14,592 12,480 2,112
Total $ 83,345 $ 70,666 $ 12,679
(1) Individual tax abatement agreements are available upon request or through the City of Boston Assessing Department website at boston.gov/assessing
8� Capital Asset
Capital asset activity for the governmental activities for the year ended June 30, 2019 was as follows (in thousands):
Beginning balance Increases Decreases
Ending balance
Governmental activities:
Capital assets not being depreciated:
Land $ 29,349 $ 13,452 $ - $ 42,801
Construction in progress 52,186 202,813 (83,639) 171,360
Total capital assets not being depreciated 81,535 216,265 (83,639) 214,161
Capital assets being depreciated:
Land improvements 287,669 11,547 - 299,216
Buildings and improvements 2,455,421 20,185 - 2,475,606
Furniture and equipment 481,508 37,784 (19,906) 499,386
Infrastructure 928,806 34,652 - 963,458
Total capital assets being depreciated 4,153,404 104,168 (19,906) 4,237,666
Less accumulated depreciation for:
Land improvements 127,391 15,605 - 142,996
Buildings and improvements 1,272,313 56,100 - 1,328,413
Furniture and equipment 367,380 44,366 (19,814) 391,932
Infrastructure 325,066 28,584 - 353,650
Total accumulated depreciation 2,092,150 144,655 (19,814) 2,216,991
Total capital assets being depreciated, net 2,061,254 (40,487) (92) 2,020,675
Governmental activities capital assets, net $ 2,142,789 $ 175,778 $ (83,731) $ 2,234,836
A-49
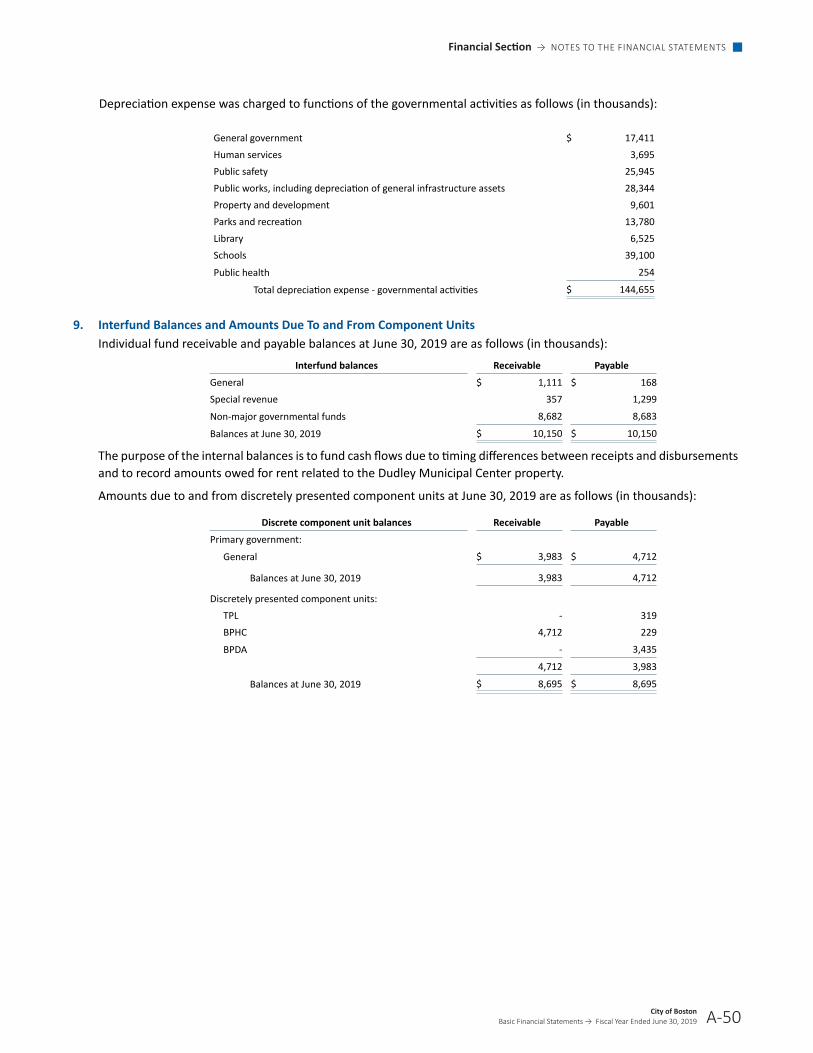
Financial Section → NOTES TO THE FINANCIAL STATEMENTS
City of BostonBasic Financial Statements → Fiscal Year Ended June 30, 2019
Financial Section → NOTES TO THE FINANCIAL STATEMENTS
City of BostonBasic Financial Statements → Fiscal Year Ended June 30, 2019A-49
Depreciation expense was charged to functions of the governmental activities as follows (in thousands):
General government $ 17,411 Human services 3,695 Public safety 25,945 Public works, including depreciation of general infrastructure assets 28,344 Property and development 9,601 Parks and recreation 13,780 Library 6,525 Schools 39,100 Public health 254 Total depreciation expense - governmental activities $ 144,655
9� Interfund Balances and Amounts Due To and From Component Units
Individual fund receivable and payable balances at June 30, 2019 are as follows (in thousands):
Interfund balances Receivable Payable
General $ 1,111 $ 168
Special revenue 357 1,299
Non-major governmental funds 8,682 8,683
Balances at June 30, 2019 $ 10,150 $ 10,150
The purpose of the internal balances is to fund cash flows due to timing differences between receipts and disbursements and to record amounts owed for rent related to the Dudley Municipal Center property.
Amounts due to and from discretely presented component units at June 30, 2019 are as follows (in thousands):
Discrete component unit balances Receivable Payable
Primary government:
General $ 3,983 $ 4,712
Balances at June 30, 2019 3,983 4,712
Discretely presented component units:
TPL - 319
BPHC 4,712 229
BPDA - 3,435
4,712 3,983
Balances at June 30, 2019 $ 8,695 $ 8,695
A-50

Financial Section → NOTES TO THE FINANCIAL STATEMENTS
City of BostonBasic Financial Statements → Fiscal Year Ended June 30, 2019
Financial Section → NOTES TO THE FINANCIAL STATEMENTS
A-50City of BostonBasic Financial Statements → Fiscal Year Ended June 30, 2019
10� Long-Term Obligations
Governmental Activities
The following is a summary of the long-term obligations of the governmental activities of the City as of June 30, 2019 (in thousands):
Interest
rates
Outstanding, beginning of
year Additions Reductions Outstanding, end of year
Due within one year
Bonds, Notes, Leases and Other long-term obligations:
General Obligation Bonds 0-6.05% $ 1,307,975 $ 145,130 $ 124,361 $ 1,328,744 $ 123,845
Add (deduct):
Unamortized bond premiums/discounts 162,347
Current portion of long-term debt (123,845)
$ 1,367,246
Interest rates
Outstanding, beginning of
year Additions Reductions Outstanding, end of year
Due within one year
Notes payable 2.10-7.18% $ 67,398 $ - $ 1,576 $ 65,822 $ 1,708
Leases payable 69,626 20,704 26,234 64,096 22,097
Judgments and claims 5,084 21,950 7,700 19,334 3,874
Tax abatements 17,300 5,600 - 22,900 7,400
Workers’ compensation 170,006 49,400 46,567 172,839 53,298
Health and life claims 19,890 288,484 281,239 27,135 27,135
Compensated absences 227,695 86,510 82,346 231,859 64,205
Landfill closure and postclosure care costs 6,957 - 365 6,592 350
Pollution remediation 500 - - 500 -
Other postemployment benefits* 2,354,231 286,739 225,635 2,415,335 -
Net pension liability 1,373,685 584,298 200,351 1,757,632 -
Total bonds, notes, leases, and other long-term obligations $ 4,312,372 $ 1,343,685 $ 872,013 $ 4,784,044 $ 180,067
*As restated in note 2r
The payment of long-term obligations of the governmental activities, except for health and life claims, is the responsibility of the City’s General Fund. Health and life claims are the responsibility of the City’s Internal Service Fund.
A-51
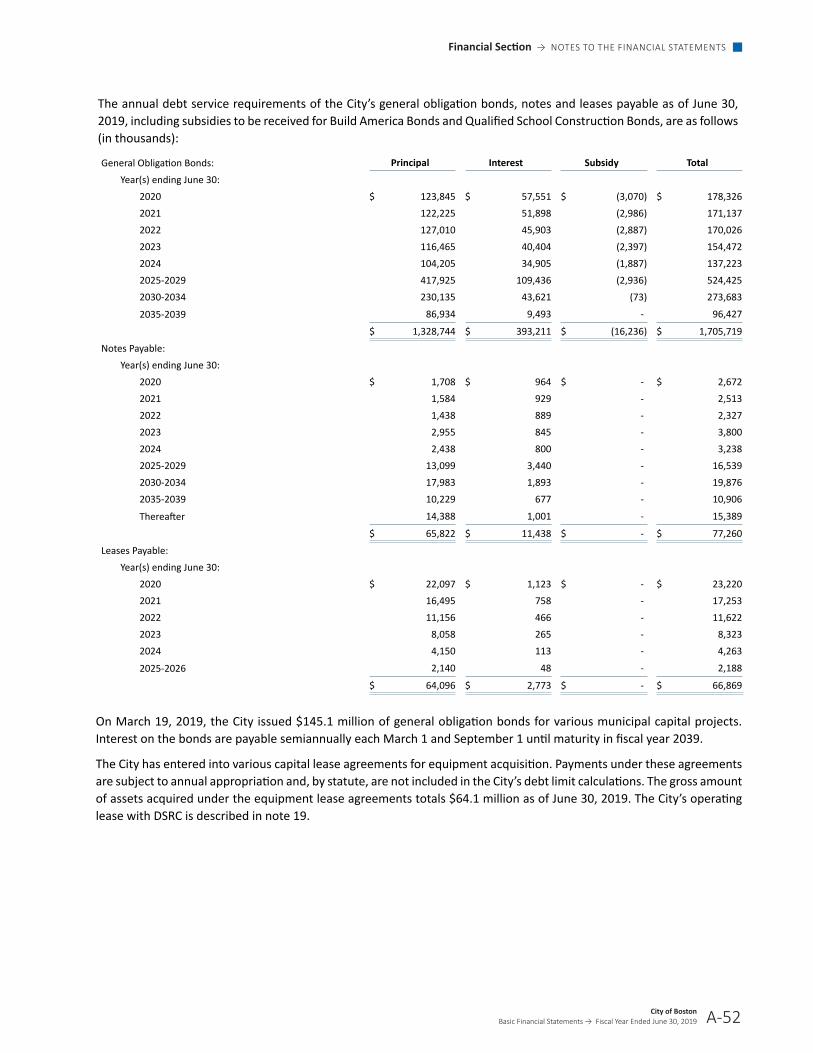
Financial Section → NOTES TO THE FINANCIAL STATEMENTS
City of BostonBasic Financial Statements → Fiscal Year Ended June 30, 2019
Financial Section → NOTES TO THE FINANCIAL STATEMENTS
City of BostonBasic Financial Statements → Fiscal Year Ended June 30, 2019A-51
The annual debt service requirements of the City’s general obligation bonds, notes and leases payable as of June 30, 2019, including subsidies to be received for Build America Bonds and Qualified School Construction Bonds, are as follows (in thousands):
General Obligation Bonds: Principal Interest Subsidy Total
Year(s) ending June 30:
2020 $ 123,845 $ 57,551 $ (3,070) $ 178,326
2021 122,225 51,898 (2,986) 171,137
2022 127,010 45,903 (2,887) 170,026
2023 116,465 40,404 (2,397) 154,472
2024 104,205 34,905 (1,887) 137,223
2025-2029 417,925 109,436 (2,936) 524,425
2030-2034 230,135 43,621 (73) 273,683
2035-2039 86,934 9,493 - 96,427
$ 1,328,744 $ 393,211 $ (16,236) $ 1,705,719
Notes Payable:
Year(s) ending June 30:
2020 $ 1,708 $ 964 $ - $ 2,672
2021 1,584 929 - 2,513
2022 1,438 889 - 2,327
2023 2,955 845 - 3,800
2024 2,438 800 - 3,238
2025-2029 13,099 3,440 - 16,539
2030-2034 17,983 1,893 - 19,876
2035-2039 10,229 677 - 10,906
Thereafter 14,388 1,001 - 15,389
$ 65,822 $ 11,438 $ - $ 77,260
Leases Payable:
Year(s) ending June 30:
2020 $ 22,097 $ 1,123 $ - $ 23,220
2021 16,495 758 - 17,253
2022 11,156 466 - 11,622
2023 8,058 265 - 8,323
2024 4,150 113 - 4,263
2025-2026 2,140 48 - 2,188
$ 64,096 $ 2,773 $ - $ 66,869
On March 19, 2019, the City issued $145.1 million of general obligation bonds for various municipal capital projects. Interest on the bonds are payable semiannually each March 1 and September 1 until maturity in fiscal year 2039.
The City has entered into various capital lease agreements for equipment acquisition. Payments under these agreements are subject to annual appropriation and, by statute, are not included in the City’s debt limit calculations. The gross amount of assets acquired under the equipment lease agreements totals $64.1 million as of June 30, 2019. The City’s operating lease with DSRC is described in note 19.
A-52

Financial Section → NOTES TO THE FINANCIAL STATEMENTS
City of BostonBasic Financial Statements → Fiscal Year Ended June 30, 2019
Financial Section → NOTES TO THE FINANCIAL STATEMENTS
A-52City of BostonBasic Financial Statements → Fiscal Year Ended June 30, 2019
No Obligation Debt
The City has outstanding industrial, commercial, and housing development bonds payable solely from revenues of the respective enterprises that do not constitute an indebtedness of the City and are not charged against its general credit. This aggregate amount is immaterial to the financial statements.
Defeased Debt
The principal amount of debt refunded through in substance defeasance transactions for governmental activities and still outstanding at June 30, 2019 was approximately $14.7 million.
Debt Capacity
The City is subject to a dual general debt limit: the normal debt limit and the double debt limit. Such limits are equal to 5% and 10%, respectively, of the valuation of taxable property in the City as last equalized by the Massachusetts Department of Revenue. Debt may be authorized up to the normal debt limit without state approval. Authorizations under the double debt limit, however, require the approval of the Commonwealth’s Secretary of Administration and Finance. Additionally, there are many categories of general obligation debt, which are exempt from the debt limit but are subject to other limitations.
As of June 30, 2019, the City may issue $6.67 billion of additional general obligation debt under the debt limit. General obligation debt of $1.02 billion, subject to the debt limit, and $75.3 million, exempt from the debt limit, are authorized but unissued as of June 30, 2019.
11. Retirement Plans
a. Plan Description The City contributes to the BRS, a cost-sharing, multiple-employer qualified defined benefit governmental pension plan. The System provides retirement, disability, and death benefits to plan members and beneficiaries of the following government units:
(1) City of Boston
(2) Boston Planning & Development Agency
(3) Boston Housing Authority
(4) Boston Water and Sewer Commission
(5) Boston Public Health Commission
(6) Sheriff of Suffolk County (Retirees as of December 31, 2009, funded by the City)
The Commonwealth of Massachusetts also is another contributing entity and makes contributions to BRS related to City of Boston teachers.
The System is administered by a five person Board of Retirement consisting of the City Auditor, who serves as a member ex officio, two members who are elected by the participants, in or retired from the service of the System, a fourth member appointed by the Mayor, and a fifth member chosen by the other members. A complete set of financial statements for BRS for the fiscal year ended December 31, 2018 can be obtained through the BRS, Boston City Hall, Room 816, Boston, MA 02201 or by accessing the website www.cityofboston.gov/retirement/investment.asp.
Participation in the System is mandatory for all permanent, full time, and certain part-time employees immediately upon the commencement of employment. Participants who resign from employment, or are receiving workers’ compensation benefits, and who are not eligible to receive a retirement allowance are entitled to request a refund of their accumulated total deductions. In addition, those participants who resign voluntarily with less than ten years of service are entitled to receive 3% per year interest; all others receive interest which has accrued on their cumulative deductions at the regular interest rate (0.1% at December 31, 2018).
A-53
Financial Section → NOTES TO THE FINANCIAL STATEMENTS
City of BostonBasic Financial Statements → Fiscal Year Ended June 30, 2019
Financial Section → NOTES TO THE FINANCIAL STATEMENTS
City of BostonBasic Financial Statements → Fiscal Year Ended June 30, 2019A-53
Employees with ten or more years of service having attained age 55 are entitled to pension benefits; an earlier retirement is allowed upon completion of 20 years of service. The System provides for retirement allowance benefits up to a maximum of 80% of a participant’s highest consecutive three-year average annual rate of regular compensation (highest consecutive five-year average for those members who join the System on or after April 2, 2012). Benefit payments are based upon a participant’s age, length of creditable service, regular compensation, and group classification. Participants become vested after ten years of creditable service. Effective July 1, 1998 Chapter 32 of the M.G.L. assigned the authority to establish and amend benefit provisions and grant cost-of-living increases for the plan to the Boston Retirement Board.
If a member in service dies due to causes unrelated to his or her job, the surviving spouse and/or surviving dependent children may receive benefits, either in a lump sum or in the form of an annuity based on the length of service, contributions and age. In the event there are no spouse and/or dependent children named, other beneficiaries may be entitled to a lump-sum distribution. Participants who become permanently and totally disabled from further duty may be eligible to receive accidental or ordinary disability retirement benefits.
Accidental disability is provided to members with incapacitation resulting from a work-related injury or hazard. Generally, annual pension benefits are provided based on 72% of the annual rate of regular compensation a member earned while an active employee on date of injury or average annual rate of regular compensation. Ordinary disability is available to any member whose permanent incapacitation is not work-related and has attained ten years of creditable service. Such benefits are provided as if the member had attained the age of 55 (or actual age if over 55) based on the amount of creditable service actually earned. Limits are placed on how much a disability employee can earn from other sources while collecting a disability retirement pension.
The City is legally responsible for funding the employer portion of all pensions associated with certain retirees from the Suffolk County Sheriff’s Department (SCSD), which became part of the Commonwealth of Massachusetts in 2010, pursuant to a cooperation agreement (the Agreement) dated June 28, 2011. According to the Agreement, all employees of the SCSD, or its predecessor department, who retired prior to January 1, 2010 remained retirees of the BRS. In addition, members of AFSCME Local 419 who retired between January 1, 2010 and October 31, 2010, remained retirees of the BRS. Employer contributions related to these retirees are the responsibility of the City under the Agreement�
Special Funding Situations
The City is party to a special funding situation with the Commonwealth of Massachusetts with respect to City of Boston Teachers. The Commonwealth is responsible for funding the employer portion of all teacher pensions in the Commonwealth. All teachers in the Commonwealth are members of the Massachusetts Teachers Retirement System, with the exception of teachers employed by the City, who are members of BRS. Although Boston Teachers are members of BRS, the Commonwealth is the responsible contributing entity as described in Chapter 112 of the Massachusetts General Laws Acts of 2010.
The Commonwealth is also legally responsible for reimbursing BRS for a portion of the benefits payments for cost of living increases granted before July 1997 as described in Chapter 112 of the Massachusetts General Laws Acts of 2010.
b. BRS Basis of Accounting The System’s financial statements are prepared using the accrual basis of accounting. Plan member contributions are recognized in the period in which the contributions are due. Employer contributions are recognized as additions in the period when they become due pursuant to formal statutory obligations. Benefits and refunds are recognized when due and payable in accordance with the terms of the plan.
Investments are reported at fair value. The following is a description of the valuation techniques and inputs used for each major class of assets and liabilities measured at fair value:
(1) Short-term, Equity and Fixed Income Investments - Securities traded on a national or international exchange are valued at the last reported sales price at current exchange rates. Certain fixed income securities not traded on an exchange are valued using a matrix pricing technique. Matrix pricing is used to value securities based on the securities’ relationship to benchmark quoted prices.
A-54

Financial Section → NOTES TO THE FINANCIAL STATEMENTS
City of BostonBasic Financial Statements → Fiscal Year Ended June 30, 2019
Financial Section → NOTES TO THE FINANCIAL STATEMENTS
A-54City of BostonBasic Financial Statements → Fiscal Year Ended June 30, 2019
(2) Pooled funds - the fair value of shares in managed investment pools is based on unit values reported by the funds.
(3) Alternative investments include hedge funds, holding through commingled limited partnerships of venture capital funds, including equity interests in early, middle, and later stage companies, as well as debt and equity interests in buyouts, acquisitions, restructurings, mezzanine structures and special situations, such as litigation or spin-off activities. These investments are carried at the limited partnership interest or redemption value, the equivalent of net asset value, which approximates fair value. Values assigned to such investments are based on available information and do not necessarily represent amounts that may ultimately be realized in liquidation. Liquidation values depend largely on future circumstances, including marketability, and frequently cannot reasonably be estimated until at, or near, the liquidation date.
(4) Real estate investments consist of interests in commercial properties held by various partnerships and other limited liability entities, some of which utilize debt financing. Fair values of such holdings are reported based on the net asset values of the entities, which are estimated using third-party appraisals and other information provided by property managers�
c. Membership Membership in the System consisted of the following at December 31, 2017:
Active plan members 20,995
Retirees and beneficiaries receiving benefits 14,448
Inactive members entitled to a return of contributions 9,514
Inactive members entitled to, but not yet receiving benefits 1,109
Total membership 46,066
Total number of participating employers 6
d. Contributions Plan members are required to contribute to the System. Depending on their employment date, active members must contribute a range of 5% – 11% of their regular gross compensation. Non-teacher members hired after January 1, 1979 must contribute an additional 2% of regular compensation in excess of $30,000. Participating employers are required to pay into the System their share of the remaining System-wide actuarially determined contribution, which is apportioned among the employers based on an actuarial computation. The contributions of plan members and the participating employers are governed by Chapter 32 of the M.G.L. For the year ended December 31, 2018, the System was due $426.3 million from all employers and the Commonwealth and received $426.3 million in these contributions. For the year ended June 30, 2019, inclusive of contributions related to SCSD, and exclusive of contributions related to the City’s teachers, the City’s required contribution was $234.1. The actual contribution was $255.1 million, which includes a $21.0 million contribution subsequent to the measurement date. For the year ended June 30, 2019, the Commonwealth’s required and actual contribution related to City Teachers was $143.1 million. The amount is reported as intergovernmental revenue and retirement cost expenditures in the General Fund.
e. Legally Required Reserve Accounts The balance in the System’s legally required reserves (on the statutory basis of accounting) at December 31, 2018 is as follows (in thousands):
Description Amount Purpose Annuity savings fund $ 1,838,956 Active members’ contribution balance Annuity reserve fund 446,799 Retired members’ contribution account Military service fund 50 Members’ contribution account while on military leave Pension reserve fund 4,081,772 Amounts appropriated to fund future retirement benefits
Pension fund 35,377 Remaining net position
$ 6,402,954
All reserve accounts are funded at levels required by state statute.
A-55

Financial Section → NOTES TO THE FINANCIAL STATEMENTS
City of BostonBasic Financial Statements → Fiscal Year Ended June 30, 2019
Financial Section → NOTES TO THE FINANCIAL STATEMENTS
City of BostonBasic Financial Statements → Fiscal Year Ended June 30, 2019A-55
f. City Pension Liabilities, Pension Expense, and Deferred Outflows of Resources Related to Pensions At June 30, 2019, the City reported a liability of $1.67 billion for its proportionate share of the BRS net pension liability measured as of December 31, 2018. This net pension liability includes amounts related to SCSD retirees and reflects a reduction for the special funding situations with the Commonwealth. The amount recognized by the City as its proportionate share of the net pension liability, the proportionate share related to the Commonwealth special funding situations, and the total portion of the net pension liability associated with the City measured at December 31, 2018 were as follows (in thousands):
City’s proportionate share of net pension liability $ 1,665,325
Commonwealth’s proportionate share of net pension liability associated with the City 2,556,731
Total $ 4,222,056
To determine employers’ proportionate share of the net pension liability, separate calculations of net pension liability were performed for each of the Commonwealth special funding situations, SCSD retirees, and the remaining non-teacher group. At December 31, 2018, the City was allocated 100% of the net pension liability for SCSD retirees and 82.4% of the remaining non-teacher group based on its proportion of 2018 required employer contributions related to this group. The City’s proportion of the collective BRS net pension liability at December 31, 2018 was 36.32% compared to 32.04% at December 31, 2017.
For the year ended June 30, 2019, in the Government-wide financial statements, the City recognized pension expense of $513 million and revenue of $254.8 million related to the Commonwealth special funding situations. At June 30, 2019, the City reported deferred outflows of resources related to pensions from the following sources (in thousands):
Deferred outflows of
resources
Deferred inflows of resources
Net difference between projected and actual investment earnings $ 329,314 $ 135,025
Changes in assumptions 115,585 25,251 Changes in employer proportion 20,107 -
Employer contributions made subsequent to the measurement date 21,000 -
$ 486,006 $ 160,276
Amounts reported as deferred outflows of resources and deferred inflows of resources at June 30, 2019 related to pensions will be recognized in pension expense as follows (in thousands):
Year ended June 30:
2020 $ 103,854
2021 41,609
2022 40,213
2023 130,205
2024 (11,151)
$ 304,730
For purposes of measuring the net pension liability, deferred outflows of resources and deferred inflows of resources related to pensions, and pension expense, information about the fiduciary net position of the BRS and additions to/deductions from the BRS’s fiduciary net position have been determined on the same basis as they are reported for the BRS�
A-56

Financial Section → NOTES TO THE FINANCIAL STATEMENTS
City of BostonBasic Financial Statements → Fiscal Year Ended June 30, 2019
Financial Section → NOTES TO THE FINANCIAL STATEMENTS
A-56City of BostonBasic Financial Statements → Fiscal Year Ended June 30, 2019
g. Actuarial Assumptions The total pension liability for the December 31, 2018 measurement date was determined by using an actuarial valuation as of January 1, 2018, with updated procedures used to roll forward the total pension liability to December 31, 2018. The measurement of the total pension liability at December 31, 2018 applied the following actuarial assumptions:
Inflation 3.25%
Salary Scale 7.5% to 4% percent, indexed by year of service, for teachers and 4.5% to 4% for non-teachers
Investment rate of return,including inflation
7.50% for BRS excluding teachers and 7.35% for teachers, net of expenses, including inflation
Cost of living adjustments 3% of first $14,000
Mortality RP-2014 Blue Collar Employee and Healthy Annuitant Mortality Tables set forward 1 year for female participants projected generationally using Scale MP-2017 for BRS excluding Teachers and RP-2014 White Collar Employee and Healthy Annuitant Mortality Tables projected generationally with Scale MP-2016 for Teachers
The long-term expected rate of return on pension plan investments was determined using a building-block method in which best-estimate ranges of expected future real rates of return (expected returns, net of pension plan investment expense and inflation) are developed for each major asset class. These ranges are combined to produce the long-term expected rate of return by weighting the expected future real rates of return by the target asset allocation percentage and by adding expected inflation.
Best estimates of arithmetic real rates of return for each major asset class included in the target asset allocation as of the actuarial valuation date of December 31, 2018 for BRS, excluding Teachers, are summarized below:
Asset class Target
Allocation
Long-term Expected
Real Rate of Return
Domestic equity 23% 6.16% International developed markets equity 17 6�69 Emerging markets equity 8 9�47 Core fixed income 16 1�89 High yield fixed income 10 4�00 Real estate 10 4�58 Commodities 0 4�77 Hedge fund, GTAA, Risk parity 9 3�68
Private equity 7 10�00 100%
h. Discount Rate The discount rate used to measure the total pension liability was 7.50% for BRS excluding Teachers. The projection of cash flows used to determine the discount rate assumes that contributions from plan members will be made at the current contribution rate and that contributions of participating employers and the Commonwealth will be made at rates equal to the actuarially determined contribution rates. Based on those assumptions, the BRS’s fiduciary net position was projected to be available to make all projected future benefit payments of current plan members. Therefore, the long-term expected rate of return on pension plan investments was applied to all periods of projected benefit payments to determine the total pension liability.
A-57
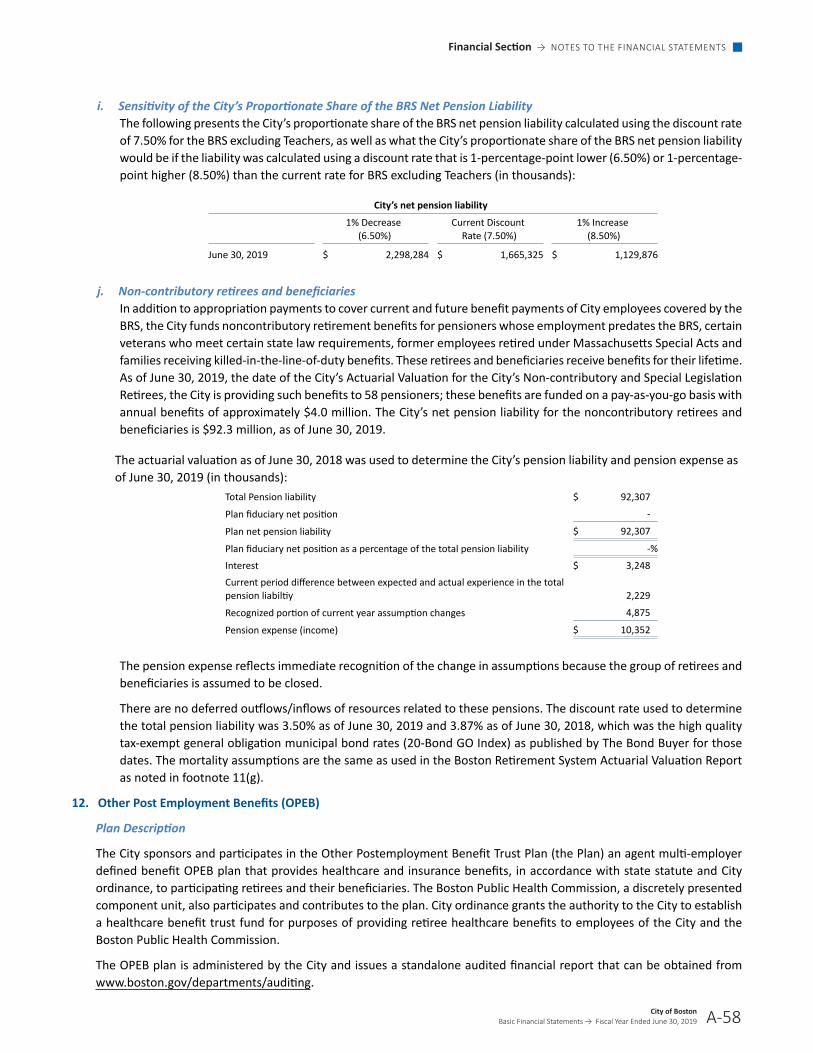
Financial Section → NOTES TO THE FINANCIAL STATEMENTS
City of BostonBasic Financial Statements → Fiscal Year Ended June 30, 2019
Financial Section → NOTES TO THE FINANCIAL STATEMENTS
City of BostonBasic Financial Statements → Fiscal Year Ended June 30, 2019A-57
i. Sensitivity of the City’s Proportionate Share of the BRS Net Pension Liability The following presents the City’s proportionate share of the BRS net pension liability calculated using the discount rate of 7.50% for the BRS excluding Teachers, as well as what the City’s proportionate share of the BRS net pension liability would be if the liability was calculated using a discount rate that is 1-percentage-point lower (6.50%) or 1-percentage-point higher (8.50%) than the current rate for BRS excluding Teachers (in thousands):
City’s net pension liability
1% Decrease
(6.50%) Current Discount
Rate (7.50%) 1% Increase
(8.50%)
June 30, 2019 $ 2,298,284 $ 1,665,325 $ 1,129,876
j. Non-contributory retirees and beneficiaries In addition to appropriation payments to cover current and future benefit payments of City employees covered by the BRS, the City funds noncontributory retirement benefits for pensioners whose employment predates the BRS, certain veterans who meet certain state law requirements, former employees retired under Massachusetts Special Acts and families receiving killed-in-the-line-of-duty benefits. These retirees and beneficiaries receive benefits for their lifetime. As of June 30, 2019, the date of the City’s Actuarial Valuation for the City’s Non-contributory and Special Legislation Retirees, the City is providing such benefits to 58 pensioners; these benefits are funded on a pay-as-you-go basis with annual benefits of approximately $4.0 million. The City’s net pension liability for the noncontributory retirees and beneficiaries is $92.3 million, as of June 30, 2019.
The actuarial valuation as of June 30, 2018 was used to determine the City’s pension liability and pension expense as of June 30, 2019 (in thousands):
Total Pension liability $ 92,307
Plan fiduciary net position -
Plan net pension liability $ 92,307
Plan fiduciary net position as a percentage of the total pension liability -% Interest $ 3,248
Current period difference between expected and actual experience in the total pension liabiltiy 2,229
Recognized portion of current year assumption changes 4,875 Pension expense (income) $ 10,352
The pension expense reflects immediate recognition of the change in assumptions because the group of retirees and beneficiaries is assumed to be closed.
There are no deferred outflows/inflows of resources related to these pensions. The discount rate used to determine the total pension liability was 3.50% as of June 30, 2019 and 3.87% as of June 30, 2018, which was the high quality tax-exempt general obligation municipal bond rates (20-Bond GO Index) as published by The Bond Buyer for those dates. The mortality assumptions are the same as used in the Boston Retirement System Actuarial Valuation Report as noted in footnote 11(g)�
12. Other Post Employment Benefits (OPEB)
Plan Description
The City sponsors and participates in the Other Postemployment Benefit Trust Plan (the Plan) an agent multi-employer defined benefit OPEB plan that provides healthcare and insurance benefits, in accordance with state statute and City ordinance, to participating retirees and their beneficiaries. The Boston Public Health Commission, a discretely presented component unit, also participates and contributes to the plan. City ordinance grants the authority to the City to establish a healthcare benefit trust fund for purposes of providing retiree healthcare benefits to employees of the City and the Boston Public Health Commission.
The OPEB plan is administered by the City and issues a standalone audited financial report that can be obtained from www.boston.gov/departments/auditing�
A-58

Financial Section → NOTES TO THE FINANCIAL STATEMENTS
City of BostonBasic Financial Statements → Fiscal Year Ended June 30, 2019
Financial Section → NOTES TO THE FINANCIAL STATEMENTS
A-58City of BostonBasic Financial Statements → Fiscal Year Ended June 30, 2019
Benefits Provided
Medical and prescription drug benefits are provided to all eligible retirees not enrolled in Medicare through a variety of plans offered by Blue Cross Blue Shield of Massachusetts, Harvard Pilgrim HealthCare, and Neighborhood Health Plan. Medical and prescription drug benefits are provided to retirees enrolled in Medicare through supplemental and Medicare Advantage plans offered by Blue Cross Blue Shield of Massachusetts, Harvard Pilgrim HealthCare, and Tufts Health Plan.
Groups 1 and 2 retirees, including teachers, with at least 10 years or 20 years of creditable service are eligible at age 55 or any age, respectively. Group 4 retirees with at least 10 years or 20 years of creditable service are eligible at age 45 or any age, respectively. Retirees on accidental disability retirement are eligible at any age, while ordinary disability requires 10 years of creditable service. The surviving spouse is eligible to receive pre and post retirement death benefits, as well as medical and prescription drug coverage.
Employees Covered by the Benefit Terms
As of June 30, 2017, the most recent actuarial valuation date, the following employees meet the eligibility requirements as put forth in Chapter 32B of M.G.L.:
City PHC Active Plan members 14,186 904 Inactive members receiving benefits 14,863 251
Inactive Plan members entitled to but not yet receiving benefits - - Total membership 29,049 1,155
b. Contributions Employer and employee contribution rates are governed by the respective collective bargaining agreements. The OPEB Plan is currently funded on a pay-as-you-go basis plus periodic advance funding contributions as amounts are available. The employers and plan members share the cost of benefits. As of June 30, 2017, the valuation date, the plan members contribute 12.0% to 29.5% of the monthly premium cost, depending on the plan in which they are enrolled. The City contributes the balance of the premium cost.
c. Basis of Accounting The OPEB Trust Fund Financial Statements are prepared using the accrual basis of accounting. Employer contributions to the plan are recognized when made. Benefits are recognized when due and payable in accordance with the terms of each plan�
Investments are reported at fair value. Fair value of securities held directly are based on quotations from national securities exchanges.
d. Investment Policy The provisions of Massachusetts General Laws (M.G.L) c. 44 sec 54 allows investment in securities listed on the Commonwealth’s approved securities listing. The OPEB investment portfolio is managed by the City’s Investment committee consisting of the City Auditor, the Assistant City Manager of Fiscal Affairs, Assistant Finance Director, and City Assessor. The investment strategy is to reduce risk through the prudent diversification of the portfolio across the distinct allowable asset classes. The Committee aims to remain consistent in the approach and refrain from dramatically shifting asset class allocation over a short period.
A-59

Financial Section → NOTES TO THE FINANCIAL STATEMENTS
City of BostonBasic Financial Statements → Fiscal Year Ended June 30, 2019
Financial Section → NOTES TO THE FINANCIAL STATEMENTS
City of BostonBasic Financial Statements → Fiscal Year Ended June 30, 2019A-59
Actuarial Methods and Assumptions
The total OPEB liability for the June 30, 2019 measurement date determined by using an actuarial valuation as of June 30, 2017,with update procedures used to roll forward the total OPEB liability to June 30, 2019. The measurement at June 30, 2019 applied the following assumptions:
● Salary Increase. Non-teachers: 4.0 to 4.5%. Teachers: 4.0 to 7.5%
● Inflation Increase. 3.25%
● Actuarial Cost Method. The entry age normal cost method based on level percentage of payroll.
● Mortality. RP-2014 generational table using Scale MP-2017 for non-teachers and MP-2016 for teachers, applied on a gender-specific basis.
● Healthcare cost trend rates. Medical and Prescription Drug: 7.0% decreasing by 0.5% for 5 years to an ultimate rate of 4.5%. Medicare Part B Premium: 4.5%. Contributions: Retiree contributions are expected to increase with medical trend�
● Discount Rate. The discount rate used to measure the total OPEB liability is 6.75% per annum.
The long-term expected rate of return on OPEB plan investments was determined using a building-block method in which best-estimate ranges of expected future real rates of return (expected returns, net of OPEB plan investment expense and inflation) are developed for each major asset class. These ranges are combined to produce the long-term expected rate of return by weighting the expected future real rates of return by the target asset allocation percentage and by adding expected inflation. The target allocation and best estimates of arithmetic real rates of return for each major asset class are summarized in the following table:
Asset Class Target
Allocation
Long-term Expected Real Rate of return
Domestic equity 25% 6.16% International developed markets equity 20% 6.69% International emerging markets equity 5% 9.47% Core Fixed Income 23% 1.89% High Yield Fixed Income 7% 4.00% Real Estate 6% 4.58% Hedge Fund, GTAA, Risk parity 14% 3.68%
Total 100%
Net OPEB Liability
The components of the net OPEB liability for the City’s Plan as of June 30, 2019, presented below on the June 30, 2019 measurement date and the actuarial assumptions are outlined above (in thousands):
City Total OPEB Liability $3,009,584
Plan Fiduciary Net Position (594,249)
Net OPEB Liability $2,415,335 Plan Fiduciary Net Position as a percentage of the Total OPEB Liability 19.75%
A-60

Financial Section → NOTES TO THE FINANCIAL STATEMENTS
City of BostonBasic Financial Statements → Fiscal Year Ended June 30, 2019
Financial Section → NOTES TO THE FINANCIAL STATEMENTS
A-60City of BostonBasic Financial Statements → Fiscal Year Ended June 30, 2019
Change in the Net OPEB Liability Total OPEB Plan Fiduciary Net OPEB Liability Net Position Liability
Balances at June 30, 2018 $2,874,860 $520,629 $2,354,231
Changes for the year:
Service cost 69,659 - 69,659
Interest 194,459 - 194,459
Differences between expected and actual experience 6,624 - 6,624
Contributions - employer - 176,018 (176,018)
Net investment income - 33,624 (33,624)
Benefit payments (136,018) (136,018) -
Administrative expenses - (4) 4
Net changes 134,724 73,620 61,104
Balances at June 30, 2019 $3,009,584 $594,249 $2,415,335
Sensitivity of the net OPEB liability to changes in the discount rate. The following presents the net pension liability of the City, calculated using the discount rates disclosed as well as what the City’s net pension liability would be if it were calculated using a discount rate that is 1-percentage point lower or 1-percentage point higher than the current rate as of June 30, 2019 (in thousands):
1% Decrease Current Discount
Rate 1% Increase
Net OPEB liability $2,835,237 $2,415,335 $2,070,930
Sensitivity of the net OPEB liability to changes in the healthcare cost trend rates. The following presents the net OPEB liability of the City, as well as what the City’s net OPEB liability would be if it were calculated using healthcare cost trend rates that are 1-percentage point lower or cost trend rates that are 1-percentage point higher than the current healthcare cost trend rates (in thousands):
1% Decrease Current Trend
Rates 1% Increase
Net OPEB liability $1,991,597 $2,415,335 $2,947,904
OPEB plan fiduciary net position
Detailed information about the OPEB plan’s fiduciary net position is available in the separately issued Plan financial report.
OPEB Expense and Deferred Outflows of Resources and Deferred Inflows of Resources Related to OPEB
For the year ended June 30, 2019 the City recognized OPEB expense of $226 million.
A-61
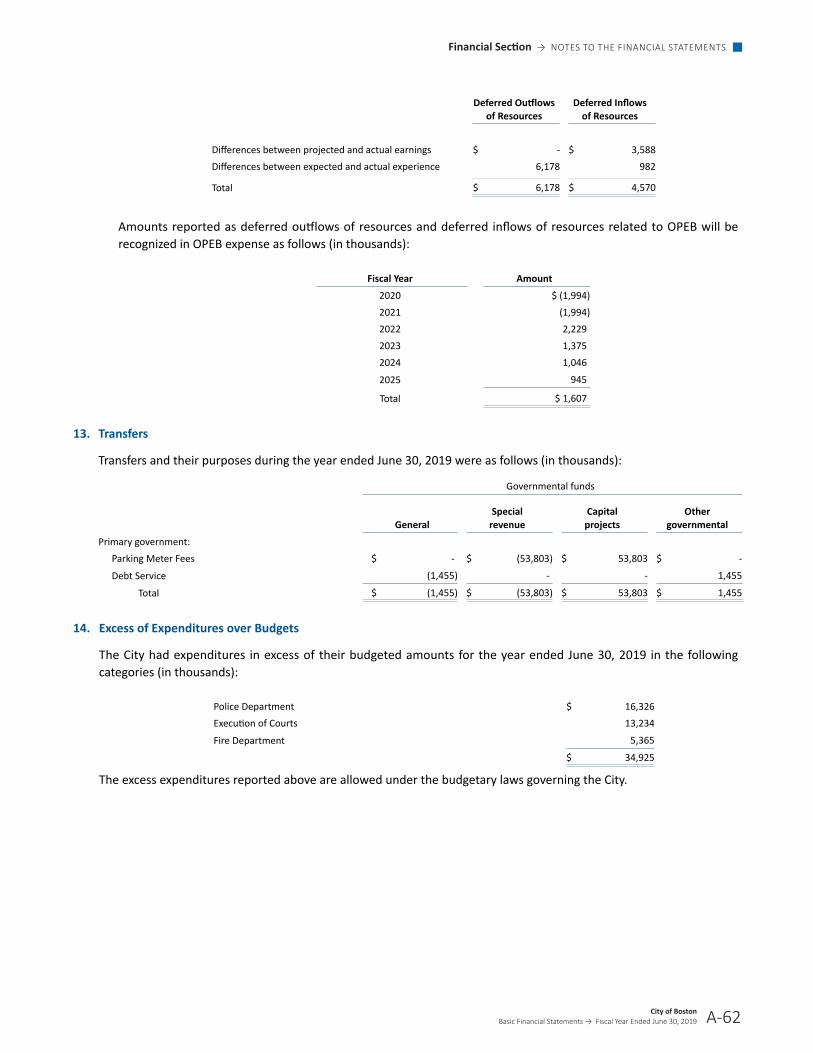
Financial Section → NOTES TO THE FINANCIAL STATEMENTS
City of BostonBasic Financial Statements → Fiscal Year Ended June 30, 2019
Financial Section → NOTES TO THE FINANCIAL STATEMENTS
City of BostonBasic Financial Statements → Fiscal Year Ended June 30, 2019A-61
Deferred Outflows
of Resources Deferred Inflows
of Resources Differences between projected and actual earnings $ - $ 3,588 Differences between expected and actual experience 6,178 982
Total $ 6,178 $ 4,570
Amounts reported as deferred outflows of resources and deferred inflows of resources related to OPEB will be recognized in OPEB expense as follows (in thousands):
Fiscal Year Amount 2020 $ (1,994) 2021 (1,994) 2022 2,229 2023 1,375 2024 1,046
2025 945 Total $ 1,607
13� Transfers
Transfers and their purposes during the year ended June 30, 2019 were as follows (in thousands):
Governmental funds
General Special
revenue Capital
projects Other
governmental
Primary government:
Parking Meter Fees $ - $ (53,803) $ 53,803 $ -
Debt Service (1,455) - - 1,455
Total $ (1,455) $ (53,803) $ 53,803 $ 1,455
14� Excess of Expenditures over Budgets
The City had expenditures in excess of their budgeted amounts for the year ended June 30, 2019 in the following categories (in thousands):
Police Department $ 16,326 Execution of Courts 13,234
Fire Department 5,365
$ 34,925
The excess expenditures reported above are allowed under the budgetary laws governing the City.
A-62

Financial Section → NOTES TO THE FINANCIAL STATEMENTS
City of BostonBasic Financial Statements → Fiscal Year Ended June 30, 2019
Financial Section → NOTES TO THE FINANCIAL STATEMENTS
A-62City of BostonBasic Financial Statements → Fiscal Year Ended June 30, 2019
15� Fund Balance Classification Details
The components of fund balance for the City’s governmental funds as of June 30, 2019 are as follows (in thousands):
Fund Balances: General Special
Revenue Capital
Projects
Other governmental
funds
Nonspendable
Permanent fund principal $ - $ - $ - $ 10,041
Subtotal - - - 10,041
Restricted for: Community Preservation Fund - 40,339 - - General government - - 15,929 2,844 Human services - - 1,487 - Police - - 21,309 - Fire - - 5,814 - Other public safety - - 10,602 - Public Works - - 98,434 - Property and Development - 24,066 40,889 36,530 Parks and recreation - - 46,437 43,219 Library - - 16,073 - Schools - - 17,503 13,418
Public health programs
Subtotal - 64,405 274,477 96,011
Assigned to: Property and development 9,240 - - - Catastrophic loss 26,072 - - - Housing initiative 34,275 - - - Debt service 7,162 - - - Employee Related Costs 150,479 - - - Designated for subsequent year budget 40,000 - - -
Designated for subsequent year expenditure 124,772 196,634 - -
Subtotal 392,000 196,634 - -
Unassigned 794,610 - - -
Total fund balances $ 1,186,610 $ 261,039 $ 274,477 $ 106,052
A-63

Financial Section → NOTES TO THE FINANCIAL STATEMENTS
City of BostonBasic Financial Statements → Fiscal Year Ended June 30, 2019
Financial Section → NOTES TO THE FINANCIAL STATEMENTS
City of BostonBasic Financial Statements → Fiscal Year Ended June 30, 2019A-63
16. Commitments and Contingencies
a. EncumbrancesThe City has assigned $124.8 million in encumbrances for purchase orders, contracts, and judgments and claims in the General Fund, $118.4 million in the Special Revenue Fund, $97.9 million in the Capital Projects Fund, and $500 thousand in Other Governmental Funds.
b. Infrastructure Investment Incentive Transactions Infrastructure Investment Incentive transactions (I-Cubed) are governed by Chapter 293 of the Acts of 2006 (the Act). Under the Act, the funding for the projects associated with these transactions is provided through proceeds of bonds issued by the Massachusetts Development Finance Agency (MDFA) and is to be used for approved public infrastructure improvements undertaken by the developer. The debt service on these bonds will be paid by the Commonwealth through State Infrastructure Development Assistance to the extent that New State Tax Revenues generated once the project is operational offset the amounts paid to MDFA to cover the debt service. When this is not the case, the participating municipality or developer generally will be responsible for the shortfall depending on the transaction agreement. The Act provides for the establishment of a Municipal Liquidity Reserve (MLR) from which the participating municipality can draw to offset any required payments made to the Commonwealth. The MLR is generally funded by the developer either through cash or a direct pay letter of credit.
During fiscal year 2015, the City executed two Infrastructure Development Assistance Agreements (IDAA) for I-Cubed transactions. Under the first IDAA, $32.4 million in bonds were issued by MDFA in September 2015. Also, an MLR of $1.2 million was established at the time of the issuance of the bonds. This reserve is equal to twice the maximum annual debt service payable in any fiscal year on the bonds issued under the indenture. The City is obligated for any shortfalls between debt service on the bonds and New State Tax Revenues. However, it has the right to assess the developer or draw from the MLR for any payments on such obligations. The City had no obligation for any shortfalls at June 30, 2019. The City also recorded $11.2 million in donated capital assets in fiscal year 2016 for improvements to City-owned infrastructure made by the developer. These assets have been recorded at acquisition value which has been defined as “the price that would be paid to acquire an asset with equivalent service potential in an orderly market transaction at the acquisition date.”
Under the second IDAA, $10.0 million in bonds were issued by MDFA in fiscal year 2016. The City is obligated for any shortfalls between debt service on the bonds and New State Tax Revenues. However, it has the right to assess the developer or draw from the MLR for one-third of any payments on such obligations. The City had no obligation for any shortfalls at June 30, 2019.
In connection with this second I-Cubed transaction, the City has a leasehold interest in a portion of the parking garage, which represents the public infrastructure improvements under the transaction, created under a master lease and its assignments and a sublease. With the execution of the master lease and sublease agreements, along with the assignment agreements transferring the interests of the owner of the parking garage to the City through the BPDA, the City essentially becomes the lessee on the master lease and the sub-landlord on the sublease. This results in the City having no responsibility for the operation of the parking garage and having the right to collect from the sub-lessee Section 121A PILOT payments from 2015 through 2036 and then base rent from 2036 through 2055, both of which are largely based on a percentage of gross revenues of the parking garage. The City has no obligation for any payments as lessee under the master lease�
During fiscal year 2019, the City executed an Infrastructure Development Assistance Agreements (IDAA) for an I-Cubed transaction. Under the IDAA, $30.0 million in bonds were issued by MDFA in June 2019. The City is obligated for any shortfalls between debt service on the bonds and New State Tax Revenues. However, it has the right to assess the developer or draw from the letter of credit for any payments on such obligations. The City had no obligation for any shortfalls at June 30, 2019.
A-64

Financial Section → NOTES TO THE FINANCIAL STATEMENTS
City of BostonBasic Financial Statements → Fiscal Year Ended June 30, 2019
Financial Section → NOTES TO THE FINANCIAL STATEMENTS
A-64City of BostonBasic Financial Statements → Fiscal Year Ended June 30, 2019
17. Public Health System
Effective July 1, 1996, the City’s Department of Health and Hospitals and Trustees of Health and Hospitals were abolished. Substantially all their assets and liabilities, including title to the City’s two hospitals, BCH and Boston Specialty and Rehabilitation Hospital (BSRH), were transferred to and assumed by BPHC.
Also effective July 1, 1996, the operations of BCH and BSRH were consolidated with the operations of the Boston University Medical Center under the licensure and control of the BMC.
The BPHC receives the majority of its funding from federal and state grants, and a City appropriation. During fiscal year 2019, the City appropriated $88.0 million to the BPHC. As described below, the BPHC uses the appropriation to pay debt service on certain general obligation bonds, for administrative purposes and to support the various public health programs run by the BPHC. The City has budgeted $93.4 million for the BPHC for fiscal year 2020.
Due from BPHC/BMC
The BPHC is also responsible for reimbursing the City for health insurance, equipment lease payments, workers’ compensation, and other miscellaneous expenses paid for by the City.
18. Risk Management
The Risk Management Program focuses on a planned strategy of self-insurance, supported by strong prevention and cost reduction efforts, financial reserves and catastrophic insurance. The City is self-insured in most areas of risk including general liability, property and casualty, workers’ compensation, certain employee health care costs and unemployment compensation.
The City’s legal liabilities are capped per M.G.L. Chapter 258, and Corporation Counsel defends the City in any lawsuits that arise from the normal course of operations. For workers’ compensation, the City is exempt from state insurance requirements per M.G.L. Chapter 152 Section 25B. The City’s Workers’ Compensation Division as well as the Police and Fire Departments manage employee injury claims internally. The City budgets for and funds legal claims and employee injury costs through the General Fund, charging specific departments for their share of costs in order to promote awareness and prevention efforts.
The City provides health insurance coverage for employees and retirees through a variety of self-insured plans. The City budgets for and funds the premium costs for all plans through the General Fund. Self-insured plans are financially managed through the Internal Service Fund established in compliance with M.G.L. Chapter 32B, Section 3A. The guiding policy for the City of Boston Health Claims Trust Fund states that accounting for the fund will be in accordance with generally accepted accounting principles, and will ensure that all contributions and actual costs are shared between employers and their subscribers according to predetermined ratios.
For unexpected large losses, the City maintains a catastrophic risk reserve, which has an available balance of $41.7 million at the end of fiscal 2019. To further protect the City’s assets and finances from adverse loss, commercial insurance is purchased strategically for certain exposures. A catastrophic property insurance policy provides $100.0 million for all risk protection after a $10.0 million deductible. Boiler and machinery losses are insured up to $25.0 million per incident, after a $50 thousand deductible.
The City has established a liability based on historical trends of previous years and attorneys’ estimates of pending matters and lawsuits in which the City is involved. Changes in the self-insurance liability for the fiscal years ended June 30, 2019 and 2018 are as follows (in thousands):
Internal service fund
2019 2018 Health and life claims, beginning of year $ 19,890 $ 23,881 Incurred claims 288,484 222,090
Payments of claims attributable to events of both the current and prior fiscal years:
Health and life (281,239) (226,081) Health and life claims, end of year $ 27,135 $ 19,890
A-65

Financial Section → NOTES TO THE FINANCIAL STATEMENTS
City of BostonBasic Financial Statements → Fiscal Year Ended June 30, 2019
Financial Section → NOTES TO THE FINANCIAL STATEMENTS
City of BostonBasic Financial Statements → Fiscal Year Ended June 30, 2019A-65
Government-wide statements
2019 2018 Judgments and claims, beginning of year $ 192,390 $ 189,261 Incurred claims 76,950 24,703
Payments of claims attributable to events of both the current and prior fiscal years:
Workers’ compensation (46,567) (13,874)
Court judgments (7,700) (7,700) Judgments and claims, end of year $ 215,073 $ 192,390
The liabilities above have not been discounted to their present value. Incurred claims represent the total of a provision for events of the current fiscal year and any change in the provision for events of the prior fiscal years.
There are numerous pending matters and lawsuits in which the City is involved. The City attorneys’ estimate that the potential claims against the City not recorded in the accompanying basic financial statements resulting from such litigation would not materially affect the basic financial statements.
19. Dudley Square Realty Corporation (DSRC) and Ferdinand Building Development Corporation (FBDC)
As described in note 1, the DSRC is a Qualified Active Low-Income Community Business, and is the owner and developer of the Dudley Municipal Center property. FBDC is the leverage lender of the Dudley Municipal Center property. As the project sponsor during fiscal year 2013, the City authorized and issued $28.9 million in general obligation bonds and transferred proceeds to FBDC. FBDC, utilizing these bond proceeds, made loans totaling $29.3 million to two investment funds. As of June 30, 2019, $29.3 million is due to FBDC on such loans. The investment funds made these proceeds and funds from additional investments available to eight leverage lenders that made loans in the aggregate amount of $40.8 million to DSRC to finance the Dudley Municipal Center project. This amount is recorded in the City’s Notes and Leases Payable line of note 10. With the completion of the Dudley Municipal Center project, FBDC is the master tenant and leases the project from DSRC.
FBDC subleases the majority of space of the project to the City. The schedule of payments is the same in the lease and the sublease as follows (in thousands):
Year(s) ending June 30: Lease payments 2020 $ 638 2021 638 2022 638 2023 1,334 2024 2,030 2025-2029 10,150 2030-2034 10,150 2035-2039 10,150 2040-2044 10,150
2045-2048 7,105 Total $ 52,983
The Board of Directors and City of Boston have arranged the leveraged loans to be paid via the assignment of the notes and cancellation of the indebtedness based on the ending compliance period of the New Market Tax Credits (“NMTC”) received by the City to operate as a qualified active low-income business (“QALICB”). The unwind of the NMTC is scheduled for fiscal year 2020�
A-66

Financial Section → NOTES TO THE FINANCIAL STATEMENTS
City of BostonBasic Financial Statements → Fiscal Year Ended June 30, 2019
Financial Section → NOTES TO THE FINANCIAL STATEMENTS
A-66City of BostonBasic Financial Statements → Fiscal Year Ended June 30, 2019
20� Discretely Presented Component Units
The following presents condensed financial statements for each of the discretely presented component units:
Condensed Statements of Net Position June 30, 2019 (In thousands)
BPHC BPDA TPL EDIC Total Assets: Current assets: Cash and investments $ 37,200 $ 42,015 $ 7,160 $ 22,845 $ 109,220 Cash and investments held by trustee - - 14,636 - 14,636 Receivables, net: Other 21,518 9,017 2,709 6,146 39,390 Other assets 463 176 6 4,579 5,224 Due from primary government 4,712 - - - 4,712 Total current assets 63,893 51,208 24,511 33,570 173,182 Noncurrent assets: Cash and investments held by trustee - - 63,043 - 63,043 Notes receivable 44,332 117,907 963 - 163,202 Capital assets: Nondepreciable 11,793 5,988 - 4,022 21,803 Depreciable 13,590 15,902 149 37,054 66,695 Total noncurrent assets 69,715 139,797 64,155 41,076 314,743 Total assets 133,608 191,005 88,666 74,646 487,925 Deferred outflows of resources: Deferred amount for pension costs 40,824 5,156 - - 45,980
Deferred amount for other postemployment benefits costs 6,995 1,887 - - 8,882
Total deferred outflows of resources $ 47,819 $ 7,043 $ - $ - $ 54,862
Liabilities: Current liabilities:
Warrants and accounts payable 20,803 3,360 1,101 3,685 28,949
Accrued liabilities: Other 1,065 161 1,509 1,612 4,347
Current portion of long-term debt and leases 1,930 - - 835 2,765
Due to primary government 229 - 319 - 548 Unearned revenue 1,974 1,066 - 670 3,710
Total current liabilities 26,001 4,587 2,929 6,802 40,319
Noncurrent liabilities:
Bonds notes and leases due in more than one year 3,548 1,475 - 9,754 14,777
Other noncurrent liabilities 1,575 133,047 - 1,167 135,789 Other postemployment benefits 130,494 14,363 - - 144,857 Unearned revenue 45,323 19,853 - - 65,176 Net pension liability 146,140 19,083 - - 165,223 Due to primary government - 3,435 - - 3,435
Total noncurrent liabilities 327,080 191,256 - 10,921 529,257
Total liabilities 353,081 195,843 2,929 17,723 569,576 Deferred inflows of resources: Deferred amount for pension costs 23,616 3,296 - - 26,912
Deferred amount for other postemployment benefits costs 17,019 15,567 - - 32,586
Total deferred inflows of resources 40,635 18,863 - - 59,498 Net position: Net investment in capital assets 19,905 18,874 149 30,487 69,415 Restricted - - 77,516 704 78,220 Unrestricted (232,194) (35,532) 8,072 25,732 (233,922) Total net position $ (212,289) $ (16,658) $ 85,737 $ 56,923 $ (86,287)
A-67

Financial Section → NOTES TO THE FINANCIAL STATEMENTS
City of BostonBasic Financial Statements → Fiscal Year Ended June 30, 2019
Financial Section → NOTES TO THE FINANCIAL STATEMENTS
City of BostonBasic Financial Statements → Fiscal Year Ended June 30, 2019A-67
Condensed Statements of Revenues, Expenses, and Changes in Net Position
Year ended June 30, 2019
(in thousands)
BPHC BPDA TPL EDIC Total
Expenses $ 181,325 $ 26,437 $ 10,984 $ 32,356 $ 251,102
Program revenues:
Charges for services 42,284 11,316 3,297 33,614 90,511
Operating grants and contributions 41,884 11,266 13,501 12,364 79,015
Capital grants and contributions 1,575 - - - 1,575
Total program revenues 85,743 22,582 16,798 45,978 171,101
Net program revenues (expenses) (95,582) (3,855) 5,814 13,622 (80,001)
General revenues:
Investment income 508 294 172 - 974
Sale of property 17 15,354 - - 15,371
City appropriation 88,759 - - - 88,759
Miscellaneous income 546 - 1,466 746 2,758
Total general revenues 89,830 15,648 1,638 746 107,862
Change in net position (5,752) 11,793 7,452 14,368 27,861
Net position - beginning of year, restated (206,537) (28,451) 78,285 42,555 (114,148)
Net position - end of year $ (212,289) $ (16,658) $ 85,737 $ 56,923 $ (86,287)
A-68

City of BostonBasic Financial Statements → Fiscal Year Ended June 30, 2019
Financial Section → REQUIRED SUPPLEMENTARY INFORMATION Financial Section → REQUIRED SUPPLEMENTARY INFORMATION
See accompanying independent auditors’ report
A-68City of BostonBasic Financial Statements → Fiscal Year Ended June 30, 2019
Required Supplementary Information(Unaudited)
Schedule of OPEB Contributions - OPEB(Amounts in thousands)
2019 2018 2017
Actuarially determined contribution $ 199,400 $ 190,991 $ 167,787Contributions in relation to the actuarially determined contribution 176,018 159,966 157,464
Contribution surplus (deficiency) (23,382) (31,025) (10,323)
Covered payroll $ 1,696,838 $ 1,611,911 $ 1,582,695
Contributions as a percentage of covered payroll 10.37% 9.92% 9.95%
Note: Information provided for Required Supplementary Information will be provided for 10 years as it becomes available.
Notes to Schedule: Valuation date: Actuarially determined contributions are calculated as of June 30, two years prior to the end of the fiscal year in which the contributions are reported. That is, the contribution for June 30, 2019 was determined with the June 30, 2017 actuarial valuation.Methods and assumptions used to determine contribution rates:Actuarial cost method: Entry Age Normal Amortization method: Payments increasing at 3.25% per year Remaining amortization: 27 years as of July 1, 2018 Asset valuation method: Market Value Inflation: 3.25%
Health care trend rates: Non-Medicare costs 7% initial, decreasing 0.5% annually to an ultimate of 4.5%
Medicare costs - 7% initial, decreasing 0.5% annually to an ultimate of 4.5%
Medicare Part B premiums - 4.5%Salary increases: Non-teachers - 4% to 4.5%; Teachers 4% to 7.5%Investment return: 6.75%
Mortality: RP-2014 generational table using Scale MP-2017 for non-teachers and MP-2016 for teachers applied on a gender-specific basis.
A-69

Financial Section → REQUIRED SUPPLEMENTARY INFORMATION
City of BostonBasic Financial Statements → Fiscal Year Ended June 30, 2019
City of BostonBasic Financial Statements → Fiscal Year Ended June 30, 2019
Financial Section → REQUIRED SUPPLEMENTARY INFORMATION
See accompanying independent auditors’ report
A-69
Schedule of Changes in Net OPEB Liability and Related RatiosJune 30, 2019
(Amounts in thousands)Total OPEB Liability
2019 2018 2017
Service Cost $ 69,659 $ 67,365 $ 65,146Interest 194,459 185,615 177,157Differences between expected and actual experience 6,624 700 (1,717)
Benefit payments, including refunds of employee contributions (136,018) (119,966) (117,464)
Net Change in total OPEB liability 134,724 133,714 123,122
Total OPEB liability - beginning 2,874,860 2,741,146 2,618,024
Total OPEB liability - ending 3,009,584 2,874,860 2,741,146
Plan Fiduciary Net Position Contributions - employers 176,018 159,966 157,464Net investment income, net 33,624 27,656 47,156Benefit payments, including refunds of employee contributions (136,018) (119,966) (117,464)
Administrative expenses (4) (12) (5)
Net change in plan fiduciary net position 73,620 67,644 87,151
Plan fiduciary net position - beginning 520,629 452,986 365,835
Plan fiduciary net position - ending 594,249 520,630 452,986
Net OPEB liability $ 2,415,335 $ 2,354,230 $ 2,288,160
Plan fiduciary net position as a percentage of the total OPEB Liability 19.75% 18.11% 16.53%
Net OPEB liability as a percentage of the total covered payroll 142.34% 146.05% 144.57%Covered payroll 1,696,838 1,611,911 1,582,695
Notes: Information provided for Required Supplementary Information will be provided for 10 years as it becomes available.
Notes to Schedule: Benefit Changes: None Changes in assumptions: None
A-70

City of BostonBasic Financial Statements → Fiscal Year Ended June 30, 2019
Financial Section → REQUIRED SUPPLEMENTARY INFORMATION Financial Section → REQUIRED SUPPLEMENTARY INFORMATION
See accompanying independent auditors’ report
A-70City of BostonBasic Financial Statements → Fiscal Year Ended June 30, 2019
Schedule of City’s Proportionate Share of the Net Pension Liability - Boston Retirement System(Amounts in millions)
2019 2018 2017 2016
City’s proportion of the net pension liability 36.31% 32.04% 35.66% 36.78%
City’s proportionate share of the net pension liability $ 1,665 $ 1,288 $ 1,484 $ 1,622
Commonwealth’s proportionate share of net pension liability associated with the City
2,451 2,451 2,345 2,426
Total $ 4,116 $ 3,739 $ 3,829 $ 4,048
City’s covered payroll (for the period ended on the measurement date December 31, 2018, 2017, and 2016)
$ 1,609 $ 1,547 $ 1,475 $ 1,475
City’s proportionate share of the net pension liability as a percentage of covered payroll
103.48% 83.26% 100.61% 109.97%
BRS fiduciary net position as a percentage of the total pension liability
58.27% 62.73% 58.44% 55.76%
Note: Schedule is intended to show information for ten years. Historical information prior to the implementation of GASB Statement No. 68 is not required if the information is not available. Additional years will be displayed as they become available.
Schedule of City’s Contributions - Boston Retirement System (Amounts in millions)
2019 2018 2017 2016
Actuarially determined contribution $ 234 $ 214 $ 193 $ 179
Contributions in relation to the actuarially determined contribution
234 214 193
179
Contribution surplus (deficiency) $ - $ - $ -
Covered payroll (for the fiscal year ended June 30, 2018, 2017 and 2016)
$ 1,609 $ 1,542 $ 1,467
$ 1,467
Contributions as a percentage of covered payroll 14.54% 13.88% 13.16% 12.20%
Note: Schedule is intended to show information for ten years. Historical information prior to the implementation of GASB Statement No. 68 is not required if the information is not available. Additional years will be displayed as they become available.
A-71