baseline measurement and analysis of uk ozone and uv
TRANSCRIPT

Baseline Measurement and Analysis of UK Ozone and UV Annual 2014 Report
Report for Defra
Ricardo-AEA/R/3435 ED45367 Issue Number 1 Date 30/09/2015

Baseline Measurement and Analysis of UK Ozone and UV
Customer: Contact:
Defra Paul Willis Ricardo-AEA Ltd Gemini Building, Harwell, Didcot, OX11 0QR t: 01235 753639 e: [email protected] Ricardo-AEA is certificated to ISO9001 and ISO14001
Customer reference:
GA 01089
Confidentiality, copyright & reproduction:
This report is the Copyright of Defra and has been prepared by Ricardo-AEA Technology Ltd under contract to Defra dated 15/10/2010. The contents of this report may not be reproduced in whole or in part, nor passed to any organisation or person without the specific prior written permission of Defra. Ricardo-AEA Ltd accepts no liability whatsoever to any third party for any loss or damage arising from any interpretation or use of the information contained in this report, or reliance on any views expressed therein.
Author:
Ian Roberts, Daniel Brookes, Ralf Toumi, John Rimmer, Andrew RD Smedley, Ann Webb, David Moore.
Approved By:
Paul Willis
Date:
30 September 2015
Signed:
Ricardo-AEA reference:
ID: Ricardo-AEA/R/3435 Ref: ED45367- Issue Number 1
Ref: AEA/ED45367/Issue Number 1 ii
Baseline Measurement and Analysis of UK Ozone and UV
Executive summary As part of the UK commitment to the Vienna Convention to Protect the Ozone Layer, the Department for Environment, Food and Rural Affairs (Defra) has supported the ground-based monitoring of column ozone at two UK sites over many years. Ozone measurements are made on a daily basis at Lerwick by the Met Office using Dobson ozone spectrophotometers, with an historical record going back to 1957 at this location. The Department has also supported the University of Manchester in making automated Brewer ozone measurements at Reading since 2003, and spectrally resolved UV measurements at Reading since 1993. The UV radiation measurements are primarily made to assess human exposure and are more local in their relevance given the sensitivity to factors such as tropospheric air pollution, cloud cover, etc.
In the present contract, awarded to a project team led by Ricardo-AEA, the Ozone and UV monitoring activities are combined under one programme with the following commitments in place:
• Continuation of the Dobson Ozone Monitoring Programme at Lerwick: There is an overwhelming case to continue the ozone measurements made at Lerwick because of the proximity of this station to the Arctic polar vortex region where significant ozone depletion has been observed, and its long-term historical data record. It provides one of the key worldwide data sets.
• Continuation of UV Measurements at Reading: The Reading dataset, which started in 1993, provides the longest time series of such measurements in the UK. The Reading measurements are considered to be an essential part of any future UK monitoring programme.
• Brewer Ozone monitoring at Reading: The state-of-the-art ozone monitoring at Reading using a Brewer spectrophotometer is co-located with the existing UV spectrometer. This allows high frequency automated measurements, which, when combined with the UV data, provide additional insight into the factors controlling column ozone and surface UV levels. Reading acts as the southern UK monitoring site, providing representative data for an area of high population density.
The current contract commenced on 16th October 2010 and will be completed on 15th October 2015. The project team comprises Ricardo-AEA, the University of Manchester, the University of Reading, Imperial College and the Met Office. This annual report covers the project activities for the period 1st October 2013 – 30th September 2014 and describes the work carried on the data processing, reporting and analysis of the measurements made.
The key activities and results during the reporting period were:
• The Reading and Lerwick sites remained fully operational. High quality, reliable results were made with a Dobson spectrophotometer at Lerwick, and with the automated Brewer ozone spectrometer and UV spectrometer at Reading. Staff at the Met Office Lerwick Observatory and the University of Manchester respectively carried out initial data checks, ensuring conformance with WMO best practice. Data transfer systems have been developed to enable Ricardo-AEA to carry out the quality assurance and reporting of ozone data from Lerwick and both ozone and UV data from Reading.
• The on-going reporting of the daily-averaged ozone values determined at the Reading and Lerwick sites, and the Reading Spectral UV data, continued to a number of different organisations, including world data centres. The reporting of the ozone measurements fulfils part of the UK commitments under the Vienna Convention.
Ref: AEA/ED45367/Issue Number 1 ii

Baseline Measurement and Analysis of UK Ozone and UV
• Trends Analysis of the Measurements suggests that the long-term decline in column ozone over the UK has not yet been reversed. The long-term (since 1978) autumn decline at Lerwick is statistically significant for single and multiple regression. It is difficult to explain enhanced ozone loss prior to the cold season of polar stratospheric cloud formation. However, the principal component analysis confirms that the most likely cause of the autumn trend is tropospheric circulation changes. Trends analysis of the short Reading time series shows an annual mean increase which is not statistically significant.
Ref: AEA/ED45367/Issue Number 1 iii

Baseline Measurement and Analysis of UK Ozone and UV
Table of contents 1 Introduction ................................................................................................................ 1
2 Project Aims and Objectives ..................................................................................... 2 2.1 Background ........................................................................................................ 2
3 Data Measurement, Processing & Reporting ........................................................... 4 3.1 Dobson Ozone Measurements ........................................................................... 4 3.2 Reading Ozone and UV Measurements ............................................................. 8 3.3 Manchester Measurements (not formally part of the contract) ...........................14 3.4 Manchester FTP ...............................................................................................15 3.5 Ozone Data Reporting ......................................................................................15 3.6 Aberwyswyth Site (not formally part of the contract) ..........................................16
4 Data Analysis .............................................................................................................17 4.1 Summary ..........................................................................................................17 4.2 The new statistical model ..................................................................................17 4.3 Routine Trends Analysis ...................................................................................19 4.4 Events ...............................................................................................................22 4.5 Stratospheric Ozone and Human Health ...........................................................25 4.6 Conclusions and Future work ............................................................................26
5 Project Information & Dissemination .......................................................................27 5.1 Web Site ...........................................................................................................27 5.2 Literature Review ..............................................................................................30
6 Other Project Activities .............................................................................................32
Ref: AEA/ED45367/Issue Number 1 iv

Baseline Measurement and Analysis of UK Ozone and UV
1 Introduction The Department for Environment, Food and Rural Affairs (Defra) has let a contract for the Baseline Measurement and Analysis of UK Ozone and UV to a project team led by Ricardo-AEA. The other members of the project team are the Met Office, the University of Manchester, the University of Reading and Imperial College. Each has specific individual responsibilities for the monitoring, reporting or analysis of stratospheric ozone and UV as illustrated in Figure 1 below.
Figure 1 Project team roles
The current contract runs from the 16th October 2010 to 30th September 2015. This annual report covers the period 1st October 2013 to 30th September 2014
Lerwick Ozone Observations
Met Office
Lerwick Ozone Data Screening
Met Office
Lerwick Ozone Calibration Met Office
Ozone and UV Measurement
Database
Website
Data Analysis
e - mail to Defra and other
stakeholders
Ozone & UV Imperial College
Ozone & UV Manchester
Low O 3 Events Imperial College
Dobson Instrument
Intercomparison
Satellite and Other Ozone
Measurements
Reading Ozone Observations Manchester
Reading Ozone Calibration Manchester
Reading Ozone Data Screening
Manchester
Brewer Instrument
Intercomparison
Reading UV Observations Manchester
Reading UV Data Screening
Manchester
Reading UV Calibration Manchester
UV Instrument
Intercomparison
International Data Centres
daily via ftp site
daily/weekly via ftp site daily via e - mail
updated daily daily/monthly
weekly
Lerwick Ozone Observations
Met Office
Lerwick Ozone Data Screening
Met Office
Lerwick Ozone Calibration Met Office
Ozone and UV Measurement
Database RICARDO-AEA
Website RICARDO-AEA
Data Analysis
e - mail to Defra and other
stakeholders
Ozone & UV Imperial College
Ozone & UV Manchester
Low O 3 Events Imperial College
Dobson Instrument
Intercomparison
Satellite and Other Ozone
Measurements
Reading Ozone Observations Manchester
Reading Ozone Calibration Manchester
Reading Ozone Data Screening
Manchester
Brewer Instrument
Intercomparison
Reading UV Observations Manchester
Reading UV Data Screening
Manchester
Reading UV Calibration Manchester
UV Instrument
Intercomparison
International Data Centres
daily via ftp site
daily/weekly via ftp site daily via e - mail
updated daily daily/monthly
weekly
Ref: AEA/ED45367/Issue Number 1 1

Baseline Measurement and Analysis of UK Ozone and UV
2 Project Aims and Objectives 2.1 Background The current monitoring programme runs from the 16th October 2010 to 30th September 2015. It has recently been independently reviewed1 and continues operation with:
• Daily measurements of total column ozone at Lerwick using Dobson spectrophotometers (1957-present)
• Automated measurements of total column ozone at Reading using a Brewer instrument (2003-present)
• Spectral UV measurements at Reading (1993-present, co-located with the Brewer instrument).
The locations of these and the other measurement sites for ozone and UV in the UK and the Republic of Ireland are shown in Figure 2, taken from the project information on the UK-AIR website2.
Figure 2 Location of Defra and Other Ozone and UV Monitoring Sites.
The contract is held by a project team led by Ricardo-AEA. The project team also includes the Met Office, the University of Manchester, the University of Reading and Imperial College.
The main driver for the monitoring programme is the 1985 Vienna Convention on the Protection of the Ozone Layer. The Vienna Convention obliges parties (including the UK) to undertake various activities, including inter alia monitoring, data dissemination and information exchange, in accordance with their capabilities and the means at their disposal.
1 Hayman G.D. & Monks P. Review of the monitoring programme: Baseline Measurement and Analysis of UK Ozone and UV. Available from the Defra website, at http://randd.defra.gov.uk/Document.aspx?Document=AQ0925_9335_FRP.pdf 2 http://uk-air.defra.gov.uk/research/ozone-uv/
Ref: AEA/ED45367/Issue Number 1 2

Baseline Measurement and Analysis of UK Ozone and UV
Ref: AEA/ED45367/Issue Number 1 3

Baseline Measurement and Analysis of UK Ozone and UV
3 Data Measurement, Processing & Reporting
The Met Office determines column ozone amounts at Lerwick using a Dobson ozone spectrophotometer. The University of Manchester makes ozone measurements at Reading using a Brewer spectrophotometer, together with spectral UV measurements using a Bentham spectroradiometer. The University of Reading provides local support for the Reading monitoring activities. In accordance with WMO recommended best practise, the instrument operators carry out the initial data processing and quality checks, before forwarding the results to Ricardo-AEA for collation, analysis and final reporting.
3.1 Dobson Ozone Measurements 3.1.1 Site Operations at Lerwick Bi-annual visits continue to be made to Lerwick to inspect the instruments, perform maintenance tasks, update ISO9000 documentation, train staff, and if possible conduct intercomparisons.
Standard and Mercury lamp tests have continued throughout the period with both instruments performing satisfactorily.
As usual measurements ceased on 25th November for the year due to the low solar angle and subsequently recommenced on 17th January.
Focussed sun measurements have been made where conditions allowed according to the revised schedule, so that the data reduction polynomials can be reviewed and updated as necessary.
3.1.1.1 Standard and Mercury Lamp Tests One of the standard lamps failed on Dobson 32 and a replacement was provided by the Regional Dobson Calibration Centre at Hohenpeissenberg. Fortunately it was not the main lamp but there is redundancy in the process through using two standard lamps other than the main one to monitor the instrument’s performance.
3.1.1.2 Dobson 35 Operational availability Since the last annual update Dobson 35 has remained on loan to the South African Weather Service. It has been reported that it is working well at Irene since last year. Dobson 89 has been periodically troublesome and with Dobson 35 excellent daily observations have been made. In the near future the instrument will be returning to Stellenbosch/Cape Point.
There is hope for an African intercomparison to be made in September 2015 at Irene. It has been reported that Dobson 35 motor and casing needs a little maintenance that will hopefully be undertaken at the comparison. The operator is also planning to upgrade the instrument with a Digital Optical decoder.
3.1.2 Polynomial Reassessment Measurements A revised Dobson observation schedule has been written for Lerwick to supplement the existing measurements so that, in due course, the existing cloudy polynomials could be reviewed and updated, after enough data has been gathered. Focussed sun measurements have continued to be made where conditions have allowed according to the revised
Ref: AEA/ED45367/Issue Number 1 4
Baseline Measurement and Analysis of UK Ozone and UV schedule. These are basically direct sun measurements with the ground quartz plate diffuser removed which provides a smaller but brighter image of the sun inside the instrument, thus enabling the instrument to be used at lower sun angles. This enables more time coincident direct sun and zenith measurements to be made as direct sun measurements cannot normally be made at such a low sun angle as zenith measurements.
It should be noted that the focussed sun measurements are not as easy to make as direct sun. Because more light enters the instrument care is required to not overload the photomultiplier. These measurements are also noisier than direct sun measurements and will not therefore be used to provide the routine ozone value for the day.
An initial analysis of the additional Dobson 32 measurements has been undertaken and a report produced for Defra to review. It concludes that the performance of the polynomials cannot be significantly improved by adjustment and on this basis the quality of recent historical data is therefore not in any doubt. A decision on the requirement for the reassessment of polynomials for instrument 41 is still under consideration.
3.1.3 Dobson Intercomparison at Hohenpeissenberg June 2014 David Moore (Met Office) visited Lerwick on 16th May 2014 to pick up Dobson 41 prior to its intercomparison with the regional standard Dobson No 64 at Hohenpeissenberg in Southern Bavaria. Both Dobson instruments were inspected at Lerwick and an intercomparison was conducted using DSAD wavelength pairs only, due to the weather conditions. Results over a Mu range of 1.9 to 1.33 were (Dob 41-Dob32)DSAD = +0.3%
It was noted that the motor on Dobson 41 was noisy, the Q1 lever drooped 0.1 at the A wavelength setting, and the time series of both Hg and standard lamp test readings tended be noisier than Dobson 32 though this was not reflected in the actual measurements.
Dobson 41 was then driven to Hohenpeissenberg for the intercomparison. The intercomparison took place with 9 staff from Germany, France, Poland and Russia.
An initial intercomparison had to wait until 6th June due to the weather conditions. The result was that Dobson 41 had a Mu roll off in the AD wavelength pair that had worsened since the last intercomparison in 2009, where it was not significant. Results over the Mu range 1.15 < Mu > 3.2 for ADDS measurements and 2.5 < Mu > 3.2 for CDDS measurements were:-
(Dob64-Dob41)ADDS= +0.6%
(Dob64-Dob41)CDDS = +3.2%
Past AD measurements therefore did not need re-evaluation. Assuming a linear drift since the last intercomparison in June 2009, CD measurements require approximately +1.5% adjustment since Dobson 41 was last used as the operational instrument on 3rd Oct 2011. The adjustment is approximately +1.5% not 3.2% as its last use was roughly half-way through the 5 year intercomparison period.
The most important work on the Dobson at the intercomparison is detailed below. Many lamp tests were also conducted and some other tests were conducted several times.
The droop of the Q1 lever was found to have disappeared and no further work on it was attempted.
Ulf Koehler, in charge of the intercomparison, was asked about the noise in the lamp data compared with Dobson 32 and he could not suggest any reason apart from saying that all Dobsons were different.
The Mu dependence was investigated and found to be caused by an optical degrading of one of the wedges. Diagonal lines could be seen inside the quartz. It was decided to replace this wedge which then required re-alignment of prism P1 and mirror M1, accompanied by a new wedge calibration. This was a difficult task. A wedge calibration takes up to 4 days continuous work, usually with 2 people, where available.
Ref: AEA/ED45367/Issue Number 1 5

Baseline Measurement and Analysis of UK Ozone and UV The photomultiplier alignment was checked and found to be satisfactory. The motor drive band required replacement, with 2 spares also put in place and the main body seal was also renewed. The standard lamp power supply lead was also replaced as a precaution as the plug connections were worn. The optics were cleaned as were the sun director's internal optics, after dismantling the sun director. The final optical alignment was checked and found to be satisfactory and within limits.
A spectral lamp test was conducted and new Q tables were produced.
The final intercomparison took place 9th June with both AD and CD wavelengths agreeing with Dobson 64 well within 1% with the Mu dependence removed.
The Dobson was returned to Lerwick on 21st June and when the optical alignment was again checked, it was found that there had been a small optical shift. After consulting with experts in Boulder, the Czech Republic and finally with Hohenpeissenberg, it was agreed that it was most likely that one of the mirrors had moved very slightly on its spring loaded mount but the movement was very minor and would not affect the intercomparison. Although an adjustment could have been made it, as has been done before, it was decided to leave things as they were.
The new motor drive band was smoothed at the joint and this was found to make the motor run more quietly.
An intercomparison took place in very good conditions on 24th June with a few readings in the morning due to cloud and 21 readings in the afternoon over a Mu range of 1.26 to 2.44, unfortunately just short of the valid CD range when cloud encroached. Results were:-
(Dob41-Dob32) = -0.4%
Results suggest that Dobson 32 was also in good shape at AD wavelengths with no obvious Mu roll off.
The Dobson room has better temperature regulation than in the old building, therefore the instrument has needed fewer adjustments for temperature changes. This is an advantage as it is not a straightforward adjustment to make.
The Met Office are still awaiting the final report on the intercomparison from Hohenpeissenberg, as they have been very busy since it took place, but it has been promised in due course.
3.1.4 Dobson Data Reassessment Ricado-AEA reported in the July 2014 quarterly report that the data reassessment of the Lerwick and Camborne data was carried out where possible and the draft report has been passed to Defra for comment.
The data were reviewed and assessed according to the WMO guidelines and the reprocess was completed by the end of March 2014.
Once the methodology and report have been agreed the corrected data can be re-uploaded to the long-term historical record.
3.1.5 Measurement Summary Figure 3 and Figure 4 show the comparison of daily Lerwick column ozone values with measurements from the OMI satellite-based instrument during this reporting period. There appears to be generally good agreement between ground-based measurements at Lerwick and the OMI satellite data.
Ref: AEA/ED45367/Issue Number 1 6

Baseline Measurement and Analysis of UK Ozone and UV
Figure 3 Lerwick vs OMI October 2013 to September 2014
Figure 4 Lerwick Best Daily vs OMI Overpass 01/10/2013 - 30/09/2014
Ref: AEA/ED45367/Issue Number 1 7

Baseline Measurement and Analysis of UK Ozone and UV
3.2 Reading Ozone and UV Measurements 3.2.1 Ozone Measurements Brewer
Ozone measurements at Reading have continued largely unperturbed during this reporting period. However there have been a number of minor stoppages (usually fixed the following morning) due to an issue with the azimuth drive. No obvious solution to these stoppages was evident at a site visit, but closer inspection of the data series traced the issue to the timing of a steps-per-revolution check that runs weekly. This test is embedded within the data acquisition software, but also run each night according to the set schedule to enable a higher frequency check on this diagnostic. The cause of the error was found to be dependent on the exact positioning of the tracker when the weekly test began (i.e. its location with respect to the azimuth datum). As this cannot be altered (it is part of the end of day summary routines) the relevant routine has been adapted to remove the weekly instance of test. The daily steps-per-revolution checks remain in the schedule, and since making this adjustment we have not observed a reoccurrence of the problem.
The calibration check on arrival at the RBCC-E intercomparison and calibration exercise at El Arenosillo during 2013 revealed that Brewer #75 had been exceptionally stable since the calibration in 2011. After calibration the instrument returned to the UK and was re-installed at its rooftop location on 25 June 2013 and has continued to record data according to its normal monitoring schedule since that date. We have since received the calibration report from IOS and the data has now been reprocessed in light of this. This entails applying interpolated calibration constants for the 2011 to 2013 inter-calibration period, and also updating the current constants to those from the 2013 calibration. In terms of the retrieved total column ozone amounts we see a slight downward shift when applying the new calibration constants of up to 1.3% for data between 2011 and 2013, with data after the 2013 calibration being shifted by between approximately 0.8 to 2.1%. Overall the r.m.s difference using the new constants is 0.88%.
For both Reading and Manchester instruments, the standard lamp corrected data is currently marked as v4.2 for WOUDC purposes, indicating that the 2013 calibration is being used, but that there have been no major changes in reprocessing or analysis method. The raw bfiles for Brewer #075 during the period that it is sited in Reading have been submitted as usual to the WOUDC by the University of Manchester team and in addition the reprocessed WOUDC format data files from the 2011 calibration onward have also been resubmitted.
At the 2011 project meeting, it was recognised that Brewer vertical profile umkehr measurements would be an important addition to the monitoring program by more fully complying with Annex 1, section 2.d.(i) of the VC Handbook 2012. During the 2012 project meeting the University of Manchester was given the go-ahead to implement umkehr measurements into the schedule. A new schedule was written and installed on the instrument during December 2012 with the majority of the umkehr measurements scheduled for the highest solar zenith angles. This ensures that there is minimal effect on the daily average of total ozone column. (The number of attempted measurements in the ozocor and ozoavg files, however, has altered as this includes additionally measurements carried out at high airmass values that do not contribute to the daily average.) These profile measurements are now being processed on a monthly basis using a third party application, filtered for good ozone profiles, and the resulting data files are then uploaded onto the Manchester-hosted database, as is carried out for Brewer #172 in Manchester. The raw Umkehr data is included in the 'b-files' which are routinely submitted to WOUDC. An example profile from May 2014 is shown in Figure 5. Subsequent to the reprocessing of the TCO amounts, the umkehr profiles also required reprocessing to reflect the new 2013 calibration. This has now been completed and the updated profiles now reside on the University of Manchester's database.
Ref: AEA/ED45367/Issue Number 1 8

Baseline Measurement and Analysis of UK Ozone and UV
Figure 5 Example umkehr profile obtained from Brewer #075. Right hand plot shows the amount of ozone measured at each of eight layers plotted against nominal layer
height; left hand plot shows interpolated ozone densities as a function of height.
Figure 6 and Figure 7 show the comparison of the daily Reading column ozone values with measurements from the OMI satellite instrument. The two sets of measurements are generally in good qualitative and quantitative agreement.
0 50 1000
5
10
15
20
25
30
35
40
45
50
Ozone (Full) [DU]
Hei
ght [
km]
19/05/2014 AM
TOC: 351.8 DU
0 50 1000
5
10
15
20
25
30
35
40
45
50
Ozone (Layers) [DU]
Hei
ght [
km]
19/05/2014 AM
TOC: 356.7 DUIT: 3RES: 0.371DF: 0.032DN: 0.012
Ref: AEA/ED45367/Issue Number 1 9

Baseline Measurement and Analysis of UK Ozone and UV
Figure 6 Reading vs. OMI, October 2013to September 2014.
Figure 7 Lerwick Best Daily vs OMI Overpass 01/10/2013 - 30/09/2014
Ref: AEA/ED45367/Issue Number 1 10

Baseline Measurement and Analysis of UK Ozone and UV
3.2.2 Reading UV
Spectral UV measurements have continued during this year with only a few unexpected interruptions. These are primarily related to an ongoing issue with the envirobox controller, and although data acquisition has mostly continued during affected periods, the core instrument temperature was raised outside of acceptable limits. Data recorded during such periods is of lower quality and has thus been removed from the data series. After the first instance of this issue in late 2013, the instrument was removed to the Manchester calibration laboratory for a brief period of maintenance in January 2014 to investigate more fully.
During this maintenance period the Bentham DM150's electrical connections were checked and the envirobox temperature monitored in the laboratory environment. On two occasions the issue was seen to reoccur under these conditions, but after rerouting an internal temperature sensor it was not observed again. The Manchester team also took the opportunity to re-measure the cosine response of the global optics and to monitor the temperature of the diffuser during a calibration check with an alternative design of lamp enclosure. The current diffuser material is known to show a small temperature dependence and it is anticipated that by minimising temperature variations during calibration checks that we can raise the overall accuracy of recorded data.
In the last quarter of the reporting period there were further reoccurrences of the temperature controller issue. Therefore during a recent site visit representatives from Bentham Instruments attended the instrument to investigate. They will shortly be providing a replacement temperature controller.
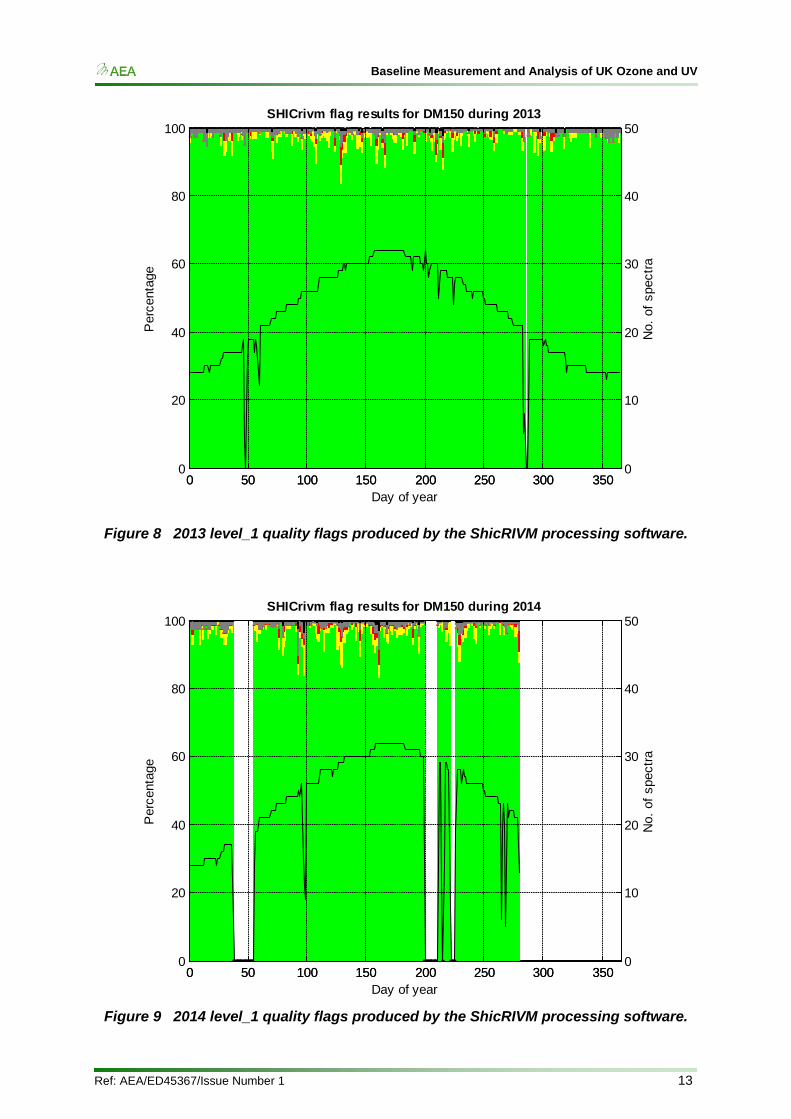
The other break in the data series occurred at the end of March 2014. The fraction of yellow (fair) level_1 quality flags had continued to be very low until 21st March 2014, as shown in as shown in Figure 8 and Figure 9, with green flags being produced almost all of the time, showing the high quality of the resulting data series. At this point a large number of grey and black flags started being outputted. Initially this was thought to be due to atmospheric variability that can occasionally cause anomalous results, but as it continued it became symptomatic of an instrumental fault.
This was traced to a wavelength alignment issue which required an on-site visit to resolve. In total 19 days of data were affected. Despite the poor quality of the data during this period, once the issue had been traced via processing and by in depth investigations of the shicRIVM output, a route to correct the data was found. In short, a routine was written to determine the large scale wavelength shift for each affected spectrum by a shicRIVM-like algorithm, and taking account of the wavelength dependence of the absolute calibration, apply this shift to the level_0 data before it was then passed to shicRIVM for the usual refinement. This additional step was only applied for days 080 to 099 and resulted in green flags at a level close to normal (approx. 95%).
The large calibration change of ~18% on day 231 occurred in the week following the problem with the temperature controller. It is not possible to be certain but the probability is that this was due to a delay in achieving temperature stability. As normal where changes over the 2% threshold have been noted during recent calibration checks, corrections have been made to the instrument response before spectral measurements were resumed (Figure 10). In addition it should be noted that the reprocessing has been carried out to take account of calibrations where changes have exceeded this threshold, interpolating between calibration dates. The calibration-interpolated data has also been reprocessed to WOUDC and EUVDB file formats and resubmitted to both organisations.
Ref: AEA/ED45367/Issue Number 1 11

Baseline Measurement and Analysis of UK Ozone and UV In addition, the computer operating system was upgraded to Windows 7 to comply with security regulations following the withdrawal of Microsoft support for Windows XP. This has involved the purchase of a new IEEE-488 interface and significant re-writes of the operating software.
The University of Manchester continues to produce WOUDC and EUVDB format files during the nightly processing routines, from the level_1 spectral UV dataset, filtering these for quality flags. These files reside on the o3uvdata.seaes.manchester.ac.uk ftp database. At the end of each month these files are sent to the World Ozone and UV Data Centre (WOUDC) and European Ultraviolet Database (EUVDB) for use by the wider scientific community. This processing is still considered as state of the art, although WMO have now approved the inclusion of UV-index into WOUDC files. University of Manchester staff are currently waiting on details of the specified format from WOUDC. However due to ongoing developments at Environment Canada who host the WOUDC we expect there to be a delay before this task can be completed. When possible the change will also be applied to the historic data series, before resubmission.
The Finnish Meteorological Institute who host EUVDB have yet to resolve their technical difficulties with part of submission process, which incurs a slight delay before data is manually added into the database. The processing of data by the Manchester team ensures that the dataset is identical to that submitted to the WOUDC as EUVDB format files are produced during the nightly processing routines from the same underlying files.
We have also liaised with PHE who run the network of broadband meters and were experiencing some inconsistencies with their internal calibration. Although their monitoring falls outside of our contract, in an effort to provide comparable data across the UK, we invited them to our calibration laboratory to ascertain the cause of the issue in early 2014.
This exercise entailed using our Bentham DM300 spectroradiometer and NIST certificated lamp alongside two instruments and a transfer standard from PHE. The University of Manchester instrument was calibrated with our NIST-traceable lamp and PHE's instruments had calibrations traceable to PTB. In turn both institutes measured their own and each other's lamp and both calibrations were found to be internally consistent, to 1% and 2% respectively. However discrepancies were seen when PHE used their calibration to measure the UoM lamp and also we recorded a different output from their lamp than stated on their lamp file. Early results suggested that the discrepancy that PHE observed against the World Radiation Centre in 2012 still persists and is likely internal to their calibration chain. It should be noted that calibrations deriving from PTB and NIST are generally known to differ by 3 to 4% in the UV with instruments calibrated to NIST standards reading lower. It is not our role to determine the "truth" between NIST and PTB, but to maintain a stable and consistent calibration of a long-term monitoring site. As a related exercise we have checked our calibration chain and lamps held at Manchester dating back to 1999 which we found to be stable to < 2% over the last 15 years. Further a number of European intercomparisons over the same time range have shown our calibrations to lie approximately 3% lower than PTB calibrated instruments, as expected.
Ref: AEA/ED45367/Issue Number 1 12
Baseline Measurement and Analysis of UK Ozone and UV
Figure 8 2013 level_1 quality flags produced by the ShicRIVM processing software.
Figure 9 2014 level_1 quality flags produced by the ShicRIVM processing software.
0 50 100 150 200 250 300 3500
20
40
60
80
100
Day of year
Per
cent
age
No.
of s
pect
ra
SHICrivm flag results for DM150 during 2013
0 50 100 150 200 250 300 3500
10
20
30
40
50
0 50 100 150 200 250 300 3500
20
40
60
80
100
Day of year
Per
cent
age
No.
of s
pect
ra
SHICrivm flag results for DM150 during 2014
0 50 100 150 200 250 300 3500
10
20
30
40
50
Ref: AEA/ED45367/Issue Number 1 13

Baseline Measurement and Analysis of UK Ozone and UV
Figure 10 DM150 irradiance calibration record.
3.2.3 UV Index Software developed by Ricardo-AEA automatically processes the spectral data from the DM150 UV instrument at Reading and converts them to a simple UV index comparable with the results from the PHE broadband UV monitoring network. The measurement data and plots of the daily UV index and of the maximum daily UV index throughout the year are available on the website one day in arrears for public information.
The daily maximum UV index values are plotted with quality flags, as an ongoing annual graph. The daily maximum UV index graphs for Reading for 2012 can be found here http://uk-air.defra.gov.uk/data/uv-data .
3.3 Manchester Measurements (not formally part of the contract)
The University of Manchester also makes column ozone measurements at Manchester using a Brewer instrument (#172), alongside the daily updates for Brewer #075. These measurements are currently not funded through this contract. The Manchester results are made available in graphical form only on the project web site.
The analysis contains individual measurements made at air masses up to 6.0, as well as the usual standard lamp corrections. Reprocessed data files, including checks against the satellite record, from Brewer #172 are being submitted to WOUDC on a monthly basis together with the raw bfiles, i.e. on the same basis as both the single monochromator instruments, Brewers #075 and, and when necessary, #126.
Brewer #172 returned from a successful calibration exercise and was reinstalled at Manchester on 26 June 2013. As with Brewer #075, the new calibration constants have now been applied to the time series. For Brewer #172 for the 2011 to 2013 inter-calibration period we also see a slight downward shift when applying the new calibration constants of up to
01-Jan-2013 01-Jan-2014 01-Jan-2015-15
-10
-5
0
5
10
15
20
Year
Per
cent
age
chan
ge
DM150 calibration record
Ref: AEA/ED45367/Issue Number 1 14

Baseline Measurement and Analysis of UK Ozone and UV 1.0%, with data after the 2013 calibration being shifted by between approximately 0.4 to 1.4%. There are a small number of days (4) that show a larger change between new and old calibration constants which are associated with a change in the number of contributing values by 1. The r.m.s. change for the full period due to applying the new constants is 0.63%.
Additionally Brewer #172 has been used by Dr Andrew Smedley as the baseline for a new instrument being developed and tested as part of the EMRP SolarUV project. This instrument is a dual channel solid state instrument fitted with both direct and global optics and it is intended that it can produce both spectral data across the UV and visible bands, together with DOAS retrieved products including ozone. Current analysis indicates that for total column ozone the new instrument can produce high frequency data (every 1 minute), and agrees with the values produced by Brewer #172 to better than 1% over the course of a day. In addition to ozone, and spectral direct and global spectra, the instrument is able to produce spectral AOD over its full wavelength range (280 to 700nm), but a slight airmass dependence in the retrieved ozone is noted that limits its usefulness to airmasses <4. This limitation is primarily due to some residual structure apparent in the direct transmission spectra after removal of aerosol, Rayleigh scattering and ozone that cannot be attributed to smaller trace gases. It is likely that this residual structure is related to difficulties in determining the details of a relatively wide slit function with a non-scanning instrument. All told it is expected that similar instruments but with narrower slit functions show promise in the relatively near future as comparable instruments to Brewers.
Umkehr ozone profiling measurements have been run by Brewer #172 as part of the daily schedule of measurements since 2008. During the period we have continued to process these on a monthly basis using a third party application, filter for good ozone profiles, and upload the resulting data files onto the Manchester-hosted database. As with Brewer #075, profiles acquired from Brewer #172 have been reprocessed to reflect the new 2013 calibration.
At the December 2012 project meeting DEFRA approached the University of Manchester with three surface ozone instruments (Casella ML2010's) with a view to installing them at UK sites. During summer 2013 a NERC intern installed the first of these instruments at Manchester along with the necessary filters, pump and cabling, and writing data acquisition software to log ozone concentrations and incorporating daily internal calibration checks. We are therefore now monitoring surface ozone concentration data continuously and saving data on every minute, and the data is transferred on a weekly basis to the UoM ozone and UV database.
3.4 Manchester FTP The FTP server has continued to be reliable providing data to the project team.
In addition University of Manchester staff transferred the ozone and UV database to the University's newly set-up Remote Data Storage solution (a 'cloud-based' remote drive intended for research groups at the university) with the aim of making the UoM database more resilient. As part of this process the frequency of the data processing was increased to run hourly, and thus provide near real time updates if the need arises, for example during a low ozone event. On the whole this has been a success although initially we experienced one or two interruptions to access due to a synchronisation conflict, but this has not impacted on the data quality.
3.5 Ozone Data Reporting A summary of daily Dobson and Brewer ozone data is reported on a weekly basis by email to the project partners and a number of other interested organisations and individuals.
Ref: AEA/ED45367/Issue Number 1 15

Baseline Measurement and Analysis of UK Ozone and UV The data are also delivered daily to the University of Thessaloniki for the World Ozone and Ultraviolet Radiation Data Centre (WOUDC) near real-time ozone mapping programme. Interpolated maps are disseminated by return to all the participants. The mapped results can also be viewed from the web page: http://exp-studies.tor.ec.gc.ca/e/ozone/Curr_allmap.htm.
Final data are reported monthly (after Ricardo-AEA’s monthly QC checks and any follow-up actions) to the WOUDC data archive. The QC checks involve:
• Comparison of all relevant datasets against each other for consistency.
• Follow-up with data providers any data points which are apparent outliers.
• Regression analysis between ground-based and satellite data to determine whether the relationship is improving or deteriorating.
• Comparison with climatology to assess whether levels are normal for the time of year.
Climatology updated by Ricardo-AEA now includes 2013 data. The Reading site now uses its own climatology rather than that transferred from the closed Camborne site.
All reports were delivered successfully during this period of the contract.
3.6 Aberwyswyth Site (not formally part of the contract) At the 2013 project meeting it was noted that the incorporation of data from the SAOZ instrument located at Aberwystwyth would be a useful addition to the project. The SAOZ (System d'Analyse par Observation Zenithale) instrument is UV-Visible (300-650 nm) diode array spectrometer developed at the Service d'Aronomie, France, used for monitoring stratospheric ozone. It is a diode array flat field spectrometer of 1 nm resolution looking at sunlight scattered at zenith during twilight. The data analysed by Differential Optical Absorption Spectrometry allow the retrieval of daily ozone and NO2 total columns at sunrise and sunset.
During the last quarter investigations have been made into the practicalities of incorporating the data produced by the SAOZ instrument into the University of Manchester's overnight routines and database. After discussions with Geraint Vaughan (UoM) who is responsible for the instrument, the University of Manchester team has retrieved the historic raw and processed data (going back to 1991), automated transfers to the database of newly acquired data, and written routines to apply processing nightly. These processing routines rely on a third party program (QDOAS) which has not been used before for this instrument - earlier processing was carried out manually using an earlier version called WINDOAS which does not have the option of using command line instructions. As manual reprocessing is a time consuming task, it was felt beneficial to transfer the extensive list of settings from WINDOAS to QDOAS to enable the automation of past and future raw data. Past data has now been processed using QDOAS, but for comparable periods when WINDOAS-analysed data also exists an outstanding discrepancy was found. Investigations during the most recent quarter have so far not located the source of this discrepancy.
Ref: AEA/ED45367/Issue Number 1 16
Baseline Measurement and Analysis of UK Ozone and UV
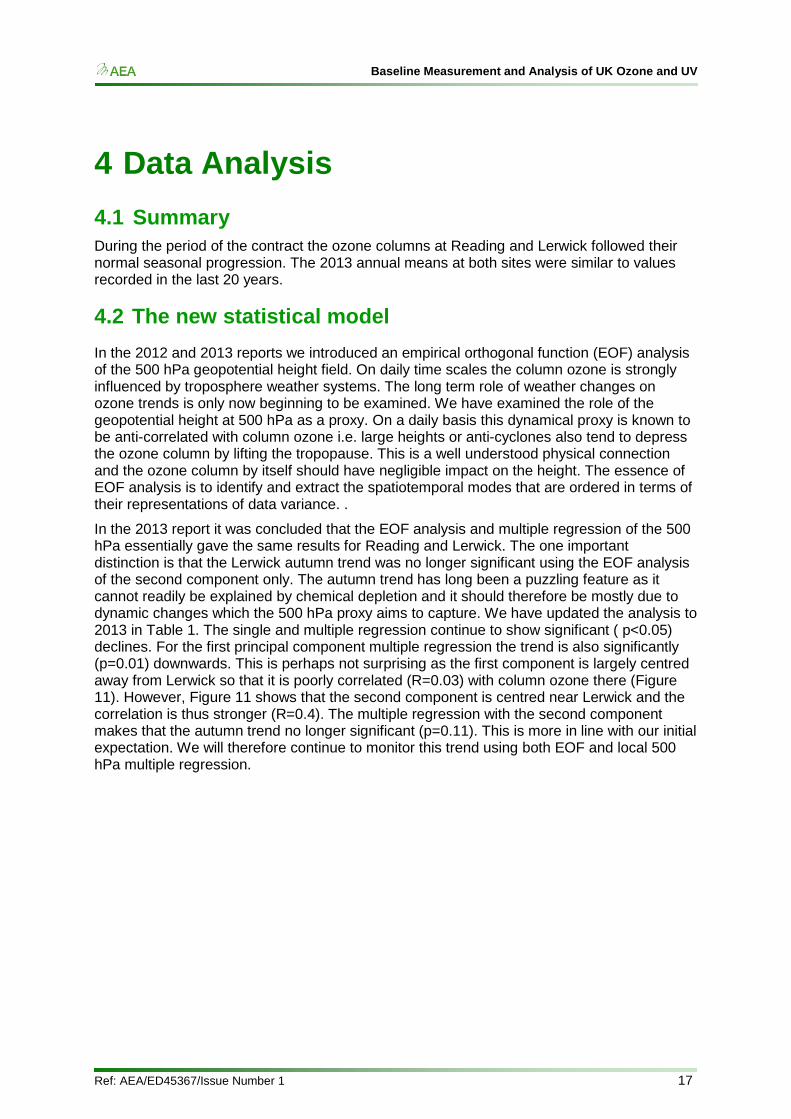
4 Data Analysis 4.1 Summary During the period of the contract the ozone columns at Reading and Lerwick followed their normal seasonal progression. The 2013 annual means at both sites were similar to values recorded in the last 20 years.
4.2 The new statistical model In the 2012 and 2013 reports we introduced an empirical orthogonal function (EOF) analysis of the 500 hPa geopotential height field. On daily time scales the column ozone is strongly influenced by troposphere weather systems. The long term role of weather changes on ozone trends is only now beginning to be examined. We have examined the role of the geopotential height at 500 hPa as a proxy. On a daily basis this dynamical proxy is known to be anti-correlated with column ozone i.e. large heights or anti-cyclones also tend to depress the ozone column by lifting the tropopause. This is a well understood physical connection and the ozone column by itself should have negligible impact on the height. The essence of EOF analysis is to identify and extract the spatiotemporal modes that are ordered in terms of their representations of data variance. .
In the 2013 report it was concluded that the EOF analysis and multiple regression of the 500 hPa essentially gave the same results for Reading and Lerwick. The one important distinction is that the Lerwick autumn trend was no longer significant using the EOF analysis of the second component only. The autumn trend has long been a puzzling feature as it cannot readily be explained by chemical depletion and it should therefore be mostly due to dynamic changes which the 500 hPa proxy aims to capture. We have updated the analysis to 2013 in Table 1. The single and multiple regression continue to show significant ( p<0.05) declines. For the first principal component multiple regression the trend is also significantly (p=0.01) downwards. This is perhaps not surprising as the first component is largely centred away from Lerwick so that it is poorly correlated (R=0.03) with column ozone there (Figure 11). However, Figure 11 shows that the second component is centred near Lerwick and the correlation is thus stronger (R=0.4). The multiple regression with the second component makes that the autumn trend no longer significant (p=0.11). This is more in line with our initial expectation. We will therefore continue to monitor this trend using both EOF and local 500 hPa multiple regression.
Ref: AEA/ED45367/Issue Number 1 17

Baseline Measurement and Analysis of UK Ozone and UV
Figure 11 Autumn (SON) principal components 1 and 2 from the NCEP re-analysis
(1948-2014)
Regression Method Lerwick Autumn Trend (1978-2013) in DU/yr
Single -0.47+/-0.18 (p=0.01)
Multiple with local 500 hPa -0.35+/-0.16 (p=0.03)
Multiple with PC1 500 hPa -0.50+/-0.18 (p=0.01)
Multiple with PC2 500 hPa -0.27+/-0.17 (p=0.11)
Table 1. The trend (DU/yr) at Lerwick for Autumn (September-November mean) in the period 1978-2013 using different regression methods. Bold indicates significance (p <
0.5).
Ref: AEA/ED45367/Issue Number 1 18

Baseline Measurement and Analysis of UK Ozone and UV
4.3 Routine Trends Analysis In the trends analysis to date we have chosen only the 500 hPa geopotential height rather than the sometimes used 200 hPa to make sure that the proxy is truly tropospheric and not affected by stratospheric temperatures which are influenced by stratospheric ozone. We have performed two types of trend analysis for Lerwick and Reading over the reporting year:
1. A simple regression of the column ozone from the start of record for Reading in 2003 and since the start of the satellite observations for Lerwick in 1978.
2. A multiple regression where we include the monthly 500 hPa geopotential height over the site from NCEP re-analysis as a tropospheric dynamical proxy.
These analyses are automated using the “R” statistical software so that they can be performed as simply as possible from the ozone and meteorological databases. We are of course aware that long-term trends will not vary greatly from quarter-to-quarter (e.g. the changes in the Lerwick seasonal trends from 2011 to 2014 in Table 2) but this analysis quickly highlights any interesting anomalies or features in the data such as the change in significance of the autumn trend for Lerwick from multiple regression.
4.3.1 Lerwick Analysis by simple linear regression of annual means shows that since the early 1980s ozone has been decreasing ~21.4% per decade over Lerwick (Figure 12, Table 2). This long-term trend is declining as ozone has stabilised since the 1990s (Figure 12). Trends are sensitive to the chosen time frame and we have chosen the beginning of the global 30 year satellite period as suitable starting year. There is as yet no evidence of significant ozone recovery. The long-term (since 1978) autumn decline is significant for single and multiple regression. It is difficult to explain enhanced ozone loss prior to the cold season of polar stratospheric cloud formation. However, the principal component analysis (see section 4.2) confirms that the most likely cause of the autumn trend is tropospheric circulation changes.
Since 1990 the Lerwick annual mean trend has been upward but this is not significant (at the 95% confidence interval). The seasonal evolution is shown in Figure 12. There is an apparent turn-around in the spring (March/April/May) ozone column over this location. From the 1970's until around 1990 there was a very strong downward trend, which has now levelled off. However, there is no statistically significant recovery since the late 1990s, when stratospheric chlorine loading is thought to have peaked.
Ref: AEA/ED45367/Issue Number 1 19

Baseline Measurement and Analysis of UK Ozone and UV
Figure 12 Long-term trends since 1983 in annual and seasonal ozone column over
Lerwick
4.3.2 Reading At Reading there is an annual increase of ozone since 2003 but this is not significant. Seasonal trends are also not significantly different from zero at the 95% confidence interval. The data record is relatively short so that trends are very sensitive to record length and possibly tropospheric circulation trends.
4.3.3 Trends up to 2014, single and multiple regression Table 2 shows the results of the analysis to date including quarterly updates from up to the year 2014 where available (winter, spring and summer trends have been updated), as well as the trends as they stood at the other years for comparison (italicised to distinguish them clearly from the current values for the trend)
Annual
(to 2013)
(to 2012)
(to 2011)
(to 2010)
Autumn (SON)
(to 2013)
(to 2012)
(to 2011)
(to 2010)
Winter3 (DJF)
(2013-2014)
(2012-2013)
(2011-2012)
(2010-2011)
Spring (MAM)
(to 2014)
(to 2013)
(to 2012)
(to 2011)
Summer (JJA)
(to 2014)
(to 2013)
(to 2012)
(to 2011)
Lerwick -SR -0.51+/-0.18
-0.59+/-0.18 -0.60 +/- 0.19 -0.62 +/- 0.20
-0.47+/-0.18
-0.51+/-0.19 -0.55 +/- 0.20 -0.61 +/- 0.21
-0.06+/-0.48
-0.21+/-0.50 -0.28+/- 0.52 -0.13+/- 0.55
-0.73+/-0.25
-0.75+/-0.27 -0.88 +/- 0.27 -0.87 +/- 0.28
-0.14+/-0.13
-0.16 +/-0.14 -0.19 +/-0.15 -0.23 +/-0.16
3 Winter (DJF) season includes December of preceding year e.g. Winter 2014 is December 2013 to February 2014.
Ref: AEA/ED45367/Issue Number 1 20

Baseline Measurement and Analysis of UK Ozone and UV
Lerwick- MR -0.43+/-0.18
-0.50+/- 0.19 -0.49+/- 0.20; -0.52+/- 0.21
-0.35+/-0.16
-0.39+/0.16 -0.33+/-0.18; -0.40+/-0.18
-0.05+/-0.48
-0.18+/-0.51 -0.25+/-0.54 -0.09+/-0.56
-0.52+/-0.22
-0.57+/- 0.22 -0.66+/- 0.24; -0.67+/- 0.25
-0.13+/-0.12
-0.16+/-0.12 -0.22+/-0.12 -0.23+/-0.13
Reading -SR +0.79+/-0.95
+0.59+/-1.16 +1.43+/-1.32 +2.97+/-1.19
+0.85+/-1.03
+1.05+/-1.26 +0.99+/-1.58 +2.19+/-1.70
+1.68+/-1.83
+0.90+/-2.12 +0.34+/-2.57 +3.55+/-2.12
+0.24+/-1.08
+0.57+/-1.28 -0.30+/-1.44 -0.10+/-1.87
+0.51+/-0.50
+0.49+/-0.61 +1.00+/-0.65 +0.75+/-0.81
Reading -MR -0.17+/-0.97
-0.53+/-1.16 +0.29+/-1.24 +2.10+/-1.94
0.00+/-0.65
-0.03+/-0.80 +0.50+/-0.83 +0.49+/-1.15
-1.05+/-1.33
-1.03+/-1.48 -1.14+/-1.76 +1.38+/-1.58
+0.28+/-0.93
+0.42+/-1.11 +0.19+/-1.41 +0.48+/-1.80
+0.34+/-0.53
+0.30+/-0.64 +1.06+/-0.91 +0.80+/-1.07
Table 2 Column ozone trend in DU per year with standard errors. Numbers in bold are significant at the 95% confidence level (P<0.05) SR: single regression; MR: multiple regression. Lerwick since 1978 and Reading since 2003 and both to August 2014.
4.3.4 Camborne / Reading In this contract we have attempted to create a simple synthetic Camborne/Reading time series. Creating synthetic time series is fraught with difficulties and results should be regarded with caution. According to satellite observations the inter-annual correlation of the annual mean ozone at Camborne and Reading should be very high (correlation coefficient greater than 0.95). The annual mean ozone of the two stations should therefore track each other very well. In 2003 both sites were run simultaneously for a complete year and it was found that Reading column ozone was 0.7% larger than the column ozone at Camborne. This is within the uncertainty of both instruments. However to be conservative Reading annual means were scaled down by 0.7% for the synthetic time series. The synthetic annual mean Camborne/Reading (1990-2013) upward trend of 0.57 DU/yr is significant (p=0.02). For 2013 the annual mean ozone at Lerwick was similar but at Reading higher compared to values recorded in the last 20 years (Figure 13).
Ref: AEA/ED45367/Issue Number 1 21

Baseline Measurement and Analysis of UK Ozone and UV
Figure 13 The annual mean of daily ozone column over Lerwick and combined
Camborne/Reading (Lerwick includes incomplete winter days).
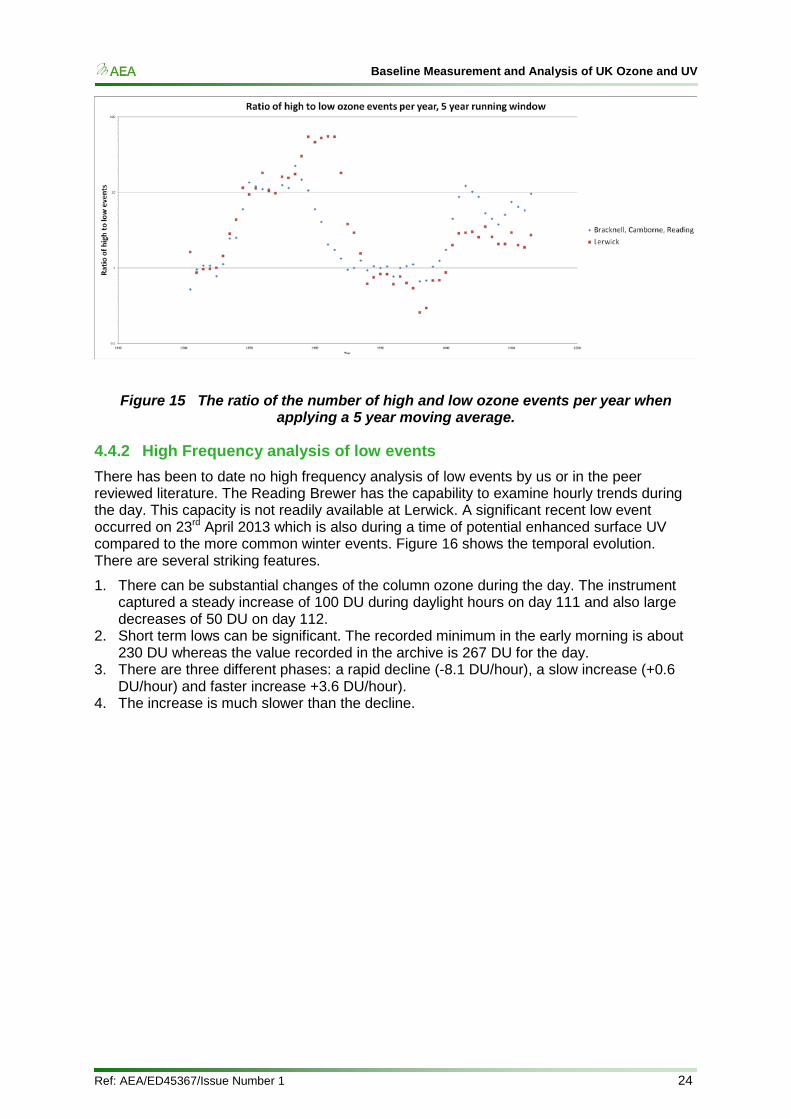
4.4 Events 4.4.1 Long term changes in high and low events High and low ozone events have been determined as 2 standard deviation anomalies relative to a 20 year moving average. Figure 14 shows the long-term evolution of high and low events at Reading (hybrid dataset) and Lerwick. There appear to be long-term decadal cycles of the ratio of high and low ozone events Figure 15. We have not identified a cause for this but it is consistent with shifting patterns of tropospheric indicators, such as the North Atlantic Oscillation (NAO), which also remain unexplained. The cycles are out of phase. In the current phase we are experiencing relatively more high than low events in Reading and Lerwick compared to the 1990s. 2013 was a year of typical number high and low events compared to the 20 year moving average. This methodology is different in the current quarterly reports of low events which use a monthly climatology. The monthly climatology is perhaps more representative as it captures true anomalies even in a more variable part of the year. However, the long-term cycles of high/low events discussed here are unlikely to be affected by this difference in methodology.
Ref: AEA/ED45367/Issue Number 1 22

Baseline Measurement and Analysis of UK Ozone and UV
Figure 14 Time series of high and low ozone events at Reading/Camborne (top) and Lerwick (bottom). The Reading data is a synthesis including other nearby stations.
Ref: AEA/ED45367/Issue Number 1 23
Baseline Measurement and Analysis of UK Ozone and UV
Figure 15 The ratio of the number of high and low ozone events per year when applying a 5 year moving average.
4.4.2 High Frequency analysis of low events There has been to date no high frequency analysis of low events by us or in the peer reviewed literature. The Reading Brewer has the capability to examine hourly trends during the day. This capacity is not readily available at Lerwick. A significant recent low event occurred on 23rd April 2013 which is also during a time of potential enhanced surface UV compared to the more common winter events. Figure 16 shows the temporal evolution. There are several striking features.
1. There can be substantial changes of the column ozone during the day. The instrument captured a steady increase of 100 DU during daylight hours on day 111 and also large decreases of 50 DU on day 112.
2. Short term lows can be significant. The recorded minimum in the early morning is about 230 DU whereas the value recorded in the archive is 267 DU for the day.
3. There are three different phases: a rapid decline (-8.1 DU/hour), a slow increase (+0.6 DU/hour) and faster increase +3.6 DU/hour).
4. The increase is much slower than the decline.
Ref: AEA/ED45367/Issue Number 1 24

Baseline Measurement and Analysis of UK Ozone and UV
Figure 16 Hourly column ozone in April 2013 at Reading.
There are several implications of this analysis. The variability of ozone during the day can be very large. This should be recognised when interpreting the values for any given "day". Ozone values during low events can briefly be substantially lower than that reported for the "day". Ozone events/mini-holes are not always symmetric. The rapid decline and slow recovery suggests an asymmetric structure here. In this case, if the hole migrated at a steady speed eastward there would have been stronger ozone horizontal gradients on it'sits eastern flank (sharp decline) than on the western flank (slow rise). This topic merits further high temporal frequency analysis of more events, satellite observations and meteorological analysis.
4.5 Stratospheric Ozone and Human Health Stratospheric ozone and clouds are the dominant variables that determine harmful (and beneficial) surface UV. Stratospheric ozone is also a contributor to surface ozone which is an irritant when inhaled.
To date our analysis has focused on the evolution of column ozone itself. This may not be the most appropriate approach as it is well known that the total UV exposure is small in winter even if there are periods of low ozone, conversely even a modest decline in the summer may have much bigger impacts. It also seems sensible that one should consider a total exposure approach. It would be necessary to evaluate the cumulative effect of below normal ozone over a period of time not just single daily values. Human behaviour which increases skin exposure (e.g. higher surface temperature) could be a further important factor. All of these considerations point to the need to define an “effective” ozone column rather than absolute column or potential/clear sky/maximum UV index. Further work is needed to develop a reasonable approach which should undergo or be based on peer review to gain credibility.
It has not been quantified how stratospheric ozone affects surface ozone in the UK. The first step would be a statistical analysis of the correlation between the two. The relationship can be expected to be strongly dependent on the strength of downward transport from the stratosphere during synoptic events. There would be a need to understand the nature and
Ref: AEA/ED45367/Issue Number 1 25

Baseline Measurement and Analysis of UK Ozone and UV frequency of these weather events. One may be able to combine, for example, an index of these events with any underlying changes in stratospheric ozone.
There is much that could be done to improve the health relevance of the monitoring program. This would require a modest amount of additional work but would strengthen this monitoring program.
4.6 Conclusions and Future work The long-term decline in column ozone over the UK has not yet been reversed. Annual mean and spring decline are statistically significant. The autumn decline at Lerwick is also statistically significant for single and multiple regressions, however further analysis using EOFs of 500 hPa geopotential height do not confirm this trend and this is what our reasoning would expect. Trend analysis of the short Reading time series shows an annual mean increase which is not statistically significant.
A new high frequency analysis shows some promise. It indicates large hourly fluctuations during a recent mini-hole event. Further analysis will be made to understand causes, uncertainties, and implications of this variability.
Ref: AEA/ED45367/Issue Number 1 26

Baseline Measurement and Analysis of UK Ozone and UV
5 Project Information & Dissemination 5.1 Web Site The project web pages have now been transferred from the previous standalone Ozone-UV website to Defra's UK-AIR website and were made live on the 1st April 2014. The old web link (http://ozone-uv.defra.gov.uk/) continues to redirect to the new project homepage (located at http://uk-air.defra.gov.uk/research/ozone-uv/) which as illustrated in Figure 17 below. During the website migration the page content has been updated and the navigation of the site has been streamlined and optimised as agreed with Defra.
Figure 17 The project website homepage on UK-AIR
As illustrated above the project now has its own home page within UK-AIR, and links from there are provided to where all the project information can be found. However, it should be noted that some aspects of the previous Ozone/UV standalone website are now dispersed throughout the UK-AIR domain where there is overlap and similarity in functionality.
The main data search tools now reside under the "Data Archive" tab with modernised data download and graphing tools introduced. The following data continue to be updated daily during normal working hours and made available for download from the website:
Ref: AEA/ED45367/Issue Number 1 27

Baseline Measurement and Analysis of UK Ozone and UV
• Dobson ozone data from Lerwick (plus historic data from Camborne) • Brewer ozone data from Reading. • Graphs of Manchester Brewer ozone data. • Spectral UV data from Reading.
The news section has been combined with the main UK-AIR news and is found here: http://uk-air.defra.gov.uk/news. Project related news stories are "tagged with either the title prefix "Stratospheric Ozone" or "Spectral UV". This allows identification of project news articles easily and hopefully avoids any confusion between ground level ozone and stratospheric ozone. Project news articles are periodically updated as and when suitable articles are identified. There were no articles added to the website during this reporting period.
The monitoring locations appear on the Interactive monitoring networks map at http://uk-air.defra.gov.uk/interactive-map with links through to data and site information.
The project FAQ's are combined under the UK-AIR "About Air Pollution" tab.
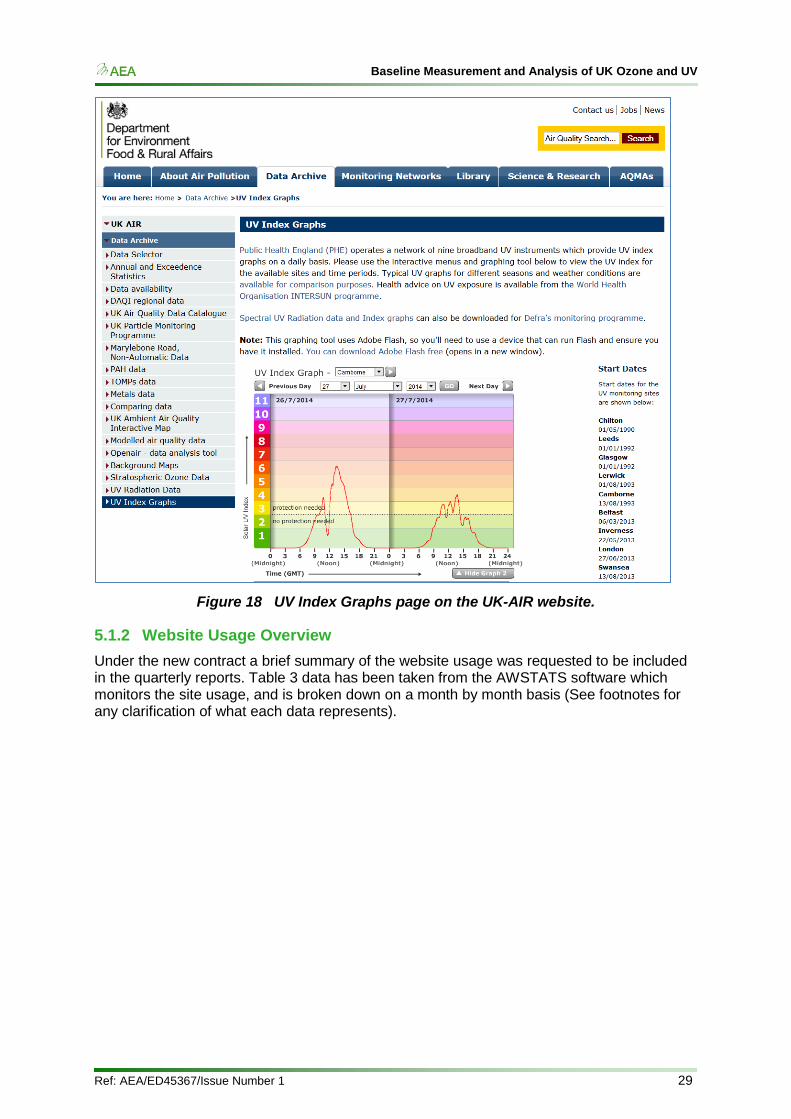
5.1.1 Integration of PHE UV Index graphs within UK-AIR Public Health England (PHE) operates a network of nine broadband UV instrument which provide "UV Index Graphs" on a daily basis. These data were originally made available via the Public Health England (PHE) website. Unfortunately the ability to host and therefore view these plots was lost when the PHE website migrated to GOV.UK domain.
As these data were referenced by the project website R-AEA suggested to Defra that it may be possible for the plots to be hosted via the UK-AIR portal. Defra agreed to the inclusion of these data on the UK-AIR portal and R-AEA made contact with the PHE to begin testing the required software.
Automation of data transfers to a R-AEA hosted FTP server was set allowing the PHE to send data automatically on an hourly basis. R-AEA tested the supplied "Adobe Flash" software module and after a few changes to its underlying code the plots became integrated with the UK-AIR ported and were available on the 25th April 2014.
The list of start dates for each site location were subsequently added on the 20th May 2014. The webpage can be viewed at: http://uk-air.defra.gov.uk/data/uv-index-graphs and an example of the plotting and list of sites can be seen in Figure 18
Ref: AEA/ED45367/Issue Number 1 28
Baseline Measurement and Analysis of UK Ozone and UV
Figure 18 UV Index Graphs page on the UK-AIR website.
5.1.2 Website Usage Overview Under the new contract a brief summary of the website usage was requested to be included in the quarterly reports. Table 3 data has been taken from the AWSTATS software which monitors the site usage, and is broken down on a month by month basis (See footnotes for any clarification of what each data represents).
Ref: AEA/ED45367/Issue Number 1 29

Baseline Measurement and Analysis of UK Ozone and UV
Year Month Unique visitors4
Number of visits5 Pages6 Hits7 Bandwidth8
2013 October 559 902 2288 10731 546.16 MB
2013 November 515 926 2403 9510 696.72 MB
2013 December 493 754 2135 8539 410.73 MB
2014 January 554 859 2290 11523 405.76 MB
2014 February 654 1063 3468 11744 541.95 MB
2014 March 756 1155 3020 11847 531.98 MB
Summary 3531 5659 15604 63894 3133.3 MB
Table 3 AWSTATS data for http://ozone-uv.defra.gov.uk/ Ozone AWSTATS
Due to the integration of the project website with UK-AIR it is no longer possible to analyse website usage statistics in the same way as previously. There is no longer a standalone website domain on which the analysis can be based, the project information and data are now spread across various locations within the UK-AIR website. In addition we have taken the opportunity to upgrade the analysis software from AWSTATS to the more modern and flexible Google Analytics.
Our new approach is to create separate reports for each project section and the number of hits is listed below in Table 4.
Website section
June (Number of page views)
July, August, September (Number of page views)
Ozone Data 462 1524 Ozone UV Analytics 565 1669 Ozone UV FAQs/Links 20 52 UV Data 505 1,485 Total 1552 4730
Table 4 Website section hits
5.2 Literature Review During the period of the project Defra requested a review on papers focusing on column ozone or UV measurements and a short non-technical summary to be provided on each
4 Unique Visitor: A unique visitor is a person or computer (host) that has made at least 1 hit on 1 page of your web site during the current period shown by the report. If this user makes several visits during this period, it is counted only once. 5 Visits: Number of visits made by all visitors. Think "session" here, say a unique IP accesses a page, and then requests three other pages within an hour. All of the "pages" are included in the visit, therefore you should expect multiple pages per visit and multiple visits per unique visitor 6 Pages: The number of "pages" viewed by visitors. Pages are usually HTML, PHP or ASP files, not images or other files requested as a result of loading a "Page". 7 Hits: Any files requested from the server (including files that are "Pages"). 8 Bandwidth: Total number of bytes for pages, images and files downloaded by web browsing.
Ref: AEA/ED45367/Issue Number 1 30

Baseline Measurement and Analysis of UK Ozone and UV paper together with its policy significance. During this period eleven relevant papers were reviewed and their findings are summarised in the project quarterly reports
• Bekki, S., A. Rap, V. Poulain, S. Dhomse, M. Marchand, F. Lefevre, P. M. Forster, S. Szopa, and M. P. Chipperfield (2013), Climate impact of stratospheric ozone recovery, Geophys. Res. Lett., 40, 2796-2800, doi:10.1002/grl.50358.
• Rieder, H E., Polvani, L M . (2013), Are recent Arctic ozone losses caused by increasing greenhouse gases? GEOPHYSICAL RESEARCH LETTERS, 40, 16, 4437-4441, DOI: 10.1002/grl.50835
• Omrani, N. -E.; et al., (2014). Stratosphere key for wintertime atmospheric response to warm Atlantic decadal conditions. CLIMATE DYNAMICS, Vol: 42, Iss 3-4, 649-663. 2014
• Manzini, E., et al. (2014), Northern winter climate change: Assessment of uncertainty in CMIP5 projections related to stratosphere-troposphere coupling, J. Geophys. Res. Atmos., 119, 7979-7998, doi:10.1002/2013JD021403.
Ref: AEA/ED45367/Issue Number 1 31

Baseline Measurement and Analysis of UK Ozone and UV
6 Other Project Activities 6.1 Project Meetings The annual Project Review meeting was held on the 08th January 2013
6.2 Other Meetings There have been a number of international conferences and meetings over the project duration which have helped to raise the profile of UK Ozone and UV monitoring activities. Selected synopses and a list of posters presented, follow:
The 14th WMO-GAW Biennial Brewer Users Group Workshop was held jointly with the 1st Eubrewnet Open Congress and Training School in Tenerife 24th to 28th March 2014.
The meeting was sponsored by COST Action ES1207 and WMO. Discussions were focused on Brewer characterisation and calibration issues and over 30 countries were represented.
6.3 WMO SAG-Ozone Meeting, Hohenpeissenberg, 6th to 8th May 2014:
Attended by John Rimmer (University of Manchester) as ex-officio member. Following the recommendations of ACSO the new ozone absorption cross sections from IUP, Bremen will be implemented for ground station measurements but not until full consistency checks have been carried out including Brewer, Dobson and Satellite. NASA still remains reluctant to change from the DBM set. John Rimmer gave an update on the status of Eubrewnet and Gordon Labow (NASA) gave an undertaking to see that overpass data was available for all stations participating in the network.
Tony Collavechia (Environment Canada) gave a presentation describing on-going work with WOUDC. There are plans to update and modify the database to better serve the community and also to look at the storage of near real time data. While efforts are being applied in this area it may result in delays in the data submission processes.
It was recognised that data providers are often unacknowledged in scientific publications and ways of addressing this problem are being investigated.
6.4 COST Annual Progress Conference, Dubrovnik, 12th to 14th May 2014
Attended by John Rimmer as Chair of COST Action ES1207. All Action Chairs were required to give a presentation on scientific progress for the preceding year. It was also announced that major changes within COST will take place. This will include the replacement of the Domain Committees with a new Scientific Committee.
Ref: AEA/ED45367/Issue Number 1 32

Baseline Measurement and Analysis of UK Ozone and UV
6.5 UNEP-WMO Ozone Research Managers Meeting, Geneva, 14th to 16th May 2014
Attended by John Rimmer as invited expert. John Rimmer gave a presentation on COST Action ES1207 - Eubrewnet which was well received and has resulted in further applications in particular from Australia and possibly Canada. John Rimmer was also appointed discussion leader and joint author for the data management and archiving section of the final report for the Parties.
6.6 COST Action ES1207 - EuBrewNet WG3 Meeting Arosa, 23rd and 24th July 2014.
John Rimmer attended the meeting, the purpose of which was to discuss the implementation of the new near real time Brewer database. This database is now accepting trial data.
6.7 Eubrewnet John Rimmer attended the meeting, the purpose of which was to discuss the implementation of the new near real time Brewer database. This database is now accepting trial data.
Ref: AEA/ED45367/Issue Number 1 33
Baseline Measurement and Analysis of UK Ozone and UV
Ref: AEA/ED45367/Issue Number 1

The Gemini Building Fermi Avenue Harwell Didcot Oxfordshire OX11 0QR
Tel: 01235 75 3000 www.ricardo-aea.com