baseline assessment report economic development and land …
TRANSCRIPT

BASELINE ASSESSMENT REPORT
ECONOMIC DEVELOPMENT AND
LAND USE Strategic Environmental Assessment of the
Hydropower Sector in Myanmar

© International Finance Corporation 2017. All rights reserved.
2121 Pennsylvania Avenue, N.W.
Washington, D.C. 20433
Internet: www.ifc.org
The material in this work is copyrighted. Copying and/or transmitting portions or all of this work without
permission may be a violation of applicable law. IFC encourages dissemination of its work and will
normally grant permission to reproduce portions of the work promptly, and when the reproduction is for
educational and non-commercial purposes, without a fee, subject to such attributions and notices as we
may reasonably require.
IFC does not guarantee the accuracy, reliability or completeness of the content included in this work, or for
the conclusions or judgments described herein, and accepts no responsibility or liability for any omissions
or errors (including, without limitation, typographical errors and technical errors) in the content
whatsoever or for reliance thereon. The boundaries, colors, denominations, and other information shown
on any map in this work do not imply any judgment on the part of The World Bank concerning the legal
status of any territory or the endorsement or acceptance of such boundaries. The findings, interpretations,
and conclusions expressed in this volume do not necessarily reflect the views of the Executive Directors of
The World Bank or the governments they represent.
The contents of this work are intended for general informational purposes only and are not intended to
constitute legal, securities, or investment advice, an opinion regarding the appropriateness of any
investment, or a solicitation of any type. IFC or its affiliates may have an investment in, provide other
advice or services to, or otherwise have a financial interest in, certain of the companies and parties.
All other queries on rights and licenses, including subsidiary rights, should be addressed to IFC’s
Corporate Relations Department, 2121 Pennsylvania Avenue, N.W., Washington, D.C. 20433.
International Finance Corporation is an international organization established by Articles of Agreement
among its member countries, and a member of the World Bank Group. All names, logos and trademarks
are the property of IFC and you may not use any of such materials for any purpose without the express
written consent of IFC. Additionally, “International Finance Corporation” and “IFC” are registered
trademarks of IFC and are protected under international law.
Cover photo credit: ICEM 2017

ACK NO W L E DG E ME NT S
The Strategic Environmental Assessment (SEA) for the Hydropower Sector in Myanmar
would not have been possible without the leadership of the Ministry of Natural Resources
and Environmental Conservation (MONREC) and Ministry of Electricity and Energy
(MOEE), with support from the Australian government. Myanmar government focal points
for this study including Daw Thandar Hlaing, U Htoo Aung Zaw, U Nay Lin Soe and U Sein
Aung Min played a critical role at all stages of the SEA process. U Hla Maung Thein, Daw
Mi Khaing, U Tint Lwin Oo and Dr. San Oo guided the work of the SEA and focal points.
These individuals provided technical inputs and facilitated working relations.
International Centre for Environmental Management (ICEM) and Myanmar Institute for
Integrated Development (MIID) prepared the SEA with IFC. ICEM’s technical team included
Jeremy Carew-Reid, Rory Hunter, Edvard Baardsen, Jens Grue Sjørslev, John Sawdon,
Kyaw Moe Aung, Lina Sein Myint, Lois Koehnken, Lwin Wai, Mai Ky Vinh, Peter-John
Meynell, Rick Gregory, Stephen Gray, Vuong Thu Huong, Win Myint, Yan Min Aung, and
Yinn Mar Swe Hlaing.
The IFC team guiding the SEA included Kate Lazarus, Pablo Cardinale, Matt Corbett, Naung
San Lin and Tiffany Noeske. Vikram Kumar, IFC Country Manager for Myanmar provided
valuable inputs. We also recognize the ongoing support of IFC’s Environmental and Social
Governance Department and Infrastructure Department, as well as the feedback and
collaboration received from colleagues at The World Bank.
We are thankful for the generous support from the Australian Government including John
Dore, Rachel Jolly, Nick Cumpston, Dominique Vigie, Tim Vistarini, Ounheun Saiyasith and
Thipphavone Chanthapaseuth.
We are grateful to the dedicated civil society organizations, NGOs, SEA Advisory and Expert
Groups, and the Hydropower Developers’ Working Group for contributing to this study and
working to advance sustainability in Myanmar’s hydropower sector.
i
ABBREVIATIONS
AAC Annual Allowable Cut
ADB Asian Development Bank
AIIB Asian Infrastructure Investment Bank
ASEAN Association of Southeast Asian Nations
BAU Business As Usual
CSO Civil Society Orgnisation
ECA Export Credit Agency
EG Expert Technical Group
FAO Food and Agriculture Organisation of the United Nations
GDP Gross Domestic Product
GoM Government of Myanmar
HP Hydropwer
HPP Hydropower Project
ICEM International Centre for Environmental Management
IFC International Finance Corporation
IPP Independent Power Producer
JICA Japan International Cooperation Agency
LNG Liquiefied Natural Gas
LPG Liquiefied Petroleum Gas
MEMP Myanmar Energy Master Plan
MOALI Ministry of Agriculture, Livestock and Irrigation
MOECAF Ministry of Environmental Conservation and Forestry
NTFP Non-Timber Forest Product
O&MO Operation and Maintenance
PDR People’s Democratic Republic
PPA Power Purchase Agreement
PPP Purchasing Power Parity
R&D Research and Development
SEA Strategic Environmental Assessment
T&D Transmission and Distribution
UN United Nations
USDA Unites States Department of Agriculture

ii
TABLE OF CONTENTS
ABBREVIATIONS ...................................................................................................................... I
TABLE OF CONTENTS ............................................................................................................ II
LIST OF TABLES ..................................................................................................................... III
LIST OF FIGURES ................................................................................................................... III
EXECUTIVE SUMMARY .........................................................................................................V
1 HYDROPOWER AND THE ECONOMIC SECTORS .................................................. 1 1.1 Myanmar’s economic situation ....................................................................................... 1 1.2 The relationship between hydropower development and economic development .......... 3
2 ENERGY ........................................................................................................................ 8 2.1 Power sector baseline ...................................................................................................... 8 2.2 Business As Usual (BAU) projection ........................................................................... 14
3 AGRICULTURE .......................................................................................................... 16 3.1 Resources ...................................................................................................................... 16 3.2 Agricultural production in Myanmar ............................................................................ 19 3.3 Shift from subsistence to commercial agriculture ......................................................... 22 3.4 Swidden cultivation....................................................................................................... 24 3.5 Riverbank gardens......................................................................................................... 25 3.6 Employment and livelihoods ........................................................................................ 26 3.7 Development issues in the agricultural sector ............................................................... 26 3.8 Environmental issues in the agricultural sector ............................................................ 26 3.9 Agricultural and associated environmental issues by river basin ................................. 28 3.10 Potential interactions between hydropower and the agricultural sector .................... 29 3.11 Business As Usual (BAU) projection/projected baseline ......................................... 30 3.12 ANNEX to agriculture section .................................................................................. 31
4 FORESTRY ................................................................................................................. 35 4.1 Resources ...................................................................................................................... 35 4.2 Production and economic significance.......................................................................... 37 4.3 Employment and livelihoods ........................................................................................ 39 4.4 Key issues in the forestry sector.................................................................................... 40 4.5 Forestry resources, production and known issues by basin .......................................... 46 4.6 Potential Interactions between hydropower and the forestry sector.............................. 47 4.7 Business As Usual (BAU) projection ........................................................................... 49
5 MINING ....................................................................................................................... 51 5.1 Resources ...................................................................................................................... 51 5.2 Production and economic significance.......................................................................... 52 5.3 Data accuracy ................................................................................................................ 54 5.4 Employment and livelihoods ........................................................................................ 55 5.5 Development issues in the mining sector ...................................................................... 56 5.6 Environmental and social issues relating to mining ...................................................... 57 5.7 Extent of mining in Myanmar and recent growth ......................................................... 58 5.8 Mining activities by major river basin .......................................................................... 59 5.9 Sand mining .................................................................................................................. 66 5.10 Potential Interactions between hydropower and mining ........................................... 66 5.11 Business As Usual (BAU) projection ....................................................................... 67

iii
6 TRANSPORTATION ................................................................................................... 69 6.1 Myanmar’s road network .............................................................................................. 69 6.2 Road network development .......................................................................................... 71 6.3 Key development issues related to road sector development ........................................ 71 6.4 Environmental issues related to road development ....................................................... 72 6.5 River transport network ................................................................................................ 73 6.6 River transport development ......................................................................................... 76 6.7 Environmental issues .................................................................................................... 77 6.8 Navigation by major river basin .................................................................................... 77 6.9 Potential interaction with hydropower .......................................................................... 77 6.10 Business As Usual (BAU) projection ....................................................................... 78
LIST OF TABLES
Table 1.1: Real value added by sector 2000/2001-2014/2015 (Billion Kyat, constant 2010 prices) ...... 2
Table 1.2: Potential interactions between hydropower and main economic activities ........................... 5
Table 1.3: Ranking the potential significance for interactions between existing hydropower and
economic activities for the SEA.............................................................................................................. 7
Table 3.1: Main crops area sown and production 2013-2014 ............................................................... 20
Table 3.2: Potential interactions between hydropower and agricultural production ............................. 29
Table 4.1: Forest resources in Myanmar by forest type 2010 (left) and legal classification (right) ..... 36
Table 4.2: Characteristics of the timber trade from different sources ................................................... 42
Table 4.3: Potential interactions between hydropower and forestry ..................................................... 47
Table 5.1: Estimated major mineral reserves in Myanmar ................................................................... 51
Table 5.2: Production of selected minerals in Myanmar 2009 - 2013 .................................................. 52
Table 5.3: Mining area by major river basin and certainty in Myanmar 2014 ..................................... 59
Table 5.4: Potential interactions between hydropower and mining ...................................................... 66
Table 6.1: Typical erosion mechanisms and environmental impacts related to road type .................... 72
Table 6.2: Navigable waterways by length ........................................................................................... 76
Table 6.3: Potential interactions between hydropower and transport ................................................... 77
LIST OF FIGURES
Figure 1.1: Real GDP growth (left) and GDP per capita (right) 1960 - 2015 ......................................... 1
Figure 1.2: Major sector share of GDP (left) GDP growth by sector contribution 2012/2013-
2015/2016 (right) .................................................................................................................................... 2
Figure 1.3: Trade and current account balance 2000-2015 (left), composition of exports by category
share 2014 (right) .................................................................................................................................... 3
Figure 2.1: Electricity production by generation technology 2000-2001 to 2013-2014 ........................ 8
Figure 2.2: Installed capacity by generation technology 2000-2001 to 2013-2014 ................................ 8
Figure 2.3: Peak load growth 1989-2014 ................................................................................................ 9
Figure 2.4: Demand supply gap 2009 - 2015 ........................................................................................ 10
Figure 2.5: Electricity consumption by sector 2000-2001 to 2013-2014 .............................................. 11
Figure 2.6: Comparing energy and capacity costs for generation technologies .................................... 13
Figure 2.7: Installed capacity by generation type and ownership 2015 ................................................ 13
Figure 2.8: Medium demand and peak load projections for Myanmar ................................................. 15
Figure 3.1: Change in cultivable area 1995-1996 to 2014-2015 ........................................................... 16
Figure 3.2: Myanmar’s annual average rainfall by zone (mm) (left) and dominant soil types (right) .. 17

iv
Figure 3.3: Crop calendar for main food crops ..................................................................................... 17
Figure 3.4: Irrigation infrastructure and irrigable area 1995 - 2015 (left) and annual water usage by
sector (Km3) 2013 (right) ...................................................................................................................... 18
Figure 3.5: Government and USDA rice production statistics in comparison 1960-2016.................... 19
Figure 3.6: Change in area, yield and production for main crops in Myanmar 1961-2014 .................. 21
Figure 3.7: Large areas cleared for plantation Kachin state 2012 ......................................................... 23
Figure 3.8: Area of concessions granted to domestic companies March 2014 ..................................... 23
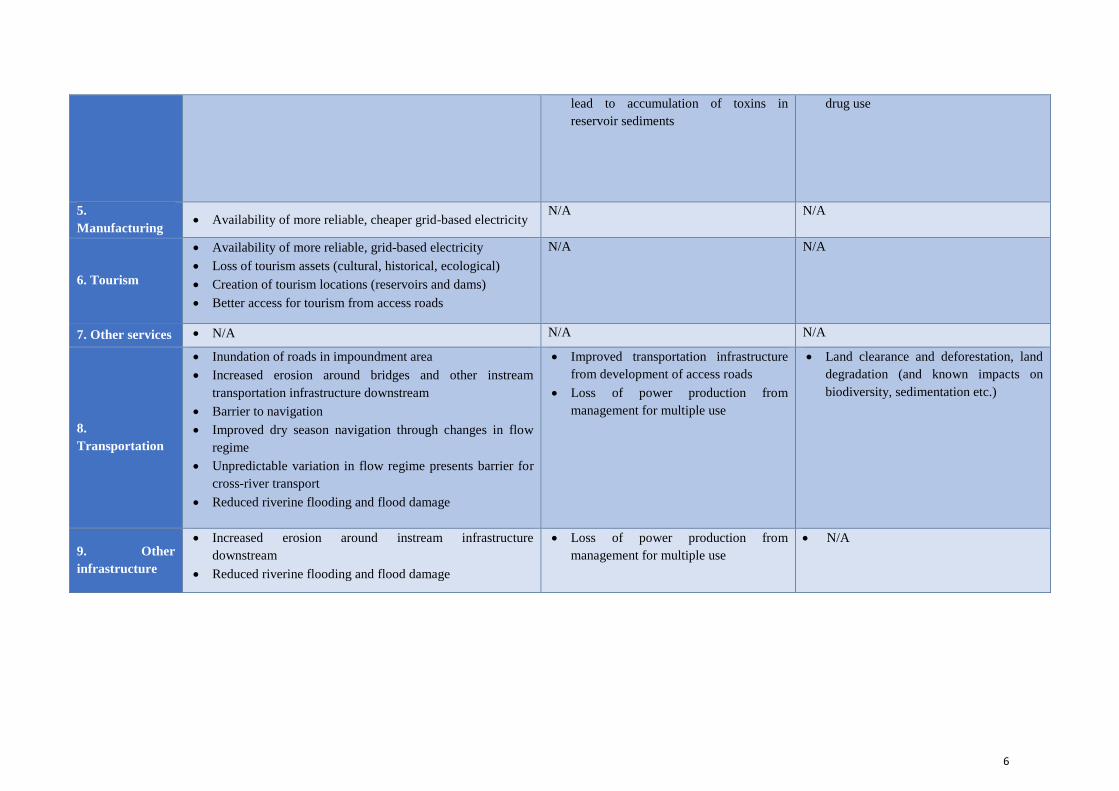
Figure 3.9: Intensively farmed area in Northern Shan State 2015 ........................................................ 24
Figure 3.10: Swidden mosaic in Eastern Shan State 2016 .................................................................... 25
Figure 3.11. Irrigable area and net sown area, 1995-1996 to 2030-2031 ............................................ 30
Figure 3.12. Sown area, yield and production for rice to 2001-2031 ................................................... 31
Figure 4.1: Forest cover in Myanmar 1990-2015 and deforestation rate 1991-2015 ........................... 35
Figure 4.2: Main forest ecosystems in Myanmar .................................................................................. 36
Figure 4.3: Forestry value added and share of national GDP 2001/2002 - 2013/2014 ......................... 37
Figure 4.4: Timber exports by value (left) and volume (round-wood equivalent) (right) 2000-2013 .. 38
Figure 4.5: Timber production by region teak (left) and other hardwoods (right) 1995-2015 ............. 38
Figure 4.6: Townships showing remaining intact forest 2014 (left) and areas showing most forest loss
2002-2014 (right) .................................................................................................................................. 40
Figure 4.7: Teak AAC and production plus estimated wastage and illegal extraction ......................... 43
Figure 4.8: Other hardwood AAC and production plus estimated wastage and illegal extraction ....... 43
Figure 4.9: Area allocated for agribusiness concessions and area planted 2012-2013 ......................... 44
Figure 4.10: Palm oil concessions granted in Southern Tanintharyi region 2013 (left), landcover
change Katha Township Sagaing region 2002-2014 (right) ................................................................. 45
Figure 4.11: Forest loss due to mining 2002-2014 Homalin Township, Sagaing region (left), Satellite
image of Homalin Township 2012, showing mining activity along the Uyu river (right) ................... 45
Figure 5.1: Major mineral resources (left) and oil and gas fields (right) .............................................. 51
Figure 5.2: Mineral extraction activities in Myanmar 2016 (left) estimated ground disturbance due to
mining activities 2014 (right) ................................................................................................................ 54
Figure 5.3: Mining sector value-added (left) and differing estimates of value of Jade exports in 2013-
2014 context (right) ............................................................................................................................... 55
Figure 5.4: National employment in mining sector 1995-2014 (left) share of employment by
region/state 2014 (right) ........................................................................................................................ 56
Figure 5.5: High certainty mining area 2002 and 2015 (left) proportion of national by region/state
(right) .................................................................................................................................................... 58
Figure 5.6: High certainty land disturbance due to mining in 2015 by major river basin .................... 59
Figure 5.7 Mining activity in Ayeyarwady River Basin ....................................................................... 61
Figure 5.8. Mining activity in the Mandalay Region ............................................................................ 62
Figure 5.9. Mining Activity in the Chindwin Basin.............................................................................. 63
Figure 5.10. Mining areas in Uyu River Basin ..................................................................................... 64
Figure 6.1: Road Construction Type by Length (Km) 2013 ................................................................. 69
Figure 6.2: Myanmar's road network .................................................................................................... 70
Figure 6.3: Road expansion and share of paved road 2004-2013 ......................................................... 71
Figure 6.4: Navigable waterways in Myanmar ..................................................................................... 74
v
EXECUTIVE SUMMARY
Hydropower development in Myanmar has potentially wide-ranging impacts. Hydropower
development in Myanmar is taking place in the context of sustained and rapid economic growth over
approximately the last two decades. This has been driven predominantly by growth in the industrial
sector, although growth in the agricultural and service sectors has also been important. Extractive and
natural-resourced based industries have been an important component of this growth with natural gas,
minerals and timber comprising the lion’s share of exports.
The economics baseline develops a broad strategic picture of relevant economic sectors, highlights
development and environmental issues, identifies interactions with hydropower development and
potential cumulative impacts of hydropower and other economic development. Based upon
consultations throughout potentially hydropower affected areas of the country, five economic sectors
were identified as having important linkages with hydropower that the SEA should investigate, these
were i) the Power sector; ii) Agriculture; iii) Forestry; iv) Mining; and, v)Transportation.
Power sector - Hydropower has significant direct economic benefits. It represents an important part
of grid-based electricity generation, accounting for around 3.5 GW of installed capacity and 72% of
grid-based electricity generation in 2014. The value of the electricity generated per year is best
estimated in terms of the value of alternative supply of electricity, which would make the
approximately 6,920 GWh generated by hydropower in 2014 worth USD 735 million.1
Agriculture - agriculture has expended relatively rapidly since the 1990s with significant increases in
land under cultivation, irrigable area and cropping intensity. The use of agricultural inputs has also
grown rapidly with increases in the use of agricultural chemicals and mechanisation in particular.
These changes have led to significant increases in agricultural productivity over the last two decades.
However, in recent years value-added growth in the sector has been low. Significant interactions
between hydropower and agriculture include:
• Reduced nutrient transport;
• Reduced deltaic stability;
• Increased erosion downstream of HP plants;
• Unseasonal changes in water flow or availability;
• Loss of riverbank gardens associated with changes in flow regime and/or sedimentation;
• Loss of agricultural land in area inundated by HP plants with a reservoir;
• Loss of access to land in watershed protection area;
• Reduced flooding of plants managed for flood reduction;
• Increased water availability for irrigation if plants managed for multiple use;
• Improved electricity supply;
• Deforestation and knock-on consequences for other sectors (such as flooding, erosion and soil
degradation) and biodiversity loss;
• Increased pollution from agricultural run-off compounding reservoir water-quality issues; and,
• Increased soil degradation, erosion and sedimentation caused by agricultural practices.
Forestry - forestry represents a relatively small and declining share of GDP. Although value-added
has grown considerably since the early 2000s, in recent years production in the sector has declined, in
part due to policies banning the export of raw timber. Illegally exported timber, not accounted for in
official statistics, is typically smuggled across the border to China, remains important. The key
development and environmental issue associated with the forest sector is deforestation and
unsustainable use of timber resources. Important interactions with hydropower development were
identified as:
• Clearance of forest from inundation areas and transmission line corridors;
• Deforestation through better access to forests, through road and other infrastructure, including
during the plant construction period; and
• Increased watershed erosion due to deforestation and sedimentation in reservoir.
1 Deloitte, 2015, Myanmar Power Sector Financial Analysis and Viability Action Plan Inception Report.

vi
Mining - Myanmar’s complex geology means it has potentially large and varied mineral resources
throughout the country, many of these resources have yet to be thoroughly explored. Mining remains
one of Myanmar’s most important productive sectors. Although like forestry the sector is plagued by
informal and illegal practices meaning actual levels of production from the sector are likely much
higher than official figures suggest, especially in the Jade mining sector. Important interactions
between the development of the sector and hydropower development include:
• Changes in river flow cause by hydropower development may alter accessibility of fluvial
deposits;
• Any improvement in the availability of electricity for mining operations due to hydropower
would benefit productivity in the sector;
• Access to mineral deposits in developed hydropower watersheds could be curtailed;
• Increases in watershed erosion, sedimentation and disposal of waste from mining affect the
long-term productivity of downstream hydropower plants;
• Water pollution from mining may compound issues with and reservoir water quality; and
• Mining related land degradation due to deforestation may compound existing issues.
Transportation - this is included as a key sector for consideration in the SEA due to potential
interactions between the development of the sector and hydropower and the potential for cumulative
environmental impacts stemming from the transportation sector development and hydropower.
Myanmar has the rapid expansion and upgrading of the national road network over the last decade.
However, the road sector still suffers from underinvestment, many roads are poor quality and the lack
of provision of all-weather rural roads. Interaction with hydropower development include:
• Flooding of roads in inundation area;
• Increased erosion, sediment generation and land-slide risk from road development may
negatively affect downstream hydropower developments; and
• Deforestation and land degradation associated with roads may compound forest loss due to
hydropower.
Myanmar has over 9,600 Km of navigable rivers. The most important navigable waterways are those
of the Ayeyarwady, Chindwin and the network of waterways in the Ayeyarwady delta. Despite the
potential of the physical network, navigation is often difficult along the main rivers because of
shallow water during the dry season, shifting river channels and the lack of adequate terminal
facilities. The sector has declined in relative importance due to the development of road transport, but
in absolute terms the sector has seen moderate growth. Development of the sector is still stymied by
ineffective planning and a lack of investment. Interactions with hydropower include:
• Increased dry season flows due to regulation by large upstream hydropower plants, improving
navigability;
• Conversely unpredictable changes in water level due to hydropower operations may pose a
hazard to navigation;
• Unpredictable changes in river morphology due to hydropower may reduce navigability; and
• Hydropower plans may block linear navigation routes in upstream areas of catchments.

1
1 HYDROPOWER AND THE ECONOMIC SECTORS
Hydropower development in Myanmar has potentially wide ranging impacts. Other sections of the
SEA deal with the implications of hydropower development for bio-physical systems and
communities. This section takes the first step in developing an investigation of the linkages between
hydropower and the economy and the likely impacts of hydropower development on economic
production.
Following the SEA methodology, the economic sectors baseline seeks to develop a broad strategic
picture of relevant economic sectors, highlight development and environmental issues, identify
interactions with hydropower development and identify potential cumulative impacts of hydropower
and other economic development. The first section of this report is a brief overview of the
performance and structure of Myanmar’s economy. This is followed by a summary of interactions
between hydropower development and various economic sectors. This section also includes an
identification of the most relevant economic sectors for consideration in the SEA. The rest of the
report looks at the economic sectors in turn, namely section 2. Power; 3. Agriculture; 4. Forestry; 5.
Mining; and, 6. Transportation (both road and navigation).
1.1 Myanmar’s economic situation
Myanmar is entering a period of rapid and significant economic growth and structural change as it
begins to develop a market economy. During the late 1990s and 2000s, Myanmar was the beneficiary
of rapid growth in the broader region and the boom in demand for commodities as well as modest
domestic reforms enabling some private sector development. This trend has continued into the 2010s
as political and continuing economic liberalisation has enabled increased trade and foreign
investment.2 Between 2000-2010 average real economic growth ran at approximately 12% and
between 2010-2015 about 8% (Figure 1.1). Similarly, growth in gross domestic product (GDP) per
capita took off in the mid-1990s after a long period of stagnation. In 2015, per capita GDP stood at
approximately USD 1,310 in constant 2010 prices or USD 4,930 at PPP3 (constant 2011 USD).4
Figure 1.1: Real GDP growth (left) and GDP per capita (right) 1960 - 2015
Source: World Bank, 2017, World Development Indicators Database
That growth has been accompanied by rapid structural changes in the economy. As is typical of the
growth pattern in developing Asia, over the last 10-15 years, growth has been driven largely by the
2 IMF, 2015 3 There are two ways to measure GDP (total income of a country) of different countries and comparing them. One way, called GDP at
exchange rate, is when the currencies of all countries are converted into USD. The second way is GDP (PPP) or GDP at Purchasing Power Parity (PPP). PPP compares different countries' currencies through a market "basket of goods" approach. According to this concept, two
currencies are in equilibrium or at par when a market basket of goods is priced the same in both countries (taking into account the exchange
rate). 4 This compares to 2015 figures of USD 1,020 in Cambodia, USD 6,498 in China, USD 1,531 in Lao People’s Democratic Republic (PDR),
USD 3,834 in Indonesia, USD 2,640 in the Philippines, USD 5,775 Thailand and USD 1,685 in Vietnam.
-15
-10
-5
0
5
10
15
20
0
10
20
30
40
50
60
70
80
1960 1970 1980 1990 2000 2010
Percent
BillionUS$(Constant2010prices)
GDP(Constant2010US$) RealGDPgrowth
5per.Mov.Avg.(RealGDPgrowth)0
200
400
600
800
1,000
1,200
1,400
1960 1970 1980 1990 2000 2010
Constant2010US$

2
industrial and services sectors, with growth rates of 21.4% and 12.5% respectively for 2000-2001 and
2014-2015 (Table 1.1). This industry/services driven growth contrasts with the broad agriculture
sector which has seen much lower levels of growth in value added over the same period. Until 2010-
2011, agriculture sector growth was around 9.6%. Since 2010 growth has stagnated (see discussion
below).5
Agriculture’s share of GDP has steadily declined from around 57% of GDP in 2000 to around 27% of
GDP by 2015, whereas the shares attributable to the industrial and service sectors have increased
(Figure 1.2 and Table 1.1).
Figure 1.2: Major sector share of GDP (left) GDP growth by sector contribution 2012/2013-2015/2016
(right)
Source: World Bank, 2017, World Development Indicators Database (left), World Bank, 2016, Myanmar
Economic Monitor 2016 (right)
A privatisation and liberalisation process is underway and the government is actively promoting
foreign investment in all sectors of the economy. Nevertheless, Myanmar remains a fragile state still
emerging from over six decades of conflict and economic mismanagement. There remains a long way
to go as state economic enterprises still dominate many traditional sectors of the economy
(particularly in resource extraction and utilisation). The economy is plagued by a weak and
underdeveloped legislative framework, poor institutions and limited governance capacity at the
central and sub-national level and by endemic corruption. Indeed the World Bank’s Doing-Business
2017 report ranks the country at 170 out of 190 countries, which ranks as the worst performance in
Association of Southeast Asian Nations (ASEAN), alongside countries such as Afghanistan and Iraq.6
Similarly, Transparency International’s Corruption Perception Index ranks Myanmar 136 out of 176
countries.7 These regulatory and institutional weaknesses are critical particularly in the natural
resources sectors.
Table 1.1: Real value added by sector 2000/2001-2014/2015 (Billion Kyat, constant 2010 prices)
Sectors GDP (Billion Kyat, constant 2010 prices) AAGR Trend
5 Statistical data, particularly agricultural and socio-economic indicators are notoriously poor. Ware and Clarke for example note “Accurate
statistical data for Myanmar is lacking, and what is available is of questionable validity. This is the result of several factors including the
government having limited control over parts of the territory, limited resources for data gathering and analysis, and data being manipulated
for internal and external consumption.” (Ware, A. and Clark, M. 2009. Consequences of Sanctions: Are the MDGs Relevant in Myanmar? Paper presented at the MDG Update Conference, ACFID and La Trobe University, Melbourne, 30th November 2009.). See also Haggblade
et al., 2013, A Strategic Agricultural Sectorand Food Security Diagnostic for Myanmar. Consultancy report for USAID Burma. 6 World Bank, 2016, Doing-Business 2017. Economy Profile Myanmar. Retrieved from
http://www.doingbusiness.org/~/media/wbg/doingbusiness/documents/profiles/country/mmr.pdf. 7 Transparency International, 2016, Corruption Perceptions Index 2016. Retrieved from
http://www.transparency.org/news/feature/corruption_perceptions_index_2016
0
10
20
30
40
50
60
70
2000 2002 2004 2006 2008 2010 2012 2014
Percent
Agriculture Industry Services

3
2000-
2001
2005-
2006
2010-
2011
2011-
2012
2012-
2013
2013-
2014
2014-
2015
2000/2001-
2004/2005
Agriculture 5,884 10,974 14,659 13,649 13,790 14,436 14,761 6.3
Agriculture 5,016 9,027 11,108 10,079 9,982 10,377 10,412 5.0
Livestock & Fishery 811 1,800 3,392 3,409 3,642 3,903 4,237 11.7
Forestry 58 147 158 160 167 156 112 4.5
Industry 996 4,116 10,528 13,143 14,594 15,818 18,232 21.4
Energy 19 38 67 2,033 2,415 2,460 3,245 40.6
Mining 41 133 299 426 368 461 634 20.0
Processing & Manufacturing 737 3,009 7,900 8,283 9,058 9,735 10,550 19.4
Electric Power 14 53 422 437 541 586 748 30.5
Construction 185 883 1,839 1,964 2,213 2,576 3,055 20.5
Services 3,400 8,415 14,590 15,209 16,696 18,626 19,934 12.5
Transportation 589 2,455 4,595 4,999 5,376 5,836 6,073 16.8
Communications 28 247 332 365 533 770 988 26.7
Financial Institutions 11 20 38 59 75 96 110 16.8
Social & Administrative
Services 158 215 916 897 1,166 1,418 1,638 16.8
Rental & Other services 141 376 738 801 964 1,115 1,243 15.6
Trade 2,471 5,103 7,971 8,089 8,583 9,389 9,882 9.7
Total GDP 10,280 23,505 39,777 42,001 45,081 48,880 52,927 11.5
Source: Department of Planning 2016. World Bank, 2017, World Development Indicators Database (Note:
GDP growth figures based upon Government of Myanmar (GoM) figures differ slightly from World Bank
figures)
As is often the case with developing countries, Myanmar is running an increasingly significant current
account deficit (Figure 1.3, left). This is not uncommon for an economy which is newly liberalising,
but it can place national finances under strain and presents the question of how to finance the needed
investment. The deficit has been exasperated in recent years due to falling demand for the
commodities that still dominate Myanmar’s exports (Figure 1.3, right), resulting in falling export
prices and volumes. This serves to emphasise the continuing importance of the role played by natural
resource sectors.8
It should be borne in mind that the available official figures for exports reported here do not take into
account the large illicit trade in precious stones (notably jade, see section on the mining sector below),
narcotics (see section on the agricultural sector) and timber (see section on forestry sector), which are
all reputedly significant export earners.
1.2 The relationship between hydropower development and economic
development
As part of the SEA process the implications of hydropower development for other sectors are
considered. Hydropower development can have important implications for development and long-
term productivity of other economic sectors and sub-sectors. Similarly, there may be important
impacts from the conduct of economic activities to the development and long term productivity of the
hydropower sector. These interactions are often if not always realised through the changes to bio-
physical systems they cause. Finally, together with hydropower the conduct of economic activities
can contribute to broader, cumulative, changes to bio-physical systems. Part of the SEA is to
understand these interactions at the strategic level.
Figure 1.3: Trade and current account balance 2000-2015 (left), composition of exports by category share
2014 (right)
8 World Bank, 2016, Myanmar Economic Monitor, May 2016.

4
Source: World Bank, 2017, World Development Indicators Database (left), Simoes A., 2017, The Observatory of
Economic Complexity9
Hydropower constitutes an important part of the electricity generation with around 3.5 GW of
installed capacity accounting for 72% of grid-based electricity generation in 2014. From this
perspective hydropower clearly provides an essential service to the national economy and is critical
for future economic development. The value of the electricity generated per year is best estimated in
terms of the value of alternative supply of electricity. In the case of Myanmar this would be gas fired
generation at around 10.6 USc/KWh, which would make the approximately 6,920 GWh generated by
hydropower in 2014 worth USD 735 million.10 No figures on investment in the sector have been
available. However, based upon the assumption that each MW of hydropower capacity costs around
USD 2 million, the additional 2.3 GW of capacity installed between 2000-2001 and 2013-2014 imply
an investment of around USD 4.6 billion or around USD 350 million per year.
Table 1.2 summarises the possible interactions between hydropower and the major economic sectors.
These pathways have been identified through stakeholder consultations led by the SEA team with
CSOs, government (national and sub-national), the private sector, international organisations and
local communities in in Myanmar, inputs from expert technical groups (EGs), reviews of literature on
hydropower in the region and globally and the experience of the project team. Details of the
consultations which were held in the Thanlwin, Sittaung, Chindwin and Tanintharyi river basins, and
were attended by a diverse range of stakeholders, are included in a separate report Regional River
Basin Consultations - Key Findings. It should be noted that at this stage a very broad view was taken
of potential economic development issues and their interaction with hydropower to ensure in-so-far-
as-was-possible, all viewpoints were considered.
9Website. Retrieved from http://atlas.media.mit.edu/en/visualize/tree_map/hs92/export/mmr/all/show/2014/ on 28 February 2017. 10Deloitte, 2015, Myanmar Power Sector Financial Analysis and Viability Action Plan Inception Report.
-8
-6
-4
-2
0
2
4
6
8
-6
-4
-2
0
2
4
6
8
10
12
14
16
2000 2002 2004 2006 2008 2010 2012 2014
Percetnt(%
)
BillionUS$
Currentaccountbalance(BoP,currentUS$)
Goodsexports(BoP,currentUS$)
Goodsimports(BoP,currentUS$)
Currentaccountbalance(%ofGDP)

5
Table 1.2: Potential interactions between hydropower and main economic activities
Sector
Potential strategic impacts
Potential for hydropower impact
(i.e. affecting productivity of sector)
Potential for impact on hydropower
(i.e. affecting productivity of hydropower)
Potential for cumulative environmental
impact from activities in sector and
hydropwer
1. Agriculture
• Reduced nutrient transport
• Reduced flooding
• Increased water availability for irrigation
• Loss of land in inundation area/watershed protection area
• Reduced sediment load to delta - reduced deltaic accretion
• Loss of riverbank gardens (due to changes in flow regime)
• Higher dry season flows reducing saline intrusion in river
deltas
• Availability of more reliable, cheaper grid based electricity
• Land clearance for agriculture in
upstream watershed leading to increased
erosion and sedimentation in
hydropower reservoir
• Loss of power production from
management for multiple use
• Reservoir water quality affected by
agricultural run-off (sewage, fertilizers
and pesticides)
• Land clearance and deforestation, land
degradation (and known impacts on
biodiversity, sedimentation etc.)
2. Fisheries
• Loss of migratory fish species
• Loss of nutrients downstream leading to reduction in
fisheries (freshwater and marine)
• Increased potential for reservoir fisheries/aquaculture
N/A N/A
3. Forestry
• Loss of forest in inundation area
• Loss of forest in zone of influence around hydropwer plants
• Loss of forest due to additional land clearance for
agriculture to compensate losses in inundation areas and
riverbank gardens
• Land clearance for agriculture in
upstream watershed leading to increased
erosion and sedimentation in
hydropower reservoir
• Logging and forest clearance in
watershed causing increased
sedimentation
• Land clearance and deforestation, land
degradation (and known impacts on
biodiversity, sedimentation etc.)
4. Mining
• Loss of access to mineral resources in inundation areas
• Loss of easy access to gold bearing sediments on riverbanks
due to changes in flow regimes
• Availability of more reliable, cheaper grid-based electricity
• Mining activities upstream of
hydropower plants may cause increased
reservoir sedimentation
• Mining activities upstream and
uncontrolled emissions of pollutants
may affect reservoir water quality and
• Land clearance and deforestation, land
degradation (and known impacts on
biodiversity, sedimentation etc.)
• Influx of workers into forested areas
putting pressure on NTFPs and fisheries
• Public health issues and widespread
6
lead to accumulation of toxins in
reservoir sediments
drug use
5.
Manufacturing • Availability of more reliable, cheaper grid-based electricity
N/A N/A
6. Tourism
• Availability of more reliable, grid-based electricity
• Loss of tourism assets (cultural, historical, ecological)
• Creation of tourism locations (reservoirs and dams)
• Better access for tourism from access roads
N/A N/A
7. Other services • N/A N/A N/A
8.
Transportation
• Inundation of roads in impoundment area
• Increased erosion around bridges and other instream
transportation infrastructure downstream
• Barrier to navigation
• Improved dry season navigation through changes in flow
regime
• Unpredictable variation in flow regime presents barrier for
cross-river transport
• Reduced riverine flooding and flood damage
• Improved transportation infrastructure
from development of access roads
• Loss of power production from
management for multiple use
• Land clearance and deforestation, land
degradation (and known impacts on
biodiversity, sedimentation etc.)
9. Other
infrastructure
• Increased erosion around instream infrastructure
downstream
• Reduced riverine flooding and flood damage
• Loss of power production from
management for multiple use
• N/A

7
Based on the information from the regional river basin consultations through November and
December 2016 and the baseline assessment workshops in January 2017 a scoring exercise was
undertaken by the SEA team to focus on the areas of interaction between the sectors most important
for economic development objectives. Table 1.3 gives the results of this scoring exercise and
summarises a ranking of the potential significance of links between existing hydropower and other
economic activities.
Table 1.3: Ranking the potential significance for interactions between existing hydropower and economic
activities for the SEA
Sector
Sensitivity Exposure
(extent of
potential
impacts)2
Overall
significance for
HP
development3
Potential for
HP impact1
Potential
for impact
on HP1
Potential for
cumulative
environmental
impact1
Agriculture 3 2 3 3 24
Fisheries 3 0 3 3 18
Forestry 3 2 3 3 24
Mining 2 2 3 2 14
Manufacturing 2 0 0 3 6
Tourism 2 0 0 1 2
Other services 0 0 0 0 0
Transportation 2 2 3 3 21
Other
infrastructure 1 1 2 2 8
The scores were calculated as follows:
(i) The figures in the three sensitivity columns are scored from 0-3 depending on an assessment
of the potential sensitivity of the sector to impacts from/to hydropower and potential
cumulative impacts;
(ii) The figures in the exposure column score the potential extent of the impact for the sector (i.e.
the scope of the impact) again giving a number from 0-3;
(iii) The final column gives the overall significance of the interactions between hydropower and
the economic sector for economic development and the environment. It is calculated by
adding the first three columns and multiplying the result by the fourth column, this gives a
score between 0-27.

8
2 ENERGY
2.1 Power sector baseline
2.1.1 Power capacity and generation
Gross electricity generation has more than doubled over the last 13 years, from 5,118 GWh in 2000 -
2001 to about 12,278 GWh in 2013-2014, equivalent to an average annual growth rate of 6.5%
(Figure 2.1). Around 97% of this increase in production has come from the expansion of hydropower.
Its share of generation has increased over the same period from 37% in 2000-2001 to about 72% in
2013-2014. The remainder is made up largely of gas fired generation which has expanded from 2,500
GWh (49% of production) in 2000-2001 to around 2,800 GWh (23% of production) in 2013-2014.
Figure 2.1: Electricity production by generation technology 2000-2001 to 2013-2014
Source: NEMC, ADB, IES and MMIC, 2015, Myanmar Energy Master Plan 2016 to 2030
This pattern of increasing dominance of hydropower in the energy sector is reflected in the growth of
installed capacity (Figure 2.2). Between 2000-2001 and 2013-2014 capacity additions have been
dominated by FDI in hydropower, accounting for 2.3GW of new capacity. This includes the
commissioning of several large hydropower projects including Paunglaung (280 MW) in 2005,
Shweli (600 MW) in 2008, Yeywa (790 MW) in 2010 and Tapein (240 MW) in 2011. That growth
compares to about 50 MW of new gas capacity and the 120 MW Tigyit coal plant commissioned up
until 2013.11 Investment in gas has since increased substantially with the commissioning of around
650 MW between 2013 and 2016. In 2015/2016 installed capacity stood at 5,235 MW.12
Figure 2.2: Installed capacity by generation technology 2000-2001 to 2013-2014
11 Kee-Yung Nam,K.Y., Cham, M., and Halili, P.R., 2015, Power Sector Development in Myanmar. ADB Economics Working Paper
Series. No. 460. 12 Oxford Business Group, 2017, Myanmar 2017.
0
2,000
4,000
6,000
8,000
10,000
12,000
14,000
2000-2001 2003-2004 2006-2007 2009-2010 2012-2013
GWh
Hydro Steam Gas Diesel
0%
10%
20%
30%
40%
50%
60%
70%
80%
90%
100%
2000-2001 2003-2004 2006-2007 2009-2010 2012-2013
Share

9
Source: Kee-Yung Nam,K.Y., Cham, M., and Halili, P.R., 2015, Power Sector Development in Myanmar. ADB
Economics Working Paper Series. No. 460.
Peak load grew at around 6.5% between 2000-2008, growth accelerated between 2009-2014 to about
15% a year. Peak load in 2014 was an estimated 2,400 MW (Figure 2.3). Although peak load in 2013-
2014 was only a little over half installed capacity of around 4.5 GW, electricity supplies have been
dogged by load shedding and black-outs.13,14
Figure 2.3: Peak load growth 1989-2014
Source: Kee-Yung Nam,K.Y., Cham, M., and Halili, P.R., 2015, Power Sector Development in Myanmar. ADB
Economics Working Paper Series. No. 460.
Figure 2.4 shows the demand supply gap over the last six years, at about a third in 2012 and 2013.
The large and persistent gap between peak demand and firm power is due to the rapid growth in
13 According to a recent World Bank report, due to load shedding “realised peak” was only around 2.1 GW. See World Bank, 2016,
Electrifying Myanmar: Challenges and opportunities planning nation-wide access to electricity. Washington D.C. 14 Posner-Ross, R., 2015, Myanmar’s Path to Electrification. The Role of Distributed Energy Systems. Centre for Strategic and International
Studies.

10
power demand over the last decade, the cumulative impact of delays in power sector infrastructure
investment and an over-reliance on seasonally available hydropower. Low reliability, load shedding
and blackouts remain a problem despite the recent additions in hydropower and gas capacity.15
Figure 2.4: Demand supply gap 2009 - 2015
Source: Deloitte, 2015, Myanmar Power Sector Financial Analysis and Viability Action Plan Inception Report.
Consultancy Report for Myanmar Electric Power Enterprise.
Apart from shortfalls in generation capacity (from breakdowns and the seasonality of hydropower)
underinvestment in transmission and distribution (T&D) infrastructure has led to large-scale
transmission and distribution losses.16 T&D losses have decreased from around 30% in 2000-2001 to
around 20% in 2012-2014. Nevertheless these are still very high at around 2.4 TWh per year, of
which around 70% take place in the distribution network, and the remainder on the transmission
network.17
2.1.2 Power consumption
Following more than a decade of rapid growth, on-grid power consumption in 2013-2014 stood at
around 9.6 TWh, almost three times the consumption in 2000-2001 of 3.3 TWh, growing at an
average of 8.7% a year between 2000-2001 and 2013-2014. This growth has accelerated significantly
between 2009-2010 and 2013-2014 to a rate of 13.6% (Figure 2.1).18 Despite the rapid growth in
consumption, grid-based electricity consumption at around 160 KWh/capita, around 5% of the world
average in 2013-2014 remains low by international and regional standards.19
Moreover, those figures probably underestimate consumption. Firstly, some portion of T&D losses is
likely to be due to non-technical losses (available data does not distinguish between technical and
non-technical losses). Secondly, supply from isolated sources is likely to be significant. Micro and
localized grids are common in rural areas, and in urban areas and at industrial facilities back-up
generators are ubiquitous.20 The World Bank estimates that 22% of households have access to off-
15 World Bank, 2016, Electrifying Myanmar: Challenges and opportunities planning nation-wide access to electricity. Washington D.C. 16 Posner-Ross, R., 2015, Myanmar’s Path to Electrification. The Role of Distributed Energy Systems. Centre for Strategic and International
Studies. 17 NEMC, 2014, National Energy Policy. 18 NEMC, ADB, IES and MMIC, 2015, Myanmar Energy Master Plan (MEMP). 19 World Bank, 2016, Electrifying Myanmar: Challenges and opportunities planning nation-wide access to electricity. Washington D.C. 20 Figures from 2013 suggest that there was approximately 116 MW of off-grid or “isolated” capacity, of which 78 MW is diesel (see Win,
U.T., 2015, Opportunities and Barriers of Power Development in Myanmar. Presentation). This seems an underestimate, as based upon a
typical household generator rating of 20 kVA, this would mean there was only approximately 4,900 gensets in the country - this is low
compared to estimates for Cambodia.

11
grid, high-cost, low-reliability electricity supply.21 There are no figures on the number of back-up
generators in the country.
All sectors have seen a rapid growth in the consumption of grid-based electricity. In 2012-2013
MEMP estimates final consumption by sector as 44% for the industrial sector, 32% for the residential
sector and 20% for the commercial sector.22 Consumption in all three sectors has grown rapidly over
the last decade, although growth in industrial consumption accounts for the lion’s share of
consumption growth, followed by the residential sector and the commercial sector (Figure 2.5).
Figure 2.5: Electricity consumption by sector 2000-2001 to 2013-2014
Source: NEMC, ADB, IES and MMIC, 2015, Myanmar Energy Master Plan.
Given low levels of electrification and the reliance on isolated supply for off-grid supply and for grid-
back-up, a considerable portion of demand for modern energy services is unmet through grid-based
provision.
2.1.3 Exports
In recent years Myanmar has become a significant exporter of energy to China and Thailand. Off-
shore natural gas fields (Shwe, Yadana and Yetagun in the Andaman Sea) are the most important
official source of export revenues for the country, accounting for USD 3.71 billion in 2014-2015.23
Most of this gas currently goes to Thailand (1.1 billion cu.ft) and China (300-400 million cu.ft), with
the remainder (300-350 million cu.ft) being used domestically.24 To develop its gas and oil resources
Myanmar has relied upon production sharing contracts. As Myanmar shifts from the predominant pre-
reform focus of generating foreign exchange earnings, to one of using domestic energy resources to
support its own development, arrangements will have to allow for better serving domestic energy
needs.25
Electricity exports from hydropower plants in Myanmar have also been developed over the last
decade. Currently, Myanmar has capacity to export 520 MW to China. This consists of 221 MW from
the Dapein 1 project and 300 MW from Shweli 1 (i.e. half of the six 100 MW units). Dapein 1 makes
8% of the capacity available to the Myanmar grid at no cost, and provides a royalty of 15% of
revenues. Shweli 1 provides 50% of its capacity to the grid at no cost and pays a royalty of 10% of
revenues.26 This means that of the total installed hydropower capacity of about 3,150 MW, 2,630 MW
21 World Bank, 2016, Electrifying Myanmar: Challenges and opportunities planning nation-wide access to electricity. Washington D.C. 22 These figures do not account for the “other” category which remains unexplained. 23 Kee-Yung Nam,K.Y., Cham, M., and Halili, P.R., 2015, Power Sector Development in Myamar. ADB Economics Working Paper Series.
No. 460. 24 Oxford Business Group, 2017, Myanmar 2017. 25 Ibid. 26 Deloitte, 2015, Myanmar Power Sector Financial Analysis and Viability Action Plan Inception Report. Consultancy Report for Myanmar
Electric Power Enterprise.
0
2,000
4,000
6,000
8,000
10,000
12,000
2000-2001 2003-2004 2006-2007 2009-2010 2012-2013
GWh
Resedential
Industrial
Commercialandpublicservices
Other
0%
10%
20%
30%
40%
50%
60%
70%
80%
90%
100%
2000-2001 2003-2004 2006-2007 2009-2010 2012-2013
Share

12
serves domestic demand. More detail on the contents of these concessions or the Power Purchase
Agreements (PPAs) for these projects have not been available.
2.1.4 Drivers of demand growth
Growth in demand for electricity is associated with rapid economic growth. In the commercial and
industrial sectors expansion of production leads to greater demand. In particular, growth in more
energy intensive sectors such as manufacturing has led to increased electricity demand. This is
illustrated in Figure 2.5 by the increased share of industry in electricity consumption. Second, while
the overall number of households connected to the national grid remains low it is increasing quickly.
In 2010-2011 only 25% of households had a grid connection, by 2015-2016 the figure had increased
to around 34% of households. This represents a growth in household connections of around 296,000
per year.27 At the same time income growth and increased household consumption is increasing the
demand for energy services and electricity per household (as ownership of air conditioners,
refrigerators and other household goods increases). This has driven the rapid expansion of electricity
demand in the residential sector.
Overall Myanmar is not only seeing increasing electricity demand due to general expansion of the
economy, but, also an increase in the intensity of electricity use - in 2010 GDP per kWh was around
USD 7.6 (2010 constant prices). In real terms this figure has shrunk to USD 5.2 by 2015 -
representing an increase in electricity intensity of around 30%.28
2.1.5 Determinants of generation mix
Hydropower has accounted for most capacity additions over the last decade (Section 2.1.1 and Figure
2.2). This is due to the availability of good hydropower resources in Myanmar and the relatively low
cost of hydropower. Domestic coal resources are limited and of low quality sub-bitumous coal or
lignite (see section on mining). To date only the plant at Tigyit (120 MW) is in operation and this has
been reportedly subject to technical problems.29 Myanmar has significant gas reserves, but these have
been developed by foreign companies and most current gas production is subject to long-term supply
agreements with Thailand and China. Recent capacity additions through Independent Power Producer
(IPP) plants and rental units have led to a significant increase in gas capacity. Thus far renewables
have made little headway beyond the provision of off-grid electricity.
While immediate availability of resources has determined technology development, cost remains of
utmost importance.
Figure 2.6 compares the basic cost characteristics of different technologies. In terms of both capacity
cost and energy cost large hydropower has a clear cost advantage. For higher capacity factors small
and medium scale hydropower also performs better than technologies other than supercritical coal.
This explains the preference for hydropower in the generation mix.
27 Wang, X., and Win, M., 2016, Myanmar: Towards Universal Access to Electricity by 2030. Presentation for ESMAP/World Bank.
Bangkok, 21 June 2016. 28 Based upon WDI GDP figures and MoEE power demand figures. 29 Oxford Business Group, 2017, Myanmar 2017.

13
Figure 2.6: Comparing energy and capacity costs for generation technologies
Source: NEMC, ADB, IES and MMIC, 2015, Myanmar Energy Master Plan
2.1.6 Financing power sector development
Myanmar’s power sector is financially constrained. End-user tariffs fall below the long term marginal
cost of supply, as a consequence the sector requires a subsidy of around USD 136 million per year.30
Unless a more price reflective tariff is adopted the need for subsidies will only increase with increased
electricity consumption. Subsidies put a strain on government finances, discourage potential energy
efficiency investment and discourage private sector investors who are sensitive to the financial
sustainability of the sector. What is more, given high demand growth in the sector there is an acute
need for significantly expanded generation and T&D investment (see section 2). Investment needs for
2014-2030 were estimated to range between USD 15.2 billion and USD 29.6 billion31, equivalent to
between USD 0.95-1.85 billion per year or 1.5-3.0% of GDP in 2015.
Figure 2.7: Installed capacity by generation type and ownership 2015
30 Kee-Yung Nam,K.Y., Cham, M., and Halili, P.R., 2015, Power Sector Development in Myamar. ADB Economics Working Paper Series.
No. 460. 31 Ibid. More recent estimates by some commentators suggest investment needs of up to US$37.5 billion between 2016 - 2030 (Oxford
Business Group, 2017, Myanmar 2017.)

14
Source: Deloitte, 2015, Myanmar Power Sector Financial Analysis and Viability Action Plan Inception Report.
Consultancy Report for Myanmar Electric Power Enterprise.
Much of the new investment in the power sector will have to come from the private sector (most of it
FDI) with support from international donors. Indeed, a large increase in private sector involvement in
the power sector indicate this trend is already apparent. While much of the capacity installed prior to
2010 was built and owned by the state (although more recently with support from Export Credit
Agencies (ECAs) and bilateral donors), subsequently most investment have been led by the private
sector, both foreign and domestic.32 Figure 2.7 gives a breakdown of current capacity by fuel type and
technology.
Although the investment climate may be challenging for some investors, there has been a significant
increase in unsolicited private sector investment proposals in recent years. For gas-based plants this
amounts to around 4,000 MW of capacity, for small and medium hydropower plants around 25,000
MW, and plans for around 20,000 MW of large (above 1,000 MW capacity), export oriented
hydropower projects (with some capacity reserved for domestic use).33
2.2 Business As Usual (BAU) projection
2.2.1 Power demand
An official plan for power sector development has yet to be adopted. As noted by a recent study of the
sector there have been a number of attempts by donors such as the United Nations (UN), World Bank,
Asian Development Bank (ADB) and Japan International Cooperation Agency (JICA) to develop an
acceptable sector plan, however at this stage the government has not adopted a coherent vision for the
sector.34 At the time of writing JICA is conducting a two-year technical assistance project to develop a
comprehensive energy sector operations plan. Here we draw on recent available planning documents
to determine key trends in the likely development of the sector to 2030.
Figure 2.8 gives medium demand projections for energy and peak load, suggesting the need to expand
generation by around 440 MW per year between 2015-2030. In terms of increase in power
consumption per capita this represents an increase from around 200 kWh/capita to 800 kWh/capita by
2030.35 It should be noted these represent the medium demand growth scenario, projections of
demand range between 41 TWh to 80.4 TWh and projections of peak load between 6,843 MW and
13,410 MW by 2030.36
32 Deloitte, 2015, Myanmar Power Sector Financial Analysis and Viability Action Plan Inception Report. Consultancy
Report for Myanmar Electric Power Enterprise. 33 Deloitte, 2015, Myanmar Power Sector Financial Analysis and Viability Action Plan Inception Report. Consultancy Report for Myanmar
Electric Power Enterprise. 34 Oxford Business Group, 2017, Myanmar 2017. 35 NEMC, ADB, IES and MMIC, 2015, Myanmar Energy Master Plan 36 Ibid.
Hydro,2040 MW
Gas,954.9 MW
Coal,120 MW
Hydro,1111MW
Gas,456.18MW
IPP+rentals,1567.18 MW
Statesector Privatesector

15
Figure 2.8: Medium demand and peak load projections for Myanmar
Source: ADICA, 2015, National Power Expansion Plan
2.2.2 Projected generation mix
The generation mix for future power sector development is a particular point of contention in the
plans for the sector. Coal was expected to play a major role in the sector but objections to coal plants
have forced a rethink, with more recent planning documents emphasising the potential role of
imported Liquiefied Petroleum Gas (LPG). Key considerations in determining the generation mix are
as follows:
• Coal - cheap and relatively easy to build. As such coal was slated to provide around 7,940
MW of capacity. As domestic coal resources are limited in quality and quantity most of this
capacity was expected to use imported coal. However, ambitions for coal have been reduced.
Most international donors are reluctant to fund coal fired power plants (with the exceptions of
Aisan Infrastructure Investment Bank (AIIB) and JICA), and local communities where coal
plants were to be situated have been hostile. Although some foreign investors from Thailand
and Indonesia still have an interest in pursuing investments in coal plants in Myanmar.37
• Hydropower - Likely to see a fall in its share of generation capacity and share of output.
While cheap and available, seasonality, and social and environmental impacts remain a
significant concern.
• Gas - Natural gas is more expensive than coal and available domestic supplies will not be
sufficient to meet power generation needs, especially in the case where the share of coal is not
increased. Imported Liquiefied Natural Gas (LNG) has been mooted as a potentially attractive
option, if suitable facilities for storage and regasification can be developed. Moreover, LNG
and natural gas generation units may be more attractive to private sector investors due to the
lower environmental and construction risks, and the relatively short construction time
needed38.
• Renewables - Considerable potential for wind and especially solar in Myanmar. Currently
around 670 MW of utility-scale solar is in the development pipeline, as well as a significant
number of small scale micro-grid projects. Wind also has significant potential with 3,708 MW
identified in feasibility studies in Chin, Rakhine, Ayeyarwady and Yangon.
Overall the process remains developer driven. While the government has solicited bids for a small
number of energy and electricity related projects, the majority of projects in the development pipeline
have been unsolicited. This pattern is typical of the region.
37 Oxford Business Group, 2017, Myanmar 2017. 38 Ibid.
0
10
20
30
40
50
60
70
2000 2005 2010 2015 2020 2025 2030
TWh
Demand
Actual
Mediumdemandprojection
0
1,000
2,000
3,000
4,000
5,000
6,000
7,000
8,000
9,000
10,000
2013 2016 2019 2022 2025 2028
MW
Peakload

16
3 AGRICULTURE
3.1 Resources
Myanmar is endowed with significant agricultural resource potential. In 2014-2015, of Myanmar’s
total land area of 67.7 million ha, around 12 million ha was cultivated, and a further 5.7 million ha
which could be brought into agricultural production (consisting of 440,000 ha of fallow land and 5.27
million ha of cultivable wasteland) (Figure 3.1).39 This suggests potential for additional expansion of
agricultural land. Most of the remaining uncultivated areas are in the less populous regions of Chin,
Kachin and Shan states.40 The average landholding size in Myanmar at around 2.6 ha, is significantly
larger than other countries in the region, reflecting the relative abundance of suitable agricultural
land.41
Figure 3.1: Change in cultivable area 1995-1996 to 2014-2015
Source: Department of Agriculture and land Management Statistics, 2016
Myanmar has a diverse topography, geology and climate enabling the cultivation of a wide range of
crops including cereals, pulses, horticultural production and fruits, as well as livestock.42 The broad
rainfall zones and soil types are indicated in Figure 3.2. For the purposes of this analysis, these can be
further aggregated into three main agro-ecological regions. The delta and coastal zone, the dry
zone and the hill regions, are each characterised by different types of agricultural systems.43
Delta and coastal zone - The densely populated deltaic (Ayeyarwady, Sittaung and Thanlwin deltas)
and coastal regions have plentiful monsoonal rainfall, and good access to water, with alluvial and
swampy soils. These areas are dominated by rice cultivation and aquaculture.
Dry Zone - The Dry Zone has significantly lower rainfall. Lying in the rain shadow of the upland
areas to its west, this area has a semi-arid climate and long dry season. Population and agriculture in
these areas are concentrated in the alluvial lowlands, along river valleys that offer access to water.
Agricultural practices concentrate on rain-fed crops, and where water availability allows summer and
monsoon rice.
39 Department of Agriculture and land Management Statistics, 2016 40 Raitzer, D., Wong, L.C.Y., and Samson, J.N.G., 2015, Myanmar’s Agriculture Sector: Unlocking The Potential For Inclusive Growth
ADB Economics Working Paper Series No.470 41 Ibid. 42 Haggable, S., 2013, A Strategic Agricultural Sectorand Food Security Diagnostic for Myanmar. Report prepared for USAID Burma. 43 Ibid.
0
2
4
6
8
10
12
14
1995-1996 1998-1999 2002-2003 2005-2006 2008-2009 2011-2012 2014-2015
Hectares(m
illion)
NetAreaSown
CurrentFallows
CultivableWasteOtherThanFallows

17
Hill regions - The large hill regions have more temperate climates. They receive greater levels of
rainfall than the Dry Zone. These regions in the main are still covered by forest. The Shan plateau in
the east has significant area cleared of forest for agricultural purposes. Here the more temperate
climate allows the cultivation of a wide range of mainly rainfed crops including fruit and other tree
crops, vegetables and other horticultural products, as well as rice, maize and pulses. Upland areas are
also home to swidden and other long-term fallow systems. Large upland areas in the east and west
have degraded forest areas affected by shifting cultivation.
Myanmar has three seasons, giving still greater variation to cropping patterns (Figure 3.3). Most
agricultural activity takes place during the monsoon which typically runs from May to October for
most of the country. The following cool winter season runs until February when the weather starts to
become warmer, this summer season typically lasts until the end of April. Agricultural production
varies significantly depending on season and agro-ecological zone.
Figure 3.2: Myanmar’s annual average rainfall by zone (mm) (left) and dominant soil types (right)
Source: FAO 2012
Figure 3.3: Crop calendar for main food crops

18
Source: Based on FAO and WFP, 2016, Special Report. FAO/WFP Crop and Food Security Assessment
Mission to Myanmar
Myanmar also has the benefit of ample freshwater supplies, from significant groundwater resources
and four major river systems - the Ayeyarwady-Chindwin, Thanlwin and Sittaung. Unlike other
countries in the region it has the additional advantage that most of the catchments of its largest rivers
lie within the country’s territorial control. Myanmar’s total renewable water resources amount to
approximately 1,167,800 million m3 year-1.44 Of this withdrawals only account for around 10%, and
of this around 90% is used for irrigation (Figure 3.4). Most water use is from surface water, but some
estimates suggest that there are substantial groundwater resources available in the Ayeyarwady River
Basin.45 Overall, renewable water resources per capita are amongst the largest in the region.46
Nevertheless, water availability presents a key constraint for agriculture because availability varies
greatly between different locations (Figure 3.2) and between the seasons. Around 80% of water flows
during the monsoon, with the remainder available during the dry winter and summer seasons.
Seasonal water scarcity is particularly acute in Rakhine State and the central Dry Zone.47
Over the last 35 years the government has expanded the provision of irrigation considerably. Most of
the expansion has been through the provision of dams (in some cases for both irrigation and
hydropower), reservoirs and pumps. Estimates of current irrigation lie at around 16-20% of total sown
area (Figure 3.4). Figures on irrigable area may also be misleading, for example, whereas around 25-
30% of monsoon rice receives supplemental irrigation, the figure for dry season rice falls to 15%.
Moreover, there is some evidence that only a small proportion of irrigation infrastructure is in use in
areas such as the Dry Zone.
Figure 3.4: Irrigation infrastructure and irrigable area 1995 - 2015 (left) and annual water usage by
sector (Km3) 2013 (right)
44 FAO, 2011, Irrigation in Southern and Eastern Asia in Figures 2011. AQUASTAT. 45 Len Drury – The Group Water Resources of the Ayeyarwady Basin, forthcoming report 2017; Naing M.M., 2005, Paddy field irrigation
systems in Myanmar. ftp://ftp.fao.org/docrep/fao/010/ai408e/ai408e01.pdf 46 Haggable, S., 2013, A Strategic Agricultural Sectorand Food Security Diagnostic for Myanmar. Report prepared for USAID Burma. 47 Ibid.
Crop
Maize
Potatoes
Rice(main)
Rice(second)
Wheat
Key
Sowing Growing Harvesting
J F M A N DM J J A S O

19
Source: Department of Land Management, Agriculture and Statistics 2015 (left), and New, H.O., 2014, Water
Management for Agribusiness Development Myanmar. Presentation. Myanmar Agribusiness Development
Summit. 21-22 January 2014, Yangon (right)
3.2 Agricultural production in Myanmar
There are serious questions regarding official agricultural statistics in Myanmar. A number of authors
point out that estimates of paddy production from the United States Department of Agriculture
(USDA) are around 35% lower than those of Myanmar’s government (Figure 3.5), and that
government figures significantly over-estimate rice production. Given the size and importance of the
rice crop, it is likely that statistical uncertainties are greater for other crops. This paucity in the extent
and quality of government figures should be borne in mind when considering the analysis provided
here.48
Figure 3.5: Government and USDA rice production statistics in comparison 1960-2016
Source: FAOSTAT 2017 (government figures); USDA 2016.
Myanmar is experiencing a rapid decline in the relative importance of the agricultural sector as its
growth is outstripped by that in the industrial and service sectors (Figure 1.2 and Table 1.2).
48 Raitzer, D., Wong, L.C.Y., and Samson, J.N.G., 2015, Myanmar’s Agriculture Sector: Unlocking the Potential For Inclusive Growth
ADB Economics Working Paper Series No.470; and, Haggable, S., 2013, A Strategic Agricultural Sectorand Food Security Diagnostic
for Myanmar. Report prepared for USAID Burma.
0
200
400
600
800
1,000
1,200
1,400
1,600
0
50
100
150
200
250
300
1995-1996 2000-2001 2005-2006 2010-2011 2014-2015
Area(1,000ha)
Num
ber
No.ofWeir No.ofTank Irrigatedarea
Industrial,
1.68Domestic,
3.36
Agriculture,
50.96
0
5
10
15
20
25
30
35
1960 1965 1970 1975 1980 1985 1990 1995 2000 2005 2010 2015
Tonnes(m
illion)
Government USDA

20
Nevertheless, agriculture still accounts for approximately 27% of GDP. It also remains a strategically
important sector providing around 20% of export earnings, employing upwards of 60% of the labour
force, supplying raw materials to the manufacturing sector, and important for food security and
poverty reduction.
The sector has seen a significant slowdown in growth in recent years. After quite rapid growth in the
sector of around 8.4% between 2000 and 2005, and around 6% between 2005 and 2010, growth has
slowed dramatically since 2010 to an average of around 0.1% between 2010 and 2015 (Table 1.2).49
Performance in the sector is related closely to performance in the food-crop sector which accounts for
around 80% of agricultural production. Figure 3.5 illustrates this growth for some key crops.
Table 3.1 gives the main crops and production statistics. Despite the continued importance of rice
cultivation, farming in Myanmar is already quite diversified. During the monsoon most farms plant
rice but in other seasons crops other than rice are popular, including other cereals, pluses, and oil
crops. Industrial crops like sugarcane, cotton, rubber, oil palm and tea are growing in importance.
Myanmar also produces a range of vegetables (e.g. garlic, onion and potato), fruits (e.g. mango,
banana, citrus fruits, durian, pineapple) and spices (e.g. chili, garlic, ginger, turmeric).50
Table 3.1: Main crops area sown and production 2013-2014
Crop Area sown
(million ha)
Yield
(t/ha)
Production
(million tonnes)
Paddy rice 7.28 3.9 28.32
Pulses 4.53 1.3 5.9
Maize 0.4 3.7 1.6
Groundnut 0.93 1.39 1.29
Sesame 1.62 0.29 0.46
Sunflower 0.48 1.7 0.82
Sugarcane 0.17 61.83 10.47
Cotton 0.3 1.7 0.51
Rubber 0.61 0.76 0.18
Oil Palm 0.15 3.28 0.14
Tea 0.09 1.2 0.1
Source: Lwin, A.K., 2015, Family farming: the case of Myanmar. Memorie di Scienze Fisiche e Naturali133°
(2015), Vol. XXXIX, Parte II, Tomo I, pp. 259-266
Increases in productivity have come from the expansion of the agricultural area, improved agricultural
practices and the intensification of agricultural production. Expansion of the agricultural area is
reflected in Figure 3.2. Expansion is also reflected in the growth of sown area for main crops (Figure
3.5), although this is also a result of higher cropping intensity - which has increased from around
119% in 1988-1989 to 180% in 2013-2014.51 Farmers have also increased the intensity of input use
(for example, of fertilizer, agricultural chemicals and machinery). In the case of rice production, it is
estimated that around 58% of production gains have been due to an increase in sown area and 42%
due to yield growth.52
Productivity growth for most crops has slowed significantly in recent years (rice and maize). The
reasons for this are not clear although suggestions have included soil degradation, availability of
fertilizer and a changing climate, as well as institutional constraints.53 Whatever the reasons,
agricultural productivity in Myanmar remains low in comparison to other countries in the region.54
49 Consultants estimates based upon Department of Land Management, Agriculture and Statistics 2015 50 World Bank, 2016, Myanmar: Analysis of Farm Production Economics. Economic and Sector Work Report No. 100066-MM 51 Kywe, M., 2016, Overview of Myanmar Agriculture. Presentation. 52 Raitzer, D., Wong, L.C.Y., and Samson, J.N.G., 2015, Myanmar’s Agriculture Sector: Unlocking the Potential For Inclusive Growth
ADB Economics Working Paper Series No.470 53 Baroang, K., 2013, Background Paper No.1 Myanmar Bio-Physical Characterization: Summary Findings and Issues to Explore. USAID. 54 Raitzer, D., Wong, L.C.Y., and Samson, J.N.G., 2015, Myanmar’s Agriculture Sector: Unlocking the Potential For Inclusive Growth
ADB Economics Working Paper Series No.470; and, World Bank, 2016, Myanmar: Analysis of Farm Production Economics. Economic
and Sector Work Report No. 100066-MM

21
Figure 3.5 also indicates the expansion of rubber. Similar patterns of expansion also apply to other
plantation crops including sugar cane and palm oil. This expansion has been implicated in land
conflicts and deforestation.
Myanmar is the largest producer and exporter of pulses such as black gram, green gram, pigeon pea
butter bean, cowpea, kidney bean and chickpea) in ASEAN. Pulse production was liberalized in 1988,
subsequently production of pulses surged, with output quadrupling between 1991 and 2014. As a
result pluses became an important export earner, second only to gas and oil in official statistics.
Sesame and groundnut production also increased significantly over the last 20 years, with the area of
planted sesame increasing about 86% and that of groundnut 20%, and both crops seeing a tripling in
production (Figure 3.5).

22
Figure 3.6: Change in area, yield and production for main crops in Myanmar 1961-2014
Source: FAOSTAT, 2017
3.3 Shift from subsistence to commercial agriculture
Agriculture in Myanmar is changing rapidly. While traditional, subsistence farming systems and
approaches still prevail they are increasing existing alongside more modern commercial approaches.
Commercial approaches to agriculture are characterised by higher levels of inputs (including
extensive use of agro-chemicals), mechanisation, the increased use of wage labour, and the
consolidation of land holdings. Commercialisation has been developing amongst smaller farmers as
better productivity enable the generation of crops surplus to subsistence needs and the development of
0
20
40
60
80
100
120
140
160
180
1961 1966 1971 1976 1981 1986 1991 1996 2001 2006 2011
Index(2000=100)
Rice
Area Yield Production
0
50
100
150
200
250
1961 1966 1971 1976 1981 1986 1991 1996 2001 2006 2011
Index(2000=100)
Groundnut
Area Yield Production
0
50
100
150
200
250
300
350
400
450
500
1961 1966 1971 1976 1981 1986 1991 1996 2001 2006 2011
Index(2000=100)
Maize
Area Yield Production
0
100
200
300
400
500
600
700
800
1961 1966 1971 1976 1981 1986 1991 1996 2001 2006 2011
Index(2000=100)
Rubber
Area Yield Production
0
50
100
150
200
250
300
350
1961 1966 1971 1976 1981 1986 1991 1996 2001 2006 2011
Index(2000=100)
Sesame
Area Yield Production
0
50
100
150
200
250
300
350
400
1961 1966 1971 1976 1981 1986 1991 1996 2001 2006 2011
Index(2000=100)
Pulses
Area Yield Production

23
infrastructure and growth in urban populations provides access to large markets for this surplus. At
the same time other forms of commercialisation, such as agribusiness concessions and contract
farming have also been developing rapidly (Figure 3.6).55
Figure 3.7: Large areas cleared for plantation Kachin state 2012
Source: Google Earth 2017
As of 2014 around 940,000 ha had been granted to private companies in Myanmar for large scale
agricultural concessions by Ministry of Agriculture, Livestock and Irrigation (MOALI). These figures
exclude concessions granted by sub-national authorities and by the former Ministry of Environmental
Conservation and Forestry (MOECAF) and probably significantly underestimate the actual extent.
This represents a rapid expansion of concessions. Most of these have been granted in more sparsely
populated border areas including Sagaing, Kachin, Shan, and Tanintharyi (Figure 3.7). Concessions
are typically developed for rubber, oil palm (Tanintharyi) and rice, although other crops include
sugar, cassava and jatropha.56
Figure 3.8: Area of concessions granted to domestic companies March 2014
Source: MOALI figures from Oxfam, 2017, Whose Crops, At What Price? Agricultural investment in Myanmar. Oxfam
Discussion Papers
Contract farming is also an increasingly common form of commercialisation that is transforming
agricultural systems in some parts for the country. For example, contract maize farming in Shan State
to supply the Chinese poultry industry has resulted in the rapid commercialisation of agriculture in
55 Ibid. 56 Oxfam, 2017, Whose Crops, At What Price? Agricultural investment in Myanmar. Oxfam Discussion Papers.
0
50
100
150
200
250
300
350
400
Area(thousandha)
24
some areas of Shan State (Figure 3.8).57 With better transportation links and greater access to markets
within Myanmar contract farming is likely to increase and be an important driver of agricultural
commercialisation.58
3.4 Swidden cultivation
Swidden or shifting cultivation is still common in upland, hilly and remote areas in Myanmar, with
this farming system most common in Kachin, Kayah, Kayin, Chin and Shan states. Swidden systems
are diverse, complex and dynamic which are often difficult to define, categorise, measure and
regulate.59 For these reasons estimates of the extent of swidden agriculture are sketchy.
Recent figures from the Department of Agriculture give the net swidden sown area as around 270,000
ha in 2014/2015 (approximately 2% of net sown area or 0.4% of total land area). These figures are
likely to be an underestimate of the significance and impact of swidden systems. First, these figures
only take into account the area under cultivation that year. Land is typically rested and left fallow in a
swidden rotation for anything from 3-20 years. The area of land under swidden systems could
therefore be anything from 3-20 times the area currently cultivated. Second, these figures are net of
“squatters”, that is they do not include unofficial land users. This may make up the majority of
swidden cultivation. Figures from the Forest Department of Myanmar dating from 1993 suggest that
around 15 million ha (22.8% of total land area) was affected by shifting cultivation, these figures are
likely to be inclusive of fallows and unofficial land use, these estimates are supported by sources cited
in a recent paper by Andersen,60 given a figure of 15.5 million Ha. Other sources from the last two
decades estimate figures from 0.29 million ha to 10.18 million ha.61 Figures for households dependent
upon swidden agriculture are similarly vague, although Forestry Department figures estimated that
between 1.5 million and 2 million households practiced swidden agriculture in 1995. Nevertheless, it
is clear that swidden systems remain an extremely important agricultural system and livelihood
strategy in many upland areas in Myanmar.
Figure 3.9: Intensively farmed area in Northern Shan State 2015
Source: Google Earth 2017
Given the paucity of data it is not possible to arrive at determinate trends relating to the extent of
swidden agriculture. Nevertheless, the experience of countries elsewhere in the region, corroborated
by small scale studies conducted in Myanmar over recent years do suggest a number of important
trends. First, swidden cycles are shortening, often due to increasing local population pressure, the
cultivation of more marginal land, and possibly the declining availability of land. For example, in
57 Woods, K., 2015, CP maize contract farming in Shan State, Myanmar: A regional case of a place-based corporate agro-feed system.
BRICS Initiative for Critical Agrarian Studies. 58 Oxfam, 2017, Whose Crops, At What Price? Agricultural investment in Myanmar. Oxfam Discussion Papers. 59 Padoch,C., Coffey, Mertz, O., Leisz, S.J., Fox, J., and Wadley R.L., 2007, The Demise of Swidden in Southeast Asia?
Local Realities and Regional Ambiguities. Geografisk Tidsskrift, Danish Journal of Geography 107(1) 60 Andersen, K.E., 2015, Study of Upland Customary Communal Tenure in Chin and Shan States. Outline of a Pilot Approach towards
Cadastral Registration of Cutomary Communal Land Tenure in Myanmar. Land Core Group. 61Schmidt-Vogt, D., Leisz, S.J., Mertz, O. et al., 2009, An Assessment of Trends in the Extent of Swidden in Southeast Asia, Hum Ecol
(2009) 37: 269.

25
Western Chin State a decline form 15 years to 6-9 year has been documented62, in Shan State reports
suggests swidden cycles as short as 3-5 years (Figure 3.9).63
Figure 3.10: Swidden mosaic in Eastern Shan State 2016
Source: Google Earth 2017
Secondly, there has been a decline in swidden cultivation due to increases in other types of land use.
Other types of land use include the intensification of swidden cycles, introduction of terracing64,
permanent more intensive cultivation practices, the more widespread cultivation of industrial crops,
and related to this, the development of large scale agri-business concessions.65 A reason often given
for the increased intensity of swidden agriculture is the increase in population. However, some reports
suggest a decline in swidden area due to outmigration and declining population.66 It is likely that these
factors are highly localised and vary from area to area. Thirdly, the expansion of other types of
agricultural system does not necessarily entail the abandonment of swidden cultivation as short fallow
swidden is often maintained alongside other intensive farming practices.67
3.5 Riverbank gardens
In Myanmar, as elsewhere in Southeast Asia, the cultivation of riverbanks, islands and other
seasonally available in-stream structures during dry season represents an important source of
agricultural production for riparian communities. Riverbank gardens become available for cultivation
as the water level recedes in the dry season and are used for the cultivation of a range of subsistence
and cash crops. They are particularly attractive for cultivation because, i) The fertility of the soil is
replenished every year by nutrients attached to sediments deposited during wet season; ii) Seasonal
flooding also means areas are largely free of weeds; iv) These areas have easy and reliable access to
water68; and iv) They provide a reliable source of production to households during the dry season.
62Thien, U.S., 2012, Study on the Evolution of the Farming Systems and Livelihoods Dynamics in Northern Chin State. GRET/LIFT 63 Win, S., 2004, Investigation on Shifting Cultivation Practices Conducted by the Hill Tribes for the Development of Suitable Agroforestry
Techniques In Myanmar. 64 Chan, N., and Takeda, S., 2016, The Transition Away from Swidden Agriculture and Trends in Biomass Accumulation in Fallow Forests
Case Studies in the Southern Chin Hills of Myanmar 65Ziegler, A.D., Bruun, T.B.,Guardiola-Claramonte, M., Giambelluca, T.D., Lawrence, D., Lam, N.T., 2009, Environmental Consequences
of the Demise in Swidden Cultivation in Montane Mainland Southeast Asia: Hydrology and Geomorphology. Hum Ecol. 37:361–373. 66Chan, N., and Takeda, S., 2016, The Transition Away from Swidden Agriculture and Trends in Biomass Accumulation in Fallow Forests
Case Studies in the Southern Chin Hills of Myanmar 67Schmidt-Vogt, D., Leisz, S.J., Mertz, O. et al., 2009, An Assessment of Trends in the Extent of Swidden in Southeast Asia, Hum Ecol
(2009) 37: 269. 68Kiguchi, Y., undated, 2-8. Riverside Agriculture in the Mekong Basin: An Uncertain Future for Environmentally Friendly Agriculture
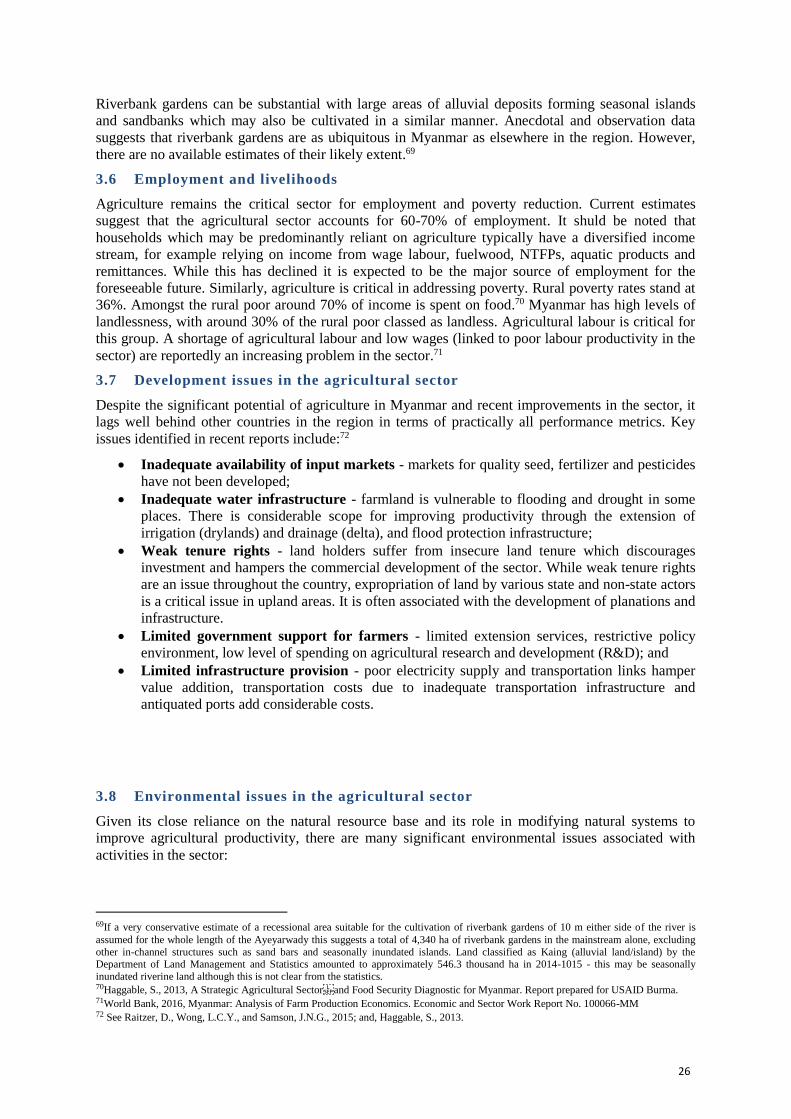
26
Riverbank gardens can be substantial with large areas of alluvial deposits forming seasonal islands
and sandbanks which may also be cultivated in a similar manner. Anecdotal and observation data
suggests that riverbank gardens are as ubiquitous in Myanmar as elsewhere in the region. However,
there are no available estimates of their likely extent.69
3.6 Employment and livelihoods
Agriculture remains the critical sector for employment and poverty reduction. Current estimates
suggest that the agricultural sector accounts for 60-70% of employment. It shuld be noted that
households which may be predominantly reliant on agriculture typically have a diversified income
stream, for example relying on income from wage labour, fuelwood, NTFPs, aquatic products and
remittances. While this has declined it is expected to be the major source of employment for the
foreseeable future. Similarly, agriculture is critical in addressing poverty. Rural poverty rates stand at
36%. Amongst the rural poor around 70% of income is spent on food.70 Myanmar has high levels of
landlessness, with around 30% of the rural poor classed as landless. Agricultural labour is critical for
this group. A shortage of agricultural labour and low wages (linked to poor labour productivity in the
sector) are reportedly an increasing problem in the sector.71
3.7 Development issues in the agricultural sector
Despite the significant potential of agriculture in Myanmar and recent improvements in the sector, it
lags well behind other countries in the region in terms of practically all performance metrics. Key
issues identified in recent reports include:72
• Inadequate availability of input markets - markets for quality seed, fertilizer and pesticides
have not been developed;
• Inadequate water infrastructure - farmland is vulnerable to flooding and drought in some
places. There is considerable scope for improving productivity through the extension of
irrigation (drylands) and drainage (delta), and flood protection infrastructure;
• Weak tenure rights - land holders suffer from insecure land tenure which discourages
investment and hampers the commercial development of the sector. While weak tenure rights
are an issue throughout the country, expropriation of land by various state and non-state actors
is a critical issue in upland areas. It is often associated with the development of planations and
infrastructure.
• Limited government support for farmers - limited extension services, restrictive policy
environment, low level of spending on agricultural research and development (R&D); and
• Limited infrastructure provision - poor electricity supply and transportation links hamper
value addition, transportation costs due to inadequate transportation infrastructure and
antiquated ports add considerable costs.
3.8 Environmental issues in the agricultural sector
Given its close reliance on the natural resource base and its role in modifying natural systems to
improve agricultural productivity, there are many significant environmental issues associated with
activities in the sector:
69If a very conservative estimate of a recessional area suitable for the cultivation of riverbank gardens of 10 m either side of the river is
assumed for the whole length of the Ayeyarwady this suggests a total of 4,340 ha of riverbank gardens in the mainstream alone, excluding
other in-channel structures such as sand bars and seasonally inundated islands. Land classified as Kaing (alluvial land/island) by the Department of Land Management and Statistics amounted to approximately 546.3 thousand ha in 2014-1015 - this may be seasonally
inundated riverine land although this is not clear from the statistics. 70Haggable, S., 2013, A Strategic Agricultural Sectorand Food Security Diagnostic for Myanmar. Report prepared for USAID Burma. 71World Bank, 2016, Myanmar: Analysis of Farm Production Economics. Economic and Sector Work Report No. 100066-MM 72 See Raitzer, D., Wong, L.C.Y., and Samson, J.N.G., 2015; and, Haggable, S., 2013.
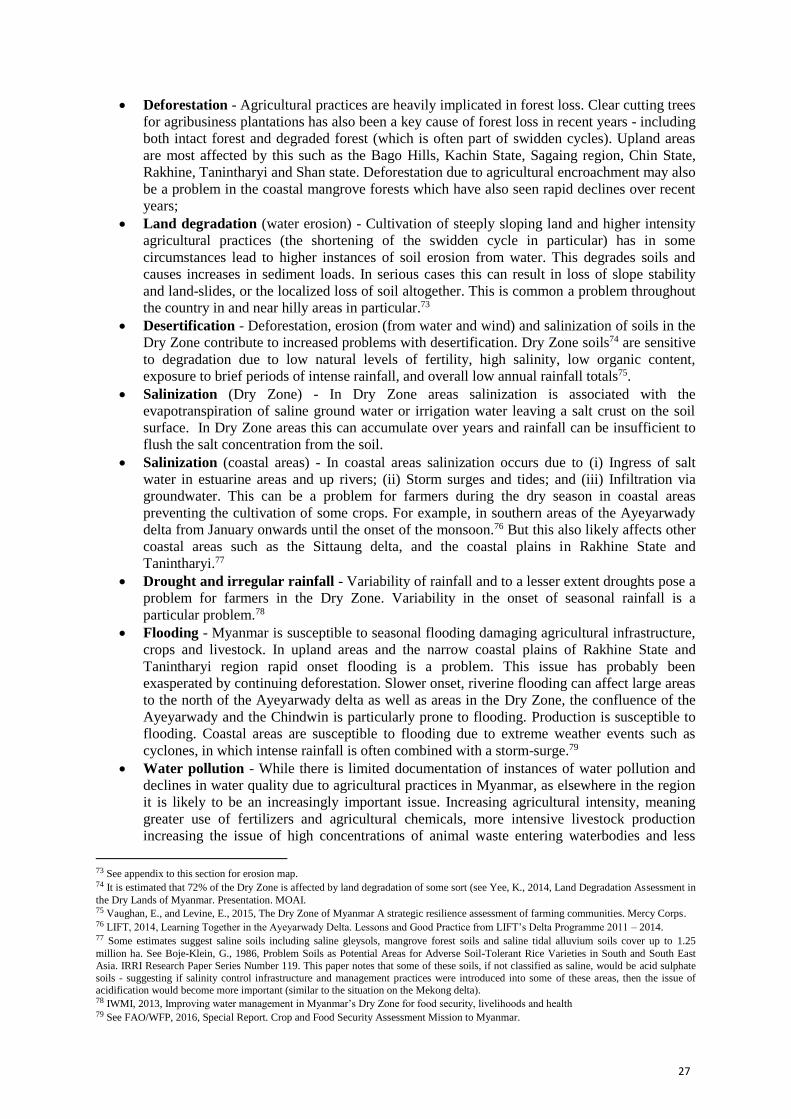
27
• Deforestation - Agricultural practices are heavily implicated in forest loss. Clear cutting trees
for agribusiness plantations has also been a key cause of forest loss in recent years - including
both intact forest and degraded forest (which is often part of swidden cycles). Upland areas
are most affected by this such as the Bago Hills, Kachin State, Sagaing region, Chin State,
Rakhine, Tanintharyi and Shan state. Deforestation due to agricultural encroachment may also
be a problem in the coastal mangrove forests which have also seen rapid declines over recent
years;
• Land degradation (water erosion) - Cultivation of steeply sloping land and higher intensity
agricultural practices (the shortening of the swidden cycle in particular) has in some
circumstances lead to higher instances of soil erosion from water. This degrades soils and
causes increases in sediment loads. In serious cases this can result in loss of slope stability
and land-slides, or the localized loss of soil altogether. This is common a problem throughout
the country in and near hilly areas in particular.73
• Desertification - Deforestation, erosion (from water and wind) and salinization of soils in the
Dry Zone contribute to increased problems with desertification. Dry Zone soils74 are sensitive
to degradation due to low natural levels of fertility, high salinity, low organic content,
exposure to brief periods of intense rainfall, and overall low annual rainfall totals75.
• Salinization (Dry Zone) - In Dry Zone areas salinization is associated with the
evapotranspiration of saline ground water or irrigation water leaving a salt crust on the soil
surface. In Dry Zone areas this can accumulate over years and rainfall can be insufficient to
flush the salt concentration from the soil.
• Salinization (coastal areas) - In coastal areas salinization occurs due to (i) Ingress of salt
water in estuarine areas and up rivers; (ii) Storm surges and tides; and (iii) Infiltration via
groundwater. This can be a problem for farmers during the dry season in coastal areas
preventing the cultivation of some crops. For example, in southern areas of the Ayeyarwady
delta from January onwards until the onset of the monsoon.76 But this also likely affects other
coastal areas such as the Sittaung delta, and the coastal plains in Rakhine State and
Tanintharyi.77
• Drought and irregular rainfall - Variability of rainfall and to a lesser extent droughts pose a
problem for farmers in the Dry Zone. Variability in the onset of seasonal rainfall is a
particular problem.78
• Flooding - Myanmar is susceptible to seasonal flooding damaging agricultural infrastructure,
crops and livestock. In upland areas and the narrow coastal plains of Rakhine State and
Tanintharyi region rapid onset flooding is a problem. This issue has probably been
exasperated by continuing deforestation. Slower onset, riverine flooding can affect large areas
to the north of the Ayeyarwady delta as well as areas in the Dry Zone, the confluence of the
Ayeyarwady and the Chindwin is particularly prone to flooding. Production is susceptible to
flooding. Coastal areas are susceptible to flooding due to extreme weather events such as
cyclones, in which intense rainfall is often combined with a storm-surge.79
• Water pollution - While there is limited documentation of instances of water pollution and
declines in water quality due to agricultural practices in Myanmar, as elsewhere in the region
it is likely to be an increasingly important issue. Increasing agricultural intensity, meaning
greater use of fertilizers and agricultural chemicals, more intensive livestock production
increasing the issue of high concentrations of animal waste entering waterbodies and less
73 See appendix to this section for erosion map. 74 It is estimated that 72% of the Dry Zone is affected by land degradation of some sort (see Yee, K., 2014, Land Degradation Assessment in
the Dry Lands of Myanmar. Presentation. MOAI. 75 Vaughan, E., and Levine, E., 2015, The Dry Zone of Myanmar A strategic resilience assessment of farming communities. Mercy Corps. 76 LIFT, 2014, Learning Together in the Ayeyarwady Delta. Lessons and Good Practice from LIFT’s Delta Programme 2011 – 2014. 77 Some estimates suggest saline soils including saline gleysols, mangrove forest soils and saline tidal alluvium soils cover up to 1.25
million ha. See Boje-Klein, G., 1986, Problem Soils as Potential Areas for Adverse Soil-Tolerant Rice Varieties in South and South East
Asia. IRRI Research Paper Series Number 119. This paper notes that some of these soils, if not classified as saline, would be acid sulphate
soils - suggesting if salinity control infrastructure and management practices were introduced into some of these areas, then the issue of acidification would become more important (similar to the situation on the Mekong delta). 78 IWMI, 2013, Improving water management in Myanmar’s Dry Zone for food security, livelihoods and health 79 See FAO/WFP, 2016, Special Report. Crop and Food Security Assessment Mission to Myanmar.

28
sustainable cultivation practices leading to increased sedimentation are all likely to affect
water quality. Large scale mono-crop plantaions in particulat have been implicated in
increased pollution loads from agricultural chemicals.
3.9 Agricultural and associated environmental is sues by river basin
3.9.1 Ayeyarwady
The Ayeyarwady River Basin is central to Myanmar’s agricultural production. Importantly, the delta
accounts for a large proportion of the county’s rice, pulses and oil crop production. Key issues for
agriculture in the basin are varied. In the upper reaches of the catchment in Kachin, Sagaing, and
some areas of Shan State, deforestation due to clearing for various agricultural activities is important.
Connected to this increased incidence and intensity of agriculture on sloping land is a growing issue.
Both deforestation and the expansion of agriculture on sloping land increase issues of erosion, land
degradation and flooding. Lower in the catchment in the Dry Zone, agricultural issues relate to
variability in water availability and soil erosion. Riverine flooding is an important constraint on
agriculture in some Dry Zone areas. The coastal and estuarine areas face issues with saline intrusion,
as well as riverine and coastal flooding. These risks are increased through the loss of mangrove forest.
3.9.2 Chindwin
The Chindwin basin is dominated by forest cover and more intensive agriculture is practiced where
conditions allow in valley bottoms and other flat areas, where wet rice and other crops can be
cultivated. However, swidden agriculture dominates and much of the forest is already degraded. There
is anecdotal evidence that swidden cycles have shortened in this river basin, and there is evidence of a
change to sedentary agriculture - for example through the development of terrace systems in Chin
State. Key issues are likely to be rapid onset flooding, a lack of infrastructure to support agriculture
(such as roads and irrigation infrastructure) and continuing forest degradation and loss. Landslides
and soil erosion is also likely to be an issue in hill areas of the basin.
3.9.3 Thanlwin
The Thanlwin River basin has seen the development of plantation and permanent agricultural area in
areas bordering on China and Thailand. Permanent intensive agriculture is common in some areas of
Shan State. Swidden systems are common in the basin on sloping and degraded forest land. Rice
cultivation is more common in lowland and coastal areas of the basin. Issues include rapid onset
flooding and landslide risk in upland areas. Erosion and land degradation is also an issue in
intensively farmed upland areas. Rapid onset flooding is also likely to be a risk in the coastal plain.
Lack of agricultural infrastructure (irrigation and transport in particular).
3.9.4 Sittaung
This basin and in particular, the deltaic region is an important location for rice cultivation. Hill and
mountainous areas have seen extensive swidden cultivation. Hill and flood plain areas are prone to
rapid onset flooding. Riverine areas also suffer from slow onset flooding. Deltaic areas face the
familiar issues of saline intrusion and vulnerability to coastal flooding from storm surges.
3.9.5 Mekong
This area is dominated by swidden systems and plantations. Like the Chindwin basin, this area is
remote and lacking in the development of support infrastructure. Little information is available on
issues with this region, although land degradation due to agricultural intensification (of swidden and
other systems), soil erosion, land slide and rapid onset flood risk are likely to be an issue. The
expansion of plantations and associated issues are also likely to be important in the region.
3.9.6 Tanintharyi
Most agricultural activity is centered on the narrow coastal strip in this region. This area is prone to
rapid onset flooding in the monsoon. Coastal areas are also vulnerable to flooding from storm surges,
these risks are increased by the rapid loss of mangrove forests. Tanintharyi region has seen rapid

29
expansion of oil palm plantations and concomitant forest loss in upland areas mainly bordering on
existing agricultural areas. Swidden agriculture is also common in upland areas and is associated with
forest degradation, soil erosion, increased flooding risks and increased land slide risk.
3.9.7 Rakhine
Rice cultivation is important in the narrow coastal plain, although most of the region is forested.
Deforestation due to agricultural encroachment (from swidden and plantations) is important with high
levels of forest loss. The coastal plain has also seen the widespread loss of mangroves - although this
has in the main been due to consumptive use of the timber rather than agricultural encroachment. Loss
of mangroves, however, increases other risks. The area is at risk of rapid onset flooding due to high
levels of wet season rainfall and the proximity of hills to the coastal plain. Coastal flooding associated
with storm surges is also an issue, these risks are increased by the loss of mangrove forests.
3.10 Potential interactions between hydropower and the agricultural sector
Table 3.2 summaries the potential interactions between the hydropower sector and the agricultural
sector. It describes the potential impact of hydropower development on the agricultural sector, the
impact of agricultural activities on hydropower and potential cumulative impacts.
Table 3.2: Potential interactions between hydropower and agricultural production
Impact Narrative
Of hydropower on agriculture
Reduced nutrient transport
Nutrients are typically attached to sediment particles in suspension.
These may drop out of the water as water slows down in the reservoir
area. This may mean that nutrients are trapped along with sediments in
reservoirs, disrupting the supply to nutrients to downstream farmland.
Reduced deltaic stability Reduction in sediment load reaching the delta due to sediment trapping
in hydropower reservoirs. Leading to reduced deltaic accretion and
threatening long term deltaic stability with knock-on implications for
agriculture in these areas.
Increased downstream erosion Reduction in sediment load due to sediment trapping in hydropower
reservoirs. Leading to increased downstream erosion affecting riverbank
stability and agriculture on and near these areas. In-stream agricultural
infrastructure (such as weirs and water intakes) could also be affected.
Unseasonal changes in water
flows/availability HP plants may alter the seasonal pattern of water flows in a river.
In-stream irrigation intakes may need adjustment to account for
changes in flow regime.
Loss of riverbank gardens Aside from increased erosion and the risks of peaking operations, HP
development may affect viability of riverbank gardens through changing
seasonal patterns of water flow and river level in an unpredictable
manner, thus inundating riverbanks or other in-stream cultivated areas.
Loss of land in inundation area Fertile land in the valley bottom will be inundated and unavailable for
agricultural production.
Loss of land in watershed
protection area
Watershed protection provisions in HP catchments may preclude the use
of these areas for agriculture.
Reduced flooding
HP reservoirs may in some circumstances be managed to reduce
flooding.
Increased water availability for
irrigation
Close to the project, hydropower reservoirs may be managed for
multiple use and irrigation provision. Larger dams or the combined
influence of a number of dams may improve dry season flows improving
the potential for irrigation.
Improved electricity supply HP development may increase the availability of affordable electricity to
agricultural areas allowing increases in productivity through reliably

30
Impact Narrative
powering irrigation pumps and technology for post-harvest processing.
Of agriculture on hydropower
Impacts of deforestation and
land degradation due to
agriculture
Deforestation resulting from unsustainable forestry practices can result
in the loss of land cover in watersheds up-steam of hydropower plants.
This may increase erosion and reservoir sedimentation and result in the
loss of productivity at the hydropower plant, as well as potentially
increased wear and tear on the plant implying higher O&M costs.
Increased pollution from
agricultural run-off
Greater use of chemicals, fertilizers and more intensively raised
livestock may increase agricultural run-off into reservoirs compounding
reservoir water quality issues.
Water use for irrigation Any management of HP projects for multiple use including irrigation
will reduce the amount of water that can be used for power generation.
Cumulative impacts
Deforestation and biodiversity
loss
Agricultural expansion is the main driver of deforestation, especially in
areas of degraded forests. This compounds deforestation pressures from
other sources such as HP development, transport, mining and logging.
Soil degradation, erosion,
sedimentation
Increased intensity of farming, especially on sloping land is an important
factor in land degradation, erosion and soil loss. Compounding
influences from logging, mining and infrastructure development.
Flooding Increased run-off due to agriculture-induced deforestation could result in
some circumstances to an increased risk of flooding, this will add to
impacts from climate change, infrastructure development, mining and
logging in upland areas.
3.11 Business As Usual (BAU) projection/projected baseline
Although agricultural productivity growth has stalled in the last few years, in the longer term the
sector is expected to return to growth. New policy is currently under discussion. Under the new
government there seems to be a change in policy emphasis towards the prioritisation of food security,
and farm income, through a focus on enhancing the productivity of small farmers. At the same time
policy is shifting towards the promotion of a more diversified sector with less focus on rice
production.80 New targets have yet to be developed, those in previous policy documents focus on
extensification and internsification of rice cultivation.
With a new policy direction in the offing developing a BAU projection for the sector is challenging,
let alone determining the spatial distribuition of such changes. However, given limited government
capacity, and important governance and institutional issues in the sector (such as those realting to land
tenure and input markets) BAU projections are based only on the projection of established trends in
the agricultural sector. The assumption being that there is no significant change in the trajectory of the
sector. This implies:
• Continuing conversion of forest and unused land to agricultural uses (including small scale
conversion and conversion of forested land at a large scale for agro-forestry plantations);
• Continuing commercailisation of agriculture, including increasingly concentrated land
holdings, increased mechanisation, increased use of chemical inputs; and
• Gradually improving productivity - through provision of better support infrastructure and
ammenties, high levels of inputs and better agricultural practices.
More concretely, Figures xx and xx project established trends in land use and irrigation forward to
2030-2031. And Figure xx projects establish trends in rice production to 2030-2031.
Figure 3.11. Irrigable area and net sown area, 1995-1996 to 2030-2031
80 Agricultural Development Strategy and Investment Plan. Preliminary Formulation. Draft 1 - 4 November 2016.
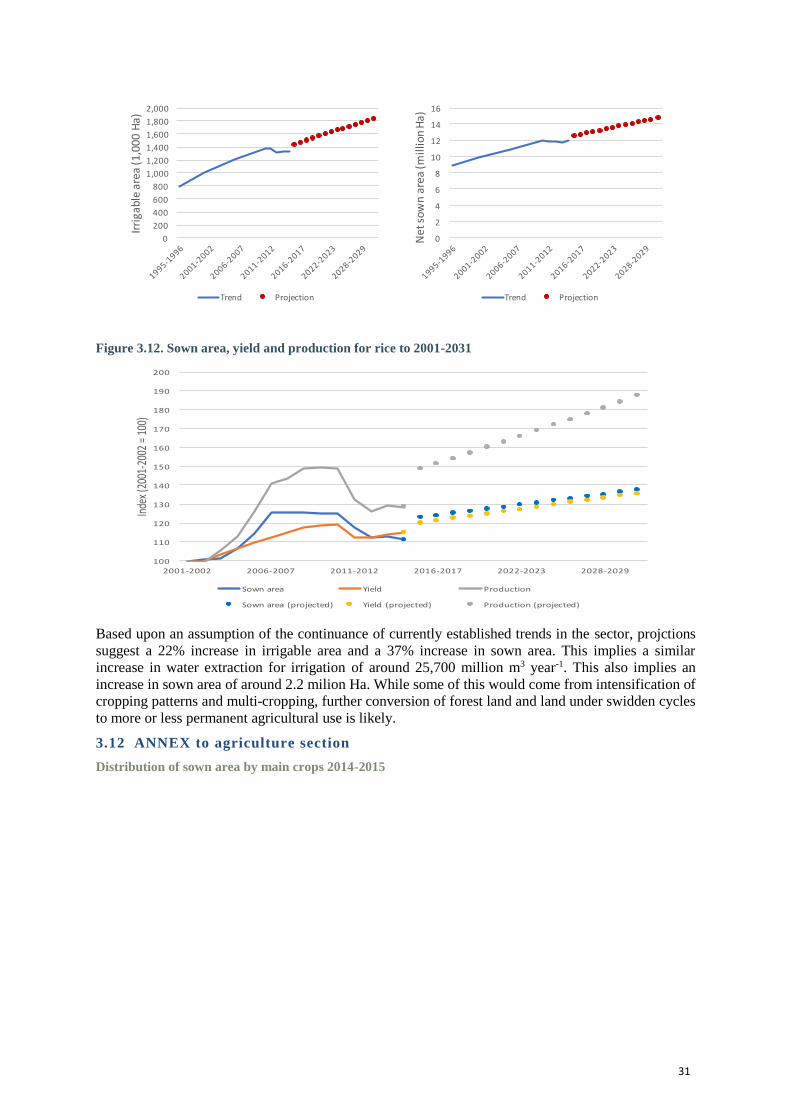
31
Figure 3.12. Sown area, yield and production for rice to 2001-2031
Based upon an assumption of the continuance of currently established trends in the sector, projctions
suggest a 22% increase in irrigable area and a 37% increase in sown area. This implies a similar
increase in water extraction for irrigation of around 25,700 million m3 year-1. This also implies an
increase in sown area of around 2.2 milion Ha. While some of this would come from intensification of
cropping patterns and multi-cropping, further conversion of forest land and land under swidden cycles
to more or less permanent agricultural use is likely.
3.12 ANNEX to agriculture section
Distribution of sown area by main crops 2014-2015
0
2
4
6
8
10
12
14
16
Netsow
narea(m
illionHa)
Trend Projection
0
200
400
600
800
1,000
1,200
1,400
1,600
1,800
2,000
Irrigablearea(1,000Ha)
Trend Projection
100
110
120
130
140
150
160
170
180
190
200
2001-2002 2006-2007 2011-2012 2016-2017 2022-2023 2028-2029
Index(2001-2002=100)
Sownarea Yield Production
Sownarea(projected) Yield(projected) Production(projected)

32
Source: Department of Agricultural Land Management and Statistics
Soil erosion risk
Ayeyarwady
BagoRegion
SagaingRegion
YangonRegion
ShanState
RakhineState
Other
Rice(totalarea7.2millionha)
SagaingRegion
MagwayRegion
MandalayRegion
BagoRegion
ShanState
Ayeyarwady
Other
Groundnut(totalarea1.0millionha)
MagwayRegion
SagaingRegion
MandalayRegion
BagoRegionOther
Sesame(totalarea1.5millionha)
ShanState
SagaingRegion
MagwayRegion
ChinState
KayinState
MandalayRegion
KachinState
Other
Maize(totalarea0.5millionha)
BagoRegion
Ayeyarwady
SagaingRegion
MandalayRegion
Other
Blackgram(totalarea1.1millionha)
MagwayRegion
BagoRegion
SagaingRegion
MandalayRegion
YangonRegion
AyeyarwadyOther
Greengram(totalarea1.2millionha)

33
Source: Yee, K., 2014, Land Degradation Assessment in the Dry Lands of Myanmar. Presentation. MOAI.

34
Agro ecological zones
Source: Yee, K., 2014, Land Degradation Assessment in the Dry Lands of Myanmar. Presentation. MOAI.

35
4 FORESTRY
4.1 Resources
Myanmar has significant forest resources. Figures differ between sources but generally accepted Food
and Agriculture Organization (FAO) of the United Nations figures suggest that in 2015 around 44.5%
of the land area of Myanmar or over 290,000 km2 was covered by forest.81 Despite the significant
remaining extent of its forested area Myanmar is experiencing rapid rates of deforestation. Between
1990 and 2015 Myanmar saw forest cover decline by approximately 26%, from about 392,000 km2 to
290,000 km2 - an average of 678,500 ha a year (Figure 4.1). Figures suggest a significant increase in
the rate of deforestation over the last five years. The decline has been dramatic particularly for dense
forest which declined from 45.6% of land coverage in 1990 to 19.9% by 2011.82
The causes of this decline include land conversion for agriculture, plantations and infrastructure, and
unsustainable levels of extraction for timber and fuelwood. These are discussed in greater detail
below.
Figure 4.1: Forest cover in Myanmar 1990-2015 and deforestation rate 1991-2015
Source: World Bank, 2017, World Development Indicators Database (FAO statistics)
Myanmar’s diverse geography, with varied topography, soils and climates give rise to a wide
variation in ecosystems. This is reflected in the variety of forest types across the country. These are
typically categorized into the seven major types given in Figure 4.2 and Table 4.1 below. Each type
provides a range of different products including fuelwood, timber and non-timber forest products
(NTFPs). Most of Myanmar’s remaining forests are composed of mixed deciduous forests
(approximately 38%). This is seen as the most economically important, containing valuable timber
species such as teak (Tectona grandis), rosewood (Dalbergia spp.), pyinkado (Xylia dolabriformis),
and padauk (Pterocarpus macrocarpus).83, 84 Although, other types of forests also have economic
81 Defined as “Forest area is land under natural or planted stands of trees of at least 5 meters in situ, whether productive or
not, and excludes tree stands in agricultural production systems (for example, in fruit plantations and agroforestry systems)
and trees in urban parks and gardens.” FAO. 82 Tint, K., Springate-Baginski, O., and Gyi, M.K.K., 2011, Community Forestry in Myanmar:
Progress & Potentials
83 Tint, K., Springate-Baginski, O., and Gyi, M.K.K., 2011, Community Forestry in Myanmar:
Progress & Potentials 84 EIA, 2014, Myanmar's Rosewood Crisis. Why key species and forests must be protected through CITES
0
0.2
0.4
0.6
0.8
1
1.2
1.4
1.6
1.8
2
0
10
20
30
40
50
60
70
1990 1992 1994 1996 1998 2000 2002 2004 2006 2008 2010 2012 2014Deforestationrate(%
)
Proportionoflandarea
(%)
Forestcover Deforestationrate

36
importance and are critical for the supply or fuelwood, locally used building materials and NTFPs - as
well numerous ecosystem goods and services.85
Figure 4.2: Main forest ecosystems in Myanmar
Source: A Checklist of the Trees, Shrubs, Herbs, and Climbers of Myanmar. Contributions from the United
States National Herbarium. Volume 45: 1-590
Teak is of particular importance to the forestry sector. Myanmar accounts for an estimated 80% of the
world’s teak reserves, it still has the world’s largest natural teak forests - approximately 50% of the
global figure or 14.5 million ha - as well as the third largest area of planted teak in the world
(approximately 390,000 ha).86
Table 4.1: Forest resources in Myanmar by forest type 2010 (left) and legal classification (right)
Forest type Area (ha)
Proportion of
forested area
(%)
Legal classification Area (ha)
Proportion
of total land
area (%)
Mangrove 467,330 1.5 Permanent forest
estate 15,694,976 23.2
Hill and temperate
evergreen 8,541,190 26.9 Of which:
Tropical
evergreen 5,470,600 17.2 Reserved forest 12,184,291 18.0
Mixed deciduous 12,157,300 38.3 Protected Area System 3,510,685 5.2
Deciduous
Dipterocarp 1,321,870 4.2
Protected Public
Forest 4,094,960 6.1
Dry 3,114,710 9.8
Scrub land 700,000 2.2
85 Springate-Baginski, O., Treue, T., and Htun, K., 2016. Legally and illegally logged out. The status of Myanmar’s timber sector and
options for reform. 86 FAO, 2017, Global Teak Trade In The Aftermath Of Myanmar’s Log Export Ban. Planted Forests and Trees Working Paper Series No.
49
37
Total 31,773,000 47.0a Total 19,789,936 29.2
Total land area 67,659,380 100 Total land area 67,659,380 100.0
Source: FAO, 2010, Forest Resource Assessment (left); Planning and Statistics Division, Forestry Department
(right). a - proportion of total land area
4.2 Production and economic significance
Forestry accounts for a small and declining share of GDP. This is, in part, due to very high growth in
the industrial and service sectors, and in part due to declining productivity of the remaining forest, and
recent legislative changes including the ban on the export of unprocessed timber in force since 31
March 2014 (Figure 4.2).87 This ban, however, has had no impact on the large illegal trade of timber
across the border to Yunnan.88
Figure 4.3: Forestry value added and share of national GDP 2001/2002 - 2013/2014
Source: Department of Planning, Consultants own calculations based upon World Bank, 2017, World
Development Indicators
The importance of timber exports as a source of revenue has diminished with the development of
other revenue sources (including energy, manufacturing and mining sector projects). However, timber
and wood products maintain a sizable share in export revenues (Figure 4.3) and remain an important
source of foreign exchange earnings. Figure 4.4 shows the rapid increase in the value of timber
exports to over USD 1.6 billion in 2013, which has more than trebled since the early 2000s. These
figures are derived from customs statistics from importing countries as these are deemed to be a better
guide than Myanmar’s own production and export statistics which miss out large portions of illegally
exported wood.89
87 According to FAO research, this ban has caused a dramatic rise in the price of high quality teak in China which sources 80% of this
timber from Myanmar, from USD 750 m3 at the end of 2013, to USD 2,000 m3 in January 2014. FAO, 2015, Global teak trade in the
aftermath of Myanmar’s log export ban by Kollert, W. & Walotek, P.J. Planted Forests and Trees Working Paper FP/49/E. Rome, Italy
(available at http://www.fao.org/forestry/plantedforests/67508@170537/en/) 88 EIA, 2015, Organised Chaos. The illicit overland timber trade between Myanmar and China. 89 In official figures the export of Timber products was worth almost US$ 950 million in 2013-2014, almost 60% below the value of exports
from Myanmar reported by importing countries. This also fails to account for smuggled timber.
155.8176881Timberexportban
0
0.1
0.2
0.3
0.4
0.5
0.6
0.7
0
20
40
60
80
100
120
140
160
180
2000-2001 2002-2003 2004-2005 2006-2007 2009-2010 2011-2012 2013-2014
ShareofGDP(%)
Valueadded(BillionKyatconstant2010prices)
ForestryValueadded ForestryshareofGDP

38
Teak reportedly accounted for 70-80% of this value, although in recent years a boom in demand for
rosewood in China has led to a significant increase in the importance of this trade.90 Reported export
volumes peaked in 2005 and were again approaching those levels in 2013. Recent years have also
seen an increase in the share of raw timber in exports, as export priorities have overridden
considerations of the development of domestic productivity.91 This trend has been reversed somewhat
with the implementation of the 2014 timber export ban.
Figure 4.4: Timber exports by value (left) and volume (round-wood equivalent) (right) 2000-2013
Source: Woods, K., 2015, Commercial Agriculture Expansion in Myanmar: Links to Deforestation, Conversion
Timber, and Land Conflicts. Forest Trends Report Series Forest Trade and Finance
Figures for timber production by region/state are given in Figure 4.5. Again, it is important to note
that these do not take account of illegally extracted timber or wastage which may be substantial.92 Key
sources of timber production over the last decade have been Mandalay, Sagaing, Shan, and Bago for
teak, and Sagaing, Mandalay, Bago and Tanintharyi for other hardwoods. Again, the recent export
ban is reflected in the decline in production in 2014-2015. In terms of illegal logging, Sagaing and
Kachin remain an important source of timber for the Chinese market.93 In the absence of effective
governance, the ban on official exports (and consequent timber price increases) increases the
incentive for this illegal trade.
Fuelwood and charcoal production also represent a critical economic function of the forestry sector.
Fuelwood and charcoal remain by a large margin the most import source of household energy supply,
representing an estimated 90% of biomass energy consumption.94 Average annual household
consumption of fuel wood is estimated to be around 2.5 tons for rural households and 1.4 tons for
urban residents.95
Figure 4.5: Timber production by region teak (left) and other hardwoods (right) 1995-2015
90 Treanor, N.B., 2015, China’s Hongmu Consumption Boom: Analysis of the Chinese Rosewood Trade and Links to Illegal Activity in
Tropical Forested Countries. Forest Trends Report Series, Forest Trade and Finance. 91 Woods, K., and Canby, K., 2011, BASELINE STUDY 4, MYANMAR, Overview of Forest Law Enforcement, Governance and Trade.
Forest Trendsfor FLEGT Asia Regional Programme August 2011. 92 See Springate-Baginski, O., Treue, T., and Htun, K., 2016. Legally and illegally logged out. The status of Myanmar’s timber sector and
options for reform, and Woods, K., 2015, Commercial Agriculture Expansion in Myanmar: Links to Deforestation, Conversion Timber, and Land Conflicts. 93 EIA, 2015, Organised Chaos. The illicit overland timber trade between Myanmar and China 94 Kissinger, G. 2017, Background report for identifying the drivers of deforestation and forest degradation in Myanmar. UN-REDD and
MONREC. 95 Ibid., ADB, IES and MMIC, 2015, Myanmar Energy Master Plan

39
Source: Myanmar Timber Enterprise 2016
Estimates of overall fuelwood use are uncertain however, there seems to be consensus in the literature
that for approximately that last decade fuelwood consumption has been around 20 million tonnes.96, 97
It is unclear if these figures include charcoal production for domestic use, estimated to be between
94,000 tons and 207,000 tons per anum.98 The figures do not seem to account for the growing charcoal
export trade to China, which has grown from virtually nothing before 2007 to representing about 32%
of China’s timber imports from Myanmar by volume by 2013 (500,000 m3).99
Aside from fuelwood and charcoal, a broader range of NTFPs are harvested at a commercial scale
from forests. These include bamboo, rattan, barks, resins and oils, honey, beeswax, bat-guano,
orchids, edible birds’ nets and lac as well as a wide range of wildlife species (much of it taken
illegally). Most of these products also used to support subsistence livelihoods, along with wild foods
and natural medicines amongst other things. A recent valuation study suggested that the economic
value of NTFPs in 2012 was approximately USD 487 million and USD 20 million.100
4.3 Employment and livelihoods
Approximately 36,000 people were directly employed in the forestry sector in 2011, and broader
estimates from 2009 including unreported, informal and indirect employment suggest up to 500,000
people are dependent upon the forestry sector for employment.101 In 2012 around 520,000 forest
adjacent households were likely to depend on forestry resources for their livelihoods.102 Although the
relative importance of this has likely declined with rapid expansion of the services and industrial
sectors, the sector remains a significant source of employment in rural areas.
Forestry is also important for rural livelihoods. Many communities are dependent upon forested areas
for fuelwood, small timber for construction and provision of farm implements, as well as a wide range
of NTFPs. Forest land is also utilised in a pattern of shifting cultivation which accounts for an
estimated 15% of forested land mainly in Kachin, Kayah, Kayin, Chin and Shan states.103
96 Ibid. 97 48 million m3 based on a conversion factor of 2.4m3/tonne and 36 million m3, based upon a conversion factor of 1.8m3/tonne. Emerton
and Yan (2013) estimate the figure at 50 million m3 98 Based on ADB, IES and MMIC, 2015, Myanmar Energy Master Plan and Bailis, R., Drigo, R., Ghilardi, A., & Masera, O. (2015) The
carbon footprint of traditional woodfuels. Nature Climate Change, 5, 266-272. doi: 10.1038/nclimate2491 98 Forest Trends, 2014, Analysis of the Myanmar-China Timber Trade. Policy Brief 99 Forest Trends, 2014, Analysis of the Myanmar-China Timber Trade. Policy Brief. 100 Emerton, L. and Yan Ming Aung. 2013. The Economic Value of Forest Ecosystem Services in Myanmar and Options for
Sustainable Financing. International Management Group, Yangon. 101 Woods, K., and Canby, K., 2011, BASELINE STUDY 4, MYANMAR, Overview of Forest Law Enforcement, Governance and Trade.
Forest Trendsfor FLEGT Asia Regional Programme August 2011. 102 Emerton, L. and Yan Ming Aung. 2013. The Economic Value of Forest Ecosystem Services in Myanmar and Options for
Sustainable Financing. International Management Group, Yangon. 103 Naw, E.E.M., 2014, Shifting cultivation in Myanmar. Presentation.
0
50
100
150
200
250
300
350Thousandcubicmeters
MandalayRegion SagaingRegion ShanState BagoRegion
KayahState MagwayRegion KachinState Other
0
200
400
600
800
1,000
1,200
1,400
1,600
Thousandcubicm
eters
SagaingRegion MandalayRegion BagoRegion TanintharyiRegion
ShanState MagwayRegion Other

40
4.4 Key issues in the forestry sector
There is no clear delineation between key development issues in the forestry sector and key
environmental issues as the single most important concern for the sector is the unsustainable use of
forest resources and deforestation. There have been dramatic declines in the forested area in Myanmar
(Figure 4.6) shows how deforestation in the last decade has been concentrated in and near locations
with the largest areas of surviving intact forest in Kachin, Sagaing, Tanintharyi, Shan and Chin. The
highest forest losses have been experienced in Shan and Sagaing, significant declines have also been
experienced in other mountainous areas including Kachin and Tanintharyi.104
Figure 4.6: Townships showing remaining intact forest 2014 (left) and areas showing most forest loss
2002-2014 (right)
Source: Bhagwat, T. et al, 2016, Myanmar Forest Cover Change 2002-2014
The forest loss not only presents concerns for the long-term sustainability of the sector itself, but
entails broader environmental consequences, including land degradation, erosion and soil loss,
sedimentation, increased flooding, loss of biodiversity, local and global climatic change.
There are multiple causes of deforestation in Myanmar, the most important of these are logging for
commercial timber extraction, extraction of timber for fuelwood, and other subsistence uses
(construction etc.), mining, infrastructure development, conversion to permanent agricultural use and
the expansion and/or intensification of swidden agriculture. These causal factors are often present
together at the same location.
It should also be noted that informal, weak or otherwise ambigious land tenure arrangements in much
of the country, and in particular in upland areas serve to enable land expropriation and timber
extraction. As such it represents an important institutional factor in understanding these drivers of
104 Note these figures come from a recent paper estimating land cover change using the analysis of satellite imagery. As such
this may overestimate the level of forest cover overall. Nevertheless, it does present an internally consistent means of
identifying areas of land cover change. Bhagwat, T. et al, 2016, Myanmar Forest Cover Change 2002-2014.

41
deforestation. The allocation of land for plantations and logging concessions in particular frequently
effectively entails ‘land-grabbing’.105
Fuelwood and charcoal - As noted above estimates of fuelwood consumption are at about 36-48
million m3 per year. This alone is roughly twice the estimated renewable fuelwood supply of 24
million m3. Given the high rate of deforestation in the intervening decade it is likely that this
significantly over-estimates the current level of sustainable fuelwood extraction. In addition to
fuelwood use, charcoal production is estimated at an annual rate of 1.4 million m3 which implies the
additional extraction of around 3.2 million m3 of fuelwood. This means that fuelwood extraction is
likely to be a major cause of deforestation in some areas, although as a recent survey of the drivers of
deforestation points out, the degree to which fuelwood extraction is a driver of deforestation is likely
to vary significantly between different regions.106
Logging for commercial timber extraction - An important cause of deforestation is unsustainable
levels of timber extraction for commercial use. As noted above this trade consists primarily of
commercially valuable species including teak and other hardwoods. Table 4.2 summarizes the main
sources of timber, geographical region, the actors in the timber trade, and sustainability and legal
characteristics of timber production from these areas.
First, more sustainably managed forest resources (community forests and forest plantations) are not
significant contributors to the commercial timber trade.
105 Kissinger, G. 2017, Background report for identifying the drivers of deforestation and forest degradation in Myanmar. UN-REDD and
MONREC 106 Kissinger, G. 2017, Background report for identifying the drivers of deforestation and forest degradation in Myanmar. UN-REDD and
MONREC
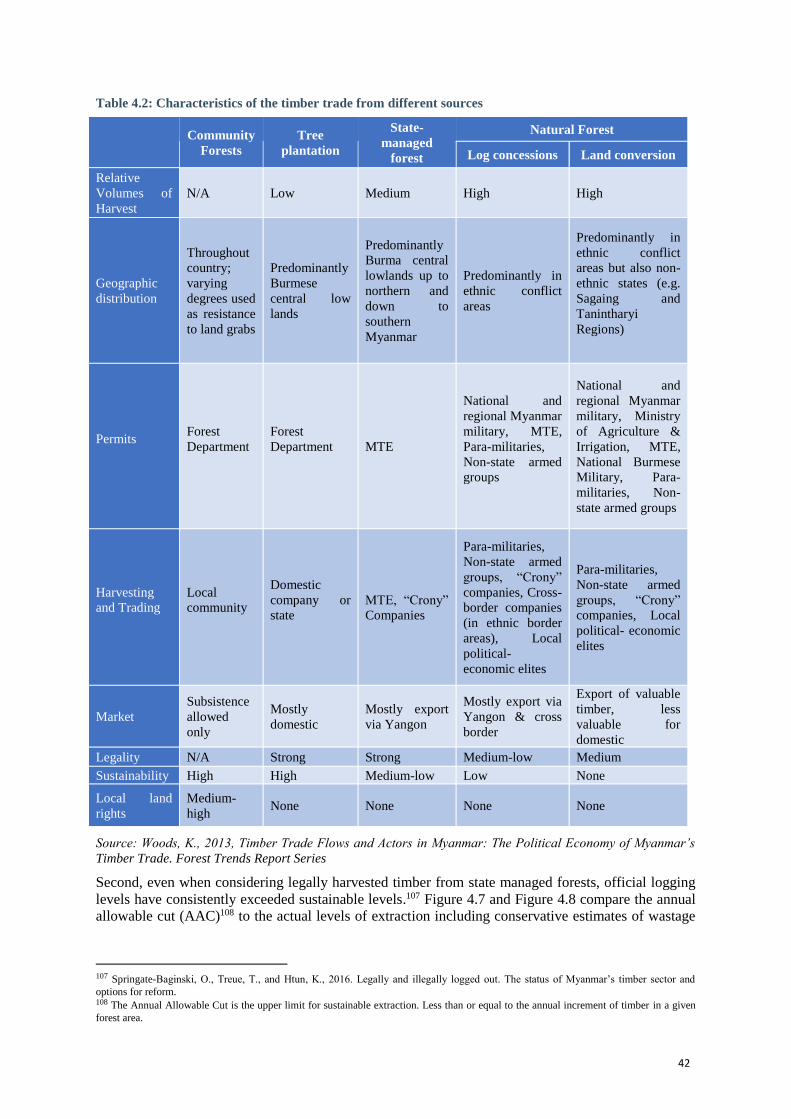
42
Table 4.2: Characteristics of the timber trade from different sources
Community
Forests
Tree
plantation
State-
managed
forest
Natural Forest
Log concessions Land conversion
Relative
Volumes of
Harvest
N/A Low Medium High High
Geographic
distribution
Throughout
country;
varying
degrees used
as resistance
to land grabs
Predominantly
Burmese
central low
lands
Predominantly
Burma central
lowlands up to
northern and
down to
southern
Myanmar
Predominantly in
ethnic conflict
areas
Predominantly in
ethnic conflict
areas but also non-
ethnic states (e.g.
Sagaing and
Tanintharyi
Regions)
Permits
Forest
Department
Forest
Department
MTE
National and
regional Myanmar
military, MTE,
Para-militaries,
Non-state armed
groups
National and
regional Myanmar
military, Ministry
of Agriculture &
Irrigation, MTE,
National Burmese
Military, Para-
militaries, Non-
state armed groups
Harvesting
and Trading
Local
community
Domestic
company or
state
MTE, “Crony”
Companies
Para-militaries,
Non-state armed
groups, “Crony”
companies, Cross-
border companies
(in ethnic border
areas), Local
political-
economic elites
Para-militaries,
Non-state armed
groups, “Crony”
companies, Local
political- economic
elites
Market
Subsistence
allowed
only
Mostly
domestic
Mostly export
via Yangon
Mostly export via
Yangon & cross
border
Export of valuable
timber, less
valuable for
domestic
Legality N/A Strong Strong Medium-low Medium
Sustainability High High Medium-low Low None
Local land
rights
Medium-
high None None None None
Source: Woods, K., 2013, Timber Trade Flows and Actors in Myanmar: The Political Economy of Myanmar’s
Timber Trade. Forest Trends Report Series
Second, even when considering legally harvested timber from state managed forests, official logging
levels have consistently exceeded sustainable levels.107 Figure 4.7 and Figure 4.8 compare the annual
allowable cut (AAC)108 to the actual levels of extraction including conservative estimates of wastage
107 Springate-Baginski, O., Treue, T., and Htun, K., 2016. Legally and illegally logged out. The status of Myanmar’s timber sector and
options for reform. 108 The Annual Allowable Cut is the upper limit for sustainable extraction. Less than or equal to the annual increment of timber in a given
forest area.

43
and illegal extraction. These patterns have continued, in the year leading up to the ban on exports,
official teak extraction in Sagaing alone exceeded the national AAC in 2013-2014.109
Figure 4.7: Teak AAC and production plus estimated wastage and illegal extraction
Source: Springate-Baginski, O., Treue, T., and Htun, K., 2016. Legally and illegally logged out. The status of
Myanmar’s timber sector and options for reform
Figure 4.8: Other hardwood AAC and production plus estimated wastage and illegal extraction
Source: Springate-Baginski, O., Treue, T., and Htun, K., 2016. Legally and illegally logged out. The status of
Myanmar’s timber sector and options for reform
Third, in recent years “conversion timber”, from the clearance of forests in areas designated for
infrastructure development (including roads and hydropower), and agro-forestry plantations (for
example, oil palm, rubber and bio-fuels) has been a major source of timber exports. In particular,
large scale land acquisitions for agricultural concessions have increased 170% between 2010 and
2013. That does not include concessions granted by sub-national government or local militias. There
is some evidence that these concessions are used to enable the extraction of timber rather than to
develop plantation as by the end of the period only about 25% of the land was planted with crops.
This pattern is illustrated in Figure 4.9.110
109 Ibid. 110 Woods, K., 2015, Commercial Agriculture Expansion in Myanmar: Links to Deforestation, Conversion Timber, and Land Conflicts.
Forest Trends Report Series.

44
Figure 4.9: Area allocated for agribusiness concessions and area planted 2012-2013
Source: Figures from Woods, K., 2015, Commercial Agriculture Expansion in Myanmar: Links to
Deforestation, Conversion Timber, and Land Conflicts. Forest Trends Report Series.
A significant proportion of these concessions have been granted in de-gazetted forest reserves,
including some areas of high conservation value forest. Data is not collected on timber production
from these sources so it is difficult to gauge the extent of timber extracted from these areas.111
Furthermore, the legality of the timber produced from these areas is unclear.
Figure 4.10 illustrates the extent of the development of plantations in areas in Tanintharyi and in
Sagaing regions.
There is a significant trade in illegally logged timber. In principle, all timber extraction that is not
approved by the Myanmar Timber Enterprise (MTE) is illegal (Table 3.1). MTE does not administer
most logging concessions granted in natural forests. These are typically granted in ethnic areas often
under the control of ethnic armed groups. Logging concessions are controlled by local elites (be they
local Burmese military and state officials, ethnic armed groups and local ethnic leaders).112 Much of
the timber is illegally exported across the land borders with China and Thailand, although the
provenance of the timber exported by MTE through Yangon can be uncertain and may come from
illegal sources.113 Given the nature of the trade figures on the scale of the trade are unavailable. The
illegal border trade with China was reputedly at a level of 1 million m3 in the early 2000s, but
111 Ibid. 112 EIA, 2015, Organised Chaos. The illicit overland timber trade between Myanmar and China 113 Woods, K., 2013, Timber Trade Flows and Actors in Myanmar: The Political Economy of Myanmar’s Timber Trade. Forest Trends
Report Series
0
100
200
300
400
500
600
700
800
900
Area(thousandHa)
Allocated Planted

45
declined following a crackdown by the Myanmar and Chinese authorities. In recent years, reports
suggest that the trade is again reaching these levels.114
Figure 4.10: Palm oil concessions granted in Southern Tanintharyi region 2013 (left), landcover change
Katha Township Sagaing region 2002-2014 (right)
Source: Woods, K., 2015, Commercial Agriculture Expansion in Myanmar: Links to Deforestation, Conversion
Timber, and Land Conflicts. Forest Trends Report Series (left), Bhagwat, T. et al, 2016, Myanmar Forest Cover
Change 2002-2014 (right)
Mining - As noted in the mining section, the development of mining activities is associated with
deforestation. This is caused in part through ground clearance for mining to allow access to mineral
deposits. Areas around mines are also likely to be subject to more intensive use as they supply wood
used for fuel and construction at mining camps. An example of forest loss due to mining activity is
shown in Figure 4.11.
Figure 4.11: Forest loss due to mining 2002-2014 Homalin Township, Sagaing region (left), Satellite image
of Homalin Township 2012, showing mining activity along the Uyu river (right)
114 EIA, 2015, Organised Chaos. The illicit overland timber trade between Myanmar and China
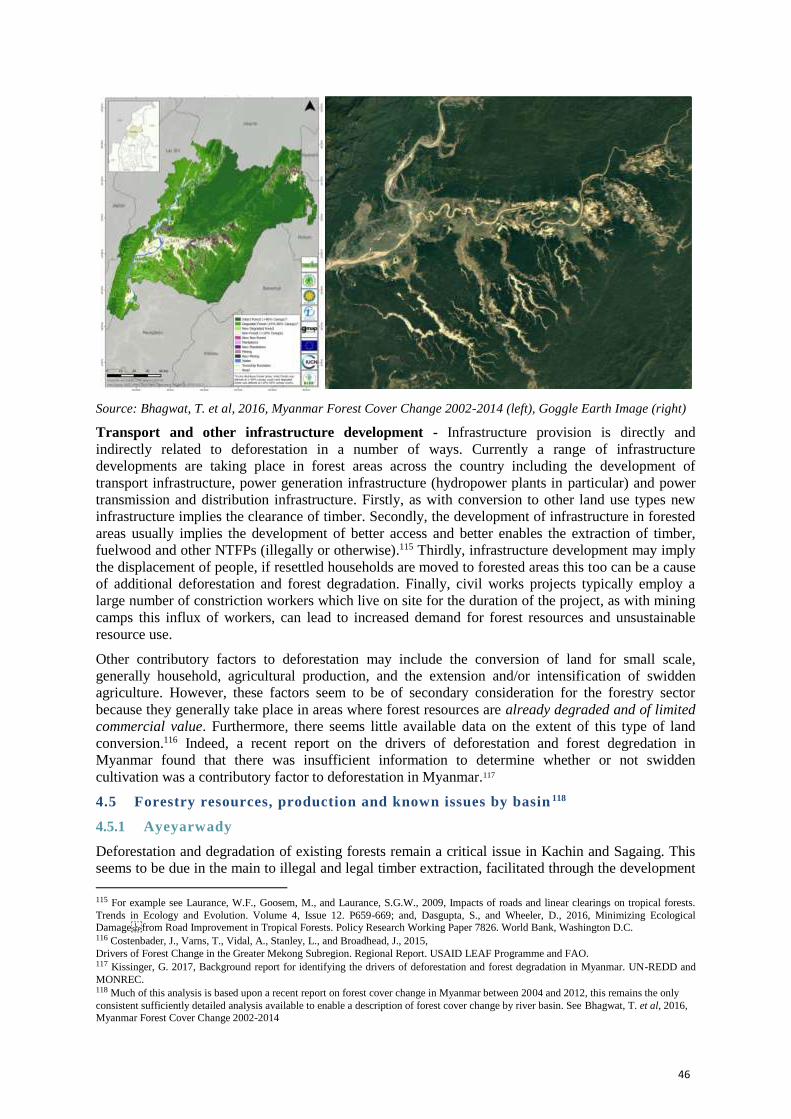
46
Source: Bhagwat, T. et al, 2016, Myanmar Forest Cover Change 2002-2014 (left), Goggle Earth Image (right)
Transport and other infrastructure development - Infrastructure provision is directly and
indirectly related to deforestation in a number of ways. Currently a range of infrastructure
developments are taking place in forest areas across the country including the development of
transport infrastructure, power generation infrastructure (hydropower plants in particular) and power
transmission and distribution infrastructure. Firstly, as with conversion to other land use types new
infrastructure implies the clearance of timber. Secondly, the development of infrastructure in forested
areas usually implies the development of better access and better enables the extraction of timber,
fuelwood and other NTFPs (illegally or otherwise).115 Thirdly, infrastructure development may imply
the displacement of people, if resettled households are moved to forested areas this too can be a cause
of additional deforestation and forest degradation. Finally, civil works projects typically employ a
large number of constriction workers which live on site for the duration of the project, as with mining
camps this influx of workers, can lead to increased demand for forest resources and unsustainable
resource use.
Other contributory factors to deforestation may include the conversion of land for small scale,
generally household, agricultural production, and the extension and/or intensification of swidden
agriculture. However, these factors seem to be of secondary consideration for the forestry sector
because they generally take place in areas where forest resources are already degraded and of limited
commercial value. Furthermore, there seems little available data on the extent of this type of land
conversion.116 Indeed, a recent report on the drivers of deforestation and forest degredation in
Myanmar found that there was insufficient information to determine whether or not swidden
cultivation was a contributory factor to deforestation in Myanmar.117
4.5 Forestry resources, production and known issues by basin 118
4.5.1 Ayeyarwady
Deforestation and degradation of existing forests remain a critical issue in Kachin and Sagaing. This
seems to be due in the main to illegal and legal timber extraction, facilitated through the development
115 For example see Laurance, W.F., Goosem, M., and Laurance, S.G.W., 2009, Impacts of roads and linear clearings on tropical forests.
Trends in Ecology and Evolution. Volume 4, Issue 12. P659-669; and, Dasgupta, S., and Wheeler, D., 2016, Minimizing Ecological Damagefrom Road Improvement in Tropical Forests. Policy Research Working Paper 7826. World Bank, Washington D.C. 116 Costenbader, J., Varns, T., Vidal, A., Stanley, L., and Broadhead, J., 2015,
Drivers of Forest Change in the Greater Mekong Subregion. Regional Report. USAID LEAF Programme and FAO. 117 Kissinger, G. 2017, Background report for identifying the drivers of deforestation and forest degradation in Myanmar. UN-REDD and
MONREC. 118 Much of this analysis is based upon a recent report on forest cover change in Myanmar between 2004 and 2012, this remains the only
consistent sufficiently detailed analysis available to enable a description of forest cover change by river basin. See Bhagwat, T. et al, 2016,
Myanmar Forest Cover Change 2002-2014
47
of areas cleared for plantation and extensive mining activities. Other regions in the river basin have
seen moderate levels of forest loss, particularly in Shan state, although the reasons for this are unclear
as mostly in forest areas that are already degraded so is unlikely to be driven by the extraction of
valuable timber. A more likely explanation is the continued over exploitation for fuelwood and
charcoal, as well as expansion of plantations and agriculture. In the delta deforestation has been
driven by the development of plantations but also use of forests for fuelwood and construction
materials. It is unclear how much if any forest loss has been due to conversion of land to rice or
aquacultural use.
4.5.2 Chindwin
In the Chindwin river basin, high levels of forest loss have taken place due to mining activities, timber
extraction and plantation development. The intact forests of Sagaing region, in particular, have seen
high levels of forest loss and degradation. The Uyu river basin has seen extensive mining activity
which has likely been a cause of considerable forest loss in this area.
4.5.3 Thanlwin
The Thanlwin river basin has seen considerable deforestation along the border areas with Thailand
and China. As with other border areas, much of this is likely to have been driven by the illicit border
trade. Lowland deforestation has been driven by the development of plantations on the edge of
existing agricultural areas.
4.5.4 Sittaung
In the west of the basin in Bago region the development of irrigation reservoirs has been a significant
driver of intact forest loss. More generally, forest cover in the basin has been lost to the development
of plantations and the encroachment of agricultural land.
4.5.5 Mekong
Significant forest loss particularly in boader areas likely due to the expansion of plantations in these
areas, as well as the trade in timber and charcoal.
4.5.6 Tanintharyi
Tanintharyi region has seen forest loss due to the development of plantations and particularly oil palm
plantations. Most forest loss has been to the west with the forests on the Thai border remaining
relatively intact.
4.5.7 Rakhine
The western most townships of Chin state have seen considerable deforestation although the reasons
for this are unclear, given the degraded state of much of the forest in this area most of this change is
likely to be driven by fuelwood extraction and conversion to agricultural uses. In the coastal areas of
Rakhine state the significant loss of mangrove forests is probably driven by extraction for fuelwood
and other subsistence purposes.
4.6 Potential Interactions between hydropower and the forestry sector
Table 4.3 summaries the existing and potential interaction between the hydropower sector and the
forestry sector. It describes actual and potential impact of hydropower development on the forestry
sector, and the impact of forestry sector activities on hydropower development and potential
cumulative impacts.
Table 4.3: Potential interactions between hydropower and forestry
Impact Narrative

48
Impact Narrative
Of hydropower on forestry
Clearance of forest
from inundation
areas
Most biomass is typically removed from impoundment areas. This typically
involves the clear-cutting of remaining timber on the basis of logging concessions.
This typically provides a one-off short term boost to production in the sector. On
the other hand, the potential removal forest areas diminishes the productive forest
area and to that extent the potential of the sector. Given the lack management of
forest resources the legally legitimate extraction of timber from impoundment
areas, can be used for cover to launder illegally extracted timber. Finally, if
concessions are granted through a transparent, competitive and fair manner they
may serve to further entrench problematic patronage networks.
Clearance of forest
for transmission lines
Forest will need to be cleared form the path of any transmission lines. Aside from
the direct impact in terms of forest loss, similar concerns arise as to those for timber
from impoundment areas, i.e. relating to the laundering of illegal timber.
Unsustainable use of
forest resources
curing construction
period
Timber is likely to be extracted from the local area in large quantities to be used in
the construction of HP projects. Moreover, workers encampments are likely to
require timber for some construction purposes. Workers will use fuelwood and
NTFPs from the surrounding area putting further pressure on forest resources.
Deforestation through
better access to
forests
HP development may improve access to hitherto inaccessible or less accessible
forests. Increased access may come through i) the development of access roads; ii)
development of transmission lines; iii) the influx of workers over the construction
period of the HP plant.
Displacement of
agricultural activities
through resettlement
Resettlement from hydropower development areas may cause additional pressure
on forest resources elsewhere as households are moved into new areas.
Establishment of
watershed protection
forest
Hydropower development may bring sustainable management of forest resources in
the watershed area as a means of protecting the watershed of the hydropower
reservoir (see impacts from forestry below).
Of forestry on hydropower
Watershed erosion
and sedimentation
Deforestation resulting from unsustainable forestry practices can result in the loss
of land cover in watersheds up-steam of hydropower plants. This may increase
erosion and reservoir sedimentation and result in the loss of productivity at the
hydropower plant, as well as potentially increased wear and tear on the plant
implying higher O&M costs.
Increase in run-off
and flood risk
Lower forest cover resulting from unsustainable forestry practices may result in
increased levels of run-off and flood risk. This may be particularly acute in
catchments that are prone to flash floods. This may mean higher risks of flood
damage to HP plants and pose problems for HP plant management.
Cumulative impacts
Deforestation and
biodiversity loss
Unsustainable use of forest resources will compound impacts from other sectors on
forest resources. This will lead to a further loss of terrestrial and aquatic
biodiversity.
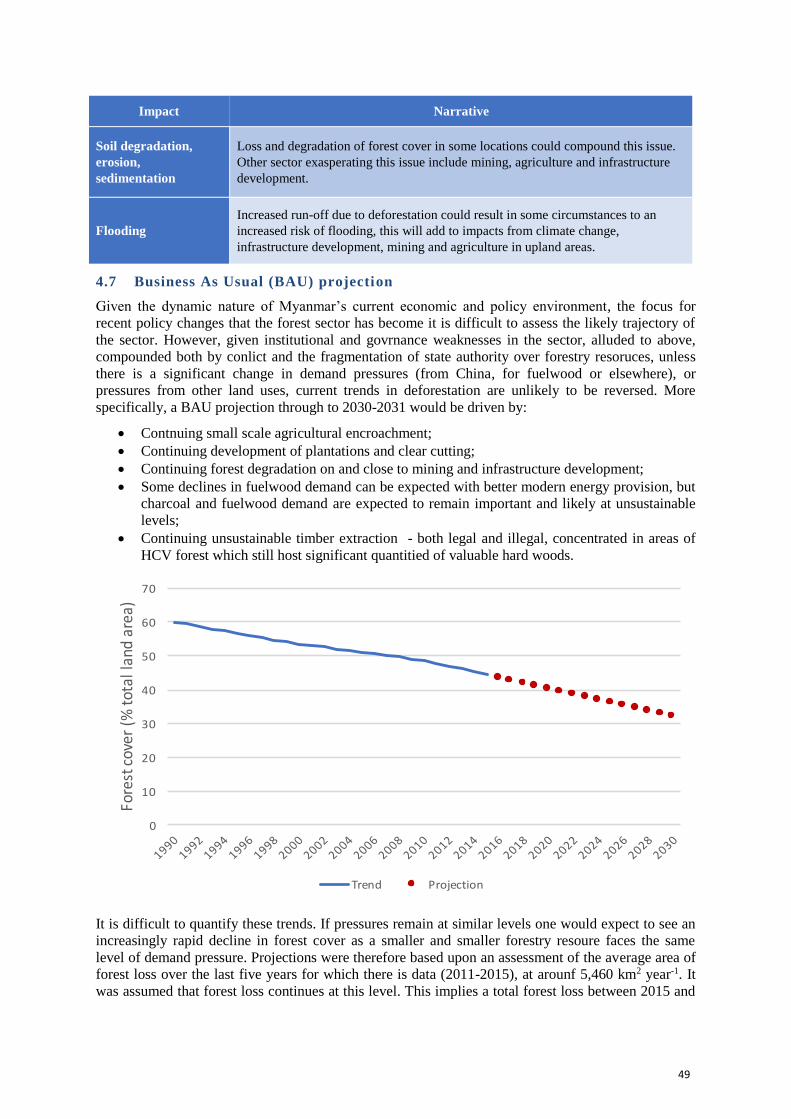
49
Impact Narrative
Soil degradation,
erosion,
sedimentation
Loss and degradation of forest cover in some locations could compound this issue.
Other sector exasperating this issue include mining, agriculture and infrastructure
development.
Flooding
Increased run-off due to deforestation could result in some circumstances to an
increased risk of flooding, this will add to impacts from climate change,
infrastructure development, mining and agriculture in upland areas.
4.7 Business As Usual (BAU) projection
Given the dynamic nature of Myanmar’s current economic and policy environment, the focus for
recent policy changes that the forest sector has become it is difficult to assess the likely trajectory of
the sector. However, given institutional and govrnance weaknesses in the sector, alluded to above,
compounded both by conlict and the fragmentation of state authority over forestry resoruces, unless
there is a significant change in demand pressures (from China, for fuelwood or elsewhere), or
pressures from other land uses, current trends in deforestation are unlikely to be reversed. More
specifically, a BAU projection through to 2030-2031 would be driven by:
• Contnuing small scale agricultural encroachment;
• Continuing development of plantations and clear cutting;
• Continuing forest degradation on and close to mining and infrastructure development;
• Some declines in fuelwood demand can be expected with better modern energy provision, but
charcoal and fuelwood demand are expected to remain important and likely at unsustainable
levels;
• Continuing unsustainable timber extraction - both legal and illegal, concentrated in areas of
HCV forest which still host significant quantitied of valuable hard woods.
It is difficult to quantify these trends. If pressures remain at similar levels one would expect to see an
increasingly rapid decline in forest cover as a smaller and smaller forestry resoure faces the same
level of demand pressure. Projections were therefore based upon an assessment of the average area of
forest loss over the last five years for which there is data (2011-2015), at arounf 5,460 km2 year-1. It
was assumed that forest loss continues at this level. This implies a total forest loss between 2015 and
0
10
20
30
40
50
60
70
Forestcover(%totallandarea)
Trend Projection

50
2030 of 84,600 Km2 between 2015 and 2030, or 28% of the remaining forest area in 2015. This is
equivalent to a deline in forest cover from around 45% in 2015 to 32% by 2030.
Not clear wht this might mean for timber production, clearly with unsustainable levels of timber
extraction it must reach an inflection point at which a large scale timber extraction industry will no
longer be viable. This is in contrast to fuelwood and charcoal production which can utilise much less
mature forest resources.

51
5 MINING
5.1 Resources
Myanmar’s complex geology means it has potentially large and varied mineral resources throughout
the country, many of these resources have yet to be thoroughly explored.119 A recent study on
Myanmar’s geological potential notes: “Myanmar comprises one of the most diverse and richly
endowed collections of natural resources in Southeast Asia, and as a country retains huge potential for
the growth of its mining industry - both through the rehabilitation of old workings, and by the
discovery of new ore deposits”.120 Resources include, gemstones, mineral fuels (coal, natural gas and
oil), metals (iron, manganese, chromium, nickel, molybdenum), precious metals (gold, platinum and
silver), base and non-ferrous minerals (lead, zinc, copper, tin, tungsten, antimony), chemical fertilizer
minerals (barite, fluorite, gypsum and rock salt), ceramic and refractory minerals (clay, limestone,
dolomite, feldspar and quartz) and construction materials (granite, limestone and sand). Figure 5.1
shows the broad mineral producing areas of Myanmar (left) and the major oil and gas producing areas
(right).
Figure 5.1: Major mineral resources (left) and oil and gas fields (right)
Source: IES and MMIC 2015 (left), Ministry of Mines 2013(right)
Myanmar hosts mineral deposits of global significance at Badwin (Lead-Zinc-Silver), Monywa
(copper) and Mawchi (tin-tungsten).121 Despite the undoubted potential commercial significance of
these deposits, in general proven reserves are small relative to reserve levels in countries that
dominate the markets for these minerals.122 Table 5.1 highlights the estimated extent of major mineral
resources in Myanmar. Given the underdeveloped nature of the most of the estimates of resource
potential remain speculative. Estimates of the resource potential for Jade and other precious stones
have not been available.
Table 5.1: Estimated major mineral reserves in Myanmar
119 Htun, K. 2014, Sustainable Mining in Myanmar. Applied Environmental Research: 36 (1): 25-35. 120 Gardiner,N.J., Robb, L.J., and Searle, M.P., 2014, Review. The metallogenic provinces of Myanmar. Applied Earth Science. Volume
123, No. 1.
121 Gardiner, N.J., 2014, Burma’s Rising Star. The Geologist. Retrieved from https://www.geolsoc.org.uk/Geoscientist/Archive/February-
2015/Burmas-rising-star 122 IES, MMIC and ADB, 2015, Myanmar Energy Master Plan.

52
Mineral No. of
occurrences
Resource estimate
(mmt, possible) Notes
Lead - Zinc 291 44 Zinc ores of 0.3 - 36%
Lead-Zinc ores of 1.06 - 5 %
Lead-Zinc-
Silver >100 - Major deposits at Bawdwin
Tin Tungsten 480 40 Major deposits at Mawchi and Heinda, Hermingyi
Copper 50 1,583 Copper content 0.4 - 1.5% (Largest deposit at
Letpadaung 1,478 mmt at 0.4%)
Gold 341 66 Gold content 1.4 - 27 ppm
Main mining operations at Kyaukpahto
Iron 393 495 Iron content 28-66%
Manganese 52 9 Manganese content 6.6-27%
Nickel 14 76
Tagaung Taung lateritic nickel deposit 40 Mt at
2%, Mwetaung lateritic nickel deposit 36 Mt at
1.5%
Chromite 43 - -
Coal 300 480 Mainly sub-bitumous
Source: Swe, Y.M., 2016, Geology and Mineral Resources of Myanmar. Presentation 28 January 2016.
5.2 Production and economic significance
In terms of production, Table 5.2 shows the major mineral products in Myanmar for the years 2009 -
2013. Myanmar produces a number of mineral commodities including non-ferrous metals such as
copper, gold, lead, tin, tungsten and zinc, precious and semi-precious stones (including jade,
diamonds, rubies and sapphires), as well as oil, natural gas and coal.123 Myanmar produced 70% of the
world’s Jadite and 90% of the world diamonds. The country also produces significant amounts of
construction materials such as cement, sand and limestone (Table 5.2) for domestic use.
Figure 5.2 illustrates the main mining locations for different minerals in the country.
Table 5.2: Production of selected minerals in Myanmar 2009 - 2013
Commodity Unit 2009 2010 2011 2012 2013
Metals
Antimony Tonnes 3,700 5,900 7,000 7,400 9,000
Copper (mine output) Tonnes 3,500 9,000 9,000 19,000 25,000
Gold, refined Kg NA NA NA 787 893
Lead (mine output) Tonnes 5,000 7,000 8,700 9,800 11,700
Manganese (mine output) Tonnes 242,000 299,000 234,400 157,000 160,000
Nickle (mine output) Tonnes 10 - 800 5,000 9,300
Silver (mine output) Kg 249 - - - -
Tin (mine output) Tonnes 1,000 4,000 11,000 10,600 45,200
Tungsten (mine output) Tonnes 87 163 140 130 130
123 USGS 2013, USGS Minerals Yearbook. Burma.

53
Commodity Unit 2009 2010 2011 2012 2013
Zinc (mine output) Tonnes 6,000 8,975 30,000 21,539 31,295
Industrial minerals
Barite Tonnes 7,623 8,975 30,000 21,539 313,295
Cement, hydralic Tonnes 669,941 534,034 538,000 600,000 600,000
Gypsum Tonnes 97,518 81,051 50,000 64,079 60,510
Precious and semiprecious stones:
Jade Kg 25,427,237 38,990,035 45,000,000 19,080,442 12,768,000
Ruby do. 1,674,579 1,612,070 870,000 852,033 395,711
Sapphire do. 795,228 1,311,327 1,500,000 1,351,916 1,059,559
Spinel do. 296,956 618,730 620,000 514,052 417,441
Crude, rock salt Tonnes NA NA NA 207,261 210,000
Stone:
Dolomite Tonnes 4,390 3,119 2,000 170 400
Limestone, crushed and
broken
1,000
tonnes 4,000 3,200 3,200 428 667
Mineral fuels and related materials
Coal, lignite Tonnes 245,418 217,650 300,000 471,022 380,272
Gas, natural marketed million
cumec 11,555 12,425 12,500 12,577 12,894
Crude bbl 6,881 6,806 6,400 6,197 5,857
Source: USGS, 2013, 2013 Minerals Yearbook, Burma [Advance Release]
According to official figures mining activities, excluding oil and gas extraction, accounted for 1.2%
of GDP or around Kyat 634 billion (constant 2010 prices) in 2014-2015. This represents significant
growth in the sector, with average real growth rate in value added running at approximately 20% per
year for the last 15 years. The mining sector is an important source of export earnings accounting for
around 12% of exports by value in 2014-2015. Jade exports accounted for approximately 8% of this
figure.124 It should be noted that official figures on the trade in Jade have shown a decline in 2015 and
2016. The reasons for this are not clear but may point to a reduction in production due to renewed
conflict in Jade producing areas and reduced demand in China.125
Considering the potential of the sector, mining has attracted relatively little foreign investment.
Between 1988 (when foreign investment was enabled by new legislation) and 2015, only US$2.87
billion was invested in the sector, less than 5% of all FDI. This remains relatively low with the sector
attracting only US$ 6.26 million in 2014-2015 out of a total across all sectors of US$ 8 billion.
Concerns about the investment climate for mining activities, and especially high risk exploration
activities are preventing higher levels of investment (see below).
124 World Bank, 2016, Myanmar Economic Monitor. October 2015. 125 Ibid.

54
Figure 5.2: Mineral extraction activities in Myanmar 2016 (left) estimated ground disturbance due to
mining activities 2014 (right)
Source: Bauer, A., Shortell, P. and Delesgues, L., 2016. Sharing The Wealth: A Roadmap for Distributing
Myanmar’s Natural Resource Revenues. Natural Resource Governance Institute (left), Connette et al., 2016,
Assessment of Mining Extent and Expansion in Myanmar Based on Freely-Available Satellite Imagery. Remote
Sensing. 8, 912
5.3 Data accuracy
Many commentators have noted that figures on mining and mineral extraction activities are highly
unreliable. Production and export figures do not, by and large, take into account in-country
stockpiling, illegal and quasi-legal mining operations and a large black market.126
The Jade sector in particular is subject to significant problems relating to illegal activities resulting in
the significant under reporting of the value of the sector. While official figures for 2013-2014 showed
total mineral exports worth US$ 1.15 billion, estimates from the Myanmar Gem Emporium127 indicate
sales of US$ 3.4 billion in the same year.128 Higher estimates based upon Chinese imports suggest the
trade in Jade was worth US$ 12.3 billion. Global Witness provides a higher estimate of over US$ 30
billion in 2013-2014 based upon estimates of Jade quality and the extent of smuggling across the
Chinese border. These estimates are shown in Figure 5.3 (right) alongside the value of gas exports and
total national GDP estimates for comparison. As the figures suggest, the value of the mining sector to
the economy is likely to be massively underestimated by official figures.
126 Global Witness, 127 The government owned trading company which controls the official Jade trade in Myanmar. 128 Global Witness, 2015,

55
Figure 5.3: Mining sector value-added (left) and differing estimates of value of Jade exports in 2013-2014
context (right)
Source: Department of Planning, World Development Indicators, IMF 2015, Global Witness 2015
5.4 Employment and livelihoods
Estimates of employment in the mining industry vary markedly between sources. Statistics from the
Ministry of Mines (
Figure 5.4) show remarkable fluctuation in the number of employees over the last 15 years. With
employment growing from around 14,000 in 1995, to at its peak, over 71,000 in 2010, and dropping
dramatically to around 18,500 by 2014. These figures probably show employment in state owned
mining enterprises under the remit of the Ministry of Mines and foreign invested mines, and do not
take account of private sector and wide-spread artisanal mining. Alternative data gained from the
2014 census suggests employment in the mining industry stood at around 168,000. The census figures
probably better represent the importance of employment in mining. In the case of a significant
proportion of artisanal miners this is likely to be a secondary and/or seasonal occupation, something
which may not be picked up in the census data.129 Some press reports suggest that the figure for
employment in Jade mining alone could be 300,000.130 Moreover, official figures aside, it is likely
that employment in mining has grown over recent years with increases in production of most minerals
(Table 5.2).
The census figures indicate that 80% of this mining employment is in rural areas. The breakdown by
state and region also illustrates locations where mining activity is concentrated, with Mandalay,
Sagaing, Kachin and Magway representing the main Jade, Ruby, Gold and Copper producing areas
which accounted for around 75% percent of employment in the sector. In terms of the importance of
the mining sector to employment in different areas, almost 6% of the workforce in Kachin state
worked in mining, followed by Kayah (3%), and Sagaing and Mandalay (2%). In all other areas
mining accounted for less than 1% of employment.131
129 Hentschel, T., Hruschla, F., and Priester, M., 2003, Artisanal and Small Scale Mining. Challenges and Opportunities. IIED and World
Business Council for Sustainable Development. 130 Myanmar Now, 26 May 2016, Dreams of riches and risk of death - a jade miner’s life. Retrieved from http://www.myanmar-
now.org/news/i/?id=df5e65ef-c61e-43cd-a53d-71aba14403ed 131 2014 Census
-
5
10
15
20
25
30
35
Mineralsexports(officalfigure)
Gasexports JadeEmporium
Sales
Chineseimports
GlobalWitnessestimate
BillionUSD
0
100
200
300
400
500
600
700
2000-2001 2003-2004 2006-2007 2009-2010 2012-2013
BillionKyat(constant2010prices)

56
Figure 5.4: National employment in mining sector 1995-2014 (left) share of employment by region/state
2014 (right)
Source: Ministry of Mines (left), 2014 Census (right)
Mining is physically difficult and dangerous work, but provides considerable livelihood opportunities.
It generally generates higher incomes than other employment activities in rural areas such as small
scale farming, fishing, and forestry. It also offers the potential for livelihood diversification, allowing
farmers to pursue the activity during the dry season when demand for agricultural labour is low. There
is some evidence that farmers are forced to take up the activity when they are forced off their land,
whether this is through loss of land to infrastructure or plantation development, loss of land to mining
or pollution from mines operating in the area.132
5.5 Development issues in the mining sector
Despite recent growth in production in the mining sector in Myanmar, the resource base remains
underexplored, production is underdeveloped and the sector is largely unregulated. Foreign
investment in the sector remains relatively low and further development is constrained by a range of
institutional, political and infrastructural factors.
Investors complain that the government has little understanding of the incentive structure facing
investors in exploration and mining. This is coupled with unrealistic expectations of the value of
mineral deposits, current regulations (including production sharing contracts, high dead-rents and
signature bonuses) that are unfavorable to exploration risk investment, complex procedures and over
lapping central and sub-national government remits, and a poor business environment. Other risks
include complex governance arrangements with multiple stakeholders (for example, central
government, sub-national government, different ministries, the military and other armed groups).133
The perception of uncontrolled political risk in the sector arising from unresolved conflict, risk of
complicity in human rights violations (in particular, related to the expropriation of land) and political
uncertainty, also discourage foreign investment in the sector.134 In addition to these barriers, investors
also cite the lack of infrastructure including access to electricity for mining operations, poor roads and
communications infrastructure, and continuing conflict in some locations.135 As such the sector
132 IHRB, Myanmar Centre for Responsible Business and the Danish Institute for Human Rights, 2016, Myanmar MiningSector Wide
Impact Assessment on Limestone, Gold and Tin. Draft report. 133 Reynolds, N., 2014, Myanmar’s Mining Industry Realities and Visions for the Future. Presentation. CSA Global. 134 IHRB, Myanmar Centre for Responsible Business and The Danish Institute for Human Rights, 2016, Myanmar MiningSector Wide
Impact Assessment on Limestone, Gold and Tin. Draft report. 135 Ibid, IHRB, Myanmar Centre for Responsible Business and the Danish Institute for Human Rights, 2016, Myanmar MiningSector
Wide Impact Assessment on Limestone, Gold and Tin. Draft report.
MoMfigures
Censusfigure
0
20
40
60
80
100
120
140
160
180
1995 2000 2005 2010
Thousand
OtherKayah
YangonAyeywawady
Bago
Shan
Magway
Kachin
Sagaing
Mandalay

57
remains dominated by small scale and artisanal mining (ASM)136 using antiquated techniques and
technologies, with low productivity and extraction rates, very poor health and safety practices and
effectively no environmental controls.
5.6 Environmental and social issues relating to mining
Mining in Myanmar is characterized by widespread social and environmental issues stemming from
poor technology skills and regulation, underinvestment and control by vested interests. While the
issues differ depending on the physical and social context of the mining operations and the type of
mining operations taking place the key environmental issues that are typical of mining operations in
Myanmar include:
• Erosion - Mining can lead directly or indirectly to increased erosion. Most mining in
Myanmar is surface mining and involves extensive soil disturbance and removal of top soil
and vegetation. Without any remedial action this can leave large areas of land vulnerable to
erosion.137 Hydraulic mining is particularly damaging. This is a commonly used mining
techniques for the extraction of alluvial gold, tin and precious stones. A high-pressure water
jet is used to dislodge the material (rock or sediments) bearing the mineral. The resulting
slurry is then processed, typically through sluices to remove valuable material. This type of
mining mobilizes large amounts of sediment potentially causing issues downstream, it also
leaves large areas vulnerable to further erosion. Mining alluvial deposits on or near water
courses also can exasperate erosion and cause issues with river bank stability.138
• Deforestation and biodiversity loss - Mining is often associated with deforestation and loss
of biodiversity. This is not only a consequence of the direct disturbance of land through
mining activities but also through ancillary activities associated with mining. Timber is used
for fuel, construction purposes within mines and mining camps. The additional access to areas
through the creation of mines may also open-up forested areas to logging. Similarly, NTFPs
may be subject to unsustainable exploitation around mining camps and previously
inaccessible areas opened-up to exploitation from the development of mining activities.
• Agricultural land and productivity loss - as with forested areas agricultural land can also be
affected directly and indirectly from mining operations. Land can be lost directly to mining
operations. Land can also be affected from the disposal of spoil, tailings and pollution from
mines sites. Changes in erosion, sedimentation and hydrology caused by mining activities
may also affect the productivity of agricultural land.
• Water pollution - water pollution is a key concern in mining activities as highlighted during
the regional river basin consultation in Monywa for the Chindwin River Basin. The type and
extent of pollution will depend upon the type of mining activities taking place. Key concerns
include the widespread use of Mercury in gold mining. A recent study showed that
concentrations of Mercury in mine-workers were 2.4 times that of the general population as
well as high concentrations of mercury amongst sediments in gold mining locations.139 Other
heavy metals (such as lead and cadmium) may also be mobilized in the mining process and
contaminate ground and surface water. Cyanide is also widely used in the processing of gold
and poses a threat to animal and human health if it contaminates the water supply.
Acidification of water sources either through the percolation of water through mined
136 Small scale mining projects accounted for 1,165 of a total 1,299 licensed mining operations in late 2014. (Ibid) 137 Connette, L. Et al, 2016, Assessment of Mining Extent and Expansion in Myanmar Based on Freely-Available Satellite Imagery; PYO,
2009, Robbing the Future. Russian backed project threatens Pa-O communities in Shan state, Burma. KDNG, 2007, Valley of Darkness
Gold mining and militarization in Burma s Hugawng valley. 138 Images Asia and Pan Katchin Development Society, 2004, At What Price? Gold Mining in Kachin State Burma; Global Witness, 2015,
Jade: Myanmar’s Big State Secret; PYO, 2011, Poison Clouds. Lessons from Burma’s Largest Coal Project at Tigyit; Myanmar Times, 23 June 2016, Sagaing authorities start gold mine clampdown. Retrieved from http://www.mmtimes.com/index.php/business/21003-sagaing-
authorities-start-gold-mine-clampdown.html ; East Asia Forum, 23 September 2015, Myanmar’s mining investment and its discontents.
Retrieved from http://www.eastasiaforum.org/2015/09/23/myanmars-mining-investment-and-its-discontents/ 139 Osawa, T. and Hatsukawa, Y. 2015, Artisanal and small-scale gold mining in Myanmar: Preliminary research for environmental mercury
contamination. International Journal of Hummanities and Cultural Studies. No. 25, 201

58
materials, through contaminated water drained from mines or through the contamination of
water bodies from tailings left as a result of ore processing (e.g. as in the case of copper).140
• Other pollution - dust and noise pollution from mining and quarrying activities can also
cause significant localized environmental problems, impacting human and animal health.
There is an increasing awareness of the environmental problems caused by mining, but this has yet to
illicit any substantive regulatory response. Although some relevant policies do exist (e.g. in the 1994
Mines Law to protect against environmental damage, prevent activities that may have detrimental
impacts, and requirement for regular inspections and monitoring), the capacity and resources to
enforce these requirements are largely absent.141 In addition to these commonly cited environmental
problems a number of health and social issues associated with mining activities in Myanmar have
been noted in the literature. The most important of these include:
• Drug use - drug abuse is wide spread and well documented amongst mining areas. Miners
reputedly take the drug to enable them to cope with the long hours of physically demanding
work in the mines. Many miners are long term users of heroin, with some estimates
suggesting that up to 60% of Jade miners in Hpakan are addicted to opiates.142 Widespread
intravenous drug use and the sharing of needles amongst miners has also lead to high rates of
HIV infection.143
• Accidents - mining is a dangerous occupation. Working conditions are hazardous as people
work in close proximity to large machinery and accidents involving collapses in mine
workings and landslides.
• Occupational health - aside from accidents at work miners are also prone to work related
diseases. Lung disease characterized by frequent lung infections is common and caused by the
long-term inhalation of particulate matter and water droplets during drilling without suitable
respiratory equipment. Other health issues relate the expose to use of poisonous substances
such as mercury, cyanide and contaminated wastewater.
• Land issues - expropriation of land for mining remains a critical issue at many mining
locations. Farmers and other land owners are frequently evicted from land without adequate
consultation, compensation or resettlement. This issue is well documented at numerous
locations. For example, conflict with villagers at Letpadaung copper mine where 26 villages
have been affected by the development remains on-going.144
• Booming sector effects - expansion in mining in a location can cause localized price inflation
as demand increases with an influx of miner workers, particularly for essential items such as
food. This can cause hardship for households employed in other sectors.
5.7 Extent of mining in Myanmar and recent growth
Given the extent of illegal and quasi-legal mining and the absence of accurate figures on mining,
establishing trends in the actual conduct of mining activities throughout the country is difficult. A
recent study however has sought to establish the extent of mining activities through using GIS
analysis to identify areas of likely ground disturbance due to mining.145 Figure 5.5 (left) shows change
in area of mining activity between 2002 and 2015, and (right) the proportion of the national total by
region/state. This shows clearly the preponderance of mining activity in Kachin (gold and Jade),
Sagaing (gold) and Mandalay (gold and rubies).
Figure 5.5: High certainty mining area 2002 and 2015 (left) proportion of national by region/state (right)
140 Smith, M., 2007. Environmental governance of mining in Burma. in M. Skidmore and T. Wilson (eds), Myanmar: The State, Community
and the Environment. (Canberra, ACT Asia Pacific Press, ANU): 218-45. 141 ADB, 2012, Interim Country Partnership Strategy: Myanmar 2012-2014. 142 VOA, 27 May 2016, Dangerous Myanmar Jade Mines Bring Income, Death. Retrieved from
http://www.voanews.com/a/dangerous-myanmar-jade-mines-bring-income-death/3348378.html 143 Médecins Sans Frontières treats nearly 2,000 HIV/AIDs patients in Hpakant, and an additional 8,000 at four other clinics in Kachin state.
Myanmar Now, 20 June 2016, Jade miners’ hopes of fortune often become tragedy of addiction. Retrieved from http://www.myanmar-
now.org/news/i/?id=07855944-5f27-4095-b358-d1bca7733090 144Zerrouk, E. and Neef, A., 2013, The Discourse of Land Grabbing and Resistance in Newly Reforming Myanmar: The Monywa Copper
Mine. 145 Connette, L. Et al, 2016, Assessment of Mining Extent and Expansion in Myanmar Based on Freely-Available Satellite Imagery

59
Source: Connette, L. Et al, 2016, Assessment of Mining Extent and Expansion in Myanmar Based on Freely-
Available Satellite Imagery.
Those estimates are conservative. Table 5.3 gives a breakdown of estimates of surface disturbance
due to mining in terms of the certainty of the attribution of the activity to mining by river basin. This
serves to emphasise the preponderance of mining in the Ayeyarwady (and Chindwin) basin.
Table 5.3: Mining area by major river basin and certainty in Myanmar 2014
Region Certainty (area, Km2) Total
High Medium Low Area (Km2) Share (%)
Ayeyarwady 44,096 22,320 8,597 75,013 87.0
Sittaung 2,756 936 292 3,984 4.6
Tanintharyi 1,692 582 532 2,806 3.3
Thanlwin 1,654 1,025 262 2,941 3.4
Others 19 291 1,213 1,523 1.8
Total 50,217 25,154 10,896 86,267 100
Source: Consultants analysis based upon Connette, L. Et al, 2016, Assessment of Mining Extent and Expansion
in Myanmar Based on Freely-Available Satellite Imagery.
This analysis does not capture much of the placer gold mining that takes place on in-stream deposits
which are subject to flooding during the wet season, nor does it include mining of river sediments
using floating dredgers or shaft/tunnel mining. Nevertheless, these conservative estimates do indicate
the large extent and rapid expansion of mining activity in Myanmar over the last decade or so, and
suggest a minimum bound for mining activity.
5.8 Mining activities by major river basin
A significant amount of mining activity is indicated in the Chindwin, Ayeyarwady, Sittaung,
Thanlwin river basins and the Tanintharyi coastal basin. Moreover, there are indications that the
extent of these activities has increased significantly over the last decade in all these basins.
Nevertheless, the Chindwin and Ayeyarwady basins, covering a combined 61 % of Myanmar’s land
area, together account for almost 90% of the mining activity in the country (Figure 5.6).
Figure 5.6: High certainty land disturbance due to mining in 2015 by major river basin
0
5,000
10,000
15,000
20,000
25,000
Hectares
2002 2015
Tanintharyi Bago
Shan
Other
Mandalay
Sagaing
Kachin

60
Source: Connette, L. Et al, 2016, Assessment of Mining Extent and Expansion in Myanmar Based on Freely-
Available Satellite Imagery.
5.8.1 Ayeyarwady
The Ayeyarwady river basin hosts several important mining areas, particularly to the north of the
basin (
Figure 5.8). These include precious stone mining areas at Mogok in Mandalay region and Mong Shu
in Shan state, precious stone belts and a ruby mine at Mong Shu in Shan state. Mandalay is also the
location of extensive gold mining activity (Figure 5.9). Other important mining activities in the basin
include the nickel mine at Tagaung Taung, also in Mandalay, the Silver-Zinc-Lead mine at Bawdin in
Shan state, and the Modi Taung gold mine.
Ayeyarwady
Chindwin
Sittaung
TanintharyiThanlwin Others

61
Figure 5.7 Mining activity in Ayeyarwady River Basin

62
Figure 5.8. Mining activity in the Mandalay Region

63
5.8.2 Chindwin
The Uyu river basin is home to the Hpakant Jade deposit in its headwaters. There is also a
considerable amount of gold mining along the length of the Uyu river (Figure 5.10), as well as
elsewhere in the Chindwin Basin (Figure 5.9). The Monywa copper mine and associated power plant
at Kalewa are also on the Chindwin River. The Chindwin and Uyu River Basin are probably the areas
with the greatest concentration of mining activity in the country, as such there are numerous reports of
environmental and social problems relating to mining in these areas.
Figure 5.9. Mining Activity in the Chindwin Basin

64
Figure 5.10. Mining areas in Uyu River Basin

65
5.8.3 Thanlwin

66
The Thanlwin is also the site of mining for limestone, some ASM gold mining, and Mawchi tin-
tungsten mine. There is also a mine mouth coal fired power plant at Mawchi + coal
5.8.4 Sittaung
There are indications of significant mining activity in the Sittaung river basin. Some of this is
accounted for by granite mining and ASM gold mining. Other mining activity may also be present in
the basin. There are no known reports of issues related to mining occurring in this river basin.
5.8.5 Taninthayri
The Tanintharyi hosts a considerable amount of tin and tungsten mining, although there are no reports
of environmental or social issues related to mining in this area.
5.9 Sand mining
Sand mining has been widespread on major rivers and beaches throughout Myanmar. Up and down
the major rivers of Myanmar sand dredgers are a common sight. Moreover, judging by the experience
of other countries in the region (notably Vietnam, Cambodia and Indonesia) demand from every
sector can be expected to increase. Regulatory environment and enforcement are weak. Although the
central government has banned sand mining from beaches enforcement seems be weak and it is
unclear whether this is enforced at the local level.146
While firm figures are difficult to come by, in 2008, Singapore imported 600,000 tonnes of sand for
construction purposes. There are no figures on domestic demand, but based upon domestic cement
demand of 8 million tonnes in 2016, domestic sand demand in the region of 64 million tonnes is
feasible.147 With burgeoning demand for construction materials domestically and high levels of
regional demand - particularly from China and Singapore - the market will continue to drive an
expansion in sand mining. Some evidence suggests that a recent tightening of regulations on sand
mining in Cambodia acted to increase demand for sand in Myanmar.
As transportation constitutes a large share of the cost of sand, extraction tends to be concentrated as
close as possible to the sources of demand. This typically means urban areas where most construction
takes place. Moving large quantities of sand and gravel from the same location can quickly alter
channel morphology, which can have impacts at the site and downstream (these may include impacts
on bank stability, increased erosion around instream infrastructure and loss of habitat). At present
little is known about the sediment budget for the major rivers in Myanmar, or about the actual extent
of sand extraction from rivers (see Sediment chapter in this SEA baseline assessment report). Further
investigation of sediment budget and extent of sand mining will be carried out under SOBA Package
4: Sediment and Geomorphology for the Ayeyarwady Basin.
5.10 Potential Interactions between hydropower and mining
Table 5.4 summaries the potential interaction between the hydropower sector and the mining sector,
setting out the potential impact of hydropower development on the mining sector, the impact of
mining sector activities on hydropower development and potential cumulative impacts.
Table 5.4: Potential interactions between hydropower and mining
Impact Narrative
Of hydropower on mining
146 Myanmar Times, 8 April 2015, Ministry orders ban on sand mining. Retrieved from http://www.mmtimes.com/index.php/national-
news/13983-ministry-orders-ban-on-sand-mining.html 147 This is based upon the assumption that most sand demand comes from construction demand for concrete, a typical mix which would be
one part cement to eight parts sand. This is a conservative estimate as it does not take account of sand demand for other uses such as asphalt,
other construction uses and industrial purposes.
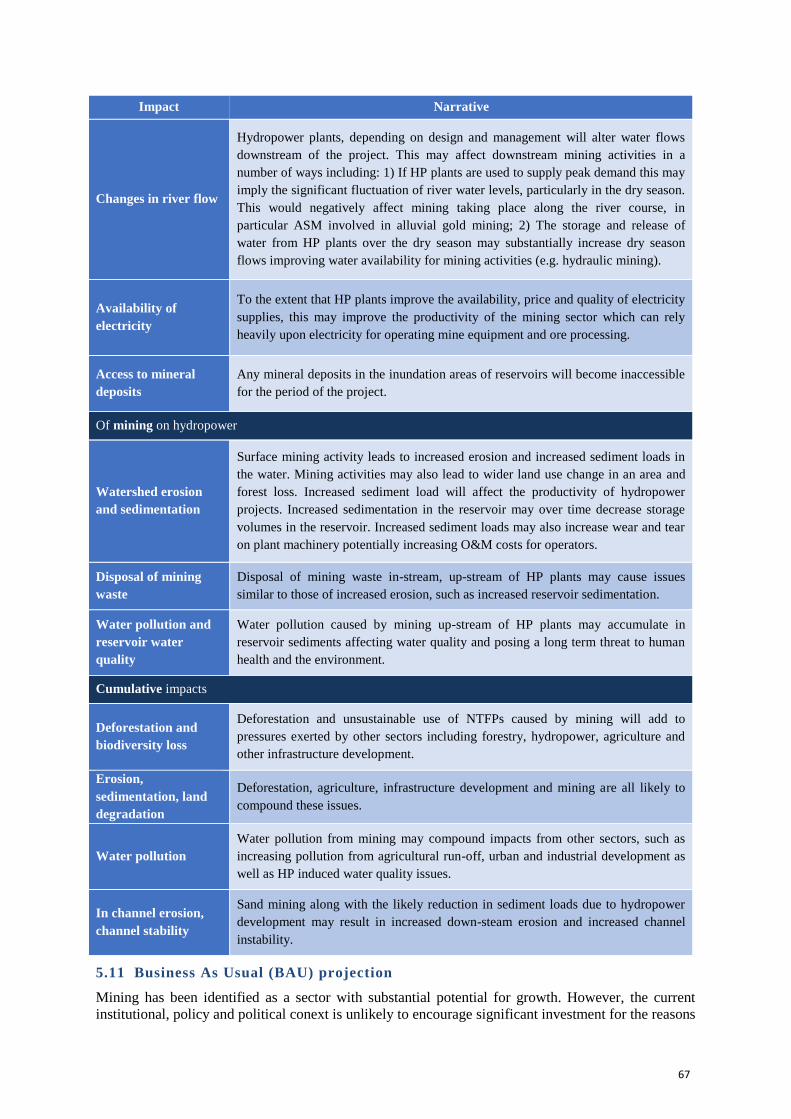
67
Impact Narrative
Changes in river flow
Hydropower plants, depending on design and management will alter water flows
downstream of the project. This may affect downstream mining activities in a
number of ways including: 1) If HP plants are used to supply peak demand this may
imply the significant fluctuation of river water levels, particularly in the dry season.
This would negatively affect mining taking place along the river course, in
particular ASM involved in alluvial gold mining; 2) The storage and release of
water from HP plants over the dry season may substantially increase dry season
flows improving water availability for mining activities (e.g. hydraulic mining).
Availability of
electricity
To the extent that HP plants improve the availability, price and quality of electricity
supplies, this may improve the productivity of the mining sector which can rely
heavily upon electricity for operating mine equipment and ore processing.
Access to mineral
deposits
Any mineral deposits in the inundation areas of reservoirs will become inaccessible
for the period of the project.
Of mining on hydropower
Watershed erosion
and sedimentation
Surface mining activity leads to increased erosion and increased sediment loads in
the water. Mining activities may also lead to wider land use change in an area and
forest loss. Increased sediment load will affect the productivity of hydropower
projects. Increased sedimentation in the reservoir may over time decrease storage
volumes in the reservoir. Increased sediment loads may also increase wear and tear
on plant machinery potentially increasing O&M costs for operators.
Disposal of mining
waste
Disposal of mining waste in-stream, up-stream of HP plants may cause issues
similar to those of increased erosion, such as increased reservoir sedimentation.
Water pollution and
reservoir water
quality
Water pollution caused by mining up-stream of HP plants may accumulate in
reservoir sediments affecting water quality and posing a long term threat to human
health and the environment.
Cumulative impacts
Deforestation and
biodiversity loss
Deforestation and unsustainable use of NTFPs caused by mining will add to
pressures exerted by other sectors including forestry, hydropower, agriculture and
other infrastructure development.
Erosion,
sedimentation, land
degradation
Deforestation, agriculture, infrastructure development and mining are all likely to
compound these issues.
Water pollution
Water pollution from mining may compound impacts from other sectors, such as
increasing pollution from agricultural run-off, urban and industrial development as
well as HP induced water quality issues.
In channel erosion,
channel stability
Sand mining along with the likely reduction in sediment loads due to hydropower
development may result in increased down-steam erosion and increased channel
instability.
5.11 Business As Usual (BAU) projection
Mining has been identified as a sector with substantial potential for growth. However, the current
institutional, policy and political conext is unlikely to encourage significant investment for the reasons

68
cited above. Given current conditons, it is therefore deemed unlikely that significant increases in the
level of investment in the sector are likely to take place. This of course may change, in particular if
the governance and instirutional context becomes more favourable. International commodity market
prices may also have a significant influence on activity in the sector.
ASM presents a different picture. Anecdaoal evidence suggests that the number of people enganged in
ASM has increased significantly over the last few years. However, this information insufficient to
generate a trend. The data on land disturbance cited above also suggests a significant expansion of
ASM activity throughout the country over the last decade. However, known vialble mineral deposits
are limited, and it is deemed unlikely that the extent of mining will increase at a similar rate in coming
decades. Therefore, for the purposes of future projections we assume that the level of ASM activity
remains at approximately the same level as is currently the case.

69
6 TRANSPORTATION
Transportation infrastructure has been included as a key sector for consideration in the SEA due to
potential interactions between the development of the sector and hydropower and the potential for
cumulative environmental impacts stemming from transportation sector development and
hydropower. However, unlike other sectors it is possible to delimit the scope of analysis in this sector
to i) the provision of transportation infrastructure outside urban areas; and, ii) navigation in inland
waterways, as other aspects of sectoral development (e.g. urban transport, air, public transport,
transport services, and railways) are unlikely to have important environmentally determined
interactions with hydropower development.
6.1 Myanmar’s road network
Myanmar has around 157,000 Km of roads, of these roads around 97,000 Km (62%) are village-to-
town roads, 40,000 Km (26%) are trunk roads, 9,500 Km (6%) are urban roads, and 11,000 Km of
other roads managed by the Army Corps of Engineers (Figure 6.1).148 Myanmar has road density of
0.23 km/km2, around the same level as Lao PDR and Cambodia, but much lower than Thailand at
0.77 km/km2.149 However, according to recent analysis given population density, economic size and
vehicle fleet the figure is quite large.150
Myanmar’s road network is also of generally poor quality. Only 53% of the trunk-road network is
currently paved, and of those 80% are paved using rough-penetration macadam, and around two-
thirds of paved trunk roads are only around 3.7 m wide (12ft). In 2015, over half of trunk roads were
regarded as in “poor condition” with basic road safety features generally absent and road alignments
frequently dangerous.151
Figure 6.1: Road Construction Type by Length (Km) 2013
Source: ADB, 2016, Myanmar transport sector policy note: Trunk roads
The rural road network is similarly underdeveloped (Figure 6.2). With only around 5% of the 49,000
Km paved, 70% with earthen construction, and around 73% of village roads are only classified as
“tracks”.152 In remote and mountainous areas such as Chin and Kachin states the proportion of all-
weather roads is even lower. During the rainy season many of these roads become impassable to most
148 ADB, 2016, Myanmar Transport Sector Policy Note. Summary for Decision Makers. 149 ADB, 2016, Myanmar transport sector policy note: Rural roads and access. Mandaluyong City, Philippines: Asian Development Bank. 150 ADB, 2016, Myanmar transport sector policy note: Trunk roads 151 Ibid. 152 ADB, 2016, Myanmar transport sector policy note: Rural roads and access.

70
motorized vehicles. Moreover, there are many of the timber bridges on rural roads that need to be
replaced frequently and are easily damaged in storms and floods.
Figure 6.2: Myanmar's road network
:
Source: ADB, 2016, Myanmar Transport Sector Policy Note. Summary for Decision Makers.

71
Road bridges also form an essential part of the terrestrial transport infrastructure, particularly in
providing all season access. Most bridges are constructed from timber which needs to be replaced
relatively frequently. Concrete bridges are becoming more common. Most bridges are less than 30 m
in length, although there are a substantial number of larger bridges. In 2013 there were 7,056 bridges,
of which 2,421 were concrete, 4,584 were timber, 16 were bailey bridges and 35 suspension bridges.
There were also 1,220 culverts.
6.2 Road network development
Myanmar has been rapidly developing its road network. Up to 2014, the country had been developing
approximately 8,000 Km of new road per year, of which around 2,500 Km has been paved. Trunk
roads have been extended by around 1,000 Km per year between 2004 and 2014 (Figure 6.3).
Figure 6.3: Road expansion and share of paved road 2004-2013
Source: ADB, 2016, Myanmar transport sector policy note: Trunk roads
The number of bridges has similarly increased with around 20,800m of bridges, causeways and
culverts constructed between 2011 and 2014 by the Department of Rural Development, of which
858m have been of concrete bridges, 13,143m have been of timber bridges, 5,771m of culverts and
1,033m have been of causeways. In addition, a total of 1,664 small bridges, 212 large bridges (of
greater than 30m span) and 86 suspension bridges have been built by MOBA since 1994.153
6.3 Key development issues related to road sector development
While the development of the road network in Myanmar has been progressing rapidly, there are a
number of important issues facing the provision of transportation infrastructure:
• Limited provision of all season rural road infrastructure - much of the road infrastructure
in rural areas becomes impassible during the wet season. About 20 million people live in
villages without access to all season roads. In rural areas with poor road access the costs of
transportation services remain very high. The problem of rural road access is particularly
acute in Chin, Kachin and Kayin states.154
• Poor quality of roads - most trunk roads are in poor or bad condition (60%), requiring urgent
maintenance or full rehabilitation.
• Underinvestment and lack of efficient investment - Myanmar has been under investing in
transport infrastructure. Countries at a similar level of development typically invest 3-5% of
153 Ibid. 154 Ibid.
0
5
10
15
20
25
30
0
20,000
40,000
60,000
80,000
100,000
120,000
140,000
160,000
180,000
2004 2005 2006 2007 2008 2009 2010 2011 2012 2013
Percent
Km
Totalroadlength(Km) Sharepaved(%)

72
GDP, but in the decade between 2005 and 2015 Myanmar only invested around 1.0-1.5% of
GDP. Spending on road infrastructure is around a third of what is needed, and current
spending is not efficient.155
6.4 Environmental issues related to road development
There are a number of key issues related to road development.
• Deforestation and forest degradation - The provision of roads in forested areas enables the
extraction of timber and NTFPs and is a factor in forest degradation and deforestation. While
an issue well documented globally,156 it is not clear to what extent this is an issue in Myanmar.
The relationship is complex. Roads enable the distribution of population over a wider area,
meaning a greater area of forest can be affected. Land beside roads is more likely to undergo
permanent conversion to agriculture, relative to land situated at a greater distance from roads
which may regenerate naturally.
• Ecosystem fragmentation and biodiversity loss - Transport infrastructure presents a
number of threats to biodiversity (i) Physical disturbances - impact on soils, hydrology and
aquatic ecosystems (e.g. increased run-off, erosion and turbidity of water bodies) (ii)
Chemical and nutrient pollution - pollution from transportation and freight including heavy
metals, oil, and air pollution- especially important where there are water bodies near roads
which receive a pulse of pollutants with run-off from heavy rain fall; (iii) Edge effects -
physical and biotic changes associated with abrupt changes in land cover (i.e. such as road
verges); (iv) Road related mortality - some species may be vulnerable to traffic on roads,
increased predation or increased hunting activity; (v) Barrier effects - roads may act as a
barrier to movement for certain fauna ; (vi) Exotic species invasion - roads can act as a
conduit for the ingress of invasive species ; (vii) human invasion - roads facilitate access for
hunters, miners, loggers, farmers and other colonists.157
• Roads and logging - the creation of roads or tracks for logging. The FAO comments that
“Forest roads are complex engineering structures … [t]hey are unquestionably the most
problematic features of timber harvesting operations since a major part of the total soil erosion
resulting from timber harvesting operations can be attributed directly to roads, often because
of design or construction flaws or poor maintenance practices”.158 This is a likely to be an
importance category of road infrastructure not properly accounted for in the literature on
transportation in Myanmar. The extent of and damage done by roads associated with timber
extraction is likely to be significant (see point below on erosion and landslides).
• Erosion - the physical disturbance of the surface by transport and road construction can result
in erosion. Typical erosion mechanisms related to road type are given in Table 6.1. At present
it is not possible to attribute land degradation issues with road development in Myanmar, but
it is likely to be a significant contributor, particularly in hilly areas.
Table 6.1: Typical erosion mechanisms and environmental impacts related to road type
Type of Type of road
155 ADB, 2016, Myanmar Transport Sector Policy Note. Summary for Decision Makers. 156 See for example, Dasgupta, S., and Wheeler, D., 2016, Minimizing Ecological Damagefrom Road Improvement in Tropical Forests.
World Bank Policy Research Working Paper 7826; and, Laurance, W.F., Goosem, M., and Laurance, S.G.W., 2009, Impacts of roads and
linear clearings on tropical forests. Trends Ecol Evol. 2009 Dec; 24(12):659-69. 157 Laurance, W.F., Goosem, M., and Laurance, S.G.W., 2009, Impacts of roads and linear clearings on tropical forests. Trends Ecol Evol.
2009 Dec; 24(12):659-69. 158 FAO, 1996, FAO Model Code for Forestry Harvesting Practice. Retrieved from http://www.fao.org/docrep/V6530E/V6530E06.htm

73
impact Formal
(Bituminous,
concrete, macadam)
Formal low-cost
(earth, gravel)
Informal
(earth)
On-site Minimal
Compaction
Sheet wash
Rills
Gullies
Mechanical Dislodgement
Flow confinement
Compaction and disaggregation
Rills
Gullying
Flow confinement
Mechanical dislodgement
Off-site Piping
Bank collapse
Gullies
Sod breakaway and transport
Bank Collapse
Gullies
Environmental
Impacts
High turbidity
Reservoir siltation
High turbidity
Mass transport
Loss of accessibility
Loss of land
Decline in land productivity
High turbidity
Lateral shift of impact
Lateral degradation with multiple
tracts
Loss of land
Decline in productivity
Source: Based on Beckedahl, H.R., Hill, T.R., and Moodley, M., 1999, Soil Conservation Perspectives of Road
Infrastructure within a Development Context in South Africa.
• Landslides - The development of roads through cutting into slopes along a contour line can
be a contributory factor to landslides. Landslides are also a major problem for road
development, particularly in hilly areas in areas which receive heavy seasonal rainfalls. Other
activities such as deforestation and mining can affect slope stability and the likelihood of
landslides. Recent heavy rainfall events in Myanmar have shown how vulnerable road
infrastructure can be.159
6.5 River transport network
Myanmar has over 9,600 Km of navigable rivers. Around 6,650 Km of navigable waterways are
situated in the five largest rivers (Ayeyarwady, Thanlwin, Chindwin, Sittaung and Kaladan) with easy
access to population centres. The most important navigable waterways are those of the Ayeyarwady,
Chindwin and the network of waterways in the Ayeyarwady delta. The Ayeyarwady is navigable to
Bhamo year-round (1,332 km upstream of Yangon) and to Myitkyina during the dry season (1,526
km upstream of Yangon). During the wet season the stretch between Bhamo and Myitkyina is not
navigable due to rapids. The Chindwin is navigable from the confluence with the Ayeyarwady to near
Minsin district in Sagaing region. The Ayeyarwady delta contains a large network of navigable
waterways consisting of river channels and canals. Heavy siltation in the Sittaung restricts its use for
commercial navigation. The Thanlwin has a large number of rapids again restricting its use for
commercial navigation. Coastal rivers in Rakhine and Tanintharyi states are served by small steamers
(
Figure 6.4).160
159 Government of the Union of Myanmar, 2015, Myanmar Post Disaster Needs Assessment of Floods and Landslides. 160ADB, 2016, Myanmar transport sector policy note: River transport.

74
Figure 6.4: Navigable waterways in Myanmar
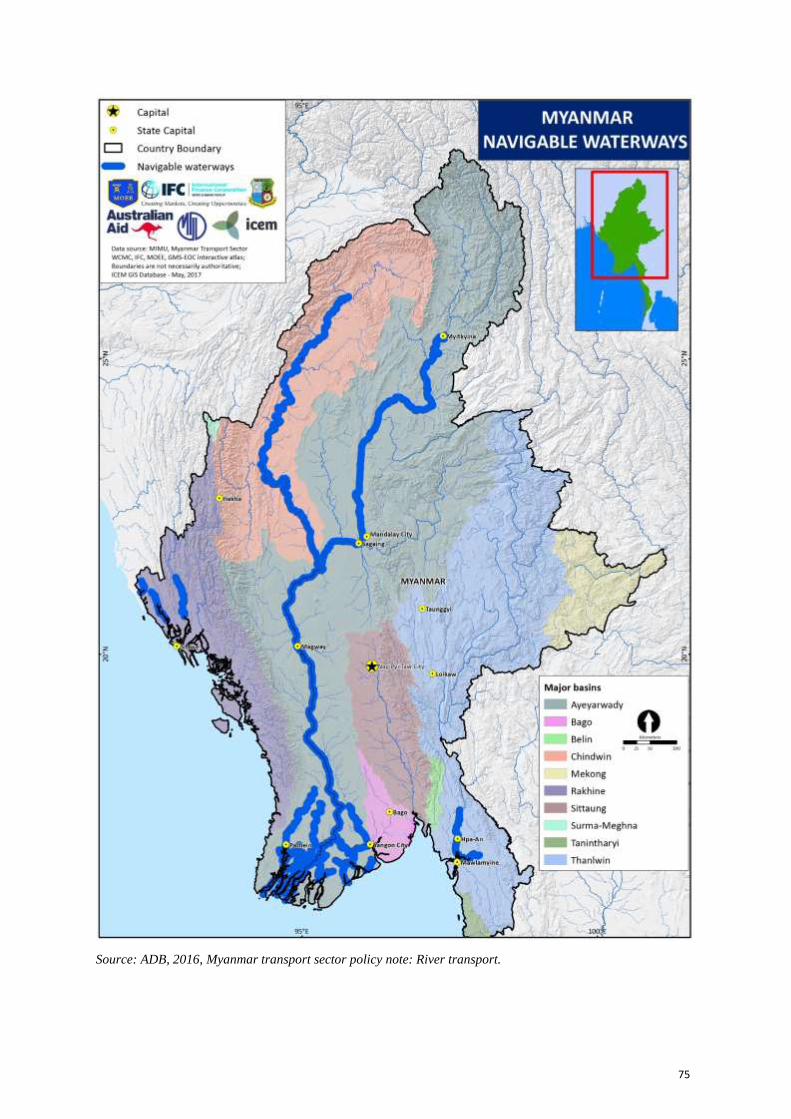
75
Source: ADB, 2016, Myanmar transport sector policy note: River transport.

76
Despite the potential of the physical network, navigation is often difficult along the main rivers
because of shallow water during the dry season, shifting river channels and the lack of adequate
terminal facilities:
• Navigation channels - the rivers are still basically used in their natural state, with channel
improvement taking place on an ad hoc and sporadic basis. Nautical charts are not available.
Large variations in seasonal discharges mean that river levels fluctuate significantly,
navigation is difficult in many stretches during the dry season when water levels are low. The
river systems are also subject to heavy sedimentation which results in changes in river course
and channel instability.
• Navigation - navigation is restricted to daylight hours and relies on local pilots who know the
conditions in a stretch of river, heavy sedimentation and shifting channels mean channel
markers are temporary, adequate charts and route maps are not available.
• Ports - there are 50 ports along the Ayeyarwady, the Chindwin, and the Ayeyarwady Delta.
However, these are often only landing beaches, approach channels and mooring areas are not
defined and cargo and passenger handling facilities are inadequate. Seasonal changes in water
levels also make construction of port facilities difficult and costly.161
Table 6.2: Navigable waterways by length
Navigable waterways Length (Km)
Ayeyarwady 1,534
Chindwin 730
Thanlwin and rivers in Mon State 380
Rivers in the Ayeyarwady Delta 2,404
Rivers in Rakhine State 1,602
Total 6,650
Source: ADB, 2016, Myanmar transport sector policy note: River transport.
6.6 River transport development
Despite the potential for river transport in Myanmar figures suggest that the sector has declined in
recent decades, mainly as a consequence of the development of better road transport. In the 1990s the
sector accounted for more than 20% of national freight. This figure has shrunk to 6% in 2013.162
While the sector has the potential to be competitive, it has not received adequate investment.
According to a recent ADB report, the sector has been “abandoned by the Government”. Starved of
even basic investment its competitiveness has been eroded by more modern road-based transport.163
The fleet has been increasing gradually since the 1990s. In 2014, there were approximately 4,590
vessels registered for inland waterway operations with the Department of Marine Administration,
with a cumulative capacity of around 93,400 passengers and 68,600 tonnes of freight. Smaller vessels
and dumb barges are registered at the local level, numbering an estimated 38,000 in 2013. Estimates
suggest that around 60% of river freight reaching Mandalay was carried by barges, 24% by private
passenger-cum-cargo vessels and 16% by state owned passenger-cum-cargo vessels. Most vessels are
small and made of wood. Utilization rates are very low at around 20,000 Km/year.164
161 Ibid. 162 Ibid. 163 Ibid. 164 Ibid.

77
6.7 Environmental issues
Key environmental issues related to navigation include:
• Pollution - spills of oil, chemicals or other freight into waterways is a key concern.
Information on the frequency of this kind of incident has not been available. However, given
the currently large share of oil and oil products in cargoes (around 31%)165 this risk is likely to
be significant.
• Channel and navigational infrastructure construction - the construction of channels or
instream infrastructure can disrupt the dynamic balance, disrupting morphological processes.
However, there is little evidence of this happening in Myanmar to date - with future
navigational improvements it may become an issue.
• Backwash - Wakes generated by navigation vessels may cause additional erosion to river
banks.
6.8 Navigation by major river basin
Currently the only significant potential for commercial navigation operations is in the Ayeyarwaddy
and Chindwin river basins.
6.9 Potential interaction with hydropower
Table 6.3: Potential interactions between hydropower and transport
Impact Narrative
Roads
Impacts of hydropower on roads
Inundation of road in
impoundment area Roads with-in inundation area will need replacement.
Increased erosion around
bridges and other instream
transportation infrastructure
downstream
Sediment trapping and flow variability may increase erosion down-
stream of hydropower projects. This may necessitate the provision of
more protection form erosion for in-stream infrastructure.
Unpredictable water levels
If plants are used for peaking, or in the event of unplanned releases river
levels downstream may change significantly over a short period of time.
This may make fording the river or crossing causeways
difficult/dangerous.
Flood protection If hydropower plants are managed to prevent flooding this could result
reduce damage risks for downstream infrastructure such as roads.
Impact of roads on hydropower
Improved transportation
infrastructure from
development of access roads
Access roads built as part of hydropower project development may
improve access for remote communities.
Loss of power production from
management for multiple use
If HP are managed for flood prevention this may reduce overall power
output.
Cumulative impacts
165 Ibid.
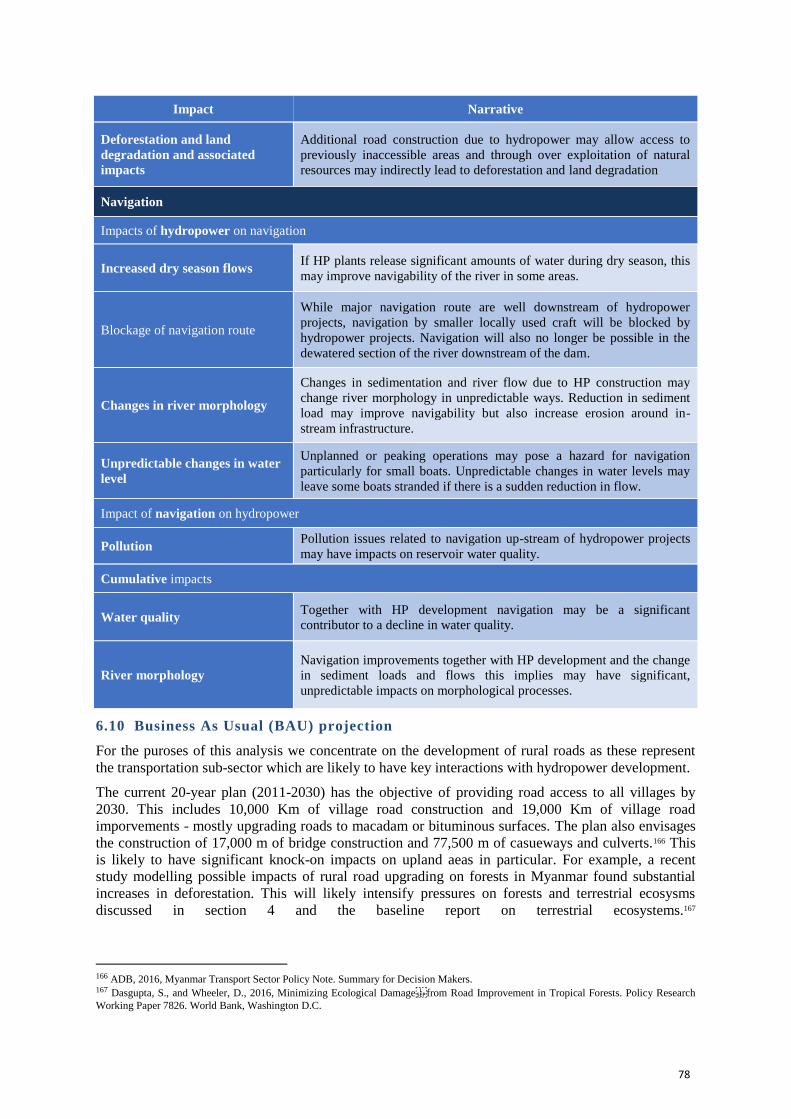
78
Impact Narrative
Deforestation and land
degradation and associated
impacts
Additional road construction due to hydropower may allow access to
previously inaccessible areas and through over exploitation of natural
resources may indirectly lead to deforestation and land degradation
Navigation
Impacts of hydropower on navigation
Increased dry season flows If HP plants release significant amounts of water during dry season, this
may improve navigability of the river in some areas.
Blockage of navigation route
While major navigation route are well downstream of hydropower
projects, navigation by smaller locally used craft will be blocked by
hydropower projects. Navigation will also no longer be possible in the
dewatered section of the river downstream of the dam.
Changes in river morphology
Changes in sedimentation and river flow due to HP construction may
change river morphology in unpredictable ways. Reduction in sediment
load may improve navigability but also increase erosion around in-
stream infrastructure.
Unpredictable changes in water
level
Unplanned or peaking operations may pose a hazard for navigation
particularly for small boats. Unpredictable changes in water levels may
leave some boats stranded if there is a sudden reduction in flow.
Impact of navigation on hydropower
Pollution Pollution issues related to navigation up-stream of hydropower projects
may have impacts on reservoir water quality.
Cumulative impacts
Water quality Together with HP development navigation may be a significant
contributor to a decline in water quality.
River morphology
Navigation improvements together with HP development and the change
in sediment loads and flows this implies may have significant,
unpredictable impacts on morphological processes.
6.10 Business As Usual (BAU) projection
For the puroses of this analysis we concentrate on the development of rural roads as these represent
the transportation sub-sector which are likely to have key interactions with hydropower development.
The current 20-year plan (2011-2030) has the objective of providing road access to all villages by
2030. This includes 10,000 Km of village road construction and 19,000 Km of village road
imporvements - mostly upgrading roads to macadam or bituminous surfaces. The plan also envisages
the construction of 17,000 m of bridge construction and 77,500 m of casueways and culverts.166 This
is likely to have significant knock-on impacts on upland aeas in particular. For example, a recent
study modelling possible impacts of rural road upgrading on forests in Myanmar found substantial
increases in deforestation. This will likely intensify pressures on forests and terrestrial ecosysms
discussed in section 4 and the baseline report on terrestrial ecosystems.167
166 ADB, 2016, Myanmar Transport Sector Policy Note. Summary for Decision Makers. 167 Dasgupta, S., and Wheeler, D., 2016, Minimizing Ecological Damagefrom Road Improvement in Tropical Forests. Policy Research
Working Paper 7826. World Bank, Washington D.C.
79
IFC Myanmar Country Office:
No. 57, Pyay Road,
6 ½ miles, Hlaing Township
Yangon
www.ifc.org/hydroadvisory