baseline assessment of sample referral networks in...
TRANSCRIPT
Baseline Assessment of Sample Referral Networks in Vertically Managed Disease Control Programs for HIV and TB in the
Dominican Republic
March 2015


Baseline Assessment of Sample Referral Networks in Vertically Managed Disease Control Programs for HIV and TB in the Dominican Republic
Alan George Claudia Valdez Emmanuel Moquete Edgar Barillas March 2015

Sample Referral Networks in Vertically Managed Disease Control Programs for HIV and TB in the DR
ii
This report is made possible by the generous support of the American people through the US
Agency for International Development (USAID), under the terms of cooperative agreement
number AID-OAA-A-11-00021. The contents are the responsibility of Management Sciences for
Health and do not necessarily reflect the views of USAID or the United States Government.
About SIAPS
The goal of the Systems for Improved Access to Pharmaceuticals and Services (SIAPS) Program
is to assure the availability of quality pharmaceutical products and effective pharmaceutical
services to achieve desired health outcomes. Toward this end, the SIAPS result areas include
improving governance, building capacity for pharmaceutical management and services,
addressing information needed for decision-making in the pharmaceutical sector, strengthening
financing strategies and mechanisms to improve access to medicines, and increasing quality
pharmaceutical services.
Recommended Citation
This report may be reproduced if credit is given to SIAPS. Please use the following citation.
George A, Valdez C, Moquete E, Barillas E. 2015. Baseline Assessment of Sample Referral
Networks in Vertically Managed Disease Control Programs for HIV and TB in the Dominican
Republic. Submitted to the US Agency for International Development by the Systems for
Improved Access to Pharmaceuticals and Services (SIAPS) Program. Arlington, VA:
Management Sciences for Health.
Key Words
transportation, laboratory, samples, HIV, AIDS, tuberculosis
Systems for Improved Access to Pharmaceuticals and Services
Center for Pharmaceutical Management
Management Sciences for Health
4301 North Fairfax Drive, Suite 400
Arlington, VA 22203 USA
Telephone: 703.524.6575
Fax: 703.524.7898
E-mail: [email protected]
Website: www.siapsprogram.org

iii
CONTENTS
Acronyms and Abbreviations ........................................................................................................ iv
Acknowledgments........................................................................................................................... v
Executive Summary ....................................................................................................................... vi
Background ..................................................................................................................................... 1
Method ............................................................................................................................................ 3
Results ............................................................................................................................................. 5
HIV ............................................................................................................................................. 5
Tuberculosis .............................................................................................................................. 11
Discussion and Conclusion ........................................................................................................... 17 Proposed Interventions.............................................................................................................. 18

iv
ACRONYMS AND ABBREVIATIONS
AIDS acquired immunodeficiency syndrome
CD4 cluster of differentiation 4
CONAVIHSIDA Consejo Nacional para el VIH y el SIDA (National Counsel for HIV and
AIDS)
DIGECITSS Dirección General de Control de las Infecciones de Transmisión Sexual y
SIDA (General Directorate for Control of Sexually Transmitted Diseases
and AIDS)
DPS Dirección Provincial de Salud (Provincial Health Directorate)
DR Dominican Republic
EID early infant diagnosis
LNSPDD Laboratorio Nacional de Salud Pública Dr. Defilló (national reference
laboratory)
MoH Ministry of Health
HIV human immunodeficiency virus
NGO nongovernmental organization
PNCT Programa Nacional contra la Tuberculosis (National TB Control Program)
SAI Servicio de atención integral (Integrated Health Service)
SIAPS Systems for Improved Access to Pharmaceuticals and Services
SOP standard operating procedures
SRS Servicios regionales de salud (Regional health services)
TAT turnaround time
TB tuberculosis

v
ACKNOWLEDGMENTS
Data collection was performed by the following team of field coordinators selected for that
purpose: Eider Sánchez, Milagros de la Rosa, José Rodríguez, Aurelino Montero, María
Lavandera, and Orquídea Salzuela. Overall coordination of field work and the study itself was
the responsibility of Emmanuel Moquete, with support provided by a team from the Systems for
Improved Access to Pharmaceuticals and Services (SIAPS) program. The laboratory
coordinators of the Regional Health Services responsible for the laboratories in the service
facilities visited and the area representatives in the laboratory serving the HIV and tuberculosis
programs and the Directorate General of Epidemiology provided the data for the study.
Dr. Ernesto Montoro provided support to those areas of the study involving biosecurity.
Dr. Yira Tavárez directed the overall framework for the process enabling the study to be carried
out.
Ms. Brianna Casciello and Mr. Javier Sánchez Álvarez provided expertise and invaluable inputs
on editorial quality assurance and technical advice in laboratory logistics.

vi
EXECUTIVE SUMMARY
At the end of 2013, the Ministry of Health (MoH) in the Dominican Republic (DR) deemed of
paramount importance evaluation and development of the supply chains within the referral
networks for HIV and tuberculosis (TB) laboratory samples, in an effort to advance its efforts to
control the spread of both diseases.
The results presented in this technical report have been adapted from a pioneering, evidence-
based assessment that took place in the DR in 2014, which collected data around the country, at
all levels of public health laboratories, regarding the performance of the referral networks of
vertically managed disease control programs for HIV and TB. Data were collected during two
weeks of surveys that consisted of a series of quantitative and qualitative questions and register
reviews.
These results strongly indicate a profound need for systems strengthening through integration
and pooling of resources of vertically managed disease control programs, standardization of
procedures, and extensive supply chain–related capacity building.

1
BACKGROUND
In recent years, the Dominican Republic (DR) introduced new technology and methods for the
diagnosis of tuberculosis (TB) and human immunodeficiency virus (HIV) aiming to improve
diagnostic services and delivery. Subsequently, national disease control programs, including the
National TB Control Program (Programa Nacional contra la Tuberculosis; PNCT), the General
Directorate for the Control of Sexually Transmitted Diseases and AIDS (Dirección General de
Control de las Infecciones de Transmisión Sexual y SIDA; DIGECITSS), and the National
Counsel for HIV and AIDS (Consejo Nacional para el VIH y el SIDA; CONAVIHSIDA) have
facilitated universal access for sputum smears, cultures, drug susceptibility tests, cluster of
differentiation 4 (CD4) counts, viral load tests, and Proviral DNA testing for early infant
diagnosis (EID) for HIV.
Currently in the DR the most technologically advanced HIV and TB laboratory resources are
concentrated in 13 regional reference laboratories, the Dr. Defilló National Public Health
Laboratory (Laboratorio Nacional de Salud Pública Dr. Defilló; LNSPDD), and the
nongovernmental organization (NGO) Profamilia. The Dominican Public Health Sector Reform
of 20031 and the Model Guide for the Development of the Regional Health Services
2 name the
Regional Health Service (Servicio regional de salud; SRS) offices as responsible for providing
oversight and all supply chain–related services. Currently there are nine autonomous SRSs,
though the autonomous regional management model has shown marked shortcomings in the
referral networks for TB and HIV laboratory samples and the turnaround of test results,
according to previous technical reports3 and mainly of anecdotal evidence on service-level
performance.4
In an effort to strengthen its service delivery, the DR Ministry of Health (MoH) requested
technical assistance for a baseline assessment5 from the Systems for Improved Access to
Pharmaceuticals and Services (SIAPS) program, a project funded by the US Agency for
International Development for strengthening health systems. This assessment is the principal
source of information adapted for this technical report and had the following main objectives:
1 Comité Ejectutivo para la Reforma del Sector Salud (CERSS). Decreto Presidencial #635-03 – Reglamento de
Rectoría y Separación de Funciones Básicas del Sistema nacional de Salud; 2003. 2 Secretaría de Estado de Salud Pública y Asistenca Social (SESPAS). Modelo de Red de los Servicios Regionales de
Salud: Una guía para el desarrollo de los servicios de salud para la atención a las personas. Disposición 00024;
Santo Domingo, República Dominicana: SESPAS; 2005.
http://salud.gob.do/download/docs/Disposiciones/Disp00024ModelodeRedSRS.pdf. 3 Consejo Nacional del VIH y del SIDA (CONAVIHSIDA). Consultoría para la Red de Transporte de Muestras.
2012. 4 Umaru FA, Vallederes, J. Assessment of HIV and Tuberculosis Services in the Dominican Republic: Informing
Decision Making for Program Integration and Scale Up. Submitted to the US Agency for International
Development by the Supply Chain Management System (SCMS). Arlington VA; 2013. 5 Moquete E, Tavárez Y, Montoro E, George A, Herrera M, Valdez C, Barillas E. Evaluation of the Logistics System
for Transporting Tuberculosis and HIV Samples and Delivering Test Results in the Dominican Republic’s Public
Health Referral Network. Ministerio de Salud Pública de la República Dominicana; SIAPS. Submitted to the US
Agency for International Development by Systems for Improved Access to Pharmaceuticals and Services (SIAPS).
Arlington, VA: Management Sciences for Health; 2014.
Sample Referral Networks in Vertically Managed Disease Control Programs for HIV and TB in the DR
2
Collect critical data necessary for mapping the current transportation system for HIV and
TB samples
Identify the bottlenecks hampering its operation
Support the creation of a unified samples referral network based on the evidence found
Publications on studies regarding supply chains for laboratory samples are limited. One peer-
reviewed article on the restructuring of Uganda’s referral network6 that specifically focused on
transportation of dried blood-spot samples used in EID tests of HIV was published in 2013. The
intervention methodically restructured an ad hoc transportation system for samples, which
resulted in improved access to treatment for the most vulnerable of populations.
After searching on PubMed and EBSCOhost databases, no evidence was found of similar
investigations conducted on the implementation of a systematic assessment to address issues in
the supply chain of HIV and TB biological samples and test results in the Latin America and
Caribbean region.
The results described in this technical report, from the analysis of the sample delivery system to
the complete turnaround of results, could be translated into tangible programming measures and
potentially lay the groundwork for comparable situations elsewhere in the region or developing
world.
6 Kiyaga C, Sendagire H, Joseph E, et al. Uganda’s new national laboratory sample transport system: a successful
model for improving access to diagnostic services for early infant HIV diagnosis and other programs. PLoS ONE
2013;8(11):e78609. doi:10.1371/journal.pone.0078609.

3
METHOD
Local public health stakeholders were involved from the beginning of the process. A technical
working group was formed to assist with the design of an in-depth baseline assessment of the
sample referral network.
This assessment was executed in several stages, starting with the collection of information,
through in-person interviews with national HIV and TB program leaders and compilation of
central-level data from the MoH, including information regarding productivity, number of
sample-collection establishments, and number of laboratories by tier.
Furthermore, three distinct quantitative-qualitative data collection tools were designed and
structured to compile empirical data in four major areas:
Delivery of samples, including preparation for delivery, packing, means of transportation,
and biosafety. To determine biosafety compliance, the surveys used the world Health
Organization’s (WHO) Guidance on regulations for the Transport of Infectious
Substances 2013–20147 as a standard, taking five of its criteria for comparison. The
criteria evaluated are as follows:
o Use of a triple-packaging system, appropriate to the United Nations category of each
substance transported
o Use of leak-proof containers
o Use of absorbent material, in case of emergency leaks
o Use of appropriate labeling and marks, such as biological risk labels, and orientation
labels to indicate position of closures on the primary receptacles
o Use of gloves for handling samples
Delivery and reception of test results (turnaround, turnaround time)
Productivity or quantity of samples processed at the central, regional and local levels
System costs and expenditure
More than 50 local health workers were trained to use the data collection tools, conduct
surveying, and collect data regarding sample quality, turnaround times (TATs), means of
transportation, and biosafety.
The data collection process comprised 125 establishments (8.2% of the total) in all of the nine
SRSs established by the Dominican MoH throughout the country. The selection criteria included
the following:
All four tiers of facilities by level of specialization: 59 first-tier facilities, at the
community level, which have capability only for collecting samples, but not for
7 World Health Organization (WHO). Guidance on Regulations for the Transport of Infectious Substances 2013–
2014. WHO/HSE/GCR/2012.12. Geneva: WHO; 2012.
http://apps.who.int/iris/bitstream/10665/78075/1/WHO_HSE_GCR_2012.12_eng.pdf.

Sample Referral Networks in Vertically Managed Disease Control Programs for HIV and TB in the DR
4
processing, including two prisons and six NGOs;35 second-tier facilities, at the municipal
and provincial levels, which collect samples and have capability to process sputum
smears; 9 third-tier facilities, at the regional level, which collect samples and have the
capacity to process more specialized tests, such as sputum culturing; the fourth-tier
facility, the LNSPDD, where drug sensitivity tests for TB patients and 80% of HIV
(CD4, viral load, Proviral DNA) tests are processed. Furthermore, the selection included
the nine regional SRS administrative offices, as well as 12 provincial health directorates
Provincial Health Directorates (Dirección Provincial de Salud; DPS).
The number of samples sent or processed by facilities. Facilities with low, medium, and
high rates of samples sent and/or processed were considered. A high rate was considered
to be 40 or more samples sent and/or processed per month.
Facilities in both rural and urban settings.
The quality of collected data was verified for consistency on site by the survey teams’
supervisors after each day of data collection; the SIAPS consultants performed a second
verification at the end of each week for two weeks during survey collection. At the same time,
databases were created using Microsoft Excel to house and recheck the data collected.
After collection, verification, cleaning, and input into databases, SIAPS consultants analyzed
data provided by the surveys and prepared the final report.
After presenting results to local stakeholders and agreeing on a course of action, new standard
operating procedures were designed and validated following a participative workshop with
SIAPS consultants, regional and provincial administrators of health services, and laboratory
technicians and bioanalysts from around the country.

5
RESULTS
At this time in the DR, each disease control program is vertically managed and funded, thereby
resulting in vertically operated referral networks and multiple modes of transportation of
laboratory samples.
The data obtained are specific to HIV and TB disease control programs, thus the results from the
assessment are presented as such.
HIV The Caribbean is the region with the second-highest HIV prevalence rate in the world (1%), after
sub-Saharan Africa. Within the Caribbean region, Haiti (120,000) and the DR (44,000) are the
countries with the most registered cases of people living with HIV.8
Delivery of Samples
The DR has 77 health establishments that provide Integrated Health Care Services for HIV
(Servicio de atención integral; SAI), of which the baseline study included 39 (50.6%). The SAIs
provide counseling services to people living with HIV and AIDS, and collect the blood samples
to be sent to an establishment capable of processing CD4, viral load, and Proviral DNA tests.
Nearly 40% of the SAIs (29) are located in the capital region (SRS 0), but no samples are
transported. Instead, patients are referred to go personally to the LNSPDD and have the blood
samples taken there. The remaining eight regions use distribution hubs where the samples are
received from all the provinces and are sent to the LNSPDD as a single delivery. These hubs are
sometimes but not always located in the same establishments where SAIs are located.
In each region, blood extraction, pickup, and delivery of HIV laboratory samples for CD4 counts
and viral load is done one day per week, most commonly Tuesdays or Wednesdays, or
sometimes Mondays. There is no schedule for Proviral DNA samples; they are picked up and
delivered on the same days as the other samples.
Testing Concentration
Eighty percent of all HIV sample testing is concentrated in the LNSPDD. Figure 1 shows the
current percentages of samples processed, by sample type and processing site.
8 Joint United Nations Programme on HIV/AIDS (UNAIDS). Global Report: UNAIDS Report on the Global AIDS
Epidemic 2012. Geneva: UNAIDS; 2012.
http://www.unaids.org/sites/default/files/en/media/unaids/contentassets/documents/epidemiology/2012/gr2012/2012
1120_UNAIDS_Global_Report_2012_with_annexes_en.pdf.

Sample Referral Networks in Vertically Managed Disease Control Programs for HIV and TB in the DR
6
Figure 1. Processing concentration of HIV laboratory samples in 2013
A service agreement is in place until the end of 2014 between the Dominican MoH and the NGO
Profamilia for processing all CD4 counts—29% of the country’s total in 2013—from the four
northern health regions (SRS 2, 3, 7, and 8). When the agreement’s lifespan comes to an end, all
HIV samples will be processed by the LNSPDD, concentrating 100% of HIV tests in a single
laboratory. Currently there are no plans for changes in the installed capacity or human resources
to adapt to this change in workload.
Transportation Providers of Laboratory Samples
The baseline study identified several transport flows within the same disease control programs.
The DR Health Sector Reform Act of 2003 states that all services must be provided by the SRSs.
Evidence indicates that in the case of HIV samples, the SRSs provide transportation services in
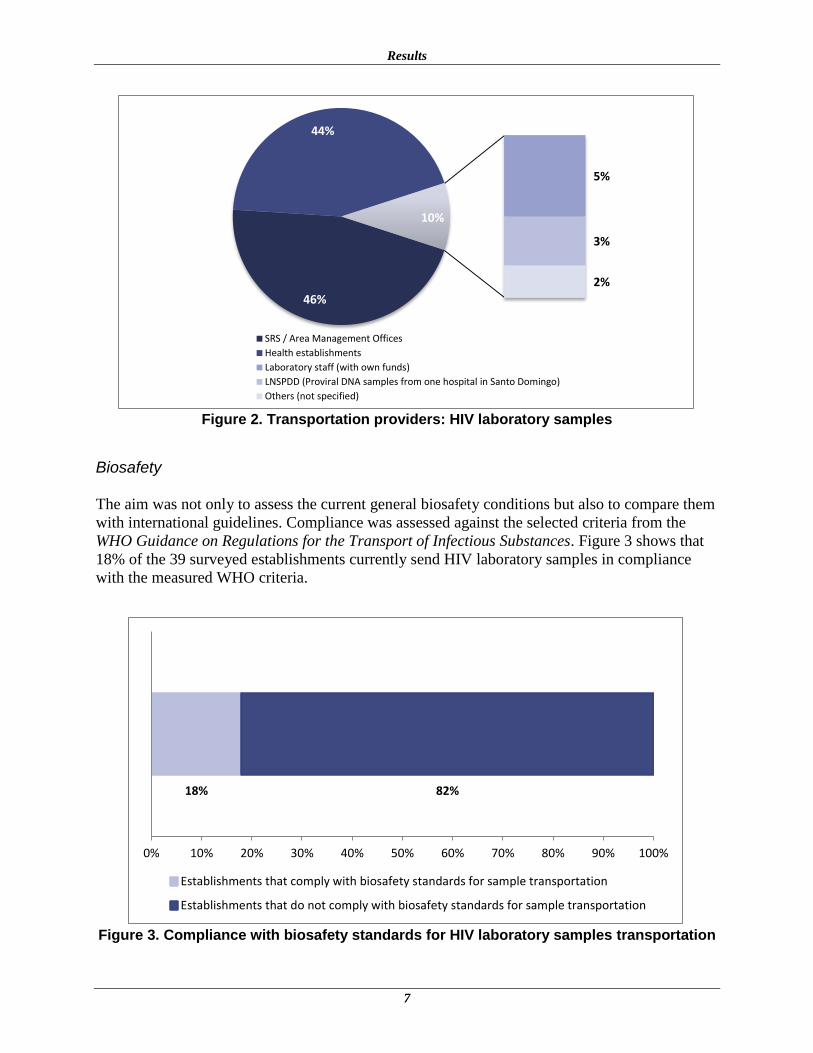
less than half (46%) of the 39 establishments surveyed. Furthermore, 44% of surveyed
establishments reported transporting the samples with their own resources, as shown in figure 2.
71%
100% 100% 29%
0%
10%
20%
30%
40%
50%
60%
70%
80%
90%
100%
CD4 Viral Load Proviral DNA
Processed by the LNSPDD Processed by Profamilia
Results
7
Figure 2. Transportation providers: HIV laboratory samples
Biosafety
The aim was not only to assess the current general biosafety conditions but also to compare them
with international guidelines. Compliance was assessed against the selected criteria from the
WHO Guidance on Regulations for the Transport of Infectious Substances. Figure 3 shows that
18% of the 39 surveyed establishments currently send HIV laboratory samples in compliance
with the measured WHO criteria.
Figure 3. Compliance with biosafety standards for HIV laboratory samples transportation
46%
44%
5%
3%
2%
10%
SRS / Area Management Offices
Health establishments
Laboratory staff (with own funds)
LNSPDD (Proviral DNA samples from one hospital in Santo Domingo)
Others (not specified)
18% 82%
0% 10% 20% 30% 40% 50% 60% 70% 80% 90% 100%
Establishments that comply with biosafety standards for sample transportation
Establishments that do not comply with biosafety standards for sample transportation

Sample Referral Networks in Vertically Managed Disease Control Programs for HIV and TB in the DR
8
There is an evident weakness of resources and general safety equipment. The laboratory samples
are transported using a sort of triple-packing system, as stated by the WHO, but not up to its
exact requirements.
Standard test tubes are the primary receptacles used. The secondary packaging, instead of being a
“durable, watertight, leak-proof packaging to enclose and protect the primary receptacle(s),”
according to the WHO guidance, polystyrene tube racks are used. Small commercial beach
coolers are currently used as outer packaging.
Delivery and Reception of Test Results
Turnaround of Test Results
Periodic regional supervisory visits by the MoH and other nonsystematic information indicate
that test results in many cases were not returned to the establishment of origin.
Within the geographical limits of the capital region (SRS 0), 13,839 patients are undergoing
either clinical follow-ups or antiretroviral treatment for HIV/AIDS (43% of the total patients
registered in the DR), all of whom are referred to the LNSPDD for blood extraction. The same
patients are called back to pick up their test results at the LNSPDD. Given that in this region no
transportation is used for laboratory samples or results, the study did not review the data on the
turnaround rate. It is expected that 100% of the patients return to obtain their results.
For the remaining eight SRSs, the baseline study revealed that 70% of all HIV samples sent for
testing obtain a corresponding result. The most northeastern region in the country, SRS 3, has the
lowest turnaround rate (38%), as shown in figure 4.
Figure 4. HIV result turnaround by SRS
91%
82%
38%
84%
61%
71%
59%
73%
0%
10%
20%
30%
40%
50%
60%
70%
80%
90%
100%
SRS 1 SRS 2 SRS 3 SRS 4 SRS 5 SRS 6 SRS 7 SRS 8
Percentage HIV results turnaround by region

Results
9
That each region has different responsible entities for receiving and forwarding results
downstream is a factor contributing to the varying turnaround rates and test results lost. For
example, the LNSPDD processes most of the laboratory samples received and prints the results.
However, the printed results are delivered back to the regions on public transportation, on
occasion to the regional distribution hubs, in some cases to the SRS administrative offices, and in
others to regional laboratories. Laboratory staff across the country also reported anecdotally that
the LNSPDD mistakenly sends results to incorrect regions.
Turnaround Time
The lengthy time taken for results to return to the region of origin was captured empirically. A
detailed inspection of laboratory logbooks indicated that TAT is not registered in a consistent or
uniform fashion across establishments. Data were retrieved directly in some cases, and where it
was not reported, triangulation was applied with the establishments where testing was done to
assess the actual TATs more accurately.
The baseline assessment found that test results for CD4, viral load, and Proviral DNA take
longer to return than the LNSPDD’s theoretical TAT for laboratory samples. Test results are sent
back to each region once a week by the LNSPDD together with the empty refrigerators originally
used to transport the samples.
For example, SRS 1 delivers HIV laboratory samples on Mondays using its own vehicle door-to-
door from the regional hub to the LNSPDD. According to protocol, test results from the previous
week’s samples are picked up when new samples are delivered. In the case of SRS 5, public
transportation buses deliver the HIV samples every Tuesday, and the LNSPDD returns the
results and empty refrigerators the following week on the same public buses.
For the remaining SRSs (2, 3, 4, 6, 7, and 8), laboratory samples are collected on Wednesdays,
received on Thursdays at the LNSPDD, and the empty refrigerators and test results are
theoretically sent back one week from the following Tuesday.
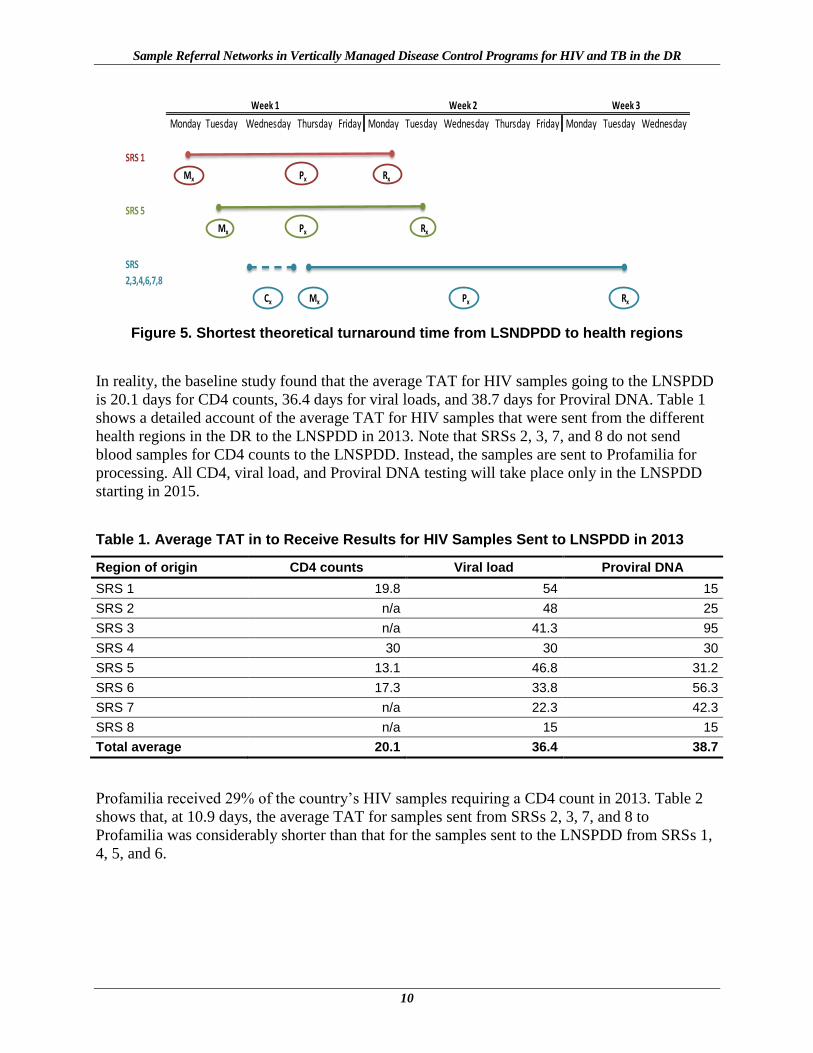
Figure 5 depicts the theoretical TAT for SRSs 1 through 8, where Cx is the process of sample
collection; Mx is the arrival of HIV samples to the LNSPDD; Px is the time for processing the
tests in the laboratory, printing results, preparing envelopes for delivery of the results, and other
administrative actions; and Rx are the results sent out from the LNSPDD. The figure shows that
the shortest TAT belongs to samples from SRSs 1 and 5, at five business days. TAT for regions
2, 3,4,6,7, and 8 should in theory be 10 business days, according to the LNSPDD schedule.
Sample Referral Networks in Vertically Managed Disease Control Programs for HIV and TB in the DR
10
Monday Tuesday Wednesday Thursday Friday Monday Tuesday Wednesday Thursday Friday Monday Tuesday Wednesday
SRS 1
Mx Px Rx
SRS 5
Mx Px Rx
SRS
2,3,4,6,7,8
Cx Mx Px Rx
Week 1 Week 2 Week 3
Figure 5. Shortest theoretical turnaround time from LSNDPDD to health regions
In reality, the baseline study found that the average TAT for HIV samples going to the LNSPDD
is 20.1 days for CD4 counts, 36.4 days for viral loads, and 38.7 days for Proviral DNA. Table 1
shows a detailed account of the average TAT for HIV samples that were sent from the different
health regions in the DR to the LNSPDD in 2013. Note that SRSs 2, 3, 7, and 8 do not send
blood samples for CD4 counts to the LNSPDD. Instead, the samples are sent to Profamilia for
processing. All CD4, viral load, and Proviral DNA testing will take place only in the LNSPDD
starting in 2015.
Table 1. Average TAT in to Receive Results for HIV Samples Sent to LNSPDD in 2013
Region of origin CD4 counts Viral load Proviral DNA
SRS 1 19.8 54 15
SRS 2 n/a 48 25
SRS 3 n/a 41.3 95
SRS 4 30 30 30
SRS 5 13.1 46.8 31.2
SRS 6 17.3 33.8 56.3
SRS 7 n/a 22.3 42.3
SRS 8 n/a 15 15
Total average 20.1 36.4 38.7
Profamilia received 29% of the country’s HIV samples requiring a CD4 count in 2013. Table 2
shows that, at 10.9 days, the average TAT for samples sent from SRSs 2, 3, 7, and 8 to
Profamilia was considerably shorter than that for the samples sent to the LNSPDD from SRSs 1,
4, 5, and 6.

Results
11
Table 2. Average TAT in days to Receive Results for HIV Samples Sent to Profamilia in 2013
Region of origin CD4 counts Viral load Proviral DNA
SRS 2 9.6 n/a n/a
SRS 3 9 n/a n/a
SRS 7 7.5 n/a n/a
SRS 8 17.5 n/a n/a
Total average 10.9 n/a n/a
Costs
Results from the baseline assessment indicate health establishments and its personnel often pay
for the costs of transporting HIV samples.
As shown in figure 2, nearly 50% of the establishments surveyed reported that the SRS does not
pick up the laboratory samples, and instead the establishments (44%) or the laboratory personnel
(5%) take them directly to the centers where tests are carried out. This creates additional
financial burden on the establishments’ already strained budgets and on health personnel.
Tuberculosis
Despite considerable improvements in the past 24 years, TB prevalence in the DR stands at 74
per 100,000 inhabitants (including HIV+TB), according to the WHO’s 2014 TB country profile
of the DR.9
Delivery of Samples
The PNCT has a local referral network for sputum smears, which intends to process samples
within the province of origin. Each region in the DR has at least 10 establishments with the
capacity to perform sputum smears through Ziehl-Neelsen staining technique and microscopy.
The referral network for processing sputum cultures takes place on a regional level, because the
equipment is available only in the regional reference laboratories; however, only eight of the
nine health regions are equipped to process cultures.
The referral network for drug susceptibility tests is at the national/central level. Currently, only the
LNSPDD in Santo Domingo is capable of processing these tests, though trials in one of the regional
reference laboratories are ongoing, to build capacity and somewhat decentralize these tests.
There is no schedule for collection, pickup, and delivery of sputum samples. The lack of a schedule
and the relative longer lifespan of sputum (about five days in ideal conditions) mean that samples
are sometimes collected and kept at the establishment until transport becomes available.
9 World Health Organization. Tuberculosis country profiles. http://www.who.int/tb/country/data/profiles/en/.
Sample Referral Networks in Vertically Managed Disease Control Programs for HIV and TB in the DR
12
Testing Concentration
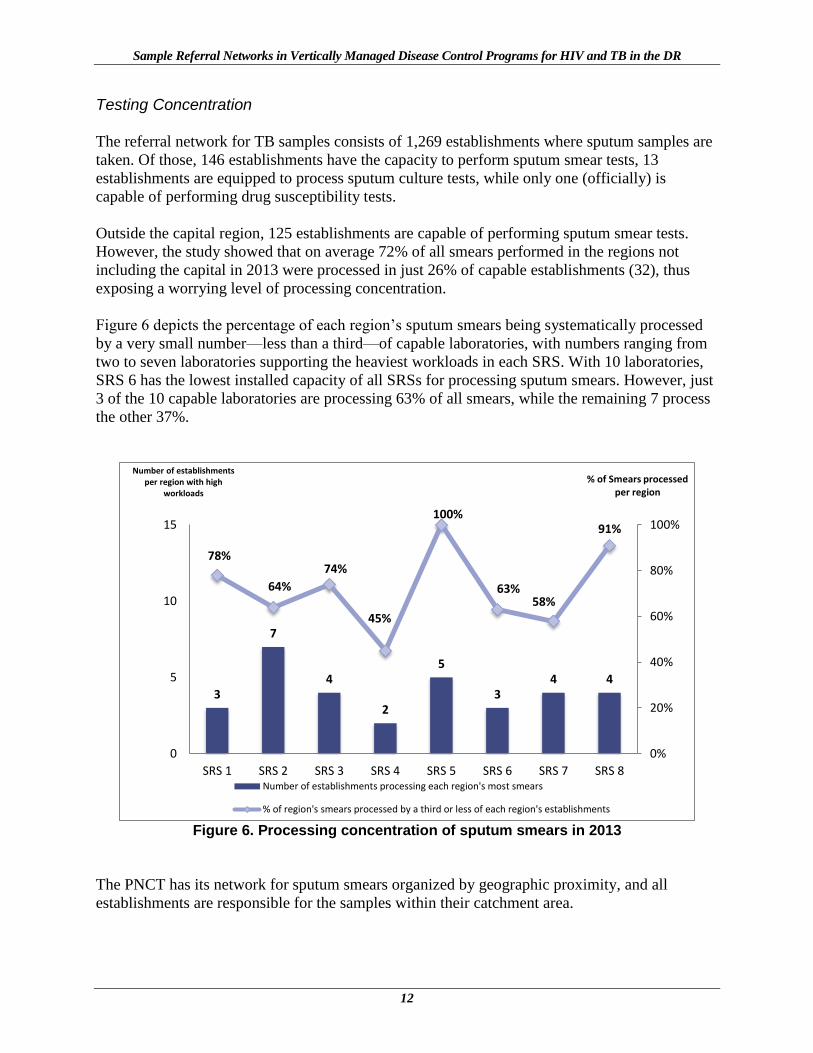
The referral network for TB samples consists of 1,269 establishments where sputum samples are
taken. Of those, 146 establishments have the capacity to perform sputum smear tests, 13
establishments are equipped to process sputum culture tests, while only one (officially) is
capable of performing drug susceptibility tests.
Outside the capital region, 125 establishments are capable of performing sputum smear tests.
However, the study showed that on average 72% of all smears performed in the regions not
including the capital in 2013 were processed in just 26% of capable establishments (32), thus
exposing a worrying level of processing concentration.
Figure 6 depicts the percentage of each region’s sputum smears being systematically processed
by a very small number—less than a third—of capable laboratories, with numbers ranging from
two to seven laboratories supporting the heaviest workloads in each SRS. With 10 laboratories,
SRS 6 has the lowest installed capacity of all SRSs for processing sputum smears. However, just
3 of the 10 capable laboratories are processing 63% of all smears, while the remaining 7 process
the other 37%.
Figure 6. Processing concentration of sputum smears in 2013
The PNCT has its network for sputum smears organized by geographic proximity, and all
establishments are responsible for the samples within their catchment area.
3
7
4
2
5
3 4 4
78%
64%
74%
45%
100%
63% 58%
91%
0%
20%
40%
60%
80%
100%
0
5
10
15
SRS 1 SRS 2 SRS 3 SRS 4 SRS 5 SRS 6 SRS 7 SRS 8
% of Smears processed per region
Number of establishments per region with high
workloads
Number of establishments processing each region's most smears
% of region's smears processed by a third or less of each region's establishments

Results
13
However, the evidence shows that this organization is not being enforced, and health centers
send samples to processing establishments outside their geographic area. An additional short
survey was conducted by SIAPS consultants together with MoH staff in three regional health
establishments, as a means of verifying initial data received by the original surveys and
empirically validating anecdotal information. This survey showed that in all three revisited
regional health establishments, sputum samples for smear testing are being received from outside
the local network.
The root causes found for this anomaly range from the systemic organizational deficiency and
absence of guideline enforcement, to the idiosyncrasies of health workers who do not trust the
current transportation system, or their peers.
The trust issues become programmatic when health workers do not trust their assigned reference
laboratory and choose to send the samples elsewhere. Anecdotal information revealed that
laboratory technicians do not trust results will return from a local laboratory; therefore, samples
are sent to a regional health establishment, even though it is farther away.
Transportation Providers for Laboratory Samples
Several different transport flows exist for TB laboratory samples (figure 7). Transportation
services are provided by the SRS in 42% (34) of establishments included in the assessment. In
38% of the surveyed establishments, laboratory staff with their own out-of-pocket resources take
the samples to the corresponding laboratory for testing. Of surveyed establishments, 12% use
their own vehicles and economic resources, and in the remaining 8%, another administrative
body of the MoH, the DPS, handles sample transportation.
Figure 7. Transportation providers: TB laboratory samples
42%
38%
12%
8%
20%
SRS Laboratory staff Health Establishments DPS

Sample Referral Networks in Vertically Managed Disease Control Programs for HIV and TB in the DR
14
Biosafety
Biosafety not only ensures that the samples arrive at their destination in ideal condition for
testing, but also that the people transporting them, and the environment, are protected from harm
in the event of an emergency.
Figure 8 shows that 93% of the 81 TB establishments surveyed did not comply with the five
criteria taken from the WHO Guidance on Regulations for the Transport of Infectious
Substances.
Figure 8. Compliance with biosafety standards for TB laboratory sample transportation
Factors contributing to low compliance include lack of enforcement of national biosafety
guidelines by the MoH and the PNCT. Laboratory staff stated during the surveys that they had
knowledge of the national guidelines; however, these guidelines emphasize internal laboratory
operations.
Delivery and Reception of Test Results
Turnaround of Test Results
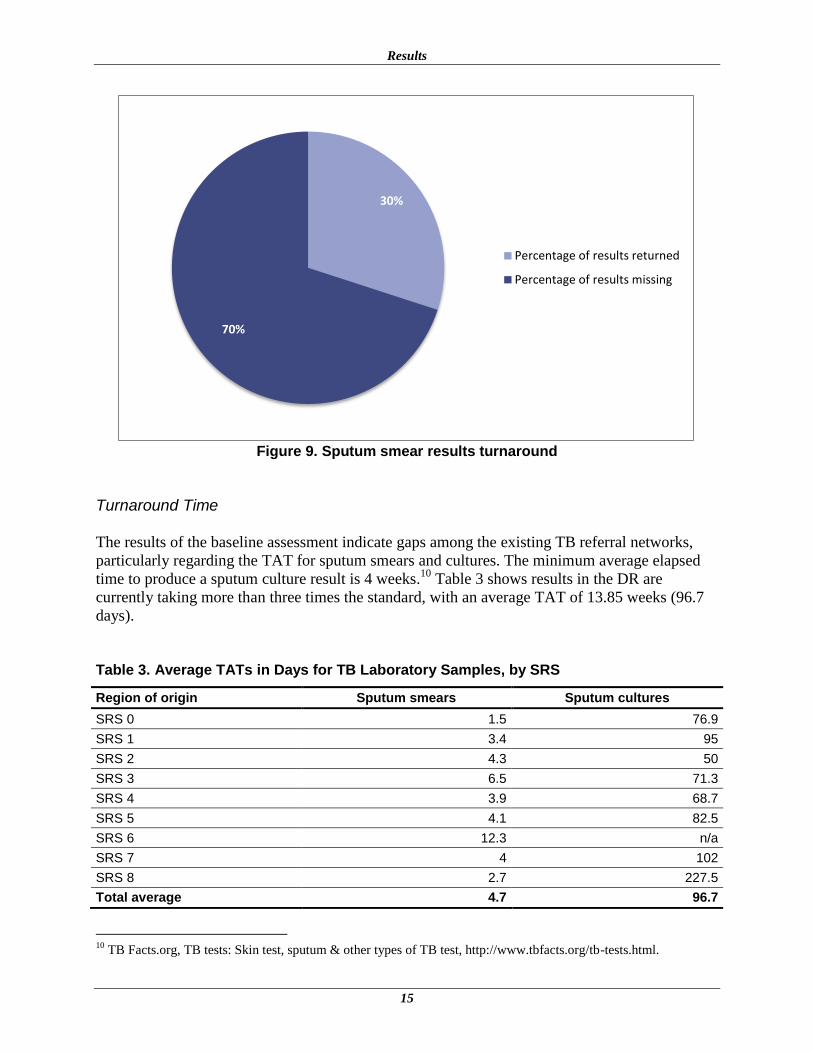
The original establishment selection of 125 included 54 facilities where sputum is collected and
sent to another establishment for smear tests. In 2013, a total of 29,525 sputum samples were
sent from these 54 sputum-collecting establishments to other establishments for testing.
However, when data were collected, the laboratory registry books revealed 8,760 (30%) results
received back, as shown in figure 9.
7% 93%
0% 10% 20% 30% 40% 50% 60% 70% 80% 90% 100%
Establishments that comply with biosafety standards for sample transportation
Establishments that do not comply with biosafety standards for sample transportation
Results
15
Figure 9. Sputum smear results turnaround
Turnaround Time
The results of the baseline assessment indicate gaps among the existing TB referral networks,
particularly regarding the TAT for sputum smears and cultures. The minimum average elapsed
time to produce a sputum culture result is 4 weeks.10
Table 3 shows results in the DR are
currently taking more than three times the standard, with an average TAT of 13.85 weeks (96.7
days).
Table 3. Average TATs in Days for TB Laboratory Samples, by SRS
Region of origin Sputum smears Sputum cultures
SRS 0 1.5 76.9
SRS 1 3.4 95
SRS 2 4.3 50
SRS 3 6.5 71.3
SRS 4 3.9 68.7
SRS 5 4.1 82.5
SRS 6 12.3 n/a
SRS 7 4 102
SRS 8 2.7 227.5
Total average 4.7 96.7
10
TB Facts.org, TB tests: Skin test, sputum & other types of TB test, http://www.tbfacts.org/tb-tests.html.
30%
70%
Percentage of results returned
Percentage of results missing

Sample Referral Networks in Vertically Managed Disease Control Programs for HIV and TB in the DR
16
Costs
As shown in figure 7, 50% of the establishments reported that the SRSs do not pick up the
samples, but instead the laboratory personnel (38%) and the health establishments (12%) take the
samples directly to the centers where tests are carried out. Laboratory technicians and other
health personnel use their own financial resources to deliver TB samples from the respective
health center to the laboratories.
Contributing factors that hinder or prevent the SRSs from providing services to their
establishments as indicated in the Dominican Public Health Sector Reform of 2003 and the
Model Guide for the Development of the Regional Health Services include insufficient follow-up
and enforcement, lack of organization and human resources, and lack of funds.
17
DISCUSSION AND CONCLUSION
The results of the baseline assessment indicate that a number of factors presently contribute to
the overall delayed turnaround of results including the following:
High concentration of laboratory samples being processed in a few testing laboratories,
thus creating an overload of equipment and human resource capacity and ultimately
negatively affecting TATs of test results: Concentration of sample processing is evident
in both vertical disease control programs—as a strategic choice for the HIV program and
resulting from lack of organization for the TB program.
It is of paramount importance to balance the workload and systemize the transportation of
samples to guarantee shorter TATs because the number of laboratories is sufficient to
process the amount of TB samples. Ideally, the PNCT should assess the human resource
and equipment capacity in all the laboratories to decide which need to be operational,
which could serve as referral hubs, and which could potentially be shut down.
In the case of HIV, when the service agreement with Profamilia is over, the LNSPDD
would become the only laboratory capable of processing CD4 counts, viral load tests, and
Proviral DNA for EID, putting a considerable strain on the sustainability of the system.
The MoH should consider changing from a centralized processing strategy to a regional
processing strategy, with designated hubs providing services to the closest provinces, to
shorten distances traveled and times.
A lack of scheduling: Although pickup of HIV samples is scheduled, the same does not
apply to TB samples; thus, resources between the two disease control programs are not
coordinated, even when most SAIs are located where TB samples are also collected. This
results in poor use of funds and duplication of efforts.
Failure to comply with biosafety protocols for transporting laboratory samples: This
presents a major factor in the DR’s issues with obtaining a result for 100% of the samples
sent for testing, because optimal conditions are seldom maintained, and numerous
samples arrive damaged, although laboratories seldom report such cases, evidencing a
need to sensitize laboratory staff on the importance of reporting.
Having vertical disease control programs creates too many different responsible entities
in the process of laboratory sample referral, leading to lack of specialization. In an
integrated model, resources could be shared, and certain staff could be dedicated to the
oversight of optimal biosafety standards for both HIV and TB.
An array of different and disorganized transport flows and responsible entities:
o The SRSs execute their responsibility to provide the service in roughly 50% of all
establishments surveyed by the baseline assessment.

Sample Referral Networks in Vertically Managed Disease Control Programs for HIV and TB in the DR
18
o The establishments make use of their vehicles and financial resources to deliver the
laboratory samples.
o Laboratory staff delivers the samples, using out-of-pocket resources, in cases when
neither the SRS nor the establishments provide transportation services.
o In the case of HIV, the regional hubs are sometimes but not always responsible for
receiving the results from the LNSPDD. In other cases, it is the regional
administrative offices of the SRS.
The ad hoc nature of the transportation flows harms the referral network’s general accountability
and contributes to samples arriving in bad shape, delayed TATs, and lost results.
An agile and organized transportation system is essential to prevent further spread of TB and
HIV. To this end, the design and implementation of an integrated and standardized transportation
system will improve the overall performance of the referral network, helping infected individuals
receive appropriate and timely treatment.
The analysis derived from the baseline assessment identified a marked need for a general
restructuring of the referral networks of HIV and TB laboratory samples that ranges from basic
reporting practices to sample pickup planning and scheduling.
Proposed Interventions
In an effort to provide structure to the transportation system, the team formed by the technical
working group and SIAPS consultants designed the first-ever model guidelines and standard
operating procedures (SOPs) for an integrated referral network of HIV and TB in the Dominican
Republic.
Because DR laboratory staff have scarce knowledge on supply chain management, the new SOPs
have been designed as a continuous flow, depicting all processes from the collection of
laboratory samples, reception at processing facilities, manual and electronic information flows,
communication, scheduling, results reporting, and people responsible for day-to-day operations.
The inclusion of local public laboratory staff in the design and validation process should help in
the transition and long-term sustainability of the proposed procedures.
The SOPs addressed seven key challenges found by the baseline assessment:
1. Assignment of establishments for sample referral: The SRSs would be responsible for
coordinating with their region’s establishments to clearly and visibly establish where
each establishment within the network will send each type of laboratory sample, without
exception. The aim is to eliminate existing and unofficial options for TB laboratory staff
to decide, or instruct drivers, where to send the samples. This would help balance the
workloads in TB laboratories once this measure is put in practice, except for the design of

Discussion and Conclusion
19
the laboratory network not being correct or up to date to account for present and future
patient needs.
2. Definition of responsibilities across the supply chain, from the laboratory technicians and
truck drivers to the administrative and operative offices of the Dominican MoH: A clear
definition of roles would help create accountability throughout the referral network,
something that at the moment is deficient because of the ad hoc nature of the current
system. In this new model, the SRS administrative offices would be responsible for 100%
of the sample transportation in the country, as opposed to the current 50%, thereby
eliminating unnecessary staff expenses.
3. Schedules for pickup and delivery of laboratory samples: The creation of a schedule to
standardize transportation flows and to pool vehicle use and economic resources is
necessary to create a more sustainable system. This schedule would determine the days
and hours for sample collection, preparation, and pickup. It should also clarify the parties
responsible for transportation.
4. Information systems: The addition of an electronic results management information
system to link the processing facilities to the sample collection facilities and regional
hubs would reduce TATs, avoid the loss of results, and drastically improve the current
turnaround rates of HIV and TB test results. The proposed roadmap for implementation is
to start with the LNSPDD, the 13 regional facilities, and eight regional hubs. A second
phase would include provincial and municipal-level facilities. Also in terms of
information systems, along with the SOPs, three different paper forms where designed to
be the preferred documentation for the transportation of laboratory samples and results.
The information contained in these three forms, if properly used, would be enough to
periodically monitor the performance of the new system.
5. Monitoring and evaluation: Currently, monitoring and evaluation is mostly done with
anecdotal information collected during supervisory visits. A monitoring and evaluation
procedure and plan were developed to help obtain hard evidence to assess the
performance of the system after implementation and scale-up. The three forms, plus a
handful of well-defined indicators to be measured, such as TAT and percentage of results
received per samples sent, should diminish the dependence on nonsystemic information.
6. Means of transportation: This is another critical subject that is addressed in the SOPs,
which requires further consideration for viability of implementation. The DR’s inter-
regional transportation system for laboratory samples relies heavily on the use of public
transportation. While this is in no case a good practice, the current resources available
(public or private) dictate further use of public transportation until the MoH can procure
other means. A contracted agreement must be reached between the transportation
companies and the MoH to guarantee highest quality of service until other options
become available.
7. Biosafety: A complete procedure was attached to the SOPs regarding biosafety measures
to cover all processes from the preparation and packing of laboratory samples to the

Sample Referral Networks in Vertically Managed Disease Control Programs for HIV and TB in the DR
20
transportation conditions, and the reception. The procedure includes the recommended
materials and equipment needed throughout in accordance with the WHO Guidance on
Regulations for the Transport of Infectious Substances 2013–2014. A considerable effort
would be needed to correct biosafety measures to minimize the loss of laboratory samples
in transit.
Next steps include a training of trainers on implementation of the SOPs, through a
comprehensive and participative workshop to prepare local stakeholders for the challenges of
managing the changes to the established system. During this workshop, all nine SRSs would
prepare the implementation plans together with the aid of SIAPS consultants.
Also, the results management information system needs to be designed and developed by local
MoH employees, with subsequent user training. This system should help shorten TATs at the
central and regional-level facilities.
Upon scale-up, continued monitoring should be scheduled for a period of six months to one year,
to have sufficient data to appraise performance of the new system. At the end of that period, a
new collection of relevant data through the monitoring and evaluation indicators would be
necessary to assess whether any improvements are evident.
The intervention that took place in Uganda in 2013 demonstrates that applying a systematic
supply chain approach to standardize the referral network for one specific type of laboratory
sample can improve dramatically the network’s performance, reduce costs, and ultimately
improve diagnosis and treatment. By integrating the TB and HIV referral networks, the aim in
the DR is to achieve similar results, but for an array of laboratory samples and a larger
population. Ultimately, the desired health outcomes are to improve the agility of diagnosis and
treatment for HIV-positive and TB patients and to help prevent the spread of these diseases.