basel iii disclosure basel iii disclosure fiscal 2014 risk management since the financial crisis in...
TRANSCRIPT

Basel III Disclosure
FISCAL 2014
2 Basel III Disclosure Fiscal 2014
CONTENTSGroup Business Management 3Risk Management 7
TOP RISK 9IMPLEMENTATION OF BASEL STANDARDS 10CREDIT RISK MANAGEMENT 11MARKET RISK MANAGEMENT 18LIQUIDITY RISK MANAGEMENT 23OPERATIONAL RISK MANAGEMENT 24
Compliance 30Basel III Data (Consolidated) 34
SCOPE OF CONSOLIDATION 34COMPOSITION OF EQUITY CAPITAL 36CAPITAL ADEQUACY 50CREDIT RISK 52CREDIT RISK MITIGATION 70DERIVATIVE TRANSACTIONS AND LONG SETTLEMENT TRANSACTIONS 71SECURITIZATION EXPOSURES (Subject to calculation of credit risk assets) 72SECURITIZATION EXPOSURES (Subject to calculation of market risk equivalent amount) 81LIQUIDITY RISK 83MARKET RISK 86OPERATIONAL RISK 88EQUITY EXPOSURES IN BANKING BOOK 88EXPOSURES RELATING TO FUNDS 90INTEREST RATE RISK IN THE BANKING BOOK (IRRBB) 90INDICATORS FOR ASSESSING GLOBAL SYSTEMICALLY IMPORTANT BANKS (G-SIBs) 91COMPOSITION OF LEVERAGE RATIO DISCLOSURE 92
3 Basel III Disclosure Fiscal 2014
Group Business Management
Business Management Framework
MUFG has adopted a group organizational structure that features cross-integration along functional lines to deliver valuable financial products and services for a wide range of customers’ needs. MUFG has established business groups across the group companies: Retail Banking, Corporate Banking, Trust Assets, Global, and Global Markets. Under this Business group framework, we develop and promote group-wide business initiatives along with a unified strategy and providing seamless services in a timely manner.
Risk-Return Management
In order to improve the group-base risk profile, to earn an appropriate amount of profits, and to allocate managerial resources properly, MUFG compiles an “Economic Capital Allocation Plan” in which to allocate economic capital, matches to the sum of various type of risk exposures calculated by internal risk measurement model, to each business group, each subsidiary, and each risk category.
In addition, in order to comply with the Basel III regulatory capital regulations, MUFG introduces “Risk-Weighted-Asset (RWA) plan,” and controls risk takings by each segment.
MUFG has also introduced business management indicators (ROEC*, RORA*, etc.) to assess and manage profitability against risk takings, aiming to heighten capital efficiency on the group basis. (Risk-Return management)
Glossary of terms:
• ROEC (Return on Economic Capital)A ratio calculated by dividing the net income of each business group by its amount of allocated capital. MUFG uses ROEC to pursue efficient use of allocated capital distributed to respective business groups.
• RORA (Return on Risk Asset)A ratio calculated by dividing the net income of each segment by its amount of risk-weighted-assets. MUFG uses RORA to pursue profitability and efficiency that are commensurate with risk assets.

4 Basel III Disclosure Fiscal 2014
Net Operating Profit/Risk-Weighted Assets by Business GroupBillions of yen
Retail banking
Corporate banking Global Trust assets
Global markets
MUFG consolidated
total
Net operating profit(Note 1) 347.1 517.1 442.4 70.1 418.1 1,675.4
Change from fiscal 2013 12.7 31.6 66.5 5.1 31.4 212.4
Risk-weighted assets(Note 2) 11,120.0 31,239.4 37,014.5 1,304.2 12,934.5 112,315.2
Change from March 31, 2014 (325.0) 631.5 6,490.1 327.8 1,698.0 12,561.2
Credit risk 9,457.8 30,144.9 35,178.7 722.6 9,101.8 98,292.2
Change from March 31, 2014 (430.1) 593.3 6,292.4 250.0 943.8 10,290.9
Market risk 17.0 64.2 51.0 155.0 3,283.8 2,511.7
Change from March 31, 2014 (2.2) (30.0) 19.1 17.1 666.6 170.8
Operational risk 1,645.1 1,030.2 1,784.7 426.4 548.8 6,644.6
Change from March 31, 2014 107.3 68.2 178.5 60.6 87.4 582.4
Note:1. Managerial figures based on settlement rates. The consolidated balance for MUFG includes figures from head office and others.2. Breakdown of risk-weighted assets by business group are managerial figures that are allocated by dividing financial-based risk-weighted assets.
Overview of Internal Capital Adequacy Assessment Process
The holding company regularly assesses its internal capital adequacy from two perspectives: regula-tory capital, based on capital adequacy regulations (Basel III), and its own economic capital, based on internal risk assessment.
In assessing internal capital adequacy based on regulatory capital, the holding company confirms that it is maintaining sufficient capital both at the current time and in terms of what will be required in the future, calculating the Common Equity Tier 1 ratio, the Tier 1 ratio, and the total capital ratio using capital and risk-adjusted assets as stipulated in the capital adequacy regulations. At the same time, the holding company confirms that it is maintaining appropriate capital relative to risk using the benchmark of a “Common Equity Tier 1 ratio of at least 9.5%,” which has been designated from the perspective of risk management and is included as a target in the Group’s medium-term busi-ness plan.
Internal capital adequacy assessment based on economic capital is carried out within the framework of the capital allocation system, which allocates capital to credit risk, strategic equity portfolio risk, market risk, and operational risk.
Credit concentration risk and interest rate risk in the banking book, as stipulated by the Second Pillar of Basel, are included in these risks. The method of calculating each risk under the capital allocation system uses the basic assumptions of a confidence level of 99.9% and a holding period of one year to enhance consistency with Basel III. The capital allocation plan is formulated after assessing internal capital adequacy by comparing the total risk amount, taking into account the effect of risk diversifica-tion, with total capital (Tier 1 capital + Tier 2 capital). Thereafter, internal capital adequacy is moni-tored on an ongoing basis by regularly checking the use of allocated capital versus the plan and the amount of allocated capital versus total capital.

5 Basel III Disclosure Fiscal 2014
Both the regulatory capital plan and the economic capital plan are stress-tested and are prepared based on a detailed analysis of the impact on capital and risk as well as an assessment of internal capital adequacy.
The same framework for the assessment of internal capital adequacy used at the holding company is applied at the Group’s two main banks: The Bank of Tokyo-Mitsubishi UFJ, Ltd., and Mitsubishi UFJ Trust and Banking Corporation.
Required Regulatory Capital Adequacy Levels(%)
March 2013 March 2014 March 2015 March 2016 March 2017 March 2018March 2019 and beyond
Common Equity Tier 1 ratio 3.5 4.0 4.5 5.5 6.5 7.5 8.5
Tier 1 ratio 4.5 5.5 6.0 7.0 8.0 9.0 10.0
Total capital ratio 8.0 8.0 8.0 9.0 10.0 11.0 12.0
Note: Based on G-SIBs surcharge of 1.5%.
Common Equity Tier 1 Ratio Requirements
March2014
March2013
March2015
March2016
March2017
March2018
March2019
and beyond
Minimum requirements
G-SIFIs surcharge*1
Capital conservation buffer*2
0
4.5
8.5
7.0
3.5 4.04.5
0.6250.375
0.75
1.251.875 2.5
1.51.125
4.5 4.5 4.5 4.5
(%)*1 G-SIFIs surcharge This surcharge is an additional capital adequacy
requirement placed on financial institutions designated as global systemically important financial institutions. The designation of covered financial institutions and the surcharge rates are updated annually. The 1.5% shown in the accompanying chart is the surcharge rate announced in 2014 that is expected to be required of MUFG.
*2 Capital conservation buffer This buffer seeks to maintain capital that can be
drawn upon during times of stress, and banks are required to hold this buffer to avoid falling below minimum regulatory capital levels. The required buffer is 2.5% of risk-weighted assets on a Common Equity Tier 1 capital basis. In the event the levels shown in the chart cannot be maintained, certain restrictions would be imposed on measures associated with the distribution of capital, such as the payment of dividends or the repurchase of shares.

6 Basel III Disclosure Fiscal 2014
Overview of Stress Testing Process
(1) Development of Stress Testing Scenarios Develop several scenarios taking into account such factors as our risk profile and underlying
macroeconomic environment. • A worst-in-a-decade scenario and worst-in-a-quarter-century scenarios are developed in principle
and some additional scenarios are developed where necessary.
Prepare macroeconomic variables for the testing horizon under each scenario. • Macroeconomic variables include GDP, TOPIX, JGB yield, dollar-yen exchange rate, euro-yen
exchange rate, unemployment rate, CPI, and others.
(2) Review and Approval Process of the Scenarios Scenarios developed under process (1) are reviewed by our internal committee and ultimately
approved by our Group Chief Risk Officer.
(3) Estimation of Financial Impact Estimate stress impacts on major assets and income based on the scenarios approved in
process (2). • Major items estimated include credit cost, losses on write-down on equity securities, net gains/
losses on equity securities, net interest income, risk-weighted assets, and others.
(4) Assessment of Capital Adequacy Assess capital adequacy of both regulatory and economic capital, calculating the following
ratios/amounts based on the stress impacts estimated in process (3). • Regulatory Capital: Common Equity Tier 1 ratio, Tier 1 ratio, and total capital ratio
• Economic Capital: Capital margin (difference between total capital and total risk amount)
Stress testing results are reviewed by the Corporate Risk Management Committee.

7 Basel III Disclosure Fiscal 2014
Risk Management
Since the financial crisis in 2008, financial groups such as us have been expected to ensure increasingly more sophisticated and comprehensive risk management. Risk management plays an increasingly important role in our operations as a financial group operating globally through various subsidiaries.
We identify various risks arising from businesses based on uniform criteria, and implement integrated risk management to ensure a stronger financial condition and to maximize shareholder value. Based on this approach, we identify, measure, control and monitor a wide variety of risks so as to achieve a stable balance between earnings and risks. We undertake risk management to create an appropriate capital structure and to achieve optimal allocation of resources.
Risk Classification
At the holding company level, we broadly classify and define risk categories faced by the Group including those that are summarized below. Group companies perform more detailed risk manage-ment based on their respective operations.
Type of Risk Definition
Credit Risk The risk of financial loss in credit assets (including off-balance sheet instruments) caused by deterioration in the credit conditions of counterparties. This category includes country risk.
Market Risk Market risk is the risk of financial loss where the value of our assets and liabilities could be adversely affected by changes in market variables such as interest rates, securities prices and foreign exchange rates. Market liquidity risk is the risk of finan-cial loss caused by the inability to secure market transactions at the required volume or price levels as a result of market turbulence or lack of trading liquidity.
Liquidity Risk The risk of incurring loss if a poor financial position at a group company hampers the ability to meet funding requirements or necessitates fund procurement at interest rates markedly higher than normal.
Operational Risk The risk of loss resulting from inadequate or failed internal processes, people or systems, or from external events.
Operations Risk The risk of incurring loss that might be caused by negligence of correct operational processing, or by incidents or misconduct by either officers or staff, as well as other similar risks.
Information Asset Risk The risk of loss caused by loss, alteration, falsification or leakage of information, or by destruction, disruption, errors or misuse of information systems, as well as other similar risks.
Tangible Asset Risk The risk of loss due to damage to tangible assets or deterioration in the operational environment caused by disasters or inadequate asset maintenance, as well as risks similar to this risk.
Personnel Risk The risk of loss due to an outflow or loss of human resources or deterioration in employee morale, as well as risks similar to this risk.
Legal Risk The risk of loss due to failure to comply with applicable laws and regulations, ade-quately evaluate contractual rights and obligations, or appropriately deal with dis-putes, as well as other similar risks.
Reputation Risk The risk of loss due to deterioration in reputation as a consequence of the spread of rumors among customers or in the market, or as a consequence of inadequate response to a particular circumstance by MUFG, as well as other similar risks.

8 Basel III Disclosure Fiscal 2014
Risk Management System
We have adopted an integrated risk management system to promote close cooperation among the holding company and group companies. The holding company and the major subsidiaries (which include BTMU, MUTB and MUSHD) each appoint a chief risk officer and establish an independent risk management division. The board of directors of the holding company determines risk manage-ment policies for various type of risk based on the discussions at, and reports and recommendations from, committees established specially for risk management purposes. The holding company has established committees to assist management in managing risks relevant to the Group. Following the fundamental risk management policies determined by the board of directors, each group company establishes its own systems and procedures for identifying, analyzing and managing various types of risks from both quantitative and qualitative perspectives. The holding company seeks to enhance group wide risk identification, to integrate and improve the Group’s risk management system and related methods, to maintain asset quality, and to eliminate concentrations of specific risks.
Group-wide Credit Committee(Note 2)
Credit & InvestmentManagement Committee(Note 1)
Corporate Risk ManagementCommittee
(including crisis management)
Risk Committee
Holding company (Mitsubishi UFJ Financial Group)
Executive Committee
Board of Directors
Management PlanningCommittee
(including ALM)
Corporate Risk Management Division
(coordinates risk management)
Credit Policy & Planning Division
Compliance Division, Operations & Systems
Planning Division
Compliance Division,Legal Division
Corporate AdministrationDivision
Human Resources Division
Corporate CommunicationsDivision
Market Risk, Liquidity Risk, Operational Risk, Operations Risk
Credit Risk
Information Asset Risk
Tangible Asset Risk
Personnel Risk
Legal Risk
Reputation Risk
Discuss and reportEstablish fundamental policy and
provide guidance and advice Discuss and report
Group Companies
Bank of Tokyo-Mitsubishi UFJ
Board of Directors
Risk Management Committee (including crisis management)
Credit & Investment Management Committee
Credit Committee
Customer Protection CommitteeSystems Strategy Committee
Executive Committee
Corporate Risk ManagementDivision
(coordinates risk management)
Credit Policy & Planning Division
Transaction Services Division
Operations Planning Division
Compliance Division, Systems Division
Corporate Administration Division
Human Resources Division
Compliance Division, Legal Division
Corporate CommunicationsDivision
ALM Committee
Market Risk,Liquidity Risk,
Operational Risk
Credit Risk
Settlement Risk
Operations Risk
Information Asset Risk
Tangible Asset Risk
Personnel Risk
Legal Risk
Reputation Risk
Credit and Investment Council
Capital Management Committee
Operational Risk Management Committee
Crisis Management Committee
Mitsubishi UFJ Trust and Banking
Board of Directors
Executive Committee ALM Council
Credit Risk, MarketRisk, Liquidity Risk,Operational Risk,Operations Risk
Mitsubishi U
FJ Securities H
oldings
Information Asset Risk
Tangible Asset Risk
Personnel Risk
Legal Risk
Reputation Risk
Corporate Risk ManagementDivision
(coordinates risk management)
Corporate Risk Management Division, Business Process & IT
Planning Division
Corporate AdministrationDivision
Compliance & Legal Division
Personnel Division
Corporate Planning Division
Other S
ubsidiaries
Note:1. Scheduled to be established in 2015.2. Scheduled to be renamed to “Credit Committee” in 2015.

9 Basel III Disclosure Fiscal 2014
TOP RISK
MUFG and its major subsidiaries control risk by taking a preventative approach of identifying the top risks establishing the necessary countermeasures in advance. If risks do materialize, the situation is managed so as to enable a flexible response. Moreover, senior management discusses top risk to share risk awareness and develop effective countermeasures.
Major Top RisksRisks Risk Scenarios(Note) (examples)
Risk of Increase in Long-term Interest Rates
• Overcoming deflation will prompt the market to have an expectation where quantitative and qualitative easing (QQE) would come to an end, leading to a rapid increase in long-term interest rates in a short period of time.
• The declining confidence in Japan’s fiscal management and government bonds may cause a rapid increase in long-term interest rates.
Risk of Decline in Equity Prices • A sudden decline in stock prices may be caused by additional efforts among global market participants to reduce their risk assets, by a global recession, or by a deterioration of corporate earnings.
• A sudden decline in stock prices may be caused by increasing concerns over the deterioration of domestic listed companies’ earnings due to the factors such as lowered expectations relating to the Japanese governmental economic stim-ulus package (often referred to as Abenomics).
Risk Associated with Money Laundering or Illegal Transactions
• Regulatory issues, such as the infringement of anti-money laundering regulations or illegal transactions could lead to legal actions, such as business suspension or civil fines, and reputational damage.
Risk of Loss or Reputational Damage Caused by Information Loss, Leaks or Cyber-Attacks
• Customer information may be leaked due to inadequate information controls or cyber-attacks.
• An inadequate response to information security breaches.
Note:The risk scenarios outlined in the above table are some of the risk scenarios discussed at the Corporate Risk Management Committee meeting and reported to Board of Directors in March 2015. Some of the scenarios are general ones and may not be unique to MUFG.
Concept of Top Risks
• Risks are defined as the losses that the Company would incur as a result of each risk scenario material-izing. The materiality of a risk is determined based on the impact and probability of risk occurrence (external and internal factors).
• Risks that MUFG believes require priority attention over the next one year period are defined as top risks (including risk events having the potential to have a relatively high probability of occurrence. Moreover, including risks that are not only limited to the quantifiable ones, but those that could materially affect MUFG’s business in the future because of possible adverse effects on MUFG’s strategies or reputation).
• The Company creates a risk map to comprehensively grasp specified top risks, and makes use of it for preventative risk management.
Note:The table shown above only describes some of the risks that MUFG believes are material. Please note that other risks not identified in the above table could materially affect MUFG’s operating results. Please refer to other disclosure materials such as Securities Report, Quarterly Securities Report, Form 20-F, and Form 6-K for more details on MUFG’s and its subsidiaries’ risk information.

10 Basel III Disclosure Fiscal 2014
Crisis Management Framework
In order to have a clear critical response rationale and associated decision-making criteria, we have developed systems designed to ensure that our operations are not interrupted or can be restored to normal quickly in the event of a natural disaster or system failure so as to minimize any disruption to customers and markets. A crisis management team within the holding company is the central coordi-nating body in the event of any emergency. Based on information collected from crisis management personnel at the major subsidiaries, this central body would assess the overall impact of a crisis on the Group’s business and establish task forces that could implement all countermeasures to restore full operations. We have business continuity plans to maintain continuous operational viability in the event of natural disasters, system failures and other types of emergencies. Regular training drills are conducted to upgrade the practical effectiveness of these systems.
Recognizing that our operations, particularly in Japan, are subject to the risk of earthquakes and other natural disasters as well as accidents resulting from such disasters, including a sudden massive blackout in major metropolitan areas in Japan, and that our contingency plans may not address all eventualities that may occur in the event of a material disruption to our operations, we have been conducting a comprehensive review of our existing business continuity plan to more effectively respond to such extreme scenarios, and continue to contemplate and implement measures to augment our current business continuity management framework, including enhancing our off-site back-up data storage and other information technology systems.
IMPLEMENTATION OF BASEL STANDARDS
Basel II, as adopted by the FSA, has been applied to Japanese banks since March 31, 2007. Certain provisions of Basel III were adopted by the FSA effective March 31, 2013 for Japanese banking institutions with international operations conducted by their foreign offices. Basel III is based on Basel II’s comprehensive regulatory framework which is built on “three pillars”: (1) minimum capital requirements, (2) the self-regulation of financial institutions based on supervisory review process, and (3) market discipline through the disclosure of information. Based on the Basel principles, MUFG has adopted the Advanced Internal Ratings-Based Approach to calculate its capital requirements for credit risk since March 31, 2009. The Standardized Approach is used for some subsidiaries that are consid-ered to be immaterial to our overall capital requirements, and MUFG Americas Holding Corporation, or MUAH, has adopted a phased rollout of the Internal Ratings-Based Approach. MUFG has adopted the Advanced Measurement Approach since March 31, 2012 to calculate its capital requirements for operational risk, except that we use the Basic Indicator Approach for entities that are deemed to be less important in the calculation of the operational risk equivalent amount and for entities that are still preparing to implement the Advanced Measurement Approach. As for market risk, MUFG has adopted the Internal Models Approach mainly to calculate general market risk and adopted the Standardized Measurement Method to calculate specific risk.

11 Basel III Disclosure Fiscal 2014
In response to the recent financial crisis, the Group of Central Bank Governors and Heads of Supervision has made a series of announcements regarding the new global regulatory framework, which has been referred to as “Basel III,” to strengthen the regulation, supervision and risk manage-ment of the banking sector. Various Basel III measures are being phased in from the calendar year 2013, including those designed to raise the level of minimum capital requirements and to establish an internationally harmonized leverage ratio and a global minimum liquidity standard. In addition, the Basel Committee on Banking Supervision has proposed additional loss absorbency requirements to supplement the Common Equity Tier 1 capital requirement ranging from 1% to 3.5% for G-SIBs, depending on the bank’s systemic importance. The Financial Stability Board identified us as a G-SIB in its most recent annual report published in November 2013, and indicated that, as a G-SIB, we would be required to hold an additional 1.5% of Common Equity Tier 1 capital. The group of banks identified as G-SIBs is expected to be updated annually, and the group of G-SIBs identified in November 2014 is the first group of G-SIBs to which the stricter capital requirements will initially be applied. The stricter capital requirements are expected to be implemented in phases between January 1, 2016 and December 31, 2018 and will become fully effective on January 1, 2019.
Based on the Basel III framework, the Japanese capital ratio framework has been revised to imple-ment the more stringent requirements, which are being implemented in phases beginning on March 31, 2013. Likewise, local banking regulators outside of Japan, such as those in the United States, have begun, or are expected, to revise the capital and liquidity requirements imposed on our subsid-iaries and operations in those countries to implement the more stringent requirements of Basel III as adopted in those countries. We intend to carefully monitor further developments with an aim to enhance our corporate value and maximize shareholder value by integrating the various strengths within the MUFG Group.
CREDIT RISK MANAGEMENT
Credit risk is the risk of losses due to deterioration in the financial condition of a borrower. We have established risk management systems to maintain asset quality, manage credit risk exposure and achieve earnings commensurate with risk.
Our major banking subsidiaries (which include BTMU and MUTB) apply a uniform credit rating system for asset evaluation and assessment, loan pricing, and quantitative measurement of credit risk. This system also underpins the calculation of capital requirements and management of credit portfolios. We continually seek to upgrade credit portfolio management, or CPM, expertise to achieve an improved risk-adjusted return based on the Group’s credit portfolio status and flexible response capability to economic and other external changes.

12 Basel III Disclosure Fiscal 2014
Credit Risk Management System
The credit portfolios of our major banking subsidiaries are monitored and assessed on a regular basis by the holding company to maintain and improve asset quality. A uniform credit rating and asset evaluation and assessment system is used to ensure timely and proper evaluation of all credit risks.
Under our credit risk management system, each of our subsidiaries in the banking, securities, consumer finance, and leasing businesses, manages its respective credit risk on a consolidated basis based on the attributes of the risk, while the holding company oversees and manages credit risk on an overall group-wide basis. The holding company also convenes regular committee meetings to monitor credit risk management at banking subsidiaries and to issue guidance where necessary.
Each major banking subsidiary has in place a system of checks and balances in which a credit admin-istration section that is independent of the business promotion sections screens individual transac-tions and manages the extension of credit. At the management level, regular meetings of the Credit & Investment Management Committee and related deliberative bodies ensure full discussion of impor-tant matters related to credit risk management. Besides such checks and balances and internal oversight systems, credit examination sections also undertake credit testing and evaluation to ensure appropriate credit risk management.
Credit Rating System
MUFG and its major banking subsidiaries use an integrated credit rating system to evaluate credit risk. The credit rating system consists primarily of borrower rating, facility risk rating, structured finance rating and asset securitization rating.
Country risk is also rated on a uniform group-wide basis. Our country risk rating is reviewed periodi-cally to take into account relevant political and economic factors, including foreign currency availability.
Risk exposure for small retail loans, such as residential mortgage loans, is managed by grouping loans into various pools and assigning ratings at the pool level.
Board of Directors / Executive CommitteeCredit & Investment Management Committee / related deliberative bodies
Regular report
Credit risk management sections
Discussion of important matters
• Transaction report
•
Quantitative risk monitoring
Credit examination sections
Credit testing and evaluation
Business promotion sections
Credit screening and management
Credit administration sections
• Decisions regarding important matters
• Delegation of authority
Monitoring by MUFGCredit & InvestmentManagement Committee(Note 1)
Group-wide Credit Committee(Note 2)
Credit Risk Management Framework of the Major Banking Subsidiaries
Note:1. Scheduled to be established in 2015.2. Scheduled to be renamed to “Credit Committee” in 2015.

13 Basel III Disclosure Fiscal 2014
Borrower ratingOur borrower rating classifies borrowers into 15 grades based on evaluations of their expected debt-service capability over the next three to five years.
Facility risk ratingFacility risk rating is used to evaluate and classify the quality of individual credit facilities, including guarantees and collateral. Ratings are assigned by quantitatively measuring the estimated loss rate of a facility in the event of a default.
Structured finance rating and asset securitization ratingStructured finance rating and asset securitization rating are used to evaluate and classify the quality of individual credit facilities, including guarantees and collateral, and focus on the structure, including the applicable credit period, of each credit facility. In evaluating the debt service potential of a credit facility, we scrutinize its underlying structure to determine the likelihood of the planned future cash flows being achieved.
Pool assignmentEach major banking subsidiary has its own system for pooling and rating small retail loans designed to reflect the risk profile of its loan portfolios.
Asset evaluation and assessment system
The asset evaluation and assessment system is used to classify assets held by us according to the probability of collection and the risk of any impairment in value based on borrower classifications consistent with the borrower ratings and the status of collateral, guarantees, and other factors.
The system is used to conduct write-offs and allocate allowances against credit risk in a timely and adequate manner.
Quantitative Analysis of Credit Risk
MUFG and its major banking subsidiaries manage credit risk by monitoring credit amount and expected losses, and run simulations based on internal models to estimate the maximum amount of credit risk. These models are used for internal management purposes, including loan pricing and measuring economic capital.
When quantifying credit risk amounts using the internal models, MUFG and its major banking subsid-iaries consider various parameters, including probability of default, or PD, loss given default, or LGD, and exposure at default, or EAD, used in their borrower ratings, facility risk ratings and pool assign-ments as well as any credit concentration risk in particular borrower groups or industry sectors. MUFG and its major banking subsidiaries also share credit portfolio data in appropriate cases.

14 Basel III Disclosure Fiscal 2014
Definition of MUFG Borrower RatingMUFG
Borrower Rating MUFG Borrower Rating Definition
Borrower Category
NPL Classifications
under FRL
1The capacity to meet financial commitments is extremely certain, and the bor-rower has the highest level of creditworthiness.
Normal
Normal claims
2The capacity to meet financial commitments is highly certain, but there are some elements that may result in lower creditworthiness in the future.
3The capacity to meet financial commitments is sufficiently certain, but there is the possibility that creditworthiness may fall in the long run.
4There are no problems concerning the capacity to meet financial commitments, but there is the possibility that creditworthiness may fall in the long run.
5There are no problems concerning the capacity to meet financial commitments, and creditworthiness is in the middle range.
6There are no problems concerning the capacity to meet financial commitments presently, but there are elements that require attention if the situation changes.
7There are no problems concerning the capacity to meet financial commitments presently, but long-term stability is poor.
8There are no problems concerning the capacity to meet financial commitments presently, but long-term stability is poor, and creditworthiness is relatively low.
9The capacity to meet financial commitments is somewhat poor, and creditwor-thiness is the lowest among “Normal” customers.
10 through
12
Borrowers who must be closely monitored because of the following business performance and financial conditions:(1) Borrowers who have problematic business performance, such as virtually
delinquent principal repayment or interest payment;(2) Borrowers whose business performance is unsteady, or who have unfavor-
able financial conditions;(3) Borrowers who have problems with loan conditions, for whom interest rates
have been reduced or shelved.
Close watch10Although business problems are not serious or their improvement is seen to be remarkable, there are elements of potential concern with respect to the bor-rower’s management, and close monitoring is required.
11Business problems are serious, or require long-term solutions. Serious ele-ments concerning business administration of the borrower have emerged, and subsequent debt repayment needs to be monitored closely.
12
Borrowers who fall under the criteria of Rating 10 or 11 and have a loan con-cession granted. Borrowers who have “Loans contractually past due 90 days or more.” (As a rule, delinquent borrowers are categorized as “Likely to Become Bankrupt,” but the definition here applies to borrowers delinquent for 90 days or more because of inheritance and other special reasons.)
Claims under close observation
13
Borrowers who pose a serious risk with respect to debt repayment, loss is likely to occur in the course of transactions. While still not bankrupt, these borrowers are in financial difficulty, with poor progress in achieving restructuring plans, and are likely to become bankrupt in the future.
Likely to become bankrupt
Doubtful claims
14While not legally bankrupt, borrowers who are considered to be virtually bank-rupt because they are in serious financial difficulty and have no prospects for an improvement in their business operations.
Virtually bankrupt
Claims over bankrupt or virtually bankrupt borrowers15
Borrowers who are legally bankrupt (i.e., who have no prospects for continued business operations because of non-payment, suspension of business, volun-tary liquidation, or filing for legal liquidation).
Bankrupt

15 Basel III Disclosure Fiscal 2014
Objective credit rating system
Asset evaluation and assessment
Risk-based pricing management
Appropriate write-offs and allowance
Quantitative monitoring of credit riskPortfolio risk concentration checks
Market-based advanced CPM
Risk-based earnings management
Execute business strategies
Implementation of Basel Standards
Risk quantification
Credit Portfolio Management (CPM) Framework
Glossary of terms:
• PD (Probability of Default)The estimated default rate or the probability that the borrower will default. The definition of default is nonperformance in pay-ments of interest or principal in the narrow sense; however, in quantifying credit risk, a wider definition of default is used.
• LGD (Loss Given Default)The percentage loss at time of default, or in other words, the estimated percentage of loss on loan when a borrower defaults due to bankruptcy or other reasons.
• EAD (Exposure at Default)The amount expressed in relevant currency of exposure to loss at time of default, or in other words, the estimated amount of exposure to loss on loan when a borrower defaults due to bankruptcy or other reasons.
Loan Portfolio Management
We aim to achieve and maintain levels of earnings commensurate with credit risk exposure. Products are priced to take into account expected losses, based on the internal credit ratings.
We assess and monitor loan amounts and credit exposure by credit rating, industry and region. Portfolios are managed to limit concentrations of risk in specific categories in accordance with our Large Credit Guidelines.
To manage country risk, we have established specific credit ceilings by country. These ceilings are reviewed when there is a material change in a country’s credit standing, in addition to being subject to a regular periodic review.
Continuous CPM Improvement
With the prevalence of securitized products and credit derivatives in global markets, we seek to supplement conventional CPM techniques with advanced methods based on the use of such market-based instruments.
Through credit risk quantification and portfolio management, we aim to improve the risk return profile of the Group’s credit portfolio, using financial markets to rebalance credit portfolios in a dynamic and active manner based on an accurate assessment of credit risk.

16 Basel III Disclosure Fiscal 2014
Derivatives and Long Settlement Transactions, and Credit Risk Mitigation Techniques (Collateral and guarantees)
While loan exposures are the main portion of the credit portfolio to be managed, a counterparty credit risk arising from derivatives and long settlement transactions (hereafter “derivatives transactions”) is also included in the portfolio. In addition, when quantifying credit risk internally, MUFG takes into consideration an effect of credit risk mitigation (CRM) provided by collateral or guarantees.
1. Derivatives
Because counterparty credit risk of derivatives transactions generally can vary over time with the movement of underlying market factors, MUFG calculates exposures to counterparty credit risk by adding increases in future potential exposure to the balance of present exposure. Counterparty credit risk is not just recognized when calculating capital requirements, but significant exposures to counterparty credit risk are also managed in the same manner as loan exposures through alloca-tion of capital for credit risk and setting limits for the purpose of internal risk management.
In addition, the establishment of collateral-based security and reserves for derivative transactions is, in principle, treated in the same manner as for loans.
Among generally used derivatives contracts, there are some contracts that provide for the require-ment of additional collateral in the event that the credit capabilities of MUFG should deteriorate, and therefore, are a potential source of increased exposures.
2. Credit Risk Mitigation Techniques (Collateral, guarantees, and credit derivatives)
When quantifying credit risk and calculating capital requirements based on the AIRB Approach, MUFG basically takes into account the CRM effects of collateral, guarantees and credit derivatives using a method based on the amounts recovered in association with default exposures.
When using the Standardized Approach to calculate capital requirements, MUFG takes into consid-eration the effect of CRM techniques. Among these techniques are eligible financial collateral as typified by deposit collateral in our banks, or guarantees and credit derivatives.
The method for taking into account CRM effects based on the IRB Approach is tied to the internal risk management system. For example, through assessing real estate value accurately, MUFG endeavors to increase the sophistication of its internal risk management systems and use its advanced internal risk management systems in the calculation of capital requirements.
MUFG has a diversity of guarantors, such as local public authorities, credit guarantee corporations, financial institutions, and corporates, but its counterparties in credit derivative transactions are primarily financial institutions. When calculating capital requirements, guarantees and credit deriva-tives for which CRM effects are taken into account are limited to counterparties to whom MUFG continuously assigns borrower ratings and monitors creditworthiness.
With loans, MUFG mainly uses guarantees by Credit Guarantee Corporations or real estate collat-eral as CRM techniques. At this point of time, the use of CRM techniques has not led to excessive concentration of credit or market risk.

17 Basel III Disclosure Fiscal 2014
Other credit risk mitigation techniques
When calculating capital requirements for corporate exposures applicable to the AIRB Approach or exposures applicable to the Standardized Approach, MUFG recognizes the effect of on-balance netting of loans and deposits. For exposures applicable to the AIRB Approach, deposits eligible for the netting process are limited to call money.
For derivatives, such as interest rate swaps and currency options, and repo-style transactions with legally enforceable netting agreements, the CRM effects are taken into account when calculating capital requirements.
In addition, for collateralized derivatives (transactions based on CSA agreements), the CRM effects are also taken into account when calculating capital requirements.
Risk Management of Strategic Equity Portfolio
Strategic equity investment risk is the risk of loss caused by a decline in the prices of our equity investments.
We hold shares of various corporate clients for strategic purposes, in particular to maintain long-term relationships with these clients. These investments have the potential to increase business revenue and appreciate in value. At the same time, we are exposed to the risk of price fluctuation in the Japanese stock market. For that reason, in recent years, it has been a high priority for us to reduce our equity portfolio to limit the risks associated with holding a large equity portfolio, but also to respond to applicable regulatory requirements as well as increasing market expectations and demands for us to reduce our equity portfolio. We are required to comply with a regulatory framework that prohibits Japanese banks from holding an amount of shares in excess of their adjusted Tier 1 capital.
We use quantitative analysis to manage the risks associated with the portfolio of equities held for strategic purposes. According to internal calculations, the market value of our strategically held (Tokyo Stock Exchange listed) stocks (excluding foreign stock exchange-listed stocks) as of March 31, 2015 was subject to a variation of approximately ¥3.73 billion when TOPIX index moves one point in either direction.
We seek to manage and reduce strategic equity portfolio risk based on such types of simulation. The aim is to keep this risk at appropriate levels compared with Tier 1 capital while generating returns commensurate with the degree of risk exposure.

18 Basel III Disclosure Fiscal 2014
Board of Directors / Executive CommitteeALM Committee / ALM Council / Risk Management Meeting
Delegation of authority
Front Office
Back Office
Quantitative risk monitoring
Trading result report Report
Confirmation of contracts and agreements
Middle Office(Market risk
management departments)
Market Risk Management System of Our Major Subsidiaries
MARKET RISK MANAGEMENT
Market risk is the risk that the value of our assets and liabilities could be adversely affected by changes in market variables such as interest rates, securities prices, or foreign exchange rates.
Management of market risk at MUFG aims to control related risk exposure across the Group while ensuring that earnings are commensurate with levels of risk.
Market Risk Management System
We have adopted an integrated system to manage market risk from our trading and non-trading activities. The holding company monitors group-wide market risk, while each of the major subsidiaries manages its market risks on a consolidated and global basis.
At each of the major subsidiaries, checks and balances are maintained through a system in which back and middle offices operate independently from front offices. In addition, separate Asset-Liability Management, or ALM, Committee, ALM Council and Risk Management Meetings are held at each of the major subsidiaries every month to deliberate important matters related to market risk and control.
The holding company and the major subsidiaries allocate economic capital commensurate with levels of market risk and determined within the scope of their capital bases. The major subsidiaries have established quantitative limits relating to market risk based on their allocated economic capital. In addition, in order to keep losses within predetermined limits, the major subsidiaries have also set limits for the maximum amount of losses arising from market activities.
19 Basel III Disclosure Fiscal 2014
Market Risk Management and Control
At the holding company and the major subsidiaries, market risk exposure is reported to the Chief Risk Management Officers on a daily basis. At the holding company, the Chief Risk Management Officer monitors market risk exposure across the Group as well as the major subsidiaries’ control over their quantitative limits for market risk and losses. Meanwhile, the Chief Risk Management Officers at the major subsidiaries monitor their own market risk exposure and their control over their quantitative limits for market risk and losses. In addition, various analyses on risk profiles, including stress testing, are conducted and reported to the Executive Committees and the Corporate Risk Management Committees on a regular basis. At the business unit levels in the major subsidiaries, the market risks on their marketable assets and liabilities, such as interest rate risk and foreign exchange rate risk, are controlled by entering into various hedging transactions using marketable securities and derivatives.
These market risk management activities are performed in accordance with the predetermined rules and procedures. The internal auditors regularly verify the appropriateness of the management controls over these activities and the risk evaluation models adopted.
Market Risk Measurement Model
Market risks consist of general risks and specific risks. General market risks result from changes in entire markets, while specific risks relate to changes in the prices of individual stocks and bonds which are independent of the overall direction of the market.
To measure market risks, MUFG uses the VaR method which estimates changes in the market value of portfolios within a certain period by statistically analyzing past market data. Since the daily variation in market risk is significantly greater than that in other types of risk, MUFG measures and manages market risk using VaR on a daily basis.
Market risk for trading and non-trading activities is measured using a uniform market risk measure-ment model. The principal model used for these activities is a historical simulation, or HS, model (holding period, 10 business days; confidence interval, 99%; and observation period, 701 business days). The HS model calculates VaR amounts by estimating the profit and loss on the current portfolio by applying actual fluctuations in market rates and prices over a fixed period in the past. This method is designed to capture certain statistically infrequent movements, such as a fat tail, and accounts for the characteristics of financial instruments with nonlinear behavior. The holding company and banking subsidiaries also use the HS model to calculate as part of the calculation of their Basel III regulatory capital adequacy ratios.
In calculating VaR using the HS method, we have implemented an integrated market risk measure-ment system throughout the Group. Our major subsidiaries calculate their VaR based on the risk and market data prepared by the information systems of their front offices and other departments. The major subsidiaries provide this risk data to the holding company, which calculates overall VaR, taking into account the diversification effect among all portfolios of the major subsidiaries.
For the purpose of internally evaluating capital adequacy on an economic capital basis in terms of market risk, we use this market risk measurement model to calculate risk amounts based on a holding period of one year and a confidence interval of 99.9%.

20 Basel III Disclosure Fiscal 2014
Monitoring and managing our sensitivity to interest rate fluctuations is the key to managing market risk in MUFG’s non-trading activities. The major banking subsidiaries take the following approach to measuring risks concerning core deposits, loan prepayments and early deposit withdrawals.
To measure interest rate risk relating to deposits without contract-based fixed maturities, the amount of “core deposits” is calculated through a statistical analysis based on deposit balance trend data and the outlook for interest rates on deposits, business decisions, and other factors. The amount of “core deposit” is categorized into various groups of maturity terms of up to ten years to recognize interest rate risk. The calculation assumptions and methods to determine the amount of core deposits and maturity term categorization are regularly reviewed.
Meanwhile, deposits and loans with contract-based maturities are sometimes cancelled or repaid before their maturity dates. To measure interest rate risk for these deposits and loans, we reflect these early termination events mainly by applying early termination rates calculated based on a statistical analysis of historical repayment and cancellation data together with historical market interest rate data.
Summaries of Market Risks (Fiscal Year Ended March 31, 2015)
Trading activities
The aggregate VaR for our total trading activities as of March 31, 2015 was ¥21.86 billion, comprising interest rate risk exposure of ¥17.63 billion, foreign exchange risk exposure of ¥8.80 billion, and equity-related risk exposure of ¥0.99 billion. Compared with the VaR as of March 31, 2014, we experi-enced an increase in market risk during the fiscal year ended March 31, 2015, primarily due to an increase in foreign exchange risk.
Our average daily VaR for the fiscal year ended March 31, 2015 was ¥20.51 billion. Based on a simple sum of figures across market risk categories, interest rate risk accounted for approximately 71%, foreign exchange risk for approximately 19% and equity-related risk for approximately 8%, of our total trading activity market risks.
Due to the nature of trading operations which involves frequent changes in trading positions, market risk varied substantially during the fiscal year, depending on our trading positions.
VaR for Trading ActivitiesApril 1, 2013–March 31, 2014 Billions of Yen
Average Maximum(Note) Minimum(Note) Mar 31, 2014Overall 20.79 29.50 15.34 18.09
Interest rate 17.33 21.93 14.02 14.98Yen 8.59 14.07 5.36 6.16U.S. dollars 6.66 11.12 3.95 5.05
Foreign exchange 6.93 15.30 3.46 3.46Equities 2.07 7.35 0.79 2.90Commodities 0.74 1.39 0.31 1.25Less diversification effect (6.28) — — (4.50)
April 1, 2014–March 31, 2015 Billions of Yen Average Maximum(Note) Minimum(Note) Mar 31, 2015
Overall 20.51 25.01 16.02 21.86Interest rate 18.25 23.79 14.74 17.63
Yen 7.65 12.95 4.87 9.50U.S. dollars 6.39 10.56 4.33 7.41
Foreign exchange 4.91 10.78 1.88 8.80Equities 2.23 3.75 0.89 0.99Commodities 0.26 1.27 0.00 0.05Less diversification effect (5.14) — — (5.61)
Assumptions for VaR calculations:Historical simulation methodHolding period: 10 business daysConfidence interval: 99%Observation period: 701 business days
Note: The maximum and minimum VaR overall and for various risk categories were taken from different days.

21 Basel III Disclosure Fiscal 2014
Non-trading Activities
The aggregate VaR for our total non-trading activities as of March 31, 2015, excluding market risks related to our strategic equity portfolio and measured using the same standards as trading activities, was ¥412.6 billion. Market risk related to interest rates equaled ¥396.8 billion and equities-related risk equaled ¥158.0 billion.
Based on a simple sum of figures across market risk categories, interest rate risks accounted for approximately 70% of our total non-trading activity market risks. Looking at a breakdown of interest rate related risk by currency, as of March 31, 2015, the yen accounted for approximately 49% while the U.S. dollar accounted for approximately 24%.
Due to reduced position taking, MUFG’s aggregate VaR in the fiscal year ended March 31, 2015 decreased in comparison to the fiscal year ended March 31, 2014.
VaR for Non-trading Activities
April 1, 2013–March 31, 2014 Billions of Yen Average Maximum(Note) Minimum(Note) Mar 31, 2014
Interest rate 400.8 459.8 304.2 304.2Yen 223.8 276.5 183.3 190.4U.S. dollars 183.8 230.2 135.8 140.8Euro 109.8 156.1 57.9 60.9
Equities 161.3 202.4 100.6 172.9Total 410.7 462.1 332.1 332.1
April 1, 2014–March 31, 2015 Billions of Yen Average Maximum(Note) Minimum(Note) Mar 31, 2015
Interest rate 387.0 455.0 305.6 396.8Yen 239.5 280.1 196.3 264.7U.S. dollars 121.7 145.8 99.7 132.8Euro 133.3 173.9 60.9 148.2
Equities 161.3 185.7 125.9 158.0Total 394.8 452.7 332.4 412.6
Assumptions for VaR calculations:Historical simulation methodHolding period: 10 business daysConfidence interval: 99%Observation period: 701 business days
Note: The maximum and minimum VaR overall for each category and in total were taken from different days. The equities-related risk figures do not include market risk exposure from our strategic equity portfolio.
22 Basel III Disclosure Fiscal 2014
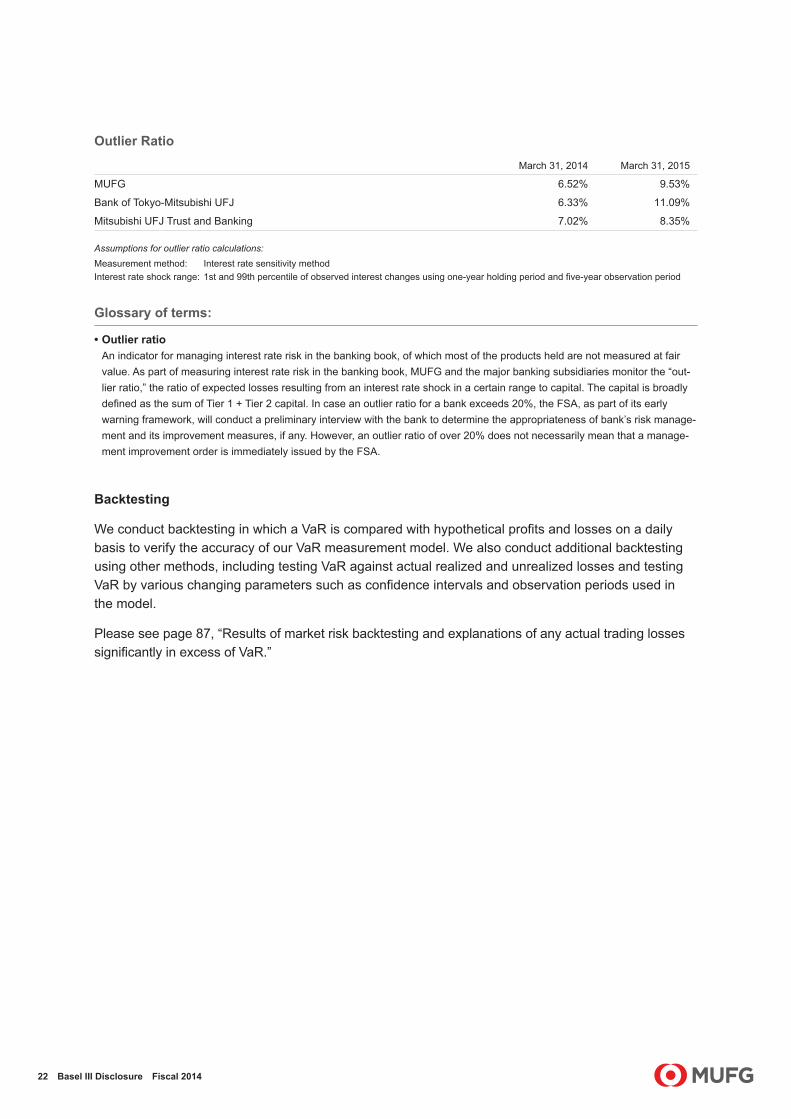
Outlier Ratio
March 31, 2014 March 31, 2015
MUFG 6.52% 9.53%
Bank of Tokyo-Mitsubishi UFJ 6.33% 11.09%
Mitsubishi UFJ Trust and Banking 7.02% 8.35%
Assumptions for outlier ratio calculations:Measurement method: Interest rate sensitivity methodInterest rate shock range: 1st and 99th percentile of observed interest changes using one-year holding period and five-year observation period
Glossary of terms:
• Outlier ratioAn indicator for managing interest rate risk in the banking book, of which most of the products held are not measured at fair value. As part of measuring interest rate risk in the banking book, MUFG and the major banking subsidiaries monitor the “out-lier ratio,” the ratio of expected losses resulting from an interest rate shock in a certain range to capital. The capital is broadly defined as the sum of Tier 1 + Tier 2 capital. In case an outlier ratio for a bank exceeds 20%, the FSA, as part of its early warning framework, will conduct a preliminary interview with the bank to determine the appropriateness of bank’s risk manage-ment and its improvement measures, if any. However, an outlier ratio of over 20% does not necessarily mean that a manage-ment improvement order is immediately issued by the FSA.
Backtesting
We conduct backtesting in which a VaR is compared with hypothetical profits and losses on a daily basis to verify the accuracy of our VaR measurement model. We also conduct additional backtesting using other methods, including testing VaR against actual realized and unrealized losses and testing VaR by various changing parameters such as confidence intervals and observation periods used in the model.
Please see page 87, “Results of market risk backtesting and explanations of any actual trading losses significantly in excess of VaR.”

23 Basel III Disclosure Fiscal 2014
Stress Testing
We use the HS-VaR model, which calculates potential changes in the market value of our portfolio as a statistically possible amount of losses that could be incurred due to market fluctuations within a certain period (or holding period, of 10 business days) based on historical market volatility for a certain period (or observation period, of 701 business days, or approximately three years). Actual losses may exceed the value at risk obtained by the application of the model in the event, for example, that the market fluctuates to a degree not accounted for in the observation period, or that the correlations among various risk factors, including interest rates and foreign currency exchange rates, deviate from those assumed in the model.
In order to complement these weaknesses of the HS-VaR model and measure potential losses that the model is not designed to capture, we conduct stress testing. For example, we measure on a quarterly basis potential losses that could be incurred in our portfolio by applying various stress scenarios, including the 10-year most extreme movement in each of the risk factors as well as actual past market movement observed beyond the 10 year historical observation period. In addition, the holding company and major subsidiaries conduct stress testing, as appropriate, by applying various stress scenarios, including those which take into account estimates regarding future market volatility, in order to better identify risks and manage our portfolio in a more stable and appropriate manner. Since October 2011, the holding company and major subsidiaries have also been measuring stressed VaR relating to their trading activities based on a one-year observation period with the highest VaR at least in the immediately preceding ten years.
LIQUIDITY RISK MANAGEMENT
Liquidity risk is the risk of incurring losses if a poor financial position hampers the ability to meet funding requirements, or necessitates fund procurement at interest rates markedly higher than normal.
Our major subsidiaries maintain appropriate liquidity in both Japanese yen and foreign currencies by managing their funding sources and mechanisms, such as liquidity gap, liquidity-supplying products such as commitment lines, and buffer assets.
We have established a group-wide system for managing liquidity risk by categorizing the risk in the following three stages: Normal, With-Concern, and Critical. The front offices and risk management offices of the major subsidiaries and the holding company exchange information and data on liquidity risk even at the Normal stage. At higher alert stages, we centralize information about liquidity risk and discuss issues relating to group-wide liquidity control actions among group companies, if necessary. We have also established a system for liaison and consultation on funding in preparation for contin-gency, such as natural disasters, wars and terrorist attacks. The holding company and the major subsidiaries conduct group-wide contingency preparedness drills on a regular basis to ensure smooth implementation in the event of an emergency.

24 Basel III Disclosure Fiscal 2014
OPERATIONAL RISK MANAGEMENT
Operational risk refers to the risk of loss caused by either internal control issues such as inadequate operational processes or misconduct, system failures, or external factors such as serious political instability, major terrorist activity, health epidemics or natural disasters. The term includes a broad range of risks that could lead to losses, including operations risk, information asset risk, tangible asset risk, personnel risk, legal risk and reputation risk. These risks that comprise operational risk are referred to as sub-category risks.
The holding company has established, based on its Executive Committee’s determination, the MUFG Operational Risk Management Policy as a group-wide policy for managing operational risk. This policy sets forth the core principles regarding operational risk management, including the definition of operational risk, and the risk management system and processes. The policy also requires the board of directors and the Executive Committee to formulate fundamental principles of operational risk management and establish and maintain an appropriate risk management system. The Chief Risk Management Officer is responsible for recognizing, evaluating, and appropriately managing opera-tional risk in accordance with the fundamental principles formulated by the board of directors and the Executive Committee. A division in charge of operational risk management has been established that is independent of business promotion sections to manage overall operational risk in a comprehensive manner. These fundamental principles have also been approved by the boards of directors of the major subsidiaries, providing a consistent framework for operational risk management of the Group.
As set forth in the following diagram, we have established a risk management framework for loss data collection, control self assessment, or CSA, and measurement of operational risk in order to appropri-ately identify, recognize, evaluate, measure, control, monitor and report operational risk.
We have also established group-wide reporting guidelines with respect to loss data collection and its monitoring. We focus our efforts on ensuring accurate assessment of the status of operational risk losses and the implementation of appropriate countermeasures, while maintaining databases of internal and external loss events.
Board of Directors / Executive CommitteeCommittees regarding risk management
Reporting on risk profile Instruction
Division in charge of Operational Risk Management
Coordination
Divisions in charge of Sub-category Risk Management
Reporting
InstructionHead Office
and Branches
Operational Risk Management System of Our Major Banking Subsidiaries

25 Basel III Disclosure Fiscal 2014
Identify and recognize Evaluate and measure Control Monitor and report
Causal analysis Implement preventive measures MonitoringIncident occurred
Record Major incidents and misconduct
Prompt reporting to the management
and relevant supervisors
Create potential loss scenario
Risk measurementAllocate economic capital to business units / subsidiaries
Internal loss data
External loss data
Risk evaluation and management through Control Self-Assessment
Monitoring of economic capital
Operational Risk Management Framework
Operations Risk Management
Operations risk refers to the risk of loss that is attributable to the actions of executives or employees, whether accidental or the result of neglect or deliberate misconduct. The Group companies offer a wide range of financial services, ranging from commercial banking products such as deposits, exchange services and loans to trust and related services covering pensions, securities, real estate and securitization, as well as transfer agent services. Cognizant of the potentially significant impact that operations risk-related events could have in terms of both economic losses and damage to our reputation, our banking subsidiaries continue to improve their management systems to create and apply appropriate operations risk-related controls.
Specific ongoing measures to reduce operations risk include the development of databases to manage, analyze and prevent the recurrence of related loss events; efforts to tighten controls over administrative procedures and related operating authority, while striving to improve human resources management; investments in systems to improve the efficiency of administrative operations; and programs to expand and upgrade internal auditing and operational guidance systems.
Senior management receives regular reports on the status of our businesses from an operations risk management perspective. We work to promote the sharing within the Group of information and exper-tise concerning any operational incidents and the measures implemented to prevent any recurrence.
Efforts to upgrade the management of operations risk continue with the aim of providing our customers with a variety of high-quality services.

26 Basel III Disclosure Fiscal 2014
Information Asset Risk Management
Information asset risk refers to the risk of loss caused by loss, alteration, falsification or leakage of information, or by destruction, disruption, errors or misuse of information systems, as well as risks similar to this risk. In order to ensure proper handling of information and prevent loss or leakage of information, our major banking subsidiaries strive to better manage and reduce such risks through the appointment of managers with specific responsibilities for information security issues, the establishment of internal procedures, training courses designed for all staff, and the implementa-tion of measures to ensure stable IT systems control. We have also formulated the Personal Information Protection Policy as the basis for ongoing programs to protect the confidentiality of personal information.
Systems planning, development and operations include appropriate design and extensive testing phases to ensure that systems are designed to help prevent failures while providing sufficient safe-guards for the security of personal information. The status of the development of any mission-critical IT systems is reported regularly to senior management. We have developed disaster countermea-sures systems and have also been investing in duplication of the Group’s IT infrastructure to mini-mize damage in the event of any system failure. Emergency drills are conducted to help increase staff preparedness.
With the aim of preventing any recurrence, we also work to promote sharing of information within the Group related to the causes of any loss or leakage of information, or system failure.
Tangible Asset Risk Management
Tangible asset risk refers to the risk of loss due to damage to tangible assets or deterioration in the operational environment caused by disasters or inadequate asset maintenance, as well as risks similar to this risk. Tangible assets include movable physical properties and immovable properties, owned or leased, such as land, buildings, equipment attached to buildings, fixtures and furniture. We recognize the potentially significant impact tangible asset risk-related events can have on the management and execution of the Group’s businesses, which in turn can result in economic losses to, or diminished market confidence in, the Group. Accordingly, we continue to improve our risk control framework designed to appropriately manage such risk.
Personnel Risk Management
Personnel risk refers to the risk of loss due to an outflow or loss of human resources or deterioration in employee morale, as well as risks similar to this risk. We recognize the potentially significant impact personnel risk-related events can have on the management and execution of the Group’s businesses, which in turn can result in economic losses to, or diminished market confidence in, the Group. Accordingly, we continue to improve our risk control framework designed to appropriately manage such risk.

27 Basel III Disclosure Fiscal 2014
Legal Risk Management
Legal risk refers to the risk of loss due to failure to comply with applicable laws and regulations, adequately evaluate contractual rights and obligations, or appropriately deal with disputes, as well as other similar risks. We recognize the potentially significant impact legal risk-related events can have on the management and execution of the Group’s businesses, which in turn can result in economic, reputation and other losses to, or diminished market confidence in, the Group. Accordingly, we continue to improve our risk control framework designed to appropriately manage such risk.
Specifically, in order to promote compliance, we have established our Principles of Ethics and Conduct as the basic legal compliance policy for the Group’s directors and employees. In addition, a compliance management division has been established at each of the holding company and the major subsidiaries. Moreover, the legal division at each of the holding company and the major subsidiaries centrally and uniformly evaluates legal issues prior to entering into contracts, deals with disputes and manages other legal matters. Through these and other measures, we endeavor to effectively manage our legal risk.
Reputation Risk Management
Reputation risk refers to the risk of loss due to deterioration in reputation as a consequence of the spread of rumors among customers or in the market, or as a consequence of our inadequate response to particular situations, as well as risks similar to this risk. We recognize the potentially significant impact reputation riskrelated events can have on the management and execution of the Group’s businesses, which in turn can result in economic losses to, or diminished market confidence in, the Group. Accordingly, we continue to improve our risk control framework designed to appropri-ately manage such risk.
Specifically, in order to manage our reputation risk effectively on a group-wide basis, we have estab-lished a risk management system designed to ensure mutual consultation and reporting if a reputation risk-related event occurs or is anticipated and, through this system, share relevant information within the Group.
Through the risk control framework and risk management system, we seek to minimize damage to the reputation and credibility of, and the market confidence in, the Group by promptly obtaining an accu-rate understanding of relevant facts relating to reputation risk-related events and disclosing informa-tion concerning the events and the measures we take in response to such events in an appropriate and timely manner.

28 Basel III Disclosure Fiscal 2014
Regulatory Capital Requirements for Operational Risk
(1) Adoption of the Advanced Measurement Approach (AMA) We have employed the AMA since March 31, 2012, in place of the Standardized Approach that
we had been using previously, for calculation of the operational risk equivalent amount in connection with measuring capital adequacy ratios based on the Basel Standards. On the other hand, we use the Basic Indicator Approach, or BIA, for entities that are deemed to be less important in the calculation of the operational risk equivalent amount and for entities that are still preparing to implement the AMA.
(2) Outline of AMA We have established a measurement model designed to account for four data elements—
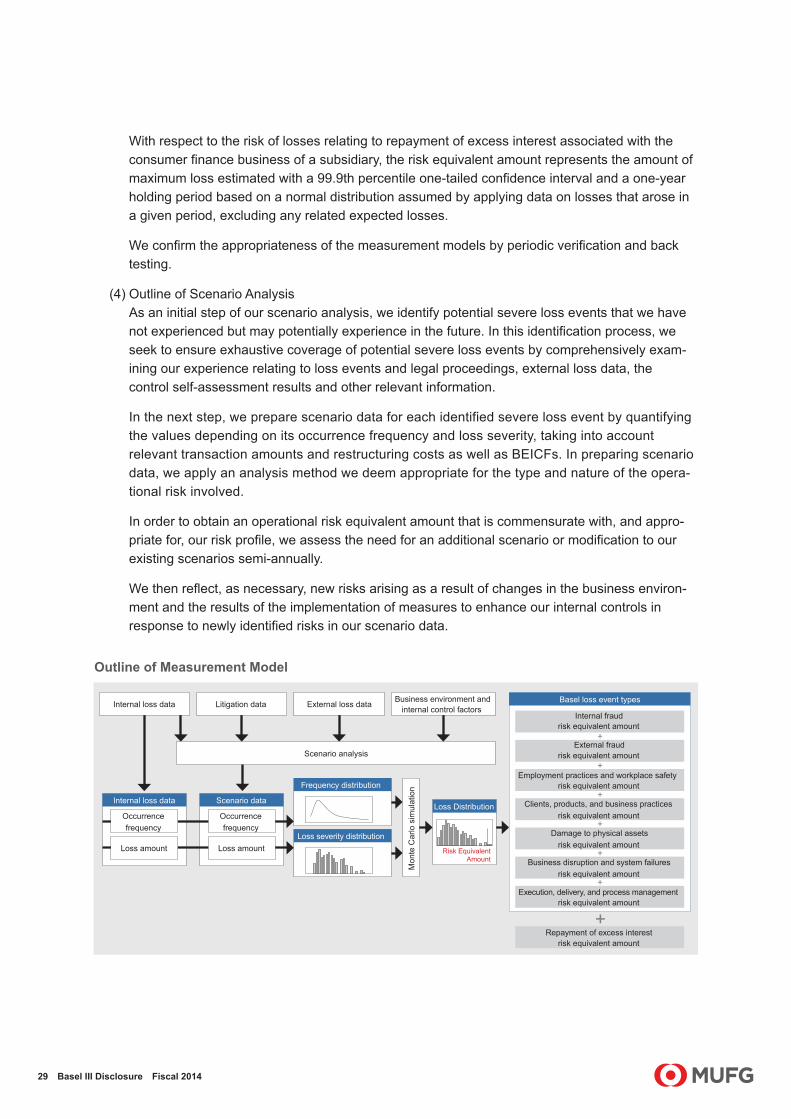
internal loss data, external loss data, scenario analysis, and business environment and internal control factors, or BEICFs—and calculate the operational risk equivalent amount by estimating the maximum loss using a 99.9th percentile onetailed confidence interval and a one-year holding period.
In calculating the operational risk equivalent amount, we exclude expected losses relating to the amount of allowance for repayment of excess interest associated with the consumer finance business of a subsidiary. We do not exclude any other expected losses and do not reflect the risk mitigating impact of insurance. In addition, we take into account credit risk-related events that are not reflected in the measurement of the credit risk equivalent amount.
(3) Outline of Measurement Model Our operational risk equivalent amount measured under the AMA is a simple sum of the
amounts calculated separately for BTMU on a consolidated basis, MUTB on a consolidated basis, and the total amount for other Group companies (including the holding company, MUSHD and Mitsubishi UFJ NICOS). For each of BTMU and MUTB on consolidated basis, the operational risk equivalent amount is a simple sum of the amounts calculated based on the seven loss event types defined by the Basel Standards. For other Group companies, the operational risk equivalent amount is a simple sum of the amounts calculated based on eight loss event types consisting of the seven loss event types defined by the Basel Standards and an additional loss event type representing losses relating to repayment of excess interest associated with the consumer finance business of a subsidiary. We do not reflect the correlation effects among the loss event types in the calculation of our operational risk equiv-alent amount.
The risk equivalent amount for each loss event type represents the amount of maximum loss estimated with a 99.9th percentile one-tailed confidence interval and a one-year holding period based on the distribution of losses arising from all relevant risk events for a one-year period (Loss Distribution). A Loss Distribution combines a Frequency Distribution (through which the frequency of occurrence of risk events is expressed) and a Loss Severity Distribution (through which the amounts of losses resulting from risk events are expressed) through Monte Carlo simulations. The data used for this purpose include internal loss data and scenario data. Scenario data are generated through a scenario analysis. External data and BEICFs are taken into account in the scenario analysis and reflected in scenario data. The Frequency Distribution is derived from the occurrence frequency information in internal loss data and scenario data expressed through a Poisson Distribution. The Loss Severity Distribution is derived from the amount information in internal loss data and scenario data expressed in a non-parametric manner (where no underlying distribution is assumed).
29 Basel III Disclosure Fiscal 2014
With respect to the risk of losses relating to repayment of excess interest associated with the consumer finance business of a subsidiary, the risk equivalent amount represents the amount of maximum loss estimated with a 99.9th percentile one-tailed confidence interval and a one-year holding period based on a normal distribution assumed by applying data on losses that arose in a given period, excluding any related expected losses.
We confirm the appropriateness of the measurement models by periodic verification and back testing.
(4) Outline of Scenario Analysis As an initial step of our scenario analysis, we identify potential severe loss events that we have
not experienced but may potentially experience in the future. In this identification process, we seek to ensure exhaustive coverage of potential severe loss events by comprehensively exam-ining our experience relating to loss events and legal proceedings, external loss data, the control self-assessment results and other relevant information.
In the next step, we prepare scenario data for each identified severe loss event by quantifying the values depending on its occurrence frequency and loss severity, taking into account relevant transaction amounts and restructuring costs as well as BEICFs. In preparing scenario data, we apply an analysis method we deem appropriate for the type and nature of the opera-tional risk involved.
In order to obtain an operational risk equivalent amount that is commensurate with, and appro-priate for, our risk profile, we assess the need for an additional scenario or modification to our existing scenarios semi-annually.
We then reflect, as necessary, new risks arising as a result of changes in the business environ-ment and the results of the implementation of measures to enhance our internal controls in response to newly identified risks in our scenario data.
+
+
+
+
+
+
+
Internal loss data Litigation data External loss data Business environment and internal control factors
Scenario analysis
Internal loss data Scenario data
Occurrencefrequency
Occurrencefrequency
Loss amount Loss amountLoss severity distribution
Frequency distribution
Loss Distribution
Mon
te C
arlo
sim
ulat
ion
Risk EquivalentAmount
Repayment of excess interest risk equivalent amount
Execution, delivery, and process management risk equivalent amount
Business disruption and system failures risk equivalent amount
Damage to physical assets risk equivalent amount
Clients, products, and business practices risk equivalent amount
Employment practices and workplace safety risk equivalent amount
External fraud risk equivalent amount
Internal fraud risk equivalent amount
Basel loss event types
Outline of Measurement Model

30 Basel III Disclosure Fiscal 2014
Basic Policy
We have clarified our mission, our vision and our values in the Corporate Vision and have expressed our commitment to meeting the expectations of customers and society as a whole. Furthermore, we have established Principles of Ethics and Conduct as the guidelines for how the Group’s directors and employees act to realize the Corporate Vision, in which we have expressed our commitment to complying with laws and regulations, to acting with honesty and integrity, and to behaving in a manner that supports and strengthens the trust and confidence of society.
In addition, as we expand the geographic scope of our business globally, we are committed to keeping abreast with developments in laws and regulations of the jurisdictions in which we operate including anti-money laundering and anti-bribery, as well as paying attention to trends in financial crimes.
Principles of Ethics and Conduct
IntroductionThese Principles of Ethics and Conduct establish clear and consistent standards for all MUFG employees to guide decisions and actions. They reflect and support the MUFG Corporate Vision. The principles are organized in three sections. Chapter 1 presents the attitude that we adopt with our customers, to act with honesty and integrity and pursue their best interests, which is a core compo-nent of our business practices. Chapter 2 presents a set of standards to help us fulfill our responsibili-ties as a good corporate citizen. MUFG’s reputation depends upon the trust and confidence of our customers and other stakeholders, including local communities, and we are responsible to society on a global level. Chapter 3 describes the actions and mindset that will create a stimulating and supportive working environment as MUFG continues to grow. Our success depends on building and maintaining a dynamic workplace where all employees can reach their full potential in ways that support our customers and contribute to society as a whole.
Outline / OverviewChapter 1 Customer FocusWe place our diverse customers at the center of all our activities and always act in their best interests. MUFG is able to thrive today because of the trust and confidence that customers have placed in us—the result of years of fair, transparent, and honorable dealings. Our business culture is not driven by the prospect of shortterm, immediate gains. Instead, we place a premium on supporting long-term, sustainable relationships with our customers to help them meet their goals.
1-1. Acting with Honesty and IntegrityWe always place our diverse customers at the center of all activities and act with honesty and integrity in all of our dealings with them. We protect customer assets, including their personal information, and strive at all times not to damage their interests.
1-2. Controlling QualityIn order to earn the lasting trust and confidence of our customers, we maintain thorough quality control of our products and services in all aspects from product design and development to delivery, and continually improve our processes to provide accurate and secure transactions.
1-3. Exceeding Customer ExpectationsWe strive to satisfy the diverse needs of our customers worldwide and to exceed their expectations through the highest standards of professionalism and by effectively leveraging our global network and consolidated strength.
Compliance
31 Basel III Disclosure Fiscal 2014
Chapter 2 Responsibility as a Corporate CitizenAs a member of MUFG with global operations, we act honorably, with honesty and integrity, and comply at all times with laws, regulations, rules, and internal policies globally. We strive to maintain stability and confidence in the global financial system and to contribute to the sound growth and development of society. We behave in a manner that supports and strengthens the trust and confi-dence that MUFG has built up over the years.
2-1. Adherence to Laws and RegulationsWe always judge and act with honesty and integrity, do what is right, and comply with both the letter and the spirit of the laws, regulations, and rules that apply to us. We avoid insider trading, do not engage in anticompetitive conduct or any form of corrupt activity, and publicly disclose corporate information in an appropriate manner.
2-2. Combating Criminal ActivityWe do not conduct business with criminal elements. We do not allow our financial products and services to be used for illegal or improper activities such as money laundering, fraud, or financing terrorist activities.
2-3. Commitment to Social SustainabilityWe respect the history, culture, and customs of local communities and strive to contribute to their development and the protection of the environment through our corporate activities and employee volunteer efforts.
Chapter 3 Ethical and Dynamic WorkplaceWe are committed to creating a working environment that fosters mutual respect among MUFG employees, supports the full expression of our individuality as professionals, promotes the power of teamwork, honors diversity, transcends differences, and embraces new challenges.
3-1. Stimulating WorkplaceWe strive to enhance our knowledge and expertise, focus on maximizing the value of teamwork, and view changes in the business environment as opportunities to launch new initiatives.
3-2. Ethical WorkplaceWe respect the diversity and human rights of all MUFG employees. We do not engage in or tolerate discrimination, harassment, intimidation, or any other behavior or activity that is inconsistent with these core beliefs. We report any violations of laws and rules, and we manage corporate assets appropriately.

32 Basel III Disclosure Fiscal 2014
Compliance Framework
Management and coordination of compliance-related matters are the responsibility of separate compliance management divisions established at the holding company and the major subsidiaries. Each compliance management division formulates compliance programs and organizes training courses to promote compliance, and regularly reports to each company’s board of directors and Executive Committee on the status of compliance activities.
The holding company has established a Group Compliance Committee and each major subsidiary has established a Compliance Committee for deliberating key issues related to compliance. Additionally, the holding company has a Group Chief Compliance Officer, or CCO, Committee, which consists of the CCO of the holding company acting as committee chairman and the CCOs of the major subsidiaries. The Group CCO Committee deliberates important matters related to compliance and compliance-related issues for which the Group should share a common understanding.
Internal Reporting System and Accounting Auditing Hotline
The major subsidiaries have established internal reporting systems that aim to identify compliance issues early so that any problems can be quickly rectified. This system includes an independent external compliance hotline. Furthermore, the holding company has set up an MUFG Group Compliance Helpline that acts in parallel with group-company internal reporting systems and provides a reporting channel for directors and employees of group companies.
In addition to these internal reporting systems, the holding company has also established an accounting auditing hotline that provides a means to report any problems related to MUFG accounting.
Holding Company (MUFG)
Board of Directors Audit Committee
Executive Committee
CCO (Chief Compliance Officer)
Group Compliance Committee
Group CCO Committee
Compliance Division (Coordinates compliance issues)
Guidance, advice and instruction
Consultation and report
Bank of Tokyo-Mitsubishi UFJ Mitsubishi UFJ Trust and Banking Mitsubishi UFJ Securities Holdings Other subsidiaries
Group Companies
Compliance Framework

33 Basel III Disclosure Fiscal 2014
MUFG Accounting Auditing Hotline
MUFG has set up an accounting auditing hotline to be used to make reports related to instances of improper practices (violations of laws and regulations) and inappropriate practices, or of practices raising questions about such impropriety or inappropriateness, regarding accounting and internal control or audits related to accounting in Group companies. The reporting process works as follows, and may be carried out via letter or e-mail:
Hokusei Law Office, P.C.Address: Kojimachi 4-3-4, Chiyoda-ku, TokyoE-mail: [email protected]
When reporting information please pay attention to the following:• Matters subject to reporting are limited to instances regarding MUFG Group companies.• Please provide detailed information with respect to the matter. Without detailed factual information there is a limit to how
much our investigations can achieve.• Anonymous information will be accepted.• No information regarding the identity of the informant will be passed on to third parties without the approval of the informant
him- or herself. However, this excludes instances where disclosure is legally mandated, or to the extent that the information is necessary for surveys or reports, when data may be passed on following the removal of the informant’s name.
• Please submit reports in either Japanese or English.• If the informant wishes, we will endeavor to report back to the informant on the response taken within a reasonable period
of time following the receipt of specific information, but cannot promise to do so in all instances.
BTMU Reaches Settlement with New York State Department of Financial Services
In November 2014, BTMU entered into a consent agreement with the New York State Department of Financial Services, or DFS, to resolve issues relating to instructions given to PricewaterhouseCoopers LLP, or PwC, and the disclosures made to DFS in connection with BTMU’s 2007 and 2008 voluntary investigation of BTMU’s U.S. dollar clearing activity toward countries under U.S. economic sanctions. BTMU had hired PwC to conduct a historical transaction review report in connection with that investi-gation, and voluntarily submitted the report to DFS’s predecessor entity in 2008. Under the terms of the agreement with DFS, BTMU made a payment of $315 million to DFS, and agreed to take actions on persons involved in the matter at that time, relocate its U.S. Bank Secrecy Act/Anti-Money Laundering, or BSA/AML, and Office of Foreign Assets Control, or OFAC, sanctions compliance programs to New York, and extend, if regarded as necessary by DFS, the period during which an independent consultant is responsible for assessing BTMU’s internal controls regarding compliance with applicable laws and regulations related to U.S. economic sanctions. In June 2013, BTMU reached an agreement with DFS regarding inappropriate operational processing of U.S. dollar clearing transactions with countries subject to OFAC sanctions during the period of 2002 to 2007. Under the terms of the June 2013 agreement, BTMU made a payment of $250 million to DFS and retained an independent consultant to conduct a compliance review of the relevant controls and related matters in BTMU’s current operations. In December 2012, BTMU agreed to make a payment of approximately $8.6 million to OFAC to settle potential civil liability for apparent violations of certain U.S. sanctions regulations from 2006 to 2007. BTMU continues to cooperate closely with all relevant regulators and is undertaking necessary actions.
kabu.com Securities Received a Business Improvement Order from FSA
In May 2015, kabu.com Securities. Co., Ltd., a securities subsidiary in Japan, received a business improvement order from the FSA under Article 51 of the Financial Instruments and Exchange Act for failing to appropriately operate and manage its information and communication systems. In response to the administrative order, kabu.com Securities submitted to the FSA and announced a business improvement plan in June 2015.

34 Basel III Disclosure Fiscal 2014
In accordance with the provisions of Article 52-25 of the Banking Law of Japan, Mitsubishi UFJ Financial Group (MUFG) adopts the “International regulatory framework” to calculate its capital ade-quacy ratio based on formulas contained in the standards for the consolidated capital adequacy ratio of bank holding companies (Notification of the Financial Services Agency No. 20, 2006; referred to hereinafter as the “FSA Holding Company Capital Adequacy Notification”) to assess capital adequacy in light of the assets we own on a consolidated basis.
With regard to the calculation of the consolidated capital adequacy ratio, MUFG received an indepen-dent audit by Deloitte Touche Tohmatsu (DTT) LLC in accordance with “Treatment of Inspection of the Capital Ratio Calculation Framework Based on Agreed-Upon Procedures” (JICPA Industry Committee Report No. 30). With regard to part of the internal controls structure governing calculation of the con-solidated capital adequacy ratio, MUFG received a report from DTT LLC, which conducted certain procedures as deemed necessary by MUFG. The procedures conducted by the independent auditor were not part of an accounting audit of the consolidated financial statements, and we did not receive any audit opinion with regard to our internal controls structure governing the calculation of the consoli-dated capital adequacy ratio or the related consolidated capital adequacy ratio.
Notes on the scope of consolidation
Differences between those companies belonging to the corporate group (here-inafter, the “holding company group”) to which the calculation of consolidated capital adequacy ratio as stipulated in Article 3 of the FSA Holding Company Capital Adequacy Notification is appli-cable and those companies that are included in the scope of consolidation for accounting purposes
Paragraph 1 of Article 3 of the FSA Holding Company Capital Adequacy Notification states that “the provisions of Paragraph 2 of Article 5 of the Japanese regulations pertaining to consolidated financial statements shall not apply” to “financial subsidiaries” of a bank holding company. Moreover, Paragraph 2 of the said Article 3 states that “insurance-related subsidiaries” of a bank holding com-pany “shall not be included in the scope of consolidation.”In addition, with regard to affiliated companies engaged in financial operations, the FSA Consolidated Capital Adequacy Notification states that, provided certain conditions are met, such companies “can be included in the scope of consolidation and in the calculation of the consolidated capital adequacy ratio using pro rata consolidation” (under which only those portions of the affiliated company’s assets, liabilities, income and expenditures that are attributable to the bank holding com-pany or any consolidated subsidiaries with investments in the said affiliated com-pany are included in the scope of consolidation).MUFG Group had no companies to which the above exception applied as of March 31, 2014, or March 31, 2015, and there were no differences between those companies belonging to the “holding company group” and those companies that are included in the “scope of consolidation for accounting purposes.”
Number of consolidated subsidiaries, and names and principal businesses of major consolidated subsidiaries of the holding company group
253 companies as of March 31, 2014; 226 companies as of March 31, 2015The Bank of Tokyo-Mitsubishi UFJ, Ltd. (banking business), Mitsubishi UFJ Trust and Banking Corporation (trust/banking business), Mitsubishi UFJ Securities Holdings Co., Ltd. (securities business), etc.
Number of affiliated companies engaged in financial operations which are subject to Article 9 of the FSA Holding Company Capital Adequacy Notification, and names, amounts of total assets and net assets shown on the balance sheet and principal businesses of affiliated compa-nies engaged in these financial operations
Not applicable as of March 31, 2014 and 2015
SCOPE OF CONSOLIDATION
Basel III Data (Consolidated)

35 Basel III Disclosure Fiscal 2014
Names, amounts of total assets and net assets shown on the balance sheet, and principal businesses of companies belonging to the holding company group that are not included in the scope of consolidation for accounting purposes, and of companies not belonging to the holding company group but included in the scope of consolidation for accounting purposes
Not applicable as of March 31, 2014 and 2015
Outline of restrictions on transfer of funds or equity capital within the holding company group
As of March 31, 2014 and 2015, transfer of funds or capital within the MUFG Group is conducted with all due consideration given to the appropriateness of each action. We give priority in ensuring that each group company maintains sufficient capital level for legal and regulatory compliance purposes. Care is also taken to ensure that actions do not compromise sound and proper operations, while eliminating negative effects on payment capacity, liquidity or profitability.
Companies that are deficient in regulatory capital and total regulatory capital deficiencies
Names of any other financial institutions, etc., classified as subsidiaries or other members of the bank holding company that are deficient in regulatory capital, and corresponding total regulatory capi-tal deficiencies
Not applicable as of March 31, 2014 and 2015

36 Basel III Disclosure Fiscal 2014
COMPOSITION OF EQUITY CAPITAL
Composition of Changes in Equity Capital Millions of yen
March 31, 2014 March 31, 2015Common Equity Tier 1 capital, beginning of period 10,300,557 11,153,032
Capital and capital surplus 2,564 (354,955)Retained earnings 765,149 827,284Treasury stock 230 (99,962)National specific regulatory adjustments (earnings to be distributed) (28,365) 10,264Subscription rights to common shares (151) (461)Accumulated other comprehensive income 341,952 1,253,757Common share capital issued by subsidiaries and held by third parties (amount allowed in group Common Equity Tier 1) 107,601 53,864
Amount included in Common Equity Tier 1 capital under transitional arrangements 3,846 (50,346)
Intangible assets (268,010) (190,794)Deferred tax assets that rely on future profitability excluding those arising from temporary differences (net of related tax liability) (1,015) (1,347)
Deferred gains or losses on derivatives under hedge accounting (6,165) (51,691)Securitization gain on sale (2,681) (2,771)Net defined benefit asset (59,030) (75,796)Investments in own shares (excluding those reported in the Net assets section) (3,448) (3,456)Others — —
Common Equity Tier 1 capital, end of period 11,153,032 12,466,619Additional Tier 1 capital, beginning of period 914,257 1,188,837
Directly issued qualifying Additional Tier 1 instruments plus related capital surplus of which: classified as equity under applicable accounting standards — —
Directly issued qualifying Additional Tier 1 instruments plus related capital surplus of which: classified as liabilities under applicable accounting standards — 100,000
Additional Tier 1 instruments issued by subsidiaries and held by third parties (amount allowed in group Additional Tier 1) 18,801 2,869
Eligible Tier 1 capital instruments subject to transitional arrangements (165,753) (165,753)Amount included in Additional Tier 1 capital under transitional arrangements 521,205 245,145Investments in own Additional Tier 1 instruments (43) (388)Significant investments in the capital of banking, financial and insurance entities that are outside the scope of regulatory consolidation (net of eligible short positions) (57) (179)
Amount excluded from additional Tier 1 capital under transitional arrangements (99,572) 293,190Others — —
Additional Tier 1 capital, end of period 1,188,837 1,663,721Tier 2 capital, beginning of period 3,459,135 3,052,471
Directly issued qualifying Tier 2 instruments plus related capital surplus of which: classified as liabilities under applicable accounting standards — 90,000
Tier 2 instruments issued by subsidiaries and held by third parties (amount allowed in group Tier 2) 19,774 (15,656)
Eligible Tier 2 capital instruments subject to transitional arrangements (264,997) (264,997)General allowance for credit losses and eligible provisions included in Tier 2 (5,358) 130,679Amount included in Tier 2 capital under transitional arrangements (182,862) 400,014Investments in own Tier 2 instruments (2,240) (5,792)Significant investments in the capital of banking, financial and insurance entities that are outside the scope of regulatory consolidation (net of eligible short positions) (1,085) (257)
Amount excluded from Tier 2 capital under transitional arrangements 30,106 35,528Others — —
Tier 2 capital, end of period 3,052,471 3,421,990Total capital, end of period 15,394,342 17,552,332

37 Basel III Disclosure Fiscal 2014
Composition of Capital Disclosure Millions of yen
Basel III Template No.
March 31, 2014 March 31, 2015
ItemsAmounts excluded under transitional arrangements
Amounts excluded under transitional arrangements
Common Equity Tier 1 capital: instruments and reserves (1)
1a+2–1c–26
Directly issued qualifying common share capital plus related capital surplus and retained earnings 10,819,854 / 11,202,486 /
1a of which: capital and capital surplus 3,924,872 / 3,569,917 /
2 of which: retained earnings 7,033,125 / 7,860,410 /
1c of which: treasury stock (1,699) / (101,661) /
26of which: national specific regulatory adjustments (earnings to be distributed) (136,444) / (126,179) /
of which: other than above — / — /
1b Subscription rights to common shares 8,732 / 8,271 /
3Accumulated other comprehensive income and other disclosed reserves 341,952 1,367,808 1,595,709 2,393,564
5
Common share capital issued by subsidiaries and held by third parties (amount allowed in group Common Equity Tier 1) 166,959 / 220,823 /
Total of items included in Common Equity Tier 1 capital: instruments and reserves subject to transitional arrangements 155,885 / 105,538 /
of which: common share capital issued by subsidiaries and held by third parties (amount allowed in group Common Equity Tier 1) 155,885 / 105,538 /
6Common Equity Tier 1 capital: instruments and reserves (A) 11,493,384 / 13,132,828 /
Common Equity Tier 1 capital: regulatory adjustments (2)
8+9
Total intangible assets (net of related tax liability, excluding those relating to mortgage servicing rights) 268,010 1,072,040 458,804 688,207
8 of which: goodwill (including those equivalent) 141,183 564,733 182,015 273,022
9of which: other intangibles other than goodwill and mortgage servicing rights 126,826 507,307 276,789 415,184
10
Deferred tax assets that rely on future profitability excluding those arising from temporary differences (net of related tax liability) 1,015 4,063 2,363 3,544
11Deferred gains or losses on derivatives under hedge accounting 6,165 24,662 57,856 86,785
12 Shortfall of eligible provisions to expected losses — — — —
13 Securitisation gain on sale 2,681 10,724 5,452 8,179
14Gains and losses due to changes in own credit risk on fair valued liabilities — — — —
15 Net defined benefit assets 59,030 236,120 134,827 202,240
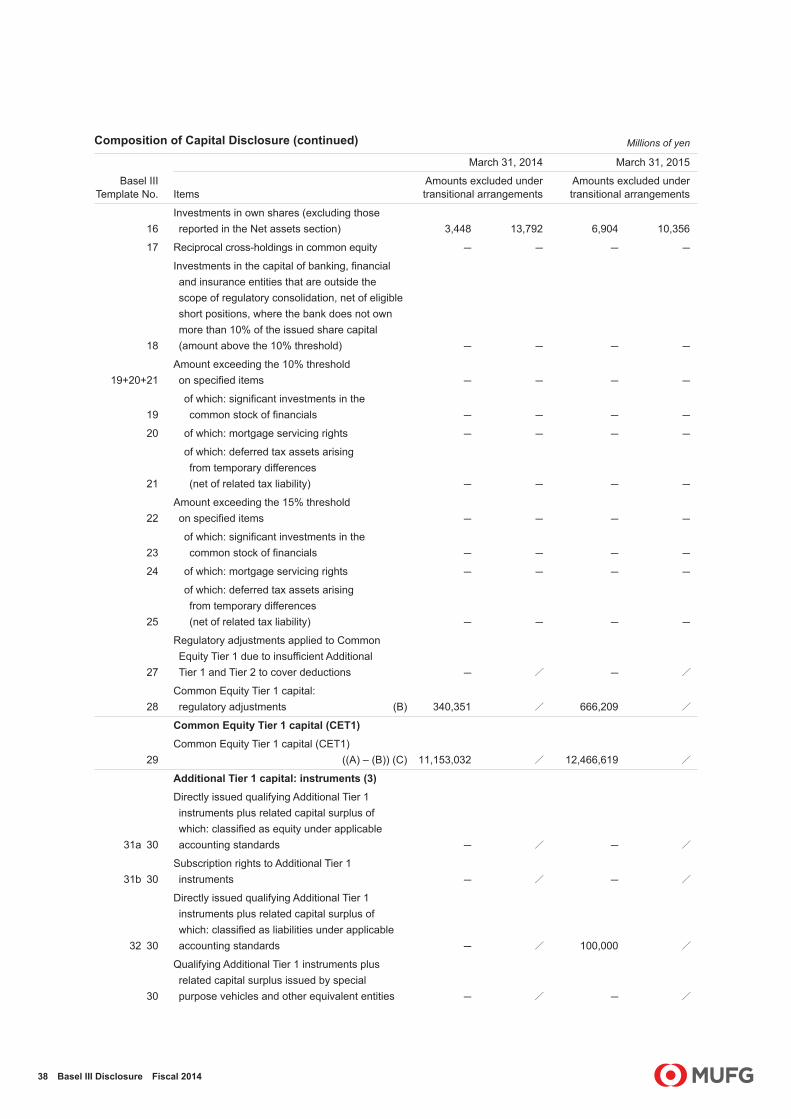
38 Basel III Disclosure Fiscal 2014
Composition of Capital Disclosure (continued) Millions of yen
Basel III Template No.
March 31, 2014 March 31, 2015
ItemsAmounts excluded under transitional arrangements
Amounts excluded under transitional arrangements
16Investments in own shares (excluding those reported in the Net assets section) 3,448 13,792 6,904 10,356
17 Reciprocal cross-holdings in common equity — — — —
18
Investments in the capital of banking, financial and insurance entities that are outside the scope of regulatory consolidation, net of eligible short positions, where the bank does not own more than 10% of the issued share capital (amount above the 10% threshold) — — — —
19+20+21Amount exceeding the 10% threshold on specified items — — — —
19of which: significant investments in the common stock of financials — — — —
20 of which: mortgage servicing rights — — — —
21
of which: deferred tax assets arising from temporary differences (net of related tax liability) — — — —
22Amount exceeding the 15% threshold on specified items — — — —
23of which: significant investments in the common stock of financials — — — —
24 of which: mortgage servicing rights — — — —
25
of which: deferred tax assets arising from temporary differences (net of related tax liability) — — — —
27
Regulatory adjustments applied to Common Equity Tier 1 due to insufficient Additional Tier 1 and Tier 2 to cover deductions — / — /
28Common Equity Tier 1 capital: regulatory adjustments (B) 340,351 / 666,209 /
Common Equity Tier 1 capital (CET1)
29Common Equity Tier 1 capital (CET1) ((A) – (B)) (C) 11,153,032 / 12,466,619 /
Additional Tier 1 capital: instruments (3)
31a 30
Directly issued qualifying Additional Tier 1 instruments plus related capital surplus of which: classified as equity under applicable accounting standards — / — /
31b 30Subscription rights to Additional Tier 1 instruments — / — /
32 30
Directly issued qualifying Additional Tier 1 instruments plus related capital surplus of which: classified as liabilities under applicable accounting standards — / 100,000 /
30
Qualifying Additional Tier 1 instruments plus related capital surplus issued by special purpose vehicles and other equivalent entities — / — /

39 Basel III Disclosure Fiscal 2014
Composition of Capital Disclosure (continued) Millions of yen
Basel III Template No.
March 31, 2014 March 31, 2015
ItemsAmounts excluded under transitional arrangements
Amounts excluded under transitional arrangements
34–35
Additional Tier 1 instruments issued by subsidiaries and held by third parties (amount allowed in group Additional Tier 1) 149,289 / 152,158 /
33+35
Eligible Tier 1 capital instruments subject to transitional arrangements included in Additional Tier 1 capital: instruments 1,326,024 / 1,160,271 /
33of which: instruments issued by bank holding companies and their special purpose vehicles 1,325,880 / 1,160,094 /
35
of which: instruments issued by subsidiaries (excluding bank holding companies’ special purpose vehicles) 144 / 177 /
Total of items included in Additional Tier 1 capital: instruments subject to transitional arrangements 325,783 / 570,928 /
of which: foreign currency translation adjustments 325,783 / 570,928 /
36 Additional Tier 1 capital: instruments (D) 1,801,097 / 1,983,359 /
Additional Tier 1 capital: regulatory adjustments
37 Investments in own Additional Tier 1 instruments 43 172 431 647
38Reciprocal cross-holdings in Additional Tier 1 instruments — — — —
39
Investments in the capital of banking, financial and insurance entities that are outside the scope of regulatory consolidation, net of eligible short positions, where the bank does not own more than 10% of the issued common share capital of the entity (amount above the 10% threshold) — — — —
40
Significant investments in the capital of banking, financial and insurance entities that are outside the scope of regulatory consolidation (net of eligible short positions) 57 230 237 355
Total of items included in Additional Tier 1 capital: regulatory adjustments subject to transitional arrangements 612,158 / 318,968 /
of which: goodwill (net of related tax liability, including those equivalent) 439,721 / 182,939 /
of which: other intangibles other than goodwill and mortgage servicing rights (net of related tax liability) 161,713 / 127,849 /
of which: securitisation gain on sale 10,724 / 8,179 /
42Regulatory adjustments applied to Additional Tier 1 due to insufficient Tier 2 to cover deductions — / — /
43Additional Tier 1 capital: regulatory adjustments (E) 612,259 / 319,637 /
Additional Tier 1 capital
44 Additional Tier 1 capital ((D) – (E)) (F) 1,188,837 / 1,663,721 /
Tier 1 capital (T1 = CET1 + AT1)
45 Tier 1 capital (T1 = CET1 + AT1) ((C) + (F)) (G) 12,341,870 / 14,130,341 /

40 Basel III Disclosure Fiscal 2014
Composition of Capital Disclosure (continued) Millions of yen
Basel III Template No.
March 31, 2014 March 31, 2015
ItemsAmounts excluded under transitional arrangements
Amounts excluded under transitional arrangements
Tier 2 capital: instruments and provisions (4)
46
Directly issued qualifying Tier 2 instruments plus related capital surplus of which: classified as equity under applicable accounting standards — / — /
46 Subscription rights to Tier 2 instruments — / — /
46
Directly issued qualifying Tier 2 instruments plus related capital surplus of which: classified as liabilities under applicable accounting standards — / 90,000 /
46
Qualifying Tier 2 instruments plus related capital surplus issued by special purpose vehicles and other equivalent entities — / — /
48–49
Tier 2 instruments issued by subsidiaries and held by third parties (amount allowed in group Tier 2) 57,609 / 41,953 /
47+49
Eligible Tier 2 capital instruments subject to transitional arrangements included in Tier 2: instruments and provisions 2,119,979 / 1,854,981 /
47of which: instruments issued by bank holding companies and their special purpose vehicles — / — /
49
of which: instruments issued by subsidiaries (excluding bank holding companies’ special purpose vehicles) 2,119,979 / 1,854,981 /
50Total of general allowance for credit losses and eligible provisions included in Tier 2 229,698 / 360,378 /
50aof which: provision for general allowance for credit losses 111,509 / 183,372 /
50b of which: eligible provisions 118,189 / 177,005 /
Total of items included in Tier 2 capital: instruments and provisions subject to transitional arrangements 775,922 / 1,175,937 /
of which: amounts equivalent to 45% of unrealized gains on other securities 671,425 / 1,108,553 /
of which: deferred gains or losses on derivatives under hedge accounting (8,111) / (16,590) /
of which: amounts equivalent to 45% of land revaluation excess 112,608 / 83,975 /
51 Tier 2 capital: instruments and provisions (H) 3,183,210 / 3,523,251 /
Tier 2 capital: regulatory adjustments
52 Investments in own Tier 2 instruments 2,240 8,962 8,033 12,049
53 Reciprocal cross-holdings in Tier 2 instruments — — — —

41 Basel III Disclosure Fiscal 2014
Composition of Capital Disclosure (continued) Millions of yen
Basel III Template No.
March 31, 2014 March 31, 2015
ItemsAmounts excluded under transitional arrangements
Amounts excluded under transitional arrangements
54
Investments in the capital of banking, financial and insurance entities that are outside the scope of regulatory consolidation, net of eligible short positions, where the bank does not own more than 10% of the issued common share capital of the entity (amount above the 10% threshold) — — — —
55
Significant investments in the capital banking, financial and insurance entities that are outside the scope of regulatory consolidation (net of eligible short positions) 1,085 4,343 1,343 2,015
Total of items included in Tier 2 capital: regulatory adjustments subject to transitional arrangements 127,411 / 91,883 /
of which: goodwill (net of related tax liability, including those equivalent) 125,011 / 90,083 /
of which: significant investments in the capital banking, financial and insurance entities that are outside the scope of regulatory consolidation (net of eligible short positions) 2,400 / 1,800 /
57 Tier 2 capital: regulatory adjustments (I) 130,738 / 101,260 /
Tier 2 capital (T2)
58 Tier 2 capital (T2) ((H) – (I)) (J) 3,052,471 / 3,421,990 /
Total capital (TC = T1 + T2)
59 Total capital (TC = T1 + T2) ((G) + (J)) (K) 15,394,342 / 17,552,332 /
Risk weighted assets (5)
Total of items included in risk weighted assets subject to transitional arrangements 593,134 / 499,134 /
of which: other intangibles other than goodwill and mortgage servicing rights (net of related tax liability) 345,594 / 287,334 /
of which: deferred tax assets that rely on future profitability excluding those arising from temporary differences (net of related tax liability) 4,063 / 3,544 /
of which: net defined benefit assets 236,120 / 202,240 /
of which: investments in own shares (excluding those reported in the Net assets section) 5,108 / 5,271 /
of which: significant investments in the capital banking, financial and insurance entities that are outside the scope of regulatory consolidation (net of eligible short positions) 2,248 / 743 /
60 Risk weighted assets (L) 99,754,058 / 112,315,287 /

42 Basel III Disclosure Fiscal 2014
Composition of Capital Disclosure (continued) Millions of yen
Basel III Template No.
March 31, 2014 March 31, 2015
ItemsAmounts excluded under transitional arrangements
Amounts excluded under transitional arrangements
Capital ratio (consolidated)
61Common Equity Tier 1 capital ratio (consolidated) ((C) / (L)) 11.18% / 11.09% /
62 Tier 1 capital ratio (consolidated) ((G) / (L)) 12.37% / 12.58% /
63 Total capital ratio (consolidated) ((K) / (L)) 15.62% / 15.62% /
Regulatory adjustments (6)
72
Non-significant investments in the capital of other financials that are below the thresholds for deduction (before risk weighting) 879,146 / 957,461 /
73
Significant investments in the common stock of other financials that are below the thresholds for deduction (before risk weighting) 706,928 / 798,418 /
74Mortgage servicing rights that are below the thresholds for deduction (before risk weighting) 245 / 788 /
75
Deferred tax assets arising from temporary differences that are below the thresholds for deduction (before risk weighting) 120,519 / 59,217 /
Provisions included in Tier 2 capital: instruments and provisions (7) /
76 Provisions (general allowance for credit losses) 111,509 / 183,372 /
77Cap on inclusion of provisions (general allowance for credit losses) 252,486 / 305,180 /
78
Provisions eligible for inclusion in Tier 2 in respect of exposures subject to internal ratings-based approach (prior to application of cap) (if the amount is negative, report as “nil”) 118,189 / 177,005 /
79Cap for inclusion of provisions in Tier 2 under internal ratings-based approach 379,301 / 407,392 /
Capital instruments subject to transitional arrangements (8)
82Current cap on AT1 instruments subject to phase out arrangements 1,326,024 / 1,160,271 /
83
Amount excluded from AT1 due to cap (excess over cap after redemptions and maturities) (if the amount is negative, report as “nil”) 413,312 / 79,773 /
84Current cap on T2 instruments subject to transitional arrangements 2,119,979 / 1,854,981 /
85
Amount excluded from T2 due to cap (excess over cap after redemptions and maturities) (if the amount is negative, report as “nil”) 56,231 / 67,293 /
Note: Capital instruments, approved by the commissioner of Japanese Financial Services Agency, subject to the provision to Paragraph 12 of Article 8 of the notification of Japanese Financial Services Agency No. 20, 2006, hereinafter referred to as the “FSA Consolidated Capital Adequacy Notification,” are excluded from the calculation of figures stipulated in Paragraph 8 of Article 8, 9-1, and 10-1 of FSA Consolidated Capital Adequacy Notification, for 10 years from March 31, 2013 to March 30, 2023. The approved amount will decrease by 20% each year from March 31, 2019. The amount approved at the end of March, 2014 is 1,193,080 million yen and the amount approved at the end of March, 2015 is 1,392,328 million yen.

43 Basel III Disclosure Fiscal 2014
Explanation on reconciliation between balance sheet items and regulatory capital elements (March 31, 2014 and 2015)Notes: 1. The amounts in the “Composition of capital disclosure” are based on those before considering transitional arrangements and include “Amounts excluded under
transitional arrangements” disclosed in “Composition of Capital Disclosure” as wells as the amounts included in regulatory capital. In addition, items included in regulatory capital under transitional arrangements are excluded from this table.
2. As of March 31, 2014 and 2015, the regulatory scope of consolidation was the same as the accounting scope of consolidation.
1. Shareholders’ equity
(1) Consolidated balance sheetMillions of yen
Consolidated balance sheet item March 31, 2014 March 31, 2015 Remarks
Capital stock 2,140,488 2,141,513
Capital surplus 2,174,384 1,428,403
Retained earnings 7,033,125 7,860,410
Treasury stock (1,699) (101,661)
Total shareholders’ equity 11,346,299 11,328,666
(2) Composition of capitalMillions of yen
Composition of capital disclosure March 31, 2014 March 31, 2015 RemarksBasel III
Template No.
Directly issued qualifying common share capital plus related capital surplus and retained earnings
10,956,298 11,328,666
Shareholders’ equity attributable to common shares (before adjusting national specific regulatory adjustments (earnings to be distributed))
of which: capital and capital surplus 3,924,872 3,569,917 1a
of which: retained earnings 7,033,125 7,860,410 2
of which: treasury stock (1,699) (101,661) 1c
of which: other than above — —
Directly issued qualifying Additional Tier 1 instruments plus related capital surplus of which: classified as equity under applicable accounting standards — —
Shareholders’ equity attributable to preferred shares with a loss absorbency clause upon entering into effective bankruptcy 31a

44 Basel III Disclosure Fiscal 2014
2. Intangible assets
(1) Consolidated balance sheetMillions of yen
Consolidated balance sheet item March 31, 2014 March 31, 2015 Remarks
Intangible fixed assets 1,483,352 1,297,277
Securities 74,515,573 73,538,191
of which: goodwill attributable to equity-method investees 156,264 150,139 Goodwill attributable to equity-method investees
Income taxes related to above296,317 295,395
Income taxes related to intangibles other than goodwill and mortgage servicing rights
(2) Composition of capitalMillions of yen
Composition of capital disclosure March 31, 2014 March 31, 2015 RemarksBasel III
Template No.
Goodwill (net of related tax liability, including those equivalent) 705,916 455,038 8
Other intangibles other than goodwill and mortgage servicing rights (net of related tax liability) 634,134 691,974 9
Mortgage servicing rights 245 788
Amount exceeding the 10% threshold on specified items — — 20
Amount exceeding the 15% threshold on specified items — — 24
Mortgage servicing rights that are below the thresholds for deduction (before risk weighting) 245 788 74
3. Net defined benefit asset
(1) Consolidated balance sheetMillions of yen
Consolidated balance sheet item March 31, 2014 March 31, 2015 Remarks
Net defined benefit assets 460,836 504,761
Income taxes related to above 165,685 167,693
(2) Composition of capitalMillions of yen
Composition of capital disclosure March 31, 2014 March 31, 2015 RemarksBasel III
Template No.
Net defined benefit assets 295,150 337,067 15

45 Basel III Disclosure Fiscal 2014
4. Deferred tax assets
(1) Consolidated balance sheetMillions of yen
Consolidated balance sheet item March 31, 2014 March 31, 2015 Remarks
Deferred tax assets 130,654 114,919
Deferred tax liabilities 320,014 988,550
Deferred tax liabilities for land revaluation 155,026 138,669
Tax effects on other intangible fixed assets 296,317 295,395
Tax effects on net defined benefit assets 165,685 167,693
(2) Composition of capitalMillions of yen
Composition of capital disclosure March 31, 2014 March 31, 2015 RemarksBasel III
Template No.
Deferred tax assets that rely on future profitability excluding those arising from temporary differences (net of related tax liability) 5,079 5,907
This item does not agree with the amount reported on the balance sheet due to offsetting of assets and liabilities. 10
Deferred tax assets that rely on future profitability arising from temporary differences (net of related tax liability) 120,519 59,217
This item does not agree with the amount reported on the balance sheet due to offsetting of assets and liabilities.
Amount exceeding the 10% threshold on specified items — — 21
Amount exceeding the 15% threshold on specified items — — 25
Deferred tax assets arising from temporary differences that are below the thresholds for deduction (before risk weighting) 120,519 59,217 75

46 Basel III Disclosure Fiscal 2014
5. Deferred gains or losses on derivatives under hedge accounting
(1) Consolidated balance sheetMillions of yen
Consolidated balance sheet item March 31, 2014 March 31, 2015 Remarks
Net deferred gains (losses) on hedging instruments 8,295 83,194
(2) Composition of capitalMillions of yen
Composition of capital disclosure March 31, 2014 March 31, 2015 RemarksBasel III
Template No.
Deferred gains or losses on derivatives under hedge accounting
30,828 144,642
Excluding those items whose valuation differences arising from hedged items are recognized as “Accumulated other comprehensive income” 11
6. Items associated with investments in the capital of financial institutions
(1) Consolidated balance sheetMillions of yen
Consolidated balance sheet item March 31, 2014 March 31, 2015 Remarks
Trading assets19,055,354 20,810,617
Including trading account securities and derivatives for trading assets
Securities 74,515,573 73,538,191
Loans and bills discounted 101,938,907 109,368,340 Including subordinated loans
Other assets8,809,286 10,119,936
Including derivatives and investments in the capital
Trading liabilities13,964,961 15,521,917
Including trading account securities sold and derivatives for trading-assets
Other liabilities 5,965,086 9,530,371 Including derivatives

47 Basel III Disclosure Fiscal 2014
(2) Composition of capitalMillions of yen
Composition of capital disclosure March 31, 2014 March 31, 2015 RemarksBasel III
Template No.
Investments in own capital instruments 28,659 38,423
Common equity Tier 1 capital 17,240 17,260 16
Additional Tier 1 capital 215 1,079 37
Tier 2 capital 11,202 20,083 52
Reciprocal cross-holdings in the capital of banking, financial and insurance entities — —
Common equity Tier 1 capital — — 17
Additional Tier 1 capital — — 38
Tier 2 capital — — 53
Investments in the capital of banking, financial and insurance entities that are outside the scope of regulatory consolidation, net of eligible short positions, where the bank does not own more than 10% of the issued share capital (amount above 10% threshold) 879,146 957,461
Common equity Tier 1 capital — — 18
Additional Tier 1 capital — — 39
Tier 2 capital — — 54
Non-significant investments in the capital of other financials that are below the thresholds for deduction (before risk weighting) 879,146 957,461 72
Significant investments in the capital of banking, financial and insurance entities that are outside the scope of regulatory consolidation, net of eligible short positions 712,645 802,370
Amount exceeding the 10% threshold on specified items — — 19
Amount exceeding the 15% threshold on specified items — — 23
Additional Tier 1 capital 287 593 40
Tier 2 capital 5,429 3,358 55
Significant investments in the capital of financials that are below the thresholds for deduction (before risk weighting) 706,928 798,418 73

48 Basel III Disclosure Fiscal 2014
7. Minority interests
(1) Consolidated balance sheetMillions of yen
Consolidated balance sheet item March 31, 2014 March 31, 2015 Remarks
Minority interests 2,048,101 1,961,322
(2) Composition of capitalMillions of yen
Composition of capital disclosure March 31, 2014 March 31, 2015 RemarksBasel III
Template No.
Common share capital issued by subsidiaries and held by third parties (amount allowed in group CET1) 166,959 220,823
After reflecting amounts eligible for inclusion (after minority interest adjustments)
5
Qualifying Additional Tier 1 instruments plus related capital surplus issued by special purpose vehicles and other equivalent entities — —
After reflecting amounts eligible for inclusion (after minority interest adjustments)
30–31ab–32
Additional Tier 1 instruments issued by subsidiaries and held by third parties (amount allowed in group AT1) 149,289 152,158
After reflecting amounts eligible for inclusion (after minority interest adjustments)
34–35
Qualifying Tier 2 instruments plus related capital surplus issued by special purpose vehicles and other equivalent entities — —
After reflecting amounts eligible for inclusion (after minority interest adjustments)
46
Tier 2 instruments issued by subsidiaries and held by third parties (amount allowed in group Tier 2) 57,609 41,953
After reflecting amounts eligible for inclusion (after minority interest adjustments)
48–49

49 Basel III Disclosure Fiscal 2014
8. Other capital instruments
(1) Consolidated balance sheetMillions of yen
Consolidated balance sheet item March 31, 2014 March 31, 2015 Remarks
Borrowed money 10,828,601 13,866,196
Bonds payable 7,165,577 8,141,713
Total 17,994,178 22,007,910
(2) Composition of capitalMillions of yen
Composition of capital disclosure March 31, 2014 March 31, 2015 RemarksBasel III
Template No.
Directly issued qualifying Additional Tier 1 instruments plus related stock surplus of which: classified as liabilities under applicable accounting standards — 100,000 32
Directly issued qualifying Tier 2 instruments plus related stock surplus of which: classified as liabilities under applicable accounting standards — 90,000 46

50 Basel III Disclosure Fiscal 2014
CAPITAL ADEQUACY
Capital requirements for credit risk Billions of yen
March 31, 2014 March 31, 2015
Capital requirements for credit risk (excluding equity exposures under the IRB Approach and exposures relating to funds (Note 3)) 6,758.3 7,023.3
IRB Approach (excluding securitization exposures) 4,955.2 4,880.1
Corporate exposures (excluding specialized lending exposures subject to supervisory slotting criteria) 3,577.6 3,526.1
Corporate exposures (specialized lending exposures subject to supervisory slotting criteria) 29.4 37.2
Sovereign exposures 68.0 78.9
Bank exposures 217.8 251.2
Residential mortgage exposures 451.0 414.2
Qualifying revolving retail exposures 176.1 163.7
Other retail exposures 241.5 216.9
Exposures related to unsettled transactions 0.0 0.0
Exposures for other assets 193.4 191.4
Standardized Approach (excluding securitization exposures) 1,615.9 1,953.1
Securitization exposures (Note 4) 187.1 190.0
Portfolios under the IRB Approach 170.5 171.9
Portfolios under the Standardized Approach 16.5 18.0
Capital requirements for credit risk of equity exposures under the IRB Approach 885.2 1,160.7
Exposures subject to transitional arrangements (grandfathering provisions) (Note 5) 359.6 —
Market-Based Approach (Simple Risk Weight Method) (Note 6) 114.6 138.4
Market-Based Approach (Internal Models Method) (Note 6) — —
PD/LGD Approach (Note 6) 261.2 852.9
Exposures related to specific items related to components not included in survey items 149.7 169.4
Capital requirements for exposures relating to funds 238.8 270.5
Required capital for CVA risk 291.0 394.9
Required capital for credit risk associated with exposures relating to central clearing houses 28.3 43.4
Total 8,201.8 8,892.9
Notes: 1. Credit risk-weighted assets were calculated using the AIRB approach. However, as an exemption to this approach, the Standardized Approach is used for calculations with credit risk-weighted assets at some subsidiaries in cases where the figures for such subsidiaries are expected to be minor compared with the total. In addition, the adoption of the IRB approach is due to be phased in from the end of March 2018 at MUFG Americas Holdings Corporation and from the end of March 2019 at Bank of Ayudhya Public Company Limited.
2. Capital requirement for portfolios under the IRB Approach is calculated as “credit risk-weighted asset amount x 8% + expected losses.” In this calculation, the credit risk-weighted asset amount is multiplied by the scaling factor of 1.06. Capital requirements for portfolios under the Standardized Approach are calculated as “credit risk-weighted asset amount x 8%.”
3. Exposures to calculate the amount of credit risk-weighted assets as stipulated in Article 145 of the FSA Holding Company Capital Adequacy Notification. 4. Including amounts equivalent to increase in equity capital resulting from a securitization exposure, as a deduction from Tier 1 capital elements. 5. Exposures to calculate the amount of credit risk-weighted assets as stipulated in Article 13 of the Supplementary Provisions to the FSA Holding Company
Capital Adequacy Notification. 6. Exposures to calculate the amount of credit risk-weighted assets as stipulated in Article 144 of the FSA Holding Company Capital Adequacy Notification.

51 Basel III Disclosure Fiscal 2014
Capital requirements for market risk Billions of yen
March 31, 2014 March 31, 2015
Standardized Method 75.5 73.2
Interest rate risk 34.7 36.8
Equity position risk 34.3 30.8
Foreign exchange risk 6.4 5.4
Commodity risk 0.0 0.1
Options transactions — —
Internal Models Approach 111.7 127.6
Total 187.2 200.9
Note: As for market risk, the Internal Models Approach is mainly adopted to calculate general market risk (in some cases the Standardized Method is adopted) and the Standardized Method is adopted to calculate specific risk.
Capital requirements for operational risk Billions of yen
March 31, 2014 March 31, 2015
The Advanced Measurement Approach 332.8 382.6
The Standardized Approach — —
The Basic Indicator Approach 152.0 148.9
Total 484.9 531.5
Note: Operational risk was calculated using the Advanced Measurement Approach and Basic Indicator Approach.
Consolidated total capital requirement Billions of yen
March 31, 2014 March 31, 2015
Consolidated total capital requirements 7,980.3 8,985.2
8% of credit risk-weighted assets 7,040.1 7,863.3
8% of the amount included in risk weighted assets using transitional arrangements 47.4 39.9
Capital requirements for market risk 187.2 200.9
Capital requirements for operational risk 484.9 531.5
8% of the amount by which the capital floor value, which is obtained by multiplying the risk-weighted asset amount as calculated according to the Former Notification (Note) by a predetermined adjustment factor, exceeds the risk-weighted asset amount as calculated according to the FSA Consolidated Capital Adequacy Notification 267.9 389.3
Note: Hereafter, this refers to Ministry of Finance (MOF) Notification No. 62, 1998, which was based on the provisions of Article 52-25 of the Banking Law of Japan.

52 Basel III Disclosure Fiscal 2014
CREDIT RISK
Credit exposure(By customer segment) Trillions of yen
March 31, 2014 March 31, 2015
BTMU, MUTB, MUB 145.7 159.9
Corporate (Domestic) 51.8 53.4
Corporate (Foreign) 47.5 58.0
Americas 23.1 30.9
Europe 11.0 12.2
Asia 13.5 14.9
Others 46.3 48.5
For individuals 21.1 21.3
SL, securitization, etc. 16.8 19.4
Others 8.5 7.8
Other subsidiaries 10.2 12.7
MUFG consolidated total 155.9 172.6
(By account) Trillions of yen
March 31, 2014 March 31, 2015
Loans 96.8 104.7
Acceptances and guarantees 5.1 5.6
Foreign exchange 1.8 2.3
Revolving facilities (unused) 26.4 30.1
Market exposure 7.2 8.6
Private bonds 1.6 1.7
SL, securitization, etc. 16.8 19.4
Others 0.3 0.2
MUFG consolidated total 155.9 172.6
Notes: 1. The following abbreviations are used in the tables above: MUFG = Mitsubishi UFJ Financial Group, Inc. BTMU = The Bank of Tokyo-Mitsubishi UFJ, Ltd. MUTB = Mitsubishi UFJ Trust and Banking Corporation MUB = MUFG Union Bank, N.A. SL = Specialized Lending 2. Figures are presented on a managerial basis. Accordingly, they do not correspond to financial figures reported in the consolidated financial statements. 3. In the breakdown by customer segment, exposures extended to corporate customers by MUB are included in “Americas” under “Corporate (Foreign).” 4. In the breakdown by account, exposures at Mitsubishi UFJ Securities Holdings Co., Ltd. (MUSHD) are included in “Market exposure.”

53 Basel III Disclosure Fiscal 2014
Status of credit risk-weighted assets Billions of yen
March 31, 2014
EAD
Weighted average
PD
Weighted average
LGD Credit RWA
Weighted average
RW
Corresponding external credit
rating (Note 3)
Internal Ratings Based Approach 239,281.3 — — 67,209.2 28.1%
Of which, corporate and others 186,062.5 — — 38,264.1 20.6%
Of which, corporate exposure 81,721.1 3.0% 32.0% 34,565.3 42.3%
(Excluding specialized lending allocated to slot)
Of which, borrower rating 1–3 32,525.5 0.1% 34.8% 8,255.3 25.4%AAA/Aaa~
BBB–/Baa3
Borrower rating 4–9 43,381.6 0.8% 30.1% 20,923.5 48.2%BB+/Ba1~
B–/B3
Borrower rating 10–11 4,195.4 10.7% 25.5% 4,685.4 111.7% CCC+/Caa1~
Borrower rating 12–15 1,618.5 100.0% 39.3% 700.8 43.3%
Sovereign exposure 94,720.4 0.0% 36.4% 765.9 0.8%
Of which, borrower rating 1–3 94,141.5 0.0% 36.5% 509.5 0.5%AAA/Aaa~
BBB–/Baa3
Borrower rating 4–9 454.9 0.8% 29.8% 211.3 46.5%BB+/Ba1~
B–/B3
Borrower rating 10–11 105.7 14.9% 6.3% 37.0 35.0% CCC+/Caa1~
Borrower rating 12–15 18.1 100.0% 24.8% 7.9 43.8%
Financial institution exposure 9,319.9 0.3% 32.1% 2,616.4 28.1%
Of which, borrower rating 1–3 6,926.2 0.1% 32.3% 1,851.5 26.7%AAA/Aaa~
BBB–/Baa3
Borrower rating 4–9 2,308.0 0.3% 31.9% 640.1 27.7%BB+/Ba1~
B–/B3
Borrower rating 10–11 84.2 15.3% 26.2% 124.3 147.6% CCC+/Caa1~
Borrower rating 12–15 1.4 100.0% 79.0% 0.3 22.1%
Corporate exposure 300.9 — — 316.4 105.2%
(Excluding specialized lending allocated to slot)
Retail 21,484.7 3.8% 41.3% 6,354.4 29.6%
Equity and others 9,285.2 — — 12,136.0 130.7%
Others 22,448.9 — — 10,454.5 46.6%
Standardized approach (Note 4) 31,679.0 — — 20,198.9 63.8%
Of which, transitioned to IRB 16,920.3 — — 11,899.4 70.3%
Standardized approach 14,758.7 — — 8,299.5 56.2%
Total 270,960.4 — — 87,408.1 32.3%
Notes: 1. Figures for credit risk-weighted assets (RWA) are presented on a Basel III full implementation basis. Credit RWA under the transitional basis was ¥88,001.3 billion as of March 31, 2014.
2. The validity of risk parameters such as probability of default, or PD, loss given default, or LGD, or Exposure at Default, or EAD, are verified regularly (at least once a year) through back testing or comparative analysis with external sources.
3. The corresponding external credit ratings are presented in terms of rating symbols from S&P and Moody’s. 4. Securitization exposure is included in “Others” under the Internal Ratings Based Approach.

54 Basel III Disclosure Fiscal 2014
Status of credit risk-weighted assets (continued) Billions of yen
March 31, 2015
EAD
Weighted average
PD
Weighted average
LGD Credit RWA
Weighted average
RW
Corresponding external credit
rating (Note 3)
Internal Ratings Based Approach 268,918.2 — — 73,378.7 27.3%
Of which, corporate and others 209,973.4 — — 39,495.1 18.8%
Of which, corporate exposure 90,857.9 2.6% 31.8% 35,124.6 38.7%
(Excluding specialized lending allocated to slot)
Of which, borrower rating 1–3 40,036.1 0.1% 35.2% 9,777.5 24.4%AAA/Aaa~
BBB–/Baa3
Borrower rating 4–9 46,094.2 0.8% 29.4% 21,527.8 46.7%BB+/Ba1~
B–/B3
Borrower rating 10–11 3,032.6 10.5% 23.1% 3,157.8 104.1% CCC+/Caa1~
Borrower rating 12–15 16,949.0 100.0% 34.5% 661.4 39.0%
Sovereign exposure 108,172.9 0.0% 36.7% 942.6 0.9%
Of which, borrower rating 1–3 107,371.9 0.0% 36.8% 616.3 0.6%AAA/Aaa~
BBB–/Baa3
Borrower rating 4–9 703.2 0.6% 30.1% 280.6 39.9%BB+/Ba1~
B–/B3
Borrower rating 10–11 93.1 13.5% 9.1% 44.8 48.1% CCC+/Caa1~
Borrower rating 12–15 4.5 100.0% 9.8% 0.8 18.3%
Financial institution exposure 10,591.8 0.2% 31.5% 3,036.6 28.7%
Of which, borrower rating 1–3 7,625.6 0.1% 32.3% 2,065.9 27.1%AAA/Aaa~
BBB–/Baa3
Borrower rating 4–9 2,894.5 0.3% 29.4% 862.7 29.8%BB+/Ba1~
B–/B3
Borrower rating 10–11 70.2 14.0% 29.3% 107.6 153.2% CCC+/Caa1~
Borrower rating 12–15 1.4 100.0% 75.5% 0.3 25.4%
Corporate exposure 350.6 — — 391.2 111.6%
(Excluding specialized lending allocated to slot)
Retail 21,157.5 3.4% 40.8% 5,979.6 28.3%
Equity and others 11,973.8 — — 15,707.6 131.2%
Others 25,813.4 — — 12,196.2 47.2%
Standardized approach (Note 4) 39,136.8 — — 24,414.4 62.4%
Of which, transitioned to IRB 21,891.6 — — 14,966.1 68.4%
Standardized approach 17,245.2 — — 9,448.2 54.8%
Total 308,055.1 — — 97,793.1 31.7%
Notes: 1. Figures for credit risk-weighted assets (RWA) are presented on a Basel III full implementation basis. Credit RWA under the transitional basis was ¥98,292.3 billion as of March 31, 2015.
2. The validity of risk parameters such as probability of default, or PD, loss given default, or LGD, or Exposure at Default, or EAD, are verified regularly (at least once a year) through back testing or comparative analysis with external sources.
3. The corresponding external credit ratings are presented in terms of rating symbols from S&P and Moody’s. 4. Securitization exposure is included in “Others” under the Internal Ratings Based Approach.
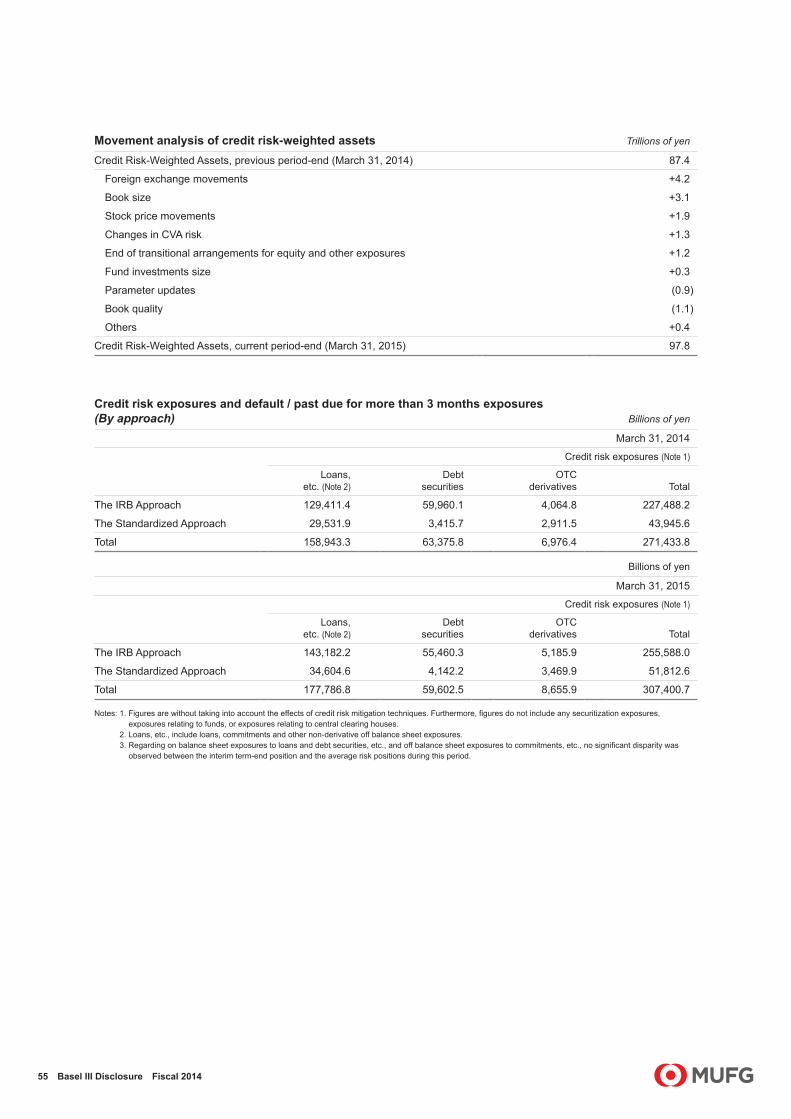
55 Basel III Disclosure Fiscal 2014
Movement analysis of credit risk-weighted assets Trillions of yen
Credit Risk-Weighted Assets, previous period-end (March 31, 2014) 87.4
Foreign exchange movements +4.2
Book size +3.1
Stock price movements +1.9
Changes in CVA risk +1.3
End of transitional arrangements for equity and other exposures +1.2
Fund investments size +0.3
Parameter updates (0.9)
Book quality (1.1)
Others +0.4
Credit Risk-Weighted Assets, current period-end (March 31, 2015) 97.8
Credit risk exposures and default / past due for more than 3 months exposures (By approach) Billions of yen
March 31, 2014
Credit risk exposures (Note 1)
Loans, etc. (Note 2)
Debt securities
OTC derivatives Total
The IRB Approach 129,411.4 59,960.1 4,064.8 227,488.2
The Standardized Approach 29,531.9 3,415.7 2,911.5 43,945.6
Total 158,943.3 63,375.8 6,976.4 271,433.8
Billions of yen
March 31, 2015
Credit risk exposures (Note 1)
Loans, etc. (Note 2)
Debt securities
OTC derivatives Total
The IRB Approach 143,182.2 55,460.3 5,185.9 255,588.0
The Standardized Approach 34,604.6 4,142.2 3,469.9 51,812.6
Total 177,786.8 59,602.5 8,655.9 307,400.7
Notes: 1. Figures are without taking into account the effects of credit risk mitigation techniques. Furthermore, figures do not include any securitization exposures, exposures relating to funds, or exposures relating to central clearing houses.
2. Loans, etc., include loans, commitments and other non-derivative off balance sheet exposures. 3. Regarding on balance sheet exposures to loans and debt securities, etc., and off balance sheet exposures to commitments, etc., no significant disparity was
observed between the interim term-end position and the average risk positions during this period.

56 Basel III Disclosure Fiscal 2014
(By geographic area) Billions of yen
March 31, 2014
Credit risk exposures (Note 1) Default / past due for more than
3 months exposures (Note 3)
Loans, etc. (Note 2)
Debt securities
OTC derivatives Total
Domestic 109,090.7 55,601.2 5,807.0 197,853.7 2,061.6
Foreign 49,852.6 7,774.6 1,169.3 73,580.1 216.0
Total 158,943.3 63,375.8 6,976.4 271,433.8 2,277.7
Billions of yen
March 31, 2015
Credit risk exposures (Note 1) Default / past due for more than
3 months exposures (Note 3)
Loans, etc. (Note 2)
Debt securities
OTC derivatives Total
Domestic 113,832.4 50,650.8 6,533.7 216,794.2 2,198.9
Foreign 63,954.4 9,019.8 2,122.2 90,606.5 174.6
Total 177,786.8 59,670.6 8,655.9 307,400.7 2,373.6
Notes: 1. Figures are without taking into account the effects of credit risk mitigation techniques. Furthermore, figures do not include any securitization exposures, exposures relating to funds, or exposures relating to central clearing houses.
2. Loans, etc., include loans, commitments and other non-derivative off balance sheet exposures. 3. Figures for exposures past due for more than 3 months or default exposures correspond to exposures as of the period-end where the amount of the credit
risk-weighted asset is computed assuming default in cases subject to the IRB Approach, and exposures where the amount of the credit risk-weighted asset is computed assuming past-due loan exposure in cases subject to the Standardized Approach. Figures do not include any securitization exposures, exposures relating to funds, or exposures relating to central clearing houses.
4. Geographic area refers to the locations of MUFG or our subsidiaries or the head and branch offices of our subsidiaries.

57 Basel III Disclosure Fiscal 2014
(By type of industry) Billions of yen
March 31, 2014
Credit risk exposures (Note 1) Default / past due for more than
3 months exposures (Note 3)
Loans, etc. (Note 2)
Debt securities
OTC derivatives Total
Manufacturing 20,319.4 1,112.6 550.7 25,119.2 380.9
Wholesale and retail 12,133.8 335.4 300.6 14,109.2 369.7
Construction 1,603.0 41.3 16.3 1,807.2 62.9
Finance and insurance 29,333.9 1,398.7 3,866.9 40,017.0 34.9
Real estate 11,890.5 195.8 105.0 12,341.9 184.0
Services 7,425.9 182.0 195.8 7,920.7 193.7
Transport 4,943.4 186.7 195.4 5,770.5 59.7
Individuals 22,361.2 — 0.0 23,226.1 641.5
Governments and local authorities 20,890.1 56,597.3 54.2 90,170.9 0.0
Others 28,041.7 3,325.5 1,691.1 50,950.8 349.9
Total 158,943.3 63,375.8 6,976.4 271,433.8 2,277.7
Billions of yen
March 31, 2015
Credit risk exposures (Note 1) Default / past due for more than
3 months exposures (Note 3)
Loans, etc. (Note 2)
Debt securities
OTC derivatives Total
Manufacturing 22,900.7 980.3 872.7 29,005.2 717.5
Wholesale and retail 12,635.5 298.3 360.7 14,814.4 343.1
Construction 1,746.8 20.5 17.0 1,939.7 41.8
Finance and insurance 33,400.4 1,486.5 4,207.4 47,690.7 19.6
Real estate 12,341.3 238.0 137.7 12,863.1 101.9
Services 8,611.7 201.3 209.5 9,263.6 156.5
Transport 5,474.4 228.1 270.1 6,653.8 48.1
Individuals 23,102.2 — 0.0 23,939.2 551.1
Governments and local authorities 22,039.2 51,903.3 50.4 100,922.9 0.0
Others 35,534.3 4,314.0 2,529.9 60,307.9 393.5
Total 177,786.8 59,670.6 8,655.9 307,400.7 2,373.6
Notes: 1. Figures are without taking into account the effects of credit risk mitigation techniques. Furthermore, figures do not include any securitization exposures, exposures relating to funds, or exposures relating to central clearing houses.
2. Loans, etc., include loans, commitments and other non-derivative off balance sheet exposures. 3. Figures for exposures for more than 3 months or default exposures correspond to exposures as of the period-end where the amount of the credit risk-weighted
asset is computed assuming default in cases subject to the IRB Approach, and exposures where the amount of the credit risk-weighted asset is computed assuming past-due loan exposure in cases subject to the Standardized Approach. Figures do not include any securitization exposures, exposures relating to funds, or exposures relating to central clearing houses.
4. Exposures held by certain subsidiaries whose credit risk weighted assets are considered minor relative to the overall total are included in the “Others” category.

58 Basel III Disclosure Fiscal 2014
(By residual contractual maturity) Billions of yen
March 31, 2014
Credit risk exposures (Note 1)
Loans, etc. (Note 2)
Debt securities
OTC derivatives Total
Due in 1 year or less 47,127.0 17,387.2 649.6 77,755.5
Due over 1 year to 3 years 19,769.0 16,108.0 1,348.2 37,324.8
Due over 3 years to 5 years 17,746.5 14,864.9 1,318.9 33,943.7
Due over 5 years to 7 years 6,504.0 4,745.3 175.3 11,425.0
Due over 7 years 16,611.9 6,922.2 579.9 24,114.2
Others (Note 3) 51,184.6 3,347.9 2,904.2 86,870.4
Total 158,943.3 63,375.8 6,976.4 271,433.8
Billions of yen
March 31, 2015
Credit risk exposures (Note 1)
Loans, etc. (Note 2)
Debt securities
OTC derivatives Total
Due in 1 year or less 49,916.1 15,312.7 958.0 74,539.0
Due over 1 year to 3 years 23,754.9 11,419.4 2,027.8 43,754.9
Due over 3 years to 5 years 20,904.1 10,525.7 1,091.3 32,512.9
Due over 5 years to 7 years 6,786.3 5,006.0 261.1 12,038.7
Due over 7 years 17,483.8 13,345.0 847.1 31,711.0
Others (Note 3) 58,941.4 4,061.6 3,470.4 112,844.0
Total 177,786.8 59,670.6 8,655.9 307,400.7
Notes: 1. Figures are without taking into account the effects of credit risk mitigation techniques. Furthermore, figures do not include any securitization exposures, exposures relating to funds, or exposures relating to central clearing houses.
2. Loans, etc., include loans, commitments and other non-derivative off balance sheet exposures. 3. The “Others” category includes exposures of indeterminate maturity, etc. Exposures held by certain subsidiaries whose credit risk weighted assets are
considered minor relative to the overall total are included in the “Others” category.

59 Basel III Disclosure Fiscal 2014
General allowance for credit losses, specific allowance for credit losses and allowance for loans to specific foreign borrowers
(Balances by geographic area) Millions of yen
March 31, 2014Against
March 31, 2013 March 31, 2015Against
March 31, 2014
General allowance for credit losses 643,260 (85,820) 766,272 123,011
Specific allowance for credit losses 320,362 (37,262) 228,297 (92,065)
Domestic 274,760 (39,793) 183,165 (91,595)
Foreign 45,601 2,530 45,131 (470)
Allowance for loans to specific foreign borrowers 1,390 639 1,214 (175)
Total 965,014 (122,443) 995,784 30,770
(Balances by type of industry) Millions of yen
March 31, 2014Against
March 31, 2013 March 31, 2015Against
March 31, 2014
General allowance for credit losses 643,260 (85,820) 766,272 123,011
Specific allowance for credit losses 320,362 (37,262) 228,297 (92,065)
Manufacturing 63,908 (25,715) 40,433 (23,475)
Wholesale and retail 73,668 (9,806) 48,730 (24,937)
Construction 8,554 (201) 5,014 (3,540)
Finance and insurance 22,942 4,904 8,435 (14,506)
Real estate 24,288 3,435 12,603 (11,684)
Services 25,017 1,370 17,713 (7,303)
Transport 9,776 (6,438) 7,457 (2,319)
Individuals 21,771 (6,124) 17,544 (4,226)
Governments and local authorities 4 (0) 4 (0)
Others 70,429 1,312 70,358 (71)
Allowance for loans to specific foreign borrowers 1,390 639 1,214 (175)
Total 965,014 (122,443) 995,784 30,770
Notes: 1. Although the specific allowance for credit losses does not include the allowance relating to any securitization exposures and exposures relating to funds, the allowance relating to these exposures is not excluded from both the general allowance for credit losses and the allowance for loans to specific foreign borrowers, owing to the fact that MUFG does not manage provisioning with respect to each asset class based on Basel III.
2. Industry classifications apply primarily to allowances related to exposures held by The Bank of Tokyo-Mitsubishi UFJ and Mitsubishi UFJ Trust and Banking (both on a non-consolidated basis). The bulk of provisions relating to exposures held by other subsidiaries is included in the “Others” category.

60 Basel III Disclosure Fiscal 2014
Loan charge-offs
(By type of industry) Millions of yen
FY2013 FY2014
Manufacturing 16,331 9,440
Wholesale and retail 22,025 14,801
Construction 1,865 1,090
Finance and insurance 511 441
Real estate 2,522 2,522
Services 9,195 4,560
Transport 1,334 2,188
Individuals 16,398 12,500
Governments and local authorities — —
Others 18,893 55,133
Total 89,079 102,677
Note: Figures do not include loan charge-offs related to securitization exposures or exposures relating to funds.

61 Basel III Disclosure Fiscal 2014
Balances by risk weight category of exposures under the Standardized Approach Billions of yen
March 31, 2014 March 31, 2015
Balances
Of which: balances for which risk weights
are determined by external rating Balances
Of which: balances for which risk weights
are determined by external rating
Risk weight: 0% 4,432.8 2,133.2 5,620.9 2,811.8
Risk weight: 10% 273.0 — 118.8 —
Risk weight: 20% 5,177.0 4,998.2 5,653.3 5,515.7
Risk weight: 35% 2,980.2 — 3,764.0 —
Risk weight: 50% 540.4 534.5 521.4 513.8
Risk weight: 75% 2,853.6 — 3,335.8 —
Risk weight: 100% 15,510.8 100.6 18,563.2 169.4
Risk weight: 150% 70.8 3.0 71.0 0.1
Risk weight: 625% 0.0 — 0.0 —
Risk weight: 1,250% 4.9 — 3.2 —
Others (Note 3) 1.8 — 1,671.8 —
Total 31,845.6 7,769.7 39,323.9 9,011.0
Notes: 1. Figures are taking into account the effects of credit risk mitigation techniques. 2. Figures do not contain any securitization exposures. 3. “Others” includes investment funds leveraged by debt loans, etc., for which the weighted average risk weight was 217% as of March 31, 2014 and 205% as of
March 31, 2015.
Exposures subject to the IRB Approach: specialized lending exposures subject to supervisory slotting criteria and equity exposures subject to the Market-Based Approach (simple risk weight method) Billions of yen
March 31, 2014 March 31, 2015
Specialized lending exposures subject to supervisory slotting criteria 300.9 350.6
Risk weight: 50% 26.3 28.6
Risk weight: 70% 68.4 107.2
Risk weight: 90% 43.0 51.1
Risk weight: 95% 46.6 22.9
Risk weight: 115% 72.4 60.5
Risk weight: 120% 27.7 24.1
Risk weight: 140% 2.6 24.2
Risk weight: 250% 13.6 31.7
Risk weight: 0% — —
Equity exposures subject to the Market-Based Approach (simple risk weight method) 362.3 436.4
Risk weight: 300% 97.1 113.6
Risk weight: 400% 265.2 322.8

62 Basel III Disclosure Fiscal 2014
Exposures subject to the IRB Approach: corporate exposures Billions of yen
March 31, 2014
EAD
On balance sheet EAD
Off balance sheet EAD
Credit rating
Amount of undrawn
commitments
Weighted average factor on undrawn
commitments
Other off balance
sheet EAD
Borrower ratings 1–3 32,525.5 21,861.3 10,664.1 13,709.3 56.68% 2,893.8
Borrower ratings 4–9 43,381.6 36,289.1 7,092.5 8,665.6 56.74% 2,175.9
Borrower ratings 10–11 4,195.4 3,778.9 416.4 228.1 56.72% 287.1
Borrower ratings 12–15 1,618.5 1,574.6 43.8 19.2 56.62% 33.0
March 31, 2014
Credit rating
Weighted average
PD
Weighted average
LGD
Weighted average
EL default
Weighted average
RW
Borrower ratings 1–3 0.12% 34.83% — 25.38%
Borrower ratings 4–9 0.79% 30.14% — 48.23%
Borrower ratings 10–11 10.69% 25.47% — 111.68%
Borrower ratings 12–15 100.00% 39.29% 36.16% 43.30%
Billions of yen
March 31, 2015
EAD
On balance sheet EAD
Off balance sheet EAD
Credit rating
Amount of undrawn
commitments
Weighted average factor on undrawn
commitments
Other off balance
sheet EAD
Borrower ratings 1–3 40,036.1 25,472.9 14,563.1 23,003.9 45.36% 4,128.2
Borrower ratings 4–9 46,094.2 38,378.1 7,716.1 13,986.9 35.21% 2,791.7
Borrower ratings 10–11 3,032.6 2,680.5 352.0 3,167.2 3.17% 251.5
Borrower ratings 12–15 1,694.9 1,641.4 53.4 6.2 42.89% 50.7
March 31, 2015
Credit rating
Weighted average
PD
Weighted average
LGD
Weighted average
EL default
Weighted average
RW
Borrower ratings 1–3 0.09% 35.23% — 24.42%
Borrower ratings 4–9 0.75% 29.36% — 46.70%
Borrower ratings 10–11 10.46% 23.05% — 104.13%
Borrower ratings 12–15 100.00% 34.46% 31.63% 39.02%
Notes: 1. Figures exclude specialized lending exposures subject to supervisory slotting criteria and any exposures relating to funds. 2. Weighted average PD and weighted average LGD represent weighted average figures based on EAD. 3. RW stands for risk weight. Risk weight is calculated by dividing the amount of credit risk-weighted assets by EAD, and does not include any expected losses. Note
that credit risk-weighted asset amounts are multiplied by 1.06.

63 Basel III Disclosure Fiscal 2014
Exposures subject to the IRB Approach: sovereign exposures Billions of yen
March 31, 2014
EAD
On balance sheet EAD
Off balance sheet EAD
Credit rating
Amount of undrawn
commitments
Weighted average factor on undrawn
commitments
Other off balance
sheet EAD
Borrower ratings 1–3 94,141.5 84,467.8 9,673.6 1,228.5 56.41% 8,980.6
Borrower ratings 4–9 454.9 412.9 42.0 53.8 56.41% 11.6
Borrower ratings 10–11 105.7 101.0 4.7 1.1 56.41% 4.0
Borrower ratings 12–15 18.1 17.4 0.7 — — 0.7
March 31, 2014
Credit rating
Weighted average
PD
Weighted average
LGD
Weighted average
EL default
Weighted average
RW
Borrower ratings 1–3 0.00% 36.46% — 0.54%
Borrower ratings 4–9 0.75% 29.75% — 46.46%
Borrower ratings 10–11 14.88% 6.34% — 35.00%
Borrower ratings 12–15 100.00% 24.82% 21.59% 43.78%
Billions of yen
March 31, 2015
EAD
On balance sheet EAD
Off balance sheet EAD
Credit rating
Amount of undrawn
commitments
Weighted average factor on undrawn
commitments
Other off balance
sheet EAD
Borrower ratings 1–3 107,371.9 95,016.0 12,355.9 1,409.2 53.97% 11,595.3
Borrower ratings 4–9 703.2 561.9 141.2 134.2 57.67% 63.8
Borrower ratings 10–11 93.1 87.0 6.1 0.0 0.00% 6.1
Borrower ratings 12–15 4.5 4.5 0.0 — — 0.0
March 31, 2015
Credit rating
Weighted average
PD
Weighted average
LGD
Weighted average
EL default
Weighted average
RW
Borrower ratings 1–3 0.00% 36.77% — 0.57%
Borrower ratings 4–9 0.59% 30.12% — 39.91%
Borrower ratings 10–11 13.49% 9.15% — 48.12%
Borrower ratings 12–15 100.00% 9.84% 8.66% 18.32%

64 Basel III Disclosure Fiscal 2014
Exposures subject to the IRB Approach: bank exposures Billions of yen
March 31, 2014
EAD
On balance sheet EAD
Off balance sheet EAD
Credit rating
Amount of undrawn
commitments
Weighted average factor on undrawn
commitments
Other off balance
sheet EAD
Borrower ratings 1–3 6,926.2 3,947.9 2,978.3 352.3 56.41% 2,779.6
Borrower ratings 4–9 2,308.0 1,417.3 890.6 97.2 56.54% 835.6
Borrower ratings 10–11 84.2 8.0 76.2 — — 76.2
Borrower ratings 12–15 1.4 1.4 — — — —
March 31, 2014
Credit rating
Weighted average
PD
Weighted average
LGD
Weighted average
EL default
Weighted average
RW
Borrower ratings 1–3 0.10% 32.28% — 26.73%
Borrower ratings 4–9 0.27% 31.88% — 27.74%
Borrower ratings 10–11 15.29% 26.22% — 147.60%
Borrower ratings 12–15 100.00% 78.97% 77.30% 22.13%
Billions of yen
March 31, 2015
EAD
On balance sheet EAD
Off balance sheet EAD
Credit rating
Amount of undrawn
commitments
Weighted average factor on undrawn
commitments
Other off balance
sheet EAD
Borrower ratings 1–3 7,625.6 4,110.3 3,515.3 421.9 47.09% 3,316.6
Borrower ratings 4–9 2,894.5 1,470.5 1,424.0 238.9 23.87% 1,367.0
Borrower ratings 10–11 70.2 8.7 61.4 153.6 — 61.4
Borrower ratings 12–15 1.4 1.4 — — — —
March 31, 2015
Credit rating
Weighted average
PD
Weighted average
LGD
Weighted average
EL default
Weighted average
RW
Borrower ratings 1–3 0.09% 32.31% — 27.09%
Borrower ratings 4–9 0.29% 29.42% — 29.81%
Borrower ratings 10–11 13.97% 29.33% — 153.24%
Borrower ratings 12–15 100.00% 75.46% 73.54% 25.41%

65 Basel III Disclosure Fiscal 2014
Exposures subject to the IRB Approach: equity exposures under PD/LGD Approach Billions of yen
March 31, 2014
Credit ratingAmount
of exposuresWeighted
average PDWeighted
average RW
Borrower ratings 1–3 572.8 0.10% 147.76%
Borrower ratings 4–9 1,407.0 0.33% 170.58%
Borrower ratings 10–11 0.8 9.57% 571.13%
Borrower ratings 12–15 1.1 100.00% 1,192.50%
Billions of yen
March 31, 2015
Credit ratingAmount
of exposuresWeighted
average PDWeighted
average RW
Borrower ratings 1–3 5,266.9 0.08% 111.13%
Borrower ratings 4–9 2,740.2 0.28% 163.31%
Borrower ratings 10–11 20.4 13.94% 779.01%
Borrower ratings 12–15 14.5 100.00% 1,192.50%
Note: Figures exclude any equity exposures based on calculations where credit risk asset values are assessed using the Market-Based Approach as well as any equity exposures where a 100% risk weight is applied based on the transitional arrangements stipulated in Article 13 of the Supplementary Provisions to the FSA Consolidated Capital Adequacy Notification.
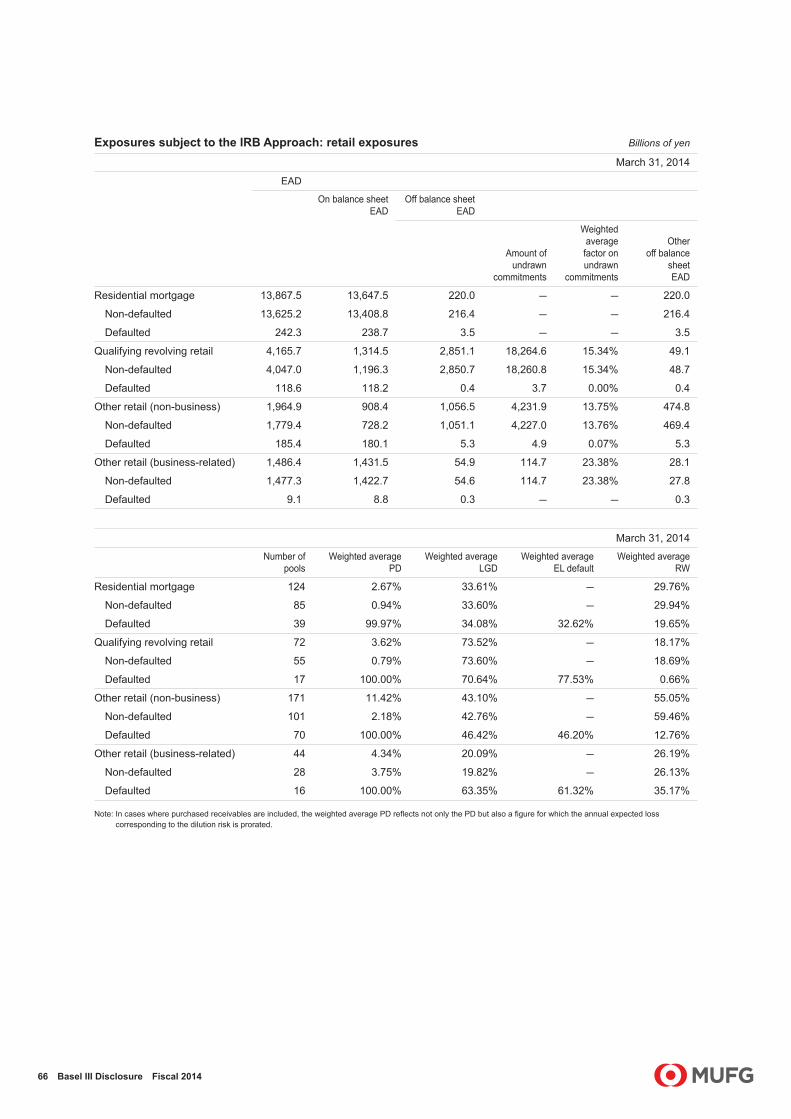
66 Basel III Disclosure Fiscal 2014
Exposures subject to the IRB Approach: retail exposures Billions of yen
March 31, 2014
EAD
On balance sheet EAD
Off balance sheet EAD
Amount of undrawn
commitments
Weighted average factor on undrawn
commitments
Other off balance
sheet EAD
Residential mortgage 13,867.5 13,647.5 220.0 — — 220.0
Non-defaulted 13,625.2 13,408.8 216.4 — — 216.4
Defaulted 242.3 238.7 3.5 — — 3.5
Qualifying revolving retail 4,165.7 1,314.5 2,851.1 18,264.6 15.34% 49.1
Non-defaulted 4,047.0 1,196.3 2,850.7 18,260.8 15.34% 48.7
Defaulted 118.6 118.2 0.4 3.7 0.00% 0.4
Other retail (non-business) 1,964.9 908.4 1,056.5 4,231.9 13.75% 474.8
Non-defaulted 1,779.4 728.2 1,051.1 4,227.0 13.76% 469.4
Defaulted 185.4 180.1 5.3 4.9 0.07% 5.3
Other retail (business-related) 1,486.4 1,431.5 54.9 114.7 23.38% 28.1
Non-defaulted 1,477.3 1,422.7 54.6 114.7 23.38% 27.8
Defaulted 9.1 8.8 0.3 — — 0.3
March 31, 2014
Number of pools
Weighted average PD
Weighted average LGD
Weighted average EL default
Weighted average RW
Residential mortgage 124 2.67% 33.61% — 29.76%
Non-defaulted 85 0.94% 33.60% — 29.94%
Defaulted 39 99.97% 34.08% 32.62% 19.65%
Qualifying revolving retail 72 3.62% 73.52% — 18.17%
Non-defaulted 55 0.79% 73.60% — 18.69%
Defaulted 17 100.00% 70.64% 77.53% 0.66%
Other retail (non-business) 171 11.42% 43.10% — 55.05%
Non-defaulted 101 2.18% 42.76% — 59.46%
Defaulted 70 100.00% 46.42% 46.20% 12.76%
Other retail (business-related) 44 4.34% 20.09% — 26.19%
Non-defaulted 28 3.75% 19.82% — 26.13%
Defaulted 16 100.00% 63.35% 61.32% 35.17%
Note: In cases where purchased receivables are included, the weighted average PD reflects not only the PD but also a figure for which the annual expected loss corresponding to the dilution risk is prorated.

67 Basel III Disclosure Fiscal 2014
Exposures subject to the IRB Approach: retail exposures (continued) Billions of yen
March 31, 2015
EAD
On balance sheet EAD
Off balance sheet EAD
Amount of undrawn
commitments
Weighted average factor on undrawn
commitments
Other off balance
sheet EAD
Residential mortgage 13,756.5 13,572.7 183.7 — — 183.7
Non-defaulted 13,550.1 13,369.4 180.7 — — 180.7
Defaulted 206.3 203.3 3.0 — — 3.0
Qualifying revolving retail 4,151.1 1,257.8 2,893.2 18,865.2 15.05% 53.5
Non-defaulted 4,050.5 1,157.6 2,892.9 18,862.6 15.05% 53.2
Defaulted 100.5 100.2 0.3 2.5 0.00% 0.3
Other retail (non-business) 1,885.7 910.5 975.2 4,144.6 13.63% 410.1
Non-defaulted 1,717.5 746.2 971.3 4,141.1 13.65% 406.2
Defaulted 168.2 164.2 3.9 3.5 0.06% 3.9
Other retail (business-related) 1,364.0 1,186.0 178.0 120.1 21.64% 152.0
Non-defaulted 1,355.9 1,178.1 177.7 120.1 21.64% 151.7
Defaulted 8.1 7.9 0.2 — — 0.2
March 31, 2015
Number of pools
Weighted average PD
Weighted average LGD
Weighted average EL default
Weighted average RW
Residential mortgage 127 2.39% 32.48% — 28.17%
Non-defaulted 87 0.90% 32.47% — 28.28%
Defaulted 40 99.97% 33.20% 31.64% 20.97%
Qualifying revolving retail 72 3.16% 74.67% — 17.96%
Non-defaulted 55 0.76% 74.60% — 18.39%
Defaulted 17 100.00% 77.57% 80.76% 0.42%
Other retail (non-business) 163 10.73% 44.64% — 55.91%
Non-defaulted 94 1.99% 44.61% — 60.32%
Defaulted 69 100.00% 44.95% 44.70% 10.97%
Other retail (business-related) 51 4.01% 16.66% — 22.32%
Non-defaulted 35 3.43% 16.38% — 22.31%
Defaulted 16 100.00% 62.30% 61.12% 25.17%
Note: In cases where purchased receivables are included, the weighted average PD reflects not only the PD but also a figure for which the annual expected loss corresponding to the dilution risk is prorated.

68 Basel III Disclosure Fiscal 2014
Comparison of estimated and actual losses for exposures subject to the IRB Approach Millions of yen
Corporate exposures
Sovereign exposures
Bank exposures
Equity exposures
under PD/LGD
Approach
Residential mortgage
exposures
Qualifying revolving
retail exposures
Other retail exposures
FY2006 actual losses 23,025 (1,571) (6,941) 84 26,725 — 5,940
FY2006 estimated losses 1,235,407 18,106 14,417 173,180 62,968 — 108,173
Initial EAD 72,143,293 43,809,530 16,865,540 375,755 14,985,264 — 5,648,325
Estimated weighted average PD 3.91% 0.09% 0.19% 51.21% 1.17% — 5.21%
Estimated weighted average LGD 43.74% 44.79% 45.16% 90.00% 36.05% — 36.78%
FY2007 actual losses 70,776 (499) (52) 2,063 12,645 — 6,058
FY2007 estimated losses 1,200,881 13,051 15,572 96,176 76,518 — 121,380
Initial EAD 66,584,415 39,998,750 19,100,674 520,689 13,705,023 — 5,469,071
Estimated weighted average PD 4.12% 0.07% 0.17% 20.52% 1.50% — 5.60%
Estimated weighted average LGD 43.75% 44.96% 45.28% 90.00% 37.78% — 39.56%
FY2008 actual losses 367,111 (353) 24,309 66,906 26,218 — 52,879
FY2008 estimated losses 993,791 18,389 24,850 94,474 89,938 — 112,090
Initial EAD 70,710,242 37,890,290 19,877,135 632,858 14,243,086 — 5,099,330
Estimated weighted average PD 3.19% 0.10% 0.25% 16.58% 1.44% — 5.27%
Estimated weighted average LGD 43.75% 44.96% 41.89% 90.00% 44.05% — 41.63%
FY2009 actual losses 374,658 (118) 23,631 2,162 28,922 2,817 20,190
FY2009 estimated losses 1,040,595 47,332 39,863 27,827 101,070 11,784 86,698
Initial EAD 74,113,431 55,115,408 12,125,418 1,382,457 14,240,099 741,843 3,877,135
Estimated weighted average PD 3.78% 0.23% 0.88% 2.24% 1.66% 2.20% 5.98%
Estimated weighted average LGD 36.98% 38.47% 37.47% 90.00% 43.02% 72.32% 37.34%
FY2010 actual losses 161,997 (298) (6,725) 238 27,687 62,514 23,460
FY2010 estimated losses 1,202,669 31,084 38,243 7,631 143,096 210,666 171,435
Initial EAD 70,981,831 65,386,649 11,189,296 1,531,399 14,527,802 5,354,803 4,809,516
Estimated weighted average PD 4.42% 0.12% 0.84% 0.55% 2.29% 4.74% 6.87%
Estimated weighted average LGD 38.14% 40.86% 40.48% 90.00% 43.13% 82.68% 44.89%
FY2011 actual losses 144,305 (214) (4) 93 29,023 18,693 23,826
FY2011 estimated losses 1,125,141 29,294 29,545 7,597 216,949 164,990 182,613
Initial EAD 66,989,253 88,407,803 12,816,541 1,500,479 14,368,724 4,706,299 4,739,835
Estimated weighted average PD 4.39% 0.08% 0.58% 0.56% 3.27% 4.62% 7.89%
Estimated weighted average LGD 37.97% 41.17% 39.48% 90.00% 46.17% 75.77% 42.54%

69 Basel III Disclosure Fiscal 2014
Comparison of estimated and actual losses for exposures subject to the IRB Approach (continued) Millions of yen
Corporate exposures
Sovereign exposures
Bank exposures
Equity exposures
under PD/LGD
Approach
Residential mortgage
exposures
Qualifying revolving
retail exposures
Other retail exposures
FY2012 actual losses 108,263 (133) — 121 21,068 13,823 7,377
FY2012 estimated losses 951,689 25,146 20,163 5,194 206,700 142,764 157,993
Initial EAD 71,463,314 88,940,300 10,391,449 672,201 14,064,062 4,788,117 4,022,364
Estimated weighted average PD 3.91% 0.08% 0.58% 0.86% 3.52% 3.97% 9.37%
Estimated weighted average LGD 34.13% 37.94% 33.47% 90.00% 41.83% 75.17% 35.19%
FY2013 actual losses 76,814 (139) — 182 (1,339) 11,191 4,378
FY2013 estimated losses 896,608 29,833 15,405 6,223 163,665 128,347 130,934
Initial EAD 77,051,135 91,958,666 10,189,751 765,530 13,900,410 4,278,958 3,679,324
Estimated weighted average PD 3.69% 0.09% 0.46% 0.90% 3.33% 3.91% 8.56%
Estimated weighted average LGD 31.82% 35.82% 32.05% 90.00% 35.76% 76.66% 32.61%
Interim FY2014 actual losses (2,846) 176 — 852 (1,471) 5,302 2,528
Interim FY2014 estimated losses (Note 4) 762,636 14,766 10,437 4,541 123,061 110,812 113,637
Initial EAD 82,577,996 94,674,332 11,472,423 788,896 13,867,539 4,165,724 3,439,214
Estimated weighted average PD 2.93% 0.04% 0.27% 0.64% 2.67% 3.62% 8.04%
Estimated weighted average LGD 31.88% 36.39% 32.95% 90.00% 33.58% 73.72% 33.12%
Interim FY2014: Discussion of the factors
Actual losses on exposures were lower than initial estimated losses, reflecting repayments on defaulted exposures and other factors such as loan normalization.
Notes: 1. Actual losses include the following amounts related to defaulted exposures: write-offs against allowances, losses on the disposal of claims, debt forgiveness or loan waivers, and impairment losses on securities. Actual losses incurred by Mitsubishi UFJ Trust and Banking Corporation equal the aggregate figures for the banking account and for trust accounts for which repayment of the principal to the customers is guaranteed.
2. The initial EAD under FY2006 estimated losses was used for a preliminary calculation under the FIRB Approach at the end of March 2006, and was not used to calculate an official figure of capital adequacy ratio.
3. Estimates for PD and LGD under FY2006 estimated losses were used for preliminary calculations under the FIRB Approach at the end of September 2006, and were not used to calculate official figures of capital adequacy ratio. Estimates for PD and LGD that were used for preliminary calculations under the FIRB Approach at the end of March 2006 were not used, because such estimates included temporary factors due to the merger of Mitsubishi Tokyo Financial Group, Inc. with UFJ Holdings, Inc.
4. Estimated losses for Interim FY2014 represent the anticipated losses for the full year estimated at the beginning of the fiscal year.

70 Basel III Disclosure Fiscal 2014
CREDIT RISK MITIGATION
Exposures subject to application of credit risk mitigation techniques Billions of yen
March 31, 2014
Eligible financial collateral Guarantees
Credit derivatives
Portfolios under the AIRB Approach / 5,795.3 224.3
Corporate exposures / 3,910.2 211.1
Sovereign exposures / 916.1 10.2
Bank exposures / 539.5 2.9
Residential mortgage exposures / — —
Qualifying revolving retail exposures / — —
Other retail exposures / 429.4 —
Portfolios under the Standardized Approach 11,528.1 183.7 —
Billions of yen
March 31, 2015
Eligible financial collateral Guarantees
Credit derivatives
Portfolios under the AIRB Approach / 7,125.2 274.3
Corporate exposures / 5,486.0 258.9
Sovereign exposures / 821.5 9.6
Bank exposures / 433.0 5.8
Residential mortgage exposures / — —
Qualifying revolving retail exposures / — —
Other retail exposures / 384.6 —
Portfolios under the Standardized Approach 11,728.2 372.2 —
Note: Eligible financial collateral includes collateral for repo transactions but does not include deposits in our banks subject to on balance sheet netting.

71 Basel III Disclosure Fiscal 2014
DERIVATIVE TRANSACTIONS AND LONG SETTLEMENT TRANSACTIONS
Matters relating to counterparty credit risk Billions of yen
March 31, 2014 March 31, 2015
Aggregated gross replacement costs 9,561.3 12,030.1
Credit equivalent amounts prior to credit risk mitigation benefits due to collateral 6,976.5 8,656.1
Foreign exchange and gold 6,924.7 9,527.2
Interest rate 8,509.0 8,247.3
Equity 176.7 257.2
Precious metals (except gold) — —
Other commodities 282.7 167.4
Credit derivative 453.3 434.3
Long settlement transactions 0.0 0.2
Netting benefits due to close-out netting agreements (Note 2) (9,370.1) (9,977.5)
Collateral held 1,198.4 1,821.3
Deposits 490.2 903.5
Marketable securities 505.9 478.6
Others 202.1 439.1
Credit equivalent amounts after credit risk mitigation benefits due to collateral 6,522.2 7,962.9
Notional principal amount of credit derivatives included in calculation of credit equivalent amounts 7,214.5 6,882.9
Purchased credit protection through credit default swaps 3,742.7 3,527.7
Purchased credit protection through total return swaps 34.8 17.9
Purchased credit protection through credit options — —
Purchased other credit protection — —
Provided credit protection through credit default swaps 3,436.9 3,337.2
Provided credit protection through total return swaps — —
Provided credit protection through credit options — —
Provided other credit protection — —
Notional principal amount of credit derivatives used for credit risk mitigation purposes 766.6 821.2
Notes: 1. Credit equivalent amounts are calculated using the Current Exposure Method. 2. These benefits are equal to the figure obtained by subtracting credit equivalent amounts prior to credit risk mitigation benefits due to collateral from the sum of
aggregated gross replacement costs and total gross add-ons.
Derivative transaction exposure Billions of yen
March 31, 2014 March 31, 2015
Derivative transactions not settled with Central Clearing Parties 6,094.5 7,544.1
Derivative transactions settled with Central Clearing Parties 2,354.6 3,278.1
Of which, OTC derivatives 1,985.2 2,952.4
Of which, exchange traded derivatives 369.3 325.6
Total 8,449.1 10,822.2
Note: Figures in the above table show exposures used in the calculation of credit risk-weighted assets.

72 Basel III Disclosure Fiscal 2014
SECURITIZATION EXPOSURES (Subject to calculation of credit risk assets)
Information on underlying assets Billions of yen
March 31, 2014 FY2013
Amount of underlying assets at period-end (Note 1)
Cumulative amount of underlying assets in default or contractually
past due 3 months or more
Underlying assets
relating to retained
securitization exposures
Underlying assets relating to
securitization transactions
during this period with no retained
securitization exposures
(Note 2)
Underlying assets relating to
retained securitization
exposures
Underlying assets relating to
securitization transactions
during this period with no retained
securitization exposures
(Note 3)
Losses on underlying assets
incurred during this period
(Note 4)
Traditional securitizations (asset transfer type) 1,345.9 — 5.4 — 2.8
Residential mortgage 1,345.9 — 5.4 — 2.8
Apartment loan — — — — —
Credit card receivables — — — — —
Other assets — — — — —
Synthetic securitizations — — — — —
Residential mortgage — — — — —
Apartment loan — — — — —
Credit card receivables — — — — —
Other assets — — — — —
Sponsor of asset-backed commercial paper (ABCP) program 17,469.7 — 314.3 938.6 683.0
Residential mortgage 46.9 — 0.0 0.0 —
Apartment loan — — — — —
Credit card receivables 2,969.6 — 45.1 428.3 235.3
Account receivables 8,117.1 — 252.3 483.8 404.7
Leasing receivables 983.1 — 3.9 3.7 32.6
Other assets 5,352.9 — 12.8 22.5 10.2
Total as an originator 18,815.7 — 319.8 938.6 685.8
Notes: 1. The amount of underlying assets relating to sponsor of ABCP programs includes underlying assets related to ABCP programs sponsored by multiple financial institutions, including certain consolidated subsidiaries of MUFG.
2. The amount of underlying assets refers only to those cases in which the securitization exposures associated with a securitization conducted during this period were wholly transferred to third parties.
3. Figures show cumulative totals for this period of underlying assets either in default or contractually past due 3 months or more arising from securitization transactions in cases where the securitization exposures associated with a transaction conducted during this period were wholly transferred to third parties, or where no exposure was retained at the end of this period from a securitization conducted during this period due to related maturity.
4. Losses with traditional or synthetic securitizations are based on the projected accounting losses for holding the underlying assets without conducting the relevant securitization. With sponsor of ABCP programs, since it is extremely rare for such schemes to result in losses on any retained securitization exposure, it is difficult to obtain generally relevant information relating to losses as based on certain definitions. These figures therefore aggregate cases where actual economic losses have been recognized with cases where the loss has been valued on the same basis as the underlying defaulted assets. Losses on underly-ing assets relating to sponsor of ABCP programs differ from losses incurred by MUFG.
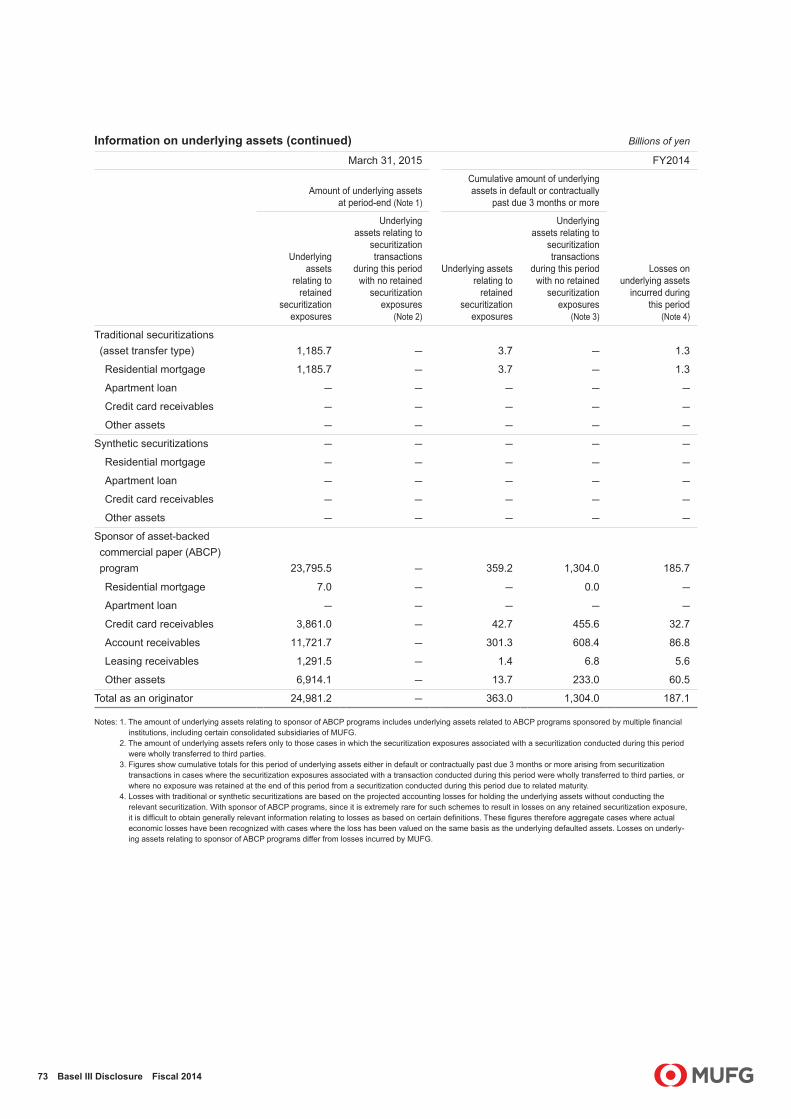
73 Basel III Disclosure Fiscal 2014
Information on underlying assets (continued) Billions of yen
March 31, 2015 FY2014
Amount of underlying assets at period-end (Note 1)
Cumulative amount of underlying assets in default or contractually
past due 3 months or more
Underlying assets
relating to retained
securitization exposures
Underlying assets relating to
securitization transactions
during this period with no retained
securitization exposures
(Note 2)
Underlying assets relating to
retained securitization
exposures
Underlying assets relating to
securitization transactions
during this period with no retained
securitization exposures
(Note 3)
Losses on underlying assets
incurred during this period
(Note 4)
Traditional securitizations (asset transfer type) 1,185.7 — 3.7 — 1.3
Residential mortgage 1,185.7 — 3.7 — 1.3
Apartment loan — — — — —
Credit card receivables — — — — —
Other assets — — — — —
Synthetic securitizations — — — — —
Residential mortgage — — — — —
Apartment loan — — — — —
Credit card receivables — — — — —
Other assets — — — — —
Sponsor of asset-backed commercial paper (ABCP) program 23,795.5 — 359.2 1,304.0 185.7
Residential mortgage 7.0 — — 0.0 —
Apartment loan — — — — —
Credit card receivables 3,861.0 — 42.7 455.6 32.7
Account receivables 11,721.7 — 301.3 608.4 86.8
Leasing receivables 1,291.5 — 1.4 6.8 5.6
Other assets 6,914.1 — 13.7 233.0 60.5
Total as an originator 24,981.2 — 363.0 1,304.0 187.1
Notes: 1. The amount of underlying assets relating to sponsor of ABCP programs includes underlying assets related to ABCP programs sponsored by multiple financial institutions, including certain consolidated subsidiaries of MUFG.
2. The amount of underlying assets refers only to those cases in which the securitization exposures associated with a securitization conducted during this period were wholly transferred to third parties.
3. Figures show cumulative totals for this period of underlying assets either in default or contractually past due 3 months or more arising from securitization transactions in cases where the securitization exposures associated with a transaction conducted during this period were wholly transferred to third parties, or where no exposure was retained at the end of this period from a securitization conducted during this period due to related maturity.
4. Losses with traditional or synthetic securitizations are based on the projected accounting losses for holding the underlying assets without conducting the relevant securitization. With sponsor of ABCP programs, since it is extremely rare for such schemes to result in losses on any retained securitization exposure, it is difficult to obtain generally relevant information relating to losses as based on certain definitions. These figures therefore aggregate cases where actual economic losses have been recognized with cases where the loss has been valued on the same basis as the underlying defaulted assets. Losses on underly-ing assets relating to sponsor of ABCP programs differ from losses incurred by MUFG.

74 Basel III Disclosure Fiscal 2014
Information on underlying assets (continued) Billions of yen
FY2013 FY2014
Cumulative amount of
underlying assets securitized
during the period
Recognized gains or losses
in this period arising from securitization
transactions
Cumulative amount of
underlying assets securitized
during the period
Recognized gains or losses
in this period arising from securitization
transactions
Traditional securitizations (asset transfer type) — — — —
Residential mortgage — — — —
Apartment loan — — — —
Credit card receivables — — — —
Other assets — — — —
Synthetic securitizations — / — /
Residential mortgage — / — /
Apartment loan — / — /
Credit card receivables — / — /
Other assets — / — /
Sponsor of asset-backed commercial paper (ABCP) program 135,707.5 / 165,304.7 /
Residential mortgage 27.0 / — /
Apartment loan — / — /
Credit card receivables 9,641.8 / 9,826.7 /
Account receivables 122,033.1 / 147,536.2 /
Leasing receivables 919.2 / 1,009.1 /
Other assets 3,086.3 / 6,932.5 /
Total as an originator 135,707.5 — 165,304.7 —

75 Basel III Disclosure Fiscal 2014
(Assets held for the purpose of securitization transactions)There were no assets held for the purpose of securitization transactions as of March 31, 2014 and 2015.
Information on securitization exposures retained (By type of underlying asset) Billions of yen
March 31, 2014
Amount of securitization exposuresAmount of
securitization exposures subject to a risk weight of
1,250% (Note 1)
Capital deductions
related to securitization
exposures (Note 2)
Other than re-securitization exposure Re-securitization exposure
On balance sheet
Off balance sheet
On balance sheet
Off balance sheet
Total as an originator 4,464.5 551.0 — — 1.8 13.4
Traditional securitizations (asset transfer type) 486.5 — — — 0.0 13.4
Residential mortgage 486.5 — — — 0.0 13.4
Apartment loan — — — — — —
Credit card receivables — — — — — —
Other assets — — — — — —
Synthetic securitizations — — — — — —
Residential mortgage — — — — — —
Apartment loan — — — — — —
Credit card receivables — — — — — —
Other assets — — — — — —
Sponsor of asset-backed commercial paper (ABCP) program 3,978.0 551.0 — — 1.8 —
Residential mortgage 42.8 — — — — —
Apartment loan — — — — — —
Credit card receivables 579.0 183.1 — — — —
Account receivables 1,470.4 282.5 — — — —
Leasing receivables 341.3 39.4 — — — —
Other assets 1,544.4 45.8 — — 1.8 —
As an investor 3,518.7 — 436.8 — 8.4 /
Residential mortgage 790.4 — — — — /
Apartment loan 22.9 — 0.4 — 0.0 /
Credit card receivables — — — — — /
Corporate loans 2,053.5 — 436.3 — — /
Other assets 651.7 — — — 8.4 /
Notes: 1. Figures listed refer to the amounts of exposures subject to a 1,250% risk weight as stipulated in Article 225 of the FSA Holding Company Capital Adequacy Notification. Securitization exposures subject to a 1,250% risk weight include cases where the credit risk-weighted assets computed using the Supervisory Formula exceed 1,250% or where a rating is lower than a certain threshold when calculating credit risk-weighted assets under the Ratings-Based Approach.
2. Capital deductions related to securitization exposures counts as deductions from Tier 1 capital, such as capital stock, as stipulated by Article 5 of the FSA Holding Company Capital Adequacy Notification, and includes any gains on disposal of the underlying assets relating to the securitization.

76 Basel III Disclosure Fiscal 2014
Information on securitization exposures retained (By type of underlying asset) (continued) Billions of yen
March 31, 2015
Amount of securitization exposuresAmount of
securitization exposures subject to a risk weight of
1,250% (Note 1)
Capital deductions
related to securitization
exposures (Note 2)
Other than re-securitization exposure Re-securitization exposure
On balance sheet
Off balance sheet
On balance sheet
Off balance sheet
Total as an originator 4,902.3 826.3 — — 2.1 13.6
Traditional securitizations (asset transfer type) 483.1 — — — 0.0 13.6
Residential mortgage 483.1 — — — 0.0 13.6
Apartment loan — — — — — —
Credit card receivables — — — — — —
Other assets — — — — — —
Synthetic securitizations — — — — — —
Residential mortgage — — — — — —
Apartment loan — — — — — —
Credit card receivables — — — — — —
Other assets — — — — — —
Sponsor of asset-backed commercial paper (ABCP) program 4,419.2 826.3 — — 2.1 —
Residential mortgage 3.0 — — — — —
Apartment loan — — — — — —
Credit card receivables 570.4 339.0 — — — —
Account receivables 1,685.4 397.7 — — — —
Leasing receivables 323.6 52.2 — — — —
Other assets 1,836.5 37.3 — — 2.1 —
As an investor 4,229.5 — 309.1 — 12.3 /
Residential mortgage 808.6 — — — — /
Apartment loan 23.4 — 0.4 — 0.0 /
Credit card receivables — — — — — /
Corporate loans 2,606.7 — 308.7 — 0.0 /
Other assets 790.7 — — — 12.2 /
Notes: 1. Figures listed refer to the amounts of exposures subject to a 1,250% risk weight as stipulated in Article 225 of the FSA Holding Company Capital Adequacy Notification. Securitization exposures subject to a 1,250% risk weight include cases where the credit risk-weighted assets computed using the Supervisory Formula exceed 1,250% or where a rating is lower than a certain threshold when calculating credit risk-weighted assets under the Ratings-Based Approach.
2. Capital deductions related to securitization exposures counts as deductions from Tier 1 capital, such as capital stock, as stipulated by Article 5 of the FSA Holding Company Capital Adequacy Notification, and includes any gains on disposal of the underlying assets relating to the securitization.
(Securitization exposures subject to early amortization provisions retained)
In line with the provisions of Articles 230 & 248 of the FSA Holding Company Capital Adequacy Notification, as of March 31, 2014 and 2015, there were no securitization exposures subject to early amortization treatment that are retained by external investors and are used to calculate credit risk-weighted assets.

77 Basel III Disclosure Fiscal 2014
(Amount of securitization exposures retained and the associated capital requirement for these exposures broken down into a number of risk weight bands) Billions of yen
March 31, 2014
Other than re-securitization exposure
Amount of securitization exposures
Capital requirement
On balance sheet
Off balance sheet
On balance sheet
Off balance sheet
Total as an originator 4,464.5 551.0 111.9 6.9
Traditional securitizations (asset transfer type) 486.5 — 51.5 —
Risk weight: to 20% — — — —
Risk weight: over 20% to 50% — — — —
Risk weight: over 50% to 100% 198.0 — 14.8 —
Risk weight: over 100% to 250% 257.7 — 25.2 —
Risk weight: over 250% under 1,250% 30.7 — 11.3 —
Risk weight: 1,250% 0.0 — 0.0 —
Synthetic securitizations — — — —
Risk weight: to 20% — — — —
Risk weight: over 20% to 50% — — — —
Risk weight: over 50% to 100% — — — —
Risk weight: over 100% to 250% — — — —
Risk weight: over 250% under 1,250% — — — —
Risk weight: 1,250% — — — —
Sponsor of asset-backed commercial paper (ABCP) program 3,978.0 551.0 60.4 6.9
Risk weight: to 20% 3,302.6 428.5 22.4 2.8
Risk weight: over 20% to 50% 358.7 97.6 10.0 2.4
Risk weight: over 50% to 100% 225.0 24.7 13.5 1.6
Risk weight: over 100% to 250% 82.8 0.0 10.6 0.0
Risk weight: over 250% under 1,250% 6.8 — 1.8 —
Risk weight: 1,250% 1.8 — 1.9 —
As an investor 3,518.7 — 43.5 —
Risk weight: to 20% 3,351.2 — 26.1 —
Risk weight: over 20% to 50% 97.9 — 2.8 —
Risk weight: over 50% to 100% 45.3 — 3.0 —
Risk weight: over 100% to 250% 12.3 — 1.4 —
Risk weight: over 250% under 1,250% 3.4 — 0.9 —
Risk weight: 1,250% 8.4 — 9.0 —

78 Basel III Disclosure Fiscal 2014
(Amount of securitization exposures retained and the associated capital requirement for these exposures broken down into a number of risk weight bands) (continued) Billions of yen
March 31, 2014
Re-securitization exposure
Amount of securitization exposures
Capital requirement
On balance sheet
Off balance sheet
On balance sheet
Off balance sheet
Total as an originator — — — —
Traditional securitizations (asset transfer type) — — — —
Risk weight: to 30% — — — —
Risk weight: over 30% to 150% — — — —
Risk weight: over 150% to 350% — — — —
Risk weight: over 350% to 500% — — — —
Risk weight: over 500% under 1,250% — — — —
Risk weight: 1,250% — — — —
Synthetic securitizations — — — —
Risk weight: to 30% — — — —
Risk weight: over 30% to 150% — — — —
Risk weight: over 150% to 350% — — — —
Risk weight: over 350% to 500% — — — —
Risk weight: over 500% under 1,250% — — — —
Risk weight: 1,250% — — — —
Sponsor of asset-backed commercial paper (ABCP) program — — — —
Risk weight: to 30% — — — —
Risk weight: over 30% to 150% — — — —
Risk weight: over 150% to 350% — — — —
Risk weight: over 350% to 500% — — — —
Risk weight: over 500% under 1,250% — — — —
Risk weight: 1,250% — — — —
As an investor 436.8 — 11.2 —
Risk weight: to 30% 401.0 — 8.2 —
Risk weight: over 30% to 150% 29.4 — 1.8 —
Risk weight: over 150% to 350% 6.2 — 1.1 —
Risk weight: over 350% to 500% — — — —
Risk weight: over 500% under 1,250% — — — —
Risk weight: 1,250% — — — —

79 Basel III Disclosure Fiscal 2014
(Amount of securitization exposures retained and the associated capital requirement for these exposures broken down into a number of risk weight bands) (continued) Billions of yen
March 31, 2015
Other than re-securitization exposure
Amount of securitization exposures
Capital requirement
On balance sheet
Off balance sheet
On balance sheet
Off balance sheet
Total as an originator 4,902.3 826.3 111.1 8.2
Traditional securitizations (asset transfer type) 483.1 — 46.0 —
Risk weight: to 20% — — — —
Risk weight: over 20% to 50% — — — —
Risk weight: over 50% to 100% 375.0 — 28.3 —
Risk weight: over 100% to 250% 91.7 — 11.2 —
Risk weight: over 250% under 1,250% 16.2 — 6.4 —
Risk weight: 1,250% 0.0 — 0.0 —
Synthetic securitizations — — — —
Risk weight: to 20% — — — —
Risk weight: over 20% to 50% — — — —
Risk weight: over 50% to 100% — — — —
Risk weight: over 100% to 250% — — — —
Risk weight: over 250% under 1,250% — — — —
Risk weight: 1,250% — — — —
Sponsor of asset-backed commercial paper (ABCP) program 4,419.2 826.3 65.1 8.2
Risk weight: to 20% 3,993.3 788.7 26.4 5.2
Risk weight: over 20% to 50% 177.1 14.5 4.7 0.4
Risk weight: over 50% to 100% 90.0 13.7 6.1 1.0
Risk weight: over 100% to 250% 131.9 5.8 19.6 0.5
Risk weight: over 250% under 1,250% 24.5 3.4 5.8 1.0
Risk weight: 1,250% 2.1 — 2.2 —
As an investor 4,229.5 — 50.9 —
Risk weight: to 20% 4,089.8 — 31.2 —
Risk weight: over 20% to 50% 84.6 — 2.4 —
Risk weight: over 50% to 100% 27.7 — 2.0 —
Risk weight: over 100% to 250% 11.5 — 1.4 —
Risk weight: over 250% under 1,250% 7.2 — 4.8 —
Risk weight: 1,250% 8.4 — 8.9 —

80 Basel III Disclosure Fiscal 2014
(Amount of securitization exposures retained and the associated capital requirement for these exposures broken down into a number of risk weight bands) (continued) Billions of yen
March 31, 2015
Re-securitization exposure
Amount of securitization exposures
Capital requirement
On balance sheet
Off balance sheet
On balance sheet
Off balance sheet
Total as an originator — — — —
Traditional securitizations (asset transfer type) — — — —
Risk weight: to 30% — — — —
Risk weight: over 30% to 150% — — — —
Risk weight: over 150% to 350% — — — —
Risk weight: over 350% to 500% — — — —
Risk weight: over 500% under 1,250% — — — —
Risk weight: 1,250% — — — —
Synthetic securitizations — — — —
Risk weight: to 30% — — — —
Risk weight: over 30% to 150% — — — —
Risk weight: over 150% to 350% — — — —
Risk weight: over 350% to 500% — — — —
Risk weight: over 500% under 1,250% — — — —
Risk weight: 1,250% — — — —
Sponsor of asset-backed commercial paper (ABCP) program — — — —
Risk weight: to 30% — — — —
Risk weight: over 30% to 150% — — — —
Risk weight: over 150% to 350% — — — —
Risk weight: over 350% to 500% — — — —
Risk weight: over 500% under 1,250% — — — —
Risk weight: 1,250% — — — —
As an investor 309.1 — 5.9 —
Risk weight: to 30% 302.4 — 5.4 —
Risk weight: over 30% to 150% 5.4 — 0.2 —
Risk weight: over 150% to 350% 1.2 — 0.2 —
Risk weight: over 350% to 500% — — — —
Risk weight: over 500% under 1,250% — — — —
Risk weight: 1,250% — — — —
(Application of credit risk mitigation methods to re-securitization exposures)
Not applicable as of March 31, 2014 and 2015.

81 Basel III Disclosure Fiscal 2014
(Credit risk-weighted asset amount calculated using transitional arrangements for securitization exposures) Billions of yen
March 31, 2014 March 31, 2015
As an originator — —
As an investor 6.9 —
Total 6.9 —
Note: Figures refer to credit risk-weighted assets calculated using transitional arrangements as stipulated in Article 15 of the Supplementary Provisions to the FSA Holding Company Capital Adequacy Notification. Specifically, in those cases where the standardized approach is applied as an exception that includes securitiza-tion exposures, figures refer to credit risk-weighted assets calculated using a transitional arrangement whereby such assets values are capped at the greater of the value based on the Former Notification as stipulated in the Supplementary Provisions to the FSA Holding Company Capital Adequacy Notification or the value if the underlying assets were retained. There were no relevant exposures as of March 31, 2015 following the end of the transitional period on June 30, 2014.
SECURITIZATION EXPOSURES (Subject to calculation of market risk equivalent amount)
Information on underlying assets
There were no securitization exposures during fiscal 2013 and as of March 31, 2014, and during fiscal 2014 and as of March 31, 2015.
(Amount of assets held for the purpose of securitization)
There were no assets held for the purpose of securitization transactions as of March 31, 2014 and 2015.
Information on securitization exposures retained(By type of underlying asset)
There were no assets held as an originator as of March 31, 2014 and 2015.
Billions of yen
March 31, 2014 March 31, 2015
Amount of securitization exposures
Amount of securitization
exposures that have been
deducted from Tier 1 capital
(Amount equivalent to
increase in capital)
(Note 1)
Capital deductions
related to securitization
exposures (Note 2)
Amount of securitization exposures
Amount of securitization
exposures that have been
deducted from Tier 1 capital
(Amount equivalent to
increase in capital)
(Note 1)
Capital deductions
related to securitization
exposures (Note 2)
Other than re-
securitization exposures
Re- securitization
exposures
Other than re-
securitization exposures
Re- securitization
exposures
As an investor 0.0 — / — 0.0 — / —
Residential mortgage 0.0 — / — 0.0 — / —
Apartment loan 0.0 — / — 0.0 — / —
Credit card receivables 0.0 — / — 0.0 — / —
Corporate loans 0.0 — / — 0.0 — / —
Other assets 0.0 — / — 0.0 — / —
Notes: 1. The amounts equivalent to increase in equity capital resulting from securitization correspond to Tier 1 capital deductions in line with Article 5 of the FSA Holding Company Capital Adequacy Notification, and include any gains on disposal of the underlying assets relating to the securitization.
2. Figures listed refer to capital deductions as stipulated in Article 280-5, Paragraph 2 of the FSA Holding Company Capital Adequacy Notification.

82 Basel III Disclosure Fiscal 2014
(Securitization exposures subject to early amortization provisions as an originator)
There were no securitization exposures subject to early amortization provisions as an originator as of March 31, 2014 and 2015.
(Amount of securitization exposures retained and the associated capital requirement for these exposures broken down into a number of risk weight bands)
There was no securitization exposure as an originator as of March 31, 2014 and 2015.
Billions of yen
March 31, 2014
Other than re-securitization exposures Re-securitization exposures
Amount of securitization
exposuresCapital
requirement
Amount of securitization
exposuresCapital
requirement
As an investor 0.0 0.0 — —
Risk weight: to 1.6% 0.0 0.0 — —
Risk weight: over 1.6% to 4% 0.0 0.0 — —
Risk weight: over 4% to 8% 0.0 0.0 — —
Risk weight: over 8% to 20% 0.0 0.0 — —
Risk weight: over 20% under 100% 0.0 0.0 — —
Risk weight: 100% 0.0 0.0 — —
Billions of yen
March 31, 2015
Other than re-securitization exposures Re-securitization exposures
Amount of securitization
exposuresCapital
requirement
Amount of securitization
exposuresCapital
requirement
As an investor 0.0 0.0 — —
Risk weight: to 1.6% 0.0 0.0 — —
Risk weight: over 1.6% to 4% 0.0 0.0 — —
Risk weight: over 4% to 8% 0.0 0.0 — —
Risk weight: over 8% to 20% 0.0 0.0 — —
Risk weight: over 20% under 100% 0.0 0.0 — —
Risk weight: 100% 0.0 0.0 — —
(Securitization exposures subject to measurement of comprehensive risk)
There were no securitization exposures subject to measurement of comprehensive risk as of March 31, 2014 and 2015.

83 Basel III Disclosure Fiscal 2014
LIQUIDITY RISK
Major liquid assets
Billions of yen
March 31, 2014 March 31, 2015
MUFG MUFGBTMU MUTB MUSH BTMU MUTB MUSH
Cash and deposits 23,969.9 21,016.9 2,219.1 1,133.8 40,488.3 33,673.9 5,915.2 1,157.2Domestic securities 50,388.0 37,497.5 7,014.0 5,984.4 43,178.7 32,632.7 6,595.2 4,068.2
Japanese government bonds 46,090.8 33,907.4 6,674.4 5,616.9 38,771.1 28,963.7 6,281.5 3,633.2
Municipal bonds 285.0 200.8 0.2 83.9 326.0 191.3 0.2 134.5Corporate bonds 4,012.2 3,389.3 339.4 283.6 4,081.7 3,477.7 313.5 300.4
Foreign bonds 21,431.5 14,695.8 6,485.5 269.3 23,571.4 14,858.9 8,467.6 249.2Domestic equity securities 5,004.3 3,557.7 860.0 642.9 6,319.2 4,685.4 1,084.4 617.9
Foreign equity securities 217.5 217.3 0.4 0.0 191.4 192.0 0.0 0.0
Others 6,363.4 4,724.0 728.9 907.2 8,226.7 5,560.0 1,178.1 1,486.4Subtotal 107,374.7 81,709.1 17,307.9 8,937.6 121,975.7 91,602.9 23,240.6 7,579.0
(Less) Assets pledged (30,266.3) (20,259.4) (9,083.4) (5,809.0) (37,370.9) (22,554.6) (11,790.4) (3,799.1)
Total 77,108.4 61,449.7 8,224.4 3,128.6 84,604.8 69,048.3 11,450.2 3,779.9
Notes: 1. Investment securities in the above table comprise securities available-for-sale, securities being-held-to-maturity and trading securities that have a quoted market value.
2. Assets pledged represent securities pledged primarily for borrowings, bills sold, foreign exchange transactions, and futures transactions. 3. Figures in the above table do not represent high quality liquid assets under the Basel III regulatory regime. High quality liquid assets would be a smaller
segment of the liquid assets presented in the above table. 4. Figures under MUFG reflect intergroup eliminations. Accordingly, these figures do not represent the sum of figures for the major operating entities.
Maturity profiles for major funding sourcesMaturity profiles of time deposits and negotiable deposits, and borrowings and bonds
Billions of yen
March 31, 2014
Due in 1 year or less
Due over 1 year to
3 years
Due over 3 years to
5 years
Due over 5 years to
7 years
Due over 7 years to
10 yearsDue over 10 years
Time deposits and negotiable deposits 61,059.1 9,056.2 1,391.6 93.8 92.4 2.7
Borrowings 7,266.0 1,977.0 538.2 198.2 564.2 285.0
Bonds 1,412.0 2,070.0 1,277.3 682.5 1,265.0 894.6Total 69,737.1 13,103.3 3,207.1 974.5 1,921.6 1,182.3
Billions of yen
March 31, 2015
Due in 1 year or less
Due over 1 year to
3 years
Due over 3 years to
5 years
Due over 5 years to
7 years
Due over 7 years to
10 yearsDue over 10 years
Time deposits and negotiable deposits 60,804.8 9,118.9 1,506.0 83.5 104.4 0.2
Borrowings 5,953.9 2,030.8 4,791.1 213.7 494.2 382.5
Bonds 1,833.4 2,490.7 1,488.4 1,230.1 954.6 934.1Total 68,592.0 13,640.3 7,785.5 1,527.3 1,553.2 1,316.8
Notes: 1. The above tables show the maturity structure (duration to maturity or repayment) of deposits (time and negotiable) to our banking subsidiaries, borrowings, and bonds. 2. Bonds include short-term bonds and subordinated bonds. 3. Bonds and borrowings with no stated maturity are included in “Over 10 years” in the above tables.
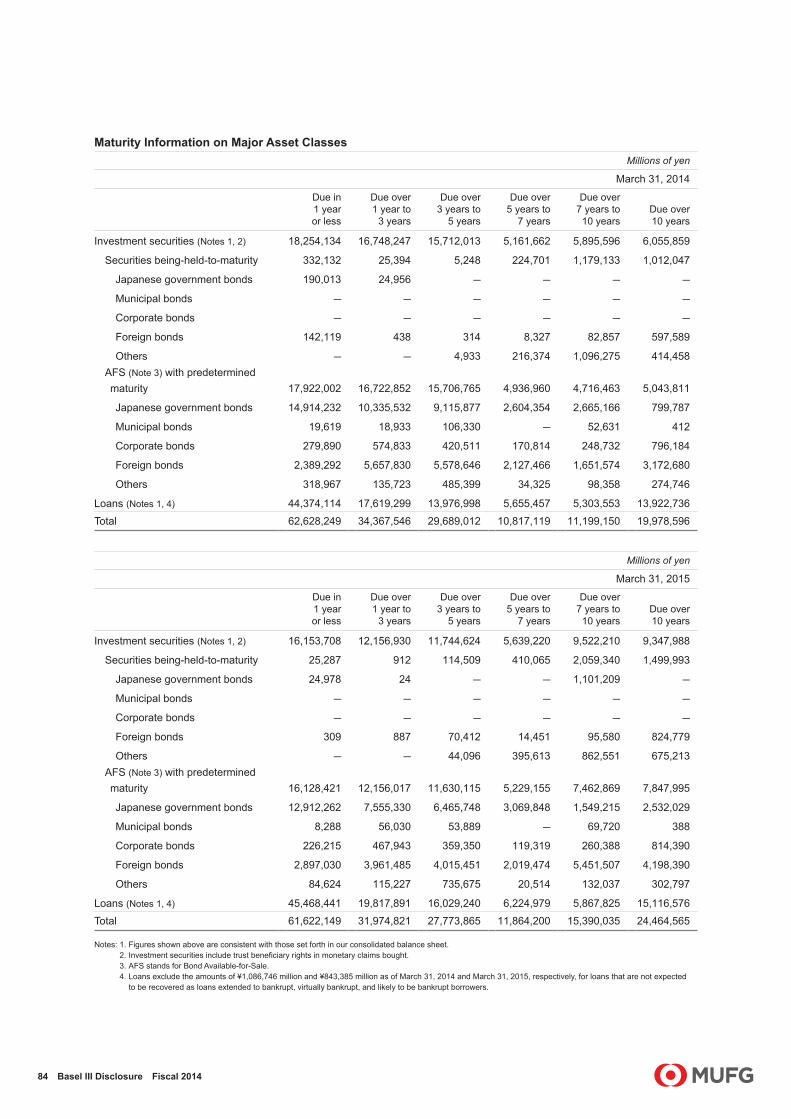
84 Basel III Disclosure Fiscal 2014
Maturity Information on Major Asset ClassesMillions of yen
March 31, 2014
Due in 1 year or less
Due over 1 year to
3 years
Due over 3 years to
5 years
Due over 5 years to
7 years
Due over 7 years to
10 yearsDue over 10 years
Investment securities (Notes 1, 2) 18,254,134 16,748,247 15,712,013 5,161,662 5,895,596 6,055,859
Securities being-held-to-maturity 332,132 25,394 5,248 224,701 1,179,133 1,012,047
Japanese government bonds 190,013 24,956 — — — —
Municipal bonds — — — — — —
Corporate bonds — — — — — —
Foreign bonds 142,119 438 314 8,327 82,857 597,589
Others — — 4,933 216,374 1,096,275 414,458AFS (Note 3) with predetermined maturity 17,922,002 16,722,852 15,706,765 4,936,960 4,716,463 5,043,811
Japanese government bonds 14,914,232 10,335,532 9,115,877 2,604,354 2,665,166 799,787
Municipal bonds 19,619 18,933 106,330 — 52,631 412
Corporate bonds 279,890 574,833 420,511 170,814 248,732 796,184
Foreign bonds 2,389,292 5,657,830 5,578,646 2,127,466 1,651,574 3,172,680
Others 318,967 135,723 485,399 34,325 98,358 274,746
Loans (Notes 1, 4) 44,374,114 17,619,299 13,976,998 5,655,457 5,303,553 13,922,736Total 62,628,249 34,367,546 29,689,012 10,817,119 11,199,150 19,978,596
Millions of yen
March 31, 2015
Due in 1 year or less
Due over 1 year to
3 years
Due over 3 years to
5 years
Due over 5 years to
7 years
Due over 7 years to
10 yearsDue over 10 years
Investment securities (Notes 1, 2) 16,153,708 12,156,930 11,744,624 5,639,220 9,522,210 9,347,988
Securities being-held-to-maturity 25,287 912 114,509 410,065 2,059,340 1,499,993
Japanese government bonds 24,978 24 — — 1,101,209 —
Municipal bonds — — — — — —
Corporate bonds — — — — — —
Foreign bonds 309 887 70,412 14,451 95,580 824,779
Others — — 44,096 395,613 862,551 675,213AFS (Note 3) with predetermined maturity 16,128,421 12,156,017 11,630,115 5,229,155 7,462,869 7,847,995
Japanese government bonds 12,912,262 7,555,330 6,465,748 3,069,848 1,549,215 2,532,029
Municipal bonds 8,288 56,030 53,889 — 69,720 388
Corporate bonds 226,215 467,943 359,350 119,319 260,388 814,390
Foreign bonds 2,897,030 3,961,485 4,015,451 2,019,474 5,451,507 4,198,390
Others 84,624 115,227 735,675 20,514 132,037 302,797
Loans (Notes 1, 4) 45,468,441 19,817,891 16,029,240 6,224,979 5,867,825 15,116,576Total 61,622,149 31,974,821 27,773,865 11,864,200 15,390,035 24,464,565
Notes: 1. Figures shown above are consistent with those set forth in our consolidated balance sheet. 2. Investment securities include trust beneficiary rights in monetary claims bought. 3. AFS stands for Bond Available-for-Sale. 4. Loans exclude the amounts of ¥1,086,746 million and ¥843,385 million as of March 31, 2014 and March 31, 2015, respectively, for loans that are not expected
to be recovered as loans extended to bankrupt, virtually bankrupt, and likely to be bankrupt borrowers.

85 Basel III Disclosure Fiscal 2014
Pledged Assets Millions of yen
March 31, 2014 March 31, 2015
Cash and due from banks 1,668 —Trading assets 248,463 248,882Securities 2,323,845 4,629,478Loans and bills discounted 6,470,882 8,024,130Other assets 42,066 —Tangible fixed assets 45,742 —Total 9,132,669 12,902,491
Liabilities correspond to the pledged assets aboveDeposits 441,252 702,440Call money and bills sold 699,451 792,619Trading liabilities 56,905 22,131Borrowed money 7,388,047 10,778,786Bonds payable 49,593 34,336Acceptances and guarantees — 80,000
In addition to the above, the following assets were pledged for foreign exchange transactions or futures transactions.
Millions of yen
March 31, 2014 March 31, 2015
Cash and due from banks 2,840 2,571
Monetary claims bought 258,222 1,438,879
Trading assets 122,103 229,479
Securities 11,612,328 11,553,234
Loans and bills discounted 8,990,050 8,083,137
Assets sold under sales under repurchase agreements or loaned under securities lending transactions backed by cash pledges are as follows.
Millions of yen
March 31, 2014 March 31, 2015
Trading assets 4,310,348 4,373,913
Securities 11,834,623 16,501,920
Total 16,144,972 20,875,833
Corresponding payables
Payables under repurchase agreements 12,182,430 12,616,225
Payables under securities lending transactions 4,947,741 7,615,108
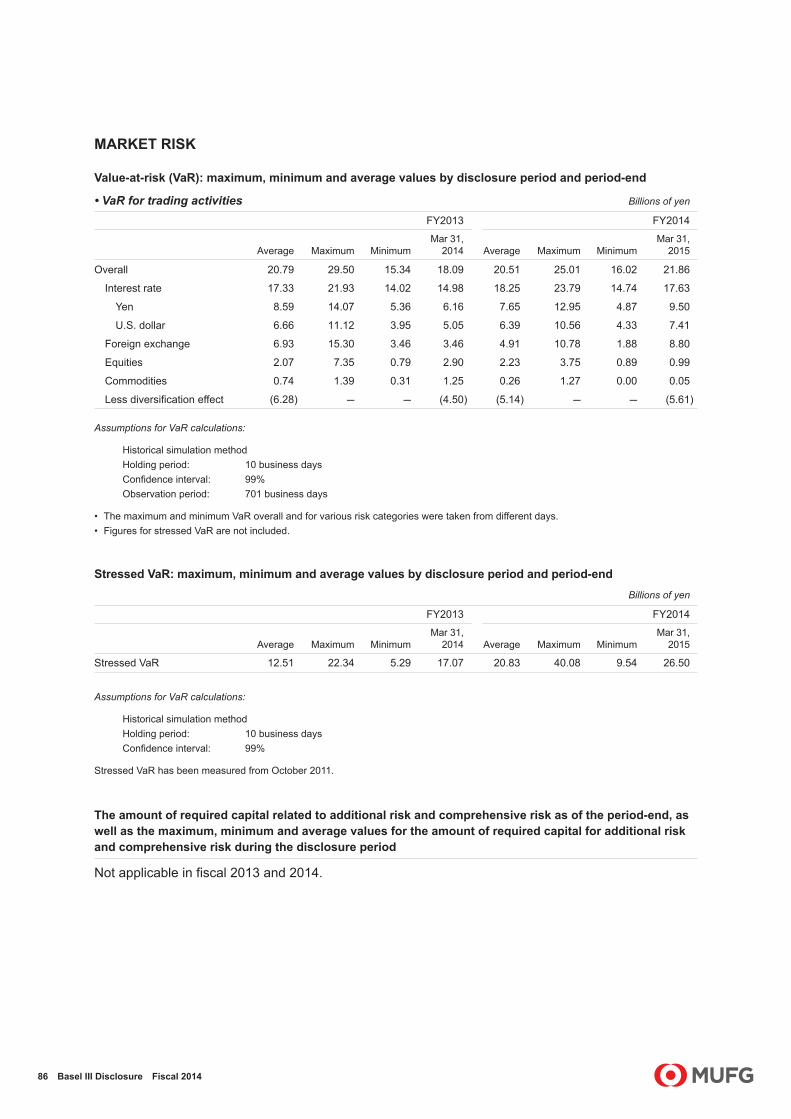
86 Basel III Disclosure Fiscal 2014
MARKET RISK
Value-at-risk (VaR): maximum, minimum and average values by disclosure period and period-end
• VaR for trading activities Billions of yen
FY2013 FY2014
Average Maximum MinimumMar 31,
2014 Average Maximum MinimumMar 31,
2015
Overall 20.79 29.50 15.34 18.09 20.51 25.01 16.02 21.86
Interest rate 17.33 21.93 14.02 14.98 18.25 23.79 14.74 17.63
Yen 8.59 14.07 5.36 6.16 7.65 12.95 4.87 9.50
U.S. dollar 6.66 11.12 3.95 5.05 6.39 10.56 4.33 7.41
Foreign exchange 6.93 15.30 3.46 3.46 4.91 10.78 1.88 8.80
Equities 2.07 7.35 0.79 2.90 2.23 3.75 0.89 0.99
Commodities 0.74 1.39 0.31 1.25 0.26 1.27 0.00 0.05
Less diversification effect (6.28) — — (4.50) (5.14) — — (5.61)
Assumptions for VaR calculations:
Historical simulation methodHolding period: 10 business daysConfidence interval: 99%Observation period: 701 business days
• The maximum and minimum VaR overall and for various risk categories were taken from different days.• Figures for stressed VaR are not included.
Stressed VaR: maximum, minimum and average values by disclosure period and period-endBillions of yen
FY2013 FY2014
Average Maximum MinimumMar 31,
2014 Average Maximum MinimumMar 31,
2015
Stressed VaR 12.51 22.34 5.29 17.07 20.83 40.08 9.54 26.50
Assumptions for VaR calculations:
Historical simulation methodHolding period: 10 business daysConfidence interval: 99%
Stressed VaR has been measured from October 2011.
The amount of required capital related to additional risk and comprehensive risk as of the period-end, as well as the maximum, minimum and average values for the amount of required capital for additional risk and comprehensive risk during the disclosure period
Not applicable in fiscal 2013 and 2014.

87 Basel III Disclosure Fiscal 2014
Note: Actual trading losses were within the range of VaR throughout the period studied.
Note: Actual trading losses were within the range of VaR throughout the period studied.
Note: Actual trading losses were within the range of VaR throughout the period studied.
Note: Actual trading losses were within the range of VaR throughout the period studied.
VaR
Dai
ly p
rofit
/loss
0
–6
–1212106 842
0
6
–9
3
–3
12
9Case of losses exceeding VaR: 0
VaR
Dai
ly p
rofit
/loss
0
–6
–1212106 842
0
6
–9
3
–3
12
9Case of losses exceeding VaR: 0
Market Risk Backtesting(April 1, 2014–March 31, 2015)
Market Risk Backtesting(April 1, 2013–March 31, 2014)
Billions of YenBillions of Yen
0
–3
–6
–9
–12
6
3
12
9Daily profit/loss
VaR shown on a negative scale
Mar. 2015Apr. 2014
0
–3
–6
–9
–12
6
3
12
9Daily profit/loss
VaR shown on a negative scale
Mar. 2014Apr. 2013
VaR and Daily Profit/Loss for Trading Activities(April 1, 2014–March 31, 2015)
VaR and Daily Profit/Loss for Trading Activities(April 1, 2013–March 31, 2014)
Billions of YenBillions of Yen
Results of market risk backtesting and explanations of any actual trading losses significantly in excess of VaR
Movement analysis of market risk-weighted assetsMarket risk-weighted assets increased by ¥0.17 trillion from March 31, 2014 mainly due to an increase in VaR based on the Internal Models Approach.
Trillions of yen
Market risk-weighted assets, previous period-end (March 31, 2014) 2.34
Internal Models Approach +0.19
VaR +0.13
Stressed VaR +0.06
Standardized Method (0.02)
Interest rate risk +0.02
Equity position risk (0.04)
Foreign exchange risk (0.01)
Others +0.00
Market risk-weighted assets, current period-end (March 31, 2015) 2.51

88 Basel III Disclosure Fiscal 2014
OPERATIONAL RISK
Movement analysis of operational risk-weighted assetsOperational risk-weighted assets increased ¥0.58 trillion from March 31, 2014 mainly due to an increase of ¥0.62 trillion based on the Advanced Measurement Approach. This increase was mainly the result of a payment in November 2014 of US$315 million (¥37.0 billion) by BTMU to the U.S. financial authorities.
Trillions of yen
Operational risk-weighted assets, previous period-end (March 31, 2014) 6.06
Advanced Measurement Approach 0.62
Internal Fraud 0.06
External Fraud 0.13
Employment Practices and Workplace Safety 0.05
Clients, Products, and Business Practices* 0.37
Damage to Physical Assets 0.03
Business Disruption and System Failures 0.01
Execution, Delivery and Process Management (0.06)Basic Indicator Approach (0.03)Operational risk-weighted assets, current period-end (March 31, 2015) 6.64
* Includes loss on repayment of excess interest in the consumer finance operations of Group subsidiaries.
EQUITY EXPOSURES IN BANKING BOOK
Amount on consolidated balance sheet and market values Billions of yen
March 31, 2014 March 31, 2015
Amount on consolidated
balance sheetMarket
value
Amount on consolidated
balance sheetMarket
value
Exposures to publicly traded equities (Note 1) 4,601.7 4,601.7 5,912.7 5,912.7
Equity exposures other than above (Note 2) 174.9 — 152.2 —
Total 4,776.6 — 6,065.0 —
Notes: 1. Figures only count Japanese and foreign equities held within securities available for sale with quoted market value. 2. Figures only count Japanese and foreign equities held within securities available for sale whose market values are not readily determinable.

89 Basel III Disclosure Fiscal 2014
Cumulative gains or losses arising from sales or write-offs of equity exposures Millions of yen
FY2013 FY2014
Gains on sales
Losses on sales Write-offs
Gains on sales
Losses on sales Write-offs
Equity exposures 171,653 (14,100) (12,979) 114,477 (16,532) (4,836)
Note: Figures refer to net gains or losses on equity securities within net non-recurring gains or losses.
Unrealized gains or losses recognized on consolidated balance sheet but not on consolidated statement of income Billions of yen
March 31, 2014 March 31, 2015
Acquisition cost
Amount on consolidated
balance sheet
Unrealized gains or
lossesAcquisition
cost
Amount on consolidated
balance sheet
Unrealized gains or
losses
Equity exposures 2,960.3 4,601.7 1,641.3 2,924.3 5,912.7 2,988.4
Note: Figures only count Japanese and foreign equities held within securities available for sale with quoted market value.
Unrealized gains or losses not recognized either on consolidated balance sheet or on consolidated statement of income
Not applicable as of March 31, 2014 and 2015.
Equity exposures subject to transitional arrangements (grandfathering provisions) Billions of yen
March 31, 2014 March 31, 2015
Exposures to publicly traded equities subject to transitional arrangements 4,126.7 —
Equity exposures other than above subject to transitional arrangements 114.5 —
Total 4,241.2 —
Note: Based on the transitional arrangements as stipulated in Article 13 of the Supplementary Provisions to the FSA Consolidated Capital Adequacy Notification, figures refer to the amount of equity exposures for which a 100% risk weight is used to calculate credit risk-weighted assets. There were no relevant exposures to equities, etc. as of March 31, 2015 following the end of the transitional period on June 30, 2014.

90 Basel III Disclosure Fiscal 2014
EXPOSURES RELATING TO FUNDS
Exposures relating to funds Billions of yen
March 31, 2014 March 31, 2015
Exposures relating to funds 2,699.6 3,495.2
Exposures where fund components are identifiable (look-through approach) (Note 1) 2,590.3 3,441.1
Exposures not included above where equity exposures constitute majority of total value of fund components (Note 2) 95.3 31.7
Exposures not included in any categories above where investment mandates of funds are known (Note 3) 8.2 19.5
Exposures not included in any categories above where the internal models approach is applied (Note 4) — —
Exposures not included in any categories above where there is a high probability of the weighted average risk weight applied to fund components being less than 400% (Note 5) 0.8 2.2
Exposures not included in any categories above (Note 5) 4.7 0.6
Notes: 1. As stipulated in Paragraph 1 of Article 145 of the FSA Consolidated Capital Adequacy Notification. 2. As stipulated in Paragraph 2 of Article 145 of the FSA Consolidated Capital Adequacy Notification. 3. As stipulated in Paragraph 3 of Article 145 of the FSA Consolidated Capital Adequacy Notification. 4. As stipulated in Paragraph 4 of Article 145 of the FSA Consolidated Capital Adequacy Notification. 5. As stipulated in Paragraph 5 of Article 145 of the FSA Consolidated Capital Adequacy Notification.
INTEREST RATE RISK IN THE BANKING BOOK (IRRBB)
Decline in economic values estimated with interest rate shocks applied to internal risk management
• VaR for non-trading activities Billions of yen
FY2013 FY2014Average Maximum Minimum Mar 31, 2014 Average Maximum Minimum Mar 31, 2015
Interest rate 400.8 459.8 304.2 304.2 387.0 455.0 305.6 396.8
Yen 223.8 276.5 183.3 190.4 239.5 280.1 196.3 264.7
U.S. dollar 183.8 230.2 135.8 140.8 121.7 145.8 99.7 132.8
Euro 109.8 156.1 57.9 60.9 133.3 173.9 60.9 148.2
Equities 161.3 202.4 100.6 172.9 161.3 185.7 125.9 158.0
Overall 410.7 462.1 332.1 332.1 394.8 452.7 332.4 412.6
Assumptions for VaR calculations:
Historical simulation methodHolding period: 10 business daysConfidence interval: 99%Observation period: 701 business days
• The maximum and minimum VaR overall and for various risk categories were taken from different days.• The equity-related risk figures do not include market risk exposure from our strategic equity portfolio.

91 Basel III Disclosure Fiscal 2014
INDICATORS FOR ASSESSING GLOBAL SYSTEMICALLY IMPORTANT BANKS (G-SIBs) Billions of yen
Item No. Description
As of March 31, 2014
As of March 31, 2015
1 Total exposures(= a + b + c + d):a. Counterparty exposure of derivatives contractsb. Gross value of securities financing transactions (SFTs) and counterparty
exposure of SFTsc. Other assets (other than assets specifically identified above and regulatory
adjustments to Tier 1 and CET1 capital under the fully phased-in Basel III framework)
d. Notional amount of off-balance sheet items (other than derivatives contracts and SFTs)
352,273.2 338,289.6
2 Intra-financial system assets(= a + b + c + d):a. Funds deposited with or lent to other financial institutions and undrawn
committed lines extended to other financial institutionsb. Holdings of securities issued by other financial institutions (Note 1)
c. Net positive current exposure of SFTs with other financial institutionsd. Over-the-counter (OTC) derivatives with other financial institutions that have a net
positive fair value
20,068.4 24,811.1
3 Intra-financial system liabilities (a + b + c):a. Deposits due to, and undrawn committed lines obtained from, other financial
institutionsb. Net negative current exposure of SFTs with other financial institutionsc. OTC derivatives with other financial institutions that have a net negative fair value
24,894.5 26,755.2
4 Securities outstanding (Note 1) 32,218.4 37,722.1
5 Assets under custody 160,278.0 183,594.0
6 Notional amount of OTC derivatives 1,121,068.1 1,364,986.6
7 Held-for-trading (HFT) securities and available-for-sale (AFS) securities, excluding HFT and AFS securities that meet the definition of Level 1 assets and Level 2 assets with haircuts (Note 2)
11,715.1 14,642.5
8 Level 3 assets (Note 3) 1,312.7 1,414.9
9 Cross-jurisdictional claims 76,747.8 87,578.6
10 Cross-jurisdictional liabilities 51,341.9 59,731.8
Item No. Description FY2013 FY2014
11 Payments (settled through the BOJ-NET, the Japanese Banks’ Payment Clearing Network and other similar settlement systems, excluding intragroup payments) 7,585,400.5 8,930,603.9
12 Underwritten transactions in debt and equity markets (Note 4) 8,129.6 9,970.0
Notes: 1. Securities refer to secured debt securities, senior unsecured debt securities, subordinated debt securities, commercial paper, certificate of deposits, and common equities.
2. Level 1 and Level 2 assets with haircuts are defined in the Basel III Liquidity Coverage Ratio (LCR). 3. The amount is calculated in accordance with U.S. GAAP. 4. This refers to underwriting of securities defined in article 2 paragraph 8 item 6 of the Financial Instruments and Exchange Act.

92 Basel III Disclosure Fiscal 2014
COMPOSITION OF LEVERAGE RATIO DISCLOSUREMillions of yen, %
Corresponding line No. on
Basel III disclosure template (Table 2)
Corresponding line No. on
Basel III disclosure template (Table 1) Item March 31, 2015
On-balance sheet exposures (1)
1 On-balance sheet exposures before deducting adjustments items 245,711,653
1a 1 Total assets reported in the consolidated balance sheet 286,149,768
1b 2The amount of assets of subsidiaries that are not included in the scope of the leverage ratio on a consolidated basis —
1c 7
The amount of assets of subsidiaries that are included in the scope of the leverage ratio on a consolidated basis (except those included in the total assets reported in the consolidated balance sheet) —
1d 3The amount of assets that are deducted from the total assets reported in the consolidated balance sheet (except adjustment items) (40,438,114)
2 7 The amount of adjustment items pertaining to Tier 1 capital (914,357)
3 Total on-balance sheet exposures (a) 244,797,296
Exposures related to derivatives transactions (2)
4 Replacement cost associated with derivatives transactions, etc. 5,613,817
5 Add-on amount associated with derivatives transactions, etc. 5,967,940
The amount of receivables arising from providing cash margin in relation to derivatives transactions, etc. 1,889,017
6
The amount of receivables arising from providing cash margin, provided where deducted from the consolidated balance sheet pursuant to the operative accounting framework 42,689
7The amount of deductions of receivables (out of those arising from providing cash variation margin) (413,514)
8
The amount of client-cleared trade exposures for which a bank or bank holding company acting as clearing member is not obliged to make any indemnification /
9 Adjusted effective notional amount of written credit derivatives 3,206,497
10The amount of deductions from effective notional amount of written credit derivatives (2,702,558)
11 4 Total exposures related to derivative transactions (b) 13,603,890
Exposures related to repo transactions (3)
12 The amount of assets related to repo transactions, etc. 14,924,924
13 The amount of deductions from the assets above (line 12) (3,251,928)
14 The exposures for counterparty credit risk for repo transactions, etc. 1,000,363
15 The exposures for agent repo transactions /
16 5 Total exposures related to repo transactions, etc. (c) 12,673,359
Exposures related to off-balance sheet transactions (4)
17 Notional amount of off-balance sheet transactions 83,494,349
18The amount of adjustments for conversion in relation to off-balance sheet transactions (55,394,279)
19 6 Total exposures related to off-balance sheet transactions (d) 28,100,069
Leverage ratio on a consolidated basis (5)
20 The amount of capital (Tier 1 capital) (e) 14,130,341
21 8 Total exposures ((a) + (b) + (c) + (d)) (f) 299,174,616
22 Leverage ratio on a consolidated basis ((e)/(f)) 4.72%