baseball and markov chains: power hitting and … · baseball and markov chains: power hitting and...
TRANSCRIPT
Baseball and MarkovChains: Power Hittingand Power SeriesJohn P. D’Angelo
As children, my friends and I oftenplayed a game called All-Star Baseball.Each of us would manage a team ofmajor league players. The players werecircular cards. Each card was divided
into labeled sectors of various sizes, correspond-ing to possible outcomes such as strikeout, walk,single, home run, and so on. The sizes variedconsiderably from player to player. To have aplayer bat, we placed the card on a spinner, fil-liped the spinner, and read the result. We all had aclear intuitive understanding of how the situationreflected baseball and how it didn’t.
We kept intricate stats. We experimented withways to make pitching matter. We introducedrandom fielding errors using a buzzer. Later Iinvented a version using dice instead of a spinner.Throwing four dice at a time was required toaccurately model the statistical profiles of actualplayers. I created new players. One (call himKingman) had only two possible outcomes, astrikeout and a home run. Another (call him Bowa)had only two outcomes, a single and a strikeout.I made the single on Bowa four times as likely asthe home run on Kingman. I would play full gamesin which one team had nine players like Bowa andthe other had nine players like Kingman.
Years later I realized that we had been regardingthe game of baseball as a Markov chain. Beforediscussing Markov chains and how to use themto model baseball, I pose three exercises for thereader. I put the first two of them in the book [DW](page 335), and I have assigned them on severaloccasions, in order to give an amusing applicationof summing power series. The following simple
John D’Angelo is professor of mathematics at the Univer-
sity of Illinois. His email address is [email protected].
lemma on power series, and its generalization tomore variables, can be used to evaluate explicitlymany of the expected value formulas arising in
a more involved treatment of these ideas. Thereader who wishes to focus on baseball may skip
the lemma, but she should at least attempt toestimate the answer to part 3 of Exercise 1.2. Theanswer appears in the conclusions.
Lemma 1.1. Let f be a polynomial of degree d in
one variable, and consider the power series
(1) s(x) =
∞∑
k=0
f (k)xk.
The series in (1) converges for |x| < 1, and there isa polynomial b(x) of degree at most d such that
(2) s(x) =b(x)
(1− x)d+1.
In particular, s is a rational function.
Lemma 1.1 can be proved by differentiating the
geometric series d times or by using the methodof generating functions. We include it becauseit provides an elegant method for solving the
key parts of Exercise 1.2, namely the formulas forK(q) and B(p). The calculation ofK(q) amounts to
finding the expectation of a random variable withthe negative binomial distribution. See page 95 of[HPS] for a derivation using probability generating
functions.
Exercise 1.1. Prove Lemma 1.1. Find s(x) explic-
itly when f (k) = k(
k+2
2
)
and when f (k) = k3.
Exercise 1.2. Consider a player (B) who hits a sin-gle with probability p and otherwise strikes out.Make the assumption that three singles score a
run. Assume that all at-bats are independent. Let
490 Notices of the AMS Volume 57, Number 4
B(p) denote the expected number of runs scored
per half inning (until three outs occur), assuming
only (B) bats. Consider a second player (K) whohits a home run with probability q and otherwise
strikes out. Let K(q) be the expected number ofruns scored per half inning.
• Prove that K(q) =3q
1−qand that B(p) =
p3(3p2−10p+10)
1−p.
• Sketch their graphs for 0 ≤ p ≤ 1.• Set q =
p
4. For what values of p is B(p) ≥
K(p
4)?
• Set q =2
5p. For what values of p is B(p) =
K(2p
5)?
• How does B(p) change if four singles are
required to score a run?
Exercise 1.3. Consider a player who hits a sin-gle with probability p, a home run with probabil-
ity q, and otherwise strikes out. Assume at-batsare independent and three singles score a run. For
each nonnegative integer k, find the probabilitythat this batter scores exactly k runs in a half in-
ning. (Be careful of runners left on base.)
This article is a short introduction to the ideas
connecting baseball and Markov chains. Manybaseball fans have invented fantasy baseball games
based on the Markov idea, and what I discuss inthis article is by now a well-established notion. I
do not intend to discuss the vast literature, but Ido mention a few entries to it.
Lindsey [L] viewed baseball in this fashion
as early as the 1950s. Cover and Keilers [CK]provided a Markov version for evaluating batters.
Pankin ([P] and also http://www.pankin.com/
markov/theory.htm) has written several precise
articles about baseball and Markov chains. See also
[N] and its references for serious discussion aboutthe evaluation of baseball players using these
methods. Katz [K] applies Markov chain analysisto the pitch count.
One of my favorite references on the subjectof mathematical baseball is [TP], to which I refer
for references published up to the early 1980s.
Thorn and Palmer also edited Total Baseball [TB],more than two thousand pages of discussion and
statistics. I am truly thankful for my research inseveral complex variables; without it I would have
spent thousands rather than merely hundreds
of hours with this volume. The many books byBill James (item [J] in our reference list gives
two early versions) helped introduce a generationof baseball fans to related ideas, especially the
notion of runs created. Many additional aspects
of baseball appeal to mathematicians. See, forexample, the recent book [R].
The main idea in this article is the notionof Markov runs. We imagine, as described more
precisely below, that a player is the only batter
on his team. He bats randomly based on his
statistics. How many runs will his team score?
We also imagine a pitcher who pitches randomly
based on his statistics. How many runs will his
team allow? Jeff Sagarin, once upon a time a
math major at MIT, publishes Markov-runs-per-
game baseball statistics (and much more) online
and updates them daily during the season. See
http://www.usatoday.com/sports/sagarin/
nlb09.htm.
Mostmathematically inclinedbaseball fanshave
played with their own formulations of these ideas,
and some baseball managers and executives have
embraced them. On the other hand, many people
in the baseball world sneer at “computer baseball”,
perhaps because they tremble with trepidation at
anything scientific. I will never forget my disgust
when a former Cubs manager, who was broadcast-
ing a game on the radio, dismissed a physicist’s
study of how a baseball travels in varying weather
conditions with “He don’t know baseball.”
This article is intended to be a short intro-
duction whose primary purpose is to illustrate
some of the connections between mathematics
and baseball. Let us pause and briefly mention
some interesting topics I omit.
One of the most interesting such topics con-
cerns the notion of a clutch hitter. Such a player
allegedly hits better when the situation matters
more, but numerical studies seem to indicate that
the concept is an illusion. On the other hand, the
discussion in this article presumes that each plate
April 2010 Notices of the AMS 491
appearance is an independent event. This assump-
tion cannot be completely true. How accurate is
it? A related question is whether players get hot.
See, for example, [A].What about fielding? Errors are rather unusual
occurrences in professional baseball, and fielding
percentages convey little important information.
More important is how many plays a defensiveplayer (fielder) makes. Would player (A) have
made the same play as player (B) did? Except
for completely routine plays, there is no way to
know. Recent studies of fielding have attemptedto measure how much ground a fielder covers.
Many subtleties arise, and I do not know of any
literature providing a good Markov chain model.
Hence this article will ignore fielding.Another omission from our discussion concerns
the impact of pitching. In principle one can account
for pitching via the Markov chain model, but,
typically, a player will have faced a specific pitchertoo few times for the statistical profile to be
meaningful. Instead one could use a weighted
average of the statistics of the pitcher (versus
all batters) and the batter (versus all pitchers).Careful studies would then answer empirically the
eternal conundrum: pitching is what percentage
of baseball? When asked this question, the catcher
Yogi Berra answered by saying “Ninety percent ofthis game is half mental.”
I acknowledge the following people (all with
Ph.D.s) for their insightful observations about
baseball statistics over the years: Phil Baldwin(physics), John Marden (statistics), Bob Northing-
ton (statistics), Bruce Reznick (mathematics), and
Kirk Sanders (classics). I also acknowledge NSFGrant DMS 07-53978 for research support. Finally
I wish to thank several referees for useful com-
ments on the exposition and for asking me to
expand the reference list.
Markov Chains
Let us now recall the concept of a Markov chain.
Let X1, X2, . . . , be a sequence of random variables
taking values in a finite set. We think of thissituation as a random system that can be in a
finite number of possible states, labeled e1, . . . , en.
The sequence of random variables is called a
Markov chain if the following holds:For each pair of indices i, j there is a fixed
probability Mij such that each time the system is
in state ei it will be in state ej the next time with
probability Mij .In other words, the conditional probability that
Xk+1 = ej given Xk = ei is, for each k, independent
of the values of Xm for m < k.
We will regard the states ei as basis vectorsfor n-dimensional real Euclidean space. Consider
a convex combination a(λ) =∑nj=1 λjej of these
states. (The coefficients λk are nonnegative, and
they sum to 1.) The n-tuple a(λ) is called a
probability vector. The coefficient λk represents
the probability that the system is in state ek at
some fixed unit of time.The system evolves in discrete intervals, often
but not necessarily regarded as units of time. In
baseball the unit will be a plate appearance. A plate
appearance is similar to an at-bat, but includescertain situations (walks, hit batters, sacrifices)
that baseball does not regard as an official at-bat.
The Markov matrix M , whose entries are Mij ,
governs the evolution of the system. If x denotesthe state at one moment (the value of the ran-
dom variable Xk), then Mx denotes the state one
moment later (the value of the random variable
Xk+1). The matrix is time independent; in otherwords, the chance of going from state x to state
Mx does not depend on any of the previous states.
The numberMij is called the transition probability
from state ei to state ej . Each Mij is nonnegativeand, because the state must go somewhere, we
have∑nj=1Mij = 1.
The reader should consult a book such as
[KSK] for a more precise treatment of Markovchains and references to their many applications.
Many elementary linear algebra books also discuss
Markov chains and their applications.
Baseball
How do we regard baseball as a Markov chain?
The number of outs and the location of the base-
runners will determine twenty-five states. We willkeep track of runs scored, but runs will not be
part of the setup. What are the states?
We regard all situations with three outs as
the same, and this situation is one of the states.Once we reach this state, we cannot leave it. For
clarity we mention that in the simplified model we
discuss, it makes no difference how many men are
on base or where they are located after the thirdout is made. Runs scored will be the only thing
that matters.
Otherwise the number of outs can be 0, 1, or 2,
and there are eight possibilities for the runners.The bases can be empty; there can be one runner
on first, second, or third base; there can be two
runners on (in three different ways); or the bases
can be loaded. These twenty-four situations definethe other states.
Player H comes to the plate. Ignoring such
situations as stolen bases or pick-offs that could
occur during the plate appearance, we ask whathappens after it. We imagine that the player
bats randomly, according to his statistical profile.
His plate appearances are independent. In other
words, his chance of getting a specific kind of hitor making a specific kind of out is independent
of how many runners are on and of how many
outs there are. Based on this profile, we compute
492 Notices of the AMS Volume 57, Number 4
the transition probabilities for each pair of states,obtaining a Markov chain.
We could use stats from the previous year,the current year, or the career. But we mustuse the same profile each time. For conveniencehere, we will write the player’s profile as follows,deviating slightly from the standard listing. HereAB denotes at-bats, S denotes singles, D denotesdoubles, T denotes triples,HR denotes home runs,BB denotes walks plus hit batters, AVE denotesbatting average, SA denotes slugging average, OBdenotes on-base average, and OPS = OB+SA. Wewill discuss this rather new statistic later. We notefor us that the number of plate appearances isAB + BB.
In the simplified scenario suggested above, weregard all outs as equivalent. Sluggers who oftenstrike out are fond of reminding their managersthat there is no practical difference between astrikeout and a pop-out. We will ignore doubleplays, sacrifice bunts, and sacrifice flies, also forsimplicity. As a result our values of OB and OPSdiffer slightly from those in the official records.
Here is the profile; note that the last fourelements can be computed from the first six, andhence they are not truly needed.
AB S D T HR BB AVE SA OB OPS
For example, we give a fictional line for a starplayer X. We also include actual profiles for AlbertPujols and Chase Utley in 2009.
(X) 500 100 25 5 30 100 .320 .570 .433 1.003(AP) 568 93 45 1 47 124 .327 .658 .443 1.101(CU) 571 98 28 4 31 112 .282 .508 .398 .905
PlayerX has 500 at-bats but 600 plate appearances.
In a given plate appearance playerX has a1
6chance
to hit a single, a1
6chance to reach first base by
either a walk or hit batter, a1
120chance to hit a
triple, and so on.We mention a small point here. In certain
situations different actions by the batter producethe same effect. For example, if no one is on base,then a single and a walk have the same effect. Onthe other hand, assuming that a single advances arunner two bases, a single with a runner on secondis far better than is a walk.
The sequence of random variables will be thelist of situations arising in a half inning. It iseasier to understand the baseball situation byfocusing on the transition matrix. Given the batterH, we determine from his statistical profile a(twenty-five by twenty-five) matrix MH . Under theassumptions discussed below, we claim that MH
defines a Markov chain.We know the complete statistical profile of H.
In other words, we know the probabilities that Hmakes each kind of hit or out, draws a walk, getshit by a pitch, and so on. We assume a fixed resultgiven each type of hit; for example, a single always
advances runners two bases. We could, but we do
not do so here, refine the model by allowing severaldifferent kinds of singles! Assuming that each plateappearance is independent (and in particular thatwhat the batter does does not depend on the
pitcher), we can assign probabilities that we passfrom each state x to the state MH(x).
In this manner we encode the statistical profileof the player as a Markov matrix. For the playerKingman who either hits a home run with prob-
ability q or strikes out, we can easily determinethe matrix MK . We will not write out this 25 by25 matrix. We simply note that, with probability1−q, the number of outs increases by one and the
base runners remain the same. With probabilityq, the number of outs remains the same, and thebases are cleared. Of course, the batter and thebase runners all score a run in this case.
Now that we are regarding baseball as a Markovchain, there is little point in keeping the usualstatistics. We know, for example, that a playerwho hits a home run every ten at-bats will on
average hit one every ten at-bats in the Markovmodel. The key new statistic is how many runs willa team score if it uses this player for every plateappearance. We naturally call this statistic Markovruns. As we mentioned earlier, Sagarin publishes
this stat, normalized using nine innings, for allplayers each day of the season.
It is possible, but inappropriate for this shortarticle, to combine probability theory and linear al-
gebra to compute the expected number of Markovruns by using the Markov matrix. Such results
April 2010 Notices of the AMS 493
generalize the idealized situations discussed in
Exercise 1.2. Rather than heading in this direc-tion, we imagine finding expected Markov runsvia computer simulation. We will then considerthe relationship between Markov runs and otherbaseball statistics.
Given the statistical profile, the player batsrandomly, using a computer simulation, according
to the Markov chain model, until he makes threeouts. The test is run thousands of times, and fromit we determine the average number of runs scoredper each nine innings. Below we will see that ateam consisting of (nine clones of) Albert Pujolswould score 9.38 runs per game; no other NationalLeague player would come within one run of himin 2009.
Some nice simplifications and approximationsto these computations are known. Bill James [J]has found many formulas for runs created. In 1978Pete Palmer [TP] ran a computer simulation of allgames played since 1901. From this mammothamount of data, he assigned linear weights to eachbatting event. Palmerperformedthese calculations
separately for the years 1901–1920, 1921–1940,1941–1960, and 1961–1978. The positive valuesof hits and the negative values of outs are notidentical over the four periods, but they are allclose to the following values:
A home run is worth 1.40 runs, a triple is worth1.02, a double is worth .80, a single is worth .46runs, and a walk is worth .33 runs. An out is
worth −.25 runs. Given a profile, one can estimateMarkov runs using these weights.
A second simplification now appears in officialbaseball statistics. One simply adds the player’sslugging average to his on-base average, obtainingwhat is called OPS. It was discovered empiricallythat this number correlates fairly well with the
expected number of runs scored using the Markovchain model. The list below of the top ten NLbatters in 2009, ordered by Markov runs, suggestsa correlation. It is likely that the correlation be-tween Markov runs andOPS has been investigatedcarefully, but I do not know any references otherthan [J] and [TP], which are intended for baseballfans rather than for statisticians.
We make an important remark. For the actualvalues arising in baseball, OPS and Markov runsprovide similar information. On the other hand,two players can have identical OPS but verydifferent Markov runs. We give an example.
Example 3.1. We consider player one to have theprofile of our contrived Bowa. His slugging averageand his on-base average both equal p, and hencehisOPS is 2p. Now consider a player with the pro-file of Kingman, who hits a home run with prob-
ability q and otherwise strikes out. His sluggingaverage is 4q, and his on-base average is q. Hence
his OPS is 5q. Hence, if q =2
5p, then the two
players have the same OPS. By Exercise 1.2, one
sees that the Markov runs are not the same in
general even when this equality holds. One can
derive this conclusion more easily by noting what
happens when p approaches 1. (Can analysis be
worthwhile?) Obviously the Markov runs for Bowa
approach infinity, whereas the Markov runs for
Kingman are finite when q =2
5.
From a mathematician’s perspective OPS is a
bit strange. Let TB denote total bases, that is,
(TB) TB = S + 2D + 3T + 4HR.
Roughly speaking, because we are ignoring sac-rifices, as noted before, we compute OPS asfollows:
OPS =TB
AB+S +D + T +HR + BB
AB + BB
=S + 2D + 3T + 4HR
AB+S +D + T +HR + BB
AB + BB.
(OPS)
Formula (OPS) shows that we are adding two
quantities with different denominators, at-bats
and plate appearances. Perhaps a better number
would be something such as
(3)BB + 2S + 3D + 4T + 5HR
AB + BB.
Notice that (3) is essentially a linear weights
formula.
Next we list, based on the Sagarin ratings for
2009, the top ten players in the National League,
based on expected number of runs scored per
nine innings computed via Markov chains. In this
list, the first number after the player’s name and
team is this expected number of runs. The other
494 Notices of the AMS Volume 57, Number 4
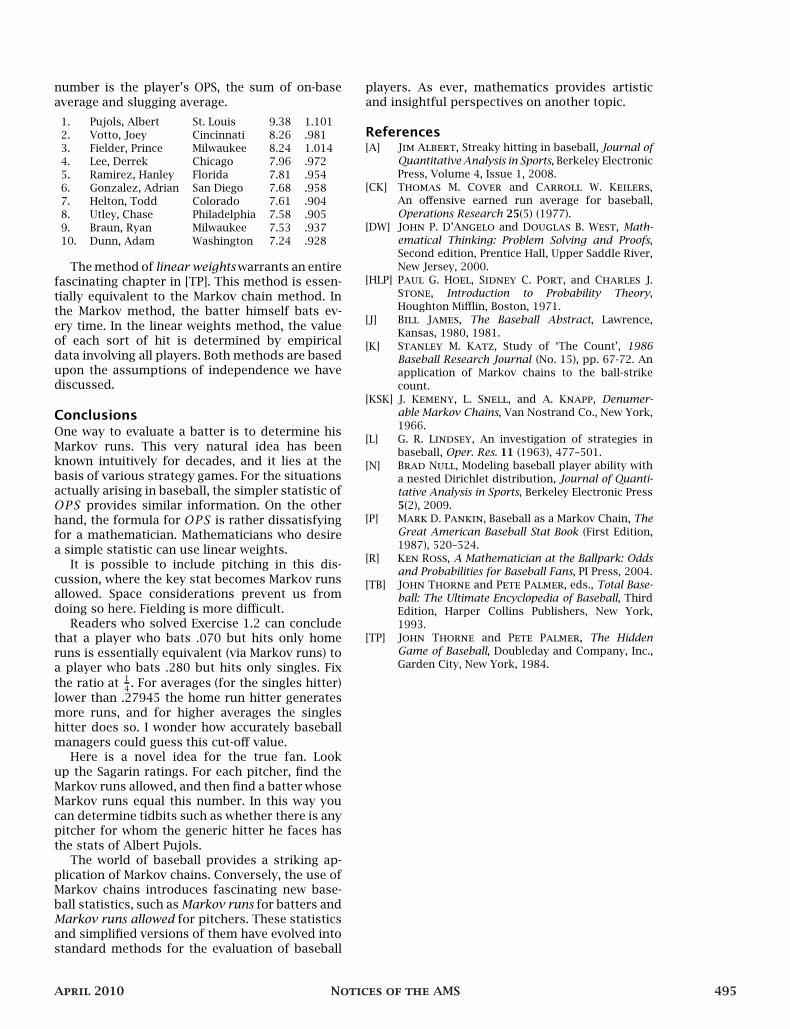
number is the player’s OPS, the sum of on-base
average and slugging average.
1. Pujols, Albert St. Louis 9.38 1.101
2. Votto, Joey Cincinnati 8.26 .981
3. Fielder, Prince Milwaukee 8.24 1.014
4. Lee, Derrek Chicago 7.96 .972
5. Ramirez, Hanley Florida 7.81 .954
6. Gonzalez, Adrian San Diego 7.68 .958
7. Helton, Todd Colorado 7.61 .904
8. Utley, Chase Philadelphia 7.58 .905
9. Braun, Ryan Milwaukee 7.53 .937
10. Dunn, Adam Washington 7.24 .928
The method of linear weights warrants an entirefascinating chapter in [TP]. This method is essen-
tially equivalent to the Markov chain method. Inthe Markov method, the batter himself bats ev-
ery time. In the linear weights method, the valueof each sort of hit is determined by empirical
data involving all players. Both methods are basedupon the assumptions of independence we havediscussed.
Conclusions
One way to evaluate a batter is to determine his
Markov runs. This very natural idea has beenknown intuitively for decades, and it lies at the
basis of various strategy games. For the situationsactually arising in baseball, the simpler statistic ofOPS provides similar information. On the other
hand, the formula for OPS is rather dissatisfyingfor a mathematician. Mathematicians who desire
a simple statistic can use linear weights.It is possible to include pitching in this dis-
cussion, where the key stat becomes Markov runsallowed. Space considerations prevent us from
doing so here. Fielding is more difficult.Readers who solved Exercise 1.2 can conclude
that a player who bats .070 but hits only home
runs is essentially equivalent (via Markov runs) toa player who bats .280 but hits only singles. Fix
the ratio at1
4. For averages (for the singles hitter)
lower than .27945 the home run hitter generates
more runs, and for higher averages the singleshitter does so. I wonder how accurately baseball
managers could guess this cut-off value.Here is a novel idea for the true fan. Look
up the Sagarin ratings. For each pitcher, find theMarkov runs allowed, and then find a batter whoseMarkov runs equal this number. In this way you
can determine tidbits such as whether there is anypitcher for whom the generic hitter he faces has
the stats of Albert Pujols.The world of baseball provides a striking ap-
plication of Markov chains. Conversely, the use ofMarkov chains introduces fascinating new base-
ball statistics, such as Markov runs for batters andMarkov runs allowed for pitchers. These statisticsand simplified versions of them have evolved into
standard methods for the evaluation of baseball
players. As ever, mathematics provides artisticand insightful perspectives on another topic.
References
[A] Jim Albert, Streaky hitting in baseball, Journal of
Quantitative Analysis in Sports, Berkeley Electronic
Press, Volume 4, Issue 1, 2008.
[CK] Thomas M. Cover and Carroll W. Keilers,
An offensive earned run average for baseball,
Operations Research 25(5) (1977).
[DW] John P. D’Angelo and Douglas B. West, Math-
ematical Thinking: Problem Solving and Proofs,
Second edition, Prentice Hall, Upper Saddle River,
New Jersey, 2000.
[HLP] Paul G. Hoel, Sidney C. Port, and Charles J.
Stone, Introduction to Probability Theory,
Houghton Mifflin, Boston, 1971.
[J] Bill James, The Baseball Abstract, Lawrence,
Kansas, 1980, 1981.
[K] Stanley M. Katz, Study of ‘The Count’, 1986
Baseball Research Journal (No. 15), pp. 67-72. An
application of Markov chains to the ball-strike
count.
[KSK] J. Kemeny, L. Snell, and A. Knapp, Denumer-
able Markov Chains, Van Nostrand Co., New York,
1966.
[L] G. R. Lindsey, An investigation of strategies in
baseball, Oper. Res. 11 (1963), 477–501.
[N] Brad Null, Modeling baseball player ability with
a nested Dirichlet distribution, Journal of Quanti-
tative Analysis in Sports, Berkeley Electronic Press
5(2), 2009.
[P] Mark D. Pankin, Baseball as a Markov Chain, The
Great American Baseball Stat Book (First Edition,
1987), 520–524.
[R] Ken Ross, A Mathematician at the Ballpark: Odds
and Probabilities for Baseball Fans, PI Press, 2004.
[TB] John Thorne and Pete Palmer, eds., Total Base-
ball: The Ultimate Encyclopedia of Baseball, Third
Edition, Harper Collins Publishers, New York,
1993.
[TP] John Thorne and Pete Palmer, The Hidden
Game of Baseball, Doubleday and Company, Inc.,
Garden City, New York, 1984.
April 2010 Notices of the AMS 495