base line survey in the minority … report district lucknow.pdf · base line survey in the...
TRANSCRIPT

BASE LINE SURVEY IN THE MINORITY
CONCENTRATED DISTRICTS OF UTTAR PRADESH
(Report Of The District Lucknow)
Sponsored by Ministry of Minority Affairs
Government of India New Delhi
Study conducted by
Nomita P. Kumar
Giri Institute of Development Studies Sector ‘O’ Aliganj Housing Scheme
Lucknow 226024 May 2008

2
CONTENTS
Map of Lucknow District i
Executive Summary ii-iv
CHAPTER I BACKGROUND OF THE STUDY 1-4 CHAPTER I I SOCIO-ECONOMIC STATUS OF 4-17 DISTRICT BARABANKI CHAPTER III SITUATIONAL ANALYSIS OF SAMPLE 18-35 VILLAGES IN DISTRICT BARABANKI CHAPTER I V SOCIO-ECONOMIC STATUS OF RURAL 36-71
HOUSEHOLDS IN DISTRICT BARABANKI CHAPTER V DEVELOPMENT GAPS AND REMEDIES 72-75 THEREOF

ii
List of Tables
Chapter I : Background of the Study i. List of Selected Sample Villages in District Lucknow
Chapter II: Socio-Economic Profile of Lucknow District
Table 1: Demographic Features Table 2: Distribution of Population by Religion Table 3: Housing Amenities Table 4: Employment Structure of the Workforce Table 5: Land use Pattern Table: 6. Irrigation Coverage and Sources (2003 - 04) Table: 7. No. of Operational Holdings and Area according to Agricultural Census 1995 -96. Table 7: Cropping Pattern in the District Table 8: Productivity of Major Crops (2004 - 05) Table 9: Livestock Population in Lucknow District- (17 th Census-2003) Table 10: Industrial Development (2003-04) Table 11: Indicators of Economic Infrastructure Table 12: Indicators of Social Development Table 13: Income and Poverty in Lucknow District and Uttar Pradesh Chapter III: Socio Economic Status of Sample V illages in District Lucknow
Table 1: Religion-wise population Table 2: Occupational Pattern Table 3: Land Use Pattern
Table 4: Sources of Irrigation
Table 5: Non-Agricultural Activities in the village or near by: Table 6: Artisan/Handicraft activities in the village: Table 7: Hospitals and Dispensaries Table 8: Facilities at the Sub-centre or PHC (number of villages) Table 9: Frequency of visit of Health Staff in the Village Table 10: Conditions of PHC/sub-centre in the village Table 11: Private Medical Facilities Table 16: Aanganwadi/ICDS Centre Table 12: Educational Facilities ( number of villages) Table 13: Average School Enrolment Table 14: Physical Structure of the Schools Table 15: Private Schools and Preference of People for Schools Table 17: Electricity Facilities Table 18: Drinking water Table 19: Toilet Facilities Table 20: Other Facilities: Table 21: Individual Beneficiary Oriented Programmes Table 22: Public Distribution System Table 23: Self-help Groups Table 24: Village Organization
iii
Chapter IV: Socio Economic Status of Rural Households in District Lucknow
Table 1: Distribution of Sample Households by Religion
Table 2: Distribution of Sample Households by caste Table 3: Number of Sample Households Reporting their Mother Tongue
Table 4: Distribution of Sample households by size of family
Table 5: Composition of Sample HH members
Table 6: Age Composition of Family Members Table 7: Classification of Population by Level of Education among Different Religious Groups Table 8: Educational Status of Children in the Age of 5 to 15 years Table 9: Aspirations of Parents of Current Students
Table 10: Working Status of Family Members
Table 11: Occupational Classification of Working Family Members
Table 12: Status of Employment by Industrial Categories of Working Family Members Table 13 : Preference of Households for Additional employment
Table 14: Distribution of working family members by their main occupation Table 15:Distribution of households by size category of Land holdings (owned land) (In Acres) Table-16: Characteristics of Land Owned by Different Religious Groups
Table 17:Distribution of Household by value of own land
Table 18: Distribution of Average Livestock per household
Table 19 : Distribution of households by value of livestock
Table 20: Classification of Households by Sources of Income
Table 21: Average household income from various sources
Table 22: Distribution Households by size of family income (yearly)
Table 23: Average Household Expenditure on different heads
Table 24: Distribution of households by size of Expenditure (Annual)
Table 25: Distribution of household by Value of Productive and other Assets
Table 26: Distribution of Households by Ownership of Agricultural Implements Table 27: Distribution of Households by Ownership of Non-Agricultural Implements Table 28: Distribution of Households by Ownership of Means of Transport
Table 29: Distribution of Households by Ownership of Modern Household Assets

iv
Table 30: Distribution of Households by the Type of Financial Assets
Table 31: Per Household Value of Productive and Other Assets
Table 32: Distribution of HH by outstanding Amount of loan
Table 33: Migration characteristics of working family members
Table 34: Interest in training of families
Table 35 : Details of Training Described by Households
Table 36 : Duration of training Described by Families
Table 37: Households reporting about Public Distribution System
Table 38: Awareness about Government Programmes (%)
Table 39: Most Useful Programmes in Order of Preferences of the Respondents Table 40: Health and Family Welfare
Table 41: Place of Treatment of Diseases
Table 42: Immunization of Children(5 years of age)
Table 43: Distribution of Households by the Type of Ownership of Houses
Table 44: Distribution of Households by the Type of Houses Table 45: Distribution of Households by the Number of Rooms
Table 46: Classification of Households According to the Area of Houses
Table 47: Classification of Households According to the Value of their Houses
Table 48: Distribution of Households according to Sources of Homestead Table 49: Distribution of Households by the Electrification and Sources of Lighting
Table 50: Classification of Households According to Sources of Drinking Water Table 51: Classification of Households According to Distance from Sources of Drinking
Water
Table 52: Classification of Households According to Toilet facility Table 53: Classification of Households According to Type of Cooking Fuel Used Table 54: Participation of HH in Administrative Community
Table 55: Problem and losses Reported by HH during communal violence
Table 56: Households with Access to Media and Communication
Table 57: Households Reporting Three important Facilities which are lacking in village
Table 58: Households Reporting three most important deprivations in their families Chapter V: Development Gaps and Remedies Thereof Remedial Measures

v
Agriculture and Allied Activities
Industrial Activities
Socio-Economic Conditions

ii
Lucknow- A District Profile

EXECUTIVE SUMMARY LUCKNOW DISTRICT
The purpose of the Baseline Survey was to assess the
development deficits in the concerned districts and
thereafter identification of the priority areas for policy
intervention and plan formulation. To carry forward these
goals set in mind the Ministry of Minority Affairs,
Government of India after identifying minority concentrated districts across the
country chalked out various indicators for assessing the back wardness of the district
with the national figures at the back of mind. The indicators or the pointers thus
selected were:
• Religion Specific Socio-Economic Indicators
i. Rate of Literacy
ii. Female Literacy
iii. Work Participation rates
iv. Female Participation rates
• Indicators of Basic Amenities
i. Percentage of Households with pucca houses
ii. Percentage of households with safe drinking water
iii. Percentage of households with Electricity
iv. Percentage of households with W/C latrines.
• Besides these two more indicators were specified to take care of
health in the particular area i.e.
i. Percentage of fully vaccinated children
ii. Percentage of Institutional deliveries.
Based on these indicators The Ministry of Minority Affairs, New Delhi,
therefore, aims at developing suitable measures during the Eleventh Plan to develop
these districts. In order to identify the gaps in the development, a baseline survey was
conducted in 19 districts of U.P. by the Giri Institute of Development Studies,
Lucknow and Lucknow is one of them. Taking deficit as weight, the indicators from
various sectors are ranked accordingly on a 10 point scale in which the rank 1 indicates
highest deficit. Thus an indicators is accorded highest rank if the value of deficit
between the survey result and the estimate for the All India is the highest. The other
5 TOP Priorities v Sanitation v Housing v Electricity v Employment v Health

iii
indicators are ranked in descending order of their deficits. On the other hand if the
indicators conforms to deficit with positive value (survey result higher than the
estimate for All India) the lower rank is assigned to the indicator which has lower
positive value and higher rank is given to higher positive value. Hence very easily all
the selected indicators are ranked on ten point scale with the underlying assumption
of assigning priorities for the indicators for designing the Multi Sectoral District
Development Plan in various selected district and so for Lucknow.
Development Deficits in Lucknow District, Uttar Pradesh.
Indicators
Survey Results-
2008
All India
(2005)
Gap between All India and
District Priority Ranking
Socio-economic Indicators Rate of Literacy 61 .31 67.3 -5.99 6 Rate of Female Literacy 51.65 57.1 -5.45 7 Work Participation Rate 30.64 38.0 -7.36 5 Female Work Participation Rate 9 . 2 2 21.5 -12.28 4 Basic Amenities Indicators Percentage of Pucca Houses 15.89 59.4 -43.51 2 Percentage of Households with access to Safe Drinking Water 96.11 87.9 8.21 8 Percentage of Households with sanitation facilities 11 .78 67 .9 -56.12 1 Percentage of Electrified Households 19.0 39.2 -20.2 3 Health Indicators Percentage of Fully vaccinated Children(NFHS-3) 52.68 43.5 9.18 - Percentage of Institutional Deliveries(NFHS-3) 20.9 38.7 -17.8 -
Note: 1) Survey data of the District pertains to rural areas only, 2) Col 2 pertains to total
Keeping in mind some of the priority areas indicated in the Table above and
some major findings of the survey highlighted in it the following aspects need special
attention whenever a Multi Sectoral Development Plan of the district is attempted.
To sum up, therefore, the areas which need to be given special attention by the
planners and policy makers are:
Ø The top priority is attracted (rank 1) by the availability of sanitation facilities
in the rural households. The number of households having sanitation facilities
is extremely low. Keeping in mind hygiene and sanitation as well as
convenience, availability of latrines is essential. This can be achieved if the
subsidy amount given under Total Sanitation Campaign is suitably increased.

iv
Ø Second rank is given to percentage of households having pucca houses. The
households survey highlighted that there is dearth of pucca houses in area and
hence the Indira Awas Yojana needs to be extended to minority families falling
in the BPL category.
Ø The 3 indicator on the third rung of the ladder is electrification of households
which needs proper planning and implementation at the rural areas level. Mere
quantity doesn’t fulfills the demand quality of its provision also has to be
ensured for rural areas to develop fast.
Ø The district is emphatically in need of employment generation for females.
Since land holdings are small, the cultivators can be educated to diversify their
activities where possible. Thus, depending on area, suitability and people’s
preference activities such as dairying, poultry farming and cultivation of fruits
and vegetables can be promoted in various blocks of the district. It has been
encountered that the employment generation is the critical lacuna in the district
and especially for female population. The ongoing programme to improve the
productivity and diversification needs to be revamped and revitalized to fulfill
the laid goals of development. Similarly other non-farm activities can be
identified by the Directorate of Industries and on their basis a cluster
development approach can be taken up as it may not be feasible to promote
these activities in each village. Some of the activities which are already being
undertaken include Chikan Embroidery, Achar making, basket and ceramic
pottery making, etc.
Ø The literacy level in the district has not shown any concern as it ranked low on
the scale. The district is in need of schools and colleges beyond the elementary
level especially for girls.
Ø Our survey had revealed that a high proportion of the respondents are desirous
of receiving vocational training. Thus, the government should ensure that such
training programmes be conducted on a regular basis.
Ø The percentage of institutional deliveries is also reported very low in the
district which calls for the sub-centres and PHCs to be upgraded and revamped
so that they can provide services effectively. This will reduce the dependence of
the rural people on unqualified doctors as is the case presently.

1
CHAPTER I
BACKGROUND OF THE STUDY 1.0 Introduction In Uttar Pradesh the share of Muslim population is about 18.5 per cent (2001),
which is the largest minority as the other religious minority groups are quite negligible
and combining them all it accounts to 19.5 percent of the total population. Overall
minorities are forming almost one-fifth of the state population and mostly they are
considered deprived class. Ministry of Minority Affairs keeping the objective of
balanced development has undertaken the task to understand the real situation of
minorities in the country, so that accordingly measures may be chalked out to
eradicate the impediments for overall balanced development. One of the latest efforts
in this direction has been in the form of constituting an expert Committee by the
Ministry to identify those districts, which have a minority concentration and are also
relatively backward. The Expert Committee at the centre has tried to locate relatively
backward minority concentrated districts and selected indicators for the identification
on the following criterion:
(a) Religion-Specific Socio-Economic Indicators
(i) Literacy Rate
(ii) Female Literacy Rate
(iii) Work Participation Rate, and
(iv) Female Work Participation Rate
(b) Indicators of Basic Amenities
(i) Proportion of households with pucca walls
(ii) Proportion of households with safe drinking water
(iii) Proportion of households with electricity, and
(iv) Proportion of households with W/C latrines.
As many as 53 districts were found to have values below the National level
average for both sets of indicators while another 37 had values below the National
average for one or the other set of indicators. Thus, total 90 district from the country
as a whole were selected in which 21 districts were from Uttar Pradesh. The Ministry

2
aims at devising suitable policy measures during the Eleventh Plan in order to develop
these districts. The Ministry then identified several institutions in different parts of the
country to carry out a baseline survey of these districts. Giri Institute of Development
Studies, Lucknow has been entrusted to carry out the study of these 21 identified
districts.
1.1 Objectives of the Study
(i) To conduct a gap analysis of availability of infrastructure such as schools,
health, ICDS centres and drinking water supply;
(ii) To find out the gaps in housing and sanitary facilities;
(iii) To identify the income generating activities such as artisan/handicrafts in
which villagers have a comparative advantage;
(iv) To identify the existing gaps in other infrastructural facilities such as roads,
ITIs, banking and marketing facilities, etc.
1.2 Methodology and Sample Design
To identify 30 villages, the Tehsil of the district where first grouped into the
strata in terms of minority population after arranging them in descending order of
minority population. The first stratum consisted of 20 per cent of the Tehsils and the
second and third stratum constituted 50 and 30 per cent Tehsils respectively. Tehsil
was used for stratification because religion-wise data is available at Tehsil level in
2001 Census. The number of villages selected from each stratum was directly
proportional to the share of each stratum and were selected as per the probability
proportional to size with replacement method.
After identification of 30 villages, house listing was conducted by door-to-door
surv ey in the villages having a population upto 1200. In case of villages with higher
population the different hamlets were considered and 2 hamlets were selected. The
first hamlet was the one where the concentration of minority population was highest
and the other hamlet was selected randomly.
From each village 30 households were selected by listing the households
according to their religion. The samples selected were in proportion to the population
in each religious category according to the systematic random sampling without
replacement method. Thus, the sample of 30 villages and 900 households were
identified and surveyed.

3
The report has been prepared in three parts. The first part includes the socio-
economic status of the district. For this, information was collected from district
statistics officer, CDO, District Minority Welfare Office, NABARD, district Lead Bank
and Census records. The second part consists of village study for which quite
substantial data was collected from Tehsil, Block Development Office, CDO and from
Census records besides primary data from fieldwork in the village. The third part of
study is based upon household information for which door-to-door survey of selected
households was conducted by a team of field staff under strict supervision. The list of
selected sample villages where survey was conducted is as follows:
List of Selected Sample Villages in District Lucknow
District Tehsil Code Tehsil Name Village Code Village Name 12 12.1 Malihabad Tehsil 12.1.1 Gahndo 12.1 12.1.2 Tirangava 12.1 12.1.3 Azadnagar 12.1 12.1.4 Dilawarnagar 12.1 12.1.5 Mandauli 12.1 12.1.6 Sultanpur 12.1 12.1.7 Aunt 12.1 12.1.8 Gagan Barauli 12.1 12.1.9 Ishapur 12.2 Lucknow Tehsil 12.2 12.2.1 Baragoan 1 2 .2 12.2.2 Behta 12.2 12.2.3 Mirzapur Lutova 12.2 12.2.4 Bahdanamau 12.2 12.2.5 Bhokapur 12.2 12.2.6 Pahar Pur 12.2 12.2.7 Makhdoompur Kaithi 12.2 12.2.8 Muzaffarnagar Ghusaval 12.3 Bakshi Ka Talab Tehsil 12.3 12 .3.1 Bhagautapur 12.3 12.3.2 Akbarpur 12.3 12.3.3 Mampur Bana 12.3 12.3.4 Bahargaun 12.3 12.3.5 Dinkarpur Jhalava 12.3 12.3.6 Para 12.3 12.3.7 Purwa 12.4 Mohanlalganj Tehsil 12.4 12.4.1 Salauli 12.4 12.4.2 Hardoe y a 12.4 12.4.3 Daudnagar 12.4 12.4.4 Dharamgad Khera 12.4 12.4.5 Bhajmar Mau 12.4 12.4.6 Kushmaura

4
CHAPTER II
SOCIO-ECONOMIC PROFILE OF DISTRICT LUCKNOW
2.1 Introduction
Lucknow, the capital of Uttar Pradesh is situated 23 Mts. above sea level. It is
situated on 26.30 & 27.10 North latitude and 80.30 & 81.13 East longitude. Lucknow
covers an area of 2528 sq.km. It is surrounded on the eastern side by District
Barabanki, on the western side by district Unnao, on the southern side by Raebareli and
on the northern side by Sitapur and Hardoi districts. River Gomti flows through the city.
Some of the tributaries of this river are Kukrail, Loni, Beta etc. Sai river flows from the
south of the city and in the east enters district Raebareli. Lucknow is accessible from
every part of India through Air, Rail and Road. It is directly connected with New Delhi,
Patna, Calcutta, Mumbai, Varanasi and other major cities by Amausi airport. Similarly city
is linked to north, east, south and west through rail and road links. In fact rail link joins
Lucknow to Pakistan via Amritsar in the west and to Bangladesh railways in the east. The
population of district Lucknow as per census 2001 is 36,47,834 lacs.
2.2 Climate, Flora and Fauna
District Lucknow has almost uniformed tropical climate. The temperature varies
from 45 celcius maximum in summer to 5 celcius minimum in winter season. Rainfall is
100 cm. per annum. The forest area is negligible in the district. Shisham, Dhak, Mahua,
Babul, Neem, Peepal, Ashok, Khajur, Mango and Gular trees are grown here. In fact
different varieties of mangoes specially Dashari are grown in Malihabad block of the
district and exported to other countries too. The main crops are wheat, paddy, sugarcane,
mustard, potatoes, and vegetables such as cauliflower, cabbage, tomato, brinjals are grown
here. Similarly sunflowers, roses, and marigold are cultivated on quite a large area of the
land. Apart from this many medicinal and herbal plants are also grown here.
2.3.1. Demographic Status
As reported in the Census of India 2001 the total population of the district stood at
36.47 lac persons of whom 19.32 lac were males and 17.15 lac were female. Between 1991
and 2001 the population registered a decadal growth of 32.03 percent which was much
less than the 37.14 percent which was registered between 1981 and 1991 decade. The
density per square kilometer registered a substantial increase from 1093 to 1456 between

5
1991 and 2001. However, the density of population was much above that obtained at the
state level (690 persons per sq. km.). The SC population of the state at 21.3 percent to total
population is above the state average (21.15 percent). A very high percentage of the total
population (36.37 percent) resides in rural areas which means that barely around 63.3
percent is urban in nature. These are very high figure as compared to the state as whole,
where urban population constitutes around 21 percent only of the total state population.
Even in terms of the sex ratio the district with the sex ratio of 888 is below the average
obtained at the state level (890 during 2001). Yet another indicator where the district
leads ahead of the state is in terms of literacy. Total literacy level is 68.7 percent as
compared to 56.3 percent in U.P. as a whole. Similarly male and female literacy rates were
found to be 76.0 and 60.5 percent respectively as compared to the corresponding figure of
68.8 and 42.2 percent in U.P. However, there has been a marked improvement in the
literacy rate in the district as compared to 1991. Despite the fact that the overall work
participation rate in the district (32.24 percent) is higher than the state average (23.7
percent), the work participation rate among females in Lucknow is very low at 5.6 percent
which has registered a decline from 1991 status of 5.9 percent (for details see Table no 1).
Table 1: Demographic Features
Features 1991 2001 Geographical Area (Sq.km.) 2544 2528 Number of Tehsils 3 4 Number of Blocks 8 8 Number of Inhabited Villages 824 822 Average size of the Household Population (in Lakh) Total 27.62 36.48 Male 14.81 19.32 Female 12.82 17.16 Sex Ratio 827 888 Density of Population 1093 1456 Decadal Growth of Population (1981-91 and 1991-2001)% 37.14 32.03 SC Population (%) 21.88 21.30 Rural Population (%) 37.34 36.37 Urban Population (%) 62.66 63.63 ST Population (%) 0.04 0.10 Literacy (%) Total 57.5 68.70 Male 66.5 76.00 Female 46.9 60.50 Work Participation Rate (Nos. & %) Person 32.24 Male 48.39 41.8 Female 5.9 5.6
Source: Census of India, 2001.

6
2.3.2 Demographic Status by Religion
Table 2: Distribution of Population by Religion Proportion to Total
Population Literacy Rate Work Participation
Rate Religion Number Percentage Number Percentage Number Percentage
Hindu 2852721 78.20 1 7 0 3 2 7 1 70.25 861704 23.62 Muslim 748687 20.52 389542 61.49 2 0 9 9 3 7 5 . 7 6 Christian 12286 0.34 10018 90.05 4 4 7 9 0.12 Sikh 23110 0.63 19282 91.83 6 9 2 5 0.19 Buddhist 4 3 2 7 0.12 2 56 4 70.23 1343 0.04 Jain 4 1 1 8 0.11 3 5 9 0 94.97 1255 0.03 Others 2585 0.07 3 6 2 14.23 1 3 3 0.00 Source: Census of India, 2001
If we look at the distribution of the population according to religion Hindus constitute
a little over three-fourth of the total population and this is below the share found in the state
as a whole (80.6 percent). However, Lucknow has a slightly higher share of Muslim population
(20.52 percent) and also of the other religious categories. In fact Sikh population constitutes
only 0.63 percent which is little higher as compared to the state average of 0.4 percent (Table
no 2).
2.3.3 Housing Amenities
Table 3: Housing Amenities
Percentage Distribution of Households
Percentage Distribution of Households Amenity
Rural Urban Rural Urban Total Number of Households 224391 383071 100.00 100.00
Type of House Permanent 83933 345219 3 7 . 4 0 90.12 Semi Permanent 25758 20890 11.48 5.45 Serviceable 105930 11288 4 7 . 2 1 2 . 9 5 Non-Serviceable 8 7 6 1 5655 3 .90 1 .48 Unclassifiable 9 19 0.004 0.005 Number of Dwelling Rooms One Room 74849 103840 3 3 . 3 6 27.11 Two Rooms 7 3 1 3 3 121320 32.59 31.67 Three Rooms 36894 7 6 1 2 7 16.44 19.87 Four Rooms 17601 43615 7 .84 11.39 Five Rooms 6 6 4 9 14982 2.96 3 .91 No exclusive room 8567 8509 3.82 2 . 2 2 Source of Drinking Water Tap 1 5 9 3 8 2 9 4 8 3 3 7.10 76.97 Handpump/Tubewell 179824 80567 80.14 21.03 Well 2 9 3 3 5 2 0 1 8 13.07 0.53 River/Canal 14 43 0.01 0.01 Any other 7 0 1 3 6 9 0.03 0.36 Source of Cooking Firewood 150398 60548 67.02 15.81 Crop residue 2 0 2 45 5 7 7 1 9.02 1.51 Cow -dung Cake 41367 4689 18.44 1 .22 Kerosene 1 8 1 7 45231 0.81 11.81 LPG 1 1 0 3 9 2 6 7 0 3 8 4.92 6 9 . 7 1 Any other 534 6 4 6 0.24 0.17 Source: Census of India, 2001

7
At this juncture it is pertinent to look into the different housing amenities
enjoyed by the people of Lucknow district. Table 3 reveals that in the district as whole
only around 70 percent households reside in permanent houses. The condition is poor
in the rural areas, where majority of the population is concentrated but only 37
percent of the households reside in permanent houses. However, in urban areas
almost 90 percent of the households have a permanent house. The poor living
condition of the people can be gauged from the fact that around one third of the
households are living in one room house and another one third has only two rooms.
The two categories together account for almost two third of the total households. In
this connection the situation is similar both in rural and urban areas.
As far as the source of drinking water is concerned the maximum number of
households (above 80 percent) obtains water from hand pump/tube wells in rural
areas and only 21 percent use this source in urban areas. The next important source is
tap water. This facility is enjoyed by merely 76.9 percent urban households while
among their rural counterparts this percentage was around 7.1 percent.
In the rural areas the main fuel used for cooking is fire wood with almost 67.02
percent households being dependent on this source. The next in importance is cow-
dung cakes (18.44 percent) and crop-residue (9.02 percent). In the urban areas the
situation is much different. Although fire wood continues to remain the most
important fuel the dependence on it is much lower at around 15.81 percent and the
most important source is LPG with around 69.71 percent of the total households using
it as the source of fuel. These variations between rural and urban areas are also quite
understandable.
3. Structure and Growth in Employment
The distribution of main workers in 2001 by different categories reveals that
almost 21 percent are cultivators while another 6 percent are agricultural laborers.
This is quite understandable in the district where rural population percentage is low as
37 percent (Table no 3). What is remarkable is that the share of population in rural
areas has registered a decline from about 37 percent in 1991 to 36 percent in 2001. In
the same row cultivators declined from 29.73 percent in 1991 to 21.06 percent and
agricultural labourers declined from 8.70 percent to 6.50 percent in 2001. Agricultural
fervor of the workforce shows a decline in favour of non-agricultural activities in the
state.

8
Table 4: Employment Structure of the Workforce
1991 2001 Change District Lucknow Total Percent Total Percent % Point Total Main workers 792228 100.00 8 9 8 8 9 0 100.00 Cultivators 235538 2 9 . 7 3 1 8 9 2 7 9 21.06 -8.67 Agricultural Labourers 6 8 8 9 3 8 .70 58384 6.50 -2 . 2 0 Livestock 1 2 1 8 4 1.54 1 4 8 2 4 1 .65 0.11 Mining and Quarrying 4 6 3 0.06 1 5 3 1 0.17 0.11 Manufacturing (HHs.) 1 6 6 7 3 2.10 39513 4.40 2 . 2 9 Non -HHs Manufacturing 6 7 4 2 7 8.51 9 5 7 9 1 10.66 2.15 Construction 2 6 8 4 9 3.39 45751 5.09 1 . 7 0 Trade and Commerce 112662 14 .22 1 2 9 5 2 3 14.41 0.19 Transport Storage and Communication 3 8 2 8 8 4.83 6 2 6 9 7 6.97 2 .14 Other Services 21 3251 26 .92 2 6 1 2 1 8 29.06 2 .14
Source: District Sankhyaki Patrika, Lucknow, 2005 Statistical Dairy, Uttar Pradesh 2005 4. Land use Pattern
Lucknow district reports a very low proportion of area under forest. The total area
under forest (4.66 percent) is much less as compared to state average which is barely
around 7percent. The district with such a high urban component of total population is
obviously dependent on non-agriculture to a high degree and so the net area sown is
barely 54.85 percent and that too declined from 60.59 percent of total reported area in
1991 (See table no 5).
Table 5: Land use Pattern Items 1991-92 % 2004 -05 %
Total Reported Area 252162 100.00 251845 100.00 Forests 11408 4.52 1 1 7 2 6 4.66 Culturable Wasteland 1137 2 4.51 8 6 2 8 3.43 Current Fallows 2 6 4 0 8 10.47 15102 6.00 Land put to Non -Agricultural Uses 2 4 3 8 2 9.67 40607 16.12 Grazing land 3 4 1 1 1.35 3 1 4 5 1.25 Area under Trees & Orchards 5451 2.16 2 1 8 2 0.87 Net Area Sown 152781 60.59 138148 54.85 Area Sown More than Once 56524 22.42 80072 31.79 Gross Cultivated Area 209305 83.00 218220 86.65 Net Irrigated Area 1 1 2 9 3 8 44.79 1 2 3 2 2 5 48.93 Gross Irrigated Area 152308 60.40 184101 73.10 Source: District Sankhyaki Patrika, Lucknow, 2005 Statistical Dairy, Uttar Pradesh 2005
The district is not solely dependent on agriculture since only one third of total
population resides in rural areas (36.37 percent). This had already been indicated by the
fact that cultivators and agricultural labourers put together account for around 37 percent
of the main workers in the district. However, the district is lucky since around 48.9
percent of the net area is irrigated. In fact, this has shown an improvement over 1991-92
figures where only 44.79 percent area was irrigated.

9
Table: 6. Irrigation Coverage and Sources (2003 - 04) Lucknow Uttar Pradesh
Area Irrigated Area Irrigated Source (in hectares) % (in hectares) %
Canal 2 0 7 0 3 3.93 2 7 6 7 2 3 3 20.92 Government Tubewell 6186 1.23 3 7 9 1 2 2 2 .87 Private Tubewell 9 7 0 8 3 6 7 . 2 6 8978021 67.87 Others 1252 27.58 1102962 8 .34 Total 1 2 5 2 2 4 100 1 3 2 2 7 3 3 8 100
Year 1991-92 (%) 2004-05 (%) Canal 52507 46.49 2 7 9 1 6 22.65 Tubewells a. Public 9 1 6 3 8.11 7 7 9 3 6.32 b. Private 4 7 2 7 7 41.86 8 6 9 7 5 70.58 Wells 6 3 1 0.56 2 7 5 0.22 Ponds 2 0 3 2 1.80 2 2 6 0.18 Others 1 3 2 8 1.18 4 0 0.03 Total 1 1 2 9 3 8 100.00 1 2 3 2 2 5 100.00 Source: District Sankhyaki Patrika, Lucknow, 2005 Statistical Dairy, Uttar Pradesh 2005
Now focusing on irrigation on a source wise basis the single most important
source of irrigation that emerges is private tube well and they account for 70.58
percent of the total irrigated area in 2004 -05 which have registered an increase from
41.86 percent in 1991-92. The only other source that has gained popularity is canal
irrigation whose contribution is merely around 22.65 percent in 2004 -05 which have
declined from the 1991-92, 46.49 percent (See Table no 6). Popularity of public
tubewells have declined over the years could be established from the data so available.
Table: 7. No. of Operational Holdings and Area according to Agricultural Census 1995-96.
Size of Land Holding No. of Land Holdings % Area %
Less than 0.5 Hectare 1111385 91.45 36605 21.01
0.5 - 1 Hectare 56018 4.61 40859 23.45 1 - 2 Hectare 32604 2.68 47037 26.99
2 - 4 Hectare 12591 1.04 33564 19.26
4 - 10 Hectare 2540 0.21 13766 7.90 10 Hectare & Above 142 0.01 2437 1.40
Total 1215280 100.00 174268 100.00
Another characteristic of the district is the heavy concentration of the
cultivators in the lowest land holding size (below 0.5 hectares). Around 91.45 percent
cultivators are in this category. However, between them they posses barely 21.01
percent of the total area under land holdings. The next lowest land holding size is
between 0.5 to 1 hectare and over 4.61 percent of 23.45 percent of the total cultivated
land.

10
5. Cropping Pattern
Table 7: Cropping Pattern in the District Indicators 1999-
00 2000-
01 2001-
02 2002-
03 2003-
04 2004-
05 2005 -
06 1 Percent of Forests to tot al Reported area 4.5 8.3 8.3 8.3 4.6 4.7 - 2 Net Sown Area to Total Reported Area 56.5 56.5 55.5 53.1 54.8 54.9 - 3 Cropping Intensity 151.1 157.3 154.4 149.5 150.9 158.0 - 4 Area under Commercial Crops to Gross
Cropped Area 5.2 4.6 4.6 10.5 9.5 9.4 -
5 Foodgrain Production (Average in qtl.) 19.3 18.9 19.5 19.8 19.9 19.8 19.5 6 Fertilizer Consumption per Ha (in Kg.) 142 138.4 143.3 134.4 141.7 135.7 - 7 Per capita Output
7.1 Foodgrains 88.0 88.6 83.7 74.5 78.5 7 7 . 9 68.9 7.2 Pulses 4.0 3.4 3.4 3 2.6 4.0 2.6 Source: District Sankhyaki Patrika, Lucknow, 2005 Statistical Dairy, Uttar Pradesh 2005 6. Productivity of Major Crops
Average productivity of major crops like wheat, paddy, potato and sugarcane in
district Lucknow is less as compared to the state’s average productivity, excepting
average productivity of paddy, which is 18.75 quintal per hectare in the district, and
18.13 quintal per hectare in the state. Despite higher productivity of cereals, potato
and sugarcane, majority of farmers in the district are facing acute problems due to
small land holdings and irregular payment by sugarcane factory owners.
Table 8: Productivity of Major Crops (2004 - 05) (Production in quintal per hectare)
Crop Lucknow Uttar Pradesh
Wheat 24.2 25.0 Paddy 18.75 18.13 Potato 162.47 223.83 Oilseeds 7.4 9.92
Sugarcane 541.24 608.07 Source: District Sankhyaki Patrika, Lucknow, 2005 Statistical Dairy, Uttar Pradesh 2005. 7. Livestock
It is evident from the table 9 that the district has sizeable number of livestock
specially the milch animals, which offers great potential to develop dairy and its
related activities in the district. The data shows that in the year 1997 total livestock in
the district was 619720 and in 2003 it stands at 655097 which shows a decline of 5.7
percent.

11
Table 9: Livestock Population in Lucknow District-
(17th Census-2003)
Lucknow Uttar Pradesh No. of Animal per 100 Ha. Of Net Sown AreaType of Animal
No. % No. % Lucknow Uttar Pradesh
Drought Animals
Bullock 2204 0.34 5 6 0 3 8 7 8 9.2 1.60 33.46
Buffalo 43181 6.59 1608809 2.64 31.26 9.61
Milch Animals
Cow 7209 1.10 6 1 8 7 6 7 2 10.16 5.22 36.94
Buffalo 87681 13.38 11194710 18.38 63.47 66.84
Young Animals
Cattle 22593 3.45 6759210 11.09 16.35 40.35
Buffalo 19633 3.00 10110181 16.59 14.21 60.36
Others
Sheep 5 7 1 0.09 1436731 2.36 0.41 8.58
Goat 141937 21.67 12941013 21.24 1 0 2 . 7 4 77 .26
Horse 1905 0.29 154049 0.25 1.38 0.92
Pig 42109 6.43 2602130 4.27 30.48 15.54
Others Animals 0 0.00 2324997 3.82 13.88
Total Livestock 655097 100.00 60923380 100 474.20 3 6 3 . 7 3
Poultry Birds 168721 - 12193964 - 122.13 72.8 Source: 17 th Livestock Census of Uttar Pradesh, 2003.
In Lucknow district, number of livestock population per 100 hectare of net
sown area is higher than that of state average thus indicating the potential of the
district to develop its livestock and extract benefits thereof. Even if the same livestock
is made more productive, it may add to the economy of the district, which can reduce
the carrying capacity of land. Number of poultry farms is also less in the district as
compare to the state, as shown in table 9.
8. Industrial Development
The industrial development in Lucknow district has been not been very
promising. It is evident from table 10 that number of registered factories per lakh of
population by 2005-06 were around 5.2 only and out of these only 3.2 factories were
in operation and remaining were closed. The working factories provided employment
to 296 persons and produced out put to the tune of rupees 4788 per capita. The
development of industries was also very much tardy in the district. There were just 186
registered working units with 9875 persons employed in 2002-03.

12
Table 10: Industrial Development (2003-04)
Lucknow U.P. Indicators
1999-00 2002 -03 % Growth
1999-00 2002-03 % Growth
Registered & Working units 148 1 8 6 25.68 4 2 9 2 4 9 3 7 15.03
Submitting Returns 148 1 8 6 25.68 4 2 9 2 4 9 3 7 15.03 Workers Employed 6 4 8 8 7106 9.53 282182 3 1 9 0 7 3 13.07 Person Employed 9 0 6 0 9 8 7 5 9.00 374817 421016 12.33 Investment (in Lakh) 6 3 6 9 7 69084 8.46 5208617 4 8 7 3 4 9 9 -6.43 Total Output (in Lakh) 120597 1 7 5 3 2 5 45.38 6 8 8 2 1 9 7 8 7 2 3 1 14 26.75
Value Added (in Lakh) 20168 31102 54.21 1166565 1 3 9 8 8 7 0 19.91
Particulars Lucknow Uttar Pradesh Number of Industrial Areas per lakh of Population 0.08 0.08 Number of Industrial Estates per lakh of Population 0.02 0.09 Number of Registered Factories per lakh of Population 5.2 5.4 Number of Functional Factories per lakh of Population 3.2 Number of persons employed in Registered Factories per lakh of Population 2 9 6 2 6 7 Per capita value of Industrial Production 7 3 8 7 4788 Source: District Sankhyaki Patrika, Lucknow, 2005 Statistical Dairy, Uttar Pradesh 2005 9. Infrastructure
Infrastructure-the backbone of the economy facilitates the process of economic
development. It is, therefore pertinent to have infrastructure both economic and social
should well developed to facilitate growth of the economy. We shall focus on economic
and social infrastructure as prevalent in the district economy and evaluate its pros and
cons in the process of district development. 9.1 Economic Infrastructure
Uttar Pradesh has the longest rail length, the second longest road length, and
highest number of post offices in India ensuring good connectivity. UP has over 4,800
km of national highways and over 10,000 km of state highways. The state runs
multiple agencies involved in the construction and maintenance of road network with
the Public Works Department (PWD) being the nodal agency. The state government is
going to take up the upgradation of 973 km of important state highways and major
district roads along with major maintenance and rehabilitation of another 2,574 km.
In addition, the PWD will construct four bypasses totalling 20 km and 5 major bridges.
Gaps in the development of important infrastructure in district of Lucknow are
evident when we co mpare the indicators over time (Table 10). Hazards of population
growth are well captured in the economic infrastructure indicators as all the indicators
are transformed in per lakh of population denomination.
13
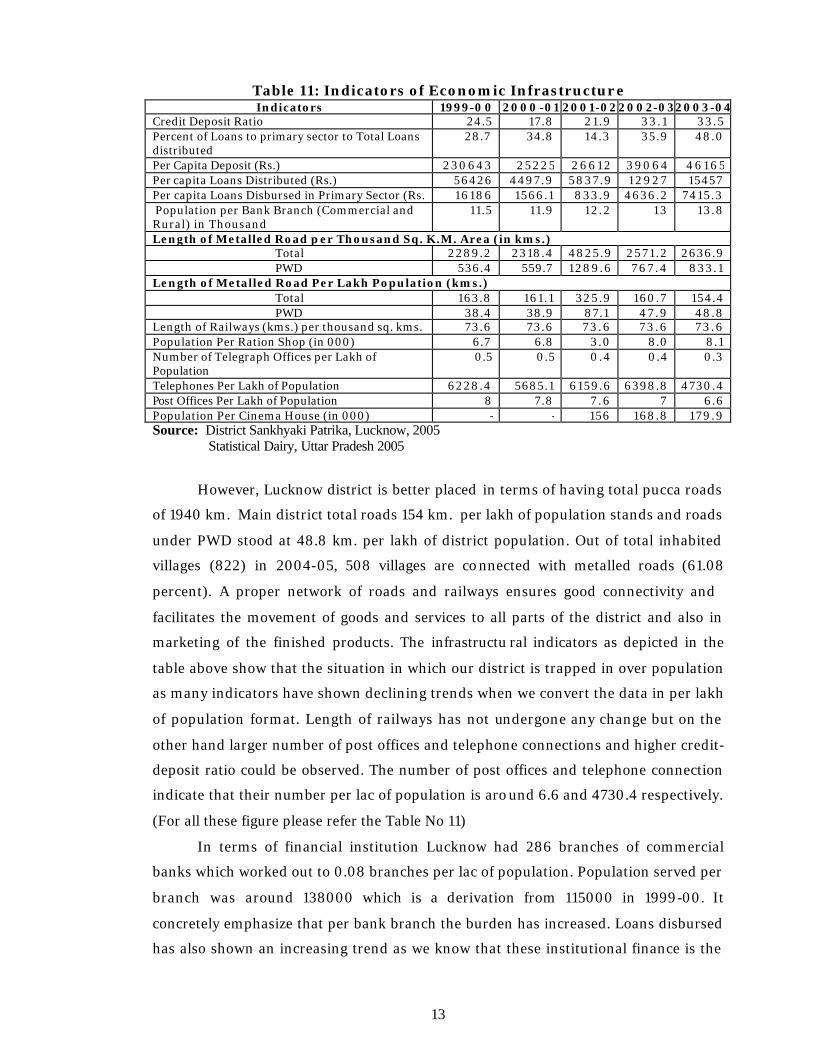
Table 11: Indicators of Economic Infrastructure Indicators 1999-00 2000 -01 2001-022002-032003-04
Credit Deposit Ratio 24.5 17.8 21.9 33.1 33.5 Percent of Loans to primary sector to Total Loans distributed
28.7 34.8 14.3 35.9 48.0
Per Capita Deposit (Rs.) 230643 25225 2 6 6 1 2 3 9 0 6 4 4 6 1 6 5 Per capita Loans Distributed (Rs.) 56426 4497.9 5837.9 1 2 9 2 7 15457 Per capita Loans Disbursed in Primary Sector (Rs.) 16186 1566.1 833.9 4636.2 7415.3 Population per Bank Branch (Commercial and Rural) in Thousand
11.5 11.9 12.2 1 3 13.8
Length of Metalled Road per Thousand Sq. K.M. Area (in kms.) Total 2289.2 2318.4 4825.9 2571.2 2636.9 PWD 536.4 559.7 1289.6 7 6 7 . 4 833.1
Length of Metalled Road Per Lakh Population (kms.) Total 163.8 161.1 325.9 160.7 154.4 PWD 38.4 38.9 87.1 47 .9 48.8
Length of Railways (kms.) per thousand sq. kms. 73.6 73.6 7 3 . 6 7 3 . 6 7 3 . 6 Population Per Ration Shop (in 000) 6.7 6.8 3.0 8.0 8.1 Number of Telegraph Offices per Lakh of Population
0.5 0.5 0.4 0.4 0.3
Telephones Per Lakh of Population 6228.4 5685.1 6159.6 6398.8 4730.4 Post Offices Per Lakh of Population 8 7.8 7 . 6 7 6.6 Population Per Cinema House (in 000) - - 156 168.8 179.9 Source: District Sankhyaki Patrika, Lucknow, 2005 Statistical Dairy, Uttar Pradesh 2005
However, Lucknow district is better placed in terms of having total pucca roads
of 1940 km. Main district total roads 154 km. per lakh of population stands and roads
under PWD stood at 48.8 km. per lakh of district population. Out of total inhabited
villages (822) in 2004-05, 508 villages are connected with metalled roads (61.08
percent). A proper network of roads and railways ensures good connectivity and
facilitates the movement of goods and services to all parts of the district and also in
marketing of the finished products. The infrastructu ral indicators as depicted in the
table above show that the situation in which our district is trapped in over population
as many indicators have shown declining trends when we convert the data in per lakh
of population format. Length of railways has not undergone any change but on the
other hand larger number of post offices and telephone connections and higher credit-
deposit ratio could be observed. The number of post offices and telephone connection
indicate that their number per lac of population is aro und 6.6 and 4730.4 respectively.
(For all these figure please refer the Table No 11)
In terms of financial institution Lucknow had 286 branches of commercial
banks which worked out to 0.08 branches per lac of population. Population served per
branch was around 138000 which is a derivation from 115000 in 1999-00. It
concretely emphasize that per bank branch the burden has increased. Loans disbursed
has also shown an increasing trend as we know that these institutional finance is the

14
important means of facilitating investment. In the absence of such opportunity people
are forced to take non-institutional options and end up paying unusually high rates of
interest.
Percent of villages electrified show a positive trends as in 2001 were 97.81
percent and it increased to 98.91 percent in the year 2006 (Sankhiyki Patrika, 2006).
Lucknow being the capital hub of the state has this privilege of being electrified to the
utmost.
Population per ration shop is 8.1 thousand in 2003-04 which has registered an
increase from 6.7 thousand in 1999-00.
9.2 Social Infrastructure
Table 12: Indicators of Social Development Indicators 1999-00 2000-01 2001-02 2002-03 2003-04 Number of Schools per Lakh of Population Number of Primary Schools 52.2 51.9 52 54.8 53.1 Number of Upper Primary Schools 16.2 17.5 18.9 19.3 21.4 High School/Intermediate Colleges 5.7 5.5 5.4 13.8 12.9 Degree Colleges 0.7 0.5 0.5 0.5 0.5 PG Colleges 0 0.2 0.3 0.3 0.3 Industrial Training Institute 0.1 0.1 0.1 0.1 0.1 Teacher Pupil Ratio Primary Schools 78.8 69.7 68.9 90.1 92.6 Upper Primary schools 116.6 127 .1 110.2 208.3 213.7 High School/Intermediate Colleges 17 .2 21.6 21.8 54.8 332.7 Degree Colleges 123.9 65.7 74 .4 71 .9 7 7 . 1 PG Colleges - - 6 8 1055.3 6 9 Industrial Training Institute - - - 11.6 11.6 Medical Facility Per Lakh of Population Allopathic Hospital / CHC and Delivery Centres
0 0 0 2 1.9
Per Lakh of Population beds in Allopathic Hospital /CHC and Delivery Centres
117 .2 127.7 125.1 118.3 110.9
Number of Child/Women Welfare Centres per lakh population.
1 0 9 7 5 14610 15036 1 1 7 2 8 12513
Source: District Sankhyaki Patrika, Lucknow, 2005 Statistical Dairy, Uttar Pradesh 2005
The main indicators of social development are facilities related to education
and health. As far as education is concerned there were almost 68 primary schools per
lac of population while the corresponding figure for upper primary schools was around
26.6. Lucknow is one of the leading district in the number of institutions including 7
universities, 1 technical universities and a large number of polytechnics, engineering
institutes and industrial training institutes. The district has several reputed
educational institutions like IIM Lucknow, Engineering University (recently ranked

15
the fourth best university in Asia). Some of the research organisations in the state
include Central Drug Research Institute, Industrial Technology Research Centre,
Central Food Technology Research Institute, National Botanical Research Institute,
Glass Research Institute, Sanjay Gandhi Post Graduate Institute of Medicine and King
George Medical College. The state has a good network of hospitals and has the highest
number of health care centres in the State as well as the Country.
Under the Sarva Shiksha Abhiyan the norms which have been laid down are
that there must be one primary school within 1 Km of each village and for a population
of 300 persons. Similarly there should be one upper primary school within 3 Km of
every village and for a population of 800. These norms are mostly met in the district
and the short falls which exist are likely to be removed shortly because additional
schools are planned in each financial year to achieve the required number. However,
from the point of view of higher education as well as technical education facilities are
definitely lacking in the district. In the district having a total population of 36 Lac
there are only 61 degree colleges and 22 PG colleges. (Refer to Table above)
Coming to medical facility there are 0.25 PHC and 0.96 CHC per Lac of
population. The norms which have been laid down are 1 PHC per 30000 of population
and 1 CHC per lac of population. These figure also indicate that in Lucknow both PHC
and CHC fall short of the prescribed norms (Please see Table 12). As far as allopathic
hospitals and dispensary is concerned their numbers was barely 1.04 per Lac of
population in year 2005-06 and the availability of beds in these hospital/dispensaries
was only 110.9 which again is reflective of the poor medical fa cilities found in
Lucknow.
10. Income and Poverty
The per capita income and poverty level are the indicators of overall
development. The per capita income at 1993-94 and current prices during the year
2003-04 was found to be higher in Lucknow district than the state level per capita
income. The percentage of rural BPL households was slightly higher in the district as
compared to the state. It implies that the economic condition of people living in rural
areas of the district is certainly poor in comparison with the people of rural areas in
Uttar Pradesh as a whole (Table 13).

16
Table 13: Income and Poverty in Lucknow District and
Uttar Pradesh
Details Lucknow District Uttar Pradesh Per capita income at 1993-94 prices (2003-0 4 ) 10389 5 9 7 5 Per capita income at current prices (2003 -04) 1 8 9 1 6 10637 Total number of rural households (BPL census 2002) 2 7 2 7 1 7 2 4 0 2 6 1 7 6 Total Rural Population (BPL census 2002) 1 3 4 9 0 7 3 1 2 7 1 9 1 1 2 2 Total number of BPL households (BPL census 2002) 134809 9956384 Total number of BPL population (BPL census 2002) 6 6 1 8 6 0 4 9 6 0 6 6 1 6 Percentage of BPL households 49.06 27.5
11. Gaps in Amenities and Facilities at the District Level
Although various problems are found in the district because of which it is
lagging behind in the process of development some efforts, as suggested below, could
prove useful in stepping up the pace of economic development and help in placing
Lucknow in the list of the developed districts:
Ø The myths prevailing amongst the population regarding family planning should
be taken care of by the government so that the unprecedented growth of
population leading to high population density could be checked so that its
adverse impact on the employment and income prospects of the people are also
taken care of. The literacy level has also found to be lower in the district and
especially amongst the female population, which if tapped properly could be
very helpful in curbing the growth of population in extraordinary numbers.
Ø The literacy level and work participation rate among the Muslims of the district
has been found to be low when we compare it with Hindus of the district.
Perhaps low literacy and low work participation rates are driving the Muslim
population to live in extreme poverty. The gap between Muslims and Hindus in
terms of literacy and employment is to be abridged if balanced social
development is to be achieved.
Ø According to Census 2001 total cultivators in the district stood at 189279,
58384 agricultural labourers, 39970 are in household industries and 612548 in
others category. Total main workers were 900181. Marginal workers were
186219 in numbers hence making the total workers to be 1086400 which were
29.78 percent of the total population.
Ø The agriculture is still the mainstay of livelihood in the district. Crop intensity
of the diversification is still low despite larger area being brought under
cultivation and irrigation. The productivity of major crops is still lower and

17
declining trend could be observed. So, the appropriate planning is required to
fill these gaps in the agricultural sector.
Ø Lucknow has sizeable livestock population and number of livestock per 100 ha
of net area sown stands above the state figure. Proper utilization of livestock
needs emphasis.
Ø Though industrial development in general has not been very impressive in the
district but development in Khadi and Village industries, which have great
potential of employment generation, has been good enough. Thus, the activities
of the Khadi and the Village industry board need to be activated to bridge these
gaps and stop rural urban migrations.
Ø Major infrastructural constraints the district is confronted with are the
conditions of roads, electricity connections are there but its supplies need
proper attention, and the number of bank branches need to be increased at the
district level.
Ø Some vital gaps in educational infrastructure of schools like lesser number of
primary schools, upper primary schools, higher secondary schools and degree
colleges’ per lakh of population are visible and needs proper assessment by the
district officials. A very high teacher student ratio is also noticed in the district.
These gaps in the educational facilities need eradication.
Ø Proper health infrastructure in the district also is a lack luster figure. So
Primary health centers, Allopathic hospitals and Child/Women welfare centers
are to be increased in the district to keep pace with the increasing population in
the district. The table shows that there numbers per lakh of population have
registered unprecedented decline.
Ø The analysis points to the fact that rural part of the district is comparatively
backward when compared to its urban counterpart. Low return from
agriculture, inadequate employment opportunities and critical gaps in key rural
infrastructure has trapped the rural folks in low incomes and hence low living
conditions in the district. Though the per capita income at current and
constant prices has been much above the state average but the percentage of
BPL households in total households of the distric t is much higher as compared
to the State average. Therefore, proper planning for the composite development
of rural areas of Lucknow District is required to fulfill the ambitions laid down
by the Ministry of Minority Affairs, Government of India.

18
CHAPTER III
SOCIO-ECONOMIC STATUS OF SAMPLE VILLAGES IN DISTRICT LUCKNOW
Previous Chapter highlighted the issue that our study is confined to 30 village
sample spread over four tehsils of Lucknow district viz; Bakshi ka talab, Malihabad,
Lucknow tehsil and Mohanlalganj. In this chapter an effort has been attempted to
focus on the socio-economic condition existing in the selected villages. We shall here
try to highlight the socio-economic conditions on various indicators such as
demographic features, existing educational and medical facilities, public amenities etc.
to pin point the loopholes for policy formulation.
3.1 Demographic Status
3.1.1 Status of Households, Population and Size of Family
Overall 30 sample villages were surveyed in district Lucknow in which 4759
households were recorded. About 84.68 per cent households belonged to Hindu
community, 15.19 per cent Muslims and 0.13 per cent of Sikh community. About
26210 population belongs to Hindus, 5100 Muslims and 39 Sikhs. Community -wise
average size of households was 6.50 Hindus, 7.05 Muslims and 6.50 Sikhs. Overall
average size of households was 6.59 persons (See Table 1).
Table 1: Religion-wise population
Religion Number of households
Percentage Total population
Average family size
Hindu 4030 84.68 26210 6.50 Muslim 723 15.19 5100 7.05 Sikh 6 0.13 39 6.50 Christian 0 0.00 0 0 Buddhist 0 0.00 0 0 Total 4759 100.00 31349 6.59 Source: Based on the Primary data.
3.2 Status of Economic Activities
3.2.1 Occupational Status
Maximum workers were engaged as cultivators 55.8 per cent followed by
agricultural labourers 17.99 and other workers 21.07 percent. Overall in primary
activity 73.79 per cent, in secondary activity 5.14 per cent and in tertiary activity 21.07
per cent people are engaged (See Table 2).

19
Table 2: Occupational Pattern
Category Number of workers Percentage Cultivators 6190 55.80 Agricultural Labour 1996 17.99 Household Industry 570 5.14 Other workers 2337 21.07 Total 11093 100.00 Source: Based on the Primary data.
3.2.2 Status of Land Utilisation
Total area of 30 villages was reported 16849.02 acres in which maximum 68.77 per
cent was occupied by agriculture, followed by 5.37 per cent by area under non-agricultural
uses, 7.8 per cent under current fallow and rest in other purposes. Area sown more than
once was 6141.64 acres i.e. 36.45 percent. Gross sown area was 16849 acres (See Table 3).
Table 3: Land Use Pattern
Item Area Percentage 1. Total reporting area (Acres) 16849.02 100.00 2. Forest 117.5 0.70 3. Uncultivable land 2272.22 13.49 4. Non-agricultural uses 905 5.37 5. Cultivable Waste 381.85 2.27 6. Pasture/Grazing 398.58 2.37 7. Orchards 2371.5 14.08 8. Other Fallow 287.5 1.71 9. Current Fallow 1314.79 7.80 10. Net Area Sown 11587.15 68.77 11. Area Sown more than once 6141.64 36.45 12. Gross Area Sown 16849.02 100.00 Source: Based on the Primary data. 3.2.3 Status of Irrigation
Irrigation the backbone of agriculture was maximum done by tubewell
(private), i.e. 79.82 per cent and canal 18.40 per cent and what is striking to note is
that the government tubewells do not play much role for the development of irrigation
in the district of Lucknow (See Table 4).
Table 4: Sources of Irrigation
Source Percentage of Irrigated Area Canal 18.40 Tube well (Govt.) 1.68 Tube well (private) 79.82 Hand pump 0.00 Wells 0.00 Ponds, etc. 0.00 Other 0.09 Source: Based on the Primary data.

20
3.2.4 Status of Non-Agricultural Activities
In non-agricultural activities dairying was dominant in 73.3 per cent villages,
fisheries in 16.67 per cent villages, manufacturing in 16.67 per cent villages, services in
16.67 per cent villages and rest other activities in 13.3 per cent villages (See Table 5).
Table 5: Non-Agricultural Activities in the village or near by:
Type of Activity No. of villages Percentage Dairying 30 100.00 Fishery 5 16.67 Service activity 5 16.67 Manufacturing activity 5 16.67 Any other 24 13.33 Source: Based on the Primary data.
3.2.5 Status of Handicraft
About 13 villages or 43.33 per cent of surveyed villages where artisan/
handicraft work was reported (See Table 6).
Table 6: Artisan/Handicraft activities in the village:
Detail Yes (No. of villages) Per Cent Villagers engaged in any artisan or traditional handicraft 13 43.33 Source: Based on the Primary data.
3.3 Status of Health Facilities
To assess the socio economic status of the villages existing medical and
educational facilities were probed very pertinently. It was significant to mention that
in Lucknow district being the state capital the villages selected showed positive signs
of development though with some underpinnings to thrust upon.
3.3.1 Status of Hospital and Dispensaries
In 9 sample villages health sub-centres were found located in the village itself, 3
villages were benefited from sub-centres located in the block and 18 villages were
served by Panchayat’s sub-centre. Average distance to sub-centres was 1.67 kms.
More than half villages (18) were using pucca or semi-pucca roads. All the 30 villages
were availing health services of PHC which were located in block. Average distance to
PHC was 3.57 kms. About 16 villages were using pucca/semi-pucca roads. About 25
villages were availing CHC services from block and 5 villages from district. Average
distance to CHC was 9.13 km. and 25 villages were having access of CHC by pucca and

21
1 by semi-pucca roads. Hospital/dispensary services were used by 23 villages within
the block and 6 villages within Panchayats and 1 village within its premises. Average
distance to hospital/dispensary was 8.37 km. and 24 villages were using pucca and 2
villages semi-pucca roads. Most of villages (19) avail health services of private
qualified allopathic Doctors who are available in block where average distance is 5.53
km. About 25 villages avail child care services within block mostly villagers use
pucca/semi-pucca roads. For family planning clinic 22 villages avail services which
are available within block wherever distance is 7.40 kms. mostly by pucca/semi-pucca
roads. Fortunately the road connectivity was found to be good with maximum villages
reporting pucca /semi-pucca conditions. To most villages the chemist/medicine shops
are available within block (See Table 7).
Table 7: Hospitals and Dispensaries
Type of health Facility
Wit
hin
V
illa
ge
Wit
hin
B
lock
Wit
hin
P
anch
ayat
Wit
hin
D
istr
ict
Ave
rage
D
ista
nce
(K
ms)
Pu
cca
Sem
i P
ucc
a
Ku
tch
a
Ku
tch
a P
ucc
a M
ix
Sub-centre 9 3 18 0 1.67 1 8 1 0 1 1 PHC 1 6 23 0 3.57 1 1 4 0 1 5 CHC 0 25 5 0 9.13 25 1 0 4 Hospital/Dispensary 1 23 6 0 8.37 2 4 2 0 4 Private Qualified Allopathic Doctors 2 19 8 1 5.53 2 4 3 0 3 Child Care Centre 4 18 7 1 4.97 2 4 3 0 3 Family Planning Clinic 0 22 2 6 7 .40 1 8 1 0 0 2 Chemist/Medicine Shop 4 1 5 10 1 4.53 2 2 5 0 3 Source: Based on the Primary data.
3.3.2 Status of Treatment
Probing the availability of facilities at the sub-centre and the PHC it was found
that the ANM services are available to maximum of villages in sub-centres and PHCs.
In 25 out of 30 sample villages it was found that the Sub-Centre had an ANM and 17
villages reported of having PHCs. Availability of medicines were reported by 25
villages at the Sub-Centre and 18 PHCs. Doctor’s services are availed by 23 and 17
villages who are available in sub-centres and PHC. Only 1 village get regular check up
in sub-centre when majority 21 villages get this facility at PHC. Pathological test is not
at all available in any villages Sub Centre whereas maximum 17 villages get this facility
at PHC. X-Ray facility is absent in all villages at sub-centre and PHC. Only 7 villages
avail hospital bed in PHC. It is therefore necessary to look forward for further
improvement in Health services which caters for the well being of the majority of
households (See Table 8).

22
Table 8: Facilities at the Sub-centre or PHC (number of villages)
Facilities Sub Centres PHC ANM 25 17 Medicines 25 18 Doctor 23 17 Regular Checkup 1 21 Pathological Tests 0 17 X-Ray 0 0 Beds 0 7 Any Other 0 0 Source: Based on the Primary data. 3.3.3 Status of Availability of Health Services Looking into the frequency of visit of health staff in the village highlights the
fact that the ANM and ASHA are regularly visiting the villages. Except Lady Health
Visitor/ASHA or ANM no other health services are reported covering most of the
villages (See Table 9). These Health providers are the milestone in spreading
awareness among the people regarding importance of sanitation and hygiene and also
to provide health awareness within the precincts of the villages itself. The table 9 is self
explanatory as we can find that other health/ medical staff are visiting the villages
twice in a village only to embark upon there official duty.
Table 9: Frequency of visit of Health Staff in the Village
Frequency Type of staff Regularly Weekly Monthly Quarterly Half Yearly Medical Officer 1 4 7 0 18 Lady Health Visitor 2 5 10 0 13 ANM 17 12 1 0 0 Malaria Inspector 0 5 5 0 20 Health Educator 0 4 3 1 22 Vaccinator 0 18 9 0 3 ASHA 23 2 0 0 5 Others 0 3 0 0 28 Source: Based on the Primary data. To further analyse the health facilities we tried to assess the condition of PHC
building in terms of good, satisfactory, poor and bad. About condition of PHC and
Sub-Centre, good condition was reported by 50.00 per cent villages, satisfactory 50.00
per cent and poor by none villages. For availability of doctor was in 74.01 per cent
villages, their availability for some time was in 33.33 per cent villages and their rare
availability was in 11.1 per cent villages. Medicines were available in 37.0 per cent
villages, occasional problem in availing medicines in 59.3 per cent villages and only in

23
one or 3.7 per cent villages there was constant problem of availability of medicines. As
stated earlier rural health services need attention at priority (See Table 10).
Table 10: Conditions of PHC/sub-centre in the village
Percentage (%) Buildings Good Satisfactory Poor Very bad
3 3 0 0
50.00 50.00
- -
Doctor Available daily Available sometimes Available rarely
1 2 3
16.67 33.33 50.00
Medicines Available regularly Occasional problems Constant problems
3 2 1
50.00 33.33 16.67
Source: Based on the Primary data. Medical services provided by the government become short of the demand
hence people have to throng the private premises of the doctors fulfilling their need s
by Jhola chap practitioners (50.00 percent). Unfortunately 15 villages out of 30
selected villages reported of having private doctors but only one was a trained allopath
and rest were the quacks or Jhola chap doctors. It is well known fact that doctors are
hesitant in accepting their rural postings and perhaps the government rule of one rural
posting a must is not able to fulfill the needs of villagers (See Table 11).
Table 11: Private Medical Facilities
Items Number of villages Percentage Availability of doctor Yes No
15 15
50.00 50.00
Type of doctor Allopathic Homeopathic Unani Ayurvedic Jhola type
1 2 0 1 15
16.67 33.33
- 16.67 50.00
Source: Based on the Primary data. As far as ICDS and Aanganwadi centres are concerned their conditions is said
to be good enough. Total 26 Aanganwadis were running in villages in which 11 are in
government buildings and 15 are in private building. Out of 15 Aanganwadis run in
private buildings, 7 are located in the houses of Aanganwadi workers and one each in
Mukhiya house and in PRIs houses and remaining 6 in other location. Except 9
Aanganwadis most of them are run in good, satisfactory and poor buildings. During

24
last one month 836 mothers visited the Aanganwadis and 2933 children were
benefited. In most cases, i.e. 92.31 per cent reported that ICDS supervisor visit the
centre, and mostly they visited monthly (See Table 16).
Table 16: Aanganwadi/ICDS Centre
Details Number Percentage Place of House where located
Govt. Building Private Building
11 15
42.31 57.69
If Pvt. Building then whose house located Mukhiya House Sarpanch Other PRI representative Aanganwadi workers Others
1 0 1 7 6
6.67 0.00 6.67
46.67 40.00
Condition of Buildings Good Satisfactory Poor Bad
4 8 5 9
15.38 30.77 19.23 34.62
Number of Mothers and Children visited/benefited during the last one month
Mother Children
836 2933
Does the ICDS supervisor visit the centre Yes No
If yes the: Weekly Monthly Quarterly
24 2
0 20 4
92.31 7.69
0.00
30.77 16.77
Source: Based on the Primary data.
3.4 Status of Educational Facilities
Education is the basic requirement for the overall social development of any
region and of mankind. Hence here we have tried to capture the educational situation
in selected villages of district Lucknow.
3.4.1 Status of Availability of Educational Institutions
Out of 30 sample villages 25 villages were having primary schools and 4 villages
were availing education from the schools located within Panchayat. Average distance
to primary schools was reported 0.27 km. and most of the villages were connected with
schools by pucca and Semi-pucca mix roads. Only 12 villages were having Middle
School, rest 5 and 13 villages were availing services in block and panchayat

25
respectively . Average distance was 1.7 km. However, when it comes to High
School/Higher Secondary School for boys and girls none of the villages had the
privilege of having this category of schools within the village. Some 22 villages avail
High/Higher Secondary (Boys) education in block, while girls of 26 villages also go to
block. Girls of 4 villages go to district schools for secondary education. Average
distance to Secondary Schools is 7.00 kms. and most of the villages are having access
to schools by Pucca and Semi-Pucca roads, except 5 villages by Kutcha road.
Education of religious schools is available within 5 villages and 1 villages avail
education in block, 1 in Panchayat and 25 in district. Average distance is about 2.1
kms. and accessibility is mostly by Kutcha- pucca mix road. In 1 village non-formal
education is available and average distance is 6.13 km through Kutcha-pucca mix
roads. The details related to availability of educational infrastructure, distance which
children slog to school and the nature of connectivity whether Pucca, Kutcha pucca -
Kutcha mix are all provided in the Table below:
Table 12: Educational Facilities ( number of villages)
Place Type of road
Type
Wit
hin
Vill
age
Wit
hin
Blo
ck
Wit
hin
Pa
ncha
yat
Wit
hin
Dis
tric
t
Dis
tanc
e
(ave
rage
) (k
ms)
Pucc
a
Sem
i Puc
ca
Kut
cha
Kut
cha
Pucc
a
Mix
Primary School 25 1 4 0 0.27 21 4 3 2 Middle School 12 5 1 3 0 1.70 23 2 3 2 High/Higher Secondary (Boys) 0 2 2 8 0 6.17 25 1 0 4 High/Higher Secondary (Girls) 0 2 6 4 0 7.00 24 1 0 5 Religious School 5 1 1 25 2.10 5 1 0 24 Non Formal Education Centre 1 0 0 29 6.13 0 0 0 30 Others 0 1 0 29 6.13 1 0 0 29 Source: Based on the Primary data.
3.4.2 Status of Availability of Educational Institutions
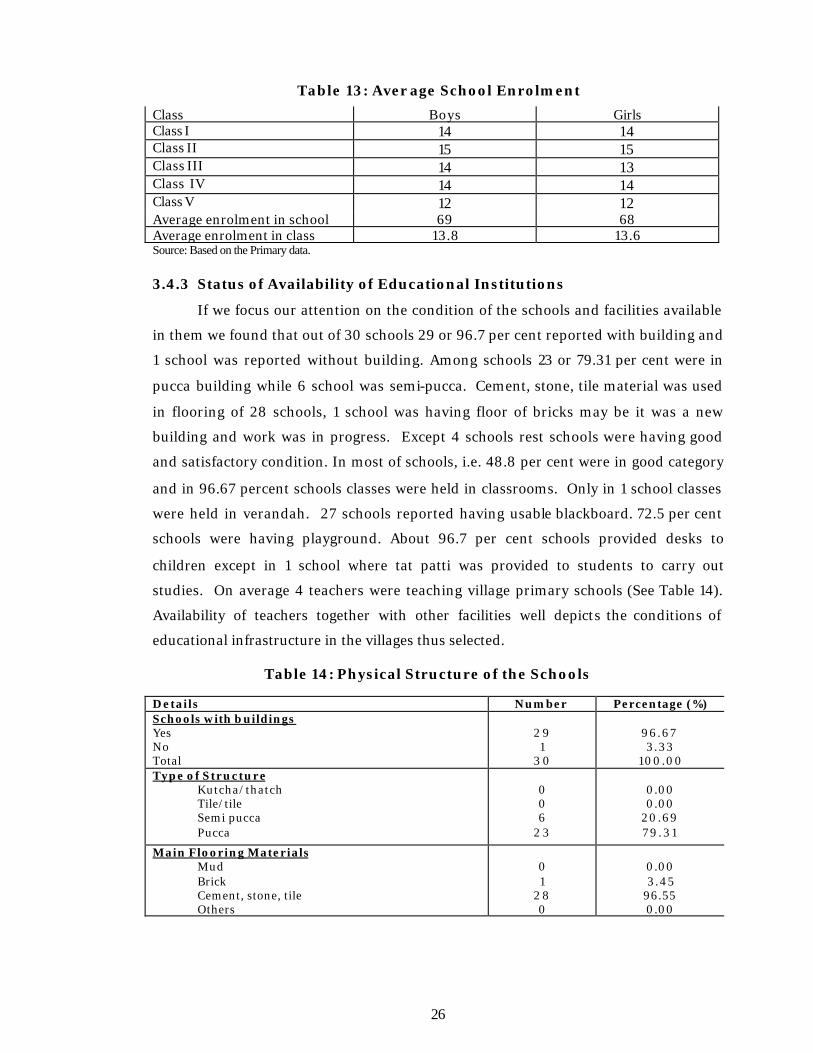
Table 13 highlights the average enrolment of school children on a sex-wise basis
and in different classes upto primary level. Overall average school enrolment in
primary schools (Class I to V) is about 69 and 68 for boys and girls respectively.
Average enrolment in a class is 14 students. The enrollment seems to be lower in all
the classes in view of the fact that each primary school average number of teachers
should be 5 and the teacher-student’s ratio should be 40. It is estimated that at quiet a
number of school going age children are not yet enrolled in any school (see Table 13).
26
Table 13: Aver age School Enrolment
Class Boys Girls Class I 14 14 Class II 15 15 Class III 14 13 Class IV 14 14 Class V 12 12 Average enrolment in school 69 68 Average enrolment in class 13.8 13.6 Source: Based on the Primary data. 3.4.3 Status of Availability of Educational Institutions
If we focus our attention on the condition of the schools and facilities available
in them we found that out of 30 schools 29 or 96.7 per cent reported with building and
1 school was reported without building. Among schools 23 or 79.31 per cent were in
pucca building while 6 school was semi-pucca. Cement, stone, tile material was used
in flooring of 28 schools, 1 school was having floor of bricks may be it was a new
building and work was in progress. Except 4 schools rest schools were having good
and satisfactory condition. In most of schools, i.e. 48.8 per cent were in good category
and in 96.67 percent schools classes were held in classrooms. Only in 1 school classes
were held in verandah. 27 schools reported having usable blackboard. 72.5 per cent
schools were having playground. About 96.7 per cent schools provided desks to
children except in 1 school where tat patti was provided to students to carry out
studies. On average 4 teachers were teaching village primary schools (See Table 14).
Availability of teachers together with other facilities well depicts the conditions of
educational infrastructure in the villages thus selected.
Table 14: Physical Structure of the Schools
Details Number Percentage (%) Schools with buildings Yes No Total
2 9
1 3 0
96.67 3.33
100.00 Type of Structure
Kutcha/thatch Tile/tile Semi pucca Pucca
0 0 6
2 3
0.00 0.00
20.69 7 9 . 3 1
Main Flooring Materials Mud Brick Cement, stone, tile Others
0 1
2 8 0
0.00 3.45
96.55 0.00

27
Condition of Building
Good Satisfactory Poor Very bad
1 4 1 1 4 0
48.28 37 .93 1 3 . 7 9 0.00
Where classes normally held In the class room In the Verandah Open space
2 8
1 0
96.55 3.45 0.00
Does the school have useable blackboard Yes No
2 7 2
93.10 6 . 9 0
Does the school have playground Yes No
2 1 8
72.41 27.59
Seating facility provided to students Tat-patti Desk
1
2 8
3.45
96.55 How may teachers are currently teaching classes (1-5) 9 6 - Source: Based on the Primary data. 3.4.4 Status of Preference of Schooling
While surveying we came across the fact that only 10 private school could be
located in the 30 sampled villages. There were 10 primary schools upto class level VIII
within the villages where 1378 students were enrolled. About 94.45 per cent preferred
government schools (see Table 15). Given the economic status of rural areas it was
quiet obvious that majority favoured government schools for procuring education.
Table 15: Private Schools and Preference of People for Schools
Number of schools within the village 10 Up to the class level 8 No. of students enrolled 1378 Preference of the schools
Government Private Both
17 1 0
% 94.45 5.55
0 Source: Based on the Primary data. 3.5 Status of Public Amenities and Facilities Availability of infrastructural facilities pinpoint the level of development of any
village and here we try to gauge the level of these facilities available in the selected villages
with the help of query on public amenities in terms of roads, electricity, water and
sanitation – the basic component of every day living.
3.5.1 Status of Roads
In Table 17 we have tried to summarise about roads and electricity situation in the
villages. At the outset we can comprehend that in all 30 villages kharanja roads could be
found and only 1 village all weather road was found. All 29 villages were connected by
28
Kutcha roads. Average distance from main road was reported to be 4.98 kms. (see Table
17) .
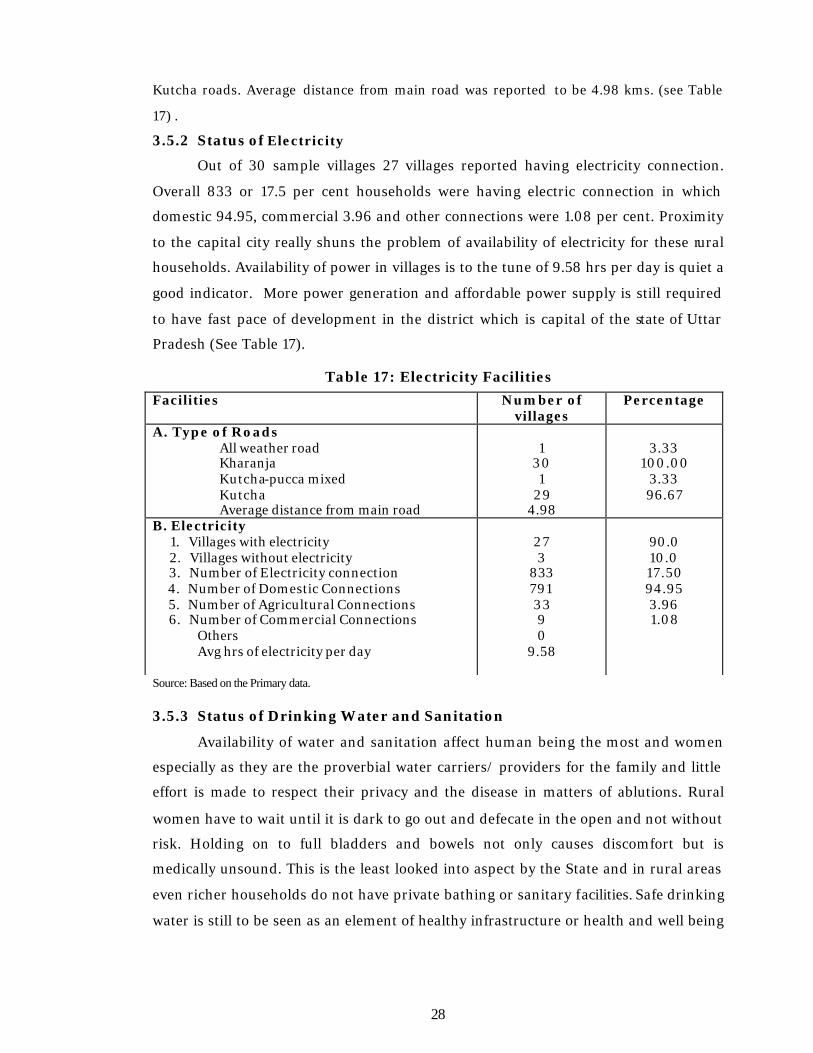
3.5.2 Status of Electricity
Out of 30 sample villages 27 villages reported having electricity connection.
Overall 833 or 17.5 per cent households were having electric connection in which
domestic 94.95, commercial 3.96 and other connections were 1.08 per cent. Proximity
to the capital city really shuns the problem of availability of electricity for these rural
households. Availability of power in villages is to the tune of 9.58 hrs per day is quiet a
good indicator. More power generation and affordable power supply is still required
to have fast pace of development in the district which is capital of the state of Uttar
Pradesh (See Table 17).
Table 17: Electricity Facilities
Facilities Number of villages
Percentage
A. Type of Roads All weather road
Kharanja Kutcha-pucca mixed Kutcha Average distance from main road
1
30 1
29 4.98
3.33
100.00 3.33 96.67
B. Electricity 1. Villages with electricity 2. Villages without electricity 3. Number of Electricity connection 4. Number of Domestic Connections 5. Number of Agricultural Connections 6. Number of Commercial Connections
Others Avg hrs of electricity per day
27 3
833 791 33 9 0
9.58
90.0 10.0 17.50 94.95 3.96 1.08
Source: Based on the Primary data. 3.5.3 Status of Drinking Water and Sanitation
Availability of water and sanitation affect human being the most and women
especially as they are the proverbial water carriers/ providers for the family and little
effort is made to respect their privacy and the disease in matters of ablutions. Rural
women have to wait until it is dark to go out and defecate in the open and not without
risk. Holding on to full bladders and bowels not only causes discomfort but is
medically unsound. This is the least looked into aspect by the State and in rural areas
even richer households do not have private bathing or sanitary facilities. Safe drinking
water is still to be seen as an element of healthy infrastructure or health and well being

29
of populations. In the absence of safe drinking water, people fall easy prey to
waterborne diseases.
There are 38 public wells out of which only 5.26 per cent were functional.
Private wells are 230 but only 38 i.e. 16.52 per cent are in working condition. Public
hand pumps are 457 and 79.65 per cent are in working position. Private hand pumps
are 882 and 54.31 per cent are working. All 20 public Tubewells are not in working
condition. Private Tubewells are 4 out of which 100.0 per cent are working. There tap
water is available only in 11 houses (see Table 18).
Table 18: Drinking water
Type Total in villages Functional Percentage (%) Public well 38 2 5.26 Private well 230 38 16.52 Public Hand pumps 457 364 79.65 Private Hand pumps 882 479 54.31 Public Tube well 20 0 0.00 Private Tube well 4 4 100.00 Public stand post 0 0 0.00 Tap water inside house 11 0 0.00 Tank/river 0 0 0.00 Others 38 2 5.26 Source: Based on the Primary data.
Out of 30 villages only 1 village reported having some toilet facility, rest 29
villages have no toilet facility. Under total sanitation campaign 666 toilets were made
for public usage (see Table 19).
Table 19: Toilet Facilities
Toilet Facility Number of Villages
Percentage (%)
Yes No
1 29
3.33 96.67
Toilets of Total Sanitation Campaign (TSC) 666 Source: Based on the Primary data.
3.5.4 Status of Other Facilities
Table 20 below highlights on other facilities such as bus stop, railway station, post
office, market centre, commercial banks etc. Only one village’s Block Headquarters is
located within the village, 25 within block and 3 within panchayats at a distance of 11 kms.
For 18 villages nearest town is in Block for 6 in Panchayat and for another 6 in district.
Average distance to town is 12 kms. For 20 villages nearest bus stop is in block, 7 in
Panchayat and for 1 village in district. Average distance to bus stand is 7 kms. For 18
villages nearest regular market is in Block, 9 in Panchayat and 1 in district. Average
distance to regular market is reported 5 kms. Average distance to veterinary centre is 4

30
kms. In 1 village Government Procurement Centre is located where as 19 villages are
linked with Block and 10 within Panchayat. Average distance to procurement centre is 6
km. In 25 villages Panchayat Ghar is located, while for 5 it is in Panchayat. Average
distance to Government Procurement Centre is 1 km. (see Table 20).
Table 20: Other Facilities:
Type Within village
Within Block
Within Panchayat
Within District
Average Distance
(km) Block HQ 1 26 3 0 11 Nearest Town 0 18 6 6 12 Nearest Bus Stop 2 20 7 1 7 Nearest Regular Market 2 18 9 1 5 Nearest Rail Station 1 15 10 4 8 Nearest Post Office 5 10 14 1 3 Commercial Bank 2 17 10 1 5 Gram Panchayat Office 23 0 7 0 2 Fair Price Shop 20 4 6 0 2 Other General Shops 15 8 7 0 2 Veterinary 4 14 12 0 4 Govt. Procurement Centre 1 19 10 0 6 Panchayat Ghar 25 0 5 29 1 Others 1 26 3 0 11 Source: Based on the Primary data.
3.6 Status of Government Programmes 3.6.1 Status of SGSY
Table 21 shows the information regarding beneficiaries through various
government programmes. In Sarva Gramin Swarozgar Yojana (SGSY) 65 were total
beneficiaries in which 30.76 per cent SCs were benefited, 23.6 per cent Minorities and
46.15 per cent others were benefited. In National Rural Employment Guarantee Agency
(NREGA) none of the respondents reported with being benefited under this programme of
the government. In Indra Awas Yojana total 288 beneficiaries were there, in which 61.8
per cent SCs, 9.2 per cent Minorities and 29.1 per cent others were benefited. In Old Age
Pension Scheme total 767 beneficiaries were recorded out of which 61.16 per cent went to
SCs, 10.13 per cent to Minorities and 28.71 per cent to Others. In Widow Pension Scheme
total 404 beneficiaries were reported in which 62.13 per cent wee SCs, 12.38 per cent
minorities and others 25.50 per cent (see Table 21).
Table 21: Individual Beneficiary Oriented Programmes
Programme Total SC % Minority % Others % SGSY 65 20 30.77 15 23.08 30 46.15 NREGA 0 0 0 0 0.00 0 0.00 IAY 288 196 68.06 0 4.94 35 12.15

31
Others 81 38 46.91 4 39 48.15 Pension Scheme Old age pension scheme Widow pension scheme
1254 404
767 251
61.16 62.13
127 50
10.13 12.38
360 103
28.71 25.50
Source: Based on the Primary data. 3.6.2 Status of PDS
As far as public distribution system is concerned, Public Distribution System
(PDS) was available in 14 out of 30 villa ges selected i.e. only 46.67 per cent villages
whereas 53.33 percent of village do not have such facilities and hence villagers have to
travel an average distance of 0.8 kms to avail such facility. Total 9813 ration cards
were issued to the households in sample villages out of which 7.57 percent ration cards
were provided by Antyodaya, 12.16 per cent by BPL and 80.26 per cent by APL. In 26
or 86.67 per cent villages foodgrains was supplied by public distribution system. Sugar
was supplied in all the 100.00 per cent villages and Kerosene oil was supplied only in
33.33 per cent villages. PDS services are poor in villages, which needs to be improved
(see Table 22).
Table 22: Public Distribution System
Particulars Numbers Percentage (%)
PDS in the Village yes No
If yes, the how many shops in the village If no, then distance
14 16 14 0.8
46.67 53.33
Number of ration card 9813 Type of card
Annapurna Antyodaya BPL APL
0 7 4 3 1194 7876
0 7.57 12.16 80.26
Is supply regular Foodgrain
Yes No.
Sugar Yea No
Kerosene oil Yes No
26 4
30 0
10 20
86.67 13.33
100.0
0.0
33.33 66.67
Source: Based on the Primary data.

32
3.6.3 Status of SHGs Table 23 shows the existence of Self Help Groups (SHG’s) in sampled 30
villages undertaken for study. These SHGs provide empowerment to the villagers
through various activities and provisioning of credit to the needy. In 17 or 56.67 per
cent villages SHGs are formed when in 13 or 43.34 per cent villages it does not exist.
There is a total 25 SHGs in these villages (see Table 23).
Table 23: Self-help Groups
Villages having SHGs Number Percentage 1.yes 2. No
17 13
56.67 43.34
Total SHGs 25 Source: Based on the Primary data. 3.6.4 Status of Credit Cooperatives
It is to our dismay that there were very many village level organizations but a
majority of them are reported to be non-functional. Total Credit Cooperatives in
villages are 28 which are functional with average number of 22, while 2 are non-
functional. Cooperatives of Agricultural inputs is 1 which is functional and 29 are non-
functional which means that every village has one registered cooperatives of
agricultural inputs. In Cooperative for production of khadi, Cooperative Marketing
and Dairy Cooperatives all are non-functional. Only one Functional farmers
organizations was reported. Functional Voluntary Organization is one with only one
member (see Table 24).
Table 24: Village Organization
Organization Functional Non-Functional
Average number of members
1. Cooperatives i. Credit 28 2 22 ii. Agricultural Inputs 1 29 0 iii. Production of Khadi 0 30 0 iv. Marketing 0 30 0 v. Dairy Coop 0 30 0 vi. Others 1 29 0 2. Workers organizations/unions 0 0 0 3. Farmers organisation 1 29 0 4. Voluntary Organizations 2 28 5 5. Religious/Caste organizations 0 30 0 6. Political Organizations 3 27 7 7. Cultural Organizations 4 26 10

33
8. Youth Mandal 1 29 1 9. Women Mandel 0 30 0 10. Flood Relief Village Security Force 0 30 0 Source: Based on the Primary data.
4. Development Constraints in the Villages
Development constraints as perceived by the responsible citizens (Pradhans
and Sarpanch) of the selected villages were very pertinently laid out in front of the
survey team are as follows despite the fact that 30 villages covering as many as 4
Tehsils were visited by us and the central problem are by and large common all over
these villages:
Ø In all villages without any exception the people have demanded that the road
network should be developed properly. The average distance covered before
reaching the main road was 4.98 km and walking through kutcha or kharanja laid
path is a great nuisance particularly during the monsoons. Moreover, every village
should have a proper link road.
Ø The existing medical infrastructure has its own tale to relate. The ill equipped sub-
centres and also the PHCs to some extent cause problems for the village
community in fulfilling their needs to meet medical care. Even the private
practitioners in the villages are ‘Jhola Chap’ doctors. On the whole, therefore, the
community is of the opinion that better medical services should be provided to
them by the government.
Ø The irregular power supply is yet another aspect which has been reiterated by
Pradhans. This is one of the reasons why people are reluctant to take electrical
connections whether it is for domestic, agricultural or commercial purposes. The
average daily power supply of 9.58 hours is sufficient to meet the requirements of
the people. The problem becomes more acute considering the fact that most of the
times power su pply is not available at the time when it is needed the most.
Ø The problem of water is prevalent in the areas with most of the handpumps being
non-functional. Only 80 percent of public handpumps are functional and 54
percent private are functional. Even those who have their own hand pump or
tubewell do not have sufficient resources to afford deep boring to get water for
usage. Public tubewells are dysfunctional to the extent that irrigation is a problem
reported by the villagers. The general opinion is that the government can play an
active role in providing a suitable water facility.
Ø As far as public distribution system is concerned Public Distribution System (PDS)
was available in 14 out of 30 villages selected i.e. only 46.67 per cent villages

34
whereas 53.33 percent of village do not have such facilities and hence villagers have
to travel an average distance of 0.8 kms to avail such facility
Ø Only very few villages had bank branches. Bank branches will not only prove useful
in making credit available to them on easy terms but they could also prove
beneficial in inculcating the habit of thrift among the people. It is, therefore,
desirable that every village should have at least one bank branch. Moreover, in
many cases banks are reluctant to extend credit facilities to the people. This forces
them to borrow money at extremely high rates of interest from, non-institutional
sources.
Ø Facilities of education upto the Upper Primary level are usually available within the
village itself or in close proximity of the villages, the students have problem when
they have to move out for higher education. Moreover, institutes offering technical
education such as ITIs, and Polytechnics are not found located close to these
villages.
Ø Few Pradhans also informed that there is problem of sanitation and only one
village reported of having toilet facility within household premises. It’s a big
nuisance for females of the village because they have to wait for sun to go before
they could go out to defecate.
Ø It was also pointed out that the veterinary services being provided too need to be
strengthened keeping in mind that many families are engaged in the dairy business
while some are keeping goats or poultry.
Some Areas which have the Potential for Development
v Dairy activity is quite popular but its potential has not been properly exploited.
Besides carrying out the revamping exercise it is equally important to introduce
new milk routes, form active milk producers cooperatives and increase the
storage as well as chilling capacity from the current level. It would be equally
important to distribute good quality milch animals and ensure that veterinary
services are adequately developed to cater to the needs of the animal husbandry
sector. At the same time it would be ideal if some units manufacturing milk
products are also set up in the area as it would provide an assured market to
those connected with the dairy activity.
v The development of fisheries in rural areas of Lucknow district with the
intention of developing self employment among the masses was started in
1982-83 with the help of World Bank. It was realized that it is a commercial
activity which has sufficient potential in a large number of villages. The

35
fisheries department can play the role of a catalyst in this direction and for this
various efforts were made to procure ponds for ten year lease, training the
persons willing to develop this activity and digging up ponds where required. At
the same time if a proper fish mandi is set up it will facilitate those engaged in
this sector in the marketing of their produce.
v In the villages surveyed by us there is a heavy dependence on agriculture.
However, the cultivators are mainly growing the traditional crops. Their
incomes from agriculture are not substantial as a large number have small size
of land holdings. It is therefore required that appropriate measures are taken
up by the government to enhance the level of awareness among cultivators to
diversify and go for cash crops such as vegetable in particular.
The households are seen primarily being engaged into activities related to
agriculture and animal husbandry sector but those carrying on non-agricultural
activities are low. The traditional craft are carried out by some 16 percent households
on a regular basis and they need encouragement by developing markets for their
produce. However, to assure the success of these non-agricultural activities it is
required to develop the road network, ensure access to credit facilities and marketing
network.

36
CHAPTER IV
SOCIO-ECONOMIC STATUS OF
RURAL HOUSEHOLDS IN DISTRICT LUCKNOW
4.1.1 Demographic Status of Sample Households
The field survey conducted in the 30 selected villages of Lucknow district
covered 30 households per village and hence our total sample was 900 households. In
this chapter, an analysis of socio-economic conditions of our selected sample have
been attempted with pre-determined intension of covering different religious
categories in proportion to their share in total population of the village. Thus out of the
900 sample households surveyed in 30 sample villages of district Lucknow 746 or
82.89 per cent households belonged to Hindus, 147 households or 16.33 per cent
belonged to Muslims and only 7 household or 0.78 per cent belonged to Sikh
community. The details in this manner are provided in Table 1 below:
Table 1: Distribution of Sample Households by Religion
Source: Based on the Primary data.
The table (Table 2) showing the caste-wise distribution of communities among 900
sample surveyed households we find the maximum proportion of households belong to SC
46.33 percent, ST 1.0 percent and 38.11 percent being the Upper Caste in the sample.
Specially among Muslims most of the households reported as Upper Caste even though
actually they belonged to OBC, but since they are not aware about OBC reservation and
benefits, they preferred to call themselves as Upper Caste (see Table 2).
Table 2: Distribution of Sample Households by caste Caste Number of Households Percentage
SC 4 1 7 46.33 ST 9 1
OBC 1 3 1 14.56 Upper Caste 3 4 3 38.11
Total 900 100 Source: Based on the Primary data.
Religion Number of HH Percentages Hindu 746 82.89 Muslim 147 16.33 Sikh 7 0.78 Total 900 100

37
As Lucknow district has the distinction of being under the influence of Nawabi
culture hence we find quiet a number of people speaking Urdu. The majority of our
households reported of Hindi as their mother tongue i.e. 90.33 percent. Despite 16.33
percent of total sample households being Muslims only 9.0 percent reported their mother
tongue to be Urdu (see Table 3). Urdu is the second language of our state is reflected from
the fact that some 50.11 percent households reported Urdu to be their second language.
Even Sikh families stated to be speaking Hindi and 0.44 percent have given Punjabi as
their second language. Only 0.67 percent of households said that they use Punjabi as their
mother tongue.
Table 3: Number of Sample Households Reporting their Mother Tongue
Language Mother Tongue % Second known language % Hindi 813 90.33 451 50.11 Urdu 81 9.00 14 1.56 English Punjabi 6 0.67 4 0.44 No Response 431 47.89 900 100 900 100 Source: Based on the Primary data.
4.1.2 Status of Size of Households
The following table 4 shows the religion-wise average size of families reflects upon
the fact that overall average size of family prevalent in the district is 5.52 persons. Among
Hindus the family size is smaller with 5.42 persons, when the family size of Muslims is
about 5.99 persons. The largest size of families of 6.29 persons has been reported from
Sikh community (see Table 4).
Table 4: Distribution of Sample households by size of family Size of Family (Number of family members)
Religion
Below 3 3 - 5 5 -7 7 -9 9 and above Total Avg
Size Hindu N 91 169 2 7 7 1 3 9 7 0 746 5.4 2 % 12.2 2 2 . 6 5 3 7 . 1 3 18.63 9.38 100 Muslim N 9 3 7 42 3 8 2 1 1 4 7 5.99 % 6.12 25.17 28.57 25.85 14.29 100 Sikh N 2 2 2 1 7 6 . 2 9 % 0 28.57 28.57 28.57 14.29 100 Total N 100 208 3 2 1 1 7 9 9 2 900 5.52 % 11 .11 23.11 35.67 19.89 10.22 100
Source: Based on the Primary data.
4.1.3 Sex Composition of Household Members
The sex composition of households thus surveyed show that proportion of male
population among Muslim community is 1.21 per cent less than the Hindu community

38
because of foeticite and biased family planning among Hindus. The result is that
among Hindus sex ratio is 886 whereas among Muslims it is 930 which means in
comparison to Muslims 44 females are missing among Hindus, which calls for drastic
reforms. Amongst the Sikhs we find presence of male members in more numbers and
lowest sex ratio is reported i.e. 760 females per 1000 males (see Table 5).
Table 5: Composition of Sample HH members
Religion Male Female Total Sex Ratio a -Hindu 2146 1901 4047 886
% 53.03 46.97 100 b-Muslim 456 424 880 930
% 51.82 48.18 100 d-Sikh 25 19 44 760
% 56.82 43.18 100 Grand Total 2627 2344 4971 892
% 52.85 47.15 100 Source: Based on the Primary data.
4.1.4 Status of Age Composition
The age wise composition of the surveyed population reveals that the category of
population below 15 years age group in our surveyed population is 38.04 per cent which is
highest followed by those in the age group of 15.30 years. Old age population of 60 years
and above is only 6.94 per cent which is quite low. It is noteworthy that not much
difference could be captured amongst the Hindu and Muslim households. In the
population of below 15 years of age group the proportion of Muslim population is higher
than the Hindu population and even the same situatio n is there in the age group of 15-30
years age group. In the age group 60 years and above the proportion of Hindu population
is more than Muslims’ proportion which reflects upon the fact that due to poor living
conditions the longevity of life among Muslims is shorter than the Hindu population, and
it is well depicted in the table below(see Table 6).
Table 6: Age Composition of Family Members Age Groups (in years) Religion Below 15 15 -30 30-45 45-60 60 &above Total
Hindu N 1528 1179 681 360 297 4 047 % 37.76 29.13 16.83 8.90 7.34 100.00 Muslim N 353 282 125 80 40 880 % 40.07 32.01 14.19 9.08 4.65 100.00 Sikh N 10 12 12 3 7 44 % 22.73 27.27 27.27 6.82 15.91 100.00 Total N 1891 1473 818 443 344 4971 % 38.04 29.63 16.46 8.91 6.94 100.00
Source: Based on the Primary data.
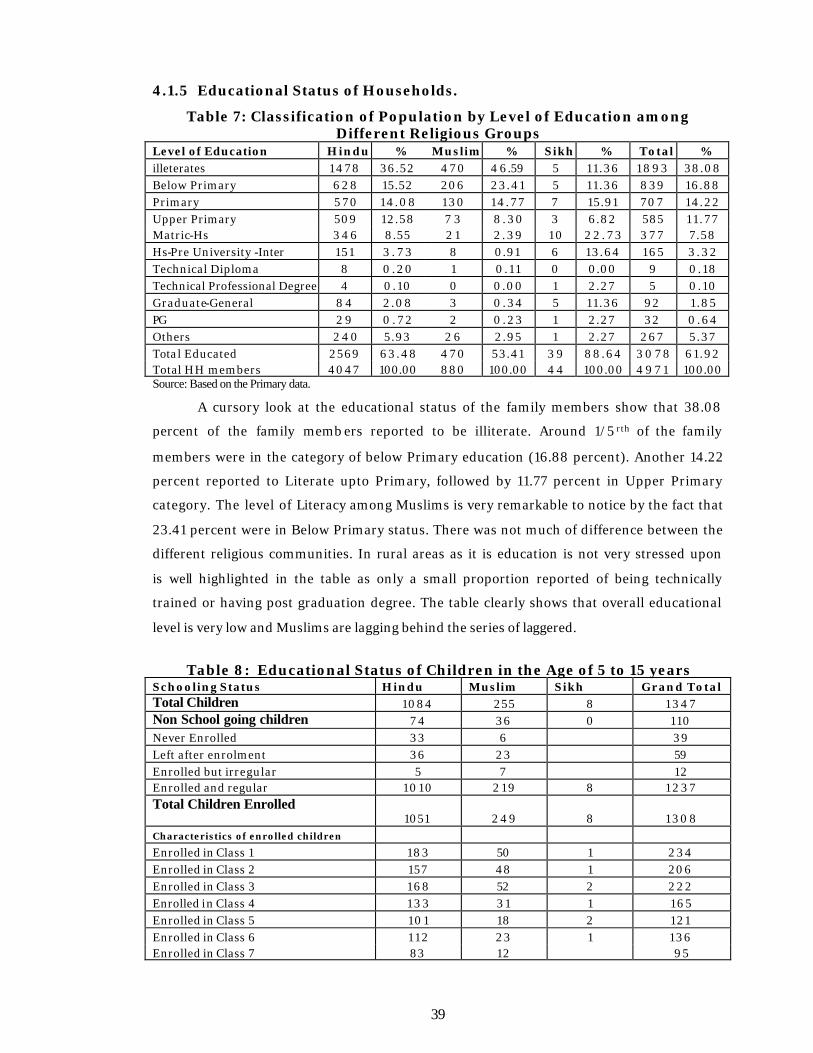
39
4.1.5 Educational Status of Households.
Table 7: Classification of Population by Level of Education among Different Religious Groups
Level of Education Hindu % Muslim % Sikh % Total % illeterates 1 4 7 8 36.52 4 7 0 4 6.59 5 11.36 1 8 9 3 38.08 Below Primary 6 2 8 15.52 206 23.41 5 11.36 839 16.88 Primary 5 7 0 14.08 1 3 0 1 4 . 7 7 7 15.91 707 14.22 Upper Primary 509 12.58 7 3 8 . 3 0 3 6.82 585 11 .77 Matric-Hs 3 4 6 8.55 2 1 2 . 3 9 1 0 2 2 . 7 3 3 7 7 7.58 Hs-Pre University -Inter 151 3 . 7 3 8 0.91 6 13.64 1 6 5 3 . 3 2 Technical Diploma 8 0 . 2 0 1 0.11 0 0.00 9 0.18 Technical Professional Degree 4 0.10 0 0.00 1 2.27 5 0.10 Graduate-General 8 4 2.08 3 0 .34 5 11.36 92 1.85 PG 2 9 0 . 7 2 2 0 .23 1 2.27 32 0.64 Others 2 4 0 5.93 2 6 2.95 1 2.27 267 5.37 Total Educated 2569 63.48 4 7 0 53.41 3 9 88.64 3 0 7 8 61.92 Total HH members 4047 100.00 880 100.00 4 4 100.00 4 9 7 1 100.00 Source: Based on the Primary data.
A cursory look at the educational status of the family members show that 38.08
percent of the family memb ers reported to be illiterate. Around 1/5 rth of the family
members were in the category of below Primary education (16.88 percent). Another 14.22
percent reported to Literate upto Primary, followed by 11.77 percent in Upper Primary
category. The level of Literacy among Muslims is very remarkable to notice by the fact that
23.41 percent were in Below Primary status. There was not much of difference between the
different religious communities. In rural areas as it is education is not very stressed upon
is well highlighted in the table as only a small proportion reported of being technically
trained or having post graduation degree. The table clearly shows that overall educational
level is very low and Muslims are lagging behind the series of laggered.
Table 8: Educational Status of Children in the Age of 5 to 15 years
Schooling Status Hindu Muslim Sikh Grand Total Total Children 1084 255 8 1 3 4 7 Non School going children 7 4 36 0 110 Never Enrolled 33 6 39 Left after enrolment 36 23 59 Enrolled but irregular 5 7 12 Enrolled and regular 1010 2 1 9 8 1 2 3 7 Total Children Enrolled 1051 2 4 9 8 1 3 0 8 Characteristics of enrolled children Enrolled in Class 1 183 50 1 2 3 4 Enrolled in Class 2 157 48 1 206 Enrolled in Class 3 1 6 8 52 2 2 2 2 Enrolled in Class 4 1 3 3 3 1 1 1 6 5 Enrolled in Class 5 101 18 2 121 Enrolled in Class 6 1 1 2 23 1 136 Enrolled in Class 7 83 12 95

40
Enrolled in Class 8 57 9 66 Enrolled in Class 9 39 3 42 Enrolled in Class 1 0 1 8 3 21 Grand Total 1051 2 4 9 8 1 3 0 8 Type of School Government 7 1 8 180 2 900 Private 3 2 2 61 6 389 Madarsa 9 7 16 Missionary 0 0 Non-formal 2 2 Others 0 1 1 Grand Total 1051 2 4 9 8 1 3 0 8 Distance of School (Km Within 1 651 181 832 1-2 2 8 1 3 8 2 321 2-4 7 7 16 4 97 4 and above 42 14 2 58 Grand Total 1051 2 4 9 8 1 3 0 8 Medium of instruction Hindi 657 146 0 803 English 36 4 2 42 Hindu & English both 358 87 6 451 Urdu 0 12 0 12 Regional Language 0 0 0 0 Other 0 0 0 0 Grand Total 1051 2 4 9 8 1 3 0 8 Learning of Minority Language Yes 1 1 9 98 0 217 No 9 3 2 151 8 1 0 9 1 Grand Total 1051 2 4 9 8 1 3 0 8 Reason for Drop out Work at home 1 1 2 Need to earn 6 4 10 Far distance of School 2 2 Lack facility in School Teacher Beat Teacher do not teach Failed in Examination Fees/Expenditure not afford 22 9 3 1 Not interested in reading 4 9 13 Marriage Other 1 0 1 Grand Total 36 23 0 59 Source: Based on the Primary data.
If we focus our attention on the children of school going age i.e. 5-15 years of
age we find that the total children in this category is around 2.9 percent of them are
not enrolled mainly because their parents do not approve of their education. About
4.38 percent dropped out after being enrolled and it is quiet interesting to note that
91.83 percent are happily enrolled and very regular at the time of survey been

41
conducted. Table 8 highlights the fact that large proportion of children are reported in
the category of Class I (18.34 percen t) followed by Class II (15.67 percent) and Class III
(15.36 percent) are further reduction if one moves up the ladder thus pointing to the
fact the children in rural areas very enthusiastically joins school but later drop out due
various hazards. Large proportions of children are seen going to Government schools
(68.62 percent) and only 29.56 percent report of going to private schools. High
concentration of children in government schools points towards inability of their
parents to bear the burden of education in rural areas.
4.1.6 Status of Aspiration of Parents for their Children
About 6.22 per cent parents wanted their sons to get education upto High
School, 29.78 per cent wanted upto Intermediate, 16.89 per cent upto Graduate, 8.00
per cent upto Post-Graduate and only 4.0 per cent Technical Degree. In case of girl’s
parents 16.22 per cent wanted their daughters to get educated upto High School, 26.44
per cent upto Intermediate and 11.1 per cent upto Graduate. In case of Muslim parents
who wanted their daughter’s education upto High School, i.e. 19.73 per cent and upto
Intermediate level were 28.57 percent. What is interesting to note is that none of the
Muslim households shown any keenness for technical education for girls whereas 0.68
percent showed such education for boys (see Table 53).
Table 9: Aspirations of Parents of Current Students
Hindu % Muslim % Sikh %
Grand Total %
Boys Desired Level High School 44 5.90 1 2 8.16 0 0.00 56 6 . 2 2 Intermediate 2 1 8 29.22 50 34.01 0 0.00 268 2 9 . 7 8 Pre-Graduation/ Diploma 20 2 .68 1 0.68 0 0.00 21 2 . 3 3 Bachelor’s Degree 1 3 0 17 .43 2 1 14.29 1 14.29 152 1 6 . 8 9 Post Graduation 66 8.85 6 4.08 0 0.00 7 2 8.00 Technical Degree 29 3 .89 1 0.68 6 85.71 36 4.00 (blank) 2 3 9 32.04 56 38.10 0 0.00 2 9 5 32.7 8 Boys (Total) 7 4 6 100.00 1 4 7 100.00 7 100.00 900 100.00 Girl High School 1 1 6 15.55 2 9 1 9 . 7 3 1 14.29 146 1 6 . 2 2 Intermediate 196 26.27 4 2 28.57 0 0.00 2 3 8 26.44 Pre-Graduation/ Diploma 9 1 .21 2 1 .36 0 0.00 11 1 .22 Bachelor’s Degree 91 12.20 9 6 .12 0 0.00 100 11 .11 Post Graduation 43 5 . 7 6 5 3 . 4 0 1 14.29 49 5.44 Technical Degree 12 1 .61 0 0.00 3 42.86 15 1 .67 (blank) 2 7 9 3 7 . 4 0 6 0 40.82 2 28.57 341 3 7 . 8 9 Girl (Total) 7 4 6 100.00 1 4 7 100.00 7 100.00 900 100.00 Source: Based on the Prim ary data. 4.2 Economic Status
4.2.1 Status of Employment

42
The working status of surveyed household population is that 28.8 per cent are
employed, 2.45 per cent unemployed, 21.82 per cent work as domestic workers, 29.48
per cent students, 1.31 per cent retired, 13.3 per cent are too old and children
(unemployable).
Table 10: Working Status of Family Members
Working Status Hindu % Muslim % Sikh % Grand Total % Employed 1 1 4 8 29.19 227 27.15 1 1 25.00 1386 28.80
Unemployed 97 2.47 2 0 2.39 1 2.27 118 2 .45 Domestic Work 857 21 .79 186 22.25 7 15.91 1050 21.82
Students 1 1 8 4 30.1 218 26.08 1 7 38.64 1 4 1 9 29.48 Retired 54 1.37 7 0.84 2 4.55 63 1 .31
Old/Child 514 13.07 1 2 0 14.35 6 13 .64 6 4 0 13.3 Others 7 9 2.01 58 6.94 0 0 137 2.85 Total 3 9 3 3 100 836 100 4 4 100 4813 100
Source: Based on the Primary data.
The figure related to status of work shows that around 27-29 percent persons in
the total population are employed and not much difference could be observed between
Hindus and Muslims. However among the Sikhs it is slightly less i.e. about 25 percent
are employed and more are in the category of students. In household of Sikh
community domestic work category have large number of people more than the
Hindus and Muslims (see Table 9).
Table 1 1: Occupational Classification of Working Family Members
Data Hindu % Muslim % Sikh % Grand Total %
Self-Employed 3 3 4 8 .49 7 4 8.85 1 0 2 2 . 7 3 4 1 8 8.68 Govt. Service 50 1 .27 1 0.12 0 0 51 1.06 Regular Salaried 83 2 .11 1 5 1 . 7 9 0 0 9 8 2.04 Non-Agriculture 4 4 0 11 .19 101 12.08 0 0 541 1 1 . 2 4 Agricultural Labour 1 9 0 4.83 22 2.63 0 0 2 1 2 4.4 Unemployed 97 2 . 4 7 20 2.39 1 2 . 2 7 1 1 8 2 . 4 5 Household work 857 2 1 . 7 9 1 8 6 2 2 . 2 5 7 15.91 1050 21.82 Household work other income activities 51 1.3 14 1.67 1 2 . 2 7 6 6 1.37 Students 1 1 8 4 30.1 21 8 26.08 1 7 38.64 1419 29.48 Retired/pensioner 54 1 .37 7 0.84 2 4.55 6 3 1 .31 Old age 514 13 .07 1 2 0 1 4 . 3 5 6 13.64 640 13.3 Others 7 9 2.01 58 6.94 0 0 1 3 7 2.85 Total 3 9 3 3 100 8 3 6 100 4 4 100 4813 100 Source: Based on the Primary data.
If we analyse in detail the overall employment and occupation we find that
maximum proportion are in student category (29.48 percent) followed by household
workers (21.82 percent) and Non-agricultural employment with 11.24. People employed as
self employment category are much higher than the percent in regular salaried and

43
government services categories. Lucknow being the capital city of Uttar Pradesh has less
concentration of workers in the category of agricultural labourer i.e. 4.4 percent of the
total population (as shown in Table above).
However, if we look at the different religious groups separately wide variations
could be perceived. Hindus and Muslims do not show much variation in their
employment status but some 22 percent of Sikhs are self-employed. As observed we
can state that Muslim human resource is comparatively poor than Hindus as Muslims
are less employed as regular salaried and government servants’ categories. Sikhs are
found to be concentrating on education as highest proportions are found as students
(38.94 percent). Muslim students are the lowest 26.08 per cent when Hindu students
are 30.1 per cent. Similarly among Muslims too old and too young who are unable to
work are comparatively more than Hindus. The poor status of Muslims is the result of
overall poor socio-economic status of the community in comparison to Hindus (see
Table 12).
Table 12: Status of Employment by Industrial Categories of Working Family Members
Data Hindu % Muslim % Sikh % Total % Agriculture 535 44.88 65 24.34 8 50.oo 608 41.22 Livestock 52 4 . 3 6 6 2 .25 7 4 3 . 7 5 6 5 4.41 Fisheries 2 0.17 0 0 0 0 2 0.14 Forestry 1 0.08 1 0.37 0 0 2 0.14 Construction 113 9 .48 42 15 .73 0 0 155 10.51 Manufacturing 2 3 4 1 9 . 6 3 41 15.36 0 0 2 7 5 18.64 Trade 55 4 .61 33 12 .36 0 0 8 8 5.97 Transport 24 2 .0 1 6 2 .25 0 0 3 0 2.03 Finance & administrative 41 3 . 4 4 4 1.5 0 0 4 5 3.05 Education, health & other services 1 3 5 1 1 . 3 3 69 25.84 1 6 . 2 5 205 13.9 Total 1 1 9 2 100 267 100 16 100 1 4 7 5 100 Source: Based on the Primary data.
To pinpoint on the overall status of employment by industrial categories of
working family members we can state that the maximum employment is provided to
family members is by agriculture 41.22 per cent followed by manufacturing 18.64 per
cent, construction 10.51 per cent, trade 5.97 per cent and livestock 4.41 per cent. In
agriculture Muslims are less in proportion to Hindus, i.e. 24.34 per cent while Hindus
are 44.88 per cent and Sikh are 50.00 percent. Muslim are exceptionally high in
construction work with 15.73 per cent, Trade with 12.36 percent and in education
health and other services category with 25.84 percent. In manufacturing a good
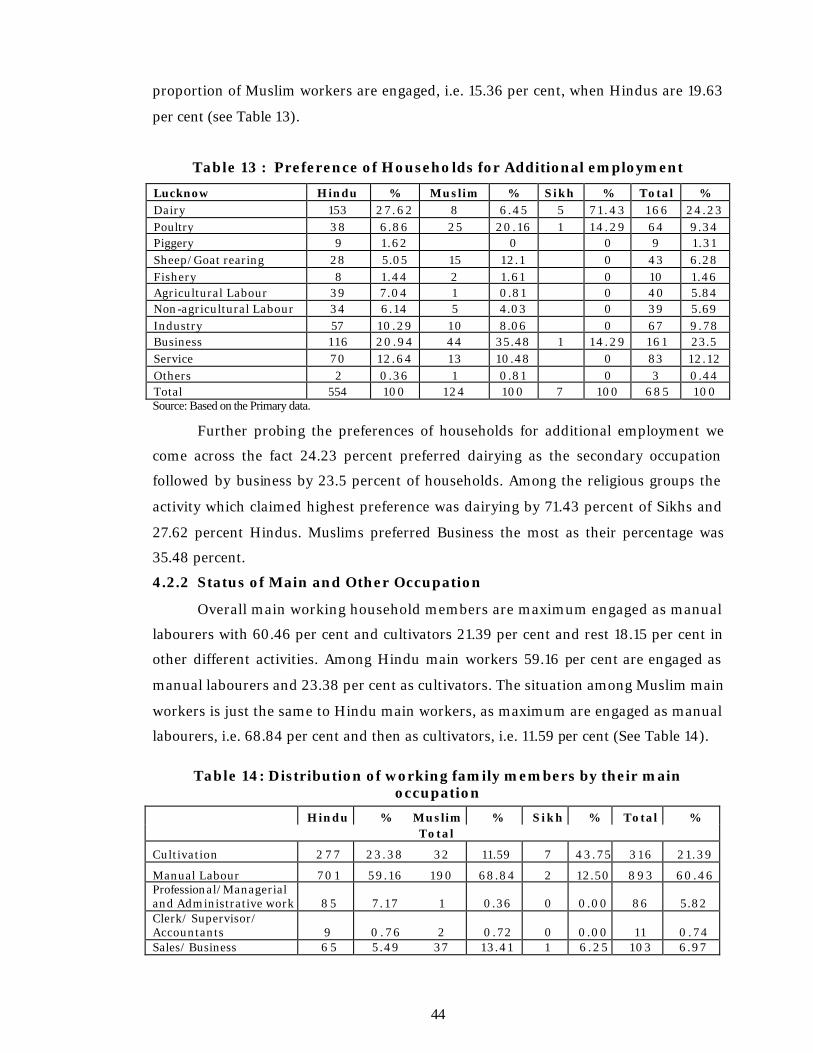
44
proportion of Muslim workers are engaged, i.e. 15.36 per cent, when Hindus are 19.63
per cent (see Table 13).
Table 13 : Preference of Households for Additional employment Lucknow Hindu % Muslim % Sikh % Total % Dairy 153 2 7 . 6 2 8 6 .45 5 7 1 . 4 3 1 6 6 24.23 Poultry 3 8 6.86 25 20.16 1 1 4 . 2 9 64 9.34 Piggery 9 1.62 0 0 9 1.31 Sheep/Goat rearing 28 5.05 15 12.1 0 43 6.28 Fishery 8 1.44 2 1.61 0 10 1.46 Agricultural Labour 39 7.04 1 0.81 0 40 5.84 Non-agricultural Labour 34 6.14 5 4.03 0 39 5.69 Industry 57 10.29 1 0 8.06 0 67 9 .78 Business 116 20.94 44 35.48 1 1 4 . 2 9 1 6 1 23.5 Service 7 0 12.64 1 3 10.48 0 83 12.12 Others 2 0.36 1 0.81 0 3 0.44 Total 554 100 124 100 7 100 685 100 Source: Based on the Primary data.
Further probing the preferences of households for additional employment we
come across the fact 24.23 percent preferred dairying as the secondary occupation
followed by business by 23.5 percent of households. Among the religious groups the
activity which claimed highest preference was dairying by 71.43 percent of Sikhs and
27.62 percent Hindus. Muslims preferred Business the most as their percentage was
35.48 percent.
4.2.2 Status of Main and Other Occupation
Overall main working household members are maximum engaged as manual
labourers with 60.46 per cent and cultivators 21.39 per cent and rest 18.15 per cent in
other different activities. Among Hindu main workers 59.16 per cent are engaged as
manual labourers and 23.38 per cent as cultivators. The situation among Muslim main
workers is just the same to Hindu main workers, as maximum are engaged as manual
labourers, i.e. 68.84 per cent and then as cultivators, i.e. 11.59 per cent (See Table 14).
Table 14: Distribution of working family members by their main occupation
Hindu % Muslim % Sikh % Total % Total
Cultivation 2 7 7 23 .38 32 11.59 7 4 3 . 7 5 3 1 6 21 .39
Manual Labour 7 0 1 59.16 190 68.84 2 12.50 8 9 3 60.46 Professional/Managerial and Administrative work 8 5 7 . 1 7 1 0.36 0 0.00 86 5.82 Clerk/ Supervisor/ Accountants 9 0 . 7 6 2 0.72 0 0.00 11 0 . 7 4 Sales/ Business 6 5 5.49 37 13.41 1 6 . 2 5 103 6.97

45
Caste Occupation 5 0 .42 0 0.00 0 0.00 5 0.34 Animal Husbandry 4 2 3.54 11 3.99 6 37.50 59 3.99 Others 1 0.08 3 1.09 0 0.00 4 0.27 Grand Total 1185 100.00 276 100.00 16 100.00 1477 100.00
Males
Cultivation 259 24.60 29 12.13 7 50.00 2 9 5 22.59
Manual Labour 6 3 2 60.02 1 6 5 69.04 2 1 4 . 2 9 7 9 9 61.18 Professional/Managerial and Administrative work 7 4 7 .03 1 0.42 0 0.00 7 5 5 .74 Clerk/ Supervisor/ Accountants 7 0 .66 1 0.42 0 0.00 8 0.61 Sales/ Business 57 5.41 35 14.64 0 0.00 92 7.04 Caste Occupation 4 0 . 3 8 0 0.00 0 0.00 4 0.31 Animal Husbandry 1 9 1.80 5 2.09 5 3 5 . 7 1 29 2.22 Others 1 0.09 3 1.26 0 0.00 4 0.31 Grand Total 1053 100 239 100 14 100 1306 100.00
Females
Cultivation 1 8 1 3 . 6 4 3 8.11 0 0.00 21 12.28
Manual Labour 6 9 52.27 25 67.57 0 0.00 94 54.97 Professional/Managerial and Administrative work 1 1 8 . 3 3 0 0.00 0 0.00 11 6.43 Clerk/ Supervisor/ Accountants 2 1.52 1 2 .70 0 0.00 3 1 . 7 5
Sales/ Business 8 6.06 2 5.41 1 50.00 11 6.43
Caste Occupation 1 0 . 7 6 0 0.00 0 0.00 1 0.58 Animal Husbandry 2 3 1 7 . 4 2 6 16.22 1 50.00 30 17.54 Others 0 0.00 0 0.00 0 0.00 0 0.00 Grand Total 132 100 37 100 2 100 171 100.00 Source: Based on the Primary data.
4.2.3 Land Holdings
If we look at the distribution of households according to the size of land
holdings the most fortunate are the Sikhs with an average land holding size of around
11.71 acres. As compared to the Sikhs fortunes Hindus were the disadvantaged lots and
survive with only 0.79 acres and Muslims are the lowest occupiers of 0.47 acres in the
selected villages. None of the Sikhs reported being landless whereas lots of Hindus and
Muslims being the one. Among Muslims 57.14 per cent households were landless while
only 39.68 percent of Hindus were landless. In 1.0 to 2.50 acres category 23.06 per
cent Hindu households fall whereas Muslims are only 10.2 per cent. In 2.5 – 5.0 acres
category 5.09 per cent Hindu households are reported but Muslims households are
only 2.04 per cent. Land distribution is quite bias as average per household
agricultural land among Sikhs is 11.71 acres, Hindus 0.79 acres and Muslims 0.47
acres (see Table 15).

46
Table 15:Distribution of households by size category of Land holdings (owned land) (In Acres)
Size of Holding Hindu % Muslim % Sikh % Grand Total % Below 1 2 2 6 30.29 4 4 29.93 0 0.00 2 7 0 30.00 Landless 296 39.68 8 4 57.14 0 0.00 3 8 0 4 2 . 2 2 1.00 -2.50 1 7 2 23.06 1 5 10.20 0 0.00 187 2 0 . 7 8 2.50 -5.00 3 8 5.09 3 2.04 3 42.86 44 4 .89 5.00-7.50 10 1 .34 1 0.68 0 0.00 1 1 1 .22 7.50 -10.00 3 0 .40 0 0.00 1 14.29 4 0.44 10.00 & above 1 0.13 0 0.00 3 42.86 4 0.44 Grand Total 7 4 6 100.00 147 100.00 7 100.00 900 100.00 Average land per HHs.(acres) 0 . 7 9 0.47 1 1 . 7 1 0.82 Source: Based on the Primary data.
Table-16: Characteristics of Land Owned by Different Religious Groups
Hindu Muslim Sikh Grand Total land owned 587.15 69.12 82.00 734.47
irrigated land in land owned 546.68 6 3 . 7 2 82.00 699.40 cultivated land in owned land 520.70 56.96 82.00 661.26
own cultivated land (irrigated) 508.03 51.86 82.00 643.49 household leased in land 46.88 8.80 0 55.68
household leased in land (irrigated) 44.83 8.80 0 53.63 household leased out land 30.38 0.93 0 3 1 . 3 1
household leased out land (irrigated) 29.43 0.93 0 30.36 Source: Based on the Primary data.
The following table 16 shows the distribution of households by value of own
land. Since it is the Sikh community who own bigger land-holdings it is quiet obvious
that the average value of their land falls in the highest value category too.
Table 17:Distribution of Household by value of own land
Land Value(000) Hindu % Muslim % Sikh % Grand Total % Below 50 99 13.27 1 3 8.84 0 0 112 12.44 50 -100 49 6.57 1 3 8.84 0 0 6 2 6.89 100-150 113 15.15 1 6 10.88 0 0 129 14.33 150-200 66 8.85 8 5.44 0 0 7 4 8.22 200-250 40 5.36 1 0.68 0 0 41 4.56 250-300 23 3.08 3 2.04 0 0 2 6 2.89 300-5000 55 7.37 1 0 6.8 7 100 7 2 8 5000 & above 3 0 1 40.35 8 3 56.46 0 0 384 42.67 Total 7 4 6 100 1 4 7 100 7 100 900 100 Avg per HH Source: Based on the Primary data.
4.2.4 Ownership of Livestock
Overall surveyed households possess 1559 livestock in which young cattle are
477 i.e. 30.60 per cent followed by goats 30.02 percent, milch animals 25.08 percent,
draught animals 9.43, cock and hen 2.18, sheep 1.22 and others (horse, ass, etc.) only
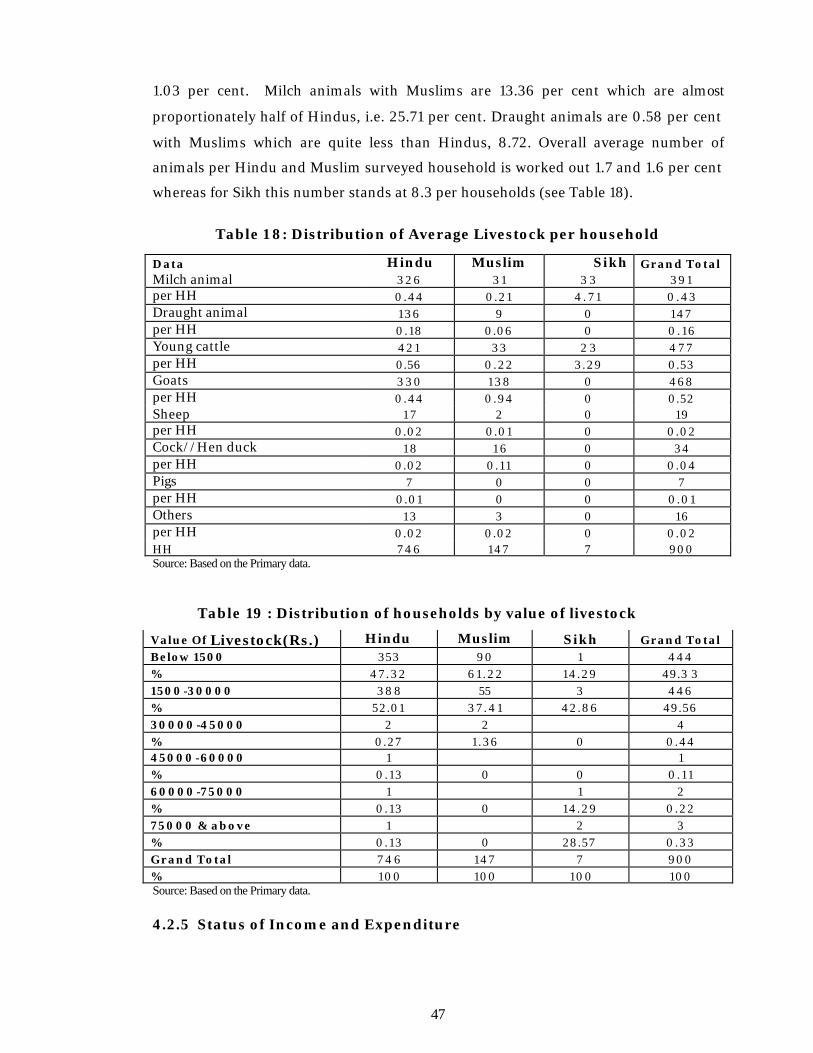
47
1.03 per cent. Milch animals with Muslims are 13.36 per cent which are almost
proportionately half of Hindus, i.e. 25.71 per cent. Draught animals are 0.58 per cent
with Muslims which are quite less than Hindus, 8.72. Overall average number of
animals per Hindu and Muslim surveyed household is worked out 1.7 and 1.6 per cent
whereas for Sikh this number stands at 8.3 per households (see Table 18).
Table 1 8: Distribution of Average Livestock per household
Data Hindu Muslim Sikh Grand Total Milch animal 3 2 6 3 1 3 3 391 per HH 0.44 0.21 4 . 7 1 0 .43 Draught animal 136 9 0 147 per HH 0.18 0.06 0 0.16 Young cattle 421 33 2 3 4 7 7 per HH 0.56 0.22 3.29 0.53 Goats 3 3 0 1 3 8 0 468 per HH 0.44 0.94 0 0.52 Sheep 1 7 2 0 19 per HH 0.02 0.01 0 0.02 Cock//Hen duck 1 8 1 6 0 34 per HH 0.02 0.11 0 0.04 Pigs 7 0 0 7 per HH 0.01 0 0 0.01 Others 1 3 3 0 16 per HH 0.02 0.02 0 0.02 HH 7 4 6 147 7 900 Source: Based on the Primary data.
Table 19 : Distribution of households by value of livestock
Value Of Livestock(Rs.) Hindu Muslim Sikh Grand Total Below 1500 353 90 1 444 % 47.32 61 .22 14.29 49.3 3 1500-30000 3 8 8 55 3 446 % 52.01 3 7 . 4 1 42.86 49.56 30000 -45000 2 2 4 % 0.27 1.36 0 0.44 45000 -60000 1 1 % 0.13 0 0 0.11 60000 -75000 1 1 2 % 0.13 0 14.29 0.22 75000 & above 1 2 3 % 0.13 0 28.57 0.33 Grand Total 7 4 6 147 7 900 % 100 100 100 100 Source: Based on the Primary data. 4.2.5 Status of Income and Expenditure

48
The most important source of income of the households is non-agricultural wages
thus pointing towards diversification that is taking place in the district of Lucknow.
Second main source of income the rural areas of Lucknow is obviously agriculture sector
followed by services and agricultural wages. What is interesting to find is that non-
agricultural sector if the basic source of income for the rural residents of Lucknow thus
showing a drift away from agriculture though it still is the secondary important source for
Hindus as well as Muslims. Sikhs have shown their source of livelihood to be from
agriculture with 61.64 percent having their earning from it and another 17.67 percent from
animal husbandry.
Table 20: Classification of Households by Sources of Income
Sources of Income Hindu Muslim Sikh Grand Total Agriculture 4173855 6 3 1 4 4 0 572000 5 3 7 7 2 9 5 % 22.3 16.33 6 1 . 6 4 22.87 Animal Husbandry 9 7 3 3 7 6 60000 164000 1 1 9 7 3 7 6 % 5.2 1.55 1 7 . 6 7 5.09 Artisan Work 39000 486900 0 525900 % 0.21 12.59 0 2 . 2 4 Trade 1171800 2 4 7 1 0 0 0 1418900 % 6.26 6.39 0 6.04 Manufacturing 0 0 0 0 % 0 0 0 0 Agricultural Wages 2142260 2 6 6 7 0 0 2 4 0 8 9 6 0 % 11.45 6.9 0 10.25 Non-agricultural Wages 5 2 7 4 200 1 3 8 2 4 6 0 6 6 5 6 6 6 0 % 28.18 35.76 0 28.31 Services 3674400 121000 3795400 % 19.63 3.13 0 16.14 Interest 13000 30000 43000 % 0.07 0.78 0 0.18 Remittances 106900 40000 146900 % 0.57 1.03 0 0.62 Pension 426050 93300 132000 651350 % 2.28 2.41 1 4 . 2 2 2 . 7 7 Others 721450 507050 60000 1288500 % 3.85 13.12 6 .47 5.48 Total 18716291 3865950 928000 23510241 % 100 100 100 100 Source: Based on the Primary data.
In trade also Muslim households are 6.39 per cent which are similar to Hindus,
i.e. 6.26 per cent. Muslim households receiving income from remittances were 1.03
per cent when Hindus were only 0.57 per cent. Proportion of Muslim households
receiving income from services is quite low and also low in comparison to proportion
of Hindu households (see Table above).

49
Total average annual income per household from various sources is Rs.26122. The
community -wise average is, among Hindus Rs. 25089, Muslims Rs. 26299 and maximum
in Sikh households Rs. 132571. Sikhs maintain their high economic status comparatively
with an average income much above rest of the communities (see Table 21).
Table 21: Average household income from various sources
Average Income Hindu Muslim Sikh Grand Total Agriculture 5595 4296 81714 5975 Animal Husbandry 1305 408 23429 1330 Artisan Work 52 3312 0 584 Trade 1571 1681 0 1577 Manufacturing 0 0 0 0 Ag Wages 2872 1814 0 2677 Non Ag Wages 7070 9404 0 7396 Services 4925 1027 0 4250 Interest 0 0 0 0 Remittances 161 272 0 178 Pension 571 635 18857 724 Others 967 3449 8571 1432 Total 25089 26299 132571 26122 Source: Based on the Primary data.
More than 90.0 per cent sample households were coming under less than
Rs.50,000 annual income both among Hindus and Muslims. In higher average income
slab of Rs.50000-100000 46 Hindu, 10 Muslim and 1 Sikh household was recorded.
Table 22: Distribution Households by size of family income (yearly)
Income(000) Hindu Muslim Sikh Grand Total Below 15 312 4 4 1 357 % 41.82 29.93 14.29 39.67 15 -25 244 53 0 297 % 32.71 36.05 0 33 25-50 125 37 1 163 % 16.76 25.17 14.29 18.11 50-100 4 6 10 1 5 7 % 6.17 6.8 14.29 6.33 100-150 9 1 0 10 % 1.21 0.68 0 1.11 150-250 6 2 3 11 % 0.8 1.36 42.86 1.22 250-400 3 1 4 % 0.4 0 14.29 0.44 400 & above 1 0 1 % 0.13 0 0 0.11 Grand Total 746 147 7 900 % 100 100 100 100 Source: Based on the Primary data.

50
Now focusing our attention to expenditure pattern of the selected households is
very pertinently correlated to their level of income. Consequently the average annual
expenditure per household is around Rs. 38198. Average per household annual
expenditure is worked out to be Rs.38198, which among Hindu, Muslim and Sikh
households, it was Rs.34068, Rs.45556 and Rs.109126 respectively. Expenses in Sikh
household were more than double of other communities. Maximum expenditure was
on cereal and pulses followed by vegetable, meat, milk, spices, sugar, etc., however, on
these items Hindu household expenses were comparatively less than other
communities. Sikh households were comparatively spending more on education while
Hindu were spending more on medical. Payment of Loans and interest was done more
by Muslims households and hence show that they are the most indebted ones
compared to other communities (see Table 23).
Table 23: Average Household Expenditure on different heads
Expenditure Heads Hindu Muslim Sikh Total
Cereal And Pulse (Total) 8383.86 1 0 1 2 7 . 9 9 16476.19 8744.24 % 24.61 22.23 15.1 22.89
Purchased 4357.40 5741.66 6133.33 4592.02 Own Produce 4026.46 4 3 8 6 . 3 2 10342.86 4152.21
Vegetable, Meal, Milk, Spices, Sugar etc (Total) 5410.64 5861.44 14502.38 5645.16 % 15.88 12.87 13.29 14.78 Purchased 3259.06 3265.98 6085.71 3282.17 Own Produce 2151.58 2595.45 8416.66 2362.99 Cloths Footwear Beddings 1165.08 1291 .25 4500 .0 1211.68 % 3.42 2.83 4.12 3.17 Education 1624.51 1107.19 9233.33 1623.87 % 4.77 2.43 8.46 4.25 Medical 2744.83 3153.41 7457.14 2848.36 % 8.06 6.92 6.83 7.46 Ceremonies 1067.33 1282.27 4000 .0 1125.60 % 3.13 2.81 3.67 2.95 Fuel 1261.69 1607.91 7566.66 1404.97 % 3.7 3.53 6.93 3.68 Telephone 1090.96 952 .00 200.00 1061.87 % 3.2 2.09 0.18 2.78 House 3185.11 3 9 7 9 . 7 3 10000.00 3401.97 % 9.35 8.74 9.16 8.91 Payment of loans and interest 3 8 4 2.00 11494.12 24500.00 6640.92 % 11.28 25.23 22.45 17.39 House repairing / construction 946.64 1073.02 1550 970.68 % 2.78 2.36 1.42 2.54 Recreation 422.26 365.81 1 6 6 0.00 433.26 % 1.24 0.8 1.52 1.13 Marriage and other ceremonies 1794.56 2517.12 3814.28 1936.57 % 5.27 5.53 3.5 5.07

51
Others 1128.93 743.52 3666.66 1149.13 % 3.31 1.63 3.36 3.01 Total 34068.45 45556.82 109126.7 38198.33 % 100 100 100 100 Source: Based on the Primary data.
Overall 77.00 per cent household fall in less than Rs.25,000 annual expenditure
slab. In higher expenditure slabs Muslim households are almost nil whereas Sikhs are
absent in the lower expenditure slabs (see Table 24).
Table 24: Distribution of households by size of Expenditure (Annual)
Expen (000) Hindu Muslim Sikh Grand Total Below 15 3 3 2 4 2 0 3 7 4 % 44.5 28.57 0 41.56 15 -25 258 6 1 0 3 1 9 % 34.58 41.5 0 35.44 25-5 0 115 3 9 2 156 % 15.42 26.53 28.57 17 .33 50 -100 35 4 3 42 % 4 . 6 9 2 . 7 2 42.86 4 .67 100-150 6 0 1 7 % 0.8 0 14.29 0 . 7 8 150-250 0 1 1 2 % 0 0.68 14.29 0.22 250-400 0 0 0 0 % 0 0 0 0 400 & above 0 0 0 0 % 0 0 0 0 Grand Total 7 4 6 1 4 7 7 900 % 100 100 100 100 Source: Based on the Primary data.
4.2.6 (a) Status of Household Assets
The level of poverty among communities who were surveyed is well depicted in the
Table 25 below. Wide variations could be captured in ownership of assets. What is
surprising is that quiet a large proportion of Hindus as well as Muslims are placed in the
below 25ooo category slabs whereas Sikhs (85.17 percent) are placed in 100000 and above
category thus showing there better economic status as compared to their counterparts.
Table 25: Distribution of household by Value of Productive and
other Assets
Value Of Asset (Rs.000) Hindu Muslim Sikh Grand Total Below 25 659 136 1 7 9 6 % 8 8 . 3 4 92.52 14.29 88.44 25-5 0 37 7 0 44 % 4 . 9 6 4 . 7 6 0 4 .89

52
50 -7 5 20 1 0 21 % 2.68 0.68 0 2 . 3 3 75-100 9 2 0 11 % 1 .21 1 .36 0 1.22 100 & above 21 1 6 28 % 2.82 0.68 85.71 3 .11 Grand Total 7 4 6 147 7 900 % 100 100 100 100 Source: Based on the Primary data.
Agricultural equipments are available with 73.59 per cent Hindu households, when
the same is possessed by 36.05 per cent Muslim households, which are just half of Hindu
households. Good proportion of Hindu households possess fodder cutter, plough and
pumpsets. Proportion of Muslim households possessing fodder cutter and plough are 10.8
and 6.12 per cent respectively. Tractors are possessed by 71.43 percent of Sikh households
and only 1.2 percent of Hindu Households. In agriculture most important implements are
tractor and pumpsets which are least with Muslim households.
Table 26: Distribution of Households by Ownership of Agricultural Implements
Assets Hindu Muslim Sikh Total Plough 5 0 5 5 5 % 6 .7 3.4 0 6 . 1 1 Cart 10 2 0 12 % 1 . 3 4 1 . 3 6 0 1 . 3 3 Tractor 9 0 5 1 4 % 1 . 2 1 0 7 1 . 4 3 1 . 5 6 Tiller 0 0 0 0 % 0 0 0 0 Thresher 2 0 0 2 % 0 . 2 7 0 0 0 . 2 2 P u m p 4 9 9 1 5 9 % 6 . 5 7 6 . 1 2 1 4 . 2 9 6 . 5 6 Sprayer 2 0 0 2 % 0 . 2 7 0 0 0 . 2 2 Cutter 2 1 7 1 6 6 2 3 9 % 2 9 . 0 9 1 0 . 8 8 8 5 . 7 1 2 6 . 5 6 Other 2 1 0 2 1 4 2 3 5 % 2 8 . 1 5 1 4 . 2 9 5 7 . 1 4 2 6 . 1 1 Total 5 4 9 5 3 1 6 6 1 8 % 7 3 . 5 9 3 6 . 0 5 2 2 8 . 5 7 6 8 . 6 7 Source: Based on the Primary data.
Table 27: Distribution of Households by Ownership of Non-Agricultural Implements
Assets Hindu Muslim Sikh Total Flour Rice Mill % 0 0 0 0 Oil Crusher 0 0 0 0 % 0 0 0 0 Cane Crusher 0 0 0 0 % 0 0 0 0

53
Handloom 0 1 0 1 % 0 0 . 6 8 0 0 .1 1 Powerloom 0 0 0 0 % 0 0 0 0 Welding 0 0 0 0 % 0 0 0 0 EleRepaire 0 0 0 0 % 0 0 0 0 Motor Repair 0 0 0 0 % 0 0 0 0 Sewing 17 1 5 0 3 2 % 2 . 2 8 10.2 0 3 . 5 6 NonAgOthers 3 9 5 0 4 4 % 5 . 2 3 3.4 0 4 . 8 9 Total 5 6 2 1 0 7 7 % 7 . 5 1 1 4 . 2 9 0 8 . 5 6 Source: Based on the Primary data.
With certain variation, both Hindu Muslim and Sikh households are in possession of
cycle i.e. 78.69, 70.75 and 85.71 per cent respectively. Income generating non-agricultural
equipments is maximum with Muslim households (14.29 percent) and that too 10 percent are
having sewing machines depicting that they are tailors. Saving bank/post office account is with
85.7 per cent Sikhs, 57.91 percent Hindus while only 47.52 per cent Muslim households have
it. About 51 per cent Hindu households have fixed deposit when only 37 per cent Muslim
households have it (see Table 30).
Table 28: Distribution of Households by Ownership of Means of Transport Assets Hindu Muslim Sikh Total
Jeep 1 2 3 % 0 . 1 3 0 2 8 . 5 7 0 . 3 3 Truck 0 0 0 0 % 0 0 0 0 Bu s 0 0 0 0 % 0 0 0 0 Car 5 1 0 6 % 0 . 6 7 0 . 6 8 0 0 . 6 7 Mcycle 4 4 7 5 5 6 % 5.9 4 . 7 6 7 1 . 4 3 6 . 2 2 Scooter 3 1 0 4 % 0.4 0 . 6 8 0 0 . 4 4 Cycle 5 8 7 1 0 4 6 6 9 8 % 7 8 . 6 9 7 0 . 7 5 8 5 . 7 1 7 7 . 5 6 Total 6 4 0 1 1 3 1 3 7 6 7 % 8 5 . 7 9 7 6 . 8 7 1 8 5 . 7 1 8 5 . 2 2 Source: Based on the Prim ary data.
Different transport vehicles are available with 85.7 per cent Hindu households, while
76.87 per cent Muslim households. Modern household assets are available with 27.35 per cent
Hindu households while it is only 19.7 per cent with Muslim households. Financial assets are
available with 85.8 per cent Sikh households 59.9 per cent Hindus and 47 percent Muslim
households.
Table 29: Distribution of Households by Ownership of Modern Household Assets
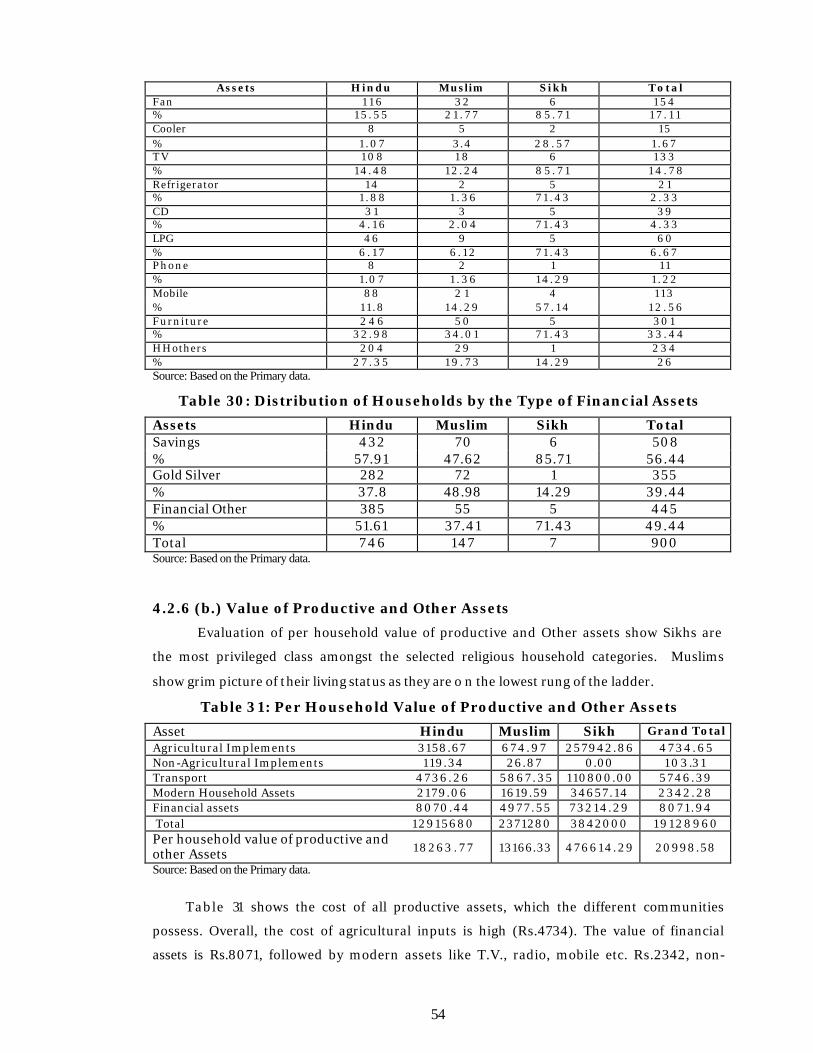
54
Assets Hindu Muslim Sikh Total Fan 1 1 6 3 2 6 1 5 4 % 1 5 . 5 5 2 1 . 7 7 8 5 . 7 1 1 7 . 1 1 Cooler 8 5 2 15 % 1 . 0 7 3.4 2 8 . 5 7 1 . 6 7 TV 1 0 8 1 8 6 1 3 3 % 1 4 . 4 8 1 2 . 2 4 8 5 . 7 1 1 4 . 7 8 Refrigerator 1 4 2 5 2 1 % 1 . 8 8 1 . 3 6 7 1 . 4 3 2 . 3 3 CD 3 1 3 5 3 9 % 4 . 1 6 2 . 0 4 7 1 . 4 3 4 . 3 3 LPG 4 6 9 5 6 0 % 6 . 1 7 6 . 1 2 7 1 . 4 3 6 . 6 7 Phone 8 2 1 11 % 1.0 7 1 . 3 6 1 4 . 2 9 1 . 2 2 Mobile 88 2 1 4 1 1 3 % 1 1 . 8 1 4 . 2 9 5 7 . 1 4 1 2 . 5 6 Furniture 2 4 6 5 0 5 3 0 1 % 3 2 . 9 8 3 4 . 0 1 7 1 . 4 3 3 3 . 4 4 HHothers 2 0 4 2 9 1 2 3 4 % 2 7 . 3 5 1 9 . 7 3 1 4 . 2 9 2 6 Source: Based on the Primary data.
Table 30: Distribution of Households by the Type of Financial Assets
Assets Hindu Muslim Sikh Total Savings 432 70 6 508 % 57.91 47.62 85.71 56.44 Gold Silver 282 72 1 355 % 37.8 48.98 14.29 39.44 Financial Other 385 55 5 445 % 51.61 37.41 71.43 49.44 Total 746 147 7 900 Source: Based on the Primary data.
4.2.6 (b.) Value of Productive and Other Assets
Evaluation of per household value of productive and Other assets show Sikhs are
the most privileged class amongst the selected religious household categories. Muslims
show grim picture of their living status as they are o n the lowest rung of the ladder.
Table 31: Per Household Value of Productive and Other Assets
Asset Hindu Muslim Sikh Grand Total Agricultural Implements 3158.67 6 7 4 . 9 7 257942.86 4 7 3 4 . 6 5 Non-Agricultural Implements 119.34 26.87 0.00 1 0 3 .3 1 Transport 4 7 3 6 . 2 6 5 8 6 7 . 3 5 110800.00 5746.39 Modern Household Assets 2179.06 1619.59 34657.14 2 3 4 2 . 2 8 Financial assets 8070.44 4977.55 73214.29 8071 .94 Total 12915680 2371280 3842000 1 9 1 2 8 9 6 0 Per household value of productive and other Assets 18263 . 7 7 13166.33 476614.29 20998.58
Source: Based on the Primary data.
Table 31 shows the cost of all productive assets, which the different communities
possess. Overall, the cost of agricultural inputs is high (Rs.4734). The value of financial
assets is Rs.8071, followed by modern assets like T.V., radio, mobile etc. Rs.2342, non-

55
agricultural implements Rs.103 and transport Rs.5746. Relatively, Sikhs have maximum
assets than that of other religious groups in all categories.
In value terms per Hindu household value of asset comes Rs.18263.77 and for
Muslims it is only Rs.13166.33. It means that average per household Muslims have only
61.67 per cent in terms of value of assets what average Hindu household posses. Per
Hindu household average agricultural equipment value is Rs.3158.67 and for Muslim
household it comes only Rs.674.97, which is only 21.4 per cent of Hindu’s assets. Value of
non-agricultural equipment per Hindu household is Rs.119.34 when it is only Rs.26.87 for
average Muslim household or only 22.51 per cent of Hindu’s average assets in terms of
value. Average value of modern asset per Hindu and Muslim household is worked out
Rs.2179.06 and Rs.1619.59 respectively. Average financial asset per Hindu household is
Rs.8070 and Muslim household is only Rs.4977 or 74.3 per cent of Hindus asset. It shows
that Muslims are The deprived lot in rural Lucknow though the condition of Hindus is also
not very good.
4.2.8 Status of Loan Taken by Households
As shown in table 32, out of total households, only 23.44 per cent have taken loan
from different sources for various purposes. The maximum 14.44 per cent households
have borrowed less than Rs.15000 for accomplishment of their needs. Among Hindus and
Muslims, the number of indebted households is higher in Muslims (32.65 per cent) as
compared to Hindus (21.58 per cent). About 21.58 and 32.65 per cent households among
Hindus and Muslims respectively had taken loan for various purposes. The maximum
14.44 per cent households have borrowed less than Rs.15000 for ac complishment of their
needs, 5.78 percent between Rs. 15 -30000. In the higher most category i.e. borrowing slab
of Rs.90000 and above, 28.57 percent of Sikhs have borrowed loans whereas only 0.67
percent and 0.68 percent of Hindus and Muslims have reported to be indebted.
Table 32: Distribution of HH by outstanding Amount of loan
Amount of loan outstanding(000) Hindus Muslim Sikh Grand Total Not Indebted 585 9 9 5 689 % 7 8 . 4 2 6 7 . 3 5 71 .43 76.56 Below 15 104 2 6 0 1 3 0 % 13 .94 17.69 0 1 4 . 4 4 1 5-3 0 3 8 1 4 0 52 % 5.09 9.52 0 5 . 7 8 3 0-45 9 4 0 13 % 1 .21 2 . 7 2 0 1 .44 4 5-6 0 2 2 0 4 % 0.27 1.36 0 0.44 6 0-7 5 2 1 0 3 % 0.27 0.68 0 0 .33

56
7 5-9 0 1 0 0 1 % 0.13 0 0 0.11 90 & above 5 1 2 8 % 0.67 0.68 28.57 0.89 Grand Total 7 4 6 1 4 7 7 900 % 100 100 100 100
Source: Based on the Primary data.
4.2.7 Status of Migration
Table 33 presents characteristics of migration of family members in surveyed
households in the district Lucknow. Out of total population of 900 households, 111 or
12.33 per cent people are reported to have migrated, in which the percentage of Hindu
migrants is higher (78 or 11.39 per cent) than that of Muslims (25 or 17.68 per cent).
Maximum migrants are of 20 - 40 years of age group, in which the proportion of Hindus is
higher (57 or 87.69 per cent) as compared to Muslims (15 or 23.0 per cent).
For livelihood 85 or 11.39 Hindus and 26 or 17.68 per cent Muslims have migrated out
of their villages. None of the Sikhs have migrated out from their family in our surveyed
villages. Seven females from Hindus and 1 Female from Muslim community has migrated out.
Maximum Hindu and Muslim households have migrated for manual labour work, they are 60
and 18 in number respectively. From Hindus 6 and 11 persons have migrated for
sales/business work and professional, managerial and administrative work respectively. While
from Muslims 3 workers have migrated for caste occupation (see Table 32).
Most of the Hindus and Muslims migrated either within the district in rural or urban
areas. Few Hindus and Muslims have also migrated within the state (urban) and outside state
(urban). It was found during the survey that there were many young aspirants who were eager
to migrate outside the villages for work to earn their livelihood and to upgrade their family’s
economic status. Among Muslims 52.0 per cent were daily commuters, 32.0 per cent were
long term migrants and 20.0 per cent were short-term migrants. Among Hindus the pattern
and trend of migration is a bit different from Muslim migrants (see Table 32).
Table 33: Migration characteristics of working family members Migrant Sex Hindus Muslim Sikh Grand Total Men 7 8 2 5 0 103 Women 7 1 0 8 Total Migrants 85 2 6 0 111 Age of Migrants below 20 22 8 0 30 20-4 0 57 1 5 0 65 40-6 0 11 2 0 13 60 & above 2 1 0 3 Grand Total 85 2 6 0 111 Migrants Occupation Professional/Managerial and Administrative work 11 0 0 1 1 Clerk/ Supervisor/ Accountants (Total) 4 0 0 4 Sales/ Business (Total) 6 5 0 1 1

57
Manual Labour 60 1 8 0 7 8 Cast Occupation (Total) 3 3 0 6 Cultivate 0 0 0 0 Grand Total 85 2 6 0 111 Place of Migration Within District (Rural) 10 7 0 17 Within District (Urban) 53 7 0 60 Within State (Rural) 2 0 0 2 Within State (Urban) 6 0 0 6 Outside State (Rural) 1 4 0 5 Outside State (Urban) 13 0 0 13 Outside Country 8 0 8 Grand Total 85 2 6 0 111 Duration of Migration Grand Total Short Term 40 5 0 45 Long Term 19 8 0 27 Daily Commuters 26 1 3 0 39 Grand Total 85 2 6 0 111 Source: Based on the Primary data.
4.2.9 Status of Training for Employment
Overall 60.56 per cent households were interested in getting training for better
employment and for self-employment and searching better job opportunities within
the district or outside 5.67 per cent households showed no interest in getting the
training. Among Hindus 61.39 per cent households wanted the training and 33.38 per
cent households didn’t want any training. Among Muslims it was only 55.78 per cent
households desired some training and 36.05 per cent showed their unwillingness to
accept any training. There is 5 household of Sikh community i.e. 71.43 percent which
desired to get training (see Table 34).
Table 34: Interest in training of families
Religion Yes % No % Not Interested
% Total %
Hindu 458 61.39 249 33.38 39 5.23 746 100.00 Muslim 82 55.78 53 36.05 12 8.16 147 100.00 Sikh 5 71.43 2 28.57 0 0.00 7 100.00 Combined 545 60.56 304 33.78 5 1 5.67 900 100.00 Source: Based on the Primary data.
Among the households who wanted training over all 7.0 per cent wanted
computer training, and 47.44 per cent training in rural industries, which are
maximum. In agriculture cottage industry, hair cutting and carpentry least
households showed their interest in getting the training. Among Hindu and Muslim
communities almost equal proportion of households wanted training in animal
husbandry.

58
Table 35 : Details of Training Described by Households
Training Type Hindu % Muslim % Sikh % Total % Traditional Handicraft 1 0.13 1 0.68 0 0.00 2 0 .22 Driver 2 0.27 0 0.00 0 0.00 2 0 .22 Repairing work 2 5 3 . 3 5 7 4 . 7 6 0 0.00 3 2 3.56 Electrician 3 0 .40 1 0.68 0 0.00 4 0.44 Computer 56 7.51 5 3 . 4 0 2 28.57 6 3 7 .00 Education (B.Ed., B.Tc) 0 0.00 0 0.00 0 0.00 0 0.00 ITI/Polytechnic 1 0.13 1 0.68 0 0.00 2 0 .22 Animal Husbandry 4 0.54 3 2.04 0 0.00 7 0 . 7 8 Agriculture 1 0.13 0 0.00 0 0.00 1 0.11 Small Industry 1 0 1 .34 7 4 . 7 6 0 0.00 1 7 1.89 Rural Industries 3 6 4 4 8 . 7 9 60 40.82 3 42.86 4 2 7 4 7 . 4 4
No Response 2 7 9 3 7 . 4 0 62 4 2 . 1 8 2 28.57 3 4 3 38.11
Grand Total 7 4 6 100.00 1 4 7 100.00 7 100.00 900 100.00 Source: Based on the Primary data.
Regarding duration of training, 22.56 per cent households are willing to get
training upto 3 months, followed by 38.44 per cent upto 3 - 6 months and 3.56 per
cent upto 3 years. Hindu’s proportion is higher in upto 3 months and 1-3 years
duration of training than that of rest communities. Sikhs also showed their interest in
getting trained. Religion-wise details are shown in table 36.
Table 36 : Duration of training Described by Families
Training Duration
Hindu % Muslim % Sikh % Total %
3 Months 1 7 6 23.59 2 5 17.01 2 28.57 203 22.6
3 -6 Months 2 8 4 38.07 6 1 41.5 1 14.29 3 4 6 38.4
1-3 Years 27 3.62 3 2.04 2 28.57 32 3.56
No Response 259 3 4 . 7 2 58 39.46 2 28.57 3 1 9 35.4
Grand Total 7 4 6 100 1 4 7 100 7 100 900 100 Source: Based on the Primary data.
4.3 Status of Government Programmes
The levels of awareness of the surveyed households about the Government
Programmes and percentage of the households who have been benefited from these
programmes in total households have been worked out in Table 36.
4.3.1 Status of Public Distribution System
It is evident from the survey that 66.89 per cent of the total households are in
BPL category in rural areas of Lucknow district. The proportion of Hindu households
is higher (68.5 per cent) as compared to Muslim households (61.9 per cent) as shown
in Table 37. The data shows that in general, 37 per cent of total households have BPL

59
cards as against 41 per cent of Muslim households and 36 per cent of Hindu
households. Majority of the households (84 per cent) get the ration from PDS and the
Muslim households who obtain ration from PDS is 84 per cent versus 83 per cent of
Hindu households.
The quantity of items (wheat, rice, sugar, kerosene etc.) obtained from the PDS by
the sample households is inadequate. The non-availability of PDS items in time is the
main problem faced by the PDS beneficiaries. Less weight and insufficient quantity are
two other major problems. Lack of timely supply in PDS is the most important reason
for not getting the PDS items for all the households. While the lack of money is the
prime reason for the Muslims households of not taking PDS items, lack of timely
supply in PDS is the most important reason for not getting PDS items for the Hindu
households.
Table 37: Households reporting about Public Distribution System
Are you in BPL Category Hindu % Muslim % Sikh % Grand
Total %
Yes 511 68.50 9 1 61.90 0 0.00 602 66.89No 2 3 5 31.50 56 38.10 7 100.00 298 33.11 Grand Total 7 4 6 100.00 1 4 7 100.00 7 100.00 900 100.00Do you have BPL card Yes 2 7 4 3 6 . 7 3 6 1 41.50 0.00 3 3 5 37 .22No 4 7 2 63.27 8 6 58.50 7 100.00 565 6 2 . 7 8Grand Total 7 4 6 100.00 1 4 7 100.00 7 100.00 900 100.00Do you get ration from PDS Yes 626 83.91 1 2 4 84.35 6 8 5 . 7 1 756 84.00 N o 1 2 0 16.09 2 3 15.65 1 1 4 .2 9 144 16.00 Grand Total 7 4 6 100.00 1 4 7 100.00 7 100.00 900 100.0011.4 If yes, the mention quantity (Kgs.)
Avg/HHs Avg/HHs Avg/HHs Avg/HHs
Wheat 3 7 8 1 6.04 1087 8.77 0 0.00 4868 6 . 4 4 Rice 5110 8.16 1070 8.63 0 0.00 6180 8.17 Sugar 581.05 0.93 169.5 1 .37 0 0.00 750.55 0.99 Kerosene(lts.) 2 0 1 5 3 .22 384 3.10 118 19.67 2517 3 . 3 3 Others Problems Faced in PDS
Insufficient quantity 32 8.04 5 10.87 1 12.5 3 8 8.41 Bad quality 16 4.02 4 8.70 0 0 2 0 4 . 4 2 Less weight 91 22.86 7 15.22 1 12.5 9 9 21.90 Non-availability in time 255 64.07 2 8 60.87 5 62.5 288 6 3 . 7 2Others 4 1.01 2 4.35 1 12.5 7 1.55 Total 398 100.00 4 6 100.00 8 100 452 100.00Are you capable of getting your share of PDS? Yes 415 55.63 7 7 10.32 5 0.67 497 66.62No 2 82 37 .80 6 0 8.04 1 0.13 3 4 3 45.98 blank 49 6.57 1 0 1 .34 1 0.13 6 0 8.04 Total 7 4 6 100.00 1 4 7 19 .71 7 0 .94 900 120.64 If no, then reasons: 1. Lack of money 20 2 0 10.26 4 16.67 0 0.00 24 2.Lack of supply in PDS 20 2 0 10.26 1 4.17 0 0.00 21 3. Discrimination by 23 2 3 11 .79 8 3 3 . 3 3 0 0.00 3 1

60
PDS trader 4. Others 132 132 67.69 1 1 45.83 3 100.00 1 4 6 Total 1 9 5 1 9 5 100.00 2 4 100.00 3 100.00 2 2 2 Note: Figures in brackets indicate percentages. Source: Primary data based.
Households reported that they get average around 6 kg wheat, 8 kg rice, less than 1
kg sugar and 3 litres of kerosene per month. Among Hindu and Muslim communities the
quantity of ration is about the same. Overall 84 per cent sample households reported that
they are able to get their share of ration from PDS, however 16 per cent households were
not able to receive it. Those households who were not able to receive their share of ration
from PDS reported various problems like 10.81 per cent due to lack of money, 9.46 per
cent due to lack of supply of PDS, 13.96 per cent due to discrimination by PDS trader and
65.77 per cent due to many other reasons. Among Hindu and Muslim households more or
less the same situation was found.
4.3.2 Status and Awareness of SGSY
Overall less than half(44.56 percent) of the total 900 sample surveyed
households reported that they are aware about the SGSY government programmes,
except Muslim households were slightly lacking behind as 10.67 per cent reported to
be aware. In SGSY overall 5 households were benefited which are only 1.25 per cent of
the total aware households. Households belonging to Hindu and Muslim communities
were almost proportionately benefited with 4 and 1 household respectively. Most of
the selections for Hindu households were made by NGO/SHGs, Sarpanch and
Secretary while Muslim households were mostly selected by Sarpanch. Out of 26
Hindu households beneficiaries, 3 reported that they paid the commission. All the
beneficiary households reported that their families are benefited by the programme.
Table 38: Awareness about Government Programmes (%)
SGSY Hindu Muslim Sikh Total Awareness Yes 2 9 3 39.28 96 65.31 7 100.00 3 9 6 44.00 Benefited Yes 4 1.37 1 1.04 0 0.00 5 1.26 Did you pay commission: Yes 1 25 0 0 0 0 1 20 NREGS Awareness Yes 2 6 0 34.85 46 31.29 3 42.86 309 34.33 Benefited Yes 1 0.38 0 0.00 0.00 1 0.32 IAY Awareness Yes 568 76.14 94 63.95 7 100.00 6 6 9 74.33 Benefited Yes 4 8 8.45 8 8.51 0 0.00 56 8.37 Did you pay commission: Yes 3 6.25 0 0 0 0 3 5.36 Old age /widow Pension

61
Awareness Yes 598 80.16 103 70.07 7 100.0 7 0 8 78.67 Benefited Yes 114 19.06 15 14.56 1 14.3 1 3 0 18.36 Did you pay commission Yes 1 4 12.28 4 26.67 0 0.0 18 13.85 TSC/Swjaldhara Awareness Yes 497 66.62 90 61.22 7 100.0 594 66.00 Benefited Yes 3 4 2 68.81 51 56.67 2 28.6 3 9 5 66.50 Did you pay commission Yes 5 1.46 0.00 0 0.0 5 1.27 _ARWSP Awareness Yes 449 60.19 93 63.27 6 85.7 548 60.89 Benefited Yes 299 66.59 81 87.10 0 0.0 3 8 0 69.34 Did you pay commission Yes 1 1 3.68 1 1.23 0 0.0 12 3.16 Sarvasikhsa Awareness Yes 661 88.61 1 3 0 88.44 7 100.0 7 9 8 88.67 Benefited Yes 353 53.40 82 63.08 1 14.3 4 3 6 54.64 Did you pay commission Yes 1 4 3.97 2 2.44 0 0.0 16 3.67
Source: Based on the Primary data.
4.3.3 Status and Awareness of NREGA
Almost one third of the sample surveyed households informed that they are aware
about the NREGA programme. Hindu community seems to be well aware of the
programme and much ahead of Muslim community. Overall 0.32 per cent households
who were aware about the programme were benefited by NREGA. Only one household
reported benefit from the programme. None of the Muslims or the Sikhs reported availing
the benefit from the prevailing programme.
4.3.4 Status and Awareness of IAY
More than 74 per cent of all the surveyed households were found aware about the
Indra Awas Yojana and even among the communities. In all 669 household were benefited
by IAY programme, in which 568 were Hindu and 94 were Muslim households. Mostly
Sarpanch and Secretary selected the Hindu household when Muslims were selected by
Sarpanch and NGO/SHGs. Among Hindus 3 and none Muslim households reported for
paying the commission for getting the IAY benefits. All the beneficiaries reported that
their families were benefited.
Another scheme of Old Age/Widow Pension is known among more than 78.67 per
cent households in our survey. Among 708 aware households about the scheme, only 130
or 18.36 per cent households reported benefited. Among Hindu and Muslim communities
114 and 15 households respectively reported benefited. Most of the beneficiaries were
selected by Sarpanch. Among beneficiaries, 14 Hindus and 4 Muslims reported paying
commission. All the beneficiaries reported their families were benefited.
4.3.5 Status and Awareness of TSC Swajaldhara
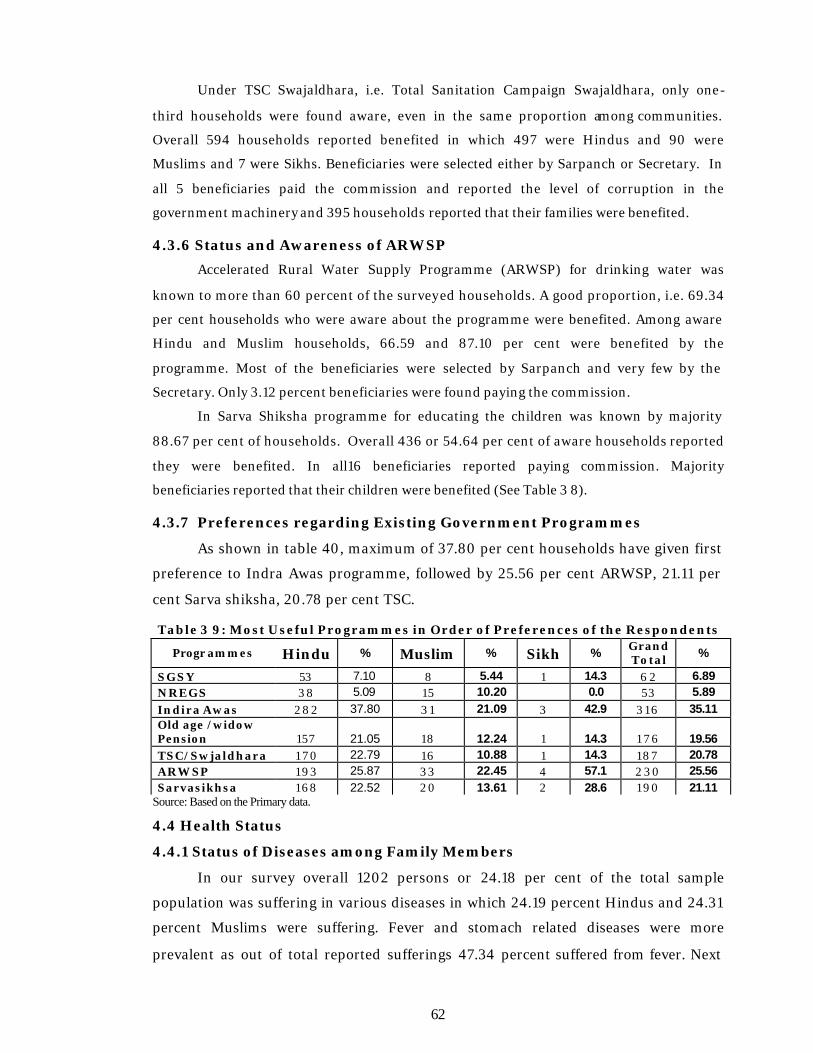
62
Under TSC Swajaldhara, i.e. Total Sanitation Campaign Swajaldhara, only one-
third households were found aware, even in the same proportion among communities.
Overall 594 households reported benefited in which 497 were Hindus and 90 were
Muslims and 7 were Sikhs. Beneficiaries were selected either by Sarpanch or Secretary. In
all 5 beneficiaries paid the commission and reported the level of corruption in the
government machinery and 395 households reported that their families were benefited.
4.3.6 Status and Awareness of ARWSP
Accelerated Rural Water Supply Programme (ARWSP) for drinking water was
known to more than 60 percent of the surveyed households. A good proportion, i.e. 69.34
per cent households who were aware about the programme were benefited. Among aware
Hindu and Muslim households, 66.59 and 87.10 per cent were benefited by the
programme. Most of the beneficiaries were selected by Sarpanch and very few by the
Secretary. Only 3.12 percent beneficiaries were found paying the commission.
In Sarva Shiksha programme for educating the children was known by majority
88.67 per cent of households. Overall 436 or 54.64 per cent of aware households reported
they were benefited. In all16 beneficiaries reported paying commission. Majority
beneficiaries reported that their children were benefited (See Table 3 8).
4.3.7 Preferences regarding Existing Government Programmes
As shown in table 40, maximum of 37.80 per cent households have given first
preference to Indra Awas programme, followed by 25.56 per cent ARWSP, 21.11 per
cent Sarva shiksha, 20.78 per cent TSC.
Table 3 9: Most Useful Programmes in Order of Preferences of the Respondents
Programmes Hindu % Muslim % Sikh % Grand Total %
SGSY 53 7.10 8 5.44 1 14.3 6 2 6.89 NREGS 3 8 5.09 15 10.20 0.0 53 5.89 Indira Awas 282 37.80 3 1 21.09 3 42.9 316 35.11 Old age /widow Pension 157 21.05 18 12.24 1 14.3 1 7 6 19.56 TSC/Swjaldhara 1 7 0 22.79 16 10.88 1 14.3 187 20.78 ARWSP 193 25.87 33 22.45 4 57.1 2 3 0 25.56 Sarvasikhsa 168 22.52 20 13.61 2 28.6 190 21.11
Source: Based on the Primary data.
4.4 Health Status
4.4.1 Status of Diseases among Family Members
In our survey overall 1202 persons or 24.18 per cent of the total sample
population was suffering in various diseases in which 24.19 percent Hindus and 24.31
percent Muslims were suffering. Fever and stomach related diseases were more
prevalent as out of total reported sufferings 47.34 percent suffered from fever. Next

63
was stomach disease in which Hindus 14.10 and Muslims 14.49 per cent were
suffering. There were many unspecific diseases reported in which people were
suffering.
Table 40: Health and Family Welfare
Disease Hindu % Muslim % Sikh % All % Fever 4 7 5 48.52 93 43.46 1 11 .11 569 47 .34 Jaundice, Typhoid 18 1 .84 2 0.93 0 0.00 20 1 .66 ENT 63 6 . 4 4 1 2 5.61 2 22.22 7 7 6.41 Accident 50 5.11 6 2.80 0 0.00 56 4.66 Stomach related 1 3 8 14.10 3 1 14.49 3 33.33 1 7 2 14.31 Cancer, T,B 27 2 . 7 6 7 3.27 0 0.00 34 2.83
Any other 2 0 8 21.25 63 29.44 3 33.33 2 7 4 22.80 Grand Total 9 7 9 214 9 1202
Average Days of Treatment 49.6 44.86 83.56 49.01 Source: Based on the Primary data.
Average duration of suffering was reported 49 days, but among Muslims the
average duration of suffering was 44.86 days, when among Hindus it was 49.6 days.
Sikhs are seen to be suffering more on average days of treatment i.e.83 days (see Table
40).
4.4.2 Status and Treatment of Family Members
The following table 42 shows the pathetic public health services as only 20.88
per cent patients reported availing treatment from government hospitals otherwise
rest 50.75 per cent are treated by private practitioners and 0.50 per cent go to quakes.
Among Hindus only 21.35 per cent patients get treatment from government hospitals,
49.85 per cent are treated by private doctors and 0.31 per cent go to quakes. Muslim
patients availing treatment from government hospitals are 19.63 per cent, from private
doctors 55.14 cent and going to quakes is 1.40 per cent. Only 9 Sikh patient were
reported who is also treated by government and private doctors (See Table 40).
Table 41: Place of Treatment of Diseases
Treated By Hindu % Muslim % Sikh % All % Government Hospital 2 0 9 2 1 . 3 5 4 2 1 9 . 6 3 0 0 2 5 1 2 0 . 8 8 Private Hospital 4 8 8 4 9 . 8 5 1 1 8 5 5 . 1 4 4 4 4 . 4 4 6 1 0 5 0 . 7 5 Government and Private 2 1 9 2 2 . 3 7 3 5 1 6 . 3 6 5 5 5 . 5 6 2 5 9 2 1 . 5 5 Traditional 3 0 . 3 1 3 1 . 4 0 0 0 . 0 0 6 0 . 5 0 Homeopathic 5 0 . 5 1 2 0 . 9 3 0 0 . 0 0 7 0 . 5 8 Local Government Health worker 1 0 .1 0 0 0.00 0 0 . 0 0 1 0 . 0 8 Voluntary Health Worker 1 0 . 1 0 0 0.00 0 0 . 0 0 1 0 . 0 8 Home Treatment 3 0 . 3 1 2 0 . 9 3 0 0 . 0 0 5 0 . 4 2 Jhola Chap Doctor 4 8 4 . 9 0 1 2 5 . 6 1 0 0 . 0 0 6 0 4 . 9 9 Others 2 0 . 2 0 0 0.00 0 0 . 0 0 2 0 . 1 7 Total 9 7 9 100.00 2 1 4 1 0 0 . 0 0 9 100.00 1 2 0 2 100.00 Patient admitted 2 5 8 2 6 . 3 5 5 2 2 4 . 3 0 5 5 5 . 5 6 3 1 5 2 6 . 2 1 Average Expenditure 2133.22 2234.24 5 5 7 8 2177.02 Source: Based on the Primary data.

64
Among total 1202 sick persons 315 persons reported were admitted in hospital.
Among overall total 258 Hindu patients 26.35 per cent, among 52 Muslim patients
24.30 per cent and out of total 1202 patients 26.21 per cent patients were hospitalized.
It was found that due to lack of health services, the patients with serious diseases
could not get admission in hospitals. Average expenditure incurred by the patients is
more amongst Sikhs followed by Muslims and Hindus (see Table 41).
4.4.3 Status of Immunization among Children
Overall proportion of immunization among Hindu children is higher than the
children of Muslim community. Among Hindu and Muslim children the immunization
against polio is highest followed by BCG, small pox/chicken pox DPT/Diphtheria and
the least for hepatitis (see Table 42). The respondents were enquired about the
immunization of their children up to the age of 5 years. It was reported that maximum
(87.99 percent) children were given polio drops. It was higher in case of children of
Hindus (91.53 per cent) as against the Children of Muslims (73.53 percent). The
percentage of immunization of Muslim children was found to be lower to that of
Hindu children in case of entire four major diseases (Table 42).
With regard to the place of immunization we come across the fact that
Asha/Midwife are the favourite source for immunization amongst the villagers
followed by government hospitals for the 24.95 percent of the vaccinations.
Table 42: Immunization of Children(5 years of age)
Details of Vaccination Hindu % Muslim % Sikh % All %
Polio 400 91.53 7 5 73.53 1 50.00 4 7 6 87.99
Diphtheria 3 2 3 73.91 6 1 59.80 1 50.00 3 8 5 71.16
BCG 388 88.79 6 8 66.67 1 50.00 457 84.47
Small pox 341 78.03 6 3 61.76 1 50.00 405 74.86
Hepatitis 251 57.44 52 50.98 1 50.00 304 56.19
Total No. of Children below 5 years 437 - 102 - 2 - 541 -
Where Vaccinated
Govt Hospital 89 20.37 44 43.14 2 100.00 135 24.95
Private Hospital 19 4.35 9 8.82 0 0.00 28 5.18
Midwife/ASHA 326 74.60 48 47.06 0 0.00 374 69.13
Untrained Dai 3 0.69 1 0.98 0 0.00 4 0.74
Others 0 0.00 0 0.00 0 0.00 0 0.00 Source: Based on the Primary data.

65
4.6 Status of Housing and Amenities
4.6.1 Housing Status
The ownership of houses is of two types in rural areas of Lucknow district.
One is the self ownership and other is the houses provided under the Indira Awas
Yojana. It is to be recorded here that the percentage of Muslims who have been given
houses under the Indira Awas Yojana is higher to that of the Hindus in the district
(Table 43). Among surveyed Hindu and Muslim households 92.23 and 91.16 per cent
are respectively owners of their houses, while 7.51 and 6.8 per cent have Indra Awas or
government houses.
Table 43: Distribution of Households by the Type of Ownership of Houses
Ownership Hindu Muslim Sikh Grand Total Own 6 8 8 134 7 8 2 9 % 92.23 9 1 . 1 6 100 92.11 Indira Awas/Govt. 56 10 6 6 % 7.51 6.8 0 7.33 Rented 2 3 5 % 0.27 2.04 0 0.56 Grand Total 7 4 6 147 7 900 % 100 100 100 100 Source: Based on the Primary data.
Table 44: Distribution of Households by the Type of Houses
Hindu % Muslim % Sikh % Grand
Total %
Thatched 2 1 8 29.22 4 6 31.29 0 2 6 4 29.33
Khaprail/Khaprail 92 12 .33 1 4 9.52 0 106 1 1 . 7 8
Semi-Pucca 303 40.62 56 38.1 1 14.29 3 6 0 40
Pucca 1 1 4 15.28 2 3 15.65 6 85.71 1 4 3 15.89
Others 19 2.55 8 5.44 0 27 3 Grand Total 7 4 6 100 147 100 7 100 900 100 Source: Based on the Primary data.
About one-third houses are thatched, in which Muslim’s proportion is higher.
Similarly more than 15 percent houses are pucca but here pucca houses belonging to
Hindus and Muslims are comparatively less than Sikhs. Semi-pucca are 40 percent.
About 40 per cent houses have only one room, among Hindus 38.47 and Muslims
40.82 per cent. About 36.86 per cent houses belonging to Hindu and 39.46 per cent
belonging to Muslims are with two rooms. Houses with 6 and above rooms a re 1.47 per
cent with Hindus and 0.68 per cent with Muslims.
Table 45: Distribution of Households by the Number of Rooms
Hindu % Muslim % Sikh % Grand Total
%
One 287 38.47 60 40.82 0 0.00 347 38.56 Two 275 36.86 58 39.46 2 28.57 335 37.22

66
Three 116 15.55 17 11.56 0 0.00 133 14.78 Four 44 5.90 8 5.44 5 71.43 57 6.33 Five 13 1.74 3 2.04 0 0.00 16 1.78 Six & Above 11 1.47 1 0.68 0 0.00 12 1.33 Total 746 100.00 147 100.00 7 100.00 900 100.00
Source: Based on the Primary data.
Classification of Households according to the area of houses we find that 81.11
percent of households are in the category of below 500 sq. ft of area. Amongst Sikhs
we have that 57.14 percent of their households have area 1000-5000 sq. ft of area.
Situation of Hindus and Muslims are not stated to be much different.
Table 46: Classification of Households According to the Area of Houses Coverd Area Hindu % Muslim % Sikh % Grand
Total %
Below 500 603 80.83 1 2 4 84.35 3 42.86 7 3 0 81.11 1000-5000 3 2 4 . 2 9 5 3.4 4 57.14 41 4.56 500 -1000 109 14.61 1 8 12.24 0 1 2 7 14.11 5000 & above 2 0.27 0 0 2 0.22 Grand Total 7 4 6 100 1 4 7 100 7 100 900 100
Source: Based on the Primary data.
Table 47 demarcates the value of the houses of the respondents. It is
interesting to note that the rural households fall in the category of have nots as their
house’s valuation stands in the category of below Rs. 50,000. 57.14 percent Sikhs
claimed that the value of their house is 200,000 and above category thus proclaiming
to be the richer lot amongst the respondents.
Table 47: Classification of Households According to the
Value of their Houses
Value (000Rs) Hindu % Muslim % Sikh % Grand Total %
Below 50 515 69.03 101 68.71 2 28.57 6 1 8 68.67 50-100 163 21.85 2 5 17.01 1 1 4 . 2 9 1 8 9 2 1 100 -200 4 5 6.03 1 3 8.84 0 58 6 . 4 4 200 & above 2 1 2.82 4 2 . 7 2 4 57 .14 2 9 3 . 2 2 Rented House 2 0.27 4 2 . 7 2 0 6 0.67 Grand Total 7 4 6 100 1 4 7 100 7 100 900 100
Source: Based on the Primary data.
Table 48: Distribution of Households according to Sources of Homestead Homeland Hindu % Muslim % Sikh % Grand
Total %
own 681 91.29 132 89.8 6 85.71 819 91

67
Provided by Government Panchayat 54 7.24 9 6.12 1 14.29 6 4 7.11
Landlords Land 8 1.07 5 3 .4 1 3 1.44
Others 3 0.4 1 0.68 4 0.44 Grand Total 7 4 6 100 147 100 7 100 900 100
Source: Based on the Primary data.
The table 47 shows that around 91 per cent of total homestead are owned.
Around 7.11 per cent has been provided by government. There is no major difference
across the religious groups of Hindu and Muslim as far the ownership of homestead is
concerned.
4.6.2 Status of Housing Amenities
More than 81 per cent houses have no electric connection. Sikh houses are the most
electrified households with 85.71 percent being electrified, followed by Muslims (25.85
percent) and Hindus (17.02 percent).
Table 49: Distribution of Households by the Electrification and
Sources of Lighting
Hindu % Muslim % Sikh % Grand Total %
Electrified: Yes 127 17.02 3 8 25.85 6 85.71 1 7 1 19.00
Electrified: No 619 82.98 109 74.15 1 14.2 9 729 81.00
Total 7 4 6 100 1 4 7 100 7 100 900 100.00
Oil lamp 556 74.53 105 71 .43 0 0 661 73 .44
Lantern 4 5 6.03 3 2.04 1 1 4 . 2 9 4 9 5.44
Petromax 1 0.13 1 0.68 0 0 2 0.22 Others 1 7 2 .28 0 0 0 0 1 7 1 .89 Grand Total 7 4 6 100 1 4 7 100 7 100 900 100.00
Source: Based on the Primary data.
The majority of houses are still using Kerosene oil lamp for lighting of their
houses (Table 50). This is true also in case of Muslim and Hindu houses but it has
been reported that 71.43 per cent of Muslim houses are using oil lamp while 74.53 per
cent of the Hindu households use oil lamp.
Table 50: Classification of Households According to Sources of Drinking Water
Hindu % Muslim % Sikh % Grand Total %
Own Hand-pump 1 9 7 26.41 3 3 22.45 3 42.86 2 3 3 25.89 Public Hand-pumps 495 66.35 9 9 6 7 . 3 5 2 28.57 596 66 .22
Tap in dwelling 2 4 3.22 1 0 6.80 2 28.57 36 4.00
Own protected well 4 0.54 0.00 0.00 4 0.44

68
Own Unprotected well 1 3 1 .74 1 0.68 0.00 14 1.56 Public Unprotected well 9 1.21 1 0.68 0.00 10 1.11
Public Protected well 1 0.13 2 1 .36 0.00 3 0.33
Public tab 0.00 0.00 0.00 0.00
Pond/River/Stream 1 0.13 0.00 0.00 1 0.11 Others 1 0.13 0.00 0.00 1 0.11 (blank) 1 0.13 1 0.68 0.00 2 0.22 Grand Total 746 100.00 1 4 7 100.00 7 100.00 900 100.00
Source: Based on the Primary data.
More than 25 per cent houses either owned hand pumps. Highest proportion of
the household (66.22 percent) depends on Public hand pumps. About little less than
half of houses have drinking water source within the premises and about 66.22 per
cent households got water at a distance upto 100 metres. Only 25 percent households
have the privilege of having water facility within house premises.
Table 5 1: Classification of Households According to Distance from Sources
of Drinking Water
Distance Hindu % Muslim % Sikh % All % With in House 197 26.41 33 22.45 3 42.86 233 25.89 Up to 100 meters 495 66.35 99 67.35 2 28.57 596 66.22 100-250 meters 46 6.17 7 4.76 2 28.57 55 6.11 Above to 250 meters 8 1.07 8 5.44 0 0.00 16 1.78 Total 746 100.00 147 100.00 7 100.00 900 100.00 Source: Based on the Primary data.
About 91.82 per cent Hindus and 71.43 per cent Muslims don’t have toilet
within their premises. About 76.0 per cent households either use wood or cow-dung as
source of fuel. (see Table 51).
Table 52: Classification of Households According to Toilet facility Toilet Facility Hindu % Muslim % Sikh % Grand
Total %
In house 61 8.18 4 2 28.57 6 85.71 109 12.11 Outside House 685 91.82 105 7 1 . 4 3 1 1 4 . 2 9 7 9 1 87.89 Grand Total 7 46 100 147 100 7 100 900 100.00 Toilet Type 0 0 0 0.00 1 Septic tank latrine 20 2 .68 7 4 . 7 6 2 28.57 2 9 3.22 2 In the dwelling/ water-sealed 26 3 . 4 9 1 5 10.2 4 57 .14 4 5 5.00
3 Pit latrine 28 3 . 7 5 1 9 1 2 . 9 3 0 0 4 7 5.22 4 Covered dry latrine 2 0.27 3 2.04 0 0 5 0.56 5 In the community/ water sealed 3 0.4 0 0 0 3 0.33 6 In the field 6 6 0 88.47 101 68.71 1 1 4 . 2 9 7 6 2 84.67 7 Others 7 0 .94 2 1 .36 0 0 9 1.00 Grand Total 7 4 6 100 147 100 7 100 900 100.00 Source: Based on the Primary data.

69
Table 5 3: Classification of Households According to
Type of Cooking Fuel Used
Fuel Type Hindu % Muslim % Sikh % Grand Total %
Wood 563 75.47 1 2 1 8 2 . 3 1 0.00 6 8 4 76.00 Coal 1 3 1 . 7 4 3 2.04 2 28.57 1 8 2.00 Kerosene oil 5 0.67 0 0.00 0 0.00 5 0.56 Hay/Leaves 8 1.07 3 2.04 0 0.00 1 1 1.22 Cow dung cake 119 15.95 12 8.16 0 0.00 1 3 1 14.56 Agricultural Waste 5 0.67 1 0.68 0 0.00 6 0.67 Goober Gas plant 0 0.00 0 0.00 0 0.00 0 0.00 L.P.G. 3 1 4 .16 5 3 .40 5 7 1 . 4 3 4 1 4.56 Others 1 0.13 0 0.00 0 0.00 1 0.11 (blank) 1 0.13 2 1 .36 0 0.00 3 0.33 Grand Total 7 4 6 100.00 1 4 7 100.00 7 100.00 900 100.00
Source: Based on the Primary data.
4.7 Status of Community Participation
4.7.1 Status of Participation in Election and Organizations
As shown in Table 54, almost all households participated in panchayat
elections, state assembly, and parliament elections. In terms of office bearers in the
panchayat, Hindu households are maximum than that of Muslims, but in SHGs and
religious / social organisations, Muslim participation is higher as compared to Hindus.
Table 54: Participation of HH in Administrative Community
Organization Hindu Muslim Sikh All Does you or your family members caste vote Panchayat election 7 4 0 147 7 894 State Assembly 7 3 9 144 7 890 Parliament 7 4 1 1 4 5 7 893 Are you member of panchayat 6 1 0 7 Are you member of SHG 2 0 0 2 Are you member of any religious/social organization 3 0 0 3 Source: Based on the Primary data.
4.7.2 Status of Community Concern
Out of 900 samples surveyed households total 1 person was reported being
killed during recent communal violence. Among the killed member he belonged to
Hindu household. In recent communal violence the loss of property was reported by 4
households in which 2 each were from Hindu and Muslim households. Overall 9
households reported to be insecure due to communal feelings which includes 8 Hindu
and 1 Muslim household (see Table 55).
Table 5 5: Problem and losses Reported by HH during communal violence

70
Yes Hindu Muslim Sikh All
Death of your family members during recent communal violence 1 0 0 1
Loss of your property during recent communal violence 2 2 0 4
Do you feel insecure due to communal feelings 8 1 0 9 Source: Based on the Primary data.
4.7.3 Status of Access to Media and Communication
As far as access of media and communication is concerned, out of total surveyed
households, 35 households go through newspaper daily, followed by 118 listen radio
and 117 watch television. A part from this, 120 households have mobile phones for
communication purpose (see table 54). Among Hindu and Muslim households 29
and 5 respectively were reading newspapers regularly. Overall 118 households
reported listening the radio in which 95 and 23 were Hindus and Muslims
respectively. Only 10 households were connected with telephones where 9 and 1 were
Hindu and Muslim households respectively (see Table 56).
Table 56: Households with Access to Media and Communication
Hindu Muslim Sikh Grand Total A. Do you read newspaper regularly 2 9 5 1 35 B. Do you listen radio regularly 9 5 23 0 118 C. Do you watch TV regularly 9 2 20 5 117 E. Do you have Telephone 9 1 0 10 E. Do you have mobile 7 2 32 1 6 1 2 0
Source: Based on the Primary data.
4.7.4 Status of Household Facilities and Family Deprivation
Households were asked which three facilities are lacking in their village, in
which maximum 63.78 per cent reported for roads, followed by 53.78 per cent water,
13.56 per cent education, 47.56 per cent for electricity, 15.00 per cent for employment,
16.0 per cent for drinking water. Almost in the same proportion all the households of
different communities have reported about the lack of facilities (see Table 57).
Table 57: Households Reporting Three important Facilities which are lacking in village
Data Hindu % Muslim % Sikh % Grand Total % Road 4 8 5 65.01 83 56.46 6 85.7 5 7 4 6 3 . 7 8 Water 4 2 9 57.51 51 34.69 4 57.1 484 5 3 . 7 8 Health Facilities 2 3 0 30.83 61 41.50 3 42.9 294 32.67 Education 105 14.08 16 10.88 1 14.3 122 13.56 Transport 3 2 4 . 2 9 11 7.48 3 42.9 46 5.11 Electricity 3 4 3 45.98 82 55.78 3 42.9 428 47.56 House 4 7 6 . 3 0 24 16.33 0 0.0 7 1 7 . 8 9
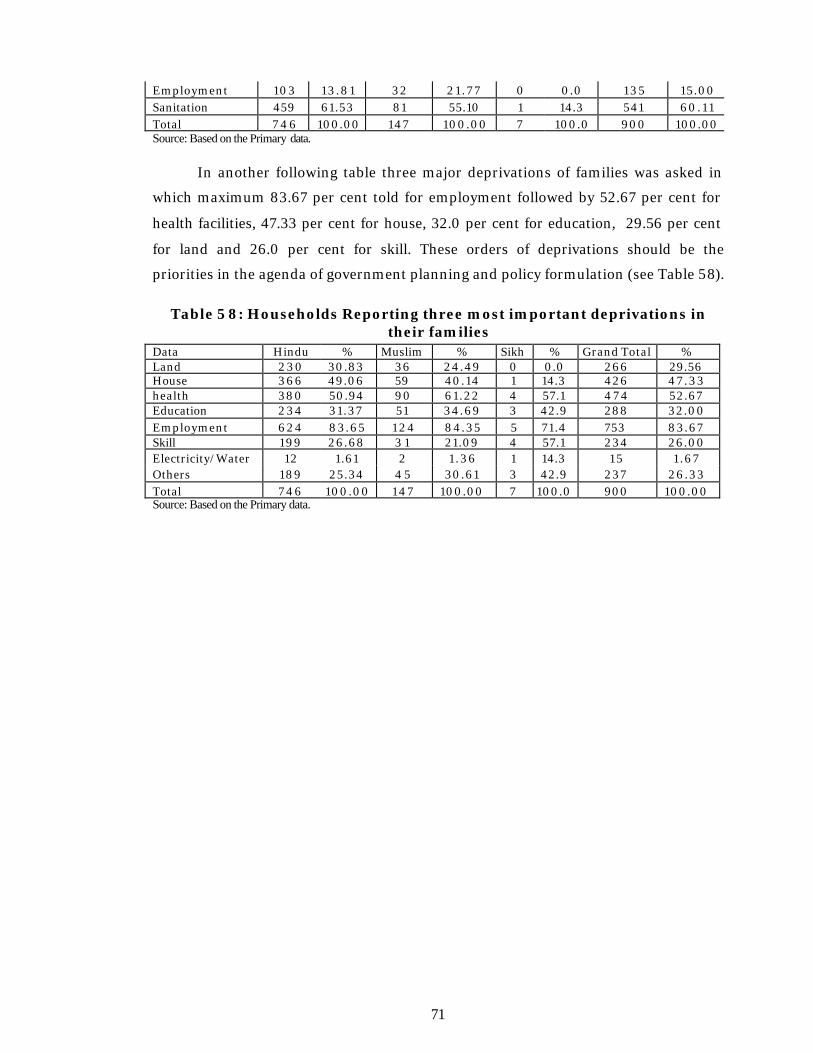
71
Employment 103 13 .81 32 2 1 . 7 7 0 0.0 1 3 5 15.00 Sanitation 459 61.53 81 55.10 1 14.3 541 60.11 Total 7 4 6 100.00 147 100.00 7 100.0 900 100.00 Source: Based on the Primary data. In another following table three major deprivations of families was asked in
which maximum 83.67 per cent told for employment followed by 52.67 per cent for
health facilities, 47.33 per cent for house, 32.0 per cent for education, 29.56 per cent
for land and 26.0 per cent for skill. These orders of deprivations should be the
priorities in the agenda of government planning and policy formulation (see Table 58).
Table 5 8: Households Reporting three most important deprivations in their families
Data Hindu % Muslim % Sikh % Grand Total % Land 2 3 0 30.83 36 24.49 0 0.0 266 29.56 House 3 6 6 49.06 59 40.14 1 14.3 426 47 .33 health 380 50.94 90 61.22 4 57.1 4 7 4 52.67 Education 2 3 4 31.37 51 34.69 3 42.9 288 32.00 Employment 624 83.65 1 2 4 84.35 5 71.4 753 83.67 Skill 199 26.68 3 1 21.09 4 57.1 234 26.00 Electricity/Water 12 1.61 2 1 .36 1 14.3 1 5 1 .67 Others 189 25.34 4 5 30.61 3 42.9 237 26.33 Total 7 4 6 100.00 1 4 7 100.00 7 100.0 900 100.00 Source: Based on the Primary data.

72
CHAPTER V
DEVELOPMENT GAPS AND REMEDIES THEREOF
In the preceding chapters, socio -economic development status has been
examined at the three levels: Firstly at the district level, secondly at the village level
and finally at the household level to fully articulate the constraints and chalk out
policies for eradication of such constraints thereof. In this chapter, critical
development gaps have been identified in relation to three spatial levels, i.e. (I)
Lucknow District as a whole; (II) Village level and (III) Household level. Ø The first and probably among the most significant aspects which needs to be
taken care of is the fact that the condition of housing has been found to be quite
unsatisfactory and receives top priority. Although IAY has contributed to
certain extent the larger section of people living below poverty line has not yet
been covered by any housing programme.
Ø To top the list is the problem of employment. As most of the population is
reported in the age group of 0-14 i.e. child or 15-30 age group the working age
population. With increase in education the so called educated lot hesitates to
take up farming activities and roam about in search of job.
Ø The issue that needs top priority based on our field survey is the problem of
employment and th is was highlighted by 82 percent of the respondents and the
leading issue to be handled.
Ø Health services are not properly developed in the area. Most of the child births
takes place within household premises and hence needs proper attention. The
number of both PHCs and CHCs are much below the prescribed norm. Because
the sick are not getting proper medical attention in the government hospitals,
they are forced to be dependent on private practitioners and even the jhola
chap doctors. Because the income levels are low a sizeable number of
households who are indebted to meet their medical requirements. It is,
therefore, a matter of top priority that the PHCs and CHCs should be properly
manned and the facilities, which they are supposed to offer, should be available
all the year round in general and specifically during period when seasonal
ailments are common. In this connection it is equally important to ensure the
availability of safe drinking water and ensure proper drainage facilities.

73
Ø Though literacy level is high but still the situation of higher education is
deplorable. Drop out rates are reported to high.
Ø Many of our respondents have expressed their desire to undertake training of
various types so that they may enhance their skills and thereby increase their
income and overcome the shabby living conditions due to poverty. Most of
them want vocational training to be provided to them. It is therefore important
that the government should take appropriate action and set up training centres
at convenient locations to ensure that those who are willing to acquire the skill
may be able to undergo short or medium duration training courses. Since
people are from the disadvantaged group these training programmes can be
subsidized because although respondents have expressed their desire to partly
pay for them their affordability levels are rather low.
Ø Since land holding sizes are low the cultivators could be educated to diversify
their activities. If non-agricultural activities are developed properly it will prove
extremely beneficial in raising the levels of living of the village community as
well as in ensuring an all round development of the district as a whole.
Ø Despite the fact that a number of promotional programmes of the government
are being implemented, the awareness level among the villagers regarding these
schemes was found to be so so. It is, therefore, desirable that concerted efforts
should be made to raise awareness levels and also to ensure that the
beneficiaries selected deserve it rightly and belong to the category for whom
they have primarily been designed. In this context it would be also appropriate
to point out that the problems related to the public distribution system,
whether issuing of BPL cards or timely, adequate and good quality of rations be
ensured. It was often found that the rich are commanding the scene.
Ø It is rightly said that development receives an impetus if the infrastructure
facilities are developed adequately. According to the baseline survey findings in
Lucknow district the road network is not properly developed. Proper road
connectivity facilitates the movement of goods and services and this is lacking
at the village level. This aspect has been very clearly been realized by the 63
percent village folk and our respondents have accorded it top priority among
the three most important concerns of their respective villages.
Ø Equally important is the development of the power sector. This has been a
cause of concern in the entire state and even in Lucknow people get power

74
supply very intermittently. Not only is the supply irregular but its quality is
poor with wide fluctuations in voltage.
Ø Yet another area of concern for villagers is that for undertaking various
economic activities they are unable to take loans easily at reasonable rates of
interest from the financial institutions. They are therefore forced to procure
loans from the village money lender or other sources at high rate of interest.
Though they have formed many cooperatives but most are not functioning. The
role SHGs should be stressed upon and the masses should be inculcated with
the skill to form SHGs and extract the benefit thereof.
Remedial Measures
According to the Census of India 1991 percentage of main workers to total
population stood at 32.2 percent, 82.5 percent of workers were engaged in agriculture,
percent in household industry to total main workers were 1.1 percent and literacy level
was 35.2 percent. But presently according to Census 2001 these percentages stood at
24.7, 27.5, 4.4, and 68.7 percent. In 2005-06 total pucca road per lakh of population
stood at 150.6 km., allopathic hospitals per lakh of population /CHC and PHC were
1.9, primary schools per lakh of population 54.8(2004-05). This lead us to derive that
infrastructural facilities have not extended and to focus our attention is the call of the
time.
Agriculture and Allied Activities
Ø Development of irrigation infrastructure have been sanctioned under RIDF
programme. To improve agriculture and rural development there is no
alternative but to bring in intensive cultivation practices with the help of
mechanization and suitable sufficient use of fertilizer. This could be possible
only if the entire district is saturated with KCC coupled with investment credit
for sgricultute and allied activities side by side with awareness and skill
development programme.
Ø The skewed distribution of land holdings vis-à-vis the area covered will
undoubtedlydetermine the cropping pattern and practices being followed in the
district. Land consolidation work may be launched to make the holdings viable
units.
Ø 25 percent of land is under unculturalable/ pastures and this stands at the
major drawback of our agricultural expansion.
Ø Off season vegetable cultivation should be introduced.

75
Ø Diversification into high value crops, horticu lture, herbiculture, vegetables, etc.
may be encouraged.
Ø Large number of tubewells and handpumps are not in working conditions.
Besides this the water is not fully utilized even from canal irrigation.
Productvity improvement through sprinkler irrigation, use of bio-fertilisers, use
of soil conditioners like gypsum in ground nut recommended.
Ø Electricity required for agricultural activities fall short of demand.
Ø Lucknow is famous for “Dashari Aam” from Kakori, Malihabad and Mal tehsils.
Even tough these areas are declared as “Mango Belt” these mango growers do
not get bank loans and exporting facilities for their produce easily.
Industrial Activities
Ø Lucknow is equally famous for its Chikan craft and ceramic potteries (Chinhat).
People employed in these traditional activities do not get the required benefits
and are cheated at the hands of middle men.
Ø Condition of SSI and Khadi Industries is very deplorable. Entrepreneurs are not
able to procure loans and other infrastructural facilities.
Socio-Economic Conditions
Ø Conditions of primary schools buildings are satisfactory and few are in
dilapidated conditions.
Ø Handpumps installed to provide drinking water facilities are non-functional
and the existing wells are either dried or the water is not worth drinking.
Ø Though urbanization at large scale has taken place but bus services in the
district is still not to the mark.
Ø Provisions made for grants to handicapped/ widows and poor backward caste
people do not reach the needy ones.
Ø Due to unprecedented increase in population and increasing population density
environmental pollution is increasing day by day. Institutional establishments
leave density of vehicles on roads, pollution, water resources, depletion of forest
resources, space research use of fertilizers etc. are creating hell lot of a
problems.
Ø Encouragement required to install pollution free units.
Ø Establish village industries so that the population is diversified and move
towards villages and curb large migrations that are taking place .
Ø Stop river and other water pollution.

76
Ø Plantation of trees should be encouraged by government as well as private
parties to enhance environmental balance.
Ø Chemical fertilizer usage should be replaced by compost fertilizers and
awareness regarding its usefulness should be spread.