barry eichengreen - iaes · barry eichengreen president international atlantic economic society...
TRANSCRIPT
MONTRÉAL 5-8 OCTOBER 2017
EIGHTY-FOURTH INTERNATIONAL
ATLANTIC ECONOMIC CONFERENCE
PRESIDENTIAL ADDRESS
BARRY EICHENGREEN PRESIDENT
INTERNATIONAL ATLANTIC ECONOMIC SOCIETY
“Aftershocks of European Monetary Unification”

Presentation in two parts • Why the euro area continues to experience
difficulties. • And what is to be done.
2

• Closing in on 2,000 citations last time I looked.
• In which we argued that proceeding with a large monetary union, including not just the Northern European core but also the “Club Med” countries, would be a mistake.
3
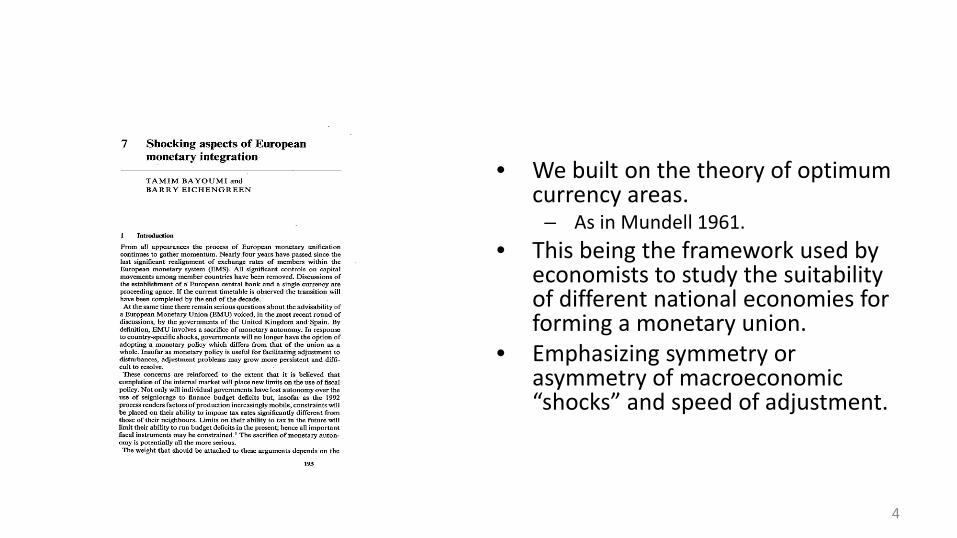
• We built on the theory of optimum currency areas.
– As in Mundell 1961. • This being the framework used by
economists to study the suitability of different national economies for forming a monetary union.
• Emphasizing symmetry or asymmetry of macroeconomic “shocks” and speed of adjustment.
4
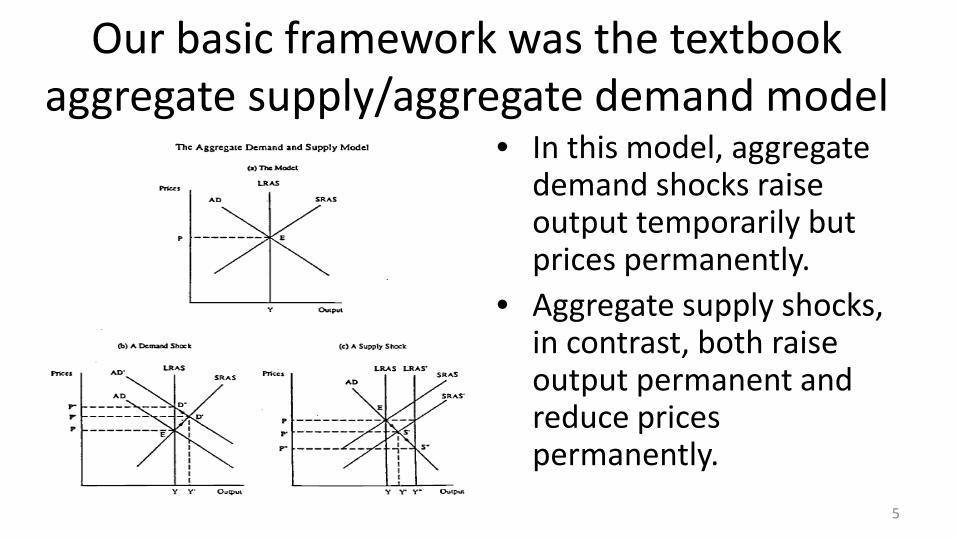
Our basic framework was the textbook aggregate supply/aggregate demand model
• In this model, aggregate demand shocks raise output temporarily but prices permanently.
• Aggregate supply shocks, in contrast, both raise output permanent and reduce prices permanently.
5
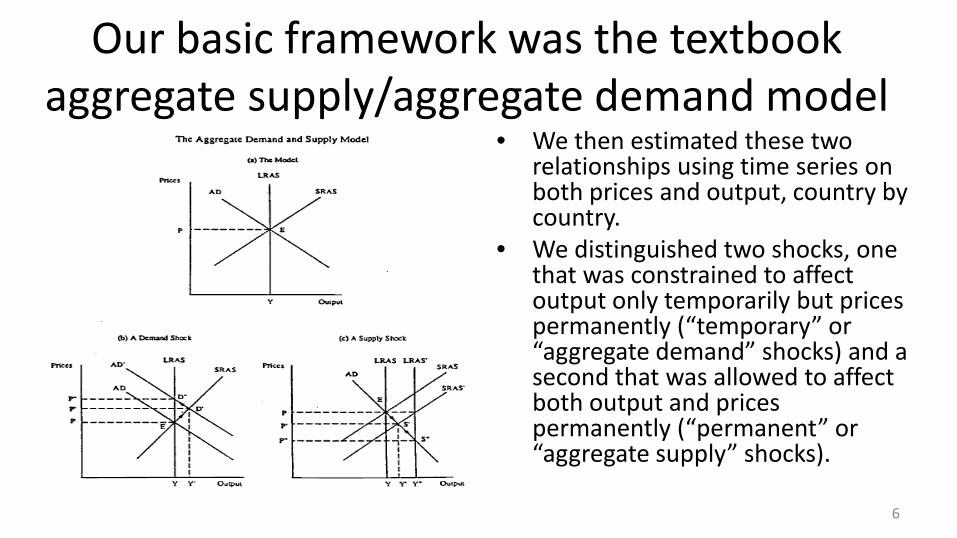
Our basic framework was the textbook aggregate supply/aggregate demand model
• We then estimated these two relationships using time series on both prices and output, country by country.
• We distinguished two shocks, one that was constrained to affect output only temporarily but prices permanently (“temporary” or “aggregate demand” shocks) and a second that was allowed to affect both output and prices permanently (“permanent” or “aggregate supply” shocks).
6
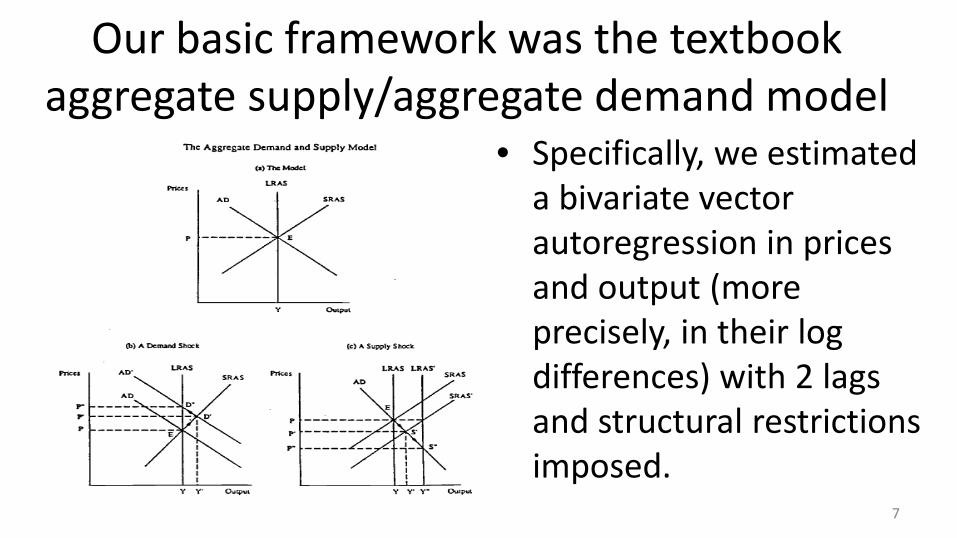
Our basic framework was the textbook aggregate supply/aggregate demand model
• Specifically, we estimated a bivariate vector autoregression in prices and output (more precisely, in their log differences) with 2 lags and structural restrictions imposed.
7
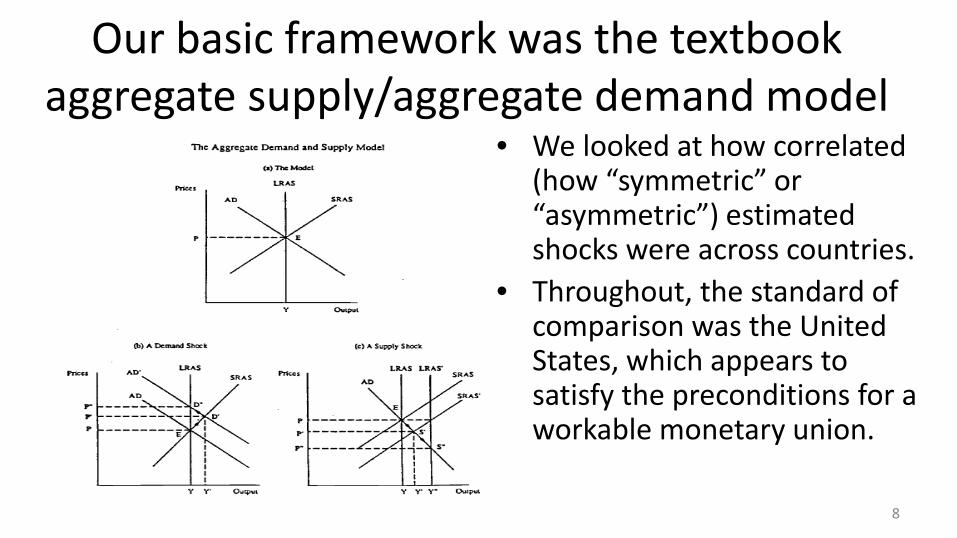
Our basic framework was the textbook aggregate supply/aggregate demand model
• We looked at how correlated (how “symmetric” or “asymmetric”) estimated shocks were across countries.
• Throughout, the standard of comparison was the United States, which appears to satisfy the preconditions for a workable monetary union.
8
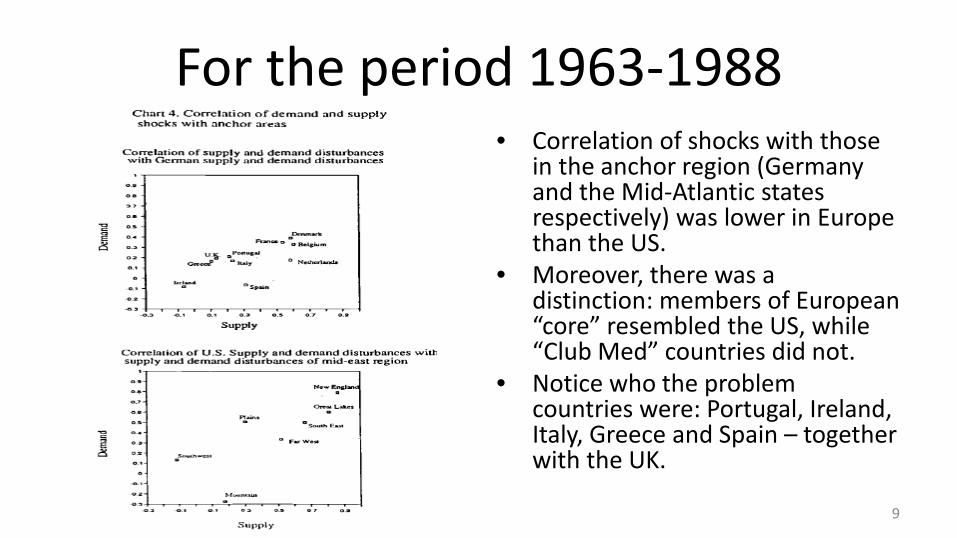
For the period 1963-1988 • Correlation of shocks with those
in the anchor region (Germany and the Mid-Atlantic states respectively) was lower in Europe than the US.
• Moreover, there was a distinction: members of European “core” resembled the US, while “Club Med” countries did not.
• Notice who the problem countries were: Portugal, Ireland, Italy, Greece and Spain – together with the UK.
9
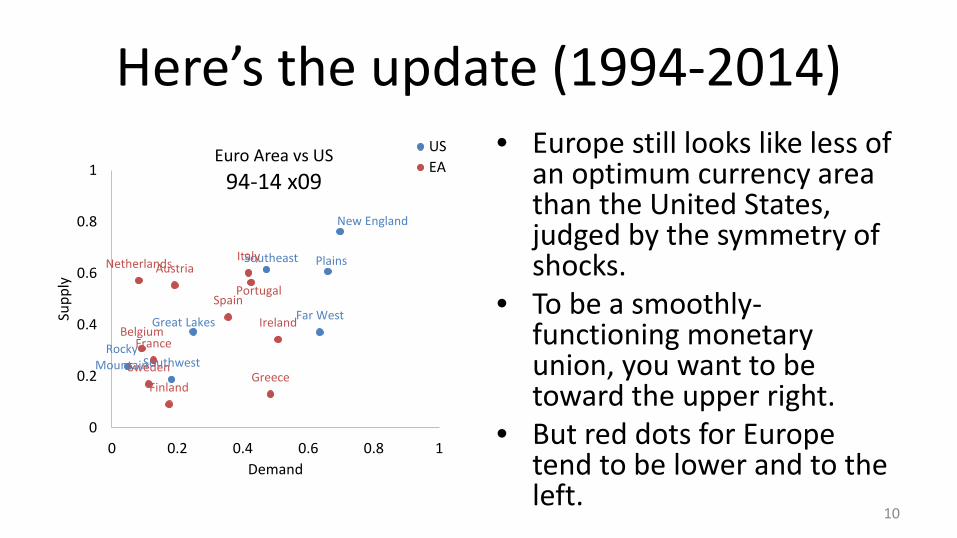
Here’s the update (1994-2014) • Europe still looks like less of
an optimum currency area than the United States, judged by the symmetry of shocks.
• To be a smoothly-functioning monetary union, you want to be toward the upper right.
• But red dots for Europe tend to be lower and to the left.
10
New England
Southeast
Great Lakes
Plains
Southwest Rocky
Mountain
Far West
France
Netherlands
Belgium
Austria
Finland
Ireland
Italy
Spain Portugal
Sweden Greece
0
0.2
0.4
0.6
0.8
1
0 0.2 0.4 0.6 0.8 1
Supp
ly
Demand
Euro Area vs US 94-14 x09
USEA
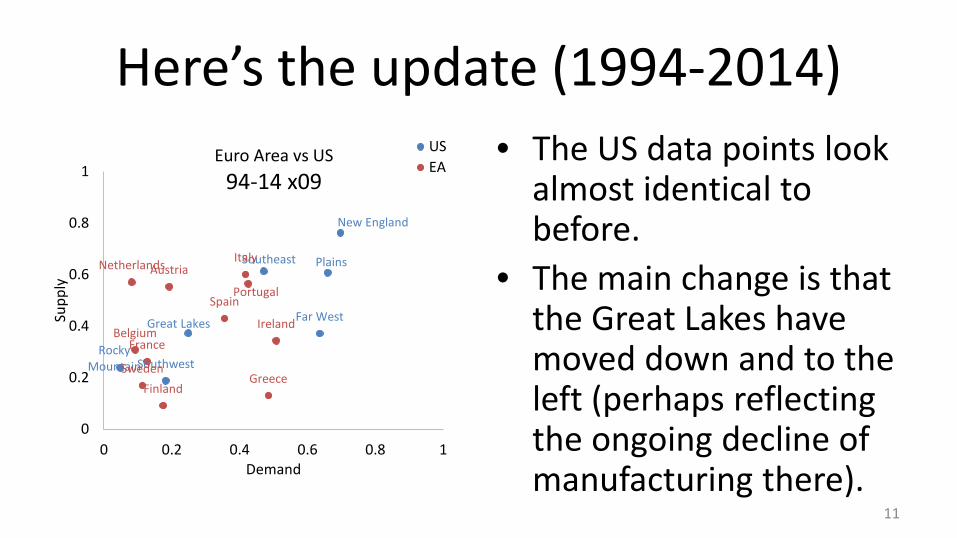
Here’s the update (1994-2014) • The US data points look
almost identical to before.
• The main change is that the Great Lakes have moved down and to the left (perhaps reflecting the ongoing decline of manufacturing there).
11
New England
Southeast
Great Lakes
Plains
Southwest Rocky
Mountain
Far West
France
Netherlands
Belgium
Austria
Finland
Ireland
Italy
Spain Portugal
Sweden Greece
0
0.2
0.4
0.6
0.8
1
0 0.2 0.4 0.6 0.8 1
Supp
ly
Demand
Euro Area vs US 94-14 x09
USEA
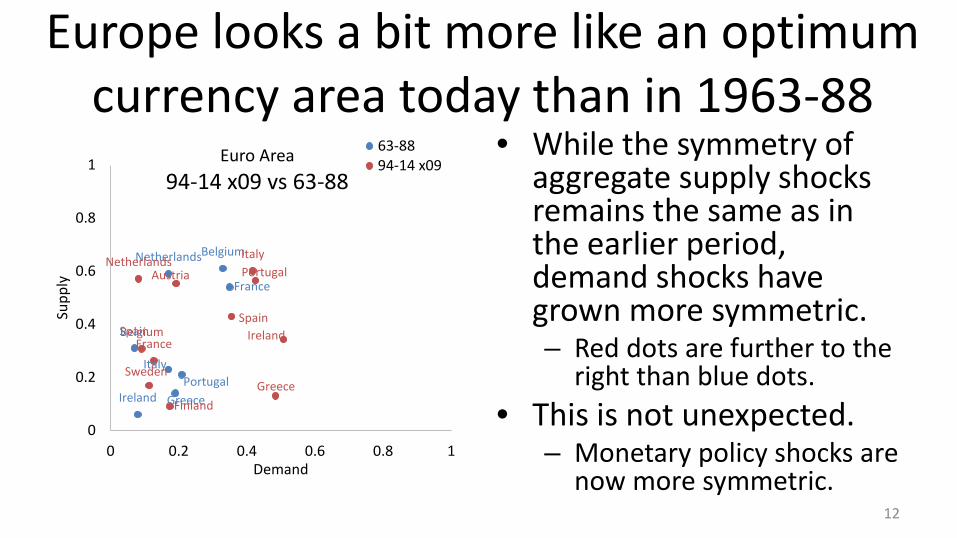
Europe looks a bit more like an optimum currency area today than in 1963-88
• While the symmetry of aggregate supply shocks remains the same as in the earlier period, demand shocks have grown more symmetric. – Red dots are further to the
right than blue dots. • This is not unexpected.
– Monetary policy shocks are now more symmetric.
12
France
Netherlands Belgium
Ireland
Italy
Spain
Portugal Greece
France
Netherlands
Belgium
Austria
Finland
Ireland
Italy
Spain
Portugal
Sweden Greece
0
0.2
0.4
0.6
0.8
1
0 0.2 0.4 0.6 0.8 1
Supp
ly
Demand
Euro Area 94-14 x09 vs 63-88
63-8894-14 x09
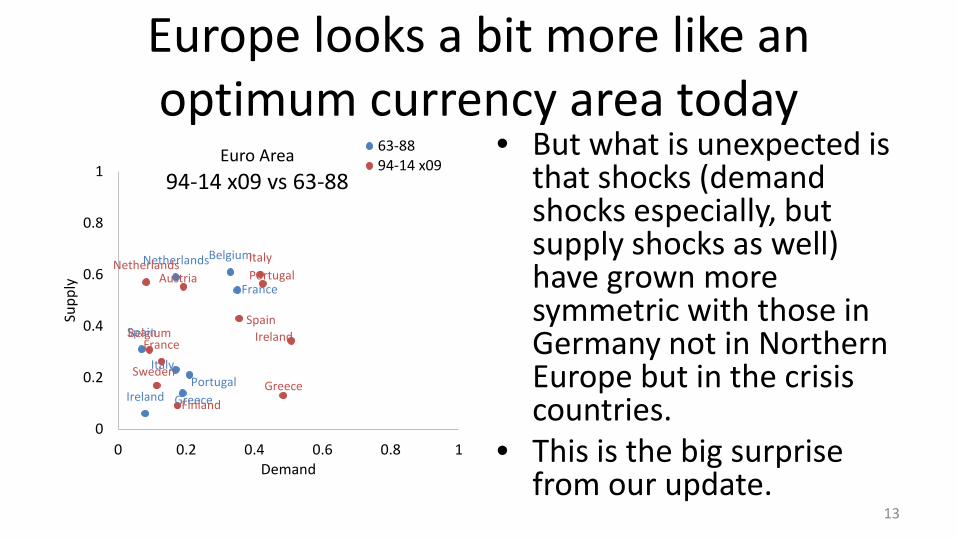
Europe looks a bit more like an optimum currency area today
• But what is unexpected is that shocks (demand shocks especially, but supply shocks as well) have grown more symmetric with those in Germany not in Northern Europe but in the crisis countries.
• This is the big surprise from our update.
13
France
Netherlands Belgium
Ireland
Italy
Spain
Portugal Greece
France
Netherlands
Belgium
Austria
Finland
Ireland
Italy
Spain
Portugal
Sweden Greece
0
0.2
0.4
0.6
0.8
1
0 0.2 0.4 0.6 0.8 1
Supp
ly
Demand
Euro Area 94-14 x09 vs 63-88
63-8894-14 x09
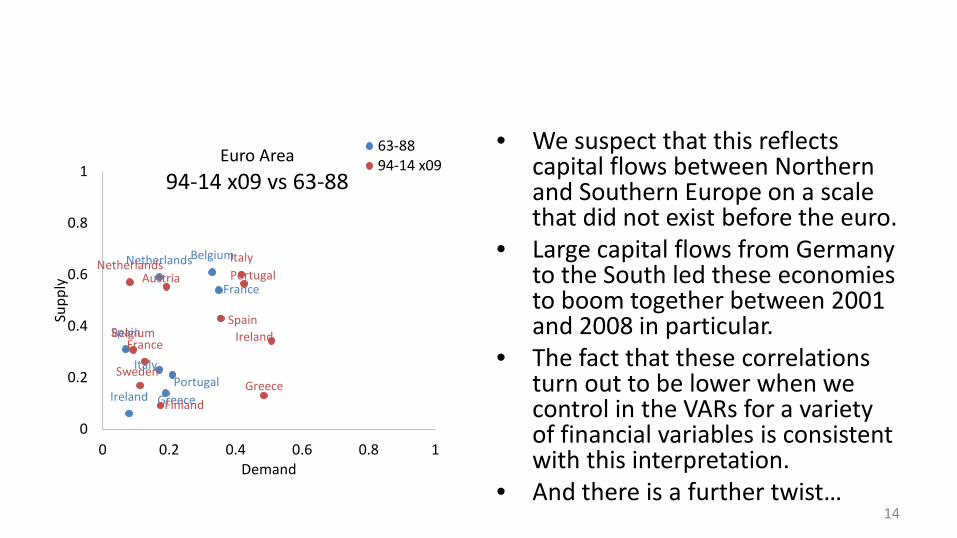
• We suspect that this reflects capital flows between Northern and Southern Europe on a scale that did not exist before the euro.
• Large capital flows from Germany to the South led these economies to boom together between 2001 and 2008 in particular.
• The fact that these correlations turn out to be lower when we control in the VARs for a variety of financial variables is consistent with this interpretation.
• And there is a further twist… 14
France
Netherlands Belgium
Ireland
Italy
Spain
Portugal Greece
France
Netherlands
Belgium
Austria
Finland
Ireland
Italy
Spain
Portugal
Sweden Greece
0
0.2
0.4
0.6
0.8
1
0 0.2 0.4 0.6 0.8 1
Supp
ly
Demand
Euro Area 94-14 x09 vs 63-88
63-8894-14 x09
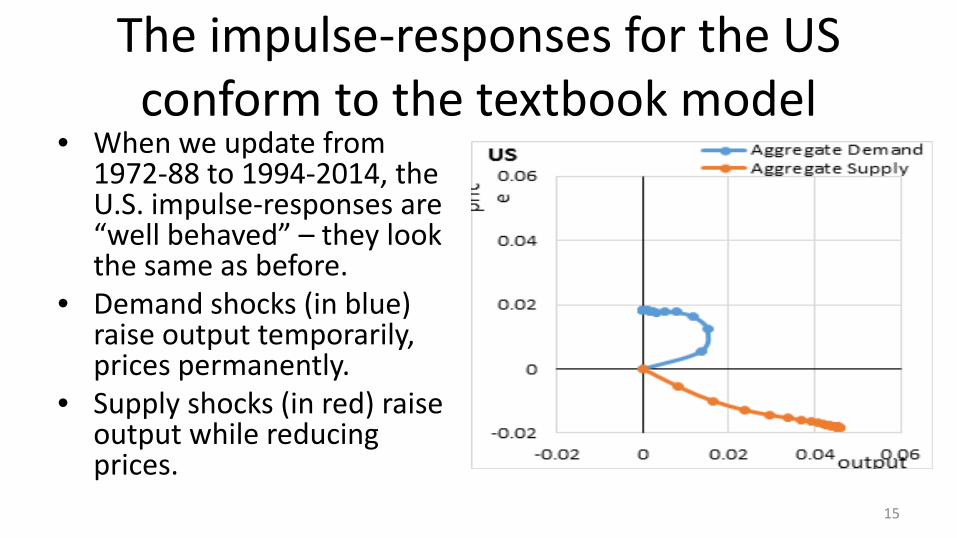
The impulse-responses for the US conform to the textbook model
• When we update from 1972-88 to 1994-2014, the U.S. impulse-responses are “well behaved” – they look the same as before.
• Demand shocks (in blue) raise output temporarily, prices permanently.
• Supply shocks (in red) raise output while reducing prices.
15
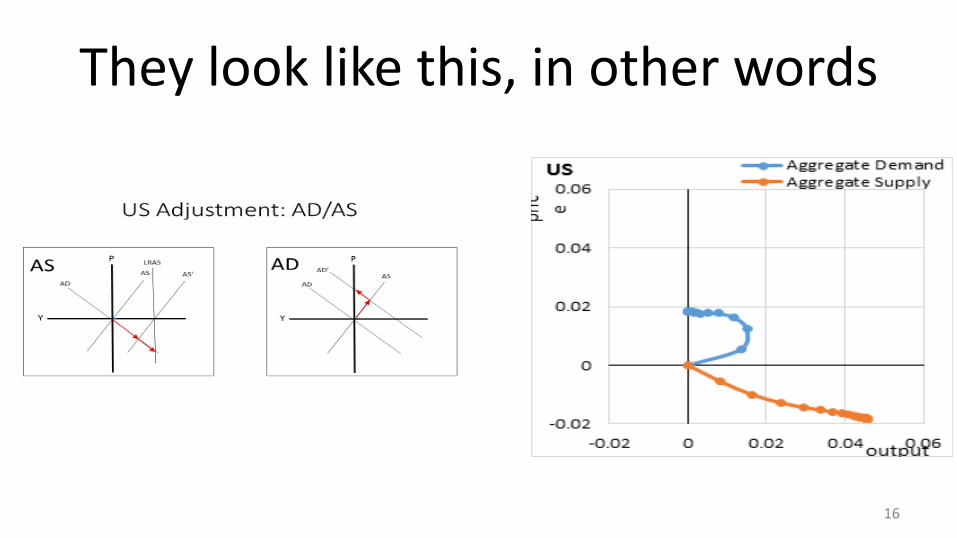
They look like this, in other words
16

In Europe, however, the impulse responses now look peculiar
• They were “well behaved” before the Euro (again, as at right).
• But now: – Positive supply shocks raise
output but also raise prices. • Where the textbook says
prices should go down. – Positive demand shocks
appear to reduce prices • Where textbook economics
say they should raise them. 17
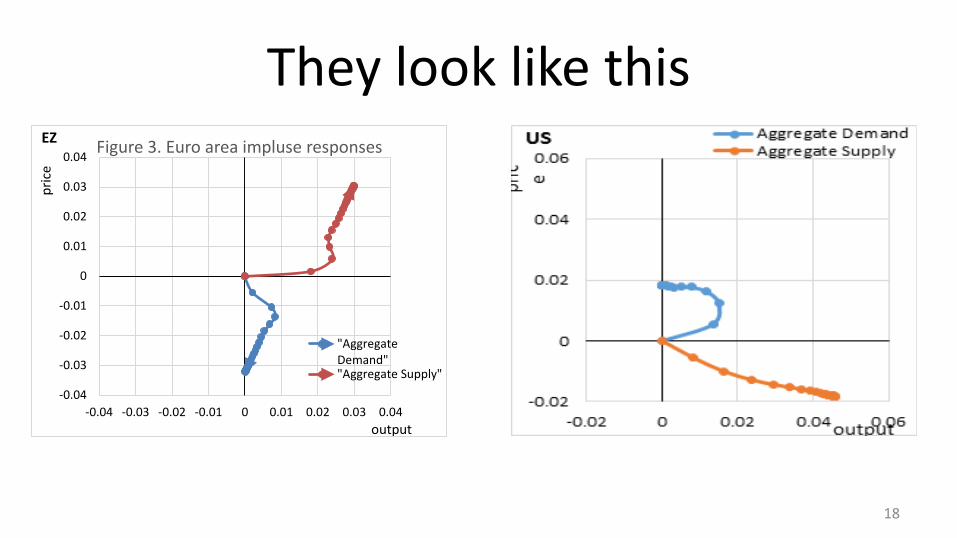
They look like this
18
-0.04
-0.03
-0.02
-0.01
0
0.01
0.02
0.03
0.04
-0.04 -0.03 -0.02 -0.01 0 0.01 0.02 0.03 0.04
Figure 3. Euro area impluse responses
"AggregateDemand""Aggregate Supply"
EZ
pric
e
output
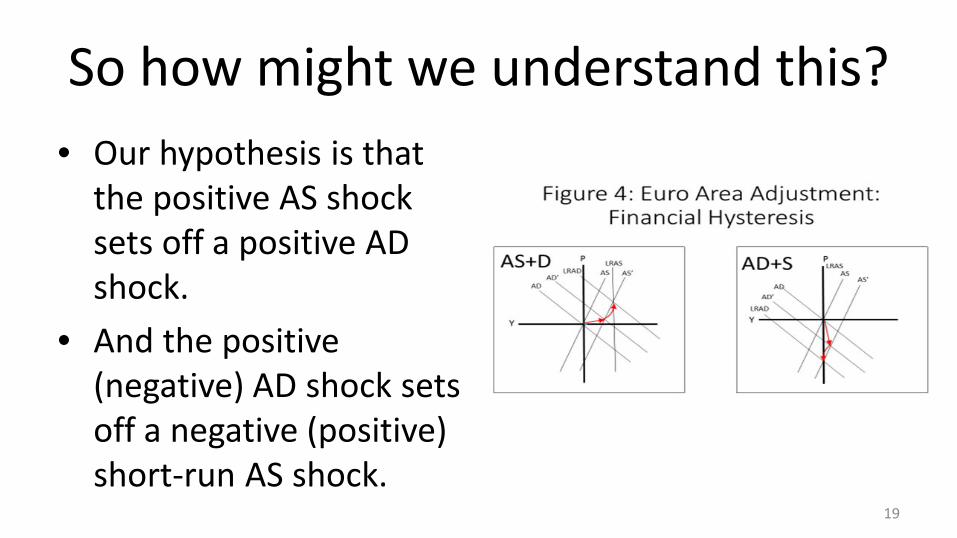
So how might we understand this? • Our hypothesis is that
the positive AS shock sets off a positive AD shock.
• And the positive (negative) AD shock sets off a negative (positive) short-run AS shock.
19
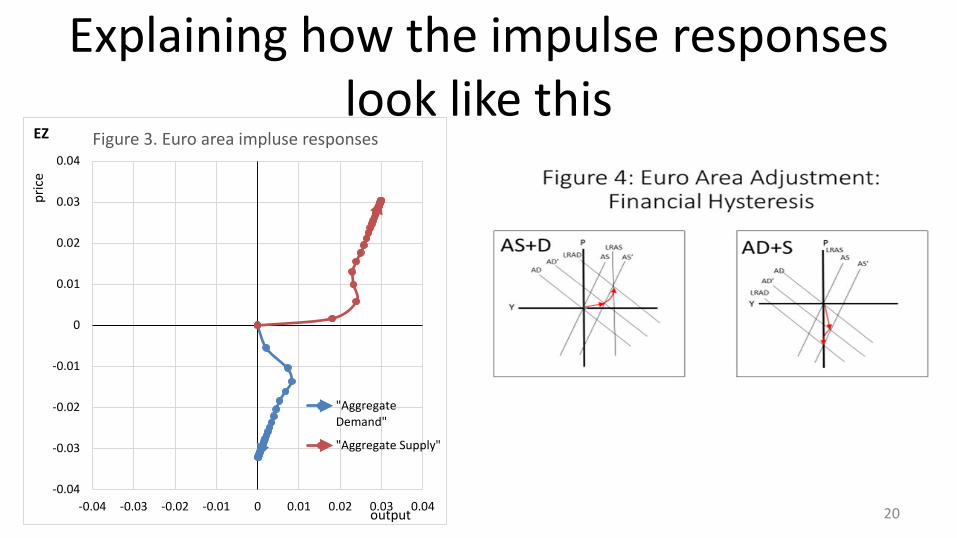
Explaining how the impulse responses look like this
20 -0.04
-0.03
-0.02
-0.01
0
0.01
0.02
0.03
0.04
-0.04 -0.03 -0.02 -0.01 0 0.01 0.02 0.03 0.04
Figure 3. Euro area impluse responses
"AggregateDemand"
"Aggregate Supply"
EZ
pric
e
output
Our hypothesis: hysteresis and the financial cycle
• The financial cycle means that positive supply shocks set off a financial response also affecting demand.
• And that positive demand shock is permanent, absent another shock (hence the hysteresis).
• Definition of hysteresis: “the dependence of the state of a system on its history.”
21
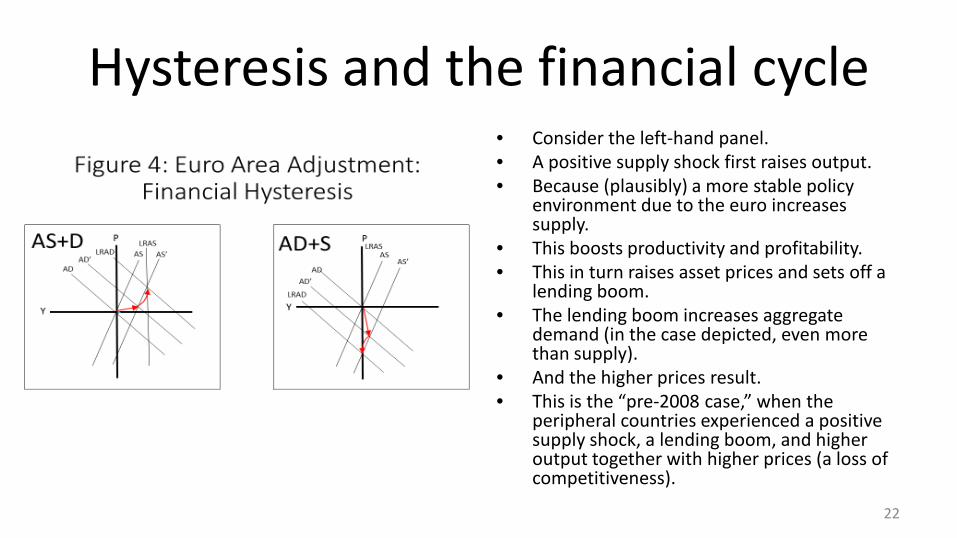
Hysteresis and the financial cycle
22
• Consider the left-hand panel. • A positive supply shock first raises output. • Because (plausibly) a more stable policy
environment due to the euro increases supply.
• This boosts productivity and profitability. • This in turn raises asset prices and sets off a
lending boom. • The lending boom increases aggregate
demand (in the case depicted, even more than supply).
• And the higher prices result. • This is the “pre-2008 case,” when the
peripheral countries experienced a positive supply shock, a lending boom, and higher output together with higher prices (a loss of competitiveness).

Hysteresis and the financial cycle
23
• Now run the experiment in reverse (“post 2008”).
• Think of a negative supply shock due to impairment of the financial system.
• Lower prices also mean an asset-price slump and therefore less lending.
• Demand falls along with supply (demand curve shifts to the left).
• The result is recession and deflation. Hysteresis implies that there is a permanent decline in output.
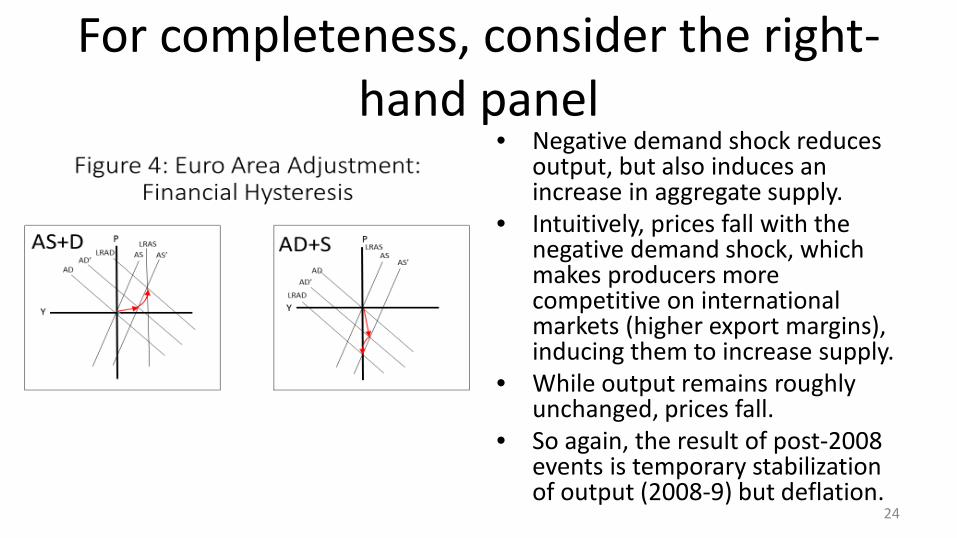
For completeness, consider the right-hand panel
24
• Negative demand shock reduces output, but also induces an increase in aggregate supply.
• Intuitively, prices fall with the negative demand shock, which makes producers more competitive on international markets (higher export margins), inducing them to increase supply.
• While output remains roughly unchanged, prices fall.
• So again, the result of post-2008 events is temporary stabilization of output (2008-9) but deflation.
Conclusion to Part 1 • It is no surprise that the Euro Area continues to
experience difficulties. • It remains further than the benchmark
represented by the United States from satisfying the preconditions for an Optimum Currency Area. – Shocks are still asymmetric. – Adjustment remains difficult (no fiscal federalism,
lower levels of labor mobility). 25
Conclusion to Part 1 • Moreover, the evidence suggests that while the € had
positive efficiency effects, that positive supply shock unleashed large capital flows between Northern and Southern Europe, inflating asset prices in the South.
• This lending boom boosted demand in Southern Europe, creating the mirage of prosperity but also leading to a permanent loss of competitiveness.
• Suggesting the need to do something about this capital-flow problem and its effects.
26

Introduction to Part 2 • So what can be done?
27

It would be nice to think that Europe could boldly complete its monetary union
• Meaning that it could: 1. Complement its single
monetary policy with a single fiscal policy (create a federal fiscal system).
2. Mutualize its debt. 3. Establish a true single labor
market. 4. Create a political union to
provide accountability for those making these Eurozone-wide fiscal, monetary and labor policies.
28
• But alas we know that this is not realistic. – There is no political appetite
for such ambitious steps. – Certainly not in the short run.
• Given this, can we imagine more limited steps that would be effective? – In other words, can monetary
union without political union be made to work, or if not should we give up the ghost?
29

I will argue that four steps, all of which
are possible without political union, suffice for survival of the euro
1. Establishing a normal central bank. 2. Completing the banking union. 3. Renationalizing fiscal policy. 4. Removing debt overhangs.
In what follows I will elaborate this argument. The starting point for doing so is by asking: how should we think about organizing the provision of monetary stability, financial stability and fiscal stability (which are what a workable monetary union requires)? 30

In thinking about provision, a useful framework is “club theory”
• When tastes are relatively homogenous, spillovers are significant and there are increasing returns to collective action, decision making should be centralized.
• But where spillovers are more limited and tastes are heterogeneous, responsibility should be decentralized. – Viz. James Buchanan, “An Economic Theory of Clubs,”
Public Choice(1965). – Viz. The Principle of Subsidiarity. – Let me now return to my four minimal conditions and how
they fit into this framework. 31
A normal central bank • I define a normal central bank as one able to pursue flexible inflation
targeting and to backstop banking systems and markets in government bonds, thereby protecting the euro area from potentially self-fulfilling crises.
• Theory and evidence argue strongly for centralized provision. – Spillovers of monetary policy and of doubts about the integrity of the euro
area are powerful. – Preferences over inflation are not that different (er….)
• This function was not provided initially. – The ECB’s two-pillar strategy focused on inflation and monetary aggregates
but not lender- and liquidity-provider-of-last resort functions. – Even inflation targeting was asymmetric. – In addition, the ECB concentrated on headline rather than core inflation,
causing it to raise interest rates in 2008 and 2011. 32
Things changed under Draghi • And with “do whatever it takes” in 2012.
– Outright Monetary Transactions to achieve it. • Symmetric inflation target.
– QE with capital key to achieve it. • Given this, what more is now needed to establish a normal
central bank? – Greater transparency commensurate with greater responsibility
and increase in the range of action. – A smaller and more nimble Governing Council able to move
more quickly.
33
A full-fledged banking union • The crisis has underscored how banking-system stability is a euro-
area-wide public good subject to strongly increasing returns (spillovers are powerful, in other words).
• One need only recall how lax regulation of French and German banks allowing these institutions to lend hand over fist to Southern European countries set the stage for the crisis, or how the subsequent problems of some banks then threatened to destabilize others via the interbank market.
• Experience has shown that this is an area where strongly increasing returns from centralized provision dominate any costs of uniformity. – As the point is sometimes put, monetary union without banking union
will not work.
34
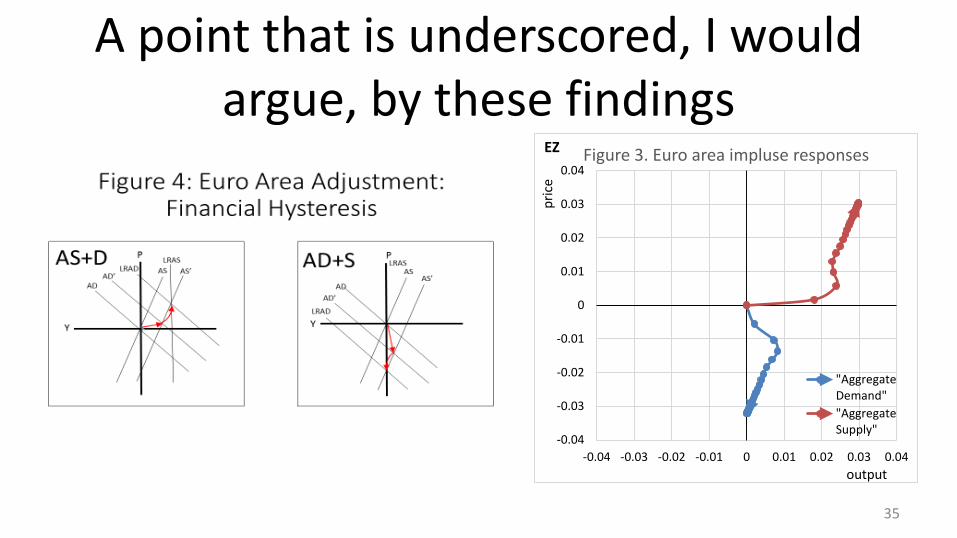
A point that is underscored, I would argue, by these findings
35
-0.04
-0.03
-0.02
-0.01
0
0.01
0.02
0.03
0.04
-0.04 -0.03 -0.02 -0.01 0 0.01 0.02 0.03 0.04
Figure 3. Euro area impluse responses
"AggregateDemand""AggregateSupply"
EZ
pric
e
output
Europe now has half a banking union • Single supervisor.
– But for biggest 130 banks only. – Adequacy of “federalized” supervision for other banks is
unclear. • Bank Recovery and Resolution Directive.
– But is it feasible? Has the Italian problem changed views? • And as yet no harmonized deposit insurance with a
common financial backstop.
36
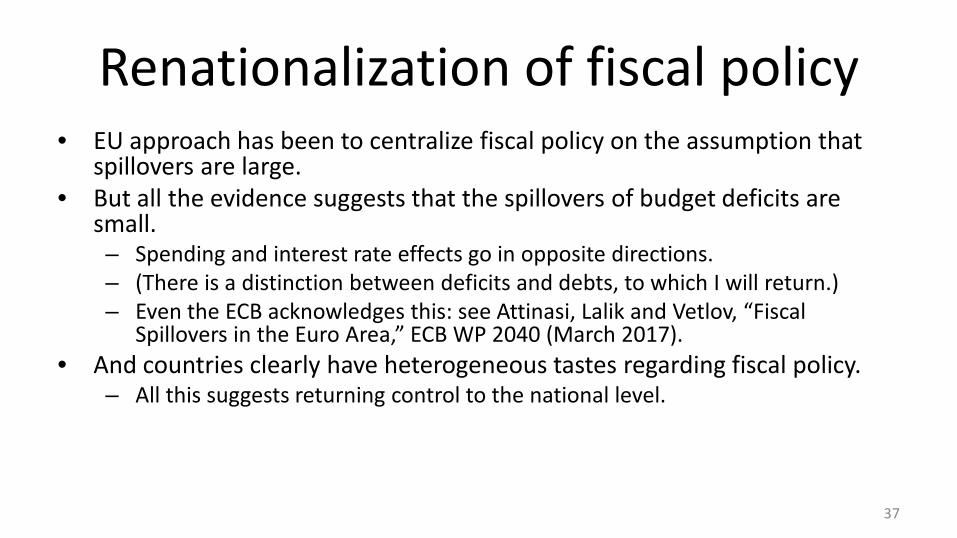
Renationalization of fiscal policy • EU approach has been to centralize fiscal policy on the assumption that
spillovers are large. • But all the evidence suggests that the spillovers of budget deficits are
small. – Spending and interest rate effects go in opposite directions. – (There is a distinction between deficits and debts, to which I will return.) – Even the ECB acknowledges this: see Attinasi, Lalik and Vetlov, “Fiscal
Spillovers in the Euro Area,” ECB WP 2040 (March 2017). • And countries clearly have heterogeneous tastes regarding fiscal policy.
– All this suggests returning control to the national level.
37
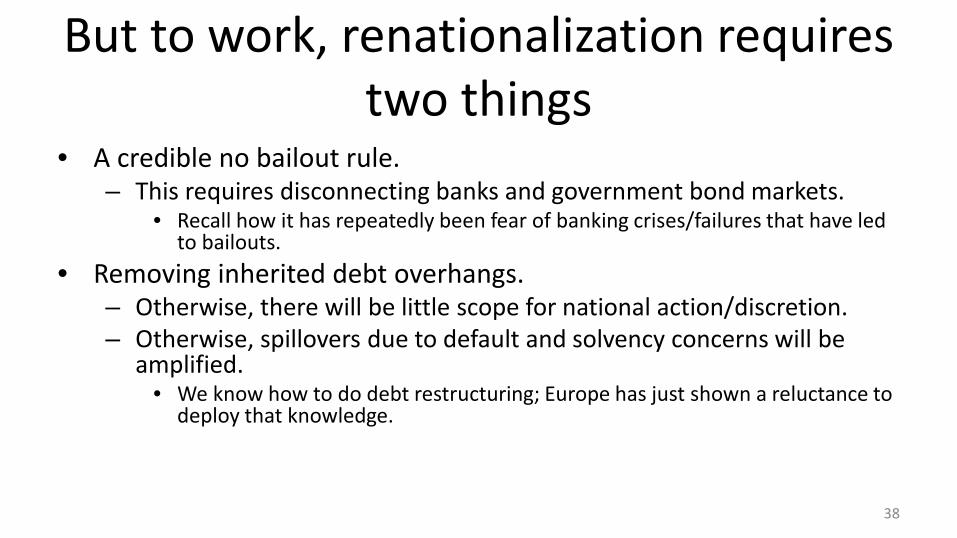
But to work, renationalization requires two things
• A credible no bailout rule. – This requires disconnecting banks and government bond markets.
• Recall how it has repeatedly been fear of banking crises/failures that have led to bailouts.
• Removing inherited debt overhangs. – Otherwise, there will be little scope for national action/discretion. – Otherwise, spillovers due to default and solvency concerns will be
amplified. • We know how to do debt restructuring; Europe has just shown a reluctance to
deploy that knowledge.
38

Conclusion • Does the Euro Area need more integration or
less integration?
39
Conclusion • Does the Euro Area need more integration or
less integration? • Answer: the Euro Area needs both. And club
theory suggests along what dimensions.
40
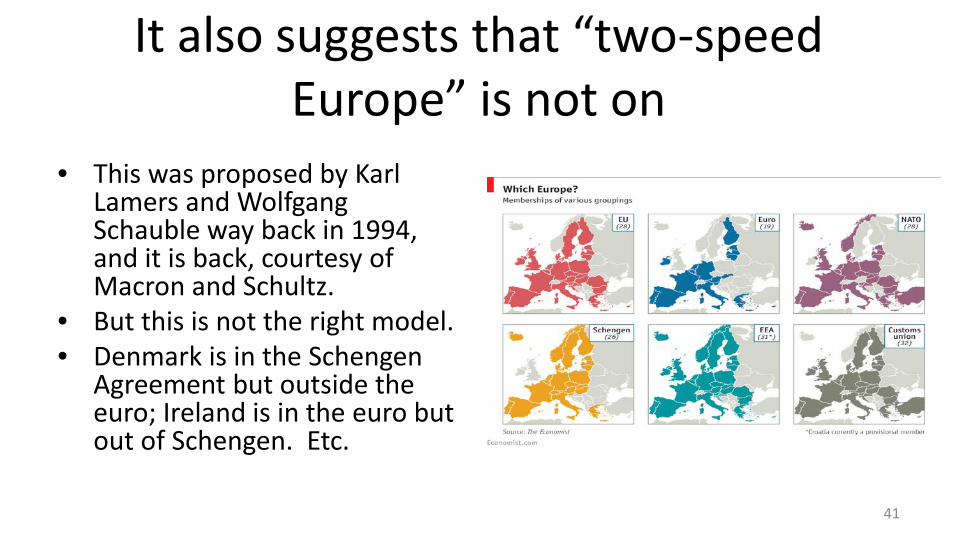
It also suggests that “two-speed Europe” is not on
• This was proposed by Karl Lamers and Wolfgang Schauble way back in 1994, and it is back, courtesy of Macron and Schultz.
• But this is not the right model. • Denmark is in the Schengen
Agreement but outside the euro; Ireland is in the euro but out of Schengen. Etc.
41

Instead, we are talking about flexible integration
• But not even the “5 Presidents Report” really discusses this possible.
• Even the term has fallen out of fashion.
• The question is why?
42

Answer: governance problems • A strengthened EU and euro area require greater accountability to
enhance the legitimacy of European integration and beat back the populist anti-EU reaction.
• But the European Parliament is not obviously an adequate vehicle for this. – It is remote to European voters. – It contains both countries in and out of the various clubs.
• Thomas Piketty and coauthors suggest a Eurozone Assembly to be established alongside the EP, to be made up of a selection of MEPs and a selection of national parliamentarians.
43
Problems • Two is not enough, given that the problem is not
simply euro ins and outs. • It assumes that national parliamentarians will have the
bandwidth and that national parliaments will rearrange their schedules.
• The EU actually tried this before 1979, when the EP was made up of national parliamentarians nominated by their countries. Shortcomings of that system was what led Europe to adopt today’s status quo.
44
Solution: Work within the framework of the European Parliament
• Different subgroups of members would vote on different issues, depending on country membership.
• If EP was endowed with additional power (to initiate legislation and reject a broader range of directives proposed by the Commission), voters would have less reason for apathy and more reason to pay attention.
45
Solution: Direct election of the President of the Commission
• Current system (where Council selects a candidate and the Parliament confirms) puts two layers of separation between the EU’s proto-executive and the people.
• Direct election becomes even more important as the president acquires executive powers (over inter alia foreign and security policy). – Objections: campaign in all 27 member states; linguistic
limitations. – But we have these problems in the US too.
46

• I am happy to take your questions.
47