bark and charcoal filters for greywater...
TRANSCRIPT

Bark and Charcoal Filters for Greywater Treatment
Pollutant Removal and Recycling Opportunities
Sahar Dalahmeh Faculty of Natural Resources and Agricultural Sciences
Department of Energy and Technology Uppsala
Doctoral Thesis Swedish University of Agricultural Sciences
Uppsala 2013

Acta Universitatis Agriculturae Sueciae
2013:51
ISSN 1652-6880 ISBN: (Print version) 978-91-576-7840-9 ISBN: (Electronic version) 978-91-576-7841-6 © 2013 Sahar Dalahmeh, Uppsala Print: SLU Service, Uppsala 2013

Bark and Charcoal Filters for Greywater Treatment. Pollutant Removal and Recycling Opportunities
Abstract Water scarcity, inappropriate sanitation and wastewater pollution are critically important global issues. Greywater is a sustainable water source for recycling, so this thesis examined simple, robust, low-cost alternatives for on-site treatment of greywater to irrigation water quality. Laboratory-scale pine bark, activated charcoal and sand filters were evaluated as regards their pollutant removal and interactions between medium properties, greywater, microbial activity and bacterial community structure. The effects of hydraulic and organic loading rates (HLR and OLR) were described by general regression models (GRM). The quality of the treated greywater was evaluated against Jordanian standards for irrigation water. A series of experiments examined treatment of artificial greywater in terms of lowering biochemical oxygen demand (BOD5), chemical oxygen demand (COD), phosphorus (Tot-P), nitrogen (Tot-N) and pathogen indicators (total thermotolerant coliforms) and tracer microorganisms (enterohaemorrhagic Escherichia coli (EHEC) and bacteriophage PhiX). Following greywater loading, all filter materials developed biofilms with high bacterial diversity and richness. The driving force shaping bacterial communities in bark material was its organic composition and low pH, while the communities in the charcoal and sand filters were more influenced by the greywater. The GRM indicated that the performance of all filters was influenced by the HLR and OLR of the present and previous runs. The organic matter content and surface and hydraulic properties of the bark filters resulted in high BOD5 removal rates (94-99%), even at increased HLR and OLR, but accompanied by release of dissolved organic substances originating from the bark itself. High nitrification occurred in the bark filters in all loading regimes tested, but with low Tot-N removal. The bark filters demonstrated 1-3 log10 removal of microorganisms, but bark organic nature made its filters more vulnerable to biodegradation and disintegration. The charcoal had large specific surface area, which provided the capacity for intermediate-high removal of BOD5 (83-97%), Tot-N (50-98%) and Tot-P (64-98%), but removal of microorganisms was poor. The sand filters demonstrated low BOD5 removal (67-91%) and high nitrification, but low nitrogen removal. Greywater treatment by bark and charcoal filters reduced their organics content to acceptable irrigation levels. Nitrogen and microorganisms must be further reduced to meet Jordanian standards on treated wastewater for irrigation.
Keywords: bacterial diversity, biofilm, BOD5, COD, hydraulic loading, irrigation,
nitrogen, organic loading, organic matter, respiration.
Author’s address: Sahar Dalahmeh, SLU, Department of Energy and Technology P.O. Box 7032, SE-750 07 Uppsala, Sweden. E-mail: [email protected]

Dedication
To the microbiologist who dedicated his PhD thesis to civil engineers who truly want to learn some microbiology.

Content
List of Publications 7
Abbreviations 9
1 Introduction and outline 11 1.1 Introduction – water scarcity and wastewater pollution 11 1.2 Objectives 13 1.3 Strategy of the study 14
2 Greywater pollution and treatment requirement for irrigation 17 2.1 Greywater pollution 17 2.2 Greywater for irrigation 18
3 Effects of filter medium properties 21 3.1 Effects of surface properties on pollutant removal capacity 21 3.2 Effects of hydraulic properties on pollutant removal capacity 26
4 Microbial activity, diversity and composition 29 4.1 Biological activities 31
4.1.1 Organic matter mineralisation and potential respiration 31 4.1.2 Nitrogen transformation and removal 34
4.2 Bacterial diversity 36
5 Loading conditions and treatment capacity 39 5.1 Hydraulic loading rate 40 5.2 Organic loading rate 42 5.3 Intermittent loading 44 5.4 Treatment capacity of the filters 45 5.5 Service life of the filters 47
6 Recycling opportunities and constraints 49 6.1 Water for irrigation 49 6.2 Organic matter 50 6.3 Nutrient availability 52 6.4 Hygienic quality 53 6.5 Recycling of spent medium 54

7 Conclusions and perspectives 57 7.1 Greywater pollution and treatment requirement 57 7.2 Effects of medium properties 57 7.3 Effects of microbial activity, diversity and composition 58 7.4 Effects of loading conditions and treatment capacity 58 7.5 Recycling opportunities and constraints 59 7.6 Future perspectives 59
Acknowledgments 61
References 63

7
List of Publications
This thesis is based on the work contained in the following papers, referred to by Roman numerals in the text:
I Dalahmeh, S.S., Hylander, L.D., Vinnerås, B., Pell, M., Öborn, I., Jönsson, H. (2011). Potential of organic filter materials for treating greywater to achieve irrigation quality: A review. Water Science and Technology 63(9), 1832-1840.
II Dalahmeh, S., Pell, M., Vinnerås, B., Hylander, L., Öborn, I., Jönsson, H. (2012). Efficiency of bark, activated charcoal, foam and sand filters in reducing pollutants from greywater. Water, Air, & Soil Pollution 223(7), 3657-3671.
III Dalahmeh, S.S., Jönsson, H., Hylander, L., Hui, N., Pell, M. Dynamics and functions of bacterial communities in bark, charcoal and sand filters treating greywater (manuscript).
IV Dalahmeh, S.S, Pell, M., Hylander, L., Lalander, C., Vinnerås, B., Jönsson, H. Greywater treatment using bark, charcoal and sand filters - response to changing hydraulic and organic loading rates (manuscript).
V Lalander, C., Dalahmeh, S., Vinnerås, B., Jönsson, H (2013). Hygienic quality of artificial greywater subjected to aerobic treatment - a comparison of three filter media at increasing organic loading rates Environmenal Technology, DOI:10.1080/09593330.2013.783603.
Papers I, II and V are reproduced with the kind permission of the publishers.
8
The contribution of Sahar Dalahmeh to the papers included in this thesis was as follows:
I Participated in planning the work, conducted the literature review and had the main responsibility for writing the manuscript.
II Participated in planning the experiment and conducted the laboratory work. Interpreted the data together with the co-authors. Had the main responsibility for writing the manuscript, including production of the illustrations.
III Contributed to planning the experiment and conducted all the laboratory work except the DNA sequencing and preparation of the gene library. Interpreted the data together with the co-authors and had the main responsibility for writing the manuscript, including production of the illustrations.
IV Participated in planning the experiment and conducted the laboratory work. Interpreted the data together with the co-authors. Had the main responsibility for writing the manuscript, including production of the illustrations.
V Conducted the chemical analysis, wrote part of the methods section and participated in revisions of the manuscript.

9
Abbreviations
ANOVA Analysis of variance
BOD5 Biochemical oxygen demand CEC Cation exchange capacity COD Chemical oxygen demand DNA Deoxyribonucleic acid D10 Particle size at which 10% of the material is finer D60 Particle size at which 60% of the media is finer E. coli Escherichia coli
EHEC Enterohaemorrhagic Escherichia coli GRM General regression models
HLR Hydraulic loading rate HLRi Hydraulic loading rate during present measuring run HLRi-1 Hydraulic loading rate during previous measuring run MBAS Methylene blue active substances MENA Middle East and North Africa NMS Non-metric multidimensional scaling NH4
+-N Ammonium nitrogen NO3
–-N Nitrate nitrogen OLR Organic loading rate OLRi Organic loading rate during present measuring run OLRi-1 Organic loading rate during previous measuring run OTU Operational taxonomic units PAST Palaeontological statistics PTC Potential treatment capacity TOC Total organic carbon Tot-N Total nitrogen Tot-P Total phosphorus TSS Total suspended solids TTC Total thermotolerant coliforms

11
1 Introduction and outline
1.1 Introduction – water scarcity and wastewater pollution
Water is a basic need not only for human survival but also for socio-economic development. Globally, water use increased six-fold during the twentieth century and by the year 2025 about 1.8 billion people will live under absolute water scarcity conditions, i.e. with an annual water supply of less than 500 m3 per capita, and two-thirds of the world’s population will experience water stress, i.e. will have an annual water supply of less than 1700 m3 per capita (UN-Water, 2006). By 2030, the planet will host 8 billion people (World Bank, 2010), with the highest growth expected in developing countries, where 82% of the world’s population already lives and experiences water scarcity. As a consequence, the demand for water will increase in these countries and water availability for irrigation will be a limiting factor for food production (FAO, 2007).
Freshwater scarcity is a reality in many regions of the world today, e.g. the Middle East and North Africa (MENA). While MENA is home to more than 5% of the world’s population, only 1% of the globally accessible water is available in this region (Redwood, 2010). The annual per capita water share in MENA is about 1200 m3, while the global average is 7000 m3. Considering the population growth and climate change, the annual per capita water share in MENA will decrease to 500-750 m3 by 2050 (Immerzeel et al., 2011).
No matter how scarce or abundant fresh water is, it is used for daily household activities and after this it becomes wastewater. Household wastewater is composed of blackwater and greywater. Blackwater is the wastewater coming from toilets (faeces, urine, possible toilet paper and flushwater). Greywater is all household wastewater excluding blackwater. This means that greywater includes water from bathtubs, showers, hand basins, kitchen sinks and laundry.

12
Wastewater management is an issue of concern. Worldwide, 2.5 billion people (37% of the world’s population) do not have access to adequate sanitation (WHO/UNICEF, 2012). The inadequate provision of sanitation and wastewater disposal facilities leads to environmental and public health problems and 1.8 million people die every year from diarrheal diseases (Corcoran et al., 2010; WHO, 2008).
Centralised wastewater systems, transporting wastewater to a central wastewater treatment plant, are common in industrialised countries and in some large cities in less industrialised countries. Centralised systems require complex infrastructure and are expensive to construct and operate. In low and middle income countries, lack of expertise, limited financial resources and prioritisation of water supply over sanitation lead to essentially no wastewater receiving treatment before being disposed of (Scott et al., 2004; WHO, 2003) or reused (Jimenez et al., 2010).
Treating wastewater properly before disposal or reuse is not a luxury but a necessity to protect public health, the environment and water resources. One way to achieve proper treatment can be by source separation, local treatment and utilisation of wastewater fractions (urine, faeces and greywater) for crop production. The World Health Organization Guidelines for safe use of wastewater, excreta and greywater highlight the reliability of greywater in alleviating water scarcity, especially for irrigation (WHO, 2006). The reliability of greywater stems from the fact that it is a constant water source, contains plant nutrients and has a comparatively low concentration of pathogens compared with mixed wastewater and blackwater.
Greywater treatment using filters of various carrier materials with different filter pore sizes is a common approach for cleaning greywater. Macropore filters, including simple strainer and mesh filters (Christova-Boal et al., 1996), nylon sock filters (March et al., 2004), gravel filters (Al-Hamaiedeh & Bino, 2010) and sand filters (Suleiman et al., 2010; Friedler & Hadari, 2006), have been used for greywater treatment. Macropore size ranges from 1-5 mm for coarse pores and 0.075-1 mm for fine pores (Beven & Germann, 1982). Generally, coarse macropore filters retain particles and hair, but are not a complete barrier against suspended pollutants, and hence the turbidity, chemical properties and organic loading of the influent are only marginally lowered, which may lead to biological growth in recycling system (Christova-Boal et al., 1996). Besides the effluent quality, frequent cleaning and replacement requirement pose other obstacles with filters relying only on straining. Micro and ultra membrane filters, with pore size 0.1 m, have been used for greywater treatment (Ramona et al., 2004; Ahn et al., 1998). Microfiltration and ultrafiltration purify greywater to unrestricted use standards

13
(Ramona et al., 2004). However, fouling and energy consumption are issues of concern (Nghiem et al., 2006), which makes membrane technology economically unfeasible at present for greywater treatment (Friedler & Hadari, 2006), at least not in small-scale applications in low and middle income countries.
Sand filters, which are within the fine macropore range, are the most commonly applied filters for on-site treatment of greywater (Burnat & Eshtaya, 2010; Suleiman et al., 2010; Friedler & Hadari, 2006) and domestic wastewater (EPA, 2002; Pell, 1991). Besides the physical filtration through the sand, an active biofilm develops. It is attached to the sand particle surfaces and mineralize organic matter from the wastewater (Rodgers et al., 2005). Clogging of sand filters is a major problem (Spychała & Błazejewski, 2003). The high bulk density of the sand means large efforts are required for transporting virgin sand and recycling or disposing of spent sand.
While having the same particle size and uniformity coefficient as sand, pine bark and charcoal are distinguished by larger specific surface area, higher porosity, lower density and higher organic content than sand (Paper II). Bark and charcoal have been shown to have a large capacity for adsorption of heavy metals (Argun et al., 2009; Babel, 2004) and organic compounds (Li et al., 2010; Mukherjee et al., 2007; Haussard et al., 2003; Ratola et al., 2003). These properties of bark and charcoal are believed to indicate high capacity for greywater treatment, with lower risk of clogging and easy transportation, which needs to be confirmed experimentally.
1.2 Objectives
The overarching aim of this thesis was to provide detailed information on the performance of simple, robust and low-cost alternatives for on-site treatment of greywater. The main research aim was to determine the potential of pine bark (bark), activated charcoal (charcoal) and sand (sand) filters for removal of organic pollutants and pathogens in order to yield water suitable for irrigation, considering also nitrogen and phosphorus. Specific objectives were to: Assess the need for treatment of greywater prior to irrigation. Investigate the treatment capacity of bark, charcoal and sand filters in
removal of organic matter, nitrogen, phosphorus and, indicator and tracer microorganisms in relation to their properties.
Describe microbial activity, bacterial diversity and composition in the filters and their effects on organic matter reduction and nitrogen transformation.

14
Analyse the response of the filters to variable hydraulic and organic loading regimes, in terms of removal capacity of organic matter, nitrogen, phosphorus and microorganisms in bark, charcoal and sand filters.
Explore the recycling opportunities and constraints of the treated greywater and the spent medium.
The work to achieve these specific objectives is reported in Papers I-V and the results are combined and discussed in this thesis in the following five chapters: (Ch. 2) Greywater pollution and treatment requirement for irrigation (Paper I); (Ch. 3) Effects of medium properties (Papers II, IV and V); (Ch. 4) Microbial activity, diversity and composition (Papers II, III and IV); (Ch. 5) Loading conditions and treatment capacity (Papers I, II, IV and V); (Ch. 6) Recycling opportunities and constraints (Papers II, IV and V). Some general conclusions and perspectives are presented in Ch. 7.
1.3 Strategy of the study
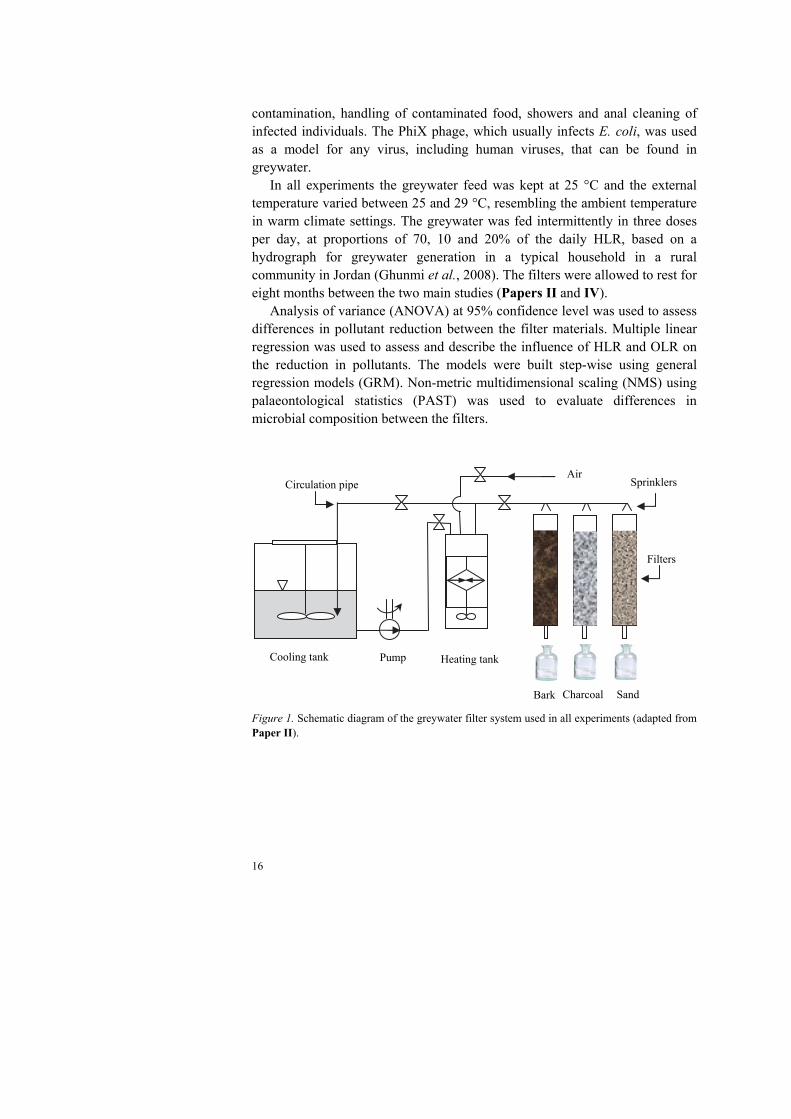
The thesis work started with a literature review to identify the problematic components of greywater and its impact on soil, plant and health, and hence to assess the need for greywater treatment prior to its use for irrigation (Paper I). The review included investigation of the potential of organic and agricultural by-products, among them bark, as a potential filter medium for greywater treatment (Paper I). Based on the findings in Paper I, a laboratory experiment was carried out to test the treatment performance of bark, charcoal, foam and sand filters under controlled conditions. For this, column filters (20 cm diameter and 60 cm deep) consisting of bark, charcoal, foam and sand were prepared (Paper II). Prior to being packed into the vertical columns the materials, except the foam, were sieved to all have similar effective particle size distribution (Figure 1). The different media were characterised for pH, loss on ignition, particle density and specific surface area according to the methods reported in Paper II. The filters were also characterised for porosity, hydraulic conductivity and hydraulic residence time (Paper II). The performance of the foam medium proved inferior to that of the other materials, and it was therefore omitted from the subsequent studies.
The hydraulic properties and specific surface properties of bark, charcoal and sand all differed. In order to understand the influence of medium properties on the physical-chemical treatment capacity, as presented in Paper II, and the biofilm and biological activity development, as presented in Paper III, the performance of the filters in terms of pollutant removal was studied at constant

15
hydraulic loading rate (HLR) of 32 L m-2 day-1 and an organic loading rate (OLR) of 14 g BOD5 m-2 day-1. For the purposes of analysing pollutants removal from greywater during the start-up and initial steady state operation, influent and effluent water samples were collected and total suspended solids (TSS), biochemical oxygen demand (BOD5), chemical oxygen demand (COD), total organic carbon (TOC), methylene blue active substances (MBAS), ammonium nitrogen (NH4
+-N), nitrate nitrogen (NO3–-N), total nitrogen (Tot-
N), phosphate (PO4-P), total phosphorus (Tot-P), total thermotolerant coliforms (TTC) and Enterococcus spp. were analysed (Paper II). For the purposes of evaluating differences in potential biofilm performance and microbial community structure between bark, charcoal and sand filters, samples of filter media were collected from 0, 20, 40 and 60 cm depth in each filter every two weeks and analysed for respiration activity and bacterial composition by 16S rRNA genes followed by 545 pyrosequencing (Paper III).
As greywater flows and composition vary daily, weekly and seasonally, and sometimes even cease completely, e.g. in summer cottages. Filters for on-site greywater treatment should integrate the composition and loading patterns of the expected greywater with the properties of the medium used. To achieve this, the effects of variable hydraulic and organic loading on BOD5, COD, Tot-N and Tot-P removal (Paper IV), as well as removal of TTC and added tracer enterohaemorrhagic Escherichia coli (EHEH) and the bacteriophage PhiX 174 (Paper V), were studied. The filters were fed with artificial greywater, first with increasing HLR of 32-128 L m-2 day-1 and then with increasing OLR of 14-76 g BOD5 m
-2 day-1. Artificial greywater was used in all experiments (Papers II-V). The
artificial greywater was mixed with 4% (v/v) real wastewater to inoculate it with bacterial flora and insure presence of bacterial populations similar to these found in real greywater. The artificial greywater used covered a wide range of levels of organic matter, nitrogen and phosphorus . These levels can be found in natural greywater under different circumstances (Table 1). The quality of the artificial water agreed well with greywater from low (Halalsheh, 2008; Bongumusa, 2007), medium (Morel & Diener, 2006) and high water consumption settings (Vinnerås et al., 2006). Most of the pollutants in the artificial greywater were in dissolved form, and therefore the suspended solids content was low (Table 1). Low total suspended solids (TSS) content can occur in natural greywater, which according to Jefferson et al. (2000) has organic strength comparable with wastewater, but has relatively low suspended solids. This greywater also resembles greywater primarily treated in a settling tank. EHEC and PhiX phage are usually not found in greywater. However, outbreaks of EHEC might result in high bacterial numbers in greywater due to faecal
16
contamination, handling of contaminated food, showers and anal cleaning of infected individuals. The PhiX phage, which usually infects E. coli, was used as a model for any virus, including human viruses, that can be found in greywater.
In all experiments the greywater feed was kept at 25 °C and the external temperature varied between 25 and 29 °C, resembling the ambient temperature in warm climate settings. The greywater was fed intermittently in three doses per day, at proportions of 70, 10 and 20% of the daily HLR, based on a hydrograph for greywater generation in a typical household in a rural community in Jordan (Ghunmi et al., 2008). The filters were allowed to rest for eight months between the two main studies (Papers II and IV).
Analysis of variance (ANOVA) at 95% confidence level was used to assess differences in pollutant reduction between the filter materials. Multiple linear regression was used to assess and describe the influence of HLR and OLR on the reduction in pollutants. The models were built step-wise using general regression models (GRM). Non-metric multidimensional scaling (NMS) using palaeontological statistics (PAST) was used to evaluate differences in microbial composition between the filters.
Figure 1. Schematic diagram of the greywater filter system used in all experiments (adapted from Paper II).
Air
Heating tank Pump Cooling tank
Sprinklers Circulation pipe
Bark Charcoal Sand
Filters

17
2 Greywater pollution and treatment requirement for irrigation
2.1 Greywater pollution
Greywater accounts for 60-70% of total wastewater in households with a flush toilet (Friedler & Hadari, 2006), with daily generation rates usually ranging from 30 to 120 L capita-1 in low and middle income countries (Morel & Diener, 2006). The concentrations of salts, solids, organic matter, nitrogen, phosphorus and pathogens in greywater vary widely (Christova-Boal et al., 1996) depending on e.g. country, location, personal habits and cleaning products used in the home.
The organic matter content in greywater ranges between 13 and 8000 mg COD L-1 (Eriksson, 2002). The organic material originates from detergent, food, dirt and skin residues and is highly degradable under both aerobic (84%) and anaerobic (72%) conditions (Zeeman et al., 2008). The nitrogen content can range from 0.6 to 74 mg L-1, as reviewed by Eriksson et al. (2002), which is low compared with household wastewater. Greywater with high nitrogen concentrations has also been reported (Halalsheh, 2008). The phosphorus level depends on whether phosphorus-containing detergents are used, or prohibited by local or regional regulations. Phosphorus levels are within 4-14 mg P L-1 in non-phosphorus detergent greywater and 6-23 mg P L-1 in areas where phosphorus-containing detergents are still in use (Eriksson et al., 2002). Greywater can be contaminated with E. coli, Enterococcus, Salmonella and enteropathogenic E. coli (EPEC) (O’Toole et al., 2012; Ottoson & Stenstrom, 2003; Rose, 1991) and enteric viruses such as norovirus and rotavirus (O’Toole et al., 2012). Faecal contamination is the major source of E. coli and Enterococcus (Christova-Boal et al., 1996), while Salmonella can be introduced into kitchen wastewater during food handling (WHO, 2006).

18
2.2 Greywater for irrigation
While greywater is a reliable source for irrigation, its use without treatment may pose hazards to the environment and to public health because of its content of organic and chemical compounds, as well as pathogens. Although the organic matter content in greywater adds to the soil organic matter content, excessive release of untreated greywater including fat and surfactants has been reported to negatively affect soil and plants (Travis et al., 2010; Shafran, 2006; Abu-Zreig et al., 2003), causing hydrophobic soil phenomena (Paper I; Shafran et al. 2006), plant toxicity (Paper I; Shafran et al., 2006) and production of malodorous compounds (Eriksson, 2002). In hydrophobic soils, the water retention capacity is low, and thus the water availability for plants is restricted, causing wilting effects. Blockage of irrigation pipes is another operating problem caused by solids, organics and fat in greywater (Paper I). Moreover, irrigation might not occur every day, and thus greywater storage might be needed. Storage of untreated greywater is aesthetically disturbing due to development of malodorous compounds (Paper I). Storing greywater for 48 hours causes rapid degradation of the organic material, accompanied by generation of offensive odours, growth of indicator bacteria, survival of Salmonella and Shigella and mosquito breeding (WHO, 2006; Dixon et al., 2000; Christova-Boal et al., 1996; Rose, 1991). Health threats due to potential pathogen contamination are a major concern. The microbial health risks of greywater may arise upon use (Rose et al., 1991) either by direct physical contact or indirectly by transmission of pathogens from irrigated crops to consumers (WHO, 2006). While nitrogen and phosphorus are considered valuable for fertilisation, if greywater has high content of these the excess nutrients can leach into the environment and cause eutrophication or groundwater contamination. Regulations for wastewater disposal and recycling are set to protect the environment and public health, which means that low levels of organics, nutrients and indicator organisms are required in greywater intended for recycling (Table 1).
In conclusion, greywater with high concentrations of organic matter and pathogenic indicators requires treatment to avoid risk to environmental and health threats, and to comply with disposal and recycling regulations.

19 T
able
1. Q
uali
ty o
f the
art
ific
ial g
reyw
ater
use
d in
this
thes
is, g
reyw
ater
qua
lity
val
ues
repo
rted
in th
e li
tera
ture
and
cri
teri
a fo
r re
cycl
ing
of w
aste
wat
er fo
r
irri
gatio
n in
diff
eren
t cou
ntri
es
Par
amet
er
Art
ific
ial g
reyw
ater
G
reyw
ater
U
SA-E
PA
Jo
rdan
E
U
Ital
y A
ustr
alia
Rec
ycli
ng o
ptio
n
R
estr
icte
d ir
riga
tion
Coo
ked
vege
tabl
es
Dis
char
ge f
rom
urb
an
was
tew
ater
trea
tmen
t fa
cili
ties
Irri
gati
on
Sur
face
ir
riga
tion
pH
6.9-
8.3
6.3-
8.35
a 6-
9 6-
9
6-9.
5
SS
(m
g L
-1)
113
76-1
396 a
50
35
10
30
BO
D5
(mg
L-1
) 12
6-13
90
129-
2287
a
10
30
25
20
20
CO
D (
mg
L-1
) 42
0-48
00
13-8
000b
10
0 12
5 10
0
Tot
-N (
mg
L-1
) 25
-241
25
-211
ac
45
15
15
Tot
-P (
mg
L-1
) 1.
7-10
.2
2.4-
27 a
c
30
1-2
2
E.c
oli (
MP
N 1
00m
L-
1 )
2×10
5 c
10
0
10
10
FC
(C
FU
100
mL
-1)
T
TC
: 4.3
0x10
4 -6.0
9x10
6 -
EH
EC
: 1.0
x108 -4
.3x1
08
Phi
X: 2
.7x1
06 -8.1
x106
PF
U 1
00m
L-1
104 -1
08 a
0
Sou
rce
Pap
ers
II-V
US
EP
A
(200
4)
JIS
M
(200
6)
The
Cou
ncil
of
the
Eur
opea
n C
omm
unit
ies
(199
1)
Cha
illo
u et
al
. (20
11)
Cha
illo
u et
al
. (20
11)
a Mor
el &
Die
ner
(200
6)
b Eri
ksso
n et
al.
(200
9)
c Hal
alsh
eh (
2008
)


21
3 Effects of filter medium properties
Filter medium acts as a substrate for physical filtration, physico-chemical adsorption and microbial growth. Medium properties such as particle size and distribution, specific surface area, surface chemical composition and porosity affect the removal capacity of pollutants. Adsorption, which is known to remove organic matter, NH4
+-N, PO4-P and bacteria, is influenced by grain size and surface characteristics of the medium (Stevik et al., 1999). Grain size determines the specific surface area available for adsorption and biofilm development (Moore et al., 2001). Mineral composition and chemical functional groups on the surface determine the charge and activity of the surface, which in turn determine the type of pollutants that can be adsorbed (Amonette & Josheph, 2009; Siegrist et al., 2000). In addition, adsorption is a prerequisite for microbial attachment (Trulear & Characklis, 1982), where the medium hosts the microbes, and the adsorbed organic matter and nutrients provide feed (Li & DiGiano, 1983). Porosity, which is the amount of voids available in the filter, determines water retention, hydraulic conductivity and hydraulic residence time in the filters. These factors affect both adsorption and biofilm activities, which in turn affect the retention of solids and bacteria and transformation of organic matter, nitrogen and phosphorus. In the following sections, the effects of specific surface and hydraulic properties of the bark, charcoal and sand filter media tested in this thesis on organic matter, solids, nitrogen, phosphorus and indicator and tracer microorganisms removal are discussed, based on results from Papers II, IV and V.
3.1 Effects of surface properties on pollutant removal capacity
The specific surface area of the pine bark used in the experiments was 0.734 m2 g-1 (Table 2). In the bark filters, 44% of sodium chloride (NaCl) added during a hydraulic retention experiment was not recovered, but sorbed by the medium (Paper II) and high removal of BOD5, MBAS, NH4
+-N, TTC, EHEC

22
and PhiX was achieved (Table 3; Papers II, IV and V). The effluent from the bark filters had lower pH (5.6-6.3) than the effluent from the charcoal (6.5-7.8) and sand filters (6.6-7.7). Moreover, the effluent from bark had a yellow tint and high COD content (200-590 mg L-1) (Papers II and IV).
Table 2. Characteristics of the bark, charcoal and sand filter materials used in the study
Parameter Bark Charcoal Sand
pH (SU) 5.1 10.4 7.9
Loss on ignition (%) 90 90 <1
Effective size (mm) 1.4 1.4 1.4
Uniformity coefficient 2.3 2.3 2.2
Bulk density (kg m-3) 365 283 1690
Particle density (kg m-3) 1340 1900 2570
Porosity (%) 73 85 34
Specific surface area (m2 g-1) 0.734 > 1000 0.136
Hydraulic conductivity (cm h-1) 330 500 360
The specific surface area of the bark was not particularly high, but its chemical composition and surface charge resulted in an active surface. Initially the BOD5, MBAS, TTC, EHEC and PhiX removal was probably dominated by adsorption mechanisms (Papers II). The BOD5 in the artificial greywater was a result of mixing detergents and cooking oil with nutrient broth, consisting of meat extract and thus containing proteins. Pine bark is rich in tannins (Soto et al., 2005) and studies have shown that bark can effectively bind proteins to tannin (Lewis et al., 1995; Hagerman & Robbins, 1987; Chibata et al., 1986). Lewis et al. (1995) also reported remarkable removal of Enterococci, E. coli and MS2 phages and protein binding in steam-exploded bark.
General biological degradation of organic matter and mineralisation in biofilms (Papers II and IV; Lens et al., 1993) and degradation of complex substances by fungal flora prevailing on the surface of the bark (Cardoza et al., 2009) are other removal mechanisms. Pine bark is a lignocellulosic material (Miranda et al., 2012), which according to Rowell et al. (2012) is porous and may therefore hold water essential to microbial populations harboured by the material. The surface of pine bark is rich in polyhydroxyl and polyphenol functional groups (Bailey et al., 1999), with high cation exchange capacity (CEC) (Naasz et al., 2008; Naasz et al., 2005). Removal of NH4
+ and Na+ occurs when the positively charged ions replace H+ and/or phenolic hydroxyl groups. This results in release of organic acids, which decreased the pH (Papers II and IV) which is also reported by Genç-Fuhrman et al. (2007).
23
Being lignin-rich, with the major function to protect the tree, bark is usually not easily degraded, particularly when in the form of large fragments. However, constructing the bark filters from small pieces of bark (1- 5 mm with effective size of 1.4 mm) seemed to make the structure vulnerable to degradation. The artificial greywater with its high Tot-N content, as indicated by a TOC:Tot-N ratio of 3.4-4.9 (Paper IV), seemed to trigger microbial attacks in scavenging for carbon (Paper IV). The weakness of the fine-textured bark was also evident in the water-soluble extractives released as a yellow tint and in the high COD measured in the effluent (Papers II and IV), which was also reported by Lens et al. (1994) when used pine bark for wastewater treatment. Using larger bark particles would probably have decreased the release of the yellow tint, but on the other hand would probably have decreased the specific surface area, leading e.g. to less binding of BOD5 and bacteria. For irrigation purposes, the presence of BOD5 and pathogens is more serious than dissolved organics forming the yellow tint, which will precipitate on soil minerals after irrigation. Dalva and Moore (1991) reported that soils with low organic matter content and rich in aluminium (AL), iron (Fe) or carbonate are potential sinks for dissolved organics.
The charcoal used as filter material was activated carbon with high specific surface (>1000 m2 g-1). In order to increase the adsorption capacity of charcoal, after initial pyrolysis it is usually activated by gasification with oxidising gases such as CO2, steam or air, or by addition of zinc salts or phosphoric acids (Downie et al., 2009). Activation results in increasing porosity and specific surface. In the present case, the newly installed charcoal filters retained 48% of the NaCl used in a hydraulic retention time experiment (Paper II) and achieved remarkably high removal of BOD5, COD, MBAS, Tot-P and Tot-N (Table 3; Paper II). Adsorption due to the large specific surface area was the dominant removal mechanism in the initial stages of charcoal filter operation (Paper II). In general, the surface of charcoal has hydrophobic sites (consisting of carbon layers) and hydrophilic functional groups (Matsis & Grigoropoulou, 2007), which include OH-, NH2, O(C=O)R, CO=OH, C=OH, phenols and carbonyls (Amonette & Josheph, 2009). The different functional groups affect the charge and the acidity of the surface, together with the hydrophobic properties, leading to adsorption of a wide range of different types of pollutants such as NH4
+ and PO4, as well as organic matter and bacteria. The charcoal surfaces are finite resources and their adsorption capacity is exhausted by continuous exposure to the pollutants in greywater (Paper IV). Nonetheless, the large specific surface area of the charcoal is likely to have hosted large numbers of biofilm bacteria, as well as protecting them from predation by other microorganisms, as suggested by Pietikäinen et al. (2000).

24
The organic matter adsorbed onto the surface of the charcoal provided substrate for the bacteria hosted on the charcoal surface as suggested by Li and DiGiano (1983). This facilitated biological mineralisation of the sorbed organic matter and oxidation of NH4
+, hence sustaining relatively high BOD5 and COD reduction and improved nitrification (Table 3; Paper IV). Surprisingly, the charcoal did not perform well in removal pathogenic indicators and tracer microorganisms, especially in the later stages of filter life (Table 3; Paper V). It can be speculated that even more bacteria would be found in the effluent after clogging of the micropores, because of overgrowth of bacteria on the large specific surface of the charcoal, as discussed by Scholz and Martin (1997).
On comparing the performance of activated and non-activated charcoal for greywater treatment, Berger (2012) showed that non-activated Salix charcoal removed 99% of the COD and MBAS from greywater loaded with 60 g COD m-2 day-1, which was similar to the performance of the activated charcoal in the present study. The charcoal studied by Berger (2012) removed Tot-P and PO4-P more efficiently than activated carbon, with average rates of 89% for Tot-P and 86% for PO4-P, but the efficiency in removing Tot-N and NH4
+-N was not stable, whereas activated carbon displayed stable rates of 97% and 98% for Tot-N and NH4
+-N (Berger, 2012). Another study (unpublished data) comparing activated charcoal with non-activated Salix charcoal at an organic loading of 240 g COD m-2 day-1 showed no significant difference between the activated and non-activated charcoal regarding COD removal, while the Tot-N removal was significantly higher in the activated charcoal. These results indicate that Salix charcoal could be a good alternative to test in field trials for greywater treatment to produce irrigation water instead of activated charcoal.
The specific surface of the sand was the smallest among the filter materials tested (Table 2), which was probably the reason for the observed low reduction rates of BOD5 and COD (Table 3; Papers II and IV). Organic matter degradation by biofilm activity is the dominant removal process in sand (Papers II and IV) and the rate seemed to be limited by the specific surface area of the sand. Pell and Nyberg (1989a) reported markedly higher organic matter reduction rates in sand filters of 0.21 mm effective particle size, providing a much larger specific surface area.

25
Table 3. Mean removal efficiency of greywater pollutants and nitrification in the bark, charcoal and sand filters treating artificial greywater, expressed as a percentage
Filter medium
Pollutant New filters
500 mg BOD 5 L-1 (Paper II)
Increasing HLR
125-500 mg BOD 5 L-1 (Paper IV)
Increasing OLR
500-2400 mg BOD 5 L-
1 (Paper IV and V)
TSS 92±5 – –
Bark BOD5 98±2 94-96 99±0.1
COD 74±12 71-40 71-91
MBAS >99±0 – –
Tot-N 19±9 0-28 7-39
NH4+-N /Tot- Nef <5 1-2 <1
NO3–-N /Tot- Nef 80 68-100 81-94
Tot-P 97±2 51-59 70-81
PO4-P 97±2 51-59 70-82
TTC 99±1 82-99 –
EHEC – – 96-99
PhiX – – 97-99
Charcoal TSS 83±8 – –
BOD5 97±3 83-94 94-98
COD 94±4 76-94 72-88
MBAS >99±0 – –
Tot-N 98±1 50-83 53-66
NH4+-N /Tot-Nef 5 3-5 1-2
NO3–-N /ot- Nef 15 59-67 76-95
Tot-P 98±1 64-84 86-92
PO4-P 98±2 86-93 95-96
TTC 91±11 65-78 –
EHEC – – 0-82
PhiX – – 51-68
Sand TSS 56±29 – –
BOD5 75±6 68-85 91-93
COD 72±2 65-84 66-85
MBAS 96±1 – –
Tot-N 5±7 0-8 0-10
NH4+-N /Tot- Nef 5 2-10 0-3
NO3–-N /Tot- Nef 79 57-92 70-100
Tot-P 83±3 38-62 78-84
PO4-P 83±3 27-87 86-92
TTC 91±11 79-99 –
EHEC – – 40-91
PhiX – – 67-80

26
Unlike other pollutants, Tot-P removal in the sand filters was relatively high (83-89%) at Tot-P loading rates ranging from 89 to 326 mg m-2 day-1. Adsorption is the principal mechanism for PO4-P reduction in sand filters (Prochaska & Zouboulis, 2003; Pell & Nyberg, 1989b). The capacity of sand to bind PO4-P depends on pH and the Ca, Fe and Al content in the sand (Arias et al., 2001). Elemental scanning electron microscopy of the sand used in this thesis showed that the particle surfaces contained 22% Ca, 5% Fe and 8% Al (Paper IV). Furthermore, the sand contained 2% lime (Paper II) and the pH ranged from 6.6-7.7. Hence, PO4-P binding to Ca hydroxides/oxides was likely to be the prevailing mechanism removing phosphorus in the sand filters.
3.2 Effects of hydraulic properties on pollutant removal capacity
The bark filters had 73% porosity (Table 2). Bark has a high water-holding capacity in relation to sand (Paper II) and also swells on exposure to water. The swelling of the bark particles probably resulted in narrowing of the pores, distributing the capillary water more evenly within the filter medium, seen as enhanced removal of TSS (92%) and TTC (92-99%) (Table 3). The effluent from the bark was clear water of yellow tint. More mixing between capillary and non-capillary water might have occurred, leading to increased residence time of the liquid within the pores (43 h) (Paper II). The increased contact between bark and water facilitated adsorption and biofilm activities by which BOD5, NH4
+-N and PO4-P were removed (Paper II). The long contact time was probably also one factor for the observed high nitrification capacity (Table 3; Papers II and IV).
The charcoal also had high porosity (85%) (Table 2). Due to the fact that the charcoal was activated, micropores and mesopores (<2 and 2-50 nm, respectively) could be expected to dominate. Matsis and Grigoropoulou (2007) reported that 71% of total pores are micropores in granular activated charcoal. Some grain sizes, between D10 and D60, were absent in the charcoal filters, which affected the distribution and size of the macropores and thereby increased the hydraulic conductivity (5.0 m h-1) and shortened the residence time (16 h). This in turn led to a lower reduction in TSS, TTC and BOD5 in the charcoal filters (Table 3). In micro/mesopores, the dissolved oxygen was probably decreased by bacterial consumption and could even be further aggravated by clogging, leading to anoxic sites. Thus, beside adsorption, loss of nitrogen by denitrification in the anoxic zones could have taken place (Table 3; Papers II and IV). The micro/mesopores in the charcoal filters seemed to clog by the progressive feeding of the greywater, especially at the high organic loading regime, leading to limited adsorption and hence lower PO4-P reduction

27
(compared with the initial reduction) (Paper IV). Moreover, filtering seemed to decline, resulting in a turbid effluent and very low reduction in EHEC and PhiX phage (Table 3; Paper V).
The sand had lower porosity (34%) than the other two filter materials, which could explain the faster flow and shorter residence time (4 h). The fast flow led to inefficient filtration of TSS (56%) and low organic matter reduction (Table 3; Paper II and IV). Sand filters generally remove TSS by physical filtration and organic matter by filtration and mineralisation in biofilm (Healy et al., 2007; Rodgers et al., 2004). Due to the low porosity in the sand, the capillary water was much lower than in the bark and charcoal filters. Therefore drying of the top surface layer, caused by evaporation under the high ambient temperature of 25-29 °C (Paper II), most likely retarded biofilm establishment during the initial stage of the sand filter life, leading to a lower organic matter reduction (Table 3; Paper II). Later, when biofilm growth was evident, narrowing the pores (Paper IV), the sand filters achieved remarkably high organic matter removal rates (91-93% reduction in BOD5) (Paper IV). Nitrification was efficient in the sand filter (Table 3; Papers II and IV). Oxygen diffusion to nitrifying bacteria in the sand filter was more pronounced due to the large pores, which limited the denitrification in this filter type compared with the bark and charcoal filters (Table 3; Papers II and IV).

29
4 Microbial activity, diversity and composition
Organic matter removal and nitrogen mineralisation in sand filters are accomplished mainly by microbiological activities in biofilms (Leverenz et al., 2009; Healy, 2007; Wanko et al., 2005; Prochaska & Zouboulis, 2003; Pell & Ljunggren, 1996; Pell et al., 1990). The properties of bark and charcoal, as discussed in Chapter 3, suggest that these materials also rely on their biofilm activities when treating greywater. Factors affecting biofilm formation include medium specific surface area, surface charge and roughness (Bolton et al., 2006; Baker, 1984), ability of the surface to absorb organic matter and to adhere microorganisms (Shimp & Pfaender, 1982). In order to understand the full treatment capacity of the three filter materials, exploring their biological activities as well as bacterial community structure (Box 1) is necessary.
The potential respiration activity is useful to give an idea of the total biomass (Anderson & Domsch, 1978) and could possibly also be used to estimate the potential carbon mineralisation capacity of the filters, i.e. capacity of the filters to deal with shock loads of organic matter. The potential respiration is usually measured under non-limiting conditions with glucose substrate. Nitrogen mineralisation, i.e. conversion of organic nitrogen into NH4
+, is a general biological process driven by heterotrophic bacteria, while oxidation of NH4
+ into NO3– (nitrification) is mediated by specific lithotrophic
bacteria (Tchobanoglous, 2002) and archea (Limpiyakorn et al., 2013; Park et al., 2006). Reduction of nitrite and nitrate to nitrogenous gases, i.e. nitrogen removal, is referred to as denitrification (Pell & Wörman, 2008). Nitrification and denitrification in biofilm environments are well documented (Bai et al., 2012; Bassin et al., 2012; Ehlers & Turner, 2012; Almstrand et al., 2011; Chu & Wang, 2011).
Microorganisms involved in wastewater treatment include bacteria, fungi, protozoa, algae (Tchobanoglous, 2002) and archea (Park et al., 2006 ). In infiltration systems such as sand filters, the microbial ecosystem is dominated

30
by bacteria, but archea, fungi and protozoa may also be important players (Chabaud et al., 2006b; Okubo & Matsumoto, 1983). The microbial ecosystems are dynamic, varying spatially and temporally (Chabaud et al., 2008; Truu et al., 2005), and respond to different substrate and loading conditions (Addison et al., 2011; Pell & Ljunggren, 1996). They are also influenced by environmental stressors and toxic compounds. Therefore, studying the variation in bacterial community structure (Box 1) of the bacteria provides valuable understanding of factors enhancing or suppressing biological activity.
This chapter discusses the effects of greywater application and type of medium on organic matter mineralisation and nitrogen transformation based on results from Papers II, III and IV. The potential of the biofilm developed at OLR of 15 g BOD5 m-2 day-1 to treat high glucose was measured using a respiration assay. Filter medium at a depth of 0-2, 20, 40 and 60 cm was sampled in each of the filters every two weeks (Paper III). The potential respiration rates of the filter materials were assayed in short-term (24 h) incubations under non-limited organic substrate loadings (2 g glucose) using dissolved oxygen electrode to measure the oxygen consumption. In addition, the effects of greywater and filter medium on bacterial diversity and structure were investigated based on results from Paper III. The deoxyribonucleic acid (DNA) of the biofilm was extracted, amplified and sequenced, and bacterial composition was identified. Thereafter, the bacterial community structure (Box 1) was determined.
Box 1. Microbial ecology definitions Abundance - Relative number of sequences of a genus to the total
number of sequences of genera in the sample. Bacterial community - Assemblage of multi types of bacteria living
together in a contiguous environment and interacting with each other. Bacterial community structure: Bacterial richness and abundance. Diversity - Number of OTUs of interest, weighted by some measure of
abundance, such as total number OTUs in the community. Often expressed in different indices, e.g. the Shannon index.
OTU - A group of similar DNA sequences, e.g. at 95% similarity level. Richness - Number of different OTUs in a community. Shannon diversity index - Mathematical measure of diversity in a given
community based on the richness and abundance.

31
4.1 Biological activities
4.1.1 Organic matter mineralisation and potential respiration
Greywater provides a suitable substrate for bacteria in biofilms in terms of carbon and nutrient balance (though shower greywater may be relatively low in nutrients). The amount of organic matter fed to the filters in different operating periods varied within the range 126-2390 mg BOD5 L-1, meaning that the C:N:P ratio of the artificial greywater varied between approximately 74:14:1 and 150:25:1. According to Chandy and Angles (2001), the C:N:P needed for bacterial growth is 100:10:1, while the actual C:N:P in the microbial biomass itself ranges between 59:12:1 and 100:20:1. Thus, the artificial greywater used in this thesis had a balanced carbon and phosphorus composition in terms of that required for bacterial growth, but excess nitrogen. Greywater is known to be degraded under both aerobic and anaerobic conditions (Abu Ghunmi et al., 2011; Hernández Leal et al., 2011; Zeeman et al., 2008; Hernández Leal et al., 2007), indicating that the organic matter in greywater constitutes an easy available carbon and energy source for bacteria. High degradation capacity was indeed observed for the artificial greywater used in this thesis, even when stored cooled at 2– 4 °C (Paper II).
Biological carbon mineralisation is a significant mechanism for organic matter removal in bark (Papers II-IV). This was demonstrated by BOD5 removal rate ranging between 94 and 99% (Figure 2; Papers II and IV), as well as by the high observed potential respiratory activity of the biofilms (Figure 3). The organic carbon in bark can provide substrate for microbial communities (Paper II and IV; Trois & Polster, 2007), thus increasing their enzymatic capacity to degrade greywater. This was evident from the high potential respiration rate measured in bark filters fed only with tap water (Figure 3).
Interestingly, the respiration rates were correlated to the number of sequences of subgroups GP1 and GP10 within Acidobacteria bacterial class (Paper III). Naether et al. (2012) reported that subgroups belonging to Acidobacteria are common in acidic forest soils and it would not be surprising if conditions similar to those in forest soils (low pH and plenty of complex substrates) prevailed in the bark filters. If the potential respiration rate of the bark fed tap water is subtracted from the rate measured when it is fed with greywater, the difference should in some way represent the increase in microbial respiration potential induced by greywater only.

32
Figure 2. Amount of BOD5 removed in the bark (●), charcoal (▲) and sand (♦) filters loaded with artificial greywater at 15 g BOD5 m
-2 day -1 during 116 days (mean ± standard deviation; n = 2) (Paper III).
Figure 3. Potential respiration rate (mean, n =2) as a function of depth in bark (●), control bark (○; n =1), charcoal (▲) and sand filters (♦) at day 84 in the infiltration experiment with artificial greywater (Paper III).
0
100
200
300
400
500
600
0 20 40 60 80 100 120
BOD5removed (mg day ‐1)
Days
0
10
20
30
40
50
60
0 200 400 600 800
Depth of filter (cm)
Potential respiration rate (mg O2 L‐1 day ‐1)
33
This difference in potential respiration levels was similar to the potential respiration measured for the more inert charcoal fed with greywater. However, it can be discussed whether the microbes utilised the bark at all, as the greywater substrate was more easily available. One interesting conclusion is that the microbial communities residing on and sustained by the bark can provide extra capacity for efficient removal of organic matter.
Even though the charcoal had similar capacity to the bark to remove organic matter (Figure 2), it displayed lower potential respiration rates (Figure 3). As a consequence of the large adsorptive surface of charcoal, a number of studies have reported creation of a nutrient-enriched environment supporting large bacterial populations (Pietikäinen et al., 2000; Scholz & Martin, 1997; Van Duck, 1984; Shimp & Pfaender, 1982). In contrast, other studies have reported lowered microbial activity induced by charcoal. Thies and Rilling (2009) reported that adding charcoal to soils reduced their respiration. Based on these contrasting observations, it could be speculated that because of the large adsorptive surface of the charcoal, a sparse biofilm might have originally been developed. Further feeding with greywater transformed the charcoal into a biological filter (Paper IV), with a more active biofilm. Charcoal has adsorption capacity for different gases including O2 (Choi et al., 2008). The lower measured potential respiration rates of the charcoal compared with the bark might thus be due to underestimation of the respiration activity. Thies and Rilling (2009) suggested that charcoal may adsorb O2. Other methods for respiration measurements, such as micro-calorimetric measurements, which depend on measuring heat flow (at micro level) from biological processes (Braissant et al., 2010) or measuring specific enzyme activities such as -glucosidase (Lazarova & Manem, 1995) might therefore be more suitable than respiration-based methods for measuring the biological activity in charcoal.
The organic matter reduction was less efficient in the sand filters (75%) than in the other filters, and the potential respiration activity rate was also lower than in the other filters (Figure 2 and 3). The ability of the filter surface to adsorb organic matter is important for initial biofilm formation (Shimp & Pfaender, 1982). Newly started sand filters, especially those with small specific surface such as the sand used in the present study (0.136 m2 g-1), probably do not have significant capacity to absorb organic matter and therefore initially do not support large biofilm cover. Acidovorax and Aquabacterium, which are reported to be abundant in low biomass biofilms (Liu et al., 2012), were found in high numbers of sequences in both the charcoal and sand filters, indicating low biomass communities, as also suggested by the observed lower respiration rates in these filters compared with bark. Continuous operation of the sand
34
filters, either with high HLR or high OLR, further extended and thickened the biofilm, as shown by its increased capacity to remove BOD5 (Paper IV).
The biofilms in the top layer (0-2 cm) of the bark and charcoal filters had higher respiration capacity than the biofilms at 60 cm depth (Figure 3), while the sand showed similar potential respiration rates in both layers. In the bark and charcoal filters, 34±16% and 63±23%, respectively, of the COD was removed in the 0-2 cm top layer (unpublished data). Well-known biofilm-forming bacteria, such as Pseudomonas and Acinetobacter (Li et al., 2009), were found in the bark and charcoal filters, with higher abundance at 0-2 cm depth (Paper III). In the sand filters these bacteria were more evenly distributed throughout the sand profile, i.e. having similar abundance at 0-2 and 60 cm depth. It is well known that the highest bacterial numbers and activities occur at the top surface (Rajeb et al., 2009; Chabaud et al., 2006a; Pell et al., 1990; Calaway et al., 1952). Therefore, it seems reasonable to argue that most of the organic matter removal occurred in the top 20 cm of the bark and charcoal filters. However, the greywater passed through the sand filter quickly, which decreased the possibility for substrate utilisation by the biofilm (Paper III). In a similar context, Bahgat et al. (1999) reported no significant difference in numbers of heterotrophic bacteria between the top and bottom of coarse sand filters and attributed this to fast passage of water. At later stages, when the large pores in the sand were bridged with biofilm, the mineralisation of organic matter improved (Paper IV). The greywater used in the present study was dosed intermittently onto the filters, which could have regressed the biomass growth and even starved it during times between feedings. This phenomenon particularly influenced the sand filter, as it had the smallest adsorptive surface. Wanko et al. (2005) also reported biomass regression and biofilm decay in intermittently dosed sand filters and attributed the biomass regression to oxidation of organics in the absence of substrate and biofilm decay due to dehydration.
4.1.2 Nitrogen transformation and removal
Organic nitrogen represented 16-20%, 31-79% and 21% of Tot-N in the effluent from the bark, charcoal and sand filters, respectively. This indicated substantial nitrogen mineralisation in the bark and sand filters. Adsorption in charcoal is an important process for the removal of different nitrogen forms (organic-N, NH4
+-N and NO3–-N), and therefore it can be difficult to assess the
mineralisation of nitrogen in this filter material. The bark, charcoal and sand filters demonstrated effective nitrification, i.e.
oxidation of ammonium to nitrite and then further to nitrate, but the overall rate was lower in the newly started charcoal filters than in the other filters (Table 3;

35
Papers II-IV). The prevalence of aerobic conditions in all filters, further promoted by the intermittent feeding of greywater (Paper II), was probably the reason for the development of successful nitrification. The presence of ammonia-oxidising bacteria (Nitrosospira and Nitrosomonas) and nitrite-oxidising bacteria (Nitrospira and Nitrobacter) verified this assumption (Paper III). The pH and composition of the medium influenced the composition of ammonia-oxidising genera present in the filters. The relatively acidic environment in the bark filters (pH 5.1) seemed to have retarded the growth of Nitrosomonas, which has a reported pH optimum of 7.8-8.5 (Bae et al., 2001; Wild et al., 1971). Instead, Nitrosospira dominated and is also reported to exist in acidic and pine forest soils (Koops et al., 2006; Nugroho et al., 2005). Furthermore, the phenolic substances usually found in bark (Miranda et al., 2012) might have been more toxic to Nitrosomonas than to Nitrosospira. Lauchnor et al. (2011) reported phenol inhibition of ammonia oxidation by Nitrosomonas europaea. It should be noted that ammonia oxidation may also be accomplished by archeans, as documented for activated sludge (Park et al., 2006) and soil (Leininger et al., 2006), but that was not investigated in this thesis.
From water samples collected at different depths in the bark and charcoal filters, it could be seen that the NH4
+-N was oxidised to NO3–-N while
infiltrating through the top 20 cm of the columns, indicating high nitrification activity (Figure 4). Similarly, Pell and Nyberg (1989c) reported that under steady state conditions, complete nitrification occurred very rapidly in the top 15 cm layer of sand filter columns fed artificial household wastewater.
The removal of Tot-N was more efficient in the charcoal filter than in the bark and sand filters (cf Figure 4; Papers II-IV). Charcoal not only has a higher capacity to adsorb and fix ammonium (Rodrigues et al., 2007), but also stimulates denitrification to a higher degree (Zwieten et al., 2009). The bacterial genera Acidovorax, Aquabacterium, Pseudomonas, Bradyrhizobium and Rhizobium, which according to Gómez-Villalba et al. (2006), Thomsen et al. (2007) and Jones et al. (2008) all contain species with denitrifying capacity, were found in all filters. However, it is the environmental conditions that regulate the activity of these genera. Besides nitrate, anaerobic conditions and available carbon regulate the denitrification communities, as reported by Gilbert (2008) and Pell and Wörman (2008). In the charcoal filters, anoxic micropores are likely to have developed and become widespread. This probably stimulated nitrogen loss via denitrification.
Variations in OLR and HLR affected the biofilm activity, which was evident as varying nitrification-denitrification activity (Table 3). Growth of the biofilm in the bark filters in response to increased organic loadings led not only

36
to higher assimilation of nitrogen, but also to improved denitrification. High HLR in the bark and sand filters, on the other hand, decreased nitrification due to shortening the residence time of water and to the development of saturated non-oxic conditions (Paper IV).
Figure 4. Profiles of NO3
–-N in infiltrated water in bark (●) and charcoal (▲) filters under greywater loading of 13-16 g BOD5 m
-2 day-1. Lines represent mean values (n=2).
4.2 Bacterial diversity
In the charcoal and sand filters, more diverse bacterial communities developed, as shown by the scattered patterns in the NMS plot (Figure 5) than for the bark filters, which showed clustered pattern. The artificial greywater was prepared from nutrient broth, cooking oil and detergents and mixed with some real wastewater. These ingredients contain organic macromolecules of a wide range of complexity (carbohydrates, protein and lipids). This is most likely the explanation for more diverse bacterial community observed in the charcoal and sand samples. Though also receiving greywater, the lignocellulosic composition of the bark (Miranda et al., 2012) and the low pH apparently induced a selective pressure on the bacterial community, leading to the development of a more distinct community than in the charcoal and sand materials. At day 0, before loading with greywater started, the bark had the richest bacterial community (Box 1) expressed as numbers of operational taxonomic units (OTU), 654 compared with 105 OTU in the charcoal and 37 OTU in the sand (Paper III). Bark is organic material found in nature and hosts a rich microorganisms when decomposed. Sand and also charcoal to a certain degree
0
20
40
60
0 20 40 60 80 100
Depth (cm
)
NO3–‐N (mg day‐1)

37
are oligotrophic and therefore less favourable for microbial attack. After 14 days of greywater feeding, the microbial richness in the bark, charcoal and sand filters had increased to 686, 540, and 620 OTU, respectively. The bacterial richness (Box 1) of the filters had thus become much more similar. Interestingly, the bacterial diversity (Box 1) and richness of the bark decreased at later stages of operation (Paper III). Greywater application to the bark filters seemed to disadvantage some bacterial genera, as was apparent from the successive disappearance of Kofleria, Methylocystis, Acidocella and Herbaspirillum in the bark filters.
In the bark and charcoal filters, richer communities were observed after 14 days at 0-2 and 20 cm depth compared with that at 60 cm, indicating an active treatment zone in bark and charcoal of less than 60 cm. This agreed with the results from the potential respiration rate measurements and nitrate profiles (Figures 3 and 4). In the sand filters, rich community also developed at 60 cm due to that more untreated material had made its way to 60 cm depth than in the bark and charcoal filters. This, together with the water-logging at deeper levels of the sand filter, enriched the bacterial communities in the sand and allowed the development of rich biofilm even at the bottom of the column. It would have been interesting to see how the bacterial diversity and composition at 40 cm and to see if this community is related to that of 0-2 or 60 cm depth. Such information could probably assist in evaluating the extent of the active infiltration zone and the actual column depth needed for complete purification.
The bacterial diversity in the three filter materials displayed lower Shannon diversity index values (1.75-2.3) than those reported for different soil ecosystems (5.39-7.07) (Chau et al., 2011; Kim et al., 2006; Dunbar et al., 2000). The more complex and environmentally diverse ecosystem in soil is probably the reason for its higher bacterial diversity. Perhaps more surprisingly, the bark, charcoal and sand filters showed lower bacterial diversity than activated sludge, which has a reported Shannon index of 6.90-7.36 (Hu et al., 2012). The activated sludge process varies between aerobic, anoxic and anaerobic conditions, and has a large inflow rich in different types of bacteria coming from blackwater, etc. The greywater composition and the operating and environmental conditions in the present study were fairly constant, which defined the bacterial community structure with the lower diversity compared with that in soil and activated sludge.

38
Figure 5. Non-metric multidimensional scaling (NMS) plot showing similarities in bacterial composition at class level between bark (●), charcoal (▲) and sand (♦) filters at the indicated horizon and incubation time (Paper III). Points close to each other have a similar bacterial composition.
B0cm-0d
B0cm-14d
B20cm-14dB60cm-14d
B0cm-28d
B20cm-28d
B60cm-28d
B0cm-84d
B20cm-84d
B60cm-84d
C0cm-0dC0cm-14dC20cm-14d
C60cm-14dC0cm-28d
C20cm-28d
C60cm-28d
C0cm-84d
C20cm-84dC60cm-84d
S0cm-0d
S0cm-14d
S20cm-14d
S60cm-14d
S0cm-28d
S20cm-28d
S60cm-28d
S0cm-84d
S20cm-84d
S60cm-84d
Stress 0.06447

39
5 Loading conditions and treatment capacity
Greywater flows vary daily, weekly and seasonally, which affects the treatment processes (Eriksson et al., 2009; Ghunmi et al., 2008). The HLR affects flow velocity, oxygen transportation and degree of water saturation in the pores (Rolland et al., 2009; Boller et al., 1993), thereby regulating the oxygen status of the filter material and its oxidation of pollutants. Also, on the one hand, high HLR increases the wetted area in granular filters with unsaturated flow (Sharvelle et al., 2008), which in turn increases the effective infiltration surface and thereby improves the conditions for biofilm coverage. On the other hand, high HLR imposes shear stress on the biofilm surface due to the higher water speed (Trulear & Characklis, 1982). Peak loading conditions can also lead to temporary failure of the treatment system, but on the other hand, the effective filtration area/depth might not be utilised at low hydraulic loads, which is economically inefficient.
Greywater composition also varies with time (Jefferson et al., 2000). When the flux of organic matter to the biofilm increases, the biological activity of the microorganisms is stimulated (Trulear & Characklis, 1982), leading to higher mineralisation rates of organic matter (Wijeyekoon et al., 2004). Intensive organic loading leads to dense biofilm formation, whereupon flux of substrate and oxygen into the interior of the biofilm is limited (Wijeyekoon et al., 2004). Ultimately, this will result in biofilm detachment, which can lead to emission of pollutants (Li et al., 2012).
Loading frequency and resting periods also influence the performance of the filters. Intermittent dosing can open filter pores during periods of drought, allowing oxygen diffusion into the filters (Stefanakis & Tsihrintzis, 2012), which enhances the mineralisation of stored organic matter. This expands the service life of well-functioning filters and may restore overloaded filters (EPA, 2002; Pell, 1991).

40
Knowledge about the response of filter media to loading and operating conditions is decisive in determination of their treatment capacity so as to avoid overloading or failure events. In the following sections, the response of bark, charcoal and sand filters to variable hydraulic and organic loading rates in terms of BOD5, COD, Tot-P, Tot-N and tracer organisms reductions is discussed. The effects of varying HLR and OLR were tested in a series of experiments using the column set-up described in Chapter 1 (Paper II). HLR was studied by increasing it stepwise from 32 to 128 L m-2 day-1 and then restoring it again to the initial 32 L m-2 day-1 while keeping the OLR constant at 13-16 g BOD5 m
-2 day-1. OLR was studied by increasing it from 14 to 76 g BOD5 m
-2 day-1 and then decreasing it to 13 g BOD5 m-2 day-1 while keeping
the HLR constant at 32 L m-2 day-1 (Figure 6A). Each loading regime was applied for three weeks until an assumed steady state was reached. The effects of HLR and OLR on the reduction in pollutants and on nitrogen and phosphorus mineralisation were modelled using general regression models (GRM; Table 4).
5.1 Hydraulic loading rate
The different materials responded differently to the HLR (HLRi and HLRi-1; Table 4). In the bark filters, for instance, increasing the HLR from 32 to 128 L m-2 day-1 successively decreased the capacity to remove BOD5 (from 95 to 93%), COD (from 74 to 40%), Tot-P (from 62 to 56%), NH4
+-N (from 97 to 88%) and also decreased the NO3
–-N fraction (from 1 to 0.64) and TTC reduction (from 96 to 82%) (Paper IV). The instant effect of increasing the HLR was an increase in flow velocity in the filters, as evident from the shortest residence time (Figure 6B). Shortest residence time is the time lapse between the greywater dosage and the first outflow from the filters, repeatedly determined throughout the experiment (Paper IV). The faster flow rates shortened the contact time of BOD5, Tot-P and NH4
+-N with the filter medium and its biofilm and thereby caused some pollutant fraction to pass through without being treated (Paper IV), as also suggested by Li et al. (2012). Therefore, when HLR was decreased, the reduction in pollutants increased again (Paper IV). Moreover, under high flow rates biofilm detachment due to fluid shear stress is likely to occur (Trulear & Characklis, 1982). Part of the biofilm in the bark seemed to be shed, which increased the pollutants slightly in the effluent (Paper IV). The chemical and physical composition of the bark material interfered with the HLR, particularly regarding the COD reduction. Pine bark contains water-soluble compounds (Miranda et al., 2012), and when more water percolated through the filters, more soluble compounds were

41
washed out from the bark (Paper IV). This increased the COD content of the effluent, resulting in an apparent lower capacity of the filter to treat the greywater.
Increasing the HLR of the charcoal and sand filters from 32 to 128 L m-2
day-1 increased their capacity to remove organic matter. At increasing load, the BOD5 reduction improved from 87 to 92% in the charcoal filters and from 76 to 84% in the sand filters, while the removal rate of COD increased from 76 to 90% and from 67 to 83%, respectively. Moreover, at increasing HLR the NH4
reduction decreased from 95 to 88% in the charcoal filters but increased from 79 to 95% in the sand filters. The TTC reduction in the charcoal filters ranged within 65-78% with no significant difference between the different HLR regimes, but it decreased from 92 to 79% in the sand filters. Increasing the HLR increased the wetted area, which is also suggested by Sharvelle et al. (2008) and Siegrist et al. (2000), which improved the conditions for biofilm coverage and for adsorption (Paper IV). Thus the active purification surface and depth increased, explaining the higher organic matter removal by microbial degradation in the charcoal and sand filters and the more efficient adsorption in charcoal (Paper IV). Aijiao et al. (2008) showed that the performance in terms of COD reduction in charcoal filters improves as flow rate increases. The question then is why the increased flow velocity associated with increasing HLR lowered the NH4
+-N reduction, but not the BOD5 reduction. It is possible that the biological activity responsible for organic matter degradation was faster than that governing oxidation or adsorption of NH4
+-N. Hence, NH4+-N
was more sensitive to higher HLR within the span of the investigation. Zou et al. (2009) reported a drop in NH4
+-N removal as hydraulic loading increased and explained this by the shortened residence time.
Interestingly, the GRM statistics proved that the pollutant reduction in the filters was influenced not only by the hydraulic loading applied at present run (HLRi), but also that at the previous run (HLRi-1). The loads applied as far back as three weeks before the measurements (HLRi-1) had a clear impact on filter performance, i.e. BOD5 reduction, nitrogen transformation and phosphorus reduction (Table 4; Paper IV). A number of physical, chemical and biological processes in a porous medium govern the organic matter, nitrogen and phosphorus transformations and bacterial growth. These processes are influenced by residence time, flow velocity, pH and amounts of oxygen. HLR has been demonstrated to affect the tracer (bromide) residence time (Van Cuyk et al., 2001), water saturation conditions and oxygen transportation (Rolland et al., 2009; Boller et al., 1993), as well as flow velocity. Therefore, changes in HLR in the present experiment would have altered these parameters, which in

42
turn influenced the fate of pollutants and treatment efficiency even in the following run.
Table 4. Summary of GRM coefficients (a-e), coefficient of determination (R2) and probability value (p) of models for the pollutant reduction in bark, charcoal and sand filters subjected to varying hydraulic (HLRi-1 and HLRi) and organic (OLRi-1 and OLRi) loading rates of artificial greywater
Filter Pollutant Intercept HLRi-1 HLRi OLRi-1 OLRi R2 p
a b c d e
Bark BOD5 0.9516 0.0004 -0.0004 -0.0007 0.0007 0.61 0.000
COD 0.8144 - -0.0036 - 0.0023 0.82 0.000
Tot-P 0.9093 0.0021 -0.0021 -0.0180 0.0066 0.98 0.000
Tot-N 0.03956 - - -0.0060 0.0065 0.75 0.000
NH4+-N 0.9970 - -0.0009 - 0.0002 - 0.000
NO3–-N /Tot-N 1.2813 -0.0062 -0.0038 - - 0.48 0.000
NH4+-N /Tot-N 0.0116 - - - -0.0002 0.37 0.000
Charcoal BOD5 0.8438 0.001 0.0001 -0.0012 0.0012 0.61 0.000
COD 0.7168 - 0.0014 - - 0.64 0.000
Tot-N 0.8500 - -0.0024 -0.0084 0.0084 0.61 0.000
NH4+-N 0.9841 -0.0008 - - - - 0.000
NO3–-N /Tot-N 0.4609 0.0023 -0.0023 -0.0084 0.0013 0.74 0.000
NH4+-N /Tot-N 0.0579 -0.0002 0.0002 -0.0005 0.0005 0.43 0.000
Sand BOD5 0.6491 0.0021 0.0001 -0.0018 0.0044 0.53 0.000
COD 0.5744 - 0.0016 - 0.0032 0.54 0.000
Tot-P 0.6208 0.0023 -0.0023 -0.0065 0.0065 0.83 0.000
NH4+-N 0.6836 0.0015 0.0003 0.0019 0.0019 0.45 0.000
NH4+-N /Tot-N 0.1036 -0.0004 -0.0003 -0.0007 -0.0005 0.34 0.003
- Coefficient value not within the 95% confidence interval and therefore omitted.
5.2 Organic loading rate
The bark, charcoal and sand filters showed similar responses to increasing OLR (OLRi and OLRi-1) when it was increased from 14 to 76 g BOD5 m
-2 day-1 (Table 4). With few exceptions, the BOD5, COD, Tot-P and Tot-N, PhiX and EHEC reductions increased with higher loading, from 99 to 100%, 73 to 87%, 81 to 73%, 0 to 29%, 97 to 99.9% and 96 to 99% in the bark filters, from 93 to 98%, 76 %, 83 to 98%, 66 to 63%, 52 to 67% and 82 to 0% in the charcoal filters and from 93 to 99%, 70 to 86%, 83 to 93%, 4%, 68 to 80% and 90 to 40% in the sand filters. In addition, the quantity of pollutants removed increased, even when the reduction percentage decreased. The effects of organic loading on the reduction in COD and Tot-N in charcoal and Tot-N in

43
the sand were not statistically significant. When the OLR increases, the substrate flux to the biofilm increases, which stimulates the activity of the microorganisms (Wilson et al., 2011), leading to higher mineralisation rates of organic matter (Wijeyekoon et al., 2004). Under high loadings with organic matter, thicker biofilm seemed to grow in the bark and sand filters, which agreed with findings reported by Bassin et al. (2012) and Tijhuis et al. (1994). Thicker biofilm increased the resistance to the greywater flowing through the filters, which in turn prolonged the water residence time (Figure 6B; Paper IV) and allowed more efficient organic matter and PhiX removal, particularly in the bark and sand filters (Papers IV and V). The prolonged observed residence time indicated a decrease in hydraulic conductivity in the bark and sand filters with increasing OLR. Formation of biofilm has been reported to decrease the hydraulic conductivity in filters treating wastewater (Beal et al., 2006; Beach et al., 2005; Siegrist & Boyle, 1987). Such effects could have happened in the charcoal filters, but were not observed, perhaps because of the high initial hydraulic conductivity obscuring small changes (Chapter 3). Besides adsorption of Tot-P to the filter materials, microbial assimilation of phosphate in the growing biofilm is inevitable (Paper IV). However, in the bark filter, anoxic incidences probably occurred, which led to desorption of PO4-P (Paper IV). Fluctuating oxygen conditions also favoured denitrification, which increased in the bark filters, further supporting the occurrence of anoxic zones. The removal of Tot-N in the charcoal decreased with decreasing OLR, and at the same time the nitrification increased. Yet, the charcoal filters still achieved the highest Tot-N reduction (63-66%) compared with both the bark (0-29%) and sand filters (4%) (Paper IV).
The GRM statistics showed that filter performance was influenced by the organic loading rate in the present run (OLRi) as well as the organic loading in the previous run (OLRi-1). This effect on filter performance was particularly evident when the high OLR was suddenly decreased (Paper IV). At that time, the previously flourishing bacterial community suddenly experienced starvation followed by biofilm detachment, which led to nitrogen and phosphorus assimilated in the biofilm during the preceding run being mineralised and leaking out (Table 4; Paper IV). In a similar context, Ahn et al. (2006) studying microbial adaptability in biological phosphorus removal systems, reported release of phosphorus after an abrupt decrease in OLR, which they explained by the severe upset of the bacterial metabolism in the system. It could be speculated that the effects from the previous loading are not long-lasting and thus when excess biomass has been mineralised and the biofilm is in balance again, the reduction capacity will increase.

44
Figure 6. A) Hydraulic (L m-2 day-1) (○) and organic loading rates (g BOD5 m
-2 day-1) (×) in the first (Paper II) and second (Paper IV) experiment. The truncation represents the periods when the filters were resting. B) Shortest residence time in the bark (●), charcoal (▲) and sand filters (♦) during the different loading regimes.
5.3 Intermittent loading
Greywater generation is usually intermittent and therefore most on-site treatment systems are fed intermittently. To mimic this, the filters in the present study were dosed intermittently with three doses per day (Paper II-V), with the longest resting time between the doses being 13 hours. Intermittent dosing can generally be predicted to enhance organic matter degradation and nitrification in the filters. Resting times allow oxygen to diffuse into the filter (Stefanakis & Tsihrintzis, 2012), hence allowing bacteria to mineralise organic matter stored within the pores and to nitrify ammonium. Besides, intermittent loading controls the growth of biomass, decreases the risk of clogging and hence extends the service life of the filter (Leverenz et al., 2009).
Long resting periods, such as the eight months which elapsed between the studies in this thesis, had the same effects as discussed above plus nearly
400 500 600
0
20
40
60
80
100
120
140
Loading
rate
00:00
01:12
02:24
03:36
04:48
06:00
07:12
08:24
09:36
10:48
12:00
0 100
Sh
ort
est
re
sid
en
ce ti
me
(m
in)
Days
Loading rate
Shortestresiden
cetime (min)
Experiment 1 Experiment 2
(B)
(A)

45
complete biofilm decay, as also suggested by Pell (1991) and Bancolé et al. (2004). This indicates possibilities for reliable rehabilitation/restoration of filters for renewed start-up. The long resting period also led to mineralisation of biologically assimilated nitrogen and phosphorus, producing ions. Therefore, PO4-P and NO3
–-N were washed out with water before the filters were used in the next experiment. During the long resting period significant amounts of water evaporated from the filter pores. This was particularly important for the bark filters, where the chips swell upon wetting and then shrink again on drying. The swelling-drying caused disruption of the bark chips and therefore at the second start-up some small particulate material was moved through the filter, causing fluctuations in the observed shortest residence time (Figure 6).
5.4 Treatment capacity of the filters
The BOD5 removal capacity of the filters during the OLR experiment (13-76 g BOD5 m
-2 day-1) was evaluated in Papers II and IV. In addition, the potential treatment capacity (PTC) of the filters was calculated using the potential respiration rates measured in Paper III and further discussed in Chapter 4. The total amount of oxygen respired in the entire filter was calculated by measuring the potential respiration rates at four depths of the filters and then integrating the potentials along the filter length.
Within the 13-76 g BOD5 m-2 day-1 loading range, the bark filters achieved
94-99% removal efficiency, which was the highest treatment efficiency of organic matter among the three filter types (Table 5; Papers II and IV). The bark filters demonstrated PTCs of 3.4 and 17.5 times the maximum and minimum loads applied in the OLR experiment (Table 5). In a full-scale application, Lightsey et al. (1976) reported a 95% reduction in BOD5 in pine bark trickling filters loaded with 55 g BOD5 m
-2 day-1. Based on the calculated PTC of the bark filters, it could be speculated that bark filters have the capacity to accept and remove short-term shock loads of BOD5. However, the PTC is only indicative and cannot be used to draw conclusions on the long-term treatment capacity of the filters, as it does not consider biomass growth or accumulation in the filters. At the highest OLR applied in the experiment (76 g BOD5 m-2 day-1), a slowdown in the hydraulic flow in the bark filter was observed (Figure 6), which could be a first sign of emerging clogging. However, operating the bark filters until failure, e.g. water ponding at the surface, is needed to determine the real long-term treatment capacity of these filters.

46
Table 5. Potential treatment capacity (PTC) of bark, charcoal and sand filters in terms of BOD5 removal under different measured or calculated loading rates
Loading conditions Applied BOD5
(g BOD5 m-2 day-1)
Removed BOD5
(g BOD5 m-2 day-1)
Bark Charcoal Sand
Minimum loading 14 14±1.5 13±1.7 12±1.9
Maximum loading 76 76±0.2 72±1.0 71±0.3
Potential treatment capacity >2000 262±55 83±35 33± 38
The measured BOD5 treatment capacity of the charcoal filters was lower
than that of the bark filters. The charcoal filters removed 92-95% of the applied load (Table 5; Paper IV). The calculated PTC was 5.7 times the minimum applied load in the OLR experiment, but was within the range of the maximum applied load (Table 5). The calculated PTC only considers the biological potential, without taking into account the adsorption capacity of the filter material. Upon depletion of the adsorption capacity, i.e. after a certain period of operation, the charcoal will start acting as a genuine biological filter. Generally, the BOD5 treatment capacity of the charcoal filters was lower than that of the bark filters, despite the charcoal having a much larger specific surface (Table 2). The underestimation of the respiration potential, discussed in section 4.1.1, was reflected on the calculated PTC. Furthermore, the contributing activity of anaerobic bacteria residing in the charcoal pores was not considered when calculating the PTC by use of an oxygen respiration method. Considering the non-accounted capacities of the charcoal, i.e. adsorption and anaerobic activity, the treatment capacity of the charcoal filters could be expected to be higher than the estimated PTC.
At later stages of operation of the sand filters, the treatment capacity increased and ranged within 85-93% of the applied loads. The calculated PTC was only twice the minimum load in the OLR experiment, and the maximum treatment capacity was within the variations of the PTC (Table 5). Based on carbon dioxide release, Pell et al. (1990) estimated a potential treatment capacity of 89-134 g BOD5 m-2 day-1 for fine sand (D10 of 0.21 mm). The recommended design factor for OLR of coarse sand filters is about 5 g BOD5 m-2 day-1 according to EPA (2002). These design loads must be considered very low compared with the actual loads applied in this thesis. However, such organic design loads are most likely intended to minimise the long-term risk of failure by clogging.

47
5.5 Service life of the filters
The service life of a filter can be defined as the time span during which the filter is expected to deliver acceptable removal rates of various pollutants. Service life is particularly important to consider for bark filters, because their organic origins make them more susceptible to degradation than the inert materials of charcoal and sand. Several studies have documented the fate of bark during composting (Davis et al., 1992; Trois & Polster, 2007) and similar conditions to those in the composting process might prevail in bark filters, leading to gradual degradation of the material and thus decreasing its service life. The greywater used in the present study was rich in nitrogen and phosphorus (Papers II and IV) and also contained a rich mixture of microbes (Paper III). Attacks on the bark by heterotrophic microbes to obtain carbon could have occurred (Papers II-IV). High respiration rates were observed in samples collected from the bark filters fed with tap water, which indicated activity of some microorganisms degrading the bark material (Paper III). Moreover, the swelling-shrinking cycles of the bark due to periods of wetting and drying could be expected to weaken the structures, causing disintegration of the bark particles. This would lead not only to loss of filter medium but also clogging phenomena. Applying greywater of high organic strength to bark filters was suggested to protect the bark from microbial attack due to both the biofilm coating physically protecting the material and to preferential consumption of the more easily available carbon fed with the water (Paper IV). However, the relationships between the organic load and rate of degradation and the service life of bark filters need more research. Charcoal and sand are oligotrophic and therefore biodegradation of the medium itself is not a concern. The service life of charcoal also needs more research regarding its adsorption capacity of organic material and subsequent biological degradation of the sorbed matter. Design of sand filters for long service life (e.g. 30 years) has been well studied (EPA, 2002; Tchobanoglous, 2002; Joseph A et al., 1969; McGauhey & Winneberger, 1964).


49
6 Recycling opportunities and constraints
Agriculture is the sector using most water, 70% of total global water use (FAO, 2007). Therefore reuse of treated greywater should be seen as an important contributor to sustainable water conservation.
The ultimate goal of this thesis was to develop filters for producing treated greywater suitable for irrigation. In this chapter, the opportunities and constraints in recycling greywater for irrigation are discussed. The discussion is mainly based on greywater quality in rural communities in Jordan (Suleiman et al., 2010; Halalsheh, 2008). The greywater was assumed to be treated in bark, charcoal or sand filters, after which the removal efficiency of organic matter, nitrogen, phosphorus and microbial indicators found in the filter experiments in Papers II-V were assumed in the following discussion. Furthermore, the suitability of the effluent for irrigation was assessed based on Jordanian standards for use of treated wastewater. The assessment was limited to nutrients, organic matter and hygiene quality properties and hence salinity issues and metal concentrations were not considered.
6.1 Water for irrigation
Greywater should be seen as a sustainable water resource to be used for irrigation. In Jordan, where the per capita water share is less than 200 m3 per year (FAO, 2007), saving every drop of water is a necessity. In rural areas of north-east Jordan, separation of greywater from toilet blackwater is already practised (Suleiman et al., 2010). The per capita daily greywater generation in north-east Jordan ranges from 83-140 L day-1 (Dalahmeh, 2010; Halalsheh, 2008). The incentive for recycling treated greywater for irrigation in the rural setting is strengthened by land availability close to the household. Olives are a common crop in Jordan, and can be irrigated with treated greywater to good effect. With drip irrigation or localised irrigation, the annual water requirement

50
for olives in Jordan is 400 L m-2 year-1 (El Zuraiq et al., 2004). Thus, 74-124 m2 of land could be irrigated with greywater generated in a typical household in the rural community, which agrees well with the normal garden area. Jamrah and Ayyash (2008) reported that garden irrigation accounts for 5-7% of total water consumption in major cities of Jordan, which implies that water savings of this magnitude should also be realistic for rural areas. Mandal et al. (2011) reported a 48% saving in water consumption when greywater was collected, treated and recycled for irrigation in one community in India, while Mourad et al. (2011) reported a 35% water saving by recycling treated greywater for toilet flushing.
6.2 Organic matter
Treating rural household greywater in a bark or charcoal filter, assuming treatment capacities obtained in Papers II-V, should substantially decrease the level of easily degraded organic materials in the greywater (Table 6), which would solve the problem of odours when the water is stored before use. The remaining organic material in the treated water can be considered a surplus contributing to soil organic matter content and sustaining soil microbial activity when irrigated to the soil system. Jordanian soils are usually poor in organic matter, with contents normally ranging between 0.07 and 0.9%. The bark effluent used in Papers II and IV contained total dissolved organic carbon (TOC) also originating from the bark itself (20 mg TOC L-1 from bark fed with tap water and 80 mg TOC L-1 from bark fed with greywater). The dissolved organic carbon (DOC) might be precipitated by soil minerals, hence adding organic matter content to the soil. Dalva and Moore (1991) reported that soils low in organic matter but rich in Al, Fe or CaCO3 are potential sinks for DOC. The agricultural soils in Jordan are generally alkaline (pH 7.9-8.4) and contain CaCO3 (8-25%) (El Zuraiq et al., 2004). However, care should be taken not to irrigate soils contaminated with heavy metals, because DOC might increase the mobility of metals such as copper, chromium and lead, which are of special concern at low soil pH (Fest et al., 2008; Linde et al., 2007; Wu et al., 2002). Depending on the quality of the treated wastewater, the Jordanian standards on treated wastewater for use in irrigation allow three classes of crops to be irrigated (Table 6). Comparing the calculated greywater quality with the Jordanian standards, BOD5 in the bark effluent met the standards for all classes, while charcoal and sand met the BOD5 requirements for classes two and three (Table 6). The COD in the effluent from all filters did not meet the standards for any of the classes.

51
Tab
le 6
. Qua
lity
of r
eal g
reyw
ater
gen
erat
ed in
rur
al s
etti
ngs
in J
orda
n, a
nd c
alcu
late
d qu
alit
y of
the
grey
wat
er a
ssum
ing
the
trea
tmen
t effi
cien
cies
in b
ark
and
char
coal
filte
rs fo
und
in th
is th
esis
. Cla
sses
1-3
are
the
Jord
ania
n st
anda
rds
for
use
of tr
eate
d w
aste
wat
er in
irri
gatio
n
Jo
rdan
ian
stan
dard
s fo
r us
e of
trea
ted
was
tew
ater
in ir
riga
tion
C
lass
1
Cla
ss 2
C
lass
3
G
reyw
ater
fro
m
rura
l set
ting
in
Jord
an
Bar
k ef
flue
nt a
Cha
rcoa
l eff
luen
t a S
and
effl
uent
a C
ooke
d ve
geta
bles
e
Fru
it tr
ees
e F
ield
cro
ps,
indu
stri
al c
rops
and
tr
ees
e
pH
64 b
6.
5-9
6.5-
9 6.
5-9
TS
S (
mg
L-1
)
845b
8-25
27
0-34
6 16
9-27
9 50
15
0 15
0
BO
D5
(mg
L-1
)
1060
b 10
-11
21-6
4 74
-95
30
200
300
CO
D (
mg
L-1
)
2570
b 23
1-74
5 30
8-72
0 38
6-87
4 10
0 50
0 50
0
Tot
-N (
mg
L-1
)
211
c 12
9-19
6 72
-99
190-
211
45
70
70
Tot
-P (
mg
L-1
)
20b
4-6
2-3
2-4
30
30
30
E.c
oli (
MP
N
100m
L-1
)
2×10
5 b 2×
103 -
3.6×
104 d
4.4×
104 -
7×
104
d 2×
103 –
4.2
×10
4 d
100
1000
a C
alcu
lati
ons
base
d on
the
tre
atm
ent
effi
cien
cies
obt
aine
d fo
r ba
rk a
nd c
harc
oal
and
sand
for
BO
D5
conc
entr
atio
ns i
n th
e in
flue
nt o
f 50
0-20
00 m
g L
-1 a
nd p
rese
nted
in
Tab
le 3
. b H
alal
sheh
(20
08)
c Sul
eim
an e
t al.
(201
0)
d E
. col
i not
ana
lyse
d in
this
wor
k, s
o re
mov
al a
ssum
ed to
be
sim
ilar
to th
at a
chie
ved
for
TT
C
e JI
SM
(20
06)

52
6.3 Nutrient availability
The need for plant nutrients in cultivation depends on the crop. Assuming that olive trees are irrigated with the treated greywater and based on the effluent content of mineral nitrogen and phosphorus reported in Papers II-IV, irrigation of a 74 m2 garden with 400 L m-2 year-1 (irrigation requirement for olives) of greywater treated in bark, charcoal or sand filters would result in the application of 430-658 kg N ha-1 and 12-21 kg P ha-1; 227-313 kg N ha-1 and 2.6-4.5 kg P ha-1; and 630-700 kg N ha-1 and 3.4-11 kg P ha-1, respectively. In olive production, the mineral N and P recommendation for traditional olive cultivation in the Mediterranean countries is 75-150 kg N ha-1 (0.5-1 kg N per tree) and 4.5-6 kg P ha-1 (30-40 g P per tree) (Ibrahim et al., 2009). In view of the irrigation requirement of olives and the fertiliser value of the effluent from all filter types, the nitrogen requirement of the olive crop would be fulfilled with a large surplus. The positive side of having nutrients in the effluent is that the need for other fertilisers is reduced, thereby mitigating the costs for purchasing mineral fertiliser and also the demand for energy inputs during its application. However, the excess nitrogen may pose a risk of pollution if the surplus water runs off to water courses or infiltrates to the groundwater (Paper II), which means noncompliance with the Jordanian standards (Table 6). The nitrification capacity in the filters is high and hence the effluent is rich in NO3
–
-N, which will increase the mobility of the nitrogen in the soil system and thus the risk of it contaminating drinking water resources. With well-managed, water-saving irrigation systems, such as drip irrigation, the risk of nitrogen leaching to groundwater should be low and the nitrogen can therefore be considered a pure asset. In arid regions, alternating irrigation with fresh water might be needed to ‘dilute’ the nutrient concentrations and thus avoid excessive application. Irrigation water is normally scarce and therefore not applied in larger amounts than necessary to compensate for evapotranspiration. Dilution, i.e. using greywater as a supplement to another source of water without plant nutrients, has the advantage that the plant nutrients can be spread over a much larger area, thus replacing and saving much more chemical fertiliser. If there is such an alternative source of water, the greywater would be distributed over a larger area than stated above, which would supply just sufficient amounts of nitrogen, 75 kg N ha-1.
The need for phosphorus fertilisation depends on how much phosphorus is stored in the soil (Jordan-Meille et al., 2012) and how available it is. The phosphorus content ranges from 4.9-14 mg Tot-P kg soil-1 in soils in Jordan. Excess phosphorus might not be a problem, as it can be adsorbed to the soil. However, the effluent from the charcoal filter might be deficient in mineral phosphorus. It should be pointed out here that greywater quality varies and
53
greywater from some settings might be low in nutrients. After treatment, such greywater can be considered just a water source for irrigation, rather than a fertiliser.
6.4 Hygienic quality
The TTC analyses in this thesis indicated reductions in this bacterial indicator of 1-2 log10 in the bark, charcoal and sand filters, with bark being slightly more efficient. The charcoal and sand effluents contained about 2 log10 of Enterococcus spp. as a result of presumed growth within the filters (Paper II), which might pose a risk upon recycling. Lewis et al. (1995) reported 3 log10
removal of E. coli and Enterococcus fecalis in bark of Pinus radiata treated by steam-explosion. In Paper V, the bark filters showed the highest removal rates of EHEC (1-3 log10) and the phage PhiX (2-3.7 log10), while charcoal showed the least capacity to reduce these tracer microorganisms (0-0.7 log10 for EHEC and 0.3-0.5 log10 for PhiX) among the three filter types. The high reduction of PhiX by the bark suggests that some human viruses might also be removed by this filter material. However, the effectiveness of virus removal might depend on their size, surface charge and other characteristics such as presence of an envelope.
The Jordanian standards regarding treated wastewater for irrigation use E. coli as an indicator to assess the microbial quality of the wastewater. As E. coli is included in the TTC analysis, similar reduction rates of this enterobacteria could be expected, which means that the estimated numbers of E. coli in the effluent from bark, charcoal and sand filters would have been 2×10³- 3.6×10⁴, 4.4×10⁴-7×10⁴ and 2×10³- 4.2×10⁴ MPN E. coli 100 mL-1, respectively (Table 6). However, these calculated figures can be underestimates of the real numbers of E. coli, because it is a subgroup of the TTC. Thus it seems that none of the effluents in the present work met the Jordan standards concerning E. coli. However, according to WHO guidelines for reuse of greywater in agriculture, the concentrations of E. coli in the effluent from all filter types were within the acceptable value of 103-105 E. coli 100 mL-1 (WHO, 2006). Protection of public health is always an important issue in wastewater treatment and basing regulations on microbial indicators is constantly under debate. The presence of the indicator organisms does not necessarily imply failure, as the indicators themselves are not pathogenic. One obvious drawback in using indicator organisms is that outside their normal habitat, they are frequently observed to behave differently to the pathogens that they are intended to indicate (Leclerc et al., 2001). Furthermore, indicators die off more

54
rapidly than the pathogens or sometimes even start to grow, i.e. increase in numbers (Warner, 2005).
It should be pointed out that source separation of greywater from blackwater is a measure in itself to decrease health risks related to wastewater contamination. Source separation decreases pathogenic indicators by 3-4 log (Ottoson & Stenström, 2003). The risk of pathogen transmission can also be minimised substantially by applying e.g. localised irrigation or drip irrigation (4-6 log10 reduction), crop washing (1 log10 reduction) or cooking (6-7 log10 reduction) (WHO, 2006). In addition, restricting the use of treated greywater to a single household could also be a way to manage health risks. The household is probably aware of any infected family members and could therefore be more cautious in using harvested crops or even avoid using the treated greywater at all for irrigation during infection periods. However, to our knowledge, there is no reported evidence in the literature of epidemics due to use of greywater.
6.5 Recycling of spent medium
All filter materials have a finite life and their failure is a matter of time (Kropf et al., 1977). Therefore, sooner or later, the spent medium will need to be replaced and the waste material will have to be disposed off. If the spent materials are to be spread onto the soil, not only should their content of carbon and plant nutrient be considered, but attention should also be paid to their hygienic and chemical quality. The possibilities of recycling spent bark and charcoal are facilitated by their light weight compared with sand, making them more advantageous as a filter material compared with sand. Using spent bark as a soil amendment should be possible and could be expected to improve the soil organic matter status (Hernández-Apaolaza et al., 2005). For example, Haynes and Swift (1986) reported that soil amendment with Pinus bark increased both plant growth and yield of blueberry. Bark containing adsorbed NH4
+-N and PO4-P could probably be viewed as a slow-release fertiliser. The high water retention capacity of the bark should also enhance the water-holding capacity of the soil. Depending on the wastewater quality treated by the filter, it could also contain trapped metals, both metals essential to the plants but also potentially toxic metals. Efficient adsorption of metals using bark is well documented (Argun et al., 2009; Genç-Fuhrman et al., 2007; Jang, 2005). In a short-term experiment, Linde et al. (2007) observed increased leaching of copper and chromium from contaminated soil covered with bark and attributed this to chelates formed with dissolved organic carbon binding and transporting the metals. Leaching of trace metals and phenols has also been observed from virgin, dried and granulated pine bark (Ribé et al., 2009). The advantage of

55
charcoal for many soil functions, leading to increased yields, is well documented and includes improved soil water retention and enhanced biomass of soil biota. In addition, environmental benefits have been observed, such as reduced greenhouse gas emissions (CO2 and N2O) from agricultural soils and increased carbon sequestration (Lehmann et al., 2011; Vaccari et al., 2011; Woolf et al., 2010; Deluca et al., 2009). Adsorption of heavy metals to charcoal can be regarded as advantageous when it is used as a filter, but also poses a risk when the filter material is recycled. In order to avoid contamination, household members should be careful not to dispose off products containing heavy metals or other hazardous compounds in greywater. Spent sand could be spread onto agricultural fields or used as a filling material for road construction. However, excavating and transporting the spent sand may be laborious and costly due to its heavy weight.


57
7 Conclusions and perspectives
Bark, charcoal and sand filters were studied in order to obtain information about the performance of these materials as low-cost alternatives for on-site greywater treatment for reuse as irrigation water. Treatment requirement, medium properties, biological activities, loading conditions and handling of spent medium are core aspects in describing, understanding and evaluation of such filters. Based on the literature review and the results presented in Papers I-V, the following conclusions were drawn:
7.1 Greywater pollution and treatment requirement
Greywater treatment is necessary to avoid environmental, aesthetic, operational and, most importantly, public health risks. For these reasons, lowering the organic matter content in the greywater and avoiding pathogen contamination are particularly important.
7.2 Effects of medium properties
The organic composition and hydraulic properties of bark, together with its swelling potential, enhanced the ability of this material to effectively remove organic matter, suspended solids and pathogenic indicators from greywater compared with charcoal and sand. The large specific surface area of the charcoal enhanced adsorption and the capacity for biological mineralisation of organic matter and removal of phosphorus. Charcoal was the most efficient material in removing nitrogen and phosphorus. The lower effectiveness of charcoal in removing suspended solids, pathogenic indicators and tracer microorganisms, compared with the bark, was mainly due to the charcoal having more uniform macropores. The small specific surface of the sand and the low porosity did not support effective removal of organic matter.

58
7.3 Effects of microbial activity, diversity and composition
The nutrient content of the greywater and the microbial population and composition of the bark itself resulted in establishment of active, distinct and rich bacterial community able to effectively treat the greywater, remove organic matter and allow nitrification. The greywater was the only source of nutrients in the biologically inert charcoal and sand filters, nourishing the microbes and allowing them to form biofilm rich and diverse in bacterial community. The potential respiration activity was higher in the charcoal than in the sand. The reason for this difference is probably the large specific surface area of the charcoal, which can host and shield a larger microbial community.
The potential respiration rate, nitrification activity, bacterial diversity and composition profiles all indicated that organic matter degradation and nitrification occurred mainly in the top 20 cm of the bark and charcoal filters. Therefore, a filter depth of 60 cm for bark and charcoal seems to be redundant for these biological processes.
7.4 Effects of loading conditions and treatment capacity
The general regression models showed that pollutant reduction in all filters proved to be influenced by the hydraulic and organic loading rates not only in the present run but also by those in the previous run.
The performance of the bark filter decreased at high hydraulic loading rates, largely because high water flow rates washed out more dissolved substances from the bark. Nevertheless, the bark achieved the highest removal of easily degraded organics among the filters. In the charcoal and the sand filters, the biofilm expanded in response to increasing hydraulic loading rates, which increased the removal capacity of organic matter compared with that at lower hydraulic loading rates. The high flow velocity associated with high hydraulic loading rates in all filters accelerated the transport of phosphorus and nitrogen species, lowering their reduction rate. The charcoal filters achieved the highest removal of phosphorus and nitrogen in all hydraulic and organic loading combinations.
All filters were favoured by high loadings of organic matter, which nourished their biofilms and thereby increased the removal of organic matter, nitrogen and phosphorus. At high organic loading rates more nitrogen and phosphorus were assimilated in the biofilm. This could be considered advantageous for short-term filter performance, because it enhances the removal rate. In the longer term, however, a thicker biofilm is disadvantageous because when the organic matter load decreases this biofilm is shed, resulting in emissions of pollutants. Bark filters had the highest potential treatment

59
capacity to deal with short term shock organic loads followed by charcoal filters.
7.5 Recycling opportunities and constraints
For the scenario of greywater recycling in rural communities in Jordan, greywater treatment in bark, charcoal and filters should provide a source of water that can be utilised for garden irrigation and can provide nitrogen and phosphorus as plant nutrients. However, the high E. coli levels in effluent from all filters pose a health risk in the event of direct human exposure to the treated greywater and the high nitrogen concentrations pose a risk of groundwater contamination with nitrate. Therefore to meet the Jordanian standards, measures to further decrease and shield possible pathogens and to lower levels of nitrogen are necessary.
Regarding the recycling of the spent filter materials, the spent bark can be used as a slow-release fertiliser and soil conditioner, while the charcoal can be used as a soil amendment to increase the nutrient and water-holding capacity of the soil. The spent sand might be a problem, since it has few recycling options and is difficult to handle and transport.
7.6 Future perspectives
Fungal activity might be important, particularly in the bark, for the degradation of greywater and also the bark itself. Bark and sand filters are materials obtained from nature, so archea might also play a role in the biological performance of the filters. Therefore, the domains of fungi and archea must be devoted more attention in future research to fully understand the capacity of bark, charcoal and sand filters.
Pine bark and charcoal were the filter media which performed best among the materials investigated here. However, different types and characteristics of bark and different parent materials and processing parameters of charcoal are found in different regions, so more research is needed in the future to optimise the performance of such filters.
The present study was performed in the laboratory, thus to determine the long-term treatment capacity of bark and charcoal filters needs further study in field conditions.


61
Acknowledgments
Wow, it should not take four and a half years to say thanks… should it? Supervisors first, Håkan Jönsson: thanks for all support, supervision, guidance and enthusiasm. I appreciated the critical questions and the positive attitude. Mikael Pell: Would “thank you, you are great” be enough?… However, more research is ongoing to find a more expressive way to say: thanks for all inspiring discussions, thorough readings and instant telephone answers. You were awesome at turning my manuscripts upside down and painting them with a tremendous number of red comments. Thanks for your unconditional support in every other aspect, including the ethernet cable, which you have spoiled . Lars Hylander: many thanks for your constructive guidance and supervision, including knocking on my office door and asking: “how is writing going?” Ingrid Öborn and Björn Vinnerås: thanks for the valuable input from your field of expertise in supervising my work. Sven Smårs, Carl Westberg and Dick Gustafsson: A big thank you for your help before, during and after the experiments. Many thanks to all colleagues and friends at the Department of Energy and Technology. Annika Nordin, Cecilia Lalander, Johanna Spångberg, Jörgen Fidjeland, Evgheni Ermolaev, Yoon Lin Chiew, Jenna Senecal, Agnes Willens and Elin Röös: thanks for the enjoyable discussions from science and fiction to wars and women’s rights! Hjördis Pell, Ingrid Mossberg, Kari Fidjeland and Sukanda Ermolaev: thanks for the wonderful non-research activities which I

62
had with each of you, including eating, knitting, walking, skating and playing games. The Agostini: Ghazala, Francesco, Mariem and Bilal: thanks for being my second family in Sweden. I will never forget you. My family ♥: thanks for all the love you gave to me. Mohammed, my lovely brother ♥: thanks for the weekly phone calls, which almost always came in the middle of my shower . My little sweeties: Yahya, Roaa, nephews and nieces ♥♥: thanks for the overseas candy, over-Facebook cake and the digital hugs. Pappa: I wish that you were still in this world. The study was carried out in the Department of Energy and Technology at the Swedish University of Agricultural Sciences (SLU), thanks to the financial support from the Islamic Development Bank (IDB), the Swedish Research Council (FORMAS) and the Swedish International Development Agency (SIDA).

63
References
Abu-Zreig, M., Rudra, R.P. & Dickinson, W.T. (2003). Effect of Application of Surfactants on Hydraulic Properties of Soils. Biosystems Engineering 84(3), 363-372.
Abu Ghunmi, L., Zeeman, G., Fayyad, M. & van Lier, J. (2011). Grey water biodegradability. Biodegradation 22(1), 163-174.
Addison, S., Slade, A. & Dennis, M. (2011). Effects of substrate composition on the structure of microbial communities in wastewater using fluorescence in situ hybridisation. Systematic and Applied Microbiology 34(5), 337-343.
Ahn, C.H., Park, J.K. & Kim, K. (2006). Microbial adaptability to organic loading changes in an enhanced biological phosphorus removal process. Journal of Environmental Engineering 132(8), 909-917.
Ahn, K.-H., Song, J.-H. & Cha, H.-Y. (1998). Application of tubular ceramic membranes for reuse of wastewater from buildings. Water Science and Technology 38(4–5), 373-382.
Aijiao, Z., Tao, T., Zhaohui, B. & Yong, Z. Effect of Charcoal Media for the Treatment of Wastewater in a Biological Filter. In: Proceedings of Bioinformatics and Biomedical Engineering, 2008. ICBBE 2008. The 2nd International Conference on, 16-18 May 2008 2008. pp. 3527-3530.
Al-Hamaiedeh, H. & Bino, M. (2010). Effect of treated grey water reuse in irrigation on soil and plants. Desalination 256(1-3), 115-119.
Almstrand, R., Lydmark, P., Sörensson, F. & Hermansson, M. (2011). Nitrification potential and population dynamics of nitrifying bacterial biofilms in response to controlled shifts of ammonium concentrations in wastewater trickling filters. Bioresource Technology 102(17), 7685-7691.
Amonette, J.E. & Josheph, S. (2009). Characteristics of Biochar: Microchemical Properties. In: Lehmann, J., et al. (Eds.) Biochar for environmental management science and technology. London: Earthscan. ISBN 978-1-84407-658-1.
Anderson, J.P.E. & Domsch, K.H. (1978). A physiological method for the quantitative measurement of microbial biomass in soils. Soil Biology and Biochemistry 10(3), 215-221.

64
Argun, M.E., Dursun, S. & Karatas, M. (2009). Removal of Cd(II), Pb(II), Cu(II) and Ni(II) from water using modified pine bark. Desalination 249(2), 519-527.
Arias, C.A., Del Bubba, M. & Brix, H. (2001). Phosphorus removal by sands for use as media in subsurface flow constructed reed beds. Water Research 35(5), 1159-1168.
Babel, S., Kurniawan, Tonni. Agustiono. (2004). Cr(VI) removal from synthetic wastewater using coconut shell charcoal and commercial activated carbon modified with oxidizing agents and/or chitosan. Chemosphere 54, 951-967.
Bae, W., Baek, S., Chung, J. & Lee, Y. (2001). Optimal operational factors for nitrite accumulation in batch reactors. Biodegradation 12(5), 359-366.
Bahgat, M., Dewedar, A. & Zayed, A. (1999). Sand-filters used for wastewater treatment: buildup and distribution of microorganisms. Water Research 33(8), 1949-1955.
Bai, Y., Sun, Q., Sun, R., Wen, D. & Tang, X. (2012). Comparison of denitrifier communities in the biofilms of bioaugmented and non-augmented zeolite–biological aerated filters. Environmental Technology 33(17), 1993-1998.
Bailey, S.E., Olin, T.J., Bricka, R.M. & Adrian, D.D. (1999). A review of potentially low-cost sorbents for heavy metals. Water Research 33(11), 2469-2479.
Baker, J.H. (1984). Factors affecting the bacterial colonization of various surfaces in a river. Canadian Journal of Microbiology 30(4), 511-515.
Bancolé, A., Brissaud, F. & Gnagne, T. (2004). Oxidation processes and clogging in intermittent unsaturated infiltration. In. pp. 139-146.
Bassin, J.P., Kleerebezem, R., Rosado, A.S., Loosdrecht, M.C.M.v. & Dezotti, M. (2012). Effect of different operational conditions on biofilm development, nitrification, and nitrifying microbial population in moving-bed biofilm reactors. Environmental Science & Technology 46(3), 1546-1555.
Beach, D.N.H., McCray, J.E., Lowe, K.S. & Siegrist, R.L. (2005). Temporal changes in hydraulic conductivity of sand porous media biofilters during wastewater infiltration due to biomat formation. Journal of Hydrology 311(1-4), 230-243.
Beal, C.D., Gardner, E.A., Kirchhof, G. & Menzies, N.W. (2006). Long-term flow rates and biomat zone hydrology in soil columns receiving septic tank effluent. Water Research 40(12), 2327-2338.
Berger, C. (2012). Biochar and activated carbon filters for greywater treatment: comparison of organic matter and nutrient removal. Diss. Sweden:Swedish University of Agricultural Sciences.
Beven, K. & Germann, P. (1982). Macropores and water flow in soils. Water Resources Research 18(5), 1311-1325.
Boller, M., Schwager, A., Eugster, J. & V, M. (1993). Dynamic bahavior of intermittent buried filters. Water Science & Technology 28(10), 99-107.
Bolton, J., Tummala, A., Kapadia, C., Dandamudi, M. & Belovich, J.M. (2006). Procedure to quantify biofilm activity on carriers used in wastewater

65
treatment systems. Journal of Environmental Engineering-Asce 132(11), 1422-1430.
Bongumusa, M.Z., Tandlich,R., Whittington-Jones, K. J., Burgess, J.E. (2007). Mulch tower treatment system Part I: Overall performance in greywater treatment. Desalination 242 38-56.
Braissant, O., Wirz, D., Göpfert, B. & Daniels, A.U. (2010). Use of isothermal microcalorimetry to monitor microbial activities. FEMS Microbiology Letters 303(1), 1-8.
Burnat, J. & Eshtaya, I. (2010). On-site greywater treatment in Qebia Village, palestine. In: McIlwaine, S., et al. (Eds.) Greywater Use in the Middle East: Technical, Social, Economic and Policy Issues. pp. 17-27. Warwickshire, UK: Practical Action Publishing Ltd, Schumacher Centre for Technology and Development Bourton on Dunsmore. ISBN 978 1 85339 698 4.
Calaway, W.T., Carroll, W.R. & Long, S.K. (1952). Heterotrophic Bacteria Encountered in Intermittent Sand Filtration of Sewage. Sewage and Industrial Wastes 24(5), 642-653.
Cardoza, Y.J., Vasanthakumar, A., Suazo, A. & Raffa, K.F. (2009). Survey and phylogenetic analysis of culturable microbes in the oral secretions of three bark beetle species. Entomologia Experimentalis et Applicata 131(2), 138-147.
Chabaud, S., Andres, Y., Lakel, A. & Cloirec, P.l. (2006a). Comparisons of packing materials in on-site wastewater treatment system. Water Practice & Technology 1(3), 7 pp.-7 pp.
Chabaud, S., Andres, Y., Lakel, A. & Le Cloirec, P. (2006b). Bacteria removal in septic effluent: Influence of biofilm and protozoa. Water Research 40(16), 3109-3114.
Chabaud, S., Martin-Laurent, F., Andres, Y., Lakel, A. & Le Cloirec, P. (2008). Evolution of bacterial community in experimental sand filters: Physiological and molecular fingerprints. Water, Air, and Soil Pollution 195(1-4), 233-241.
Chaillou, K., Gérente, C., Andrès, Y. & Wolbert, D. (2011). Bathroom Greywater Characterization and Potential Treatments for Reuse. Water, Air, & Soil Pollution 215(1), 31-42.
Chandy, J.P. & Angles, M.L. (2001). Determination of nutrients limiting biofilm formation and the subsequent impact on disinfectant decay. Water Research 35(11), 2677-2682.
Chau, J.F., Bagtzoglou, A.C. & Willig, M.R. (2011). The Effect of Soil Texture on Richness and Diversity of bacterial Communities. Environmental Forensics (12), 333-341.
Chibata, I., Tosa, T., Mori, T., Watanabe, T. & Sakata, N. (1986). Immobilized tannin — a novel adsorbent for protein and metal ion. Enzyme and Microbial Technology 8(3), 130-136.
Choi, Y.C., Li, X., Raskin, L. & Morgenroth, E. (2008). Chemisorption of oxygen onto activated carbon can enhance the stability of biological perchlorate

66
reduction in fixed bed biofilm reactors. Water Research 42(13), 3425-3434.
Christova-Boal, D., Eden, R.E. & McFarlane, S. (1996). An investigation into greywater reuse for urban residential properties. Desalination 106(1–3), 391-397.
Chu, L. & Wang, J. (2011). Nitrogen removal using biodegradable polymers as carbon source and biofilm carriers in a moving bed biofilm reactor. Chemical Engineering Journal 170(1), 220-225.
Corcoran, E., Nellemann, C., Baker, E., Bos, R., Osborn, D. & Savelli, H. (2010). Sick Water? The central role of wastewter management in sustainable development. A Rapid Responce Assessment. As, Norway: United Nations Environment Programme, UN-HAPITAT, GRID-Arendal.
Dalahmeh, S., Sayyed, M., Suleiman, W. Al-Hayek, Bassam., (2010). Grey Water Management in the North Eastern Badia of Jordan. In: Redwood, S.M.a.M. (Ed.) Greywater Use in the Middle East: Technical, Social, Economic and Policy Issues. pp. 54-79. Warwickshire, UK: Practical Action Publishing Ltd. ISBN ISBN 978-1-85339-698-4.
Dalva, M. & Moore, T.R. (1991). Sources and sinks of dissolved organic carbon in a forested swamp catchment. Biogeochemistry 15(1), 1-19.
Deluca, T.H., MacKenzie, M.D. & Gundale, M.J. (2009). Biochar effects on soil nutrient transformation. In: Lehmann, J., et al. (Eds.) Biochar for environmental management: science and technology UK: Earthscan.
Dixon, A., Butler, D., Fewkes, A. & Robinson, M. (2000). Measurement and modelling of quality changes in stored untreated grey water. Urban Water 1(4), 293-306.
Downie, A., krosky, A. & Munroe, P. (2009). Physical Properties of Biochar. In: Lehmann, J., et al. (Eds.) Biochar for environmental management science and technology. London: Earthscan. ISBN 978-1-84407-658-1.
Dunbar, J., Ticknor, L.O. & Kuske, C.R. (2000). Assessment of microbial diversity in four Southwestern United States soils by 16S rRNA gene terminal restriction fragment analysis. Applied And Environmental Microbiology 66(7), 2943-2950.
Ehlers, G.A.C. & Turner, S.J. (2012). Biofilms in Wastewater Treatment Systems. Wymondham: Caister Academic Press. (Microbial Biofilm: Current Research and Applications. ISBN 978-1-904455-96-7.
El Zuraiq, S., Rusan, M.J. & AL Qawasmi, W. (2004). Fertigation in Jordan. In: IPI regional workshop on Potassium and Fertigation development in West Asia and North Africa. Rabat, Morocco, .
EPA, U. (2002). Onsite wastewater treatment systems manual. EPA/625/R-00/008. Eriksson, E., Andersen, H.R., Madsen, T.S. & Ledin, A. (2009). Greywater
pollution variability and loadings. Ecological Engineering 35(5), 661-669. Eriksson, E., Auffarth, K., Henze, M., Ledin, A. (2002). Characteristics of grey
wastewater. Urban Water 4, 85-104. FAO (2007). Coping with water scarcity: challenge of the twenty first century:
Food and Agriculture Organisation.

67
Fest, E.P.M.J., Temminghoff, E.J.M., Comans, R.N.J. & van Riemsdijk, W.H. (2008). Partitioning of organic matter and heavy metals in a sandy soil: Effects of extracting solution, solid to liquid ratio and pH. Geoderma 146(1–2), 66-74.
Friedler, E. & Hadari, M. (2006). Economic feasibility of on-site greywater reuse in multi-storey buildings. Desalination 190(1–3), 221-234.
Genç-Fuhrman, H., Mikkelsen, P.S. & Ledin, A. (2007). Simultaneous removal of As, Cd, Cr, Cu, Ni and Zn from stormwater: Experimental comparison of 11 different sorbents. Water Research 41(3), 591-602.
Ghunmi, L.A., Zeeman, G., Lier, J.v. & Fayyed, M. (2008). Quantitative and qualitative characteristics of grey water for reuse requirements and treatment alternatives: the case of Jordan. Water Science & Technology— 58(7), 1385-1396.
Gilbert, Y., Bihan, Yann. Le., Aubry, Genevie`ve., Veillette, Marc., Duchaine, Caroline., Lessard, Paul. (2008). Microbiological and molecular characterization of denitrification in biofilters treating pig manure. Bioresource Technology 99 4495-4502.
Gómez-Villalba, B., Calvo, C., Vilchez, R., González-López, J. & Rodelas, B. (2006). TGGE analysis of the diversity of ammonia-oxidizing and denitrifying bacteria in submerged filter biofilms for the treatment of urban wastewater. Applied Microbiology and Biotechnology 72(2), 393-400.
Hagerman, A. & Robbins, C. (1987). Implications of soluble tannin-protein complexes for tannin analysis and plant defense mechanisms. Journal of Chemical Ecology 13(5), 1243-1259.
Halalsheh, M., Dalahmeh, S., Sayed, M., Suleiman, W., Shareef, M., Mansour, M., Safi, M. (2008). Grey water characteristics and treatment options for rural areas in Jordan. Bioresource Technology 99, 6635-6641.
Haussard, M., Gaballah, I., Kanari, N., de Donato, P., Barrès, O. & Villieras, F. (2003). Separation of hydrocarbons and lipid from water using treated bark. Water Research 37(2), 362-374.
Haynes, R.J. & Swift, R.S. (1986). Effect of soil amendments and sawdust mulching on growth, yield and leaf nutrient content of highbush blueberry plants. Scientia Horticulturae 29(3), 229-238.
Healy, M.G., Rodgers, M. & Mulqueen, J. (2007). Treatment of dairy wastewater using constructed wetlands and intermittent sand filters. Bioresource Technology 98(12), 2268-2281.
Healy, M.G., Rodgers, M., Mulqueen, J. (2007). Performance of a stratified sand filter in removal of chemical oxygen demand, total suspended solids and ammonia nitrogen from high-strength wastewaters. Journal of Environmental Management 83.
Hernández-Apaolaza, L., Gascó, A.M., Gascó, J.M. & Guerrero, F. (2005). Reuse of waste materials as growing media for ornamental plants. Bioresource Technology 96(1), 125-131.

68
Hernández Leal, L., Temmink, H., Zeeman, G. & Buisman, C.J.N. (2011). Characterization and anaerobic biodegradability of grey water. Desalination 270(1–3), 111-115.
Hernández Leal, L., Zeeman, G., Temmink, H. & Buisman, C. (2007). Characterisation and biological treatment of greywater. In. pp. 193-200.
Hu, M., Wang, X., Wen, X. & Xia, Y. (2012). Microbial community structures in different wastewater treatment plants as revealed by 454-pyrosequencing analysis. Bioresource Technology 117(0), 72-79.
Ibrahim, A.A., Boulouha, B., Gregorian, C., El-Kholy, M., Ksantini, M., Serafids, N. & Shdiefat, S. (2009). Olive gap manual- Good agricultural practices for the near east & north africa countries: FAO.
Immerzeel, W., Droogers, P., Terink, W., Hoogeveen, J., Hellegers, P., Bierkens, M. & Beek, R.v. (2011). Middle-East and Northern Africa Water Outlook. The Netherlands: Futurewater. World bank; 98).
Jamrah, A. & Ayyash, S. (2008). greywter generation and charcaterization in major cities in Jordan. Jordan Journal of Civil Engineering 2(4), 376-390.
Jang, A.S., Youngwoo Bishop, Paul L. (2005). The removal of heavy metals in urban runoff by srption on mulch. Environmental Pollution 133, 117-127.
Jefferson, B., Laine, A., Parsons, S., Stephenson, T. & Judd, S. (2000). Technologies for domestic wastewater recycling. Urban Water 1(4), 285-292.
Jimenez, B., Drechsel, P., Kone, D., Bahri, A., Raschid-Sally, L. & Qadir, M. (2010). Wastewater, Sludge and Excreta Use in Developing Countries: An Overview. In: Drechsel, P., et al. (Eds.) Wastewater Irrigation and Health- Assessing and Mitigating Risk in Low-Income Countries. 1. ed. p. 404. London, UK: Earthscan, International Development Center and International Water management Institute. ISBN 978-1-84407-796-0.
JISM (2006). Jordanian standards for reclaimed wastewater reuse in agriculture. In. Jordan: JSIM.
Jones, C.M., Stres, B., Rosenquist, M. & Hallin, S. (2008). Phylogenetic Analysis of Nitrite, Nitric Oxide, and Nitrous Oxide Respiratory Enzymes Reveal a Complex Evolutionary History for Denitrification. Molecular Biology and Evolution 25(9), 1955-1966.
Jordan-Meille, L., Rubæk, G.H., Ehlert, P.A.I., Genot, V., Hofman, G., Goulding, K., Recknagel, J., Provolo, G. & Barraclough, P. (2012). An overview of fertilizer-P recommendations in Europe: soil testing, calibration and fertilizer recommendations. Soil Use and Management 28(4), 419-435.
Joseph A, Cotteral Jr & Norris, D.P. (1969). Septic Tank Systems. Journal of the Sanitary Engineering Division SA:4, 715-746.
Kim, K.T., Kim, I.S., Hwang, S.H. & Kim, S.D. (2006). Estimating the combined effects of copper and phenol to nitrifying bacteria in wastewater treatment plants. Water Research 40(3), 561-568.
Koops, H.-P., Purkhold, U., Pommerening-Röser, A., Timmermann, G. & Wagner, M. (2006). The lithoautotrophic ammonia-oxidizing bacteria. In: Dworkin, M., et al. (Eds.) The Prokaryotes. Springer. pp. 778-811.

69
Kropf, F.W., Laak, R. & Healey, K.A. (1977). Equilibrium Operation of Subsurface Absorption Systems. Journal (Water Pollution Control Federation) 49(9), 2007-2016.
Lauchnor, E.G., Radniecki, T.S. & Semprini, L. (2011). Inhibition and gene expression of Nitrosomonas europaea biofilms exposed to phenol and toluene. Biotechnology and Bioengineering 108(4), 750-757.
Lazarova, V. & Manem, J. (1995). Biofilm characterization and activity analysis in water and wastewater treatment. Water Research 29(10), 2227-2245.
Leclerc, H., Mossel, D.A.A., Edberg, S.C. & Struijk, C.B. (2001). Advances in the Bacteriology of the Coliform Group: Their Suitability as Markers of Microbial Water Safety. Annual Review of Microbiology 55(1), 201-234.
Lehmann, J., Rillig, M.C., Thies, J., Masiello, C.A., Hockaday, W.C. & Crowley, D. (2011). Biochar effects on soil biota - A review. Soil Biology and Biochemistry 43(9), 1812-1836.
Leininger, S., Urich, T., Schloter, M., Schwark, L., Qi, J., Nicol, G.W., Prosser, J.I., Schuster, S.C. & Schleper, C. (2006). Archaea predominate among ammonia-oxidizing prokaryotes in soils. Nature 442(7104), 806-809.
Lens, P.N., Vochten, P.M., Speleers, L. & Verstraete, W.H. (1994). Direct treatment of domestic wastewater by percolation over peat, bark and woodchips. Water Research 28(1), 17-26.
Leverenz, H.L., Tchobanoglous, G. & Darby, J.L. (2009). Clogging in intermittently dosed sand filters used for wastewater treatment. Water Research 43(3), 695-705.
Lewis, G.D., Lomax, T.D. & Kimberley, M. (1995). Removal of virus particles, bacteria and bovine serum albumin from water by steam-exploded Pinus radiata bark. Water Research 29(7), 1689-1693.
Li, A.Y.L. & DiGiano, F.A. (1983). Availability of Sorbed Substrate for Microbial Degradation on Granular Activated Carbon. Journal (Water Pollution Control Federation) 55(4), 392-399.
Li, H., Li, Y., Sun, T. & Wang, X. (2012). The use of a subsurface infiltration system in treating campus sewage under variable loading rates. Ecological Engineering 38(1), 105-109.
Li, M.-Y., Zhang, J., Lu, P., Xu, J.-L. & Li, S.-P. (2009). Evaluation of Biological Characteristics of Bacteria Contributing to Biofilm Formation. Pedosphere 19(5), 554-561.
Li, Y., Chen, B. & Zhu, L. (2010). Enhanced sorption of polycyclic aromatic hydrocarbons from aqueous solution by modified pine bark. Bioresource Technology 101(19), 7307-7313.
Limpiyakorn, T., Fürhacker, M., Haberl, R., Chodanon, T., Srithep, P. & Sonthiphand, P. (2013). amoA-encoding archaea in wastewater treatment plants: a review. Applied Microbiology and Biotechnology 97(4), 1425-1439.
Linde, M., Öborn, I. & Gustafsson, J. (2007). Effects of Changed Soil Conditions on the Mobility of Trace Metals in Moderately Contaminated Urban Soils. Water, Air, and Soil Pollution 183(1-4), 69-83.

70
Liu, R., Yu, Z., Guo, H., Liu, M., Zhang, H. & Yang, M. (2012). Pyrosequencing analysis of eukaryotic and bacterial communities in faucet biofilms. Science of The Total Environment 435–436(0), 124-131.
Mandal, D., Labhasetwar, P., Dhone, S., Dubey, A.S., Shinde, G. & Wate, S. (2011). Water conservation due to greywater treatment and reuse in urban setting with specific context to developing countries. Resources, Conservation and Recycling 55(3), 356-361.
March, J.G., Gual, M. & Orozco, F. (2004). Experiences on greywater re-use for toilet flushing in a hotel (Mallorca Island, Spain). Desalination 164(3), 241-247.
Matsis, V.M. & Grigoropoulou, H.P. Interaction of Activated Carbon and Dissolved Oxygen In: Proceedings of The 10th International Conference on Environmental Science and Technology, Kos Island, Greece, 5-7 September 2007 2007. pp. A939- A-945.
McGauhey, P.H. & Winneberger, J.H. (1964). Studies of the Failure of Septic Tank Percolation Systems. Water Pollution Control Federation 36(5), 593-606.
Miranda, I., Gominho, J., Mirra, I. & Pereira, H. (2012). Chemical characterization of barks from Picea abies and Pinus sylvestris after fractioning into different particle sizes. Industrial Crops and Products 36(1), 395-400.
Moore, R., Quarmby, J. & Stephenson, T. (2001). The effects of media size on the performance of biological aerated filters. Water Research 35(10), 2514-2522.
Morel, A. & Diener, S. (2006). Greywater management in low and middle-income countries, review of different treatment systems for households or neighbourhoods. Dübendorf: Swiss Federal Institute of Aquatic Science and Technology (Eawag).
Mourad, K.A., Berndtsson, J.C. & Berndtsson, R. (2011). Potential fresh water saving using greywater in toilet flushing in Syria. Journal of Environmental Management 92(10), 2447-2453.
Mukherjee, S., Kumar, S., Misra, A.K. & Fan, M. (2007). Removal of phenols from water environment by activated carbon, bagasse ash and wood charcoal. Chemical Engineering Journal 129(1-3), 133-142.
Naasz, R., Michel, J.-C. & Charpentier, S. (2005). Measuring Hysteretic Hydraulic Properties of Peat and Pine Bark using a Transient Method. Soil Sci. Soc. Am. J. 69(1), 13-22.
Naasz, R., Michel, J.C. & Charpentier, S. (2008). Water repellency of organic growing media related to hysteretic water retention properties. European Journal of Soil Science 59(2), 156-165.
Naether, A., Foesel, B.U., Naegele, V., Wüst, P.K., Weinert, J., Bonkowski, M., Alt, F., Oelmann, Y., Polle, A., Lohaus, G., Gockel, S., Hemp, A., Kalko, E.K.V., Linsenmair, K.E., Pfeiffer, S., Renner, S., Schöning, I., Weisser, W.W., Wells, K., Fischer, M., Overmann, J. & Friedrich, M.W. (2012). Environmental Factors Affect Acidobacterial Communities below the

71
Subgroup Level in Grassland and Forest Soils. Applied And Environmental Microbiology 78(20), 7398-7406.
Nghiem, L.D., Oschmann, N. & Schäfer, A.I. (2006). Fouling in greywater recycling by direct ultrafiltration. Desalination 187(1-3), 283-290.
Nugroho, R.A., Röling, W.F.M., Laverman, A.M., Zoomer, H.R. & Verhoef, H.A. (2005). Presence of Nitrosospira cluster 2 bacteria corresponds to N transformation rates in nine acid Scots pine forest soils. FEMS Microbiology Ecology 53(3), 473-481.
O’Toole, J., Sinclair, M., Malawaraarachchi, M., Hamilton, A., Barker, S.F. & Leder, K. (2012). Microbial quality assessment of household greywater. Water Research 46(13), 4301-4313.
Okubo, T. & Matsumoto, J. (1983). Biological clogging of sand and changes of organic constituents during artificial recharge. Water Research 17(7), 813-821.
Ottoson, J. & Stenstrom, T.A. (2003). Faecal contamination of greywater and associated microbial risks. Water Research 37(3), 645-655.
Ottoson, J. & Stenström, T.A. (2003). Faecal contamination of greywater and associated microbial risks. Water Research 37(3), 645-655.
Park, H.D., Wells, G.F., Bae, H., Griddle, C.S. & Francis, C.A. (2006). Occurrence of ammonia-oxidizing archaea in wastewater treatment plant bioreactors. Applied And Environmental Microbiology 72(8), 5643-5647.
Pell, M. (1991). Microbiology and nitrogen transformation in sand-filter systems for treatment of household septic-tank effluents. Diss. Uppsala:Swedish university of agricutural sciences.
Pell, M. & Ljunggren, H. (1996). Composition of the bacterial population in sand-filter columns receiving artificial wastewater, evaluated by soft independent modelling of class analogy (SIMCA). Water Research 30(10), 2479-2487.
Pell, M. & Nyberg, F. (1989a). Infiltration of waste-water in a newly started pilot sand-filter system .1. Reduction of organic-matter and phosphorus. Journal of Environmental Quality 18(4), 451-457.
Pell, M. & Nyberg, F. (1989b). Infiltration of waste-water in a newly started pilot sand-filter system .2. Development and distribution of the bacterial-populations. Journal of Environmental Quality 18(4), 457-462.
Pell, M. & Nyberg, F. (1989c). Infiltration of Wastewater in a Newly Started Pilot Sand-Filter System: III. Transformation of Nitrogen. Journal of Environmental Quality 18(4), 463-467.
Pell, M., Nyberg, F. & Ljunggren, H. (1990). Microbial numbers and activity during infiltration of septic-tank effluent in a subsurface sand filter. Water Research 24(11), 1347-1354.
Pell, M. & Wörman, A. (2008). Biological Wastewater Treatment Systems. In: Editors-in-Chief: Sven Erik, J., et al. (Eds.) Encyclopedia of Ecology. pp. 426-441. Oxford: Academic Press. ISBN 978-0-08-045405-4.

72
Pietikäinen, J., Kiikkilä, O. & Fritze, H. (2000). Charcoal as a Habitat for Microbes and Its Effect on the Microbial Community of the Underlying Humus. Oikos 89(2), 231-242.
Prochaska, C.A. & Zouboulis, A.I. (2003). Performance of Intermittently Operated Sand Filters: A Comparable Study, Treating Wastewaters of Different Origins. Water, Air, & Soil Pollution 147(1), 367-388.
Rajeb, A.B., Kallali, H., Aissa, N.B., Bouzaiene, O., Jellali, S., Jedidi, N. & Hassen, A. (2009). Soil microbial growth and biofilm expansion assessment under wastewater infiltration percolation treatment process: column experiments. Desalination 246(1-3), 514-525.
Ramona, G., Green, M., Semiat, R. & Dosoretz, C. (2004). Low strength graywater characterization and treatmentby direct membrane filtration. Desalination 170(3), 241-250.
Ratola, N., Botelho, C. & Alves, A. (2003). The use of pine bark as a natural adsorbent for persistent organic pollutants - Study of lindane and heptachlor adsorption. Journal of Chemical Technology and Biotechnology 78(2-3), 347-351.
Redwood, M. (2010). Introduction: the greywater use in the middle east. The story so far. In: McIlwaine, S., et al. (Eds.) Greywater Use in the Middle East: Technical, Social, Economic and Policy Issues. Warwickshire, UK: Practical Action Publishing Ltd. pp. 1-12.
Ribé, V., Nehrenheim, E., Odlare, M. & Waara, S. (2009). Leaching of contaminants from untreated pine bark in a batch study: Chemical analysis and ecotoxicological evaluation. Journal of Hazardous Materials 163(2-3), 1096-1100.
Rodgers, M., Healy, M.G. & Mulqueen, J. (2005). Organic carbon removal and nitrification of high strength wastewaters using stratified sand filters. Water Research 39(14), 3279-3286.
Rodgers, M., Mulqueen, J. & Healy, M.G. (2004). Surface clogging in an intermittent stratified sand filter. Soil Science Society of America Journal 68(6), 1827-1832.
Rolland, L., Molle, P., Liénard, A., Bouteldja, F. & Grasmick, A. (2009). Influence of the physical and mechanical characteristics of sands on the hydraulic and biological behaviors of sand filters. Desalination 248(1–3), 998-1007.
Rose, J.B., Sun, Gwo-Shing., Gerba, Charles P., And Sinclair, Norval A. (1991). Microbial Quality And Persistence Of Enteric Pathogens In Graywater From Various Household Sources. Water Research 25(1), 37-42.
Rowell, R.M., Hann, J.S. & Byrd, V.L. (2012). Fiber Webs. In: Rowell, R.M. (Ed.) Handbook of Wood Chemistry and Wood Composite. CRC Press. pp. 349-363.
Scholz, M. & Martin, R.J. (1997). Ecological equilibrium on biological activated carbon. Water Research 31(12), 2959-2968.
Scott, C.A., Faruqui, N.I. & Raschid-Sally, L. (2004). Wastewater Use in Irrigated Agriculture: Management Challenges in Developing Countries. In: Scott, C.A., et al. (Eds.) Wastewater Use in Irrigated Agriculture: Confronting

73
the Livelihood and Environmental Realities. pp. 2-3. Oxfordshire, UK: IDRC and CABI.
Shafran, A.W., Ronen, Z., Weisbrod, N., Adar, A., Gross, A. (2006). Potential changes in soil properties following irrigation with surfactant-rich greywater. Ecological Engineering 26, 348–354.
Sharvelle, S., McLamore, E. & Banks, M.K. (2008). Hydrodynamic characteristics in biotrickling filters as affected by packing material and hydraulic loading rate. Journal of Environmental Engineering-Asce 134(5), 346-352.
Shimp, R.J. & Pfaender, F.K. (1982). Effects of surface area and flow rate on marine bacterial growth in activated carbon columns. Applied And Environmental Microbiology 44(2), 471-477.
Siegrist, R.L. & Boyle, W.C. (1987). Wastewater-induced soil clogging development. Journal of Environmental Engineering 113(3), 550-566.
Siegrist, R.L., Tyler, E.J. & Jenssen, P.D. (2000). Design and Performance of Onsite Wastewater Soil Absorption Systems. In: National Research Needs Conference: Risk-Based Decision Making for Onsite Wastewater Treatment. Palo Alto, CA.: Electric Power Research Institute.
Soto, R., Freer, J. & Baeza, J. (2005). Evidence of chemical reactions between di- and poly-glycidyl ether resins and tannins isolated from Pinus radiata D. Don bark. Bioresource Technology 96(1), 95-101.
Stefanakis, A.I. & Tsihrintzis, V.A. (2012). Effects of loading, resting period, temperature, porous media, vegetation and aeration on performance of pilot-scale vertical flow constructed wetlands. Chemical Engineering Journal 181–182(0), 416-430.
Stevik, T.K., Ausland, G., Hanssen, J.F. & Jenssen, P.D. (1999). The influence of physical and chemical factors on the transport of E. coli through biological filters for wastewater purification. Water Research 33(18), 3701-3706.
Suleiman, W., Al-Hayek, B., Assayed, M., Dalahmeh, S. & Al-Hmoud, N. (2010). Greywater management in the northeastern Badia of Jordan In: McIlwaine, S., et al. (Eds.) Greywater Use in the Middle East: Technical, Social, Economic and Policy Issues. pp. 59-74. Warwickshire, UK: Practical Action Publishing Ltd, Schumacher Centre for Technology and Development Bourton on Dunsmore. ISBN 978 1 85339 698 4.
Tchobanoglous, G., Burton, F. L. Stensel, D., Metcalf & Eddy Inc, Burton, F. (2002). Wastewater Engineering fourth eddition. ed: Published by McGraw-Hill Professional, 2002. ISBN 0070418780, 9780070418783.
The Council of the European Communities (1991). Council Directive of 21 May 1991 Concerning Urban Waste Water treatment. In. The Council of the European Communities. p. 13.
Thies, J.E. & Rilling, M.C. (2009). Charcateristic of biochar: biological properties. In: Lehmann, J., et al. (Eds.) Biochar for environmental management science and technology. London: Earthscan. ISBN 978-1-84407-658-1.

74
Tijhuis, L., Van Loosdrecht, M.C.M. & Heijnen, J.J. (1994). Formation and growth of heterotrophic aerobic biofilms on small suspended particles in airlift reactors. Biotechnology and Bioengineering 44(5), 595-608.
Travis, M.J., Wiel-Shafran, A., Weisbrod, N., Adar, E. & Gross, A. (2010). Greywater reuse for irrigation: Effect on soil properties. Science of The Total Environment 408(12), 2501-2508.
Trulear, M.G. & Characklis, W.G. (1982). Dynamics of Biofilm Processes. Journal (Water Pollution Control Federation) 54(9), 1288-1301.
Truu, J., Nurk, K., Juhanson, J. & Mander, Ü. (2005). Variation of miorobiologioal parameters within planted soil filter for domestic wastewater treatment. Journal of Environmental Science and Health - Part A Toxic/Hazardous Substances and Environmental Engineering 40(6-7), 1191-1200.
UN-Water (2006). Water: A shared responsibility. Paris. (The United Nations World Water Development. ISSN Report 2.
USEPA (2004). Guidelines for Water Reuse. Washington D.C: US Environmental Protection Agency; EPA/625/R-04/108).
Vaccari, F.P., Baronti, S., Lugato, E., Genesio, L., Castaldi, S., Fornasier, F. & Miglietta, F. (2011). Biochar as a strategy to sequester carbon and increase yield in durum wheat. European Journal of Agronomy 34(4), 231-238.
Van Cuyk, S., Siegrist, R., Logan, A., Masson, S., Fischer, E. & Figueroa, L. (2001). Hydraulic and purification behaviors and their interactions during wastewater treatment in soil infiltration systems. Water Research 35(4), 953-964.
Van Duck, P.J., H. Van I.E Voorde (1984). Activated Charcoal And Microflora In Water Treatment. Water Research 18(11), 1361-1364.
Wanko, A., Mose, R. & Beck, C. (2005). Biological Processing Capacities and Biomass Growth in Waste Water Treatment by Infiltration On two Kinds of Sand. Water, Air, and Soil Pollution 165(1-4), 279-299.
Warner, W.S. (2005). Understanding greywater treatment. In: David Butler, F.M. (Ed.) Water Demand Managment. p. 384 London/ UK: IWA Publishing ISBN 1843390787.
WHO (2003). Water sanitation and health: WHO; WHO/WSH/WWD/TA.8). WHO (2006). WHO guidelines for the safe use of wastewater, excreta and
greywater. In. Geneva: World health organization. p. 182. WHO (2008). Global Burden of Disease 2004 Update. Geneva, World Helath
Organization. WHO/UNICEF (2012). Progress on Drinking Water and Sanitaion 2012 update New York, UNICEF, Geneva , World health organization. Wijeyekoon, S., Mino, T., Satoh, H. & Matsuo, T. (2004). Effects of substrate
loading rate on biofilm structure. Water Research 38(10), 2479-2488. Wild, H.E., Jr., Sawyer, C.N. & McMahon, T.C. (1971). Factors Affecting
Nitrification Kinetics. Journal (Water Pollution Control Federation) 43(9), 1845-1854.
75
Wilson, J., Boutilier, L., Jamieson, R., Havard, P. & Lake, C. (2011). Effects of Hydraulic Loading Rate and Filter Length on the Performance of Lateral Flow Sand Filters for On-Site Wastewater Treatment. Journal of Hydrologic Engineering 16(8), 639-649.
Vinnerås, B., Palmquist, H., Balmér, P. & Jönsson, H. (2006). The characteristics of household wastewater and biodegradable solid waste—A proposal for new Swedish design values. Urban Water Journal 3(1), 3-11.
Woolf, D., Amonette, J.E., Street-Perrott, F.A., Lehmann, J. & Joseph, S. (2010). Sustainable biochar to mitigate global climate change. Nat Commun 1, 56.
World Bank (2010). Sustaining Water for All in a Changing Climate. Washington: World bank 57125).
Wu, J., West, L.J. & Stewart, D.I. (2002). Effect of humic substances on Cu(II) solubility in kaolin-sand soil. Journal of Hazardous Materials 94(3), 223-238.
Zeeman, G., Kujawa, K., de Mes, T., Hernandez, L., de Graaff, M., Abu-Ghunmi, L., Mels, A., Meulman, B., Temmink, H., Buisman, C., van Lier, J. & Lettinga, G. (2008). Anaerobic treatment as a core technology for energy, nutrients and water recovery from source-separated domestic waste(water). In. pp. 1207-1212.
Zou, J.L., Dai, Y., Sun, T.H., Li, Y.H., Li, G.B. & Li, Q.Y. (2009). Effect of amended soil and hydraulic load on enhanced biological nitrogen removal in lab-scale SWIS. Journal of Hazardous Materials 163(2–3), 816-822.
