barings uk unit trusts - morningstar, inc
TRANSCRIPT

Barings UK Unit TrustsInterim Report & Unaudited Financial Statementsfor the half year ended 28 February 2021

2
Barings UK Unit TrustsInterim Report and Unaudited Financial Statements
For the period ended 28 February 2021Contents
Introduction 3
Trusts Available in Hong Kong 3
Barings Europe Select Trust 4
Barings German Growth Trust 19
Barings Strategic Bond Fund 35
The Risk and Reward profile* 47
Other Important Information* 49
Disclosure for Overseas Investors 51
Unit Price History - Hong Kong Registered Trusts 58
Directory* 63
* These pages, together with the investment report, directors' statement, trust information table disclosure and portfolio statement of each trust comprise the Manager's Report

3
Barings UK Unit TrustsIntroduction
These Interim Reports and Unaudited Financial Statements cover the period from 1 September 2020 to 28 February 2021 and review the performance and market outlook for three of the unit trusts managed by Baring Fund Managers Limited (“the Manager”). These comprise the Barings Europe Select Trust, the Barings German Growth Trust and the Barings Strategic Bond Fund (“the Trusts”).Baring Asset Management Limited is the Investment Manager for the Trusts.The functional and presentational currency for all the Trusts is Sterling except for the Barings German Growth Trust where the functional and presentational currency is Euros.As an investor in one of the Trusts, your money is pooled with that of other investors in the same Trust and invested by the Manager in line with the Investment Objective of the particular trust.For further information about the Trusts please visit the Barings website, www.barings.com.Trusts Available in Hong KongWarning: In relation to the trusts as set out in this interim report, only the following trusts are authorised by the Securities and Futures Commission (“SFC”) pursuant to Section 104 of the Securities and Futures Ordinance of Hong Kong (“SFO”) and hence may be offered to the public of Hong Kong:• Barings Europe Select Trust• Barings German Growth TrustThe SFC’s authorisation is not a recommendation or endorsement of a scheme nor does it guarantee the commercial merits of a scheme or its performance. It does not mean the scheme is suitable for all investors nor is it an endorsement of its suitability for any particular investor or class of investors.Please note that this interim financial report is a global document and therefore also contains information of the following trusts which are not authorised by the SFC in Hong Kong and not available to the public in Hong Kong.• Barings Strategic Bond FundNo offer shall be made to the public of Hong Kong in respect of the above unauthorised trusts and unauthorised collective investment schemes.COVID-19 The spread of COVID-19 around the world in 2020 has caused significant volatility in international markets. There is still uncertainty around the breadth and duration of business disruptions related to COVID-19, as well as its impact on the international economies and, as such, the Manager is actively monitoring the extent of the impact to its operations, financial accounting and reporting.

4
Barings Europe Select TrustInvestment Objective and Policy and Trust at a Glance
Investment Objective and PolicyThe investment objective of Barings Europe Select Trust (the “Trust”) is to achieve capital growth by investing in Europe excluding the United Kingdom. The Trust will seek to achieve its investment objective by investing at least 75% of its total assets directly and indirectly in equities and equity-related securities of smaller companies incorporated in, or exercising the predominant part of their economic activity in Europe excluding the United Kingdom, or quoted or traded on the stock exchanges in Europe excluding the United Kingdom.Smaller European companies can be defined as those companies which are constituents of the bottom 30% of total market capitalisation of Europe’s listed companies (this excludes companies in the United Kingdom).For the remainder of its total assets, the Trust may invest directly and indirectly in equities and equity-related securities outside of Europe (including in the United Kingdom), as well as in larger companies, and in fixed income and cash.In order to implement the investment policy, the Trust may gain indirect exposure through American depositary receipts, global depositary receipts and other equity related securities including participation notes, structured notes, equity-linked notes and debt securities convertible into equities. The Trust may also obtain indirect exposure through investments in collective investment schemes (including collective investment schemes managed by the Manager or an associate of the Manager) and other transferable securities. It may also use derivatives including futures, options, swaps, warrants and forward contracts for efficient portfolio management (including hedging).Please refer to the Prospectus for the full investment objective and policy.Performance Comparator The Trust is not managed to a benchmark, however the Manager uses the EMIX Smaller European Companies Ex UK (Total Gross Return) Index to assess the Trust’s performance. The Manager considers the performance comparator to be an appropriate assessment tool because it tracks the performance of small and medium sized companies from developed European countries excluding the UK.How the Trust is ManagedAt Barings, our equity investment teams share the philosophy of quality “Growth at a Reasonable Price” or GARP. We believe that earnings growth is the principal driver of equity market performance over the medium to long term, and favour high-quality companies for their ability to outperform the market on a risk-adjusted basis. In particular, we believe that structured fundamental research and a disciplined investment process combining quality, growth and upside disciplines can allow us to identify attractively priced, long-term growth companies which will outperform the market. Our approach emphasises quality criteria when looking at companies and a three- to five-year time horizon when forecasting company earnings. In determining upside, we use consistent and transparent methods to place emphasis on discounted earnings models. We value companies on a long term-term basis utilizing proprietary valuation models that incorporate ESG analysis and macro considerations.
Risk ProfilePlease see detailed below the key risks applicable to the Trust:• Changes in exchange rates between the currency of the Trust and the currencies in which the assets of the Trust
are valued can have the effect of increasing or decreasing the value of the Trust and any income generated.• The Trust can hold smaller company shares, which can be more difficult to buy and sell as they may trade
infrequently and in small volumes, so their share prices may fluctuate more than those of larger companies.• Regional Funds have a narrower focus than those which invest broadly across markets and are therefore
considered to be more risky.• Derivative instruments can make a profit or a loss and there is no guarantee that a financial derivative contract
will achieve its intended outcome. The use of derivatives can increase the amount by which the Trust’s value rises and falls and could expose the Trust to losses that are significantly greater than the cost of the derivative, as a relatively small movement may have a larger impact on derivatives than the underlying assets. Some derivative transactions may be entered into directly with an eligible person or institution (a “counterparty”). There is a risk that the counterparty may not meet its obligations or becomes insolvent, which could cause the Trust to incur a loss.

5
Barings Europe Select TrustInvestment Objective and Policy and Trust at a Glance (continued)
• Emerging markets or less developed countries may face more political, economic or structural challenges than developed countries. Coupled with less developed regulation, this means your money is at greater risk.
• Losses may occur if an organization through which we buy an asset (such as a bank) fails to meet its obligations.• Liquidity risk exists when a particular security or instrument is difficult to purchase or sell. If the amount of a
transaction is particularly large or if the relevant market is illiquid (as is the case with many privately negotiated derivatives, structured products, etc), it may not be possible to initiate a transaction or liquidate a position at an advantageous time or price.
Please refer to the Prospectus for the full risk profile.
The Trust at a Glance on 28 February 2021
Total Trust size: 28 February 2021 £1,257.01 million
Total Trust size: 31 August 2020 £1,390.78 millionOCF* 28/02/2021 31/08/2020Class A GBP Inc** 1.55% 1.57%Class A EUR Acc** 1.55% 1.57%Class A EUR Inc** 1.55% 1.57%Class A USD Acc 1.55% 1.57%Class I GBP Acc*** 0.80% N/AClass I GBP Inc 0.80% 0.82%Class I EUR Acc 0.80% 0.82%Class I EUR Inc 0.80% 0.82%
Initial charge Annual chargeClass A GBP Inc** up to 5.00% 1.50%Class A EUR Acc** up to 5.00% 1.50%Class A EUR Inc** up to 5.00% 1.50%Class A USD Acc up to 5.00% 1.50%Class I GBP Acc*** Nil 0.75%Class I GBP Inc Nil 0.75%Class I EUR Acc Nil 0.75%Class I EUR Inc Nil 0.75%
Minimum initial investment Minimum subsequent investmentClass A GBP Inc** £1,000 £500Class A EUR Acc** €5,000 €1,000Class A EUR Inc** €5,000 €1,000Class A USD Acc US$5,000 US$2,500Class I GBP Acc*** £10,000,000 £500Class I GBP Inc £10,000,000 £500Class I EUR Acc €10,000,000 €1,000Class I EUR Inc €10,000,000 €1,000
* The Ongoing Charge Figure (“OCF”) reflects the payments and expenses which cover aspects of operating the Trust and is deducted from the assets over the year. It includes fees paid for investment management, trustee and general charges.
** Calculation based on mid-price.
*** Unit class was launched on 30 October 2020.
Risk Profile (continued)

6
Barings Europe Select TrustInvestment Objective and Policy and Trust at a Glance (continued)
Price per unit (pence/cents per unit)
Class A GBP Inc 4,741.00p
Class A EUR Acc 5,813.00c
Class A EUR Inc 5,450.00c
Class A USD Acc 7,023.00c
Class I GBP Acc 115.50p
Class I GBP Inc 4,761.00p
Class I EUR Acc 5,899.00c
Class I EUR Inc 5,478.00c
The Trust at a Glance on 28 February 2021 (continued)

7
Barings Europe Select TrustTrust Information
Class A GBP Inc - Distribution units Class A EUR Acc - Accumulation units28/02/2021
(p)31/08/2020
(p)31/08/2019
(p)28/02/2021
(c)31/08/2020
(c)31/08/2019
(c)Change in net assets per unitOpening net asset value per unit 4,321.13 4,217.91 4,063.90 5,144.69 4,959.27 4,911.96Return before operating charges 451.31 167.49 250.24 707.27 261.99 129.60Operating charges (35.36) (64.27) (78.47) (43.46) (76.57) (82.29)Return after operating charges 415.95 103.22 171.77 663.81 185.42 47.31Distributions – – (17.76) – – –Retained distributions on accumulation units – – – – – –
Closing net asset value per unit 4,737.08 4,321.13 4,217.91 5,808.50 5,144.69 4,959.27after direct transaction costs of* 1.89 4.14 2.38 2.32 4.93 2.50PerformanceReturn after charges 9.63% 2.45% 4.23% 12.90% 3.74% 0.96%Other informationClosing net asset value ('000) £199,265 £217,196 £232,387 €28,494 €25,373 €38,581Closing number of units 4,206,495 5,026,359 5,509,533 490,560 493,187 777,949Operating charges 1.55% 1.57% 1.56% 1.55% 1.57% 1.56%Direct transaction costs 0.04% 0.10% 0.06% 0.04% 0.10% 0.06%Prices**
Highest unit price 5,009.00 4,419.00 4,383.00 6,112.00 5,616.00 5,141.00Lowest unit price 4,121.00 3,072.00 3,534.00 4,870.00 3,607.00 4,150.00
Class A EUR Inc - Distribution units Class A USD Acc - Accumulation units28/02/2021
(c)31/08/2020
(c)31/08/2019
(c)28/02/2021
(c)31/08/2020
(c)31/08/2019
(c)Change in net assets per unitOpening net asset value per unit 4,823.50 4,649.41 4,623.86 6,121.29 5,464.50 5,736.98Return before operating charges 662.67 246.06 111.59 949.29 747.84 (189.45)Operating charges (40.56) (71.97) (77.81) (52.49) (91.05) (83.03)Return after operating charges 622.11 174.09 33.78 896.80 656.79 (272.48)Distributions – – (8.23) – – (27.50)Retained distributions on accumulation units – – – – – 27.50
Closing net asset value per unit 5,445.61 4,823.50 4,649.41 7,018.09 6,121.29 5,464.50after direct transaction costs of* 2.16 4.64 2.36 2.80 5.87 2.52PerformanceReturn after charges 12.90% 3.74% 0.73% 14.65% 12.02% (4.75)%Other informationClosing net asset value ('000) €147,929 €179,049 €292,038 $17,268 $16,057 $16,926Closing number of units 2,716,475 3,712,004 6,281,177 246,051 262,319 309,752Operating charges 1.55% 1.57% 1.56% 1.55% 1.57% 1.56%Direct transaction costs 0.04% 0.10% 0.06% 0.04% 0.10% 0.06%Prices**
Highest unit price 5,730.00 5,265.00 4,828.00 7,421.00 6,125.00 5,971.00Lowest unit price 4,566.00 3,382.00 3,907.00 5,689.00 3,928.00 4,728.00
*Direct transaction costs comprise commission and taxes, principally applicable to equity investment purchases and sales. Unitholders should note that there are other additional transaction costs such as dealing spread and underlying costs with regard to Investment Fund holdings which will also have reduced the Trust and unit class returns before operating charges.
**High/low prices included in the table above for the current accounting period are from 1 September 2020 to 28 February 2021. For previous periods, they relate to the accounting year from 1 September 2019 to 31 August 2020 and accounting period from 1 June 2018 to 31 August 2019, respectively.

8
Barings Europe Select TrustTrust Information (continued)
Class I GBP Acc - Accumulation units Class I GBP Inc - Distribution units28/02/2021^
(p)28/02/2021
(p)31/08/2020
(p)31/08/2019
(p)Change in net assets per unitOpening net asset value per unit 101.84 4,323.55 4,217.28 4,069.60Return before operating charges 14.17 452.32 169.65 253.10Operating charges (0.47) (18.32) (33.65) (40.89)Return after operating charges 13.70 434.00 136.00 212.21Distributions (0.14) (4.82) (29.73) (64.53)Retained distributions on accumulation units 0.14 – – –
Closing net asset value per unit 115.54 4,752.73 4,323.55 4,217.28after direct transaction costs of* 0.05 1.89 4.15 2.39PerformanceReturn after charges 13.45% 10.04% 3.22% 5.21%Other informationClosing net asset value ('000) £142 £816,727 £870,211 £933,913Closing number of units 123,310 17,184,391 20,127,246 22,144,891Operating charges 0.80% 0.80% 0.82% 0.81%Direct transaction costs 0.04% 0.04% 0.10% 0.06%Prices**
Highest unit price 122.00 5,030.00 4,434.00 4,424.00Lowest unit price 100.00 4,128.00 3,635.00 4,152.00
I
Class I EUR Acc - Accumulation units Class I EUR Inc - Distribution units28/02/2021
(c)31/08/2020
(c)31/08/2019
(c)28/02/2021
(c)31/08/2020
(c)31/08/2019
(c)Change in net assets per unitOpening net asset value per unit 5,201.78 4,975.84 4,892.47 4,830.91 4,652.29 4,645.25Return before operating charges 715.17 266.29 126.21 664.63 249.16 119.06Operating charges (22.48) (40.35) (42.84) (21.10) (37.72) (40.83)Return after operating charges 692.69 225.94 83.37 643.53 211.44 78.23Distributions (4.67) (35.34) (74.02) (5.55) (32.82) (71.19)Retained distributions on accumulation units 4.67 35.34 74.02 – – –
Closing net asset value per unit 5,894.47 5,201.78 4,975.84 5,468.89 4,830.91 4,652.29after direct transaction costs of* 2.32 4.98 2.51 2.18 4.65 2.39PerformanceReturn after charges 13.32% 4.54% 1.70% 13.32% 4.54% 1.68%Other informationClosing net asset value ('000) €39,720 €78,588 €58,399 €46,668 €42,409 €36,082Closing number of units 673,858 1,510,216 1,173,650 853,326 877,868 775,583Operating charges 0.80% 0.82% 0.81% 0.80% 0.82% 0.81%Direct transaction costs 0.04% 0.10% 0.06% 0.04% 0.10% 0.06%Prices**
Highest unit price 6,201.00 5,655.00 5,152.00 5,759.00 5,287.00 4,886.00Lowest unit price 4,930.00 3,635.00 4,152.00 4,579.00 3,398.00 3,939.00
^Unit class was launched on 30 October 2020.
*Direct transaction costs comprise commission and taxes, principally applicable to equity investment purchases and sales. Unitholders should note that there are other additional transaction costs such as dealing spread and underlying costs with regard to Investment Fund holdings which will also have reduced the Trust and unit class returns before operating charges.
**High/low prices included in the table above for the current accounting period are from 1 September 2020 to 28 February 2021. For previous periods, they relate to the accounting year from 1 September 2019 to 31 August 2020 and accounting period from 1 June 2018 to 31 August 2019, respectively.

9
Barings Europe Select TrustReport of the Investment Manager
PerformanceDuring the reporting period from 1 September 2020 to 28 February 2021, the Barings Europe Select Trust (“the Trust”) produced an absolute net return for Class A GBP Inc of 9.75% compared with a return of 17.68% for the performance comparator. The table below shows the 6 month, 1 year, 3 year and 5 year annualised net return for the Class A GBP Inc units against the performance comparator.
6 months 1 year 3 years 5 yearsBarings Europe Select Trust 9.75% 18.91% 6.08% 11.86%EMIX Smaller European Companies Ex UK (Total Net Return) Index 17.68% 28.94% 8.01% 14.63% Over the longer term, on an annualised basis, the Trust has delivered absolute returns of 6.08% over three years and 11.86% over five, but lagged relative to the performance comparator, owing to the more recent short-term underperformance. Recent relative underperformance, which has impacted longer-term numbers, has been driven in part by a recovery in the share prices of companies exposed to the Travel and Leisure sectors, such as Airlines, Airports and Cruise operators. These are companies not owned in the portfolio, owing to their continued very weak profitability and uncertain business outlooks. Our focus on companies that are improving the quality of their earnings and business models, while helping our relative performance during the market downturn experienced earlier in 2020, meant that our portfolio did not participate as meaningfully in the recent short-term market rally.Over the period, we sold out of a number of longer term portfolio holdings, particularly in the IT and Healthcare sectors, which had performed strongly in the earlier months of 2020. For example, we sold shares in computer equipment manufacturer Logitech International following strong performance and took profits in Infrastrutture Wireless Italiane, the Italian telecommunications towers services group, as the share price achieved our price target. In the Healthcare sector, we sold shares in Ontex, the Belgian manufacturer of personal hygiene products, as progress towards repositioning the business has been slower than hoped and exited out of our position in Swiss pharmacy and healthcare wholesaling group Galenica. We made new investments in areas such as Media sector companies, Industrial engineering groups and in fast-growing internet platforms. These included German broadcaster ProSiebenSat.1 Media, as their online assets have performed strongly, and advertising group Publicis, which has a strong track record of execution and is well positioned relative to peers due to recent restructuring and effective strategic decision-making. We also invested in Metso Outotec, the Finish mining equipment provider, for its leading position in machinery exposed to minerals with supportive outlooks and potential to expand margins. The top ten purchases and sales during the period were as follows:
Purchases Costs £’000
Metso Outotec 16,743
Aalberts Industries 16,224
Temenos 15,565
Cie Plastic Omnium 15,115
ProSiebenSat.1 Media 14,078
Publicis Groupe 13,170
Elis 12,711
Cargotec 12,571
Hexpol 12,345
Shop Apotheke Europe 11,980
Sales Proceeds £’000
Logitech International 24,709
Infrastrutture Wireless Italiane 23,248
Vopak 22,357
Tryg 20,069
Korian 19,244
Worldline 19,236
Moncler 18,787
GN Store Nord 16,973
Kingspan 15,711
Enagas 15,292

10
Barings Europe Select TrustReport of the Investment Manager (continued)
Market OutlookEuropean smaller companies, and global equity markets, have weathered a volatile year with remarkable resilience. As we move into 2021, equity markets have continued to extend their recovery from the lows of last year, reflecting optimism that this year will see a strong recovery in economic activity worldwide. Economists predict around 4.10% global GDP growth in 2021, against an easy comparison base. Trade is forecast to recover while corporate fixed asset investment and private consumption are seen as likely to rebound on pent-up demand and falling unemployment rates. Strong money supply growth, low interest rates and supportive short-term furlough and taxation policies have ensured bond yields remained low, while helping more indebted companies to weather the current environment. On a number of measures, however, European Smaller Companies’ valuations are now very much at the higher end of their historic ranges. As a result, individual companies’ share price performances are likely to reflect changing assessments of their potential for earnings growth in 2021 and beyond. With rising raw materials prices, a stronger Euro and the disappointing pace of vaccination roll-out in much of Europe, the recovery in European smaller companies’ profits in 2021 is likely to lag behind some of the more optimistic forecasts. In this context, we continue to follow our quality Growth at a Reasonable Price investment approach. Our aim remains to identify attractively valued investment opportunities in companies whose strategic positioning and competitive strengths can drive sustained improvements in their profitability and returns. Given the trends outlined above we anticipate that earnings revisions will be a more reliable guide to share price performance in 2021 than has been the case in 2020, with opportunities for stock selection more widespread among companies, sectors and styles given the valuation backdrop.
Baring Asset Management LimitedBaring Asset Management Limited (the “Investment Manager”) gives its portfolio managers full authority to manage their funds as they see fit, within the established guidelines set down. This includes the views that managers may take of the markets and sectors they invest in, which may differ from the views of other Barings portfolio managers.

11
Barings Europe Select TrustDirectors’ Statement
The financial statements on pages 15 and 16 were approved by Baring Fund Managers Limited (the “Manager") and signed on its behalf by:
R. KENT Director
J. SWAYNE Director London 27 April 2021

12
Portfolio Statement
as at 28 February 2021
Barings Europe Select Trust
Holdings Investments
Bid-Market value
(£)
Percentage of total net
assets (%)
Investment Funds: 0.00% (3.73%)
Ireland: 0.00% (3.73%)
Equities: 96.20% (95.67%)
Austria: 2.21% (1.60%)284,647 BAWAG 10,551,431 0.84710,216 Wienerberger 17,213,562 1.37
27,764,993 2.21
Belgium: 2.05% (3.31%)191,756 D'ieteren 11,619,014 0.92494,331 Telenet 14,198,597 1.13
25,817,611 2.05
Denmark: 5.69% (6.86%)18,625 ALK-Abello 5,709,096 0.4571,636 Chemometec 4,807,083 0.38
179,045 GN Store Nord 11,043,466 0.8886,500 Netcompany Group 5,587,104 0.4559,819 Rockwool International 15,413,069 1.23
173,780 Royal Unibrew 13,002,239 1.03470,918 Topdanmark 15,954,458 1.27
71,516,515 5.69
Finland: 8.12% (5.07%)348,904 Cargotec 13,291,251 1.06274,788 Elisa 12,020,594 0.96580,746 Huhtamaki 18,952,567 1.51349,679 Kemira 4,067,366 0.32
2,346,747 Metso Outotec 18,901,629 1.50271,412 Neles 2,410,210 0.19628,343 Nokian Renkaat 15,966,626 1.27162,058 Sanoma 1,921,642 0.15599,028 Valmet 14,544,728 1.16
102,076,613 8.12
France: 10.30% (11.44%)534,470 Cie Plastic Omnium 13,790,334 1.10
1,124,674 Elis 13,942,278 1.11282,647 Eurazeo 14,878,052 1.18
82,691 Gaztransport Et Technigaz 4,970,934 0.40136,990 Orpea 11,926,894 0.95442,213 Publicis Groupe 18,606,488 1.48
1,560,440 Rexel 20,911,161 1.6689,820 SEB 11,689,135 0.93
584,427 SPIE 9,414,413 0.7560,176 Trigano 8,035,300 0.6448,565 Verallia 1,287,688 0.10
129,452,677 10.30
Germany: 16.14% (13.72%)287,377 Brenntag 16,038,900 1.28

13
Portfolio Statement (continued)
as at 28 February 2021
Barings Europe Select Trust
Holdings Investments
Bid-Market value
(£)
Percentage of total net
assets (%)
Equities: 96.20% (95.67%) (continued) Germany: 16.14% (13.72%) (continued)
151,256 Cancom 6,949,365 0.5579,089 Dermapharm 4,018,036 0.32
312,327 DWS Group GmbH 9,302,173 0.7470,344 Eckert & Ziegler 3,449,004 0.27
205,593 Evotec 5,740,787 0.46181,898 Gerresheimer 13,630,844 1.08
68,952 Hamburger Hafen und Logistik 1,258,791 0.10347,461 HelloFresh 19,437,579 1.55153,459 Hochtief 10,138,962 0.81323,540 KION 19,801,048 1.57513,142 Nordex 9,912,180 0.79173,576 Norma 5,897,009 0.47
1,328,145 ProSiebenSat.1 Media 19,443,530 1.55337,813 Scout24 18,486,710 1.47
56,733 Siltronic 6,796,299 0.54550,055 Softwareone 11,334,650 0.90336,313 Stroeer 21,299,076 1.69
202,934,943 16.14
Iceland: 0.29% (0.22%)713,574 Marel 3,585,539 0.29
Ireland: 1.77% (2.51%)653,844 Smurfit Kappa Group 22,202,093 1.77
Italy: 10.45% (11.70%)395,918 ACEA 5,582,692 0.44719,754 Amplifon 20,642,103 1.64825,374 Banca Generali 20,291,667 1.61424,972 De' Longhi 11,408,411 0.91
1,875,864 FinecoBank 23,597,035 1.88189,487 GVS 2,760,838 0.22
6,359,393 Hera 16,308,921 1.30483,216 Interpump Group 16,072,144 1.28633,230 Prysmian 14,665,040 1.17
131,328,851 10.45
Netherlands: 16.29% (14.45%)487,087 Aalberts Industries 16,395,680 1.30663,230 Arcadis 16,305,387 1.30123,947 ASM International 24,147,125 1.92800,879 ASR Nederland 24,166,239 1.92342,882 BE Semiconductor Industries 18,218,624 1.45148,682 Corbion 6,126,667 0.49281,019 Euronext 21,730,473 1.73268,969 Flow Traders 7,982,764 0.64263,053 IMCD 23,782,864 1.89
64,593 Shop Apotheke Europe 11,427,136 0.91747,298 Signify 23,296,552 1.85

14
Portfolio Statement (continued)
as at 28 February 2021
Barings Europe Select Trust
Holdings Investments
Bid-Market value
(£)
Percentage of total net
assets (%)
Equities: 96.20% (95.67%) (continued) Netherlands: 16.29% (14.45%) (continued)
315,163 TKH Group 11,156,566 0.89204,736,077 16.29
Norway: 1.83% (3.26%)175,323 Bakkafrost 9,036,608 0.72685,862 TGS-NOPEC Geophysical Company 7,831,635 0.62198,400 Tomra Systems 6,177,036 0.49
23,045,279 1.83
Spain: 2.14% (2.86%)1,701,954 Applus Services 12,561,545 1.00
428,362 CIE Automotive 8,348,993 0.66218,539 Fluidra 4,132,147 0.33264,592 Soltec Power 1,897,659 0.15
26,940,344 2.14
Sweden: 9.63% (7.04%)1,002,024 AAK 15,586,086 1.24
630,313 Avanza Bank 14,319,748 1.14909,129 Getinge 16,715,094 1.33
1,568,688 Hexpol 12,321,287 0.982,078,485 Husqvarna 18,581,286 1.48
377,005 Loomis 7,174,139 0.571,190,293 Munters Group 7,087,197 0.561,389,859 Securitas 15,608,873 1.24
453,629 Thule 13,637,226 1.09121,030,936 9.63
Switzerland: 9.29% (11.63%)155,869 Baloise 19,617,284 1.56
40,051 Bucher Industries 13,941,334 1.11264,319 Cembra Money Bank 19,754,621 1.57227,526 DKSH 12,244,173 0.97
1,397,361 SIG Combibloc 22,216,118 1.7741,988 Tecan 12,925,074 1.03
164,278 Temenos 16,138,181 1.28116,836,785 9.29
Portfolio of investments: 96.20% (99.40%) (Cost: £925,529,404) 1,209,269,256 96.20
Net other assets 47,736,578 3.80
Net assets 1,257,005,834 100.00
Note: Securities shown on the portfolio statement are ordinary shares admitted to official stock exchange listings or traded on a regulated market, unless otherwise stated.Comparative figures shown in brackets relate to 31 August 2020.

15
Statement of Total Return and Statement of Change in Net Assets Attributable to Unitholders
for the period ended 28 February 2021
Barings Europe Select Trust
Statement of Total Return
28/02/2021 29/02/2020£'000 £'000 £'000 £'000
IncomeNet capital gains/(losses) 126,220 (72,895)Revenue 6,520 3,829Expenses (6,603) (7,910)
Interest payable and other similar charges (96) (33)Net expense before taxation (179) (4,114)Taxation 366 (353)Net revenue/(expense) after taxation 187 (4,467)Total return before distributions/equalisation 126,407 (77,362)(Distributions)/equalisation (931) 2Change in net assets attributable to unitholders from investment activities 125,476 (77,360)
Statement of Change in Net Assets Attributable to Unitholders
28/02/2021 29/02/2020£'000 £'000 £'000 £'000
Opening net assets attributable to unitholders* 1,390,778 1,565,627Amounts receivable on issue of units 154,292 134,706Amounts payable on cancellation of units (413,568) (254,118)
(259,276) (119,412)Changes in net assets attributable to unitholders from investment activities 125,476 (77,360)Retained distribution on accumulation units 28 –Closing net assets attributable to unitholders 1,257,006 1,368,855
*
The opening net assets attributable to unitholders for 28 February 2021 differs to the closing position in 29 February 2020 by the movement between the two interim periods of the Trust.

16
Balance Sheet
as at 28 February 2021
Barings Europe Select Trust
28/02/2021 31/08/2020
£'000 £'000
AssetsInvestment assets 1,209,269 1,382,378Current assets:
Debtors 7,380 15,905Cash and bank balances 51,498 14,627
Total assets 1,268,147 1,412,910
LiabilitiesCreditors:
Bank overdraft (2,344) (1,800)Distribution payable on income units (869) (6,241)Other creditors (7,928) (14,091)
Total liabilities (11,141) (22,132)Net assets attributable to unitholders 1,257,006 1,390,778
Note to the Financial Statementsfor the period ended 28 February 2021
The interim financial statements have been prepared on the same basis as the annual audited financial statements for the year ended 31 August 2020. They are in accordance with the historical cost convention, as modified by the revaluation of investments and the Statement of Recommended Practice for Authorised Funds issued by the Investment Association in May 2014 (the “IMA SORP 2014”). The financial statements have been prepared on a going-concern basis.
Post balance sheet eventsWith effect from 10 March 2021, the Trust has been brought into scope of Article 8 of the Sustainable Finance Disclosure Regulation (“SFDR”) and can be categorised as a “Light Green” environmental, social and governance (“ESG”) product. The Trust will invest at least 50% of the Trust’s total assets in equities of companies that exhibit positive or improving ESG characteristics.
Subsequent to the period end, the price per unit of the A GBP Income class has increased from 4,741.00p to 5,185.00p, A EUR Accumulation class from 5,813.00c to 6,367.00c, A EUR Income class from 5,450.00c to 5,969.00c, A USD Accumulation class from 7,023.00c to 7,662.00c, I GBP Accumulation class from 115.50p to 126.60p, I GBP Income class from 4,761.00p to 5,208.00p, I EUR Accumulation class from 5,899.00c to 6,468.00c and I EUR Income class from 5,478.00c to 6,001.00c as at 23 April 2021. This movement takes into account routine transactions. The Manager continues to monitor investment performance in line with investment objectives.

17
Barings Europe Select TrustDistribution Tables
Interim DistributionGroup 1: Units purchased prior to 1 September 2020Group 2: Units purchased between 1 September 2020 and 28 February 2021Interim distribution - Class A GBP Inc (in pence per unit)
GroupNet
RevenueEqualisation
2021 Distribution
Payable
2020 Distribution
Paid
1 Nil Nil Nil Nil
2 Nil Nil Nil Nil
Interim accumulation - Class A EUR Acc (in cents per unit)
GroupNet
RevenueEqualisation
2021 Accumulation
Payable
2020 Accumulation
Paid
1 Nil Nil Nil Nil
2 Nil Nil Nil Nil
Interim distribution - Class A EUR Inc (in cents per unit)
GroupNet
RevenueEqualisation
2021 Distribution
Payable
2020 Distribution
Paid
1 Nil Nil Nil Nil
2 Nil Nil Nil Nil
Interim accumulation - Class A USD Acc (in cents per unit)
GroupNet
RevenueEqualisation
2021 Accumulation
Payable
2020 Accumulation
Paid
1 Nil Nil Nil Nil
2 Nil Nil Nil Nil
Interim accumulation - Class I GBP Acc* (in pence per unit)
GroupNet
RevenueEqualisation
2021 Accumulation
Payable
2020 Accumulation
Paid
1 0.1446 0.0000 0.1446 Nil
2 0.0000 0.1446 0.1446 Nil

18
Barings Europe Select TrustDistribution Tables (continued)
Interim distribution - Class I GBP Inc (in pence per unit)
GroupNet
RevenueEqualisation
2021 Distribution
Payable
2020 Distribution
Paid
1 4.8154 0.0000 4.8154 Nil
2 2.0635 2.7519 4.8154 Nil
Interim accumulation - Class I EUR Acc (in cents per unit)
GroupNet
RevenueEqualisation
2021 Accumulation
Payable
2020 Accumulation
Paid
1 4.6697 0.0000 4.6697 Nil
2 2.1842 2.4855 4.6697 Nil
Interim distribution - Class I EUR Inc (in cents per unit)
GroupNet
RevenueEqualisation
2021 Distribution
Payable
2020 Distribution
Paid
1 5.5455 0.0000 5.5455 Nil
2 1.3253 4.2202 5.5455 Nil
* Unit class was launched 30 October 2020.

19
Barings German Growth TrustInvestment Objective and Policy and Trust at a Glance
Investment Objective and PolicyThe investment objective of Barings German Growth Trust (the “Trust”) is to achieve capital growth by investing in Germany. The Trust will seek to achieve its investment objective by investing at least 75% of its total assets directly and indirectly in equities and equity related securities of companies incorporated in, or exercising the predominant part of their economic activity in Germany, or quoted or traded on the stock exchanges in Germany.For the remainder of its total assets, the Trust may invest directly and indirectly in equities and equity related securities outside of Germany as well as in fixed income and cash.In order to implement the investment policy, the Trust may gain exposure through American Depositary Receipts, Global Depositary Receipts and other equity related securities including participation notes, structured notes, equity-linked notes and debt securities convertible into equities. The Trust may also obtain indirect exposure through investments in collective investment schemes (including collective investment schemes which are managed by the Manager or an associate of the Manager) and other transferable securities. It may also use derivatives including futures, options, swaps, warrants and forward contracts for efficient portfolio management (including hedging).Please refer to the Prospectus for the full investment objective and policy.Performance Comparator The Trust is not managed to a benchmark, however the Manager uses the HDAX® (Total Return) Index to assess the Trust’s performance. The Manager considers the performance comparator to be an appropriate assessment tool because it tracks the performance of the stock market index in Germany.How the Trust is ManagedAt Barings, our equity investment teams share the philosophy of quality “Growth at a Reasonable Price” (GARP). We believe that earnings growth is the principal driver of equity market performance over the medium to long term, and favour high-quality companies for their ability to outperform the market on a risk-adjusted basis. In particular, we believe that structured fundamental research and a disciplined investment process combining quality, growth, upside, and ESG considerations can allow us to identify attractively priced, long-term growth companies which will outperform the market. Our approach emphasises both growth and quality criterion when looking at companies and a three- to five-year time horizon when forecasting company earnings. In determining upside, we use consistent and transparent methods to place emphasis on discounted earnings models. We value companies on a long term-term basis utilizing proprietary valuation models that incorporate ESG analysis and macro considerations.
Risk Profile Please see detailed below the key risks applicable to the Trust:• Changes in exchange rates between the currency of the Trust and the currencies in which the assets of the Trust
are valued can have the effect of increasing or decreasing the value of the Trust and any income generated.• Country-specific funds have a narrower focus than those which invest broadly across markets and are therefore
considered to be more risky.• Derivative instruments can make a profit or a loss and there is no guarantee that a financial derivative contract
will achieve its intended outcome. The use of derivatives can increase the amount by which the Trust’s value rises and falls and could expose the Trust to losses that are significantly greater than the cost of the derivative as a relatively small movement may have a larger impact on derivatives than the underlying assets.
• Losses may occur if an organisation through which we buy an asset (such as a bank) fails to meet its obligations.• Liquidity risk exists when a particular security or instrument is difficult to purchase or sell. If the amount of a
transaction is particularly large or if the relevant market is illiquid (as is the case with many privately negotiated derivatives, structured products, etc), it may not be possible to initiate a transaction or liquidate a position at an advantageous time or price.
Please refer to the Prospectus for the full risk profile.

20
Barings German Growth TrustInvestment Objective and Policy and Trust at a Glance (continued)
The Trust at a Glance on 28 February 2021
Total Trust size: 28 February 2021 €350.47 million
Total Trust size: 31 August 2020 €366.38 millionOCF* 28/02/2021 31/08/2020Class A GBP Acc 1.58% 1.56%Class A GBP Inc 1.58% 1.56%Class A EUR Acc 1.58% 1.56%Class A EUR Inc 1.58% 1.56%Class A USD Acc 1.58% 1.56%Class A USD Hedged Acc 1.58% 1.56%Class A RMB Hedged Acc 1.58% 1.56%Class I GBP Acc 0.83% 0.81%Class I GBP Inc 0.83% 0.81%Class I GBP Hedged Acc 0.83% 0.81%Class I EUR Acc 0.83% 0.81%Class I EUR Inc 0.83% 0.81%Class I USD Acc 0.83% 0.81%
Initial charge Annual chargeClass A GBP Acc up to 5.00% 1.50%Class A GBP Inc up to 5.00% 1.50%Class A EUR Acc up to 5.00% 1.50%Class A EUR Inc up to 5.00% 1.50%Class A USD Acc up to 5.00% 1.50%Class A USD Hedged Acc up to 5.00% 1.50%Class A RMB Hedged Acc up to 5.00% 1.50%Class I GBP Acc Nil 0.75%Class I GBP Inc Nil 0.75%Class I GBP Hedged Acc Nil 0.75%Class I EUR Acc Nil 0.75%Class I EUR Inc Nil 0.75%Class I USD Acc Nil 0.75%
Minimum initial investment Minimum subsequent investmentClass A GBP Acc £1,000 £500Class A GBP Inc £1,000 £500Class A EUR Acc €5,000 €1,000Class A EUR Inc €5,000 €1,000Class A USD Acc US$5,000 US$2,500Class A USD Hedged Acc US$5,000 US$2,500Class A RMB Hedged Acc US$5,000 US$2,500Class I GBP Acc £10,000,000 £500Class I GBP Inc £10,000,000 £500Class I GBP Hedged Acc £10,000,000 £500

21
Barings German Growth TrustInvestment Objective and Policy and Trust at a Glance (continued)
Minimum initial investment Minimum subsequent investmentClass I EUR Acc €10,000,000 €1,000Class I EUR Inc €10,000,000 €1,000Class I USD Acc US$10,000,000 US$2,500
* The Ongoing Charge Figure (“OCF”) reflects the payments and expenses which cover aspects of operating the Trust and is deducted from the assets over the year. It includes fees paid for investment management, trustee and general charges.
Price per unit (pence/cents per unit)
Class A GBP Acc 875.30p
Class A GBP Inc 785.50p
Class A EUR Acc 1,008.00c
Class A EUR Inc 900.10c
Class A USD Acc 1,219.00c
Class A USD Hedged Acc 1,214.00c
Class A RMB Hedged Acc RMB82.99
Class I GBP Acc 929.30p
Class I GBP Inc 782.90p
Class I GBP Hedged Acc 939.80p
Class I EUR Acc 1,070.00c
Class I EUR Inc 880.30c
Class I USD Acc 1,280.00c
The Trust at a Glance on 28 February 2021 (continued)

22
Barings German Growth TrustTrust Information
Class A GBP Acc - Accumulation units Class A GBP Inc - Distribution units28/02/2021
(p)31/08/2020
(p)31/08/2019
(p)28/02/2021
(p)31/08/2020
(p)31/08/2019
(p)Change in net assets per unitOpening net asset value per unit 782.61 817.54 928.87 702.26 734.48 838.93Return before operating charges 97.53 (22.54) (92.26) 87.51 (20.26) (83.34)Operating charges (6.26) (12.39) (19.07) (5.61) (11.12) (17.22)Return after operating charges 91.27 (34.93) (111.33) 81.90 (31.38) (100.56)Distributions – (0.82) (4.21) – (0.84) (3.89)Retained distributions on accumulation units – 0.82 4.21 – – –
Closing net asset value per unit 873.88 782.61 817.54 784.16 702.26 734.48after direct transaction costs of* 0.19 0.34 0.38 0.17 0.31 0.34PerformanceReturn after charges 11.66% (4.27)% (11.99)% 11.66% (4.27)% (11.99)%Other informationClosing net asset value ('000) £58,281 £59,214 £70,879 £405 £420 £482Closing number of units 6,669,258 7,566,216 8,669,792 51,587 59,817 65,561Operating charges 1.58% 1.56% 1.57% 1.58% 1.56% 1.57%Direct transaction costs 0.02% 0.04% 0.04% 0.02% 0.04% 0.04%Prices**
Highest unit price 913.20 866.10 936.90 819.40 778.10 846.20Lowest unit price 695.90 533.10 708.50 624.50 479.00 639.90
Class A EUR Acc - Accumulation units Class A EUR Inc - Distribution units28/02/2021
(c)31/08/2020
(c)31/08/2019
(c)28/02/2021
(c)31/08/2020
(c)31/08/2019
(c)Change in net assets per unitOpening net asset value per unit 874.38 901.94 1,055.51 781.47 807.09 949.44Return before operating charges 138.32 (13.71) (134.54) 123.60 (12.29) (121.03)Operating charges (7.21) (13.85) (19.03) (6.42) (12.42) (17.07)Return after operating charges 131.11 (27.56) (153.57) 117.18 (24.71) (138.10)Distributions – (0.92) (4.71) – (0.91) (4.25)Retained distributions on accumulation units – 0.92 4.71 – – –
Closing net asset value per unit 1,005.49 874.38 901.94 898.65 781.47 807.09after direct transaction costs of* 0.22 0.38 0.38 0.19 0.34 0.34PerformanceReturn after charges 14.99% (3.06)% (14.55)% 14.99% (3.06)% (14.55)%Other informationClosing net asset value ('000) €159,681 €155,414 €187,926 €1,325 €1,520 €2,399Closing number of units 15,880,977 17,774,191 20,835,804 147,432 194,475 297,194Operating charges 1.58% 1.56% 1.57% 1.58% 1.56% 1.57%Direct transaction costs 0.02% 0.04% 0.04% 0.02% 0.04% 0.04%Prices**
Highest unit price 1,046.00 1,031.00 1,068.00 934.40 922.30 960.40Lowest unit price 769.70 572.50 785.80 687.90 512.30 706.90
*Direct transaction costs comprise commission and taxes, principally applicable to equity investment purchases and sales. Unitholders should note that there are other additional transaction costs such as dealing spread and underlying costs with regard to Investment Fund holdings which will also have reduced the Trust and unit class returns before operating charges.
**High/low prices included in the table above for the current accounting period are from 1 September 2020 to 28 February 2021. For previous periods, they relate to the accounting year from 1 September 2019 to 31 August 2020 and accounting period from 16 May 2018 to 31 August 2019, respectively.

23
Barings German Growth TrustTrust Information (continued)
Class A USD Acc - Accumulation unitsClass A USD Hedged Acc -
Accumulation units28/02/2021
(c)31/08/2020
(c)31/08/2019
(c)28/02/2021
(c)31/08/2020
(c)31/08/2019
(c)Change in net assets per unitOpening net asset value per unit 1,042.02 995.49 1,257.98 1,049.67 1,059.09 1,193.42Return before operating charges 183.27 63.01 (243.27) 170.74 8.13 (115.09)Operating charges (8.69) (16.48) (19.22) (8.67) (17.55) (19.24)Return after operating charges 174.58 46.53 (262.49) 162.07 (9.42) (134.33)Distributions – (1.47) (5.07) – (1.15) (4.69)Retained distributions on accumulation units – 1.47 5.07 – 1.15 4.69
Closing net asset value per unit 1,216.60 1,042.02 995.49 1,211.74 1,049.67 1,059.09after direct transaction costs of* 0.26 0.45 0.38 0.26 0.48 0.38PerformanceReturn after charges 16.75% 4.67% (20.87)% 15.44% (0.89)% (11.26)%Other informationClosing net asset value ('000) $6,092 $7,590 $7,583 $9,820 $15,392 $18,601Closing number of units 500,746 728,375 761,750 810,367 1,466,324 1,756,346Operating charges 1.58% 1.56% 1.57% 1.58% 1.56% 1.57%Direct transaction costs 0.02% 0.04% 0.04% 0.02% 0.04% 0.04%Prices**
Highest unit price 1,272.00 1,126.00 1,262.00 1,260.00 1,223.00 1,208.00Lowest unit price 900.50 615.10 894.70 924.30 679.40 904.60
Class A RMB Hedged Acc - Accumulation units Class I GBP Acc - Accumulation units
28/02/2021 (RMB)
31/08/2020 (RMB)
31/08/2019 (RMB)
28/02/2021 (p)
31/08/2020 (p)
31/08/2019 (p)
Change in net assets per unitOpening net asset value per unit 70.87 71.57 80.23 827.80 858.28 965.49Return before operating charges 70.34 115.77 10.32 103.49 (23.71) (96.78)Operating charges* (58.37) (116.47) (18.98) (3.48) (6.77) (10.43)Return after operating charges 11.97 (0.70) (8.66) 100.01 (30.48) (107.21)Distributions – (4.47) (0.42) – (7.43) (13.14)Retained distributions on accumulation units – 4.47 0.42 – 7.43 13.14
Closing net asset value per unit 82.84 70.87 71.57 927.81 827.80 858.28after direct transaction costs of** 1.75 3.20 0.38 0.20 0.36 0.40PerformanceReturn after charges 16.89% (0.97)% (10.79)% 12.08% (3.55)% (11.10)%Other informationClosing net asset value ('000) RMB2,566 RMB4,570 RMB5,895 £78,235 £86,287 £107,137Closing number of units 30,976 64,480 82,373 8,432,268 10,423,693 12,482,677Operating charges 1.58% 1.56% 1.57% 0.83% 0.81% 0.82%Direct transaction costs 0.02% 0.04% 0.04% 0.02% 0.04% 0.04%Prices***
Highest unit price 86.07 82.82 81.33 969.30 912.30 973.90Lowest unit price 62.74 45.98 61.30 737.00 562.00 740.00
*Direct transaction costs comprise commission and taxes, principally applicable to equity investment purchases and sales. Unitholders should note that there are other additional transaction costs such as dealing spread and underlying costs with regard to Investment Fund holdings which will also have reduced the Trust and unit class returns before operating charges.
**High/low prices included in the table above for the current accounting period are from 1 September 2020 to 28 February 2021. For previous periods, they relate to the accounting year from 1 September 2019 to 31 August 2020 and accounting period from 16 May 2018 to 31 August 2019, respectively.

24
Barings German Growth TrustTrust Information (continued)
Class I GBP Inc - Distribution unitsClass I GBP Hedged Acc - Accumulation
units28/02/2021
(p)31/08/2020
(p)31/08/2019
(p)28/02/2021
(p)31/08/2020
(p)31/08/2019
(p)Change in net assets per unitOpening net asset value per unit 697.41 729.60 833.39 812.11 835.94 954.93Return before operating charges 87.19 (20.16) (83.41) 129.59 (16.69) (108.68)Operating charges (2.94) (5.77) (9.05) (3.41) (7.14) (10.31)Return after operating charges 84.25 (25.93) (92.46) 126.18 (23.83) (118.99)Distributions – (6.26) (11.33) – (3.88) (13.35)Retained distributions on accumulation units – – – – 3.88 13.35
Closing net asset value per unit 781.66 697.41 729.60 938.29 812.11 835.94after direct transaction costs of* 0.17 0.31 0.34 0.19 0.38 0.39PerformanceReturn after charges 12.08% (3.55)% (11.09)% 15.54% (2.85)% (12.46)%Other informationClosing net asset value ('000) £10,738 £10,460 £20,042 £534 £633 £740Closing number of units 1,373,751 1,499,778 2,747,024 56,955 77,989 88,542Operating charges 0.83% 0.81% 0.82% 0.83% 0.81% 0.82%Direct transaction costs 0.02% 0.04% 0.04% 0.02% 0.04% 0.04%Prices**
Highest unit price 816.60 775.60 840.70 975.00 961.20 966.30Lowest unit price 620.90 477.80 638.90 715.30 530.20 719.30
Class I EUR Acc - Accumulation units Class I EUR Inc - Distribution units28/02/2021
(c)31/08/2020
(c)31/08/2019
(c)28/02/2021
(c)31/08/2020
(c)31/08/2019
(c)Change in net assets per unitOpening net asset value per unit 925.05 947.20 1,098.01 761.52 786.80 957.29Return before operating charges 146.50 (14.52) (140.36) 120.56 (11.96) (155.31)Operating charges (3.93) (7.63) (10.45) (3.17) (6.27) (8.88)Return after operating charges 142.57 (22.15) (150.81) 117.39 (18.23) (164.19)Distributions – (8.26) (14.48) – (7.05) (6.30)Retained distributions on accumulation units – 8.26 14.48 – – –
Closing net asset value per unit 1,067.62 925.05 947.20 878.91 761.52 786.80after direct transaction costs of* 0.22 0.40 0.40 0.18 0.33 0.34PerformanceReturn after charges 15.41% (2.34)% (13.73)% 15.42% (2.32)% (17.15)%Other informationClosing net asset value ('000) €5,508 €14,200 €13,542 €14 €34 €35Closing number of units 515,879 1,535,073 1,429,644 1,561 4,421 4,420Operating charges 0.83% 0.81% 0.82% 0.83% 0.81% 0.82%Direct transaction costs 0.02% 0.04% 0.04% 0.02% 0.04% 0.04%Prices**
Highest unit price 1,110.00 1,087.00 1,111.00 913.60 902.20 969.00Lowest unit price 815.30 603.60 821.10 671.20 501.50 688.00
*Direct transaction costs comprise commission and taxes, principally applicable to equity investment purchases and sales. Unitholders should note that there are other additional transaction costs such as dealing spread and underlying costs with regard to Investment Fund holdings which will also have reduced the Trust and unit class returns before operating charges.
**High/low prices included in the table above for the current accounting period are from 1 September 2020 to 28 February 2021. For previous periods, they relate to the accounting year from 1 September 2019 to 31 August 2020 and accounting period from 16 May 2018 to 31 August 2019, respectively.

25
Barings German Growth TrustTrust Information (continued)
Class I USD Acc - Accumulation units28/02/2021
(c)31/08/2020
(c)31/08/2019
(c)Change in net assets per unitOpening net asset value per unit 1,080.00 1,030.00 1,286.61Return before operating charges 204.80 58.86 (245.82)Operating charges (4.80) (8.86) (10.79)Return after operating charges 200.00 50.00 (256.61)Distributions – (13.35) (15.90)Retained distributions on accumulation units – 13.35 15.90
Closing net asset value per unit 1,280.00 1,080.00 1,030.00after direct transaction costs of* 0.27 0.47 0.41PerformanceReturn after charges 18.52% 4.85% (19.94)%Other informationClosing net asset value ('000) $– $– $–Closing number of units 10 10 10Operating charges 0.83% 0.81% 0.82%Direct transaction costs 0.02% 0.04% 0.04%Prices**
Highest unit price 1,334.00 1,167.00 1,290.00Lowest unit price 941.40 638.30 918.00
*Direct transaction costs comprise commission and taxes, principally applicable to equity investment purchases and sales. Unitholders should note that there are other additional transaction costs such as dealing spread and underlying costs with regard to Investment Fund holdings which will also have reduced the Trust and unit class returns before operating charges.
**High/low prices included in the table above for the current accounting period are from 1 September 2020 to 28 February 2021. For previous periods, they relate to the accounting year from 1 September 2019 to 31 August 2020 and accounting period from 16 May 2018 to 31 August 2019, respectively.

26
Barings German Growth TrustReport of the Investment Manager
PerformanceDuring the reporting period from 1 September 2020 to 28 February 2021, the Barings German Growth Trust (“the Trust”) produced an absolute net return for Class A EUR Acc of 15.45% compared with a return of 7.58% for the performance comparator. The table below shows the 6 month, 1 year, 3 year and 5 year annualised net return for the Class A EUR Acc units against the performance comparator.
6 months 1 year 3 years 5 yearsBarings German Growth Trust 15.45% 16.34% (0.94)% 5.94%HDAX® (Total Return) Index 7.58% 15.89% 3.95% 8.47% Outperformance of the Trust over the short-term has been driven entirely by stock selection, with our positioning in the Information Technology sector adding close to 3.5% in relative performance, and our exposures to the Health Care, Industrials and Materials sectors all contributing over 1% each. Despite this overall strong performance, the market backdrop was volatile at points, with German equities (as measured by the HDAX index) falling approximately 10% in the first two months of the period before rebounding strongly in November in response to positive news regarding COVID-19 vaccines. Stock prices continued to rally throughout the remainder of the period, generating a new all-time high for the HDAX in the process. Long-term numbers are primarily a reflection of poor relative performance in the earlier stages of 2020, as the COVID-19 pandemic took hold, and relative weakness in the latter stages of 2018, when German large cap equities outperformed small cap, reflecting generally negative investor sentiment towards equity markets rather than stock-specific factors. At the time, the Trust’s exposure to smaller cap names proved to be a significant headwind in this environment, and was the principle reason for the fund significantly underperforming its benchmark in 2018.At a sector level, Semiconductors and IT Hardware were particularly strong, alongside the traditionally cyclical sectors of Industrials and Consumer Discretionary. Of the stocks held in the fund, strong performance came from Allgeier and its spin-off Nagarro in the IT sector. Semiconductor wafer manufacturer Siltronic was another outperformer, as Global Wafers bid for the company at a significant premium. Thirdly was Ibu-Tec Advanced Materials which will benefit from the transition to electric vehicles. Partially offsetting this, in the Information Technology sector S&T and Cancom both underperformed. Elsewhere, Hannover Reinsurance and nutritional supplement company PharmaSGP also lagged the Index and detracted from relative returns. Portfolio activity remained relatively low over the period. Towards the end of 2020, we sold a significant part of our holding in Allianz, which had outperformed, to finance a switch in insurance sector exposure from primary insurance into the re-insurance market. This was achieved through purchases in Hannover Reinsurance and Muenchener Rueckversicherungs-Gesellschaftin. Then, towards the end of the accounting period, bond yields rose dramatically and cyclical equities rallied. Therefore, it made sense to take profits in some cyclical stocks and recycle these back into more defensive names, such as Allianz, which had also underperformed by approximately 10% since the sale at the end of 2020. Other stocks purchased were largely in the renewable energy sector, such as Siemens Gamesa, ABO Wind and 7C Solarparken. Airbus was the most significant sale, as the stock exceeded our target price. Other positions sold included Compugroup Medical, which reached our price target, and Fresenius Medical Care, whose business has been impacted by a reduction in their dialysis patient population due to COVID-19. This we believe is likely to have a longer lasting impact on the company, even after the pandemic.

27
Barings German Growth TrustReport of the Investment Manager (continued)
The top ten purchases and sales during the period were as follows:
Purchases Costs €’000
BASF 12,762
Hannover Reinsurance 11,852
Daimler 10,061
Muenchener Rueckversicherungs-Gesellschaftin 9,783
Covestro 3,022
Allianz 2,567
Linde 1,926
LafargeHolcim 1,614
ADVA Optical Networking 1,040
ABO Wind 1,031
Sales Proceeds €’000
Airbus 21,168
Deutsche Post 10,817
Hochtief 9,254
Fresenius Medical Care 8,965
Rheinmetall 7,669
Allianz 5,999
Lanxess 4,943
SAP 4,746
Volkswagen 3,626
CompuGroup Medical 3,525
Market OutlookGiven the strong performance of stock prices since the end of October, we would expect more modest movements over the coming months, particularly as news flow regarding the reopening of economies begins to wane. This will likely be balanced by the potential for increased COVID-19 infection rates, as the UK variant begins to take hold in Europe at a time when few people on the continent have been vaccinated.In this environment, companies more dependent on the normalization of economic activity (e.g. retailers), will probably prove to have more volatile share prices, whilst many companies in the traditional industrial sectors, which have successfully overcome the limitations, are likely to continue to perform well. Looking further ahead, vaccination rates will continue to increase, and as long as the current vaccines remain effective against the various mutations of COVID-19, we would expect a reopening of the economy over the summer months. This should allow for the positive market progression to continue into the second half of the year, as companies report strong earnings progression following a gradual normalization of economic activity. There is still a risk however, that COVID-19 mutates in a way that proves to be resistant against the current set of vaccines, and therefore we do not expect any particularly strong market advances in the realms of a double-digit gain by the end of summer.In this context, we continue to follow our quality Growth at a Reasonable Price investment approach. Our aim remains to identify attractively valued investment opportunities in companies whose strategic positioning and competitive strengths can drive sustained improvements in their profitability and returns.
Baring Asset Management LimitedBaring Asset Management Limited (the “Investment Manager”) gives its portfolio managers full authority to manage their funds as they see fit, within the established guidelines set down. This includes the views that managers may take of the markets and sectors they invest in, which may differ from the views of other Barings portfolio managers.
28
Barings German Growth TrustDirectors’ Statement
The financial statements on pages 33 and 34 were approved by Baring Fund Managers Limited (the “Manager") and signed on its behalf by:
R. KENT Director
J. SWAYNE Director London 27 April 2021

29
Portfolio Statement
as at 28 February 2021
Barings German Growth Trust
Holdings Investments
Bid-Market Value
(€)
Percentage of total net
assets (%)
Investment Funds: 0.00% (1.33%)
Equities: 99.48% (98.73%)
Basic Materials: 8.06% (8.23%)140,000 Linde 28,266,000 8.06
Communication Services: 0.23% (0.00%)47,000 ProSiebenSat 1 Media 791,480 0.23
Consumer Discretionary: 12.30% (7.68%)210,000 Daimler 13,826,400 3.94
34,193 EDAG Engineering 340,562 0.1052,000 Einhell 5,876,000 1.6870,000 Grammer 1,582,000 0.4572,780 HELMA Eigenheimbau 3,362,436 0.96
305,000 Polytec 2,568,100 0.73370,000 SAF-Holland 4,366,000 1.25
41,000 Volkswagen 6,937,200 1.98104,000 Zeal Network 4,232,800 1.21
43,091,498 12.30
Consumer, Non-cyclical: 0.44% (0.56%)24,000 HelloFresh 1,544,400 0.44
Energy: 0.22% (0.00%)24,000 Vereinigte BioEnergie 788,400 0.22
Financials: 10.74% (5.50%)65,000 Allianz 12,959,700 3.6940,000 DFV Deutsche Familienversicherung 627,360 0.1895,000 DWS Group GmbH 3,254,700 0.9377,000 Hannover Reinsurance 10,857,000 3.1041,000 Muenchener Rueckversicherungs-Gesellschaftin 9,954,800 2.84
37,653,560 10.74
Health Care: 12.22% (15.99%)233,000 Bayer 11,934,260 3.41
34,000 Dermapharm 1,986,960 0.5773,000 Eckert & Ziegler 4,117,200 1.1884,000 Evotec 2,698,080 0.77
270,000 M1 Kliniken 2,462,400 0.70320,000 MagForce 1,440,000 0.41
41,000 Medios 1,488,300 0.4286,000 Merck 11,769,100 3.3662,000 MPH Health Care 1,531,400 0.44
579,955 Paion 1,345,496 0.3835,000 PharmaSGP 735,000 0.2190,000 Vita 34 1,305,000 0.37
42,813,196 12.22
Industrials: 15.30% (25.72%)14,000 2G Energy 1,211,000 0.35

30
Portfolio Statement (continued)
as at 28 February 2021
Barings German Growth Trust
Holdings Investments
Bid-Market Value
(€)
Percentage of total net
assets (%)
Equities: 99.48% (98.73%) (continued) Industrials: 15.30% (25.72%) (continued)
68,000 Befesa 3,787,600 1.08335,000 Deutsche Post 13,721,600 3.91500,000 Deutz 3,007,500 0.86
26,000 Dr Hoenle 1,145,300 0.33282,500 Francotyp-Postalia 875,750 0.25
54,000 Frequentis 1,090,800 0.31105,000 Hamburger Hafen und Logistik 2,205,000 0.63
87,000 JOST Werke 4,136,850 1.1882,000 KION 5,772,800 1.6545,000 Schaltbau 1,422,000 0.4123,000 Siemens Gamesa Renewable Energy 706,560 0.20
200,000 Singulus Technologies 1,172,000 0.3328,000 Sixt 1,716,400 0.4946,000 Steico 3,302,800 0.9487,000 Technotrans 2,388,150 0.68
155,000 Traton 3,585,150 1.0253,000 Wienerberger 1,477,640 0.42
150,000 Zumtobel Group 895,500 0.2653,620,400 15.30
Information Technology: 22.00% (25.51%)19,000 Adesso 2,156,500 0.62
114,000 ADVA Optical Networking 1,061,340 0.3084,000 Allgeier 1,957,200 0.5648,000 DataSE 3,091,200 0.8866,000 Dialog Semiconductor 4,247,760 1.21
125,000 Exasol 2,707,500 0.77200,000 GFT Technologies 3,168,000 0.90
23,000 GK Software 2,599,000 0.74155,000 Infineon Technologies 5,459,875 1.56
60,000 Jenoptik 1,596,000 0.46260,000 LPKF Laser & Electronics 6,669,000 1.90230,000 Mobotix 1,667,500 0.48
70,000 Nagarro 6,440,000 1.84114,000 PSI Software 3,420,000 0.98118,000 PVA TePla 2,778,900 0.79170,000 S&T 3,780,800 1.08205,000 SAP 21,115,000 6.02
42,956 Softing 237,117 0.0786,000 Traffic Systems 2,958,400 0.84
77,111,092 22.00
Materials: 11.39% (6.21%)90,000 AlzChem 2,214,000 0.63
205,000 BASF 13,722,700 3.92149,000 BRAIN Biotechnology Research & Information Network 1,469,140 0.42
60,000 Covestro 3,618,000 1.0370,000 Evonik Industries 1,944,600 0.5642,000 Ibu-Tec Advanced Materials 1,688,400 0.4842,000 Ibu-Tec Advanced Materials Rights 43,260 0.01

31
Portfolio Statement (continued)
as at 28 February 2021
Barings German Growth Trust
Holdings Investments
Bid-Market Value
(€)
Percentage of total net
assets (%)
Equities: 99.48% (98.73%) (continued) Materials: 11.39% (6.21%) (continued)
33,000 LafargeHolcim 1,513,895 0.43170,000 Lanxess 10,325,800 2.95115,000 Nabaltec 3,381,000 0.96
39,920,795 11.39
Real Estate: 0.39% (0.49%)35,000 Deutsche Wohnen 1,371,650 0.39
Technology: 3.55% (0.39%)174,857 7C Solarparken 725,656 0.21
85,000 Siltronic 11,713,000 3.3412,438,656 3.55
Telecommunications: 0.36% (0.35%)70,000 Freenet 1,254,050 0.36
Utilities: 2.28% (2.10%)34,919 ABO Wind 1,557,387 0.45
203,000 RWE 6,418,860 1.837,976,247 2.28
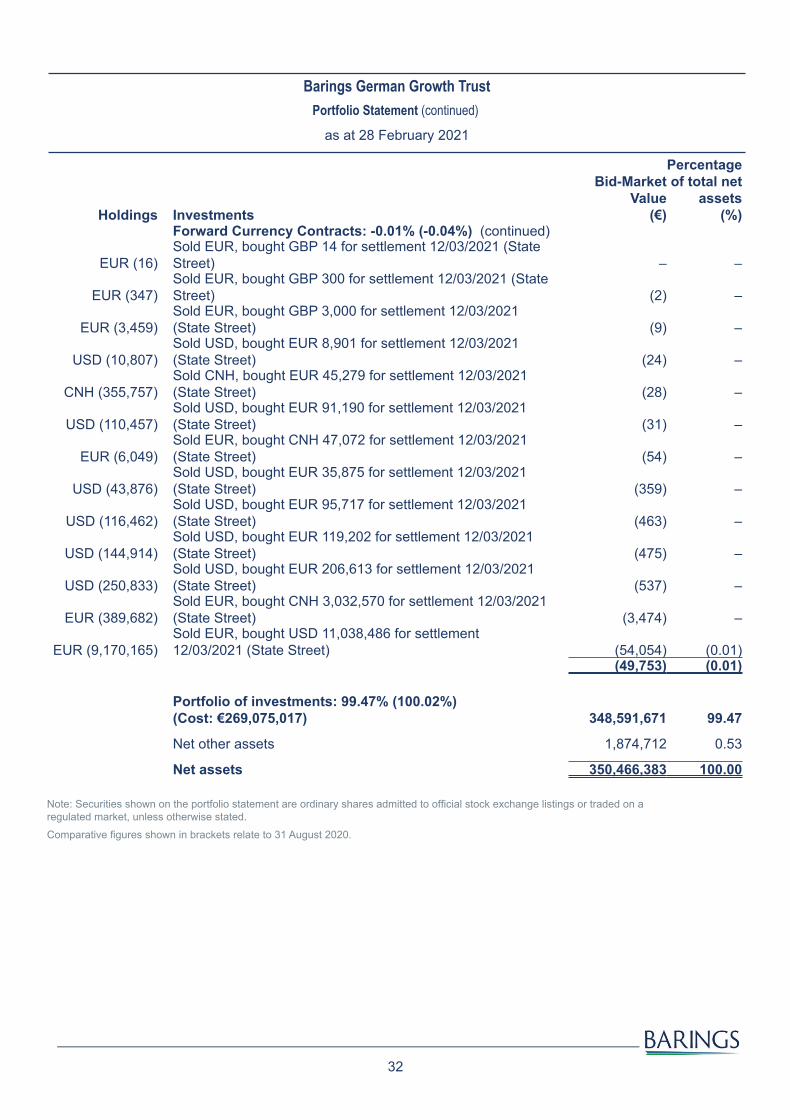
Forward Currency Contracts: -0.01% (-0.04%)
EUR (581,393)Sold EUR, bought GBP 511,412 for settlement 12/03/2021 (State Street) 7,596 –
USD (220,987)Sold USD, bought EUR 183,582 for settlement 12/03/2021 (State Street) 1,080 –
USD (58,410)Sold USD, bought EUR 48,524 for settlement 12/03/2021 (State Street) 287 –
GBP (20,734)Sold GBP, bought EUR 24,083 for settlement 12/03/2021 (State Street) 237 –
USD (64,545)Sold USD, bought EUR 53,491 for settlement 12/03/2021 (State Street) 187 –
EUR (15,868)Sold EUR, bought GBP 13,958 for settlement 12/03/2021 (State Street) 185 –
EUR (5,801)Sold EUR, bought GBP 5,100 for settlement 12/03/2021 (State Street) 64 –
USD (24,042)Sold USD, bought EUR 19,907 for settlement 12/03/2021 (State Street) 52 –
EUR (3,975)Sold EUR, bought GBP 3,484 for settlement 12/03/2021 (State Street) 33 –
EUR (19,570)Sold EUR, bought GBP 17,036 for settlement 12/03/2021 (State Street) 23 –
EUR (796)Sold EUR, bought GBP 700 for settlement 12/03/2021 (State Street) 9 –
EUR (156)Sold EUR, bought GBP 137 for settlement 12/03/2021 (State Street) 2 –
EUR (114)Sold EUR, bought GBP 100 for settlement 12/03/2021 (State Street) 1 –
EUR (114)Sold EUR, bought GBP 100 for settlement 12/03/2021 (State Street) 1 –
32
Portfolio Statement (continued)
as at 28 February 2021
Barings German Growth Trust
Holdings Investments
Bid-Market Value
(€)
Percentage of total net
assets (%)
Forward Currency Contracts: -0.01% (-0.04%) (continued)
EUR (16)Sold EUR, bought GBP 14 for settlement 12/03/2021 (State Street) – –
EUR (347)Sold EUR, bought GBP 300 for settlement 12/03/2021 (State Street) (2) –
EUR (3,459)Sold EUR, bought GBP 3,000 for settlement 12/03/2021 (State Street) (9) –
USD (10,807)Sold USD, bought EUR 8,901 for settlement 12/03/2021 (State Street) (24) –
CNH (355,757)Sold CNH, bought EUR 45,279 for settlement 12/03/2021 (State Street) (28) –
USD (110,457)Sold USD, bought EUR 91,190 for settlement 12/03/2021 (State Street) (31) –
EUR (6,049)Sold EUR, bought CNH 47,072 for settlement 12/03/2021 (State Street) (54) –
USD (43,876)Sold USD, bought EUR 35,875 for settlement 12/03/2021 (State Street) (359) –
USD (116,462)Sold USD, bought EUR 95,717 for settlement 12/03/2021 (State Street) (463) –
USD (144,914)Sold USD, bought EUR 119,202 for settlement 12/03/2021 (State Street) (475) –
USD (250,833)Sold USD, bought EUR 206,613 for settlement 12/03/2021 (State Street) (537) –
EUR (389,682)Sold EUR, bought CNH 3,032,570 for settlement 12/03/2021 (State Street) (3,474) –
EUR (9,170,165)Sold EUR, bought USD 11,038,486 for settlement 12/03/2021 (State Street) (54,054) (0.01)
(49,753) (0.01)
Portfolio of investments: 99.47% (100.02%) (Cost: €269,075,017) 348,591,671 99.47
Net other assets 1,874,712 0.53
Net assets 350,466,383 100.00
Note: Securities shown on the portfolio statement are ordinary shares admitted to official stock exchange listings or traded on a regulated market, unless otherwise stated.Comparative figures shown in brackets relate to 31 August 2020.

33
Statement of Total Return and Statement of Change in Net Assets Attributable to Unitholders
for the period ended 28 February 2021
Barings German Growth Trust
Statement of Total Return
28/02/2021 29/02/2020€'000 €'000 €'000 €'000
IncomeNet capital gains/(losses) 50,930 (11,223)Revenue 991 1,631Expenses (2,341) (2,945)
Interest payable and other similar charges (6) –Net expense before taxation (1,356) (1,314)Taxation (94) (244)Net expense after taxation (1,450) (1,558)Total return before equalisations 49,480 (12,781)Equalisations (7) –Change in net assets attributable to unitholders from investment activities 49,473 (12,781)
Statement of Change in Net Assets Attributable to Unitholders
28/02/2021 29/02/2020€'000 €'000 €'000 €'000
Opening net assets attributable to unitholders* 366,385 448,154Amounts receivable on issue of units 20,001 27,582Amounts payable on cancellation of units (85,393) (77,335)
(65,392) (49,753)Changes in net assets attributable to unitholders from investment activities 49,473 (12,781)Closing net assets attributable to unitholders 350,466 385,620
* The opening net assets attributable to unitholders for 28 February 2021 differs to the closing position in 29 February 2020 by the movement between the two interim periods of the Trust.

34
Balance Sheet
as at 28 February 2021
Barings German Growth Trust
28/02/2021 31/08/2020€'000 €'000
AssetsInvestment assets 348,652 366,645Current assets:
Debtors 3,314 1,303Cash and bank balances 1,805 804
Total assets 353,771 368,752
LiabilitiesCreditors:Investment liabilities (60) (172)
Bank overdraft (1,083) (807)Distribution payable on income units – (108)Other creditors (2,162) (1,280)
Total liabilities (3,305) (2,367)Net assets attributable to unitholders 350,466 366,385
Note to the Financial Statementsfor the period ended 28 February 2021
The interim financial statements have been prepared on the same basis as the annual audited financial statements for the year ended 31 August 2020. They are in accordance with the historical cost convention, as modified by the revaluation of investments and the Statement of Recommended Practice for Authorised Funds issued by the Investment Association in May 2014 (the “IMA SORP 2014”). The financial statements have been prepared on a going-concern basis.
Post balance sheet eventsSubsequent to the period end, the price per unit of the A EUR Accumulation class has increased from 1,008.00c to 1,100.00c, A GBP Accumulation class from 875.30p to 954.10p, A GBP Income class from 785.50p to 856.20p, A EUR Income class from 900.10c to 982.50c, A USD Accumulation class from 1,219.00c to 1,325.00c, A USD Hedged Accumulation class from 1,214.00c to 1,328.00c, A RMB Hedged Accumulation class from RMB 82.99 to RMB 91.09, I GBP Accumulation class from 929.30p to 1,015.00p, I GBP Income class from 782.90p to 854.40p, I GPB Hedged Accumulation class from 939.80p to 1,029.00p, I EUR Accumulation class from 1,070.00c to 1,169.00c, I EUR Income class from 880.30c to 962.00c and I USD Accumulation class from 1,280.00c to 1,394.00c as at 23 April 2021. This movement takes into account routine transactions. The Manager continues to monitor investment performance in line with investment objectives.

35
Barings Strategic Bond FundInvestment Objective and Policy and Fund at a Glance
Investment Objective and PolicyThe investment objective of Barings Strategic Bond Fund (the “Fund”) is to achieve capital growth together with income by investing globally. The Fund will seek to achieve its investment objective by investing directly and indirectly in fixed income securities globally, as well as cash, near cash and money market instruments. The Fund may invest directly and indirectly in investment grade, sub-investment grade and unrated bonds issued by governments, sovereigns, supranationals and corporates in developed and emerging markets. The Investment Manager has the ability to invest directly or indirectly in debt securities of any maturity, duration or credit rating (including unrated).In order to implement the investment policy, the Fund may gain indirect exposure through investments in collective investment schemes (including collective investment schemes which are managed by the Manager or an associate of the Manager) and other transferable securities. It may also obtain indirect exposure through derivatives including futures, options, swaps, warrants and forward contracts for efficient portfolio management and for investment purposes. Forward currency transactions will be used to gain exposure to currencies and may be used to manage currency risk when considered appropriate. Please refer to the Prospectus for the full investment objective and policy.Performance Assessment The Fund is not managed to a benchmark, nor does the Manager use a benchmark in assessing the Fund’s performance, Investors may however refer to the information in Morningstar’s Global Bond Category, which presents data for a range of funds (including the Fund) which are grouped according to investment style, including performance information, and which enables investors to compare information across products.How the Fund is ManagedThe Fund invests in corporate and government bond markets where it is believed that yields are likely to fall (and prices are likely to rise). It also avoids those which are evaluated as expensive, and where returns are likely to be negative in the medium term. The overall duration or interest rate sensitivity of the Fund will fluctuate as expectations for economic developments change, relative to the market. The Manager will also look to add value through foreign exchange management, identifying those markets where currencies are attractive, for example, due to sound economic fundamentals or rising interest rates.
Risk Profile Please see detailed below the key risks applicable to the Fund:• There is no guarantee that a bond issuer will pay the interest due or repay the loan. Bond values are likely to fall
if interest rates rise.• Where a bond market has a low number of buyers and/or a high number of sellers, it may be harder to sell fund
investments at an anticipated price or in a timely manner. This could have a negative impact on the value of your investment. In extreme conditions, this could affect the Fund’s ability to meet investors’ redemption requests.
• Derivative instruments can make a profit or a loss and there is no guarantee that a financial derivative contract will achieve its intended outcome. The use of derivatives can increase the amount by which the Fund’s value rises and falls and could expose the Fund to losses that are significantly greater than the cost of the derivative as a relatively small movement may have a larger impact on derivatives than the underlying assets.
• Emerging market countries may have less developed regulation and face more political, economic or structural challenges than developed countries. This means your money is at greater risk.
• Losses may occur if an organisation through which we buy an asset (such as a bank) fails to meet its obligations.• Liquidity risk exists when a particular security or instrument is difficult to purchase or sell. If the amount of a
transaction is particularly large or if the relevant market is illiquid (as is the case with many privately negotiated derivatives, structured products, etc), it may not be possible to initiate a transaction or liquidate a position at an advantageous time or price.
Please refer to the Prospectus for the full risk profile.

36
Barings Strategic Bond FundInvestment Objective and Policy and Fund at a Glance (continued)
The Fund at a Glance on 28 February 2021
Total Fund size: 28 February 2021 £32.88 million
Total Fund size: 31 August 2020 £31.92 millionOCF* 28/02/2021 31/08/2020Class A GBP Inc** 1.61% 1.58%Class I GBP Inc 1.01% 0.98%
Initial charge Annual chargeClass A GBP Inc** up to 5.00% 1.25%Class I GBP Inc Nil 0.65%
Minimum initial investment Minimum subsequent investmentClass A GBP Inc** £1,000 £500Class I GBP Inc £10,000,000 £500
* The Ongoing Charge Figure (“OCF”) reflects the payments and expenses which cover aspects of operating the Fund and is deducted from the assets over the year. It includes fees paid for investment management, trustee and general charges. The OCF figures for the current period have increased due to the decrease in ‘Other expenses’ and the decrease in the ‘Net assets attributable to unitholders’ as shown on the Balance Sheet on page 45 .
** Calculation based on mid-price.
Price per unit (pence per unit)
Class A GBP Inc 120.50p
Class I GBP Inc 121.10p

37
Barings Strategic Bond FundFund Information
Class A GBP Inc - Distribution units Class I GBP Inc - Distribution units28/02/2021
(p)31/08/2020
(p)31/08/2019
(p)28/02/2021
(p)31/08/2020
(p)31/08/2019
(p)Change in net assets per unitOpening net asset value per unit 109.89 119.93 115.24 110.05 120.10 115.38Return before operating charges 11.53 (5.13) 9.47 11.60 (5.13) 9.52Operating charges (0.93) (1.83) (1.90) (0.59) (1.14) (1.11)Return after operating charges 10.60 (6.96) 7.57 11.01 (6.27) 8.41Distributions (0.95) (3.08) (2.88) (1.23) (3.78) (3.69)Closing net asset value per unit 119.54 109.89 119.93 119.83 110.05 120.10after direct transaction costs of* 0.01 0.03 0.03 0.01 0.03 0.03PerformanceReturn after charges 9.65% (5.80)% 6.57% 10.00% (5.22)% 7.29%Other informationClosing net asset value ('000) £11,817 £14,855 £18,357 £21,067 £17,065 £20,678Closing number of units 9,885,690 13,517,773 15,306,845 17,580,843 15,507,127 17,216,975Operating charges 1.61% 1.58% 1.44% 1.01% 0.98% 0.84%Direct transaction costs 0.01% 0.02% 0.03% 0.01% 0.02% 0.03%Prices**
Highest unit price 122.30 127.30 122.50 122.70 127.80 123.20Lowest unit price 109.60 93.44 112.00 109.80 93.67 112.90
*Direct transaction costs comprise commission and taxes, principally applicable to equity investment purchases and sales. Unitholders should note that there are other additional transaction costs such as dealing spread and underlying costs with regard to Investment Fund holdings which will also have reduced the Fund and unit class returns before operating charges.
**High/low prices included in the table above for the current accounting period are from 1 September 2020 to 28 February 2021. For previous periods, they relate to the accounting year from 1 September 2019 to 31 August 2020 and accounting period from 13 July 2018 to 31 August 2019, respectively.

38
Barings Strategic Bond FundReport of the Investment Manager
PerformanceDuring the reporting period from 1 September 2020 to 28 February 2021, the Barings Strategic Bond Fund (the “Fund”) produced an absolute net return for Class A GBP Inc of 9.55% compared with a return of 0.25% for the performance comparator. The table below shows the 6 month, 1 year, 3 year and 5 year annualised net return for the Class A GBP Inc units against the performance comparator.
6 months 1 year 3 years 5 yearsBarings Strategic Bond Fund 9.55% 2.05% 2.85% 2.40%Morningstar Global Bond Category 0.25% 4.75% 3.02% 3.06% As highlighted in the annual report for the year ended 31 August 2020, the Fund was negatively impacted by COVID-19, but fully recovered all post COVID-19 losses and has closed calendar year 2020 in positive territory. Performance continued to improve with economically sensitive assets rebounding from the COVID-19 hit. This was in line with our global macro-economic base case scenario.Specifically, over the current reporting period, the Fund had returned 9.55% vs negative return of (6.05%) for the reporting period ended 31 August 2020. This translates to a return of 2.05% on a 1 year horizon, 2.85% on a 3 year horizon and 2.40% on a 5 year horizon. The Investment Managers continue to have high conviction in their asset selection and investment strategy and continue to expect positive Fund returns over the short to medium term. The Fund distributes income collected semi-annually. This is not a targeted return measure and varies from time to time. The Fund’s overall performance is measured on an absolute return basis. The average 1 year and 3 year income distribution for the Class A GBP Inc was 2.86p and 2.56p respectively and for the Class I GBP Inc was 3.55p and 3.30p respectively.The Fund’s positioning remain biased towards risk assets, with long positions in Eurozone peripheral sovereign bonds and spreads, DM credit, EM hard currency bonds and commodity linked currencies (CLCs) such as the Australian Dollar and Chilean Peso. On Brexit, we expected a positive conclusion and therefore raised our GBP exposure through long positions in GBP/USD and selling EUR/GBP FX futures.There are three notable positioning changes during the current reporting period, namely:• We continued to actively hedge FX exposure given GBP (base currency) FX volatility on Brexit. This was done
through currency futures;• We reduced exposure to Emerging Markets, including exposure to long maturity bonds given the high inherent
risks, and overall contribution to portfolio risk; and• We also reduced exposure to long maturity Italian bonds. Domestic political volatility was dragging down
performance, and the outlook on spread compression to Germany remains uncertain.

39
Barings Strategic Bond FundReport of the Investment Manager (continued)
The top ten purchases and sales during the period were as follows:
Purchases Costs £’000
UK Treasury Bond 0.00% 09/08/2021 5,096
US Treasury Bond 0.00% 27/11/2020 3,337
US Treasury Bond 0.00% 21/01/2021 3,215
SPDR Refinitiv Global Convertible Bond UCITS 2,999
Italy Buoni Poliennali Del Tesoro 2.8% 01/03/2067 2,817
US Treasury Bond 0.00% 15/07/2021 2,412
Hellenic Republic Government Bond 3.375% 15/02/2025 2,210
Hellenic Republic Government Bond 3.9% 30/01/2033 1,838
Italy Buoni Poliennali Del Tesoro 2.7% 01/03/2047 1,755
Deutsche Bundesrepublik Inflation Linked Bond 0.10% 15/04/2023 1,683
Sales Proceeds £’000
SPDR Refinitiv Global Convertible Bond UCITS 5,213
Italy Buoni Poliennali Del Tesoro 2.8% 01/03/2067 4,741
US Treasury Bond 0.00% 27/11/2020 3,218
US Treasury Bond 0.00% 21/01/2021 3,140
Hellenic Republic Government Bond 3.9% 30/01/2033 2,858
United States Treasury Inflation Indexed Bonds 0.25% 15/02/2050 2,151
Portugal Obrigacoe 4.1% 15/02/2045 1,759
Italy Buoni Poliennali Del Tesoro 2.7% 01/03/2047 1,627
US Treasury Bond 3.125% 15/05/2021 1,528
Mexico Government International Bond 4% 15/03/2115 1,502
Market OutlookWe maintained a positive economic outlook premised on the ongoing strong economic recovery supported by extremely accommodative monetary policy, large global fiscal stimulus programs and encouraging results from the COVID-19 vaccine trials.Our global economic and market outlook has not changed; recovery expectations remain buoyant premised on:• Additional rounds of fiscal stimulus in the US and Europe;• Discovery of COVID-19 vaccine and ongoing mass vaccination programs underway in most major economies;• Resilient consumption globally, supported by government job support schemes; and• Monetary policy set to remain loose over the next few years across major economies, thus supporting the
recovery in the medium term.We however acknowledge that asset valuations in most markets have recovered to pre-COVID-19 levels. The recovery is arguably priced-in. The bar for significant positive economic surprises is high, but the stock of stimulus injected into the global economy post COVID-19 and policymakers’ bias towards supporting the recovery provides a strong base for the economic recovery continuing into 2022. Since our base outlook has not changed, the Fund’s overall positioning has equally not changed. We are maintaining a pro-risk bias, positioning for sectors that are likely to benefit from the global infrastructure boom.
Baring Asset Management LimitedBaring Asset Management Limited (the “Investment Manager”) gives its portfolio managers full authority to manage their funds as they see fit, within the established guidelines set down. This includes the views that managers may take of the markets and sectors they invest in, which may differ from the views of other Barings portfolio managers.

40
Barings Strategic Bond FundDirectors’ Statement
The financial statements on pages 44 and 45 were approved by Baring Fund Managers Limited (the “Manager") and signed on its behalf by:
R. KENT Director
J. SWAYNE Director London 27 April 2021

41
Portfolio Statement
as at 28 February 2021
Barings Strategic Bond Fund
Holdings Investments
Bid-Market value
(£)
Percentage of total net
assets (%)
Bonds: 76.63% (77.23%)
Euro: 23.82% (25.86%)
EUR 1,720,998Deutsche Bundesrepublik Inflation Linked Bond 0.10% 15/04/2023 1,674,483 5.09
EUR 2,151,000Hellenic Republic Government Bond 3.375% 15/02/2025 2,099,791 6.39
EUR 1,600,000Petroleos Mexican 5.125% 15/03/2023 5.125% 15/03/2023 1,464,017 4.45
EUR 1,400,000Republic of South Africa Government International Bond 3.75% 24/07/2026 1,308,618 3.98
EUR 1,425,000Turkey Government International Bond 4.125% 11/04/2023 1,285,885 3.91
7,832,794 23.82
Mexican peso: 3.70% (0.00%)MXN 31,930,000 Mexican Bonos 7.75% 29/05/2031 1,217,919 3.70
Pound sterling: 19.85% (2.70%)GBP 1,200,000 Petrobras Global Finance 6.625% 16/01/2034 1,432,260 4.35GBP 5,096,235 UK Treasury Bond 0.00% 09/08/2021 5,095,565 15.50
6,527,825 19.85
Russian ruble: 3.88% (0.00%)RUB 122,298,000 Russian Federal Bond - OFZ 8.15% 03/02/2027 1,276,690 3.88
South African rand: 5.30% (0.00%)
ZAR 16,352,655Republic of South Africa Government Bond 8.00% 31/01/2030 729,297 2.22
ZAR 25,834,456Republic of South Africa Government Bond 8.75% 31/01/2044 1,014,325 3.08
1,743,622 5.30
US dollar: 20.08% (48.67%)
USD 1,571,000Brazilian Government International Bond 3.875% 12/06/2030 1,124,802 3.42
USD 1,272,000Brazilian Government International Bond 6.00% 07/04/2026 1,059,619 3.22
USD 1,578,000Republic of South Africa Government International Bond 4.665% 17/01/2024 1,204,620 3.66
USD 1,307,300United States Treasury Inflation Indexed Bonds 0.657% 15/04/2023 1,042,948 3.17
USD 1,553,500United States Treasury Inflation Indexed Bonds 0.126% 15/04/2025 1,211,564 3.69
USD 1,335,000 US Treasury Bond 0.00% 15/07/2021 958,545 2.926,602,098 20.08
Credit Default Swaps : 0.00% (1.71%)
Euro: 0.00% (1.41%)

42
Portfolio Statement (continued)
as at 28 February 2021
Barings Strategic Bond Fund
Holdings Investments
Bid-Market value
(£)
Percentage of total net
assets (%)
Credit Default Swaps : 0.00% (1.71%) (continued) US dollar: 0.00% (0.30%)
Time Deposits: 0.00% (0.66%)US dollar: 0.00% (0.66%)
Exchange Traded Funds: 4.06% (10.39%)US dollar: 4.06% (10.39%)
34,793 SPDR Refinitiv Global Convertible Bond UCITS 1,334,752 4.06
Futures Contracts: 0.99% (1.76%)Australian dollar: 0.23% (0.00%)
(65) Future Australian 10yr SFE June 2021 74,926 0.23(17) Future Australian Dollar X-RAT CME March 2021 (647) –
74,279 0.23
Euro: 0.06% (-0.26%)(6) Future EUR OAT Eurx March 2021 10,067 0.03
(15) Future Eurx Eur-Bund June 2021 8,997 0.0319,064 0.06
Pound sterling: 0.87% (0.00%)(74) Future Euro/GBP CME March 2021 281,379 0.85(25) Future Long Gilt ICF June 2021 6,230 0.02
287,609 0.87
US dollar: -0.17% (2.02%)34 Future AUD/USD Currency CME March 2021 (2,700) (0.01)
115 Future British Pound Currency CME March 2021 (49,861) (0.15)18 Future Canadian Dollar Currency CME March 2021 (2,830) (0.01)20 Future EURO FX March 2021 (6,912) (0.02)(5) Future US 10yr Ultra CBT June 2021 6,284 0.02
(56,019) (0.17)
Interest Rate Swaps: 1.61% (0.00%)Canadian dollar: 0.69% (0.00%)
(4,500,000) Pay Fixed Citigroup CDOR 3M 1.96% 02/05/2031 – –4,500,000 Receive Fixed Citigroup CDOR 3M 1.96% 02/05/2031 226,111 0.69
226,111 0.69
New Zealand dollar: 0.45% (0.00%)(5,000,000) Pay Fixed Citigroup BBR 3M 1.37% 02/03/2051 – –
5,000,000 Receive Fixed Citigroup BBR 3M 1.37% 02/03/2051 148,773 0.45148,773 0.45
Norwegian krone: 0.29% (0.00%)(30,000,000) Pay Fixed Citigroup Nibor 6M 1.46% 02/05/2031 – –
30,000,000 Receive Fixed Citigroup Nibor 6M 1.46% 02/05/2031 93,725 0.2993,725 0.29
South African rand: 0.18% (0.00%)(40,000,000) Pay Fixed Citigroup JIBAR 3M 5.09% 02/09/2026 – –
40,000,000 Receive Fixed Citigroup JIBAR 3M 5.09% 02/09/2026 59,502 0.1859,502 0.18

43
Portfolio Statement (continued)
as at 28 February 2021
Barings Strategic Bond Fund
Holdings Investments
Bid-Market value
(£)
Percentage of total net
assets (%)
Forward Currency Contracts: 0.17% (-0.05%)
USD (4,547,127)Sold USD, bought EGP 74,150,000 for settlement 20/05/2021 (Northern Trust) 57,737 0.18
JPY (489,975,375)Sold JPY, bought GBP 3,358,105 for settlement 30/12/2021 (State Street) 39,402 0.12
USD (1,000,000)Sold USD, bought CLP 759,010,000 for settlement 31/03/2021 (Standard Chartered Bank) 36,846 0.11
EUR (1,250,000)Sold EUR, bought PLN 5,729,539 for settlement 30/06/2021 (Northern Trust) 13,277 0.04
USD (4,903,385)Sold USD, bought TWD 135,000,000 for settlement 30/06/2021 (Standard Chartered Bank) 11,037 0.03
PEN (4,816,800)Sold PEN, bought USD 1,332,337 for settlement 05/04/2021 (Standard Chartered Bank) 8,571 0.03
PLN (8,729,539)Sold PLN, bought EUR 1,927,548 for settlement 30/06/2021 (Northern Trust) (149) –
EUR (667,103)Sold EUR, bought PLN 3,000,000 for settlement 30/06/2021 (Northern Trust) (4,027) (0.01)
USD (1,331,564)Sold USD, bought PEN 4,816,800 for settlement 05/04/2021 (Standard Chartered Bank) (8,016) (0.02)
SEK (30,510,200)Sold SEK, bought NOK 31,000,000 for settlement 31/08/2021 (Northern Trust) (35,562) (0.11)
USD (3,416,494)Sold USD, bought CLP 2,400,940,862 for settlement 23/06/2021 (Standard Chartered Bank) (63,964) (0.20)
55,152 0.17
Portfolio of investments: 83.46% (91.04%) 27,443,896 83.46
Net other assets 5,440,410 16.54
Net assets 32,884,306 100.00
Note: Securities shown on the portfolio statement are ordinary shares admitted to official stock exchange listings or traded on a regulated market, unless otherwise stated.Comparative figures shown in brackets relate to 31 August 2020.
Debt security allocation is as follows:Percentage of debt securities above investment grade 28.74%Percentage of debt securities below investment grade (sub BBB - or unrated) 71.26%
100.00%

44
Statement of Total Return and Statement of Change in Net Assets Attributable to Unitholders
for the period ended 28 February 2021
Barings Strategic Bond Fund
Statement of Total Return
28/02/2021 29/02/2020£'000 £'000 £'000 £'000
IncomeNet capital gains/(losses) 2,699 (679)Revenue 580 781Expenses (175) (215)
Interest payable and other similar charges (12) (42)Net revenue before taxation 393 524Taxation – –Net revenue after taxation 393 524Total return before distributions 3,092 (155)Distributions (319) (422)Change in net assets attributable to unitholders from investment activities 2,773 (577)
Statement of Change in Net Assets Attributable to Unitholders
28/02/2021 29/02/2020£'000 £'000 £'000 £'000
Opening net assets attributable to unitholders* 31,920 39,035Amounts receivable on issue of units 857 1,244Amounts payable on cancellation of units (2,672) (3,229)
(1,815) (1,985)Changes in net assets attributable to unitholders from investment activities 2,773 (577)Unclaimed distributions 6 2Closing net assets attributable to unitholders 32,884 36,475
* The opening net assets attributable to unitholders for 28 February 2021 differs to the closing position in 29 February 2020 by the movement between the two interim periods of the Fund.

45
Balance Sheet
as at 28 February 2021
Barings Strategic Bond Fund
28/02/2021 31/08/2020
£'000 £'000
AssetsInvestment assets 27,619 29,609Current assets:
Debtors 3,040 451Cash and bank balances 4,927 2,954
Total assets 35,586 33,014
LiabilitiesCreditors:Investment liabilities (175) (338)
Bank overdraft (1,823) –Distribution payable on income units (311) (618)Other creditors (393) (138)
Total liabilities (2,702) (1,094)Net assets attributable to unitholders 32,884 31,920
Note to the Financial Statementsfor the period ended 28 February 2021
The interim financial statements have been prepared on the same basis as the annual audited financial statements for the year ended 31 August 2020. They are in accordance with the historical cost convention, as modified by the revaluation of investments and the Statement of Recommended Practice for Authorised Funds issued by the Investment Association in May 2014 (the “IMA SORP 2014”). The financial statements have been prepared on a going-concern basis.
Post balance sheet eventsSubsequent to the period end, the price per unit of the A GBP Income class has decreased from 120.50p to 119.60p and I GBP Income class has decreased from 121.10p to 120.00p as at 23 April 2021. This movement takes into account routine transactions. The Manager continues to monitor investment performance in line with investment objectives.

46
Barings Strategic Bond FundDistribution Tables
Interim Distribution Group 1: Units purchased prior to 1 September 2020Group 2: Units purchased between 1 September 2020 and 28 February 2021Interim distribution - Class A GBP Inc (in pence per unit)
GroupNet
RevenueEqualisation
2021 Distribution
Payable
2020 Distribution
Paid
1 0.9492 0.0000 0.9492 1.1686
2 0.8095 0.1397 0.9492 1.1686
Interim distribution - Class I GBP Inc (in pence per unit)
GroupNet
RevenueEqualisation
2021 Distribution
Payable
2020 Distribution
Paid
1 1.2344 0.0000 1.2344 1.4638
2 1.0124 0.2220 1.2344 1.4638

47
Barings UK Unit TrustsThe Risk and Reward Profile
SRRI risk category*28/02/2021
SRRI risk category*31/08/2020
Barings Europe Select - Class A GBP Inc 6 6
Barings Europe Select - Class A EUR Acc 6 6
Barings Europe Select - Class A EUR Inc 6 6
Barings Europe Select - Class A USD Acc 6 6
Barings Europe Select - Class I GBP Acc** 6 N/A
Barings Europe Select - Class I GBP Inc 6 6
Barings Europe Select - Class I EUR Acc 6 6
Barings Europe Select - Class I EUR Inc 6 6
SRRI risk category*28/02/2021
SRRI risk category*31/08/2020
Barings German Growth - Class A GBP Acc 6 6
Barings German Growth - Class A GBP Inc 6 6
Barings German Growth - Class A EUR Acc 6 6
Barings German Growth - Class A EUR Inc 6 6
Barings German Growth - Class A USD Acc 6 6
Barings German Growth - Class A USD Hedged Acc 6 6
Barings German Growth - Class A CHF Hedged Acc 6 6
Barings German Growth - Class A RMB Hedged Acc 6 6
Barings German Growth - Class I GBP Acc 6 6
Barings German Growth - Class I GBP Inc 6 6
Barings German Growth - Class I GBP Hedged Acc 6 6
Barings German Growth - Class I EUR Acc 6 6
Barings German Growth - Class I EUR Inc 6 6
Barings German Growth - Class I USD Acc 6 6

48
Barings UK Unit TrustsThe Risk and Reward Profile (continued)
SRRI risk category*28/02/2021
SRRI risk category*31/08/2020
Barings Strategic Bond - Class A GBP Inc 5 5
Barings Strategic Bond - Class I GBP Inc 5 5
* The Synthetic Risk and Reward Indicator (“SRRI”) is not a measure of the risk of capital loss, but a measure of the Trust's price movement over time; the higher the number, the greater the price movement both up and down. It is based on historical data and is not a reliable indication of the future risk profile of the Trust. The risk category shown is in line with the Key Investor Information Document (“KIID”) at year-end, is not guaranteed, and may change over time. The risk categories are measured from 1 to 7 (1 measuring typically lower risk/rewards and 7 measuring typically higher risk/rewards). The lowest category does not mean a risk-free investment. The Trust is classified in the category indicated due to past movements in the Trust’s price. There is no capital guarantee. The value of investments and the income from them may go down as well as up and investors may not get back the amount they invest. The SRRI figures shown have not changed during the period.
** Share class was launched on 30 October 2020.

49
Barings UK Unit TrustsOther Important Information
ConstitutionThe Trusts were constituted by a Trust Deed between Baring Fund Managers Limited (‘the Manager”) and NatWest Trustee and Depositary Services Limited.This document has been issued by the Manager, which is authorised by the Financial Conduct Authority.The Trusts are authorised unit trust schemes as defined in section 243 of the Financial Services and Markets Act 2000 and have been established as Undertakings for Collective Investments in Transferable Securities ("UCITS") schemes.
PerformancePast performance is no indication of current or future performance. Investment involves risk. The value of any investments and any income generated may go down as well as up and is not guaranteed. Any reference in the Investment Manager reports for any of the Trusts should not be read as recommendations to investors to buy or sell the same but are included as illustrations only.
Key changes during the periodThe Prospectus of the Trusts was updated on 5 March 2021. The material changes to the Prospectus are outlined as follows:• Updated disclosures on the United Kingdom’s exit from the European Union:• Inclusion of additional disclosures to bring the Trusts into compliance with Level 1 of the Sustainable Finance
Disclosure Regulation (“SFDR”).• The following Trusts have been categorised under Article 6 of the regulation (non-ESG financial products):
a. Barings German Growth Trust;b. Barings Strategic Bond Fund;
• The following Trusts have been brought into scope of Article 8 of the regulation and can be categorised as “Light Green” ESG products:
a. Barings Europe Select Trust; The prospectus include clarifications to the investment policy and strategy of these Trusts.There are other immaterial changes to the Prospectus that are not listed above.Effective 1 September 2020, Barings Europe Select Trust re-opened for ongoing subscription by existing and new investors.
Market timingRepeatedly purchasing and selling units in the Trusts in response to short-term market fluctuations – known as ‘market timing’ – can disrupt the Manager's investment strategy and increase the Trusts’ expenses to the prejudice of all unitholders.The Trusts are not intended for market timing or excessive trading. To deter these activities, the Manager may refuse to accept an application for units from persons that it reasonably believes are engaged in market timing or are otherwise excessive or potentially disruptive to the Trusts.The Manager also reserves the right to redeem units which it reasonably believes have been purchased by unitholders engaged in market timing.
Publication of pricesThe prices of units are published on the Barings website at www.barings.com. You can also obtain prices by telephone by calling +44 (0) 333 300 0372.
Dealing basisThe Manager’s basis for dealing in purchases and sales of the Trusts’ units is “forward”. This means that the price used for any deal will be calculated at the next valuation point following receipt of the investor’s instruction.

50
Barings UK Unit TrustsOther Important Information (continued)
Fees and expensesThe Manager’s periodic charge is calculated on each business day, based on the value of the property of the Trusts on the immediately preceding business day, and is paid to the Manager monthly, in arrears, on the first business day of the calendar month immediately following. The current annual management fees charged to the Trust are shown on 5, 20, and 36.
Revenue allocations and reportsRevenue allocations are made on 30 April (interim) and 31 October (final) of each year, where applicable, and forwarded to unitholders together with tax vouchers. The most recent annual report and audited financial statements and interim report and unaudited financial statements will be available on the Baring Asset Management Limited website at www.barings.com.
Prospectus and Manager's reportsCopies of the Prospectus, the Key Investor Information Document(s) (“KIID(s)”), and the most recent annual or interim report and financial statements are available to all persons free of charge from the Manager upon request.PricewaterhouseCoopers LLP (the "Independent Auditor") expresses its opinion on the English version of the annual report and financial statements, and accepts no responsibility for any translations of those financial statements.
Value AssessmentAs part of the FCA’s Asset Management Market Study, Authorised Fund Managers are now required to produce an annual Value Assessment for all UK authorised funds. The Manager had published the Value Assessment for the Barings funds as part of a broader composite report in the 4th Quarter 2020. This is available on the Barings website at www.barings.com.

51
Barings UK Unit TrustsDisclosure for Overseas Investors
Special risks resulting from additional German tax publication requirements in GermanyA foreign investment company such as Baring Fund Managers Limited (the "Manager") must provide documentation to the German fiscal authorities upon request, e.g. in order to verify the accuracy of the additional German published tax information. German investors will use this for their tax returns. The basis upon which such figures are calculated is open to interpretation and it cannot be guaranteed that the German fiscal authorities will accept the Manager’s calculation methodology in every material respect. In addition, you should be aware that if it transpires that these publications are incorrect, any subsequent correction will, as a general rule, not have retrospective effect and will, as a general rule, only take effect during the current financial year. Consequently, the correction may positively or negatively affect the investors who receive a distribution or an attribution of deemed income distributions in the current financial period.
Information for investors in SwitzerlandThe Manager has appointed BNP Paribas Securities Services, Paris, succursale de Zurich, Selnaustrasse 16, 8002 Zurich, Switzerland as representative and paying agent for Switzerland. Units are distributed in Switzerland by BNP Paribas (Switzerland) Limited at the above address. Investors can obtain free of charge the Prospectus, KIID(s), the latest annual and interim reports, copies of the Trust Deed (and any amendments thereto) as well as a list of the purchases and sales made on behalf of the Trust, in French, from the representative at the above address. Official publications for the relevant trusts are found on the internet at www.fundinfo.com. Unit prices (Net Asset Value with the words “plus commissions”) are published daily on the internet at www.fundinfo.com.
Important information to the performance tables on page 55 to 57 The value of an investment can fall as well as rise as a result of market fluctuations and investors may not get back the amount originally invested. Past performance is no indication of current or future performance. The performance data does not take account of the commissions and costs incurred on the issue and redemption of units, nor the effect of the Manager’s preliminary charge.In conformity with a Guideline of the Swiss Funds Association (“SFA”) dated 16 May 2008, the Manager is providing the below additional information regarding performance.
Total Expense Ratio (“TER”)Following the Guideline of the Swiss Funds Association ("SFA") dated 16 May 2008, the Manager is required to publish a total expense ratio (“TER”) for the Fund for the 6 month to 28 February 2021. The TER has been established by the Manager and draws upon the data contained in the ‘‘Statement of total return’’ (Manager’s management fee, registration fees, trustee fees, safe custody charges, audit fees, Financial Conduct Authority (“FCA”) and other regulatory fees and taxation fees as well as any further fees and costs listed in the ‘‘Statement of total return’’ account which do not form part of the aforementioned categories). It is calculated with reference to these numbers and in conformity with the above guideline.

52
Barings UK Unit TrustsDisclosure for Overseas Investors (continued)
The TERs for each class for the period ended 28 February 2021 and year ended 31 August 2020 are as follows:
TER 28/02/2021
%
TER 31/08/2020
%
Barings Europe Select Trust - Class A GBP Inc 1.55 1.57
Barings Europe Select Trust - Class A EUR Acc 1.55 1.57
Barings Europe Select Trust - Class A EUR Inc 1.55 1.57
Barings Europe Select Trust - Class A USD Acc 1.57 1.57
Barings Europe Select Trust - Class I GBP Acc* 0.80 N/A
Barings Europe Select Trust - Class I GBP Inc 0.80 0.82
Barings Europe Select Trust - Class I EUR Acc 0.80 0.82
Barings Europe Select Trust - Class I EUR Inc 0.80 0.82
* The Class I GBP Acc unit class was launched on 30 October 2020.

53
Barings UK Unit TrustsDisclosure for Overseas Investors (continued)
The TERs for each class for the period ended 28 February 2021 and year ended 31 August 2020 are as follows:
TER 28/02/2021
%
TER 31/08/2020
%
Barings German Growth Trust - Class A GBP Acc 1.58 1.56
Barings German Growth Trust - Class A GBP Inc 1.58 1.56
Barings German Growth Trust - Class A EUR Acc 1.58 1.56
Barings German Growth Trust - Class A EUR Inc 1.58 1.56
Barings German Growth Trust - Class A USD Acc 1.58 1.56
Barings German Growth Trust - Class A USD Hedged Acc
1.58 1.56
Barings German Growth Trust - Class A CHF Hedged Acc
1.58 1.56
Barings German Growth Trust - Class A RMB Hedged Acc
1.58 1.56
Barings German Growth Trust - Class I GBP Acc 0.83 0.81
Barings German Growth Trust - Class I GBP Inc 0.83 0.81
Barings German Growth Trust - Class I GBP Acc 0.83 0.81
Barings German Growth Trust - Class I GBP Hedged Acc Acc
0.83 0.81
Barings German Growth Trust - Class I EUR Acc 0.83 0.81
Barings German Growth Trust - Class I EUR Inc 0.83 0.81
Barings German Growth Trust - Class I USD Acc 0.83 0.81
The TERs for each class for the period ended 28 February 2021 and year ended 31 August 2020 are as follows:
TER 28/02/2021
%
TER 31/08/2020
%
Barings Strategic Bond Fund - Class A GBP Inc 1.61 1.58
Barings Strategic Bond Fund - Class I GBP Inc 1.01 0.98

54
Barings UK Unit TrustsDisclosure for Overseas Investors (continued)
Trailer fees and reimbursementsTrailer fees (Bestandespflegekommissionen) may only be paid to the sales agents/partners indicated below:• authorised sales agents (distributors) within the meaning of Article 19, Para 1, Collective Investment Schemes
Act (“CISA”);• sales agents (distributors) exempted from the authorisation requirement within the meaning of Article 19, Para
4, CISA;• sales partners who place fund units exclusively with institutional investors with professional treasury facilities;
and/or;• sales partners who place fund units with their clients exclusively on the basis of a written commission-based
asset management mandate.Reimbursements (Rückvergütungen) may only be paid to the institutional investors detailed below who from a commercial perspective are holding the fund units for third parties:• life insurance companies (in respect of fund units held for the account of insured persons or to cover obligations
towards insured persons), pension funds and other retirement provision institutions (in respect of fund units held for the account of beneficiaries);
• investment foundations (in respect of fund units held for the account of in-house funds);• Swiss fund management companies (in respect of fund units held for the account of the funds managed); and• foreign fund management companies and providers (in respect of fund units held for the account of managed funds
and investing unitholders).

55
Barings UK Unit TrustsDisclosure for Overseas Investors (continued)
Performance record to 28 February 2021Barings Europe Select Trust
01/09/2020 - 28/02/2021
%
01/09/2019 - 31/08/2020
%
01/06/2018 - 31/08/2019
%
01/06/2017 - 31/05/2018
%
01/06/2016 - 31/05/2017
%
Class A GBP Inc (GBP terms)* 9.75 2.34 4.25 5.27 36.09
Euromoney Smaller European Companies (ex UK) Index, Total Return (GBP terms)
17.68 6.74 (0.62) 6.17 39.89
Class A EUR Acc (EUR terms)* 12.96 3.69 1.00 4.91 18.91
Class A EUR Inc (EUR terms)* 12.95 3.70 0.76 4.92 18.91
Class A USD Acc (USD terms) 14.87 11.81 (4.74) 9.27 19.58
Class I GBP Acc (GBP terms)** 13.35 N/A N/A N/A N/A
Class I GBP Inc (GBP terms) 10.15 3.12 5.22 6.06 37.17
Class I EUR Acc (EUR terms) 13.38 4.50 1.72 5.72 19.79
Class I EUR Inc (EUR terms) 13.36 4.49 1.71 5.70 19.82Performance figures are shown net of fees and charges, on a published NAV per unit basis (mid-price), with gross revenue reinvested.
Source: Morningstar/Barings/Euromoney.
* ‘Baring Europe Select Trust - Class GBP Inc’ changed its name to ‘Barings Europe Select Trust - Class A GBP Inc’ on 29 August 2017.
* ‘Baring Europe Select Trust - Class EUR Acc’ changed its name to ‘Barings Europe Select Trust - Class A EUR Acc’ on 29 August 2017.
* ‘Baring Europe Select Trust - Class EUR Inc’ changed its name to ‘Barings Europe Select Trust - Class A EUR Inc’ on 29 August 2017.
** The Class I GBP Acc unit class was launched on 30 October 2020.

56
Barings UK Unit TrustsDisclosure for Overseas Investors (continued)
Barings German Growth Trust
01/09/2020 - 28/02/2021
%
01/09/2019 - 31/08/2020
%
16/05/2018 - 31/08/2019
%
16/05/2017 - 15/05/2018
%
16/05/2016 - 15/05/2017
%
Class A GBP Acc (GBP terms) 12.06 (4.62) (11.92) 9.84 39.62
Class A GBP Inc (GBP terms) 12.08 (4.62) (11.91) 9.84 39.60
HDAX @ Total Return (GBP terms) 5.59 6.60 (5.65) 7.19 38.53
Class A EUR Acc (EUR terms) 15.45 (3.35) (14.53) 5.94 29.55
Class A EUR Inc (EUR terms) 15.34 (3.35) (14.49) 5.89 29.57
Class A USD Acc (USD terms) 17.32 4.20 (20.80) 14.98 25.36
Class A USD Hedged Acc (USD terms) 15.95 (1.32) (11.21) 8.14 31.77
Class A CHF Hedged Acc (CHF terms)* - - - - 28.75
Class A RMB Hedged Acc (RMB terms) 17.18 - - 9.97 36.10
Class I GBP Acc (GBP terms) 12.49 (3.91) (11.03) 10.67 40.69
Class I GBP Inc (GBP terms) 12.50 (3.91) (11.03) 10.67 40.65
Class I GBP Hedged Acc (GBP terms)* 15.97 (3.21) (12.39) 7.26 7.71
Class I EUR Acc (EUR terms) 15.85 (2.65) (13.68) 6.70 30.56
Class I EUR Inc (EUR terms) 15.77 (2.63) (17.09) 6.67 30.48
Class I USD Acc (USD terms) 17.97 5.34 (20.03) 15.93 26.42
Performance figures are shown net of fees and charges, on a published NAV per unit basis (mid-price), with gross revenue reinvested.
Source: Morningstar/Barings/HDAX.
* The Class A CHF Hedged Acc unit class was launched on 29 May 2015 and closed on 17 April 2018.
* The Class I GBP Hedged Acc unit class was launched on 24 March 2017.

57
Barings UK Unit TrustsDisclosure for Overseas Investors (continued)
Barings Strategic Bond Fund
01/09/2020 - 28/02/2021
%
01/09/2019 - 31/08/2020
%
13/07/2018 - 31/08/2019
%
13/07/2017 - 12/07/2018
%
13/07/2016 - 12/07/2017
%
Class A GBP Inc (GBP terms)* 9.55 (6.03) 6.79 (0.68) 0.48
Class I GBP Inc (GBP terms) 9.90 (5.43) 7.49 0.00 1.09
Performance figures are shown net of fees and charges, on a published NAV per unit basis (mid-price), with gross revenue reinvested.
Source: Morningstar/Barings
* ‘Baring Strategic Bond Fund – Class GBP Inc’ changed its name to ‘Barings Strategic Bond Fund – Class A GBP Inc’ on 29 August 2017.
For data sourced from Morningstar: © Morningstar. All Rights Reserved. The information contained herein: (1) is proprietary to Morningstar and/or its content providers; (2) may not be copied or distributed; and (3) is not warranted to be accurate, complete or timely. Neither Morningstar nor its content providers are responsible for any damages or losses arising from any use of this information. Past performance is no indication of current or future performance. The performance data does not take account of the commissions and costs incurred on the issue and redemption of units. Please note that changes in the rates of exchange may have an adverse effect on the value, price or income of an investment.

58
Barings UK Unit TrustsUnit Price History - Hong Kong Registered Trusts
Barings Europe Select Trust and Barings German Growth Trust have been registered for sale in Hong Kong.
Barings Europe Select Trust
A GBP Inc(p)
A EUR Acc(c)
A Eur Inc(c)
A USD Acc*(c)
I GBP Acc**(p)
2021HighLow
5,009.00 4,121.00
6,112.004,870.00
5,730.004,566.00
7,421.005,689.00
122.00 100.00
2020HighLow
4,419.00 3,072.00
5,616.003,607.00
5,265.003,382.00
6,125.003,928.00
N/AN/A
2019HighLow
4,383.00 3,534.00
5,141.004,150.00
4,828.003,907.00
5,971.004,728.00
N/AN/A
2018HighLow
4,184.00 3,828.00
5,000.004,482.00
4,735.004,243.00
6,184.005,206.00
N/AN/A
2017HighLow
3,887.00 2,793.00
4,717.003,615.00
4,481.003,450.00
5,253.003,982.00
N/AN/A
2016HighLow
2,891.00 2,439.00
4,042.003,373.00
3,866.003,226.00
4,393.003,783.00
N/AN/A
2015HighLow
2,701.00 2,033.00
3,908.002,652.00
3,757.002,550.00
4,372.003,380.00
N/AN/A
2014HighLow
2,486.00 2,299.00
3,106.002,406.00
3,004.002,327.00
4,277.003,834.00
N/AN/A
2013HighLow
2,171.00 1,843.00
2,579.001,879.00
2,536.001,849.00
N/AN/A
N/AN/A
2012HighLow
1,676.21 1,438.74
2,136.001,582.00
2,116.001,567.00
N/AN/A
N/AN/A
* Class A USD Acc was only launched on 2014 hence no data available from 2012 to 2013.** Class I GBP Acc was launched on 30 October 2020 hence no data available from 2012 to 2020.

59
Barings UK Unit TrustsUnit Price History - Hong Kong Registered Trusts (continued)
I GBP Inc(p)
I EUR Acc*(c)
I EUR Inc**(c)
2021HighLow
5,030.00 4,128.00
6,201.004,930.00
5,759.004,579.00
2020HighLow
4,434.00 3,084.00
5,655.003,635.00
5,287.003,398.00
2019HighLow
4,424.00 3,552.00
5,152.004,152.00
4,886.003,939.00
2018HighLow
4,212.00 3,837.00
4,973.004,438.00
4,786.004,271.00
2017HighLow
3,929.00 2,803.00
4,660.003,550.00
4,531.003,450.00
2016HighLow
2,917.00 2,450.00
3,940.003,293.00
3,892.003,252.00
2015HighLow
2,722.00 2,043.00
3,794.003,777.00
3,793.002,563.00
2014HighLow
2,507.00 2,317.00
N/AN/A
3,033.002,874.00
2013HighLow
2,183.00 1,848.00
N/AN/A
N/AN/A
2012HighLow
1,761.001,361.00
N/AN/A
N/AN/A
* Class I EUR Acc was only launched in 2015 hence no data available from 2012 to 2014.** Class I EUR Inc was only launched in 2014 hence no data available from 2012 to 2013.
Barings Europe Select Trust (continued)

60
Barings UK Unit TrustsUnit Price History - Hong Kong Registered Trusts (continued)
Barings German Growth Trust
A GBP Inc(p)
A GBP Acc(p)
A Eur Acc(c)
A EUR Inc(c)
A USD Acc*(c)
2021HighLow
819.40624.50
913.20695.90
1,046.00
770.00
934.00 688.00
1,272.00
901.00
2020HighLow
778.10479.00
866.10533.10
1,031.00
572.50
922.30 512.30
1,126.00
615.10
2019HighLow
846.20639.90
936.90708.50
1,068.00
785.80
960.40 706.90
1,262.00
894.70
2018HighLow
887.30752.00
980.20830.70
1,117.00 956.60
1,009.00
864.00
1,378.00 1,083.00
2017HighLow
771.10535.80
846.40587.90
997.70 712.10
907.80 648.10
1,095.00
788.00
2016HighLow
584.30500.90
634.80544.20
879.20 694.60
808.40638.70
966.60 785.20
2015HighLow
589.60497.30
638.80538.80
885.70606.60
817.50559.80
1,014.00
772.90
2014HighLow
553.30516.50
596.80557.30
722.10566.10
669.60 515.70
990.80 909.40
2013HighLow
472.10409.80
509.00441.80
601.90430.20
558.30 399.10
N/AN/A
2012HighLow
387.60330.70
412.90352.40
506.60340.70
539.80 363.10
N/AN/A
* Class A USD Acc was only launched on 2014 hence no data available from 2012 to 2013.

61
Barings UK Unit TrustsUnit Price History - Hong Kong Registered Trusts (continued)
A USD Hedged
Acc*(c)
A CHF Hedged
Acc**(CHF)
A RMB Hedged
Acc*(RMB)
I GBP Acc***
(p)
I GBP Inc***(p)
2021HighLow
1,260.00
924.00
N/AN/A
86.07 62.74
969.30737.00
816.60620.90
2020HighLow
1,223.00
679.40
N/AN/A
82.82 45.98
912.30562.00
775.60477.80
2019HighLow
1,208.00
904.60
N/AN/A
81.33 61.30
973.90740.00
840.70638.90
2018HighLow
1,253.00 1,064.00
11.35 9.74
83.87 70.80
1,017.00
857.00
885.90747.00
2017HighLow
1,105.00
778.00
9.30 6.75
73.02 49.90
886.00602.40
771.10532.10
2016HighLow
954.80755.10
9.06 7.14
59.71 47.93
649.6556.1
584.40500.30
2015HighLow
N/AN/A
N/AN/A
N/AN/A
648.7546.1
589.40496.10
2014HighLow
N/AN/A
N/AN/A
N/AN/A
600.9560.9
553.30516.50
2013HighLow
N/AN/A
N/AN/A
N/AN/A
509.5469.2
474.20410.30
2012HighLow
N/AN/A
N/AN/A
N/AN/A
N/AN/A
N/AN/A
* Class A USD Hedged Acc and A RMB Hedged Acc were only launched on 2016 hence no data available from 2012 to 2015.** Class A CHF Hedged Acc was only launched on 2016 and closed in 2018 hence no data available from 2012 to 2015 and 2019 to 2021.*** Class I GBP Acc and Class I GBP Inc were launched on 2013 hence no data available for 2012.
Barings German Growth Trust (continued)

62
Barings UK Unit TrustsUnit Price History - Hong Kong Registered Trusts (continued)
I GBP Hedged
Acc*(p)
I EUR Acc**(c)
I Eur Inc**(c)
I USD Acc**(c)
2021HighLow
975.00715.30
1,110.00 815.00
914.00 671.00
1,334.00
941.00
2020HighLow
961.20530.20
1,087.00
603.60
902.20 501.50
1,167.00
638.30
2019HighLow
966.30719.30
1,111.00 821.10
969.00 688.00
1,290.00
918.80
2018HighLow
1,007.00
857.20
1,159.00
989.00
1,020.00
871.00
1,406.00 1,100.00
2017HighLow
891.00826.20
1.030.00
730.00
919.00652.10
1,111.00
794.00
2016HighLow
N/AN/A
895.00710.10
807.70641.30
930.90788.10
2015HighLow
N/AN/A
N/AN/A
N/AN/A
N/AN/A
2014HighLow
N/AN/A
N/AN/A
N/AN/A
N/AN/A
2013HighLow
N/AN/A
N/AN/A
N/AN/A
N/AN/A
2012HighLow
N/AN/A
N/AN/A
N/AN/A
N/AN/A
* Class I GBP Hedged Acc was only launched on 2017 hence no data available from 2012 to 2016.** Class I EUR Acc, I EUR Inc and I USD Acc were only launched on 2016 hence no data available from 2012 to 2015.
Barings German Growth Trust (continued)

63
Barings UK Unit TrustsDirectory
ManagerBaring Fund Managers LimitedAuthorised and regulated by the Financial Conduct Authority (“FCA”).
Investment Manager Baring Asset Management Limited 20 Old Bailey London, EC4M 7BFAuthorised and regulated by the FCA.
Directors J. Armstrong (non-executive) E. BrowningR. KentJ. SwayneK. Troup (non-executive)
Registered Office20 Old BaileyLondon, EC4M 7BF
TrusteeNatWest Trustee and Depositary Services Limited250 BishopsgateLondon, EC2M 4AA Authorised by the Prudential Regulation Authority (“PRA”) and regulated by the FCA and PRA.
Administrator & RegistrarNorthern Trust Global Services SE6 rue Lou Hemmer,SenningerbergLuxembourg, L-1748
The Administrator & Registrar's principal place of business in the United Kingdom:Northern Trust Global Services SE UK Branch50 Bank StreetLondon, E14 5NTAuthorised by the PRA and regulated by the FCA and PRA.
Independent AuditorsPricewaterhouseCoopers LLPAtria One144 Morrison StreetEdinburgh, EH3 8EX
Austrian paying agentUniCredit Bank Austria AGSchottengasse 6-81010 Wien Austria

64
Barings UK Unit TrustsDirectory (continued)
French paying agentBNP Paribas Securities Services9 rue du Débarcadère93 761 Pantin CedexFrance
German paying and information agentDeutsche Bank AGGlobal Transaction BankingIssuer Services - Global Securities ServicesPost IPO ServicesTaunusanlage 1260325 Frankfurt am MainGermany
Further German information agentBaring Asset Management Limited GmbHGuiollettstraße 5460325 Frankfurt am MainGermany
Swedish paying agentSkandinaviska Enskilda Banken AB (publ)Merchant BankingGlobal Funds, RB6Rissneleden 110SE-106 40 StockholmSweden
Swiss paying agentBNP Paribas Securities Services, Parissuccursale de ZurichSelnaustrasse 168002 ZurichSwitzerland The Prospectus, the Key Investor Information Document(s) (“KIID(s)”), a list of portfolio changes, the Instrument of Incorporation as well as the annual and the interim reports and financial statements are available on www.barings.com, or via the office of the Austrian, French, German, Swedish, and Swiss paying agents.

Address:Baring Asset Management Limited 20 Old Bailey London, EC4M 7BFContact:Tel: +44 (0)20 7628 6000 Fax: +44 (0)20 7638 7928 www.barings.com