barclays high yield bond & syndicated loan conference
TRANSCRIPT

BARCLAYS HIGH YIELD BOND & SYNDICATED LOAN CONFERENCE
June 8, 2017

SAFE HARBORCautionary Statement Concerning Forward-Looking Statements Statements in this presentation that are not historical facts are forward-looking statements, within the meaning of the Private Securities Litigation Reform Act of 1995 and involve risks and/or uncertainties, including those described in the Company’s public filings with the Securities and Exchange Commission. The Company has based forward-looking statements on management’s current expectations and assumptions and not on historical facts. Examples of these statements include, but are not limited to, the Company’s expectations regarding future results and financial outlook, the payment of any future cash dividends on the Company’s common stock, the Company’s ability to generate future cash flow growth and to execute on future development and other projects (including the opening of MGM Cotai later this year) and the Company’s ability to execute its strategic plan and improve its financial flexibility. Among the important factors that could cause actual results to differ materially from those indicated in such forward-looking statements include effects of economic conditions and market conditions in the markets in which the Company operates and competition with other destination travel locations throughout the United States and the world, the design, timing and costs of expansion projects, risks relating to international operations, permits, licenses, financings, approvals and other contingencies in connection with growth in new or existing jurisdictions and additional risks and uncertainties described in the Company’s Form 10-K, Form 10-Q and Form 8-K reports (including all amendments to those reports). In providing forward-looking statements, the Company is not undertaking any duty or obligation to update these statements publicly as a result of new information, future events or otherwise, except as required by law. If the Company updates one or more forward-looking statements, no inference should be drawn that it will make additional updates with respect to those other forward-looking statements. Use of Non-GAAP Financial Measures The financial information included in this presentation includes non-GAAP financial measures. Schedules that reconcile the non-GAAP financial measures to the most directly comparable financial measures calculated and presented in accordance with Generally Accepted Accounting Principles in the United States are included in the Company’s earnings releases that have been furnished with the SEC and are available on our website at www.mgmresorts.com
2

Dan D’ArrigoEVP & Chief Financial Officer
MGM Resorts International
3
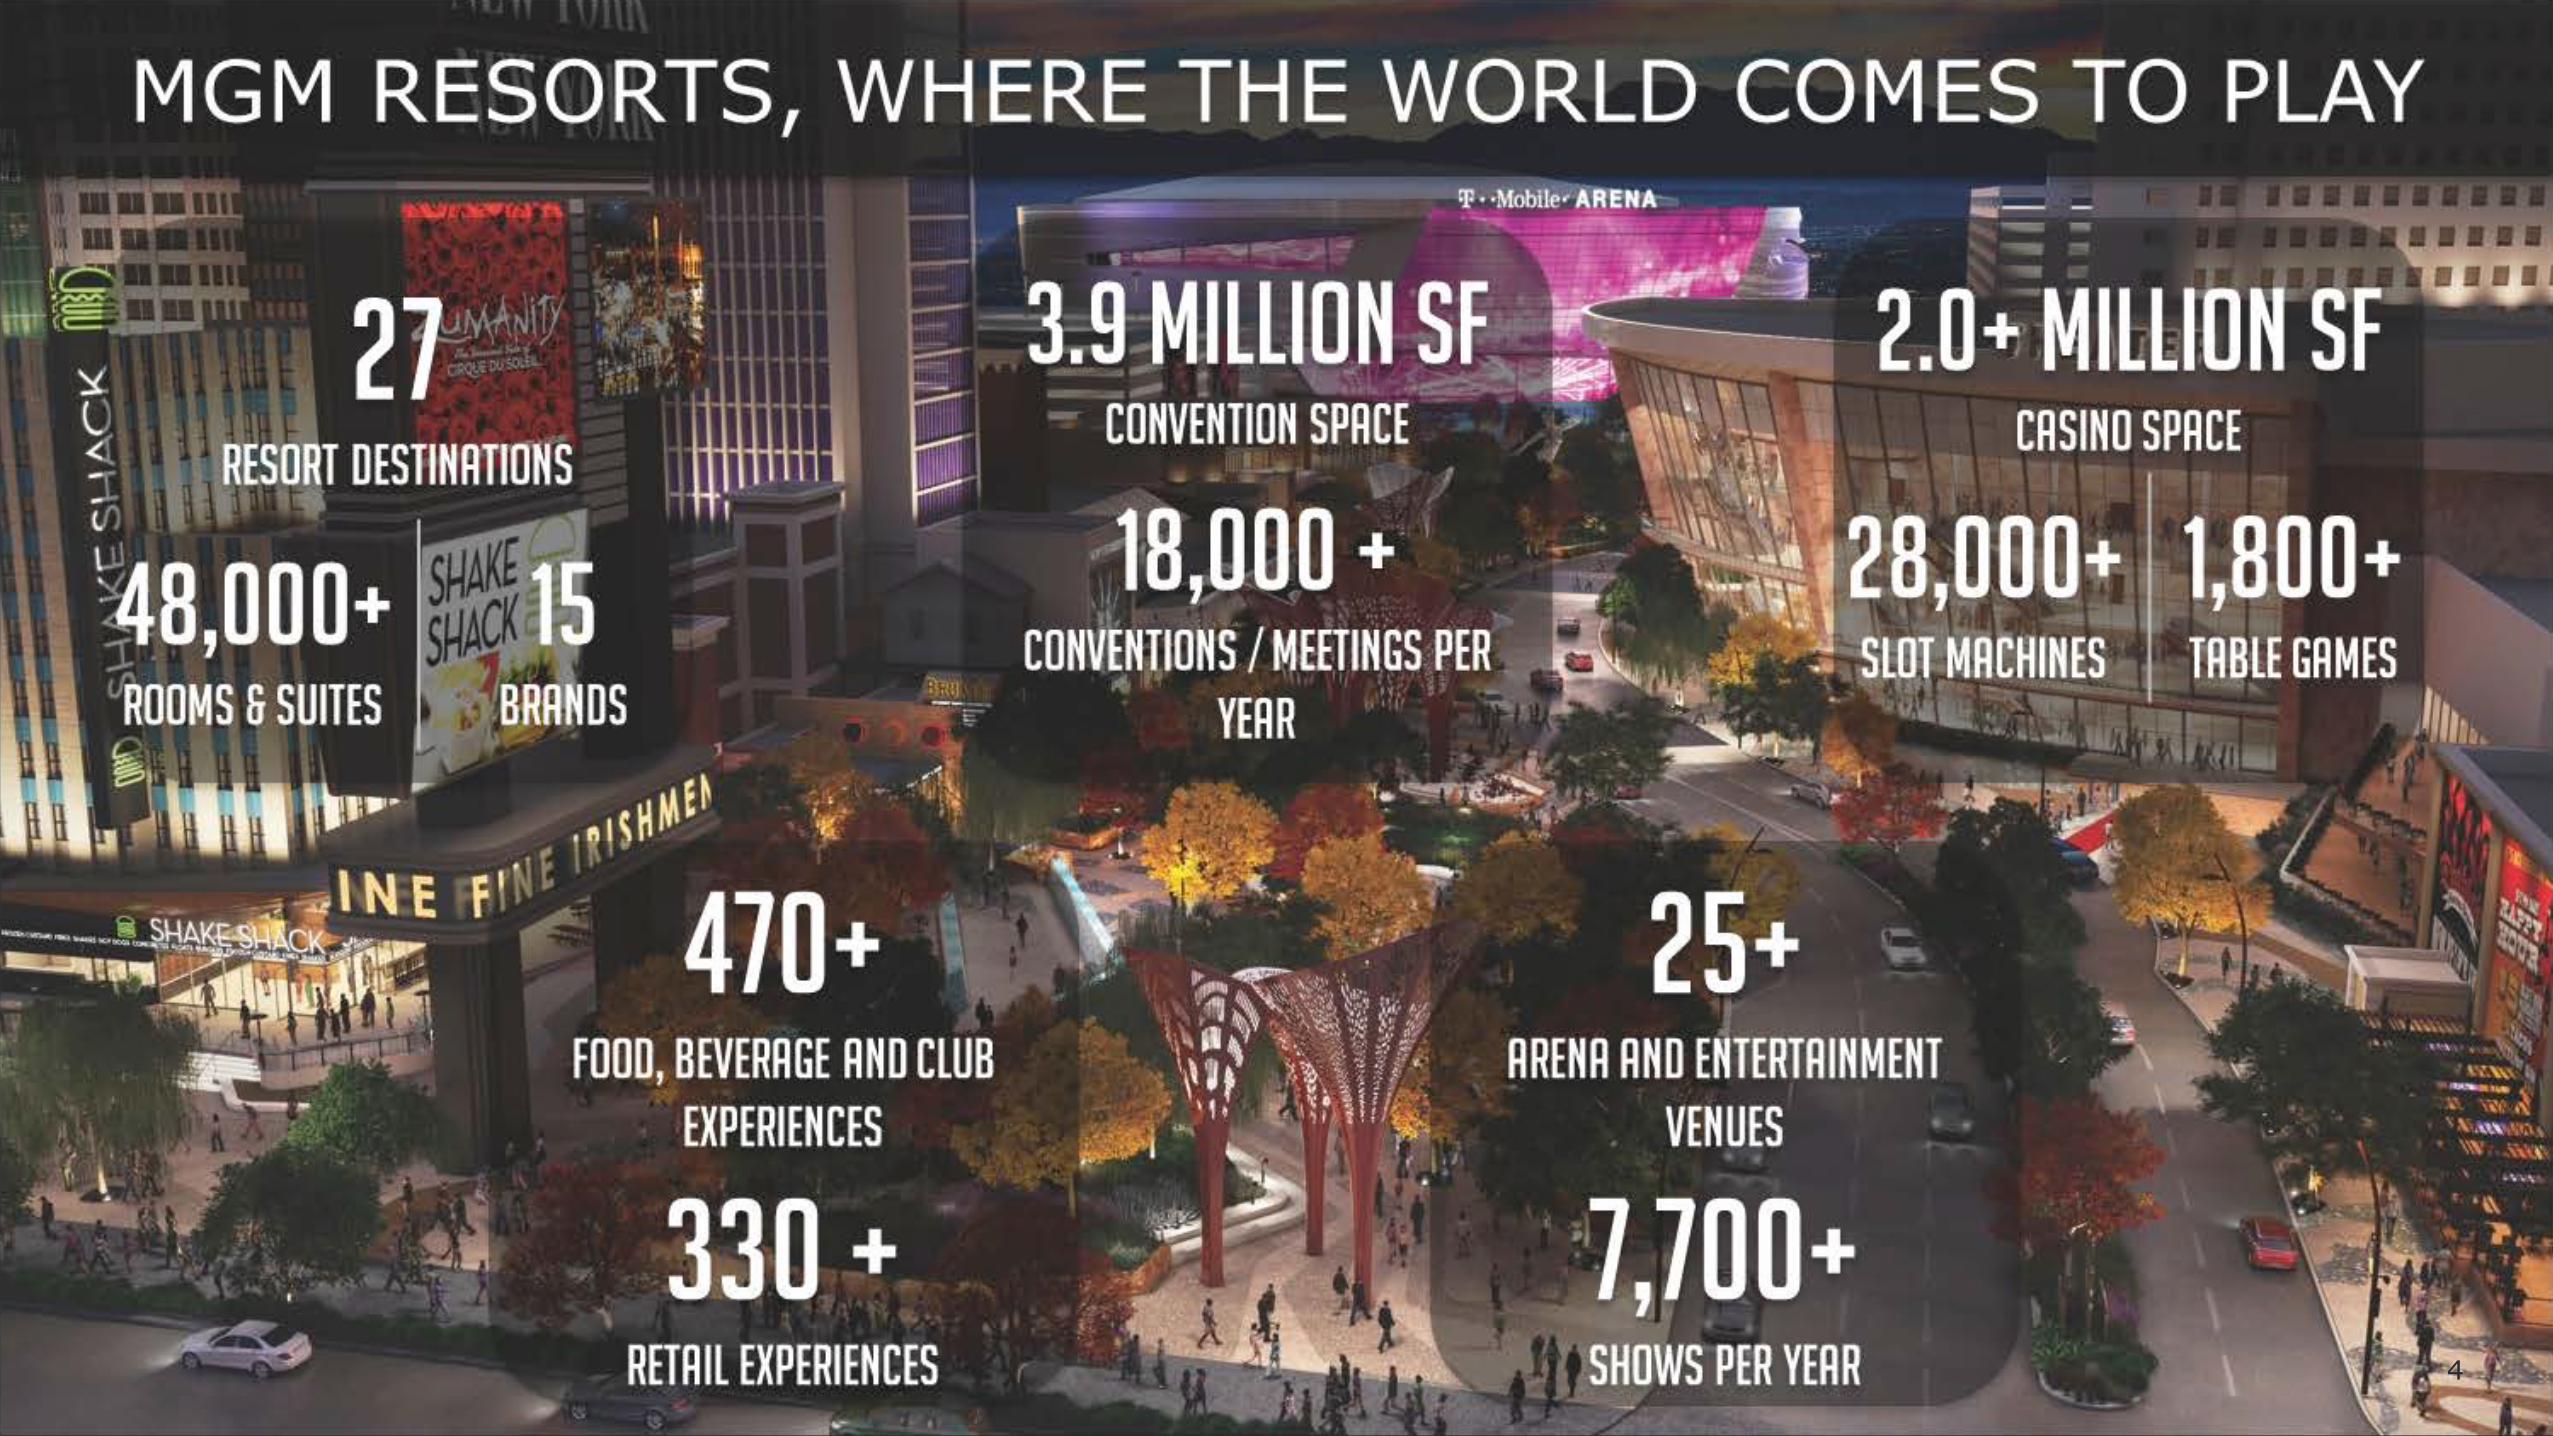
27Resort destinations
470+Food, beverage and
club experiences
330 +Retail experiences
3.9 million SF
convention space
18,000 +Conventions /
meetings per year
25+Arena AND
entertainment venues
7,700+Shows per year
MGM RESORTS, WHERE THE WORLD COMES TO PLAY
2.0+ million sf
casino space28,000+ SLOT
MACHINES
1,800+
TABLE GAMES
48,000+
Rooms & Suites
15 Brands
4

AWARD WINNING RESORT DESTINATIONS
Note: Third-party logos are trademarks of their respective owners5

MGM RESORTS ORGANIZATIONAL STRUCTUREMGM Resorts International
(NYSE: MGM)
Other
Las Vegas Arena Company (42.5%)
T-Mobile Arena
Diaoyutai MGM Hospitality (49%)MGM Grand Sanya,Diaoyutai Hotel Hangzhou,Diaoyutai Hotel Chengdu, Bellagio Shanghai (Opening 2017)
Elgin Riverboat Resort (50%)Grand Victoria – Elgin, IL
CityCenter Holdings
(50% ownership)
PropertiesAriaVdaraMandarin Oriental
Owned PropertiesBellagio, MGM Grand LV, Circus Circus LV, MGM National HarborDevelopmentMGM Springfield (Opening Sept 2018)
Owned
Leased1 PropertiesMandalay Bay, The Mirage, Luxor, Excalibur, New York-New York, Monte Carlo, The Park, MGM Grand Detroit, Beau Rivage, Gold Strike Tunica, Borgata
Leased1 (“OpCo”)
MGM Growth Properties (“MGP”)
(76% ownership)
Publicly Traded REIT1
(NYSE: MGP)
MGM China Holdings Limited
(56% ownership)
PropertiesMGM MACAU
DevelopmentMGM COTAI(Opening Late 2017)
(HKSE: 2282 HK)
1 MGM Growth Properties owns the properties leased by MGM Resorts International6

STRATEGIC TRANSACTIONSCreation Of A Premier Triple Net Lease REIT, MGM Growth Properties
Maximizing Value At CityCenter
Acquisition Of Borgata Hotel Casino & Spa
5% Increase In MGM China Stake
Opened MGM National Harbor7
$20
$25
$30
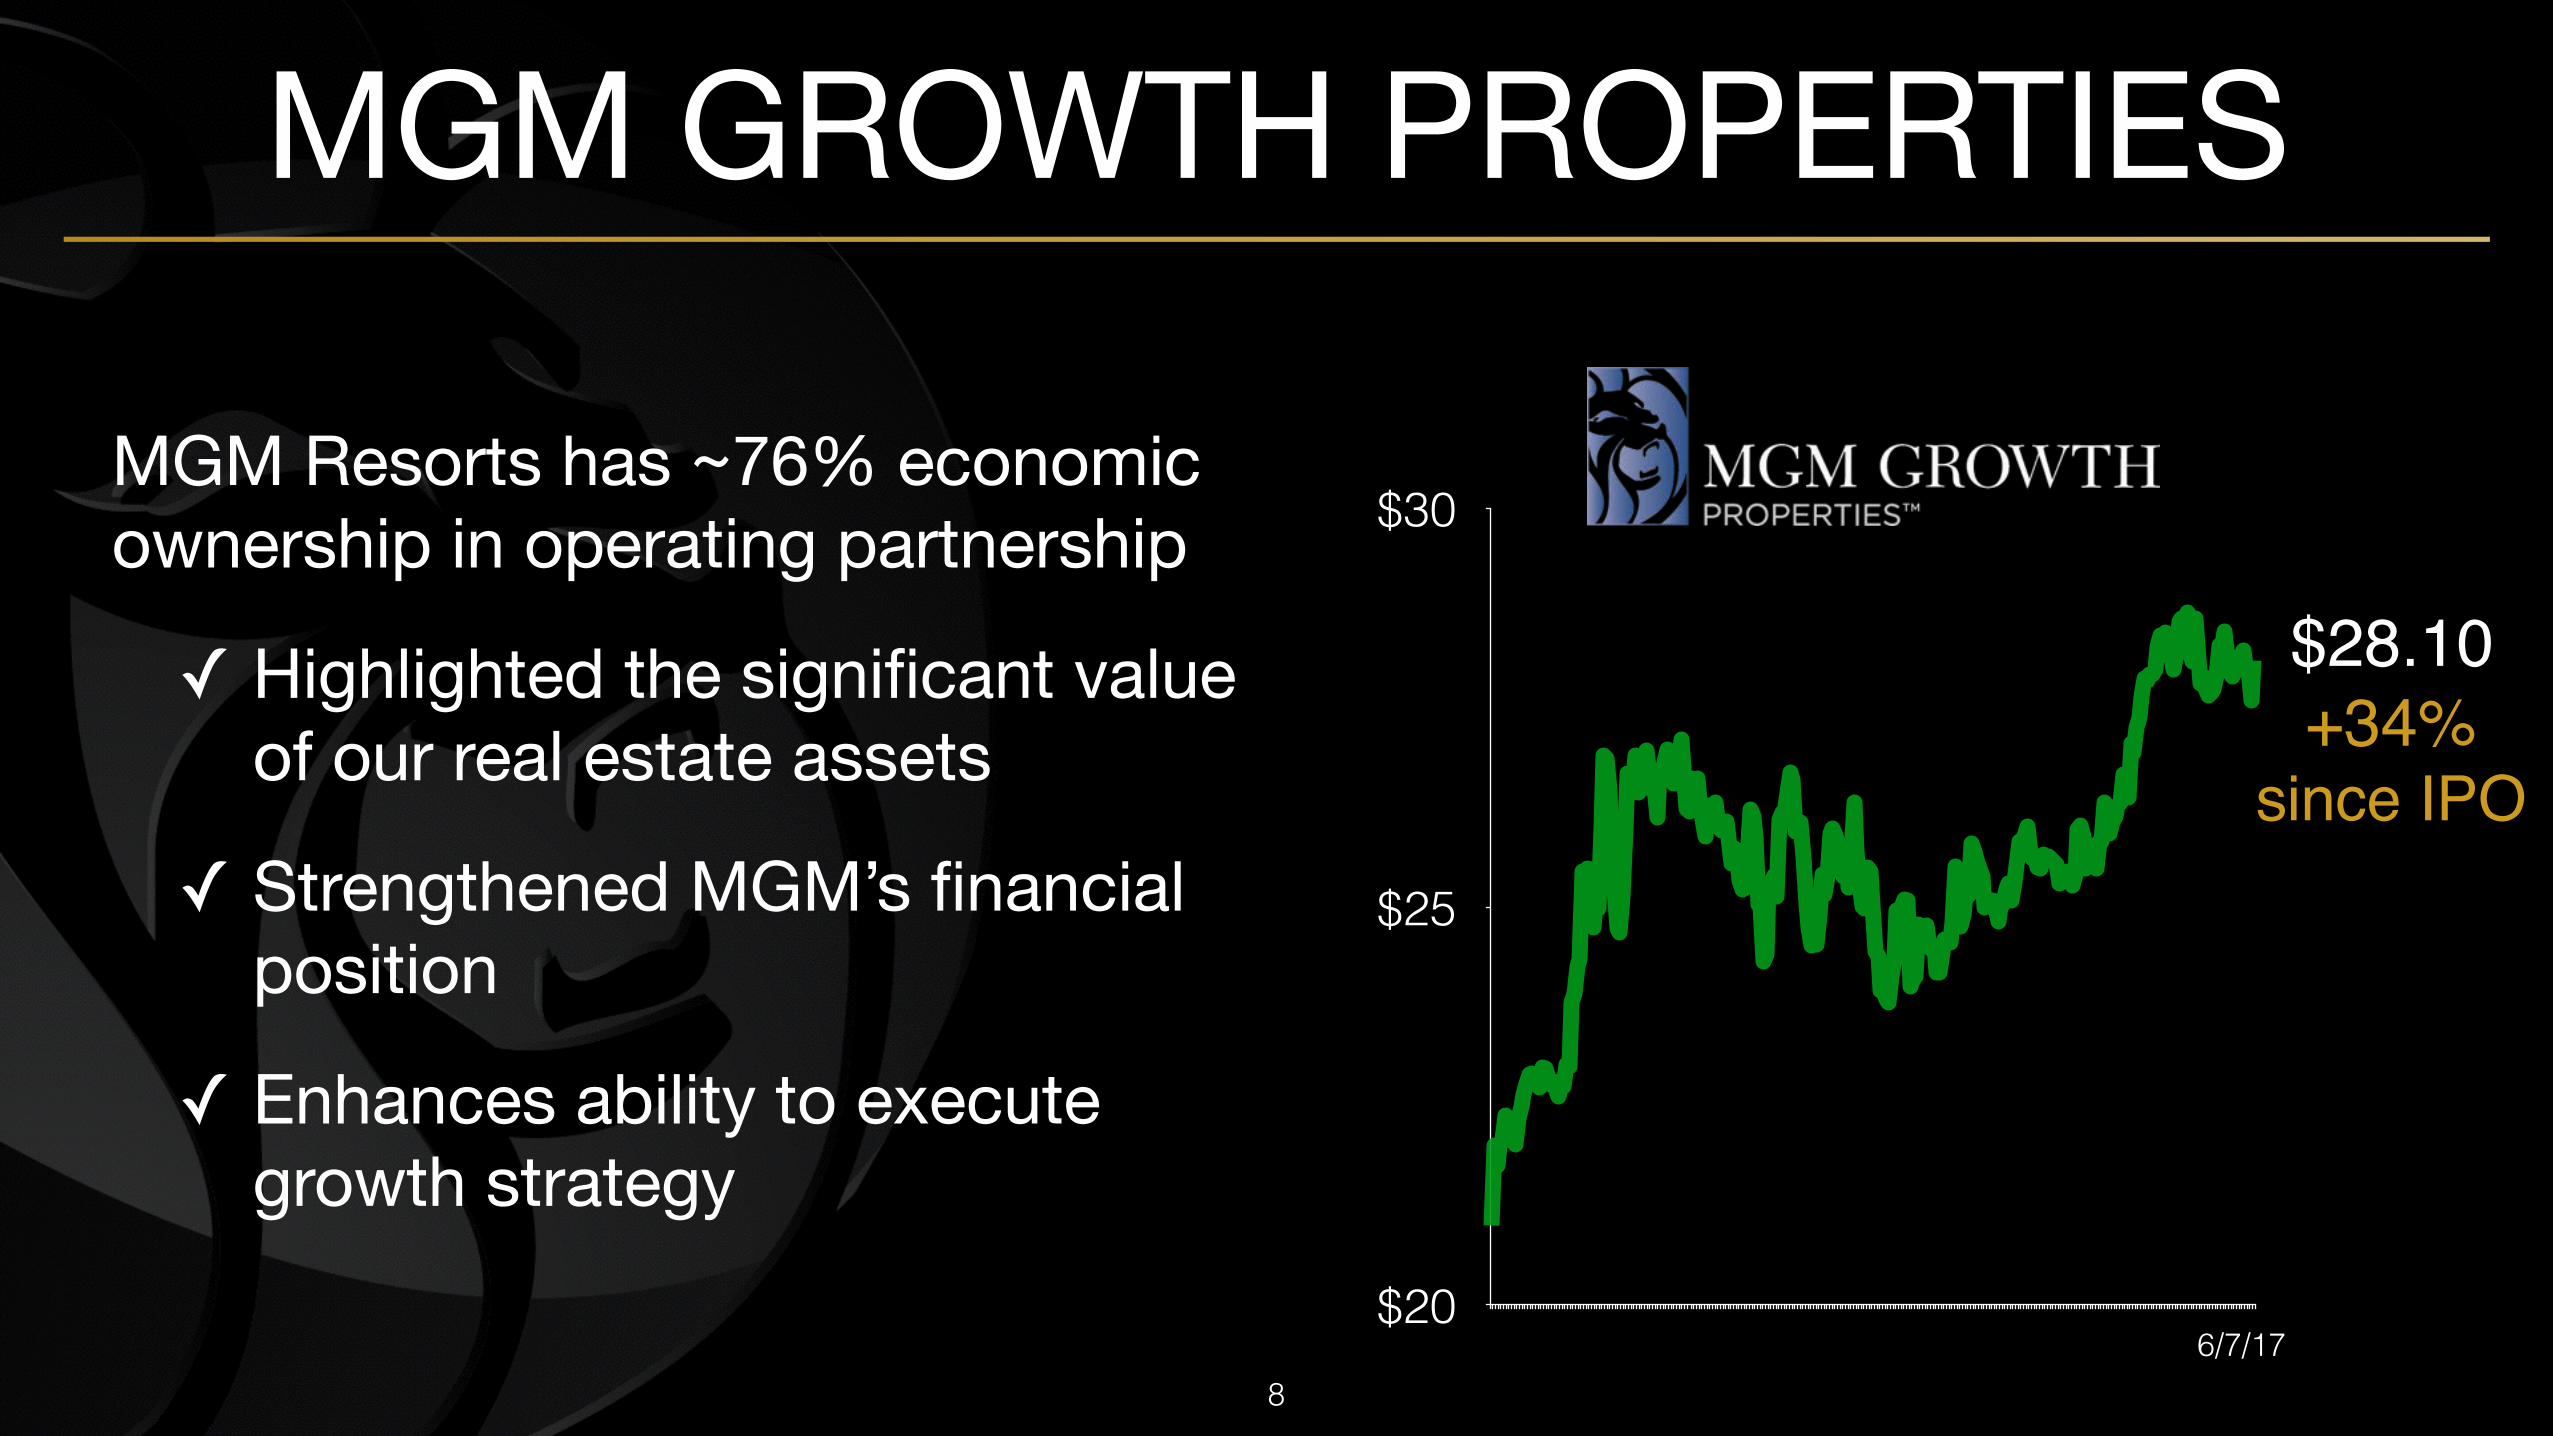
MGM GROWTH PROPERTIES
MGM Resorts has ~76% economic ownership in operating partnership
✓ Highlighted the significant value of our real estate assets
✓ Strengthened MGM’s financial position
✓ Enhances ability to execute growth strategy
$28.10 +34%
since IPO
6/7/178

MGM CHINA
MGM Resorts owns ~56% of MGM China
✓ Acquired additional 4.95% stake in September 2016
✓ Long-term strategic initiative whereby MGM Resorts reinforced its confidence in the future success of MGM China & Macau
✓ On track to triple our footprint1 upon opening MGM COTAI in late 2017
1 Based on room count
$10
$13
$17
$20
HK$16.16+48%
9/1/16 6/7/179

$$300 Million
Dividend Received from CityCenter
+23% Net Revenue
+36% Adjusted
Property EBITDA
+310bps to 31% Margin
$0.36Diluted
Earnings Per ShareTripled prior year
quarter
$
1Q 2017 MGM RESORTS CONSOLIDATED FINANCIAL HIGHLIGHTS
$63 MillionReturned to
Shareholders
$
10
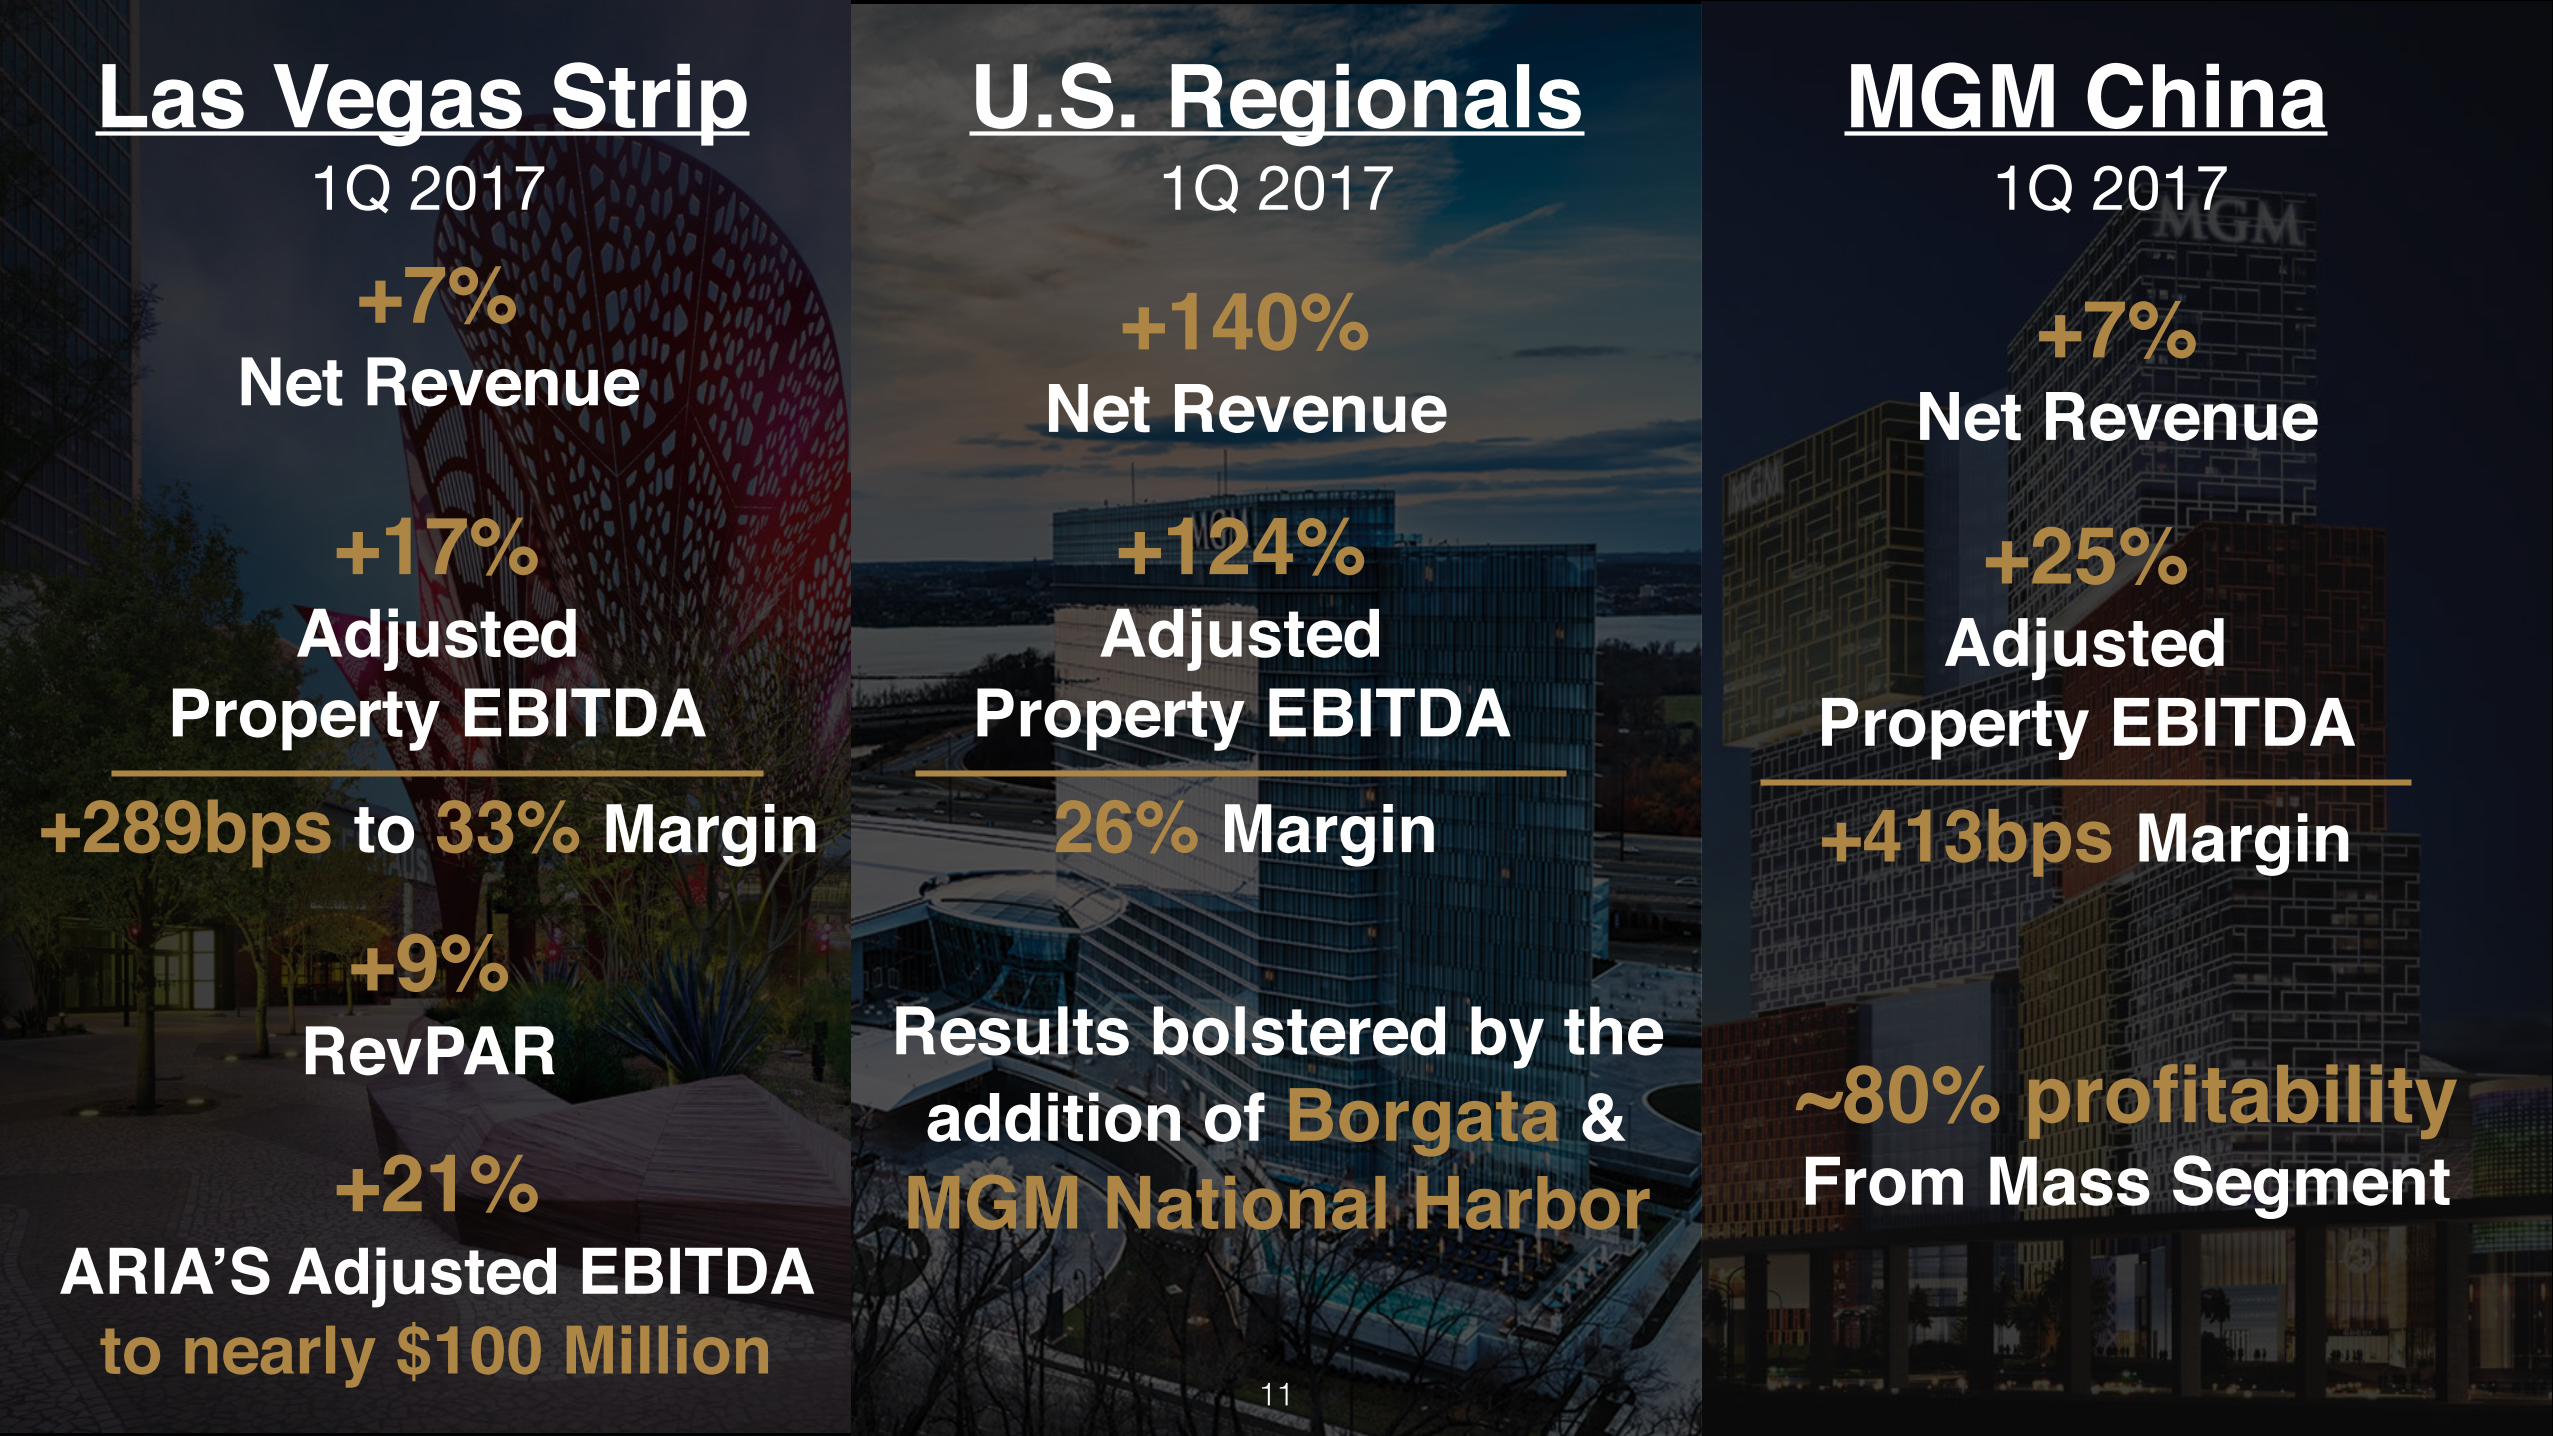
+7% Net Revenue
+17% Adjusted
Property EBITDA+289bps to 33% Margin
Las Vegas Strip
+9% RevPAR
+21% ARIA’S Adjusted EBITDA
to nearly $100 Million
MGM China
+7% Net Revenue
+25% Adjusted
Property EBITDA+413bps Margin
~80% profitabilityFrom Mass Segment
U.S. Regionals
Results bolstered by the addition of Borgata &
MGM National Harbor
+140% Net Revenue
+124% Adjusted
Property EBITDA26% Margin
1Q 2017 1Q 2017 1Q 2017
11
FORTIFYING OUR COMPETITIVE ADVANTAGES
Operational Excellence
Creating Unique Guest Experiences Through Entertainment
Expanding And Investing In Our Resorts
Significant Growth Pipeline
12

COMPANY-WIDE TRANSFORMATION
2014 2015 2016
30%
26%24%
Source: Company filings1 Same Store Adjusted Property EBITDA is Adjusted Property EBITDA related to operating resorts which were consolidated by the Company for both the entire current and prior year periods presented
Domestic Same-Store Adjusted EBITDA Margins1
($ in millions)
$400 Million Adjusted Property EBITDAUp From Original Target of
$300 Million
30%+Adjusted Property EBITDA Margins
PROFIT GROWTH PLAN 2017 TARGETS
13
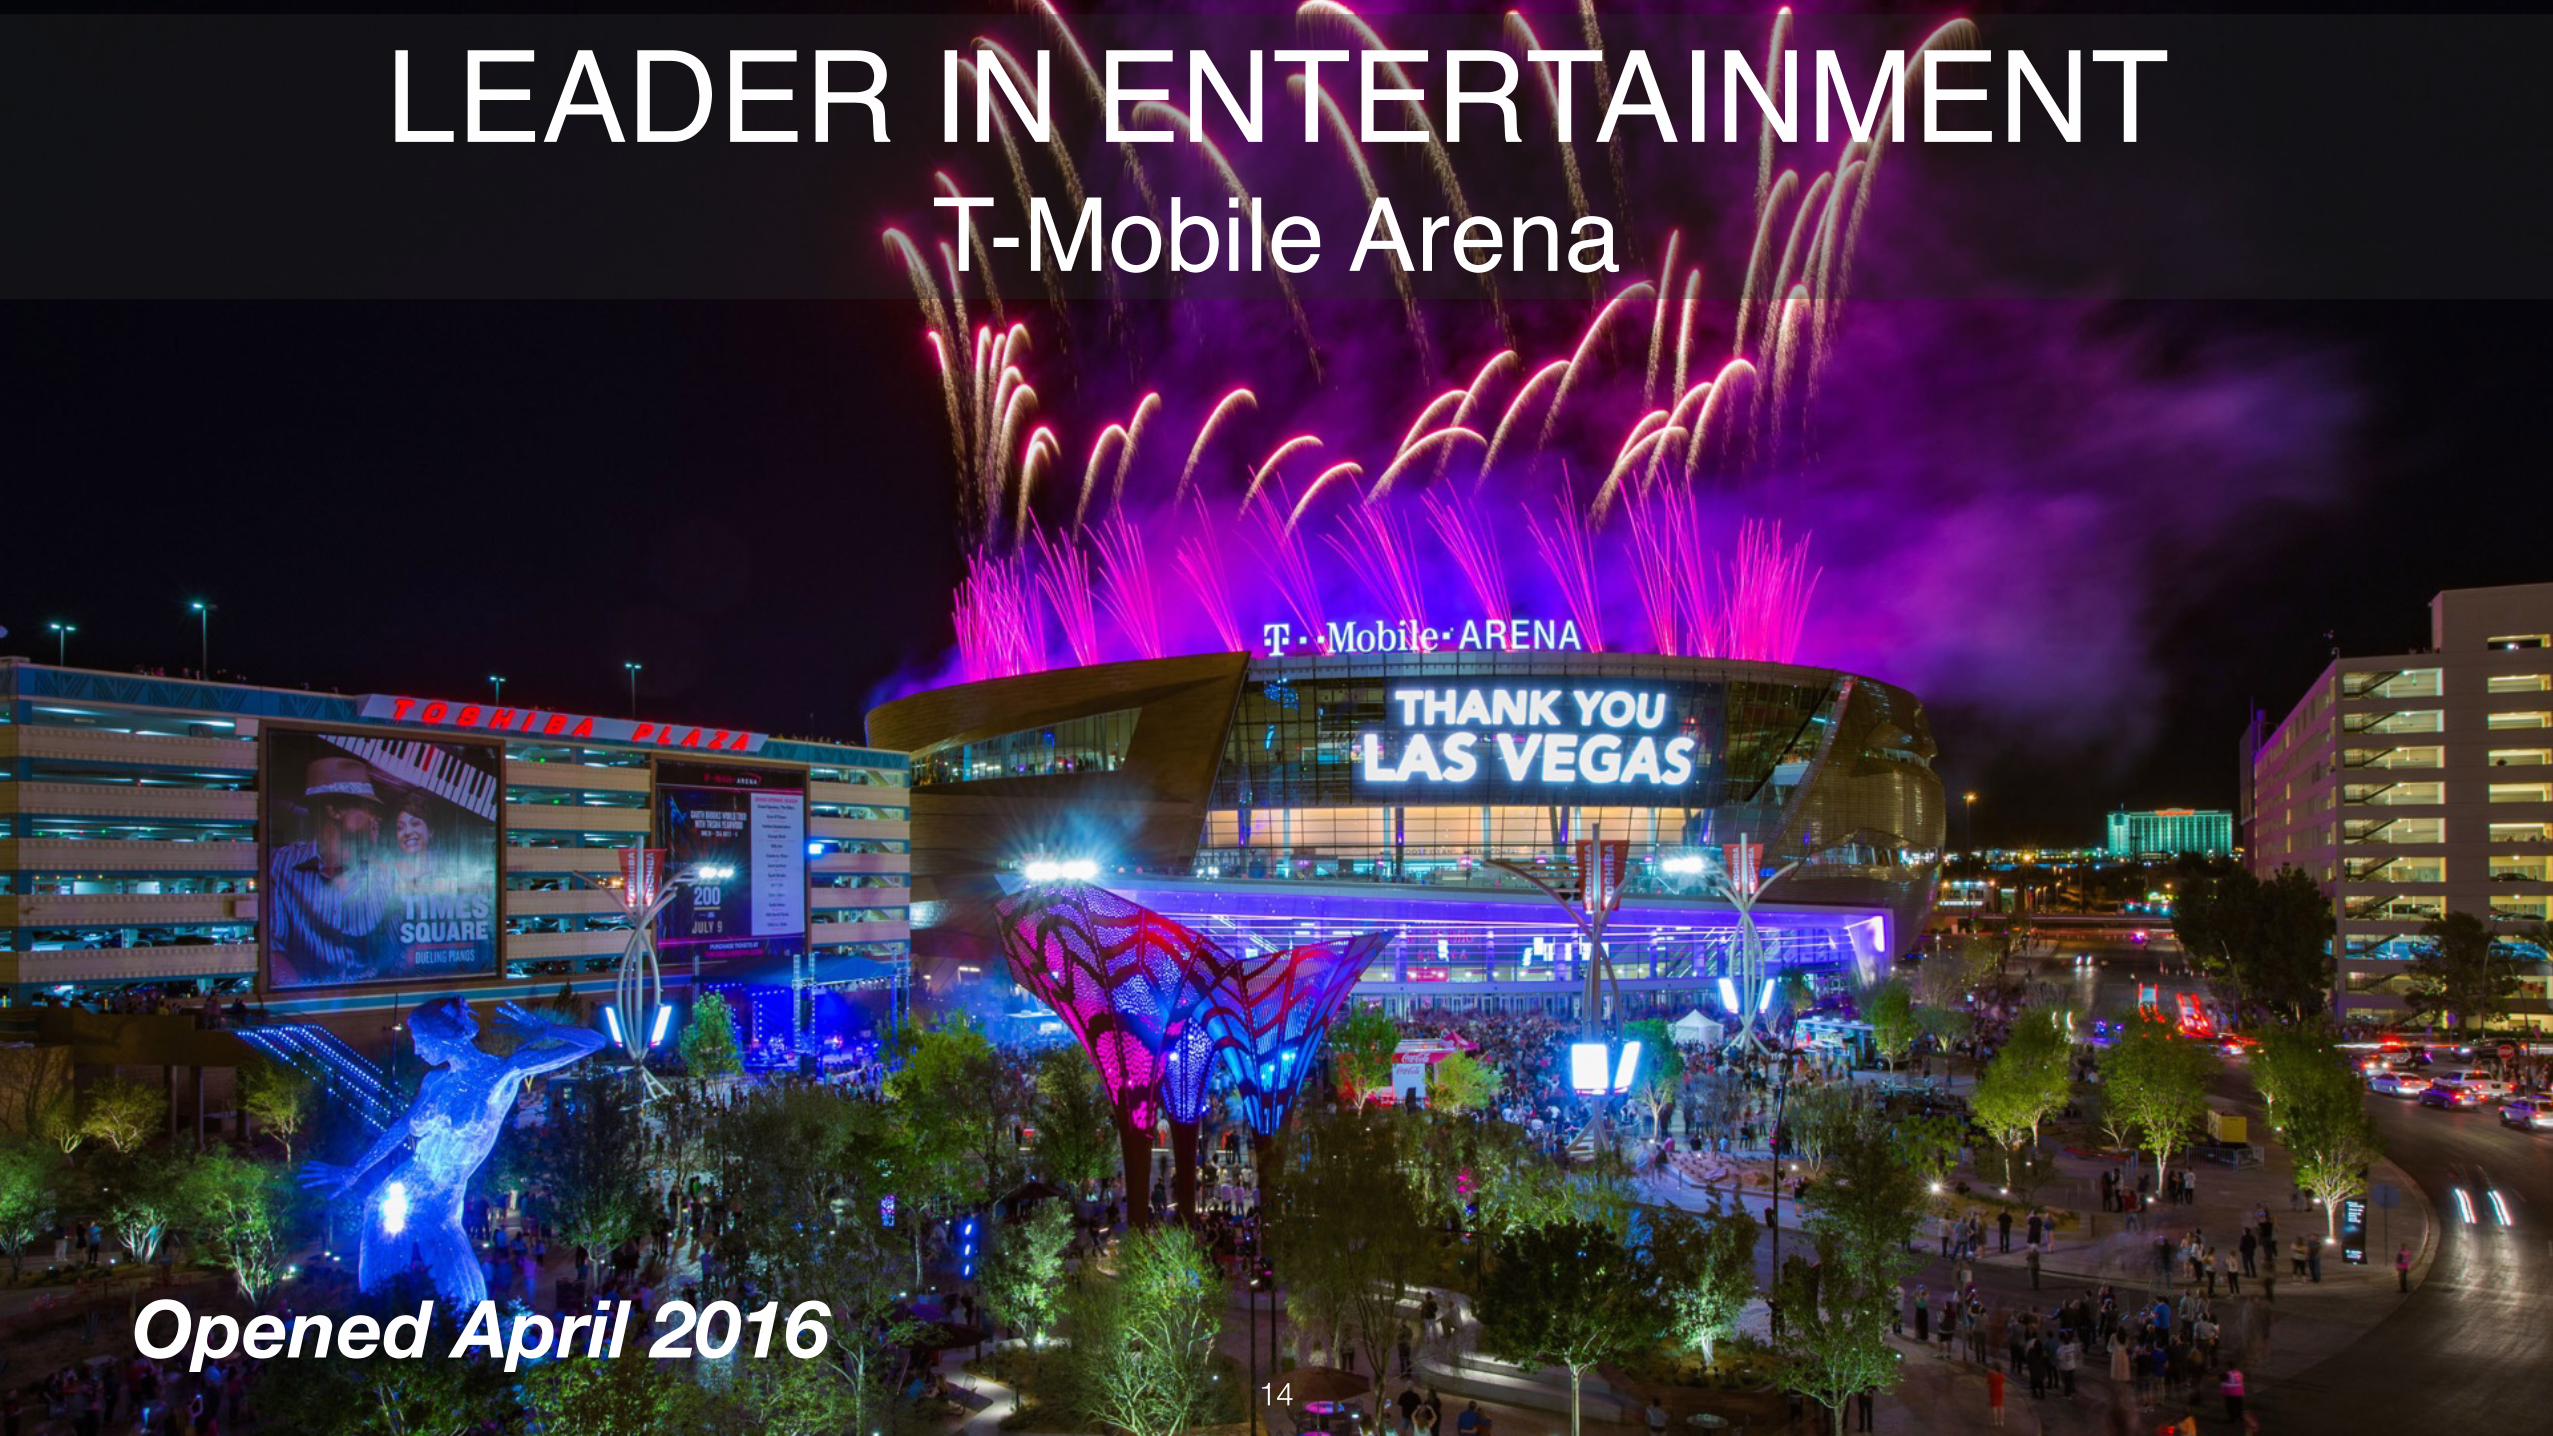
Opened April 2016
LEADER IN ENTERTAINMENTT-Mobile Arena
14

–Johnny Appleseed
“Type a quote here.”
LEADER IN ENTERTAINMENTThe Park Theater
Opened December 201615

LEADER IN ENTERTAINMENTThe Theater at MGM National Harbor
Opened December 201616

ENHANCING GUEST EXPERIENCES
Day Club Bungalows F&B Reconcepting
Convention Center ExpansionRoom & Suite Remodel
Casino Reinvestment
Entertainment Venues
17

MANDALAY BAY CONVENTION CENTER EXPANSION
18

PARK MGM & NOMAD HOTEL
Rendering19

DEVELOPMENT PIPELINE
MGM National Harbor: Opened In December 2016
MGM Cotai: Opening In Late 2017
Park MGM / NoMad in Las Vegas: Opening In Late 2017/2018
MGM Springfield: Opening by September 2018
20
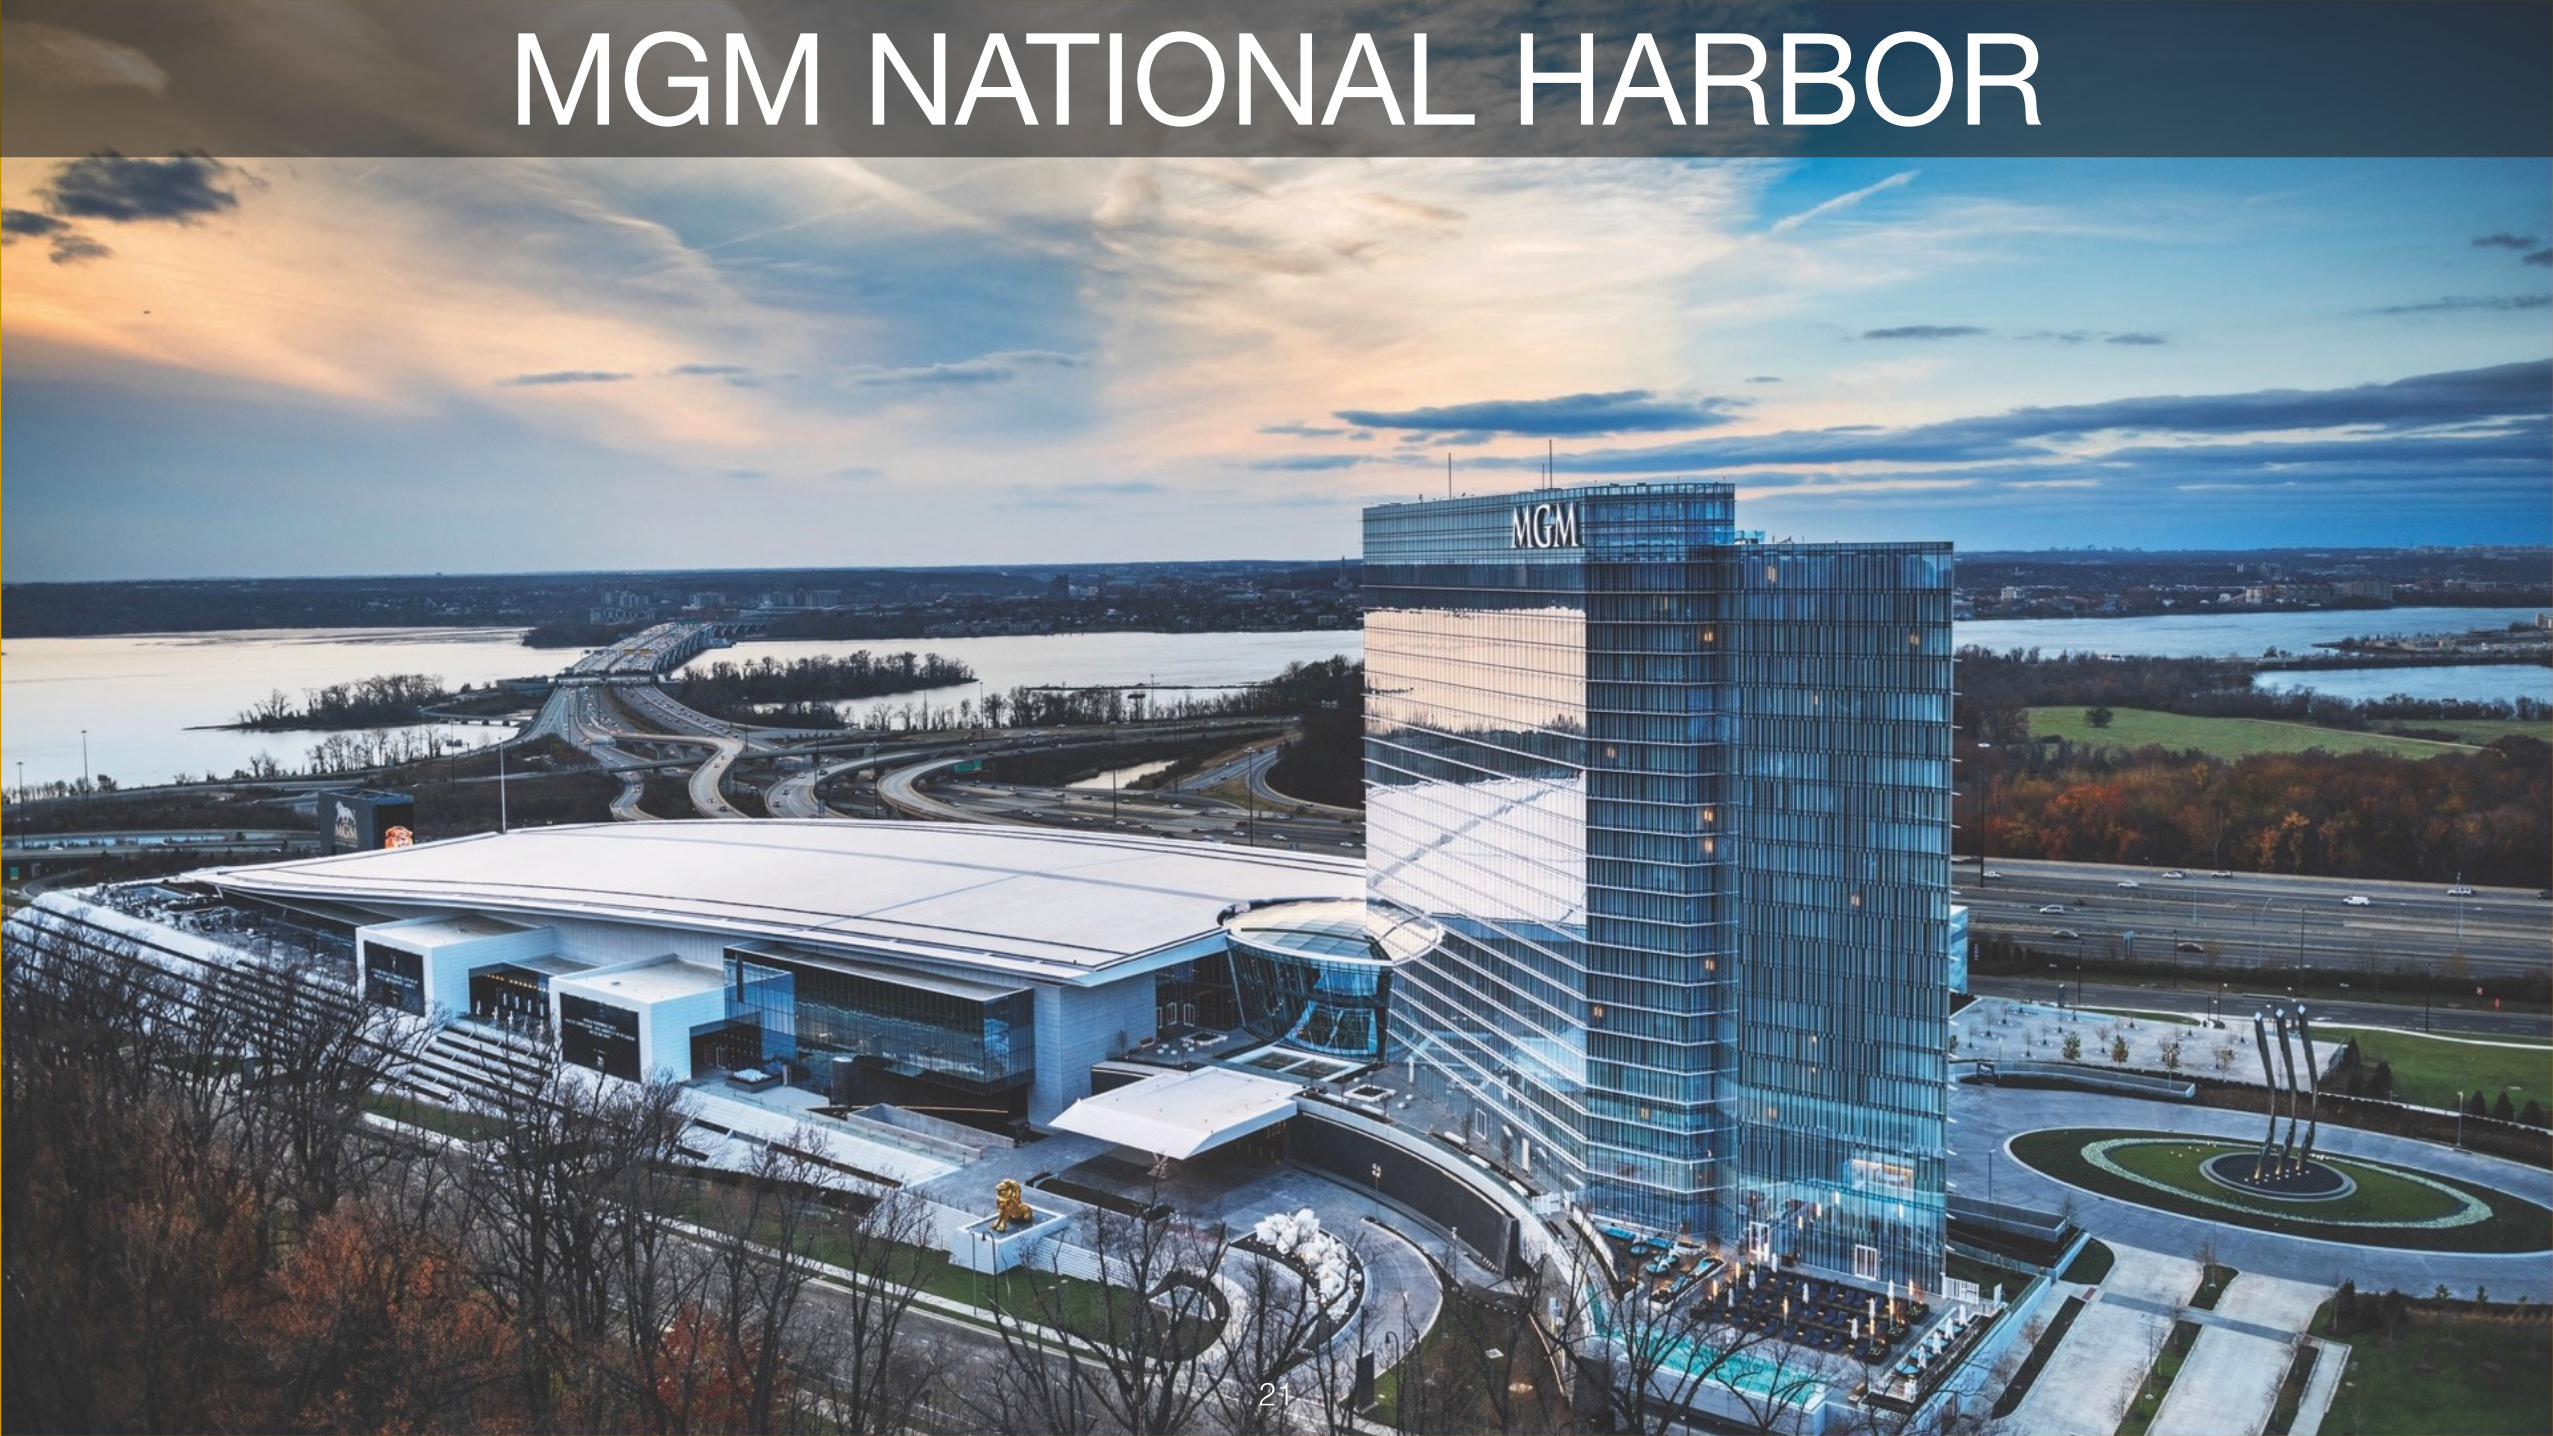
MGM NATIONAL HARBOR
21

MGM COTAI
Rendering22

MGM COTAI
Construction in progress23
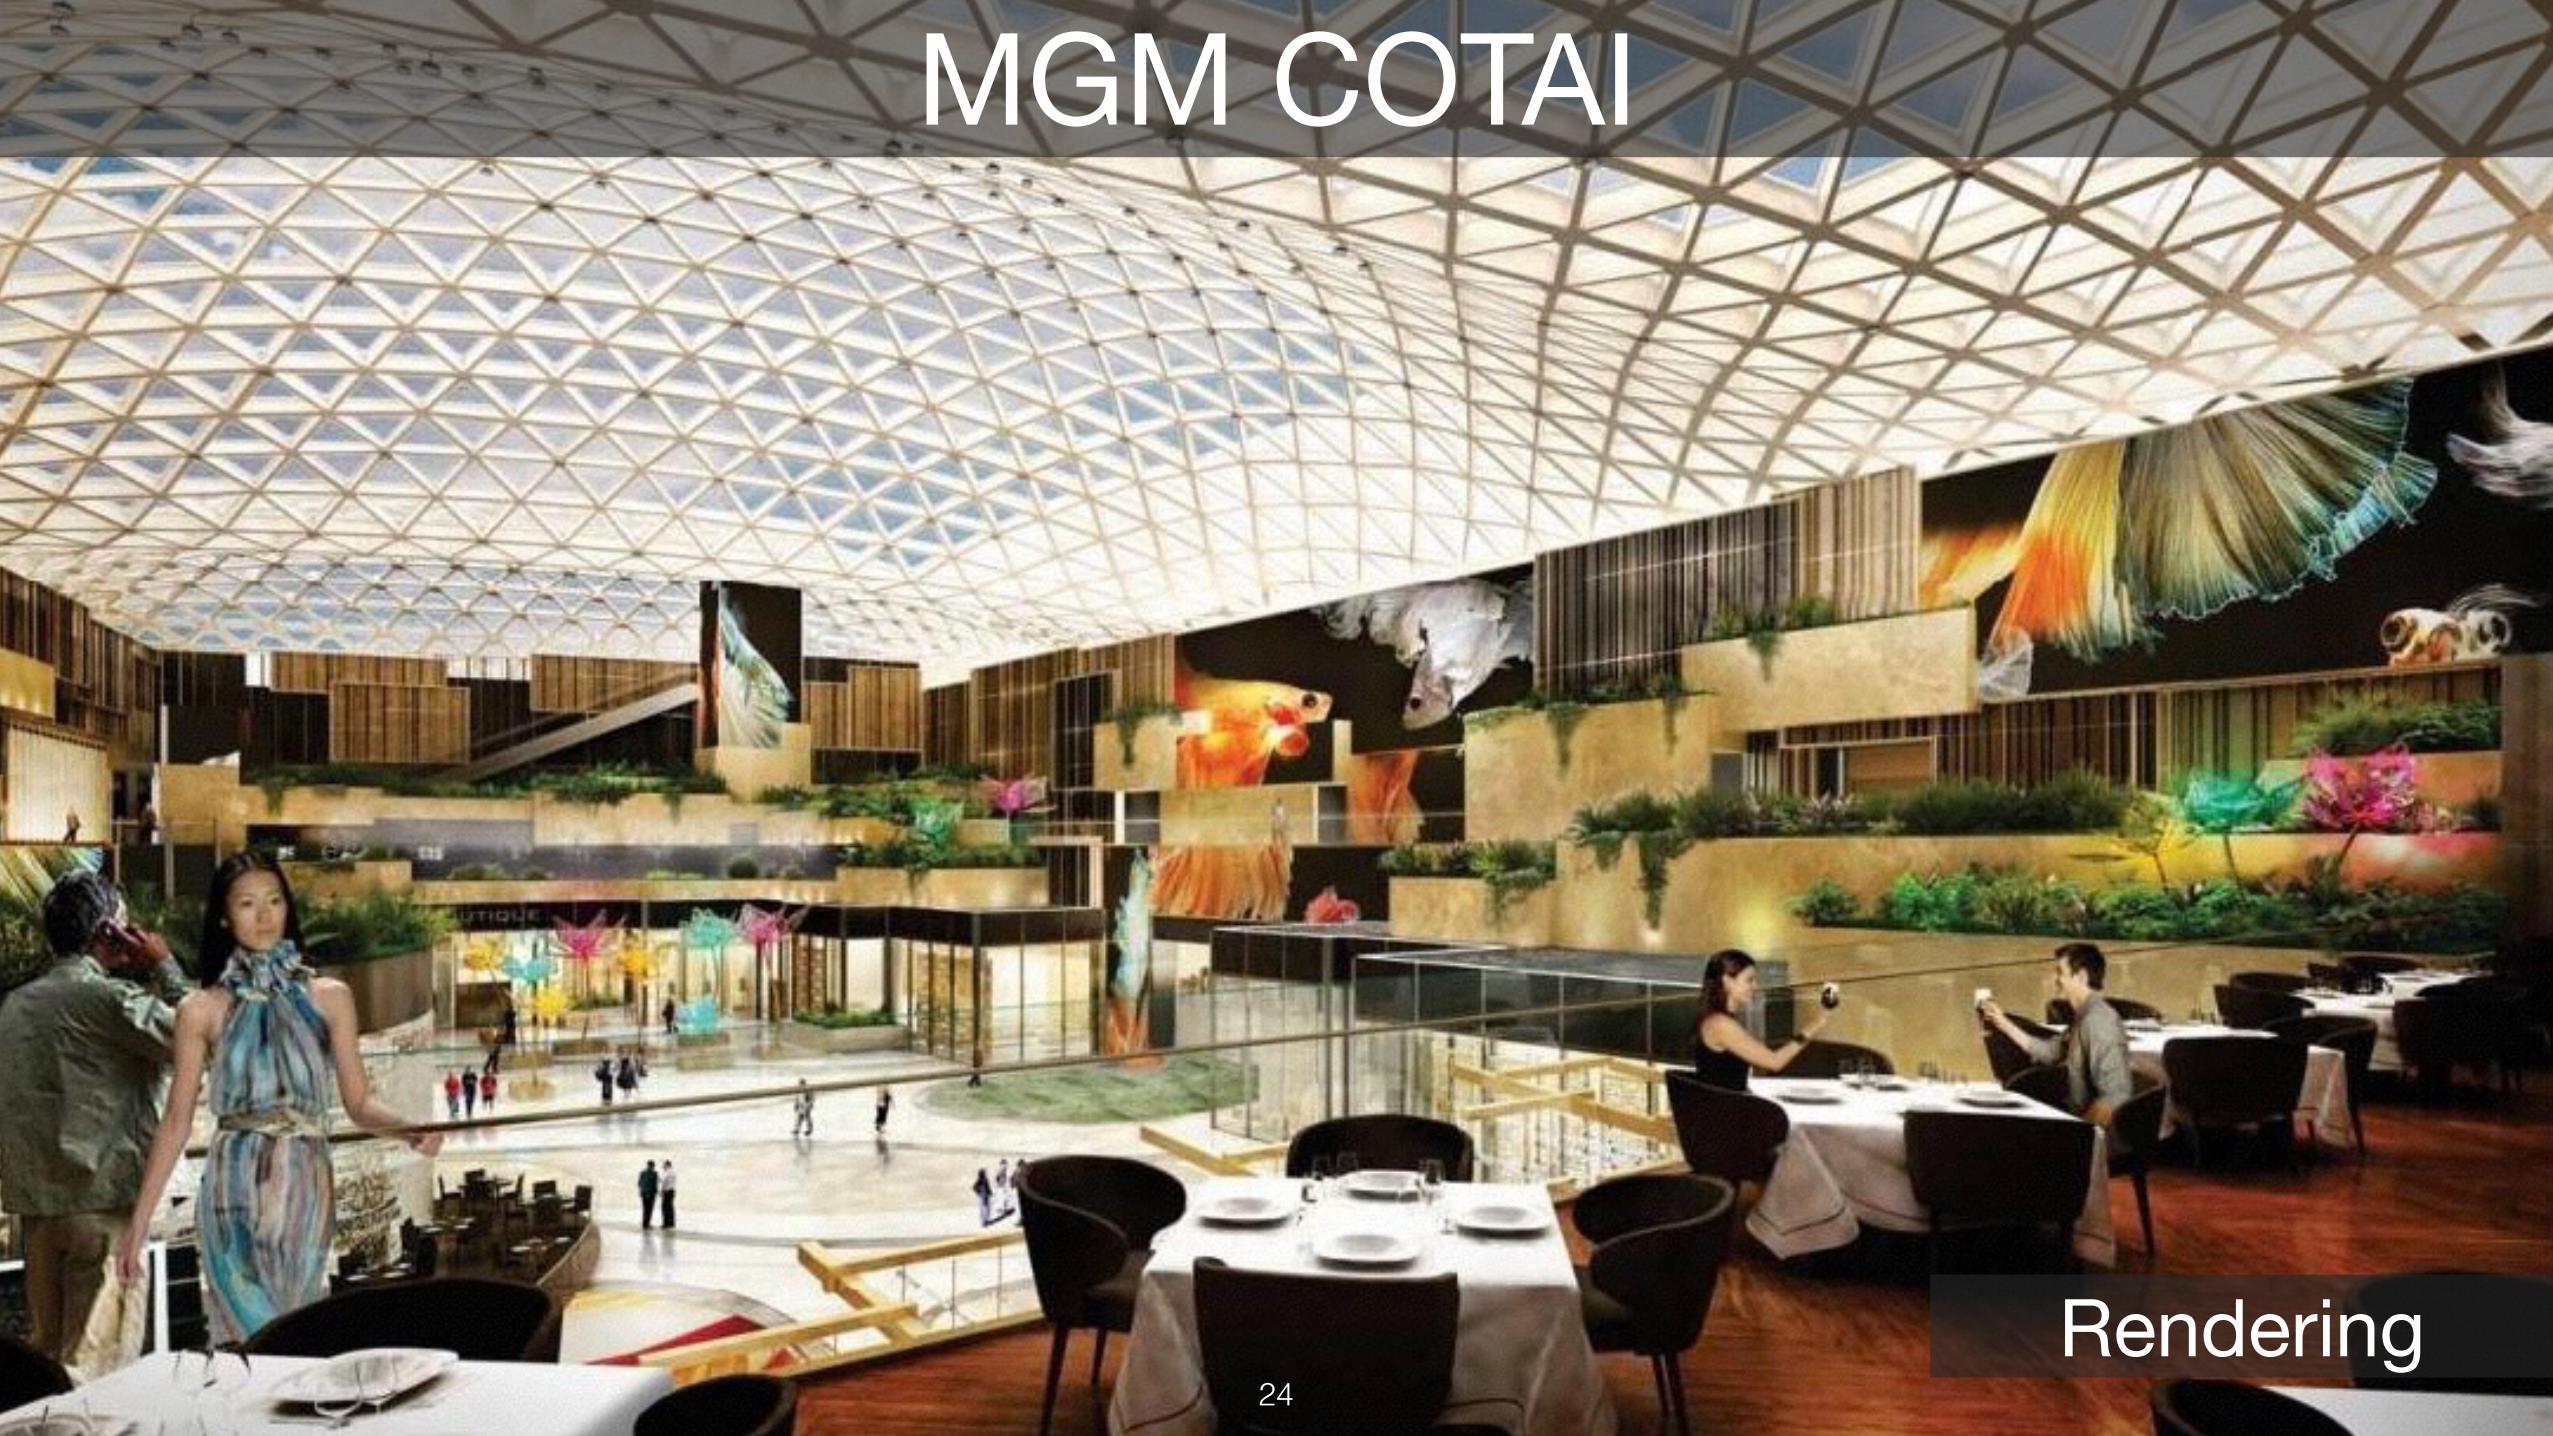
MGM COTAI
Rendering24

MGM SPRINGFIELD
Rendering25

MGM SPRINGFIELD
Construction in progress26

CLEAR PATH TO INVESTMENT GRADE RATING
Enhanced capital structure and flexible balance sheet
Creates foundation for strong long-term growth
Lower cost of debt1 Reduced from ~8% to ~6% since 2011
Reduced consolidated net leverage
From 6.5x in 2011 to 4.3x at 3/31/17 PF2
1 Based on weighted average cost of Consolidated MGM Resorts’ debt 2 Please refer to page 31 27

INVESTMENT HIGHLIGHTSPremier Resort Portfolio
Dominant Position In Key Gaming Markets
Organic Growth Through Operational Excellence
Nearing Completion Of Significant Development Projects
Strong Balance Sheet
Improving Free Cash Flow Profile28

Q&A
29

APPENDIX
30

CAPITAL STRUCTURE ENHANCEMENTActual
3/31/2017 Annualization
AdjustmentPro Forma 3/31/2017
Total Cash1 $1,395 $-- $1,395
LTM Adjusted EBITDA related to: Domestic Resorts $2,226 $187 2 $2,413 Management and other operations 20 -- 20 MGM China 550 -- 550 Corporate expense (excluding stock-based compensation)
(283) -- (283)$2,512 $187 $2,699
Dividends and distributions received by MGM Resorts3 58 -- 58$2,570 $187 $2,757
Total Principal Amount of Debt related to: MGM Resorts Consolidated4 $13,247 $-- $13,247
$13,247 $-- $13,247
Net Leverage Ratio 4.6x 4.3x1 3/31/17 Actual includes $465 million and $368 million at MGM China and MGM Growth Properties, respectively2 Borgata annualization based on LTM March 31, 2017 actuals less $140.2M of Borgata Adjusted Property EBITDA reported as of LTM March 31, 2017. National Harbor annualization based on the property opening on December 8, 2016 less $41.7M of National Harbor Adjusted Property EBITDA reported as of LTM March 31, 2017.3 Represents ordinary dividends (excluding special dividends) and other regular cash distributions actually received by MGM from CityCenter and Grand Victoria.4 LTM 3/31/2017 Actual includes $2.0 billion, $3.7 billion, and $450 million at MGM China, MGM Growth Properties, and MGM National Harbor, respectively 31

PATH TO INVESTMENT GRADE
Recent Upgrades:
Moody’s: Two Notch Upgrade On 4/26/16 To Ba3
S&P: One Notch Upgrade On 8/4/16 To BB-
Fitch: Two Notch Upgrade On 5/10/16 To BB
Moody's S&P FitchAaa AAA AAAAa1 AA+ AA+Aa2 AA AAAa3 AA- AA-A1 A+ A+A2 A AA3 A- A-
Baa1 BBB+ BBB+Baa2 BBB BBBBaa3 BBB- BBB-
Ba1 BB+ BB+Ba2 BB BBBa3 BB- BB-B1 B+ B+B2 B BB3 B- B-
Caa1 CCC+ CCC+Caa2 CCC CCCCaa3 CCC- CCC-Ca CC CCC C C
Current MGM Rating
Trough MGM Rating
Investment Grade
Non-Investment
Grade
32

SUPPLEMENTAL DATA: NON-GAAP FINANCIAL MEASURES
33